Genotoxic effects of some agricultural pesticides in vitro tested with Aspergillus nidulans
© The Author 2014. Published by Oxford University Press on behalf of the UK Environmental Mutagen Society. All rights reserved. For permissions, please e-mail: [email protected].
117
Mutagenesis, 2015, 30, 117–127doi:10.1093/mutage/geu032
Original Article
Original Manuscript
Cytotoxic and genotoxic responses of the RTgill-W1 fish cells in combination with the yeast oestrogen screen to determine the sediment quality of Lagos lagoon, NigeriaNnamdi H. Amaeze, Sabine Schnell1, Osman Sozeri2, Adebayo A. Otitoloju, Rosemary I. Egonmwan, Volker M. Arlt2 and Nic R. Bury1,*
Ecotoxicology Laboratory, Department of Zoology, Faculty of Science, University of Lagos, Akoka, 101017 Lagos, Nigeria, Nigeria, 1Division of Diabetes and Nutritional Sciences and 2Analytical and Environmental Sciences Division, MRC-PHE Centre for Environment and Health, King’s College London, Franklin Wilkins Building, 150 Stamford Street, London SE1 9NH, UK
*To whom correspondence should be addressed. Tel: +44 207 848 4091; Fax: +44 207 848 4500; Email: [email protected]
Received March 6 2014; Revised June 17 2014; Accpeted July 2 2014.
Abstract
Economic advancements in developing countries have seen an increase in urbanisation and industrialisation with a rise in the levels of discharge of effluents and municipal waste into aquatic ecosystems. Unfortunately, aquatic environmental regulations in these countries are often rudimentary and the development of environmental monitoring programmes will help identify ecological risks. As an example, the current study assesses the pollution status of 11 sampling sites in Lagos lagoon, Nigeria. The organic solvent sediment extracts were assessed for cytotoxicity and genotoxicity in rainbow trout gill-W1 cells. The induction of oestrogenic activities using the yeast oestrogen screen was also determined. The sediments were analysed for polycyclic aromatic hydrocarbons (PAHs) and other contaminants (polychlorinated biphenyls, organochlorine and organophosphate pesticides). Only sediments from three sites were cytotoxic at both 25 and 12.5 mg eQsed/ml using the Alamar Blue cell viability assay. The alkaline Comet assay showed that all sites caused significant DNA damage at 7 mg eQsed/ml; the extent of the damage was site specific. The measure of oxidative damage to DNA via the formamidopyrimidine DNA-glycosylase-modified Comet assay revealed similar results. Toxicity to yeast cells was observed in extracts from six sites; of the remaining sites, only two exhibited oestrogenic activity. There was no strong consistent relationship between sediment PAH concentrations and the cell toxicity endpoints. The dynamic nature of Lagos lagoon with its tides and freshwater inputs are suggested as factors that make it difficult to link the sources of pollution observed at each site with PAH levels and toxic endpoints. The study has demonstrated that the Comet assay is a sensitive endpoint to identify sediments that possess genotoxic contaminants, and this in vitro bioassay has the potential to be incorporated into an environmental monitoring framework for Lagos lagoon.
Introduction
Increasingly, environmental regulations and monitoring require test-ing of chemicals and environmental samples with fish to assess haz-ards and risks to the aquatic environment. The development of in vitro assays that reflect the effect on whole organism is an attractive
alternative to whole-animal testing. Cytotoxicity has mainly been used as an end point with fish cell lines exposed to environmental samples (1,2), and results indicate a good correlation to cell viability and whole animal toxicity, but cells are generally less sensitive (3). The use of genotoxicity assays is of interest because they are more
by guest on May 13, 2016
http://mutage.oxfordjournals.org/
Dow
nloaded from
sensitive than cytotoxicity assays (4) and alteration to DNA can identify potential chronic effects that influence population health (5).
The single cell gel electrophoresis (Comet) assay is a relatively quick and reliable method to detect DNA damage such as single- and double-strand breaks (6). The assay can be modified by the addition of endonucleases to assess oxidative damage to DNA (7). For exam-ple, formamidopyrimidine DNA-glycosylase (FPG) removes oxidised purines (8), but alkylated DNA lesions may also be detected by this enzyme (7). DNA repair mechanisms in fish cells have been described (9,10), and because DNA repair capacity has been reported to be low in some fish cell lines (11,12), they may provide a particular sensitive measure of the genotoxic effects of chemical contaminants (13–15). The Comet assay is not restricted to use for genotoxic hazard clas-sification of chemicals and has been used successfully in determining the genotoxicity of complex environmental matrices such as sewage treatment plant effluent (16), marine coastal sediments (17,18), as well as sediment from the gypsum mining area (19) and the River Danube (20). The Comet assays applicability and relevance for ecog-enotoxicology and use for environmental monitoring of the aquatic environment is becoming increasingly recognised (21,22).
It is estimated that over 2000 industries are situated close to Lagos lagoon and in the neighbouring Ogun States of Nigeria that discharge effluents into the lagoon (23). Lagos lagoon is also a major harbour for ships importing goods into Nigeria via the Tin Can Port, and this is another source of contaminants, such as oil and antifouling compounds (24,25). A number of studies have illus-trated the rise in pollution within the brackish water lagoon based on chemical monitoring of surface waters (26–29). Further, biotic communities have been assessed for pathology and bioaccumula-tion of non-biodegradable compounds (30–32). These observations have been linked to diminishing health of its fin and shelf fish com-munities (25,33,34). As early as the 1990s, Osae-Addo and Abigail (35) reported a drop of almost 90% in fish catch from 1 000 000 kg/year in 1980 to ~100 000 kg/year in 1990 and attributed this to over fishing as well as a drop in fish populations as a consequence of health issues associated with pollutants. These dramatic effects on the health of biota often fail to draw the required attention from the general public and environmental regulators, and there is a need to identify environmental risks posed by pollution in the lagoon to advice on potential future health issues and strategies for pollutant mitigation and/or remediation.
Sediments are a sink for chemicals present in industrial and domestic effluents and reflect the historic contamination of water bodies (36). Sediments collected from the Lagos lagoon have been found to contain elevated concentrations of metals previously (37), in addition to marine sediments collected from sites worldwide, e.g. in Croatia (38), the Yellow Sea off China (39) as well as the rivers Danube, Elbe and Rhine in Europe (40). In addition, many of these studies also reported the presence of pesticides, polychlo-rinated biphenyls (PCBs) and polycyclic aromatic hydrocarbons (PAHs). The binding characteristic of chemicals to sediments often reduces contaminant bioavailability, but compounds may accumu-late to concentrations that are many orders of magnitude greater than the overlying water. These contaminants are not locked into the sediment. For example, in Lagos lagoon, sand mining and harbour dredging are common (41). These practices inadvertently resuspend sediment into the water column, which is a major way in which these pollutants are reintroduced into the aquatic phase (42,43), leading to a continuous contaminant exposure route for biota living near the benthos (36,44). This pollution source is now recognised as a potential risk to environmental and human health (45). However, regulatory guidelines on allowable sediment toxicant loads are
rarely derived or implemented. This is likely due to the complex nature of the mixtures of pollutants and geochemical dynamics governing contaminant bioavailability and toxicity. This lack of regulatory guidance for toxicant load in a key compartment of the aquatic environment prevents a holistic ecological risk assessment. Environmental biological monitoring is time consuming and costly. Therefore, the use of relevant in vitro models, such as reporter assays (46) or assays to measures cytotoxicity and genotoxicity in cell lines, can help to identify toxic environments (47,48). This is especially important in developing countries where the pressure on the aquatic environment from pollution is rapidly growing and there is an urgent need to develop simple monitoring tools to bridge the gap in the knowledge between contaminant load and impact.
This study follows a similar approach of Schnell et al. (49) that advocated the use of a suite of in vitro tests coupled with chemi-cal analysis to identify potential toxic benthic sediments in the seas of northern Spain. Sediment from 11 sites along the west shore of Lagos lagoon, Nigeria, was evaluated in the rainbow trout gill (RTgill-W1) cell line. Cytotoxicity was assessed using the Alamar Blue assay measuring metabolic cell activity (50), and an unmodi-fied and modified Comet assay was used to detect DNA damage (6). Furthermore, a yeast oestrogen screen was applied to determine the effect of endocrine disruption (46). The data obtained were used to rank sediments in terms of environmental risk and thus advise on toxic sites. Although all sites showed a degree of toxicity, interest-ingly the toxicity measures did not always coincide with the meas-ured chemical contaminant load, indicating that restricted chemical analysis may not identify potential toxic sediments and an integra-tive approach that includes in vitro endpoints is necessary in sedi-ment risk assessment.
Materials and methods
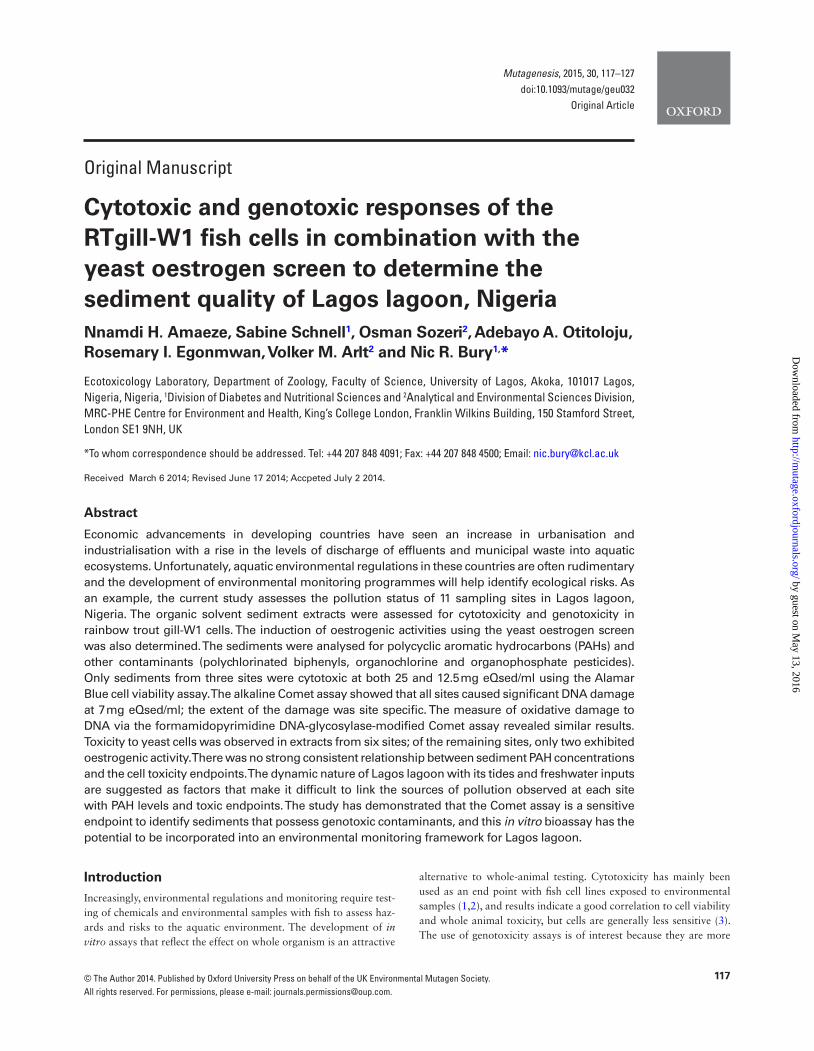
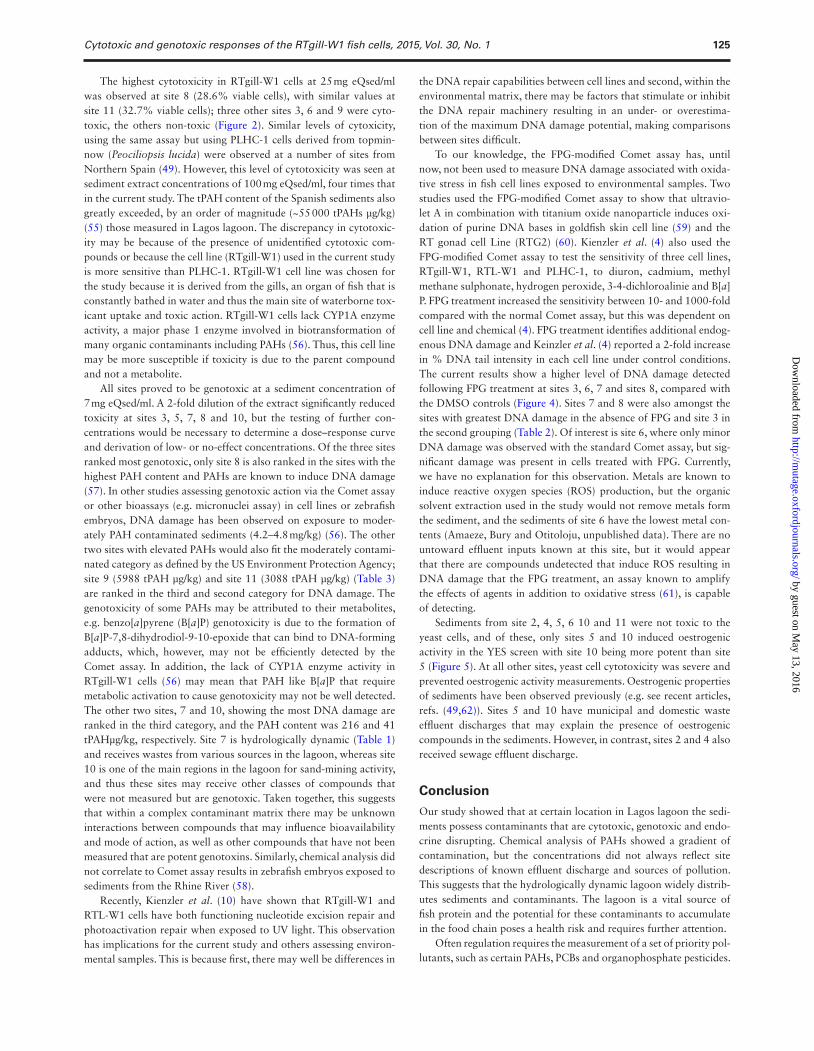
Study sites and samplingThis study was conducted in the Lagos lagoon, a tropical lagoon complex that stretches from Cotonu in the Republic of Benin and extends to the fringes of the Niger Delta in Nigeria along its 257 km course (Longitude 3°23″ and 3°53″E and latitude 6°26″ and 6°37″N). It is brackish water that is fed majorly in the north by the Ogun River and a host of other smaller rivers as well as tidal creeks. It discharges in the south into the South Atlantic Ocean through the Lagos harbour. Sediment was collected from 11 sampling sites (Figure 1) based on a previous study that evaluated metal loading (37). Sampling sites were divided into four zones: Zone I (Outer Lagos lagoon), 1. Victoria Island; 2. Apapa port and 3. Apapa tank farm; Zone II (mid/lower Lagos lagoon), 4. Iddo and 5. Makoko; Zone III (mid Lagos lagoon, University), 6. Unilag High rise; 7. Off third mainland bridge and 8. Off Unilag power station; and Zone IV (upper Lagos lagoon), 9. Ilaje; 10. Oworonshoki and 11. Odo Iyalaro. Descriptions of each sampling site along with characteristic sources of effluent contamination are given in Table 1. Approximately 1 kg of sediment was obtained from the surface at each sampling sites using 20 kg Van Veen grabs. Grabs were performed in triplicates per site and pooled together to ensure they are representative of each location. The samples were wrapped in aluminum foils in situ and transported chilled to the laboratory using ice packs.
Sediment preparation and extractionSediment samples were air dried under a ceiling fan and packed in aluminum foil for transportation to King’s College London, London, United Kingdom. Before extraction, samples were further
118 N. H. Amaeze et al., 2015, Vol. 30, No. 1
by guest on May 13, 2016
http://mutage.oxfordjournals.org/
Dow
nloaded from
freeze dried to ensure that all moisture was removed. Extraction was similar to the protocol described in Schnell et al. (49) Samples were ground in clean ceramic crucibles and shaken through a 63-μm sieve, from which 2.5 g of sediment was placed into glass vials. After the addition of 10 ml of dichloromethane:hexane (1:1; v:v) mixture, the samples were sonicated for 10 min at 4°C and then centrifuged (2000 g) for 10 min at 4°C. The supernatant was placed in a fresh glass vial and the procedure repeated twice. Sediments were further
extracted using a dichloromethane:acetone (1:1; v:v) mixture and the process repeated as described above. All supernatants were pooled and reduced to 5 ml over a stream of nitrogen gas. After the addition of 500 mg of activated copper to each extract, it was stored overnight at 4°C. Next day the supernatant was removed, placed into a fresh tube and evaporated as described earlier to complete dryness. Extracts were reconstituted with 500 μl of dimethylsul-phoxide (DMSO) or methanol depending on the subsequent assay
Figure 1. Map of sampling sites on the west coast of Lagos lagoon, Nigeria.
Table 1. Description of sampling sites in Lagos lagoon
Sampling sites Location within Lagos lagoon Sources of pollution/characteristics
1 Victoria Island Solid waste dump, boat transportation. Relatively undisturbed.2 Apapa port Shipping activities, loading and offloading of cargo, cement and sugar
plants, canals discharging municipal sewage.3 Apapa tank farm Petroleum products jetty, shore-side automechanic workshops, ship
welding centres, solid waste dumps.4 Iddo Major centre for discharge of septic tank wastes, solid waste dump,
subsistence recycling of jute bags and chemical cans by hand washing.5 Makoko Solid waste dumps, canals discharging municipal sewage, domestic
sewage.6 Off Unilag High Rise Relatively undisturbed shallow coast line, receives wastes from other
parts of the lagoon mainly by tidal action.7 Off third mainland bridge (Unilag section) Deep lagoon area receiving wastes from different parts of the lagoon at
high tide. Off-road wastes from the third mainland bridge.8 Off Unilag power station Solid waste dumps, canals discharging municipal sewage, university
campus sewage treatment plant effluents, electricity power station effluents.
9 Ilaje Solid waste dumps, canals discharging municipal sewage, domestic sewage.
10 Oworonshoki Solid waste dumps, domestic sewage, sand mining, boat construction and water transportation
11 Odo-Iya Alaro Industrial effluents from Ikeja/Ogba Industrial Estate.
Cytotoxic and genotoxic responses of the RTgill-W1 fish cells, 2015, Vol. 30, No. 1 119
by guest on May 13, 2016
http://mutage.oxfordjournals.org/
Dow
nloaded from
performed. Extracts were stored at −20°C until analysis. The stock was equivalent to 5 g dry weight extract (eQsed)/ml.
RTgill-W1 cell culture and cell viabilityRTgill-W1 cells (51) were routinely cultured in 75-cm2 culture flasks at 18°C in Leibovitz’s L-15 culture medium (Invitrogen) supple-mented with 5% fetal bovine serum, 1% of penicillin–streptomy-cin solution (10 000 units/ml penicillin, 10 mg/ml streptomycin) and 1% of gentamycin solution (10 mg/ml). For exposure to sediment extracts, cells were seeded in 96-well tissue culture plates at a cell density of 50 000 cells per well in 100 µl medium and left overnight for attachment. Cultures (n = 5) were exposed to various concentra-tions of extract (dissolved in DMSO) and cells were incubated for 24 h at 18°C. Controls were treated with solvent, DMSO, only; the final concentration of DMSO was always kept at 0.5%. A serial dilu-tion, 1:1–1:32, of sediment extract was made, and from each dilu-tion, 5 µl was added to 1000 µl of media to give final concentrations ranging from 0.78 mg to 25 mg eQsed/ml. For cell viability assess-ment, 100 µl of the test solution was added to each well. From pre-liminary standard toxicity curves two extract concentrations, (1:1) 25 mg eQsed/ml and (1:2) 12.5 mg eQsed/ml were chosen for further in-depth analysis. Assays were performed in triplicate.
The metabolic cell activity as a measure of cell viability was mon-itored using Alamar Blue (resazurin; Invitrogen) (50). Just before starting the assay, 526 µl of Alamar Blue was added to 10 ml of L15/ex, a modified L15 culture medium, which contains salts, galactose and pyruvate, but no vitamins and amino acids. The test medium was replaced by 100 µl of the Alamar Blue solution and incubated for an hour. Fluorescence was measured using a fluorescence plate reader (Synergy HT from Bio-Tek) with excitation and emission wavelengths 530 and 590 nm, respectively. Results were reported as relative fluorescent units.
Comet assayThe alkaline version of the Comet assay was used to detect DNA damage, including single- and double-strand breaks and alkali-labile (e.g. apurinic) sites (52). The lesion-specific repair enzyme FPG was employed to characterise oxidative damage to DNA as described previously (53). RTgill-W1 cells were seeded into 25-cm2 culture flasks (0.7 × 10⁶ cells/4 ml media) and incubated for 24 h at 18°C. Each set of experiments included extracts from two sites as well as from site 11, Odo Iya-Alaro, a site of known to receive industrial effluent, which acted as an internal standard to account for inter-experimental variation. Cells grown in media containing 0.5% DMSO served as control. For each exposure, 22.5 µl of test extract was added to each flask. The concentration of extract used for treat-ment was based on the lowest dilution, where there was no loss of cell viability, this equated to 1:4 and 1:8 dilutions or 7 μg and 3.5 mg eQsed/ml.
After 24 h of incubation at 18°C, cells were trypsinised and resuspended in phosphate-buffered saline (PBS) to a final concentra-tion of 2 × 10⁶ cells/ml. Fifty microlitres of the cell suspension was mixed with 150 µl of 0.65% low melting point agarose (in PBS), pre-heated to 45°C and 75 µl aliquots were spread over agarose pre-treated microscope slides. Slides where placed on ice for 30 min until the agarose cell mixture was solidified and transferred into lysis buffer (2.5 M NaCl, 100 mM EDTA, 10 mM Tris, 250 mM NaOH pH 10) overnight at 5°C. Thirty microlitres of FPG enzyme (54 ng/µl) in enzyme buffer (0.1 M KCl, 40 mM HEPES, 0.5 mM EDTA, 0.2 mg/ml bovine serum albumin) or enzyme buffer alone as control were added and incubations were performed in a humidity chamber
pre-heated to 37°C for 30 min. DNA unwinding was performed in denaturing/electrophoresis buffer (0.3 M NaOH, 1 mM EDTA) for a further 30 min at 4°C. Electrophoresis (22 V for 24 min at 0.3 A) was performed in a pre-cooled (4°C) horizontal electrophore-sis tank. After electrophoresis, slides were placed in neutralisation buffer (0.4 M Tris-Cl pH 7.5), and subsequently fixed in methanol for 10 min. Dried slides were then stained with ethidium bromide (10 µg/ml in water) for 5 min. Comets where analysed using a Leica fluorescence microscope (Leica DMLB 020-519-010 LB30T). DNA damage was scored using the Comet IV capture system (version 4.11; Perceptive Instruments, UK). Fifty nucleoids were assessed per slide, and each sample was analysed in duplicate. All samples were measured blind. The results from both replicates were combined for further analysis. The tail intensity (% tail DNA), defined as the per-centage of DNA migrated from the head of the comet into the tail, was used as a measure of DNA damage induced, because it has been shown to be a meaningful end point to assess genotoxicity (54).
Yeast oestrogen screenThe culture of yeast cells containing the human oestrogen receptor integrated into its genome and also carrying an expression plasmid with the oestrogen response element upstream of the lacZ reporter gene was performed as described (46). Yeast cells were incubated with chlorophenol red-b-D-galactopyranoside (CPRG) and in the presence of an oestrogenic compound the oestrogen receptor was activated, which induced the synthesis of beta-galactosidase, encoded for by lacZ. This enzyme breaks down CPRG changing the media from a yellow to red colour, the absorbance of which is meas-ured at 540 nm.
Experiments were conducted in 96-well plates containing 200 μl of yeast culture (0.4 × 10⁻⁷ cell/50 ml). For each site a dilution of the stock was carried out generating a range of concentrations from 7.8 to 250 mg eQsed/ml (e.g. 1:32 to 1:1). Yeast grown in media con-taining 0.5% DMSO served as control. Each experiment included a blank (no DMSO), DMSO controls and a series of estradiol (E2) controls, with a range of 5 × 10⁻¹³–5 × 10⁻⁸ M. E2 was dissolved in ethanol and 10 μl of the stock test solution was added to each well and allowed to dry before the addition of yeast cells. Cells were incubated at 32°C in a humidified atmosphere for 75 h, after which the absorbance at 540 and 630 nm was measured. The reading at 630 nm accounts for changes in growth and cell lysis. Samples where growth was less than the controls were not considered. Oestrogenic activity was calculated as follows: sample absorbance (540 nm) − [sample absorbance (630 nm) − control absorbance (630 nm)]. The experiment was performed three times.
Chemical analysisA single sediment sample from each site was sent to the National Laboratory Services, Leeds, United Kingdom, a UKAS (Method accredited to International Organization for Standardization/International Electrotechnical Commission 17025) accredited labo-ratory for analysis of polyaromatic hydrocarbons, PCBs, organochlo-rine and organophosphate pesticides (see Appendix 1). For tetra- to octa-chlorinated dioxins and furans, PCB samples were extracted into toluene using a Dionex Accelerated Solvent Extraction (ASE)™ system and cleaned up to remove potentially interfering compounds such as fats. For quantification 13C labelled isotopes of the compounds of interest are added to the sample before extraction and used as internal standards. For the other compounds sediment, samples were extract with dichloromethane between 12 and 14 h on a horizontal roller at room temperature. For some measurements, a fraction of the
120 N. H. Amaeze et al., 2015, Vol. 30, No. 1
by guest on May 13, 2016
http://mutage.oxfordjournals.org/
Dow
nloaded from

dichloromethane extract was passed through a solid-phase extraction cartridge and extracted with hexane. All samples were analysed on a High-Resolution GC-MS (HR GC-MS) or GC-MS.
Statistical analysisFor the cytotoxicity assay, results are presented as the mean ± SD of replicate wells of three independent experiments and expressed as percentage of solvent controls. Significant difference between sites and the solvent control were calculated based on untransformed flu-orescent units using the non-parametric Mann–Whitney rank sum test (SigmaStat v12.0).
For the assessment of strand breaks an one-way analysis of vari-ance (ANOVA) revealed significant differences in % DNA tail intensity between the DMSO controls used during each set of experiments (one-way ANOVA failed the Shapiro–Wilkins normality test and Kruskal–Wallis rank test P < 0.001, SigmaStat v12.0), but there was no difference between the internal control site 11 (one-way ANOVA, failed homog-eny of variance and passed Shapiro–Wilkins normality test, P = 0.056, SigmaStat v12.0). Because of the significant difference in the DMSO controls, a comparison between each site from different sets of experi-ments was not performed. Instead, for each experiment the difference in DNA tail intensity between exposure and the DMSO control, as well as between the two dilutions from each site, was assessed via a t-test or Mann–Whitney rank sum test depending on whether the data was normally distributed (SigmaStat v12.0). The extent of oxidative DNA purine damage was determined by subtracting the % DNA tail inten-sity from the FPG-treated cells from the buffer alone.
Results
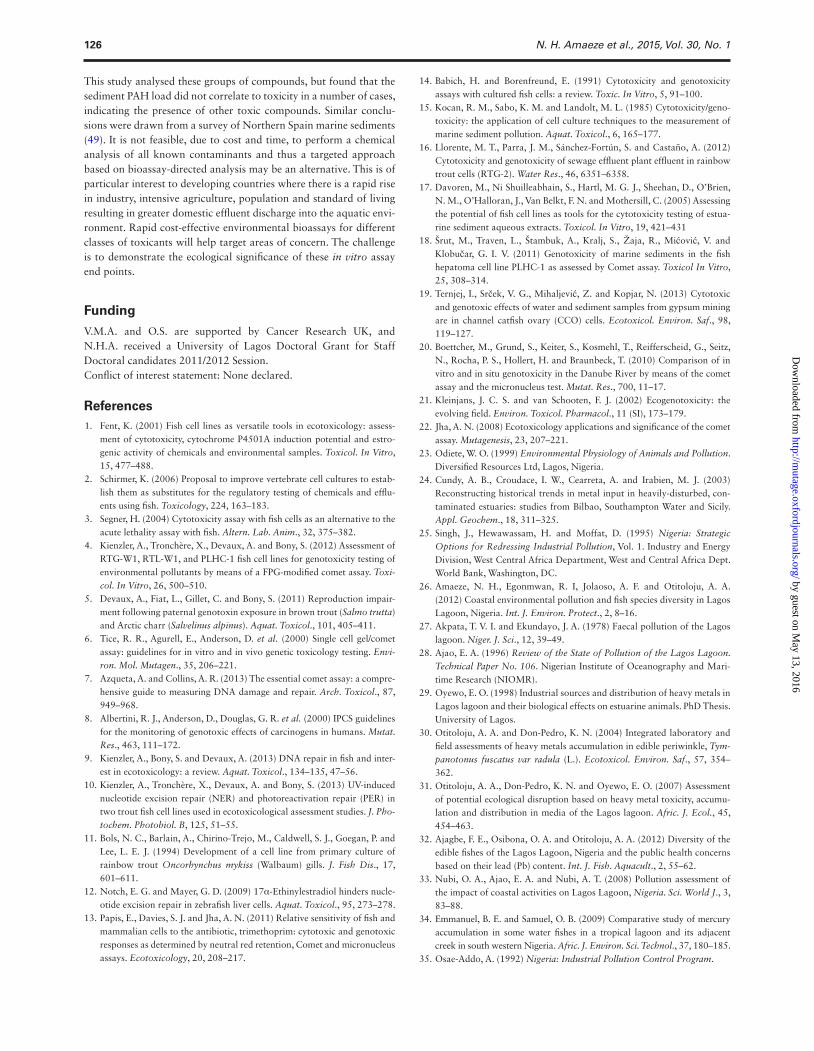
Cytotoxicity in RTgill-W1 cellsExtracts from sites 1, 4, 5, 7 and 10 were not cytotoxic to RTgill-W1 cells. Extracts from sites 2, 3 and 11 were toxic at 25 mg eQsed/ml and
sites 6, 8 and 11 toxic at both 25 and 12.5 mg eQsed/ml (Figure 2) compared to solvent controls (Mann–Whitney rank sum test, P < 0.05).
Genotoxicity in RTgill-W1 cellsAll extracts at 7 mg eQsed/ml caused a significant increase in % DNA tail intensity and only site 1 at 3.5 mg eQsed/ml did not induce any DNA damage when compared with the DMSO control (Figure 3). A 2-fold dilution in the extracts from sites 3, 5, 7 and 8 caused a significant reduction in DNA damage, but this was not apparent at sites 1, 2, 4, 6, 9 or 11 (Figure 3). A ranking of site DNA damage based on subtracting the mean % DNA tail intensity from each site exposed to 7 mg eQsed/ml shows that site 7 induced the most DNA damage followed by site 8 > 10 > 4 > 3 > 11 > 9 > 2 > 1 > 5 > 6 (Table 2). A measure of oxidative damage to DNA determined using the FPG-modified Comet assay revealed a ranking of the greatest effect at 7 mg eQsed/ml of site 3 > 7 = 6 > 8 > 11 > 5 = 4 > 1 = 9 = 10 > 2 = DMSO control (Figure 4).
Yeast oestrogen screenThe DMSO and extracts from sites 1, 5, 6, 10 and 11 were not toxic to the yeast cells. However, sites 3 and 8 were toxic down to 7.8 mg eQsed/ml (1:32 dilutions) and sites 2, 4, 7 and 9 to 15.6 mg eQsed/ml (1:16 dilution). For the latter four sites, growth was seen at 7.8 mg eQsed/ml, but no oestrogenic activity was observed. Of the non-toxic extracts, sites 5 and 10 induced oestrogenic activity at the highest sediment extract load (250 mg eQsed/ml). However, the activity at site 5 was low but above the absorbance of the lowest observable concentration of E2 to induce activity, 0.5 × 10⁻¹¹ M E2. Oestrogenic activity at site 10 was higher around the E2 EC50 (~0.2 × 10⁻¹⁰ M) value (Figure 5).
Toxicity assessmentTo assess the overall combined toxicity from the various in vitro tests, a ranking approach was used, where the sites were placed into
1 2 3 4 5 6 7 8 9 10 11
Via
ble
cel
ls [
% c
on
tro
l]
0
20
40
60
80
100
120
Sampling sites in Lagos Lagoon
*
* *
*
*
*
*
*
*
*
Figure 2. Cell viability in RTgill-W1 cells, as measured by the cells’ ability to reduce Alamar Blue (resazurin). Results are expressed as viable cells (% control) and each bar represents an average of three independent experiments ± SD. The white bars represent a final exposure concentration of 25 mg eQsed/ml and the grey bars exposure to 12.5 mg eQsed/ml. Asterisks indicate significant difference (Mann–Whitney rank sum test, P < 0.05 performed on the untransformed fluorescent units) from controls.
Cytotoxic and genotoxic responses of the RTgill-W1 fish cells, 2015, Vol. 30, No. 1 121
by guest on May 13, 2016
http://mutage.oxfordjournals.org/
Dow
nloaded from
four arbitrary ranges and the scores combined to give an overall toxic unit measure (Table 2). The toxicity rank for the cell viability assay (Figure 2) was as follows: rank 1, toxic at both concentrations and cell viability <40%; rank 2, toxic at both concentrations, with cell viability >50%; rank 3, toxic at one concentration; rank 4, non-toxic. Because there was significant difference between the controls for each set of experiments, the difference in the average % tail DNA intensity at an exposure concentration of 7 mg eQsed/ml from each site to the corresponding control (Figure 3) was used and ranked as
follows: rank 1 (most toxic), Δ 16–32; rank 2, Δ 12–15; rank 3, Δ 10–12; and rank 4, Δ <10. For oxidative damage to DNA (Figure 4), ranking was as follows: rank 1, >22; rank 2, 20; rank 3, 10–20; and rank 4, <10. For the yeast assay, values were based on the lowest dilution to cause significant death of the cells: rank 1, 1:32 dilution; rank 2, 1:16; rank 3, 1:8; and rank 4, non-toxic. Overall toxicity based on the ranking revealed the hierarchy of toxicity as follows: 8 > 3 > 7 > 11 > 6 = 4 > 9 = 2 > 10 > 5 > 1. For comparative purposes sediment total PAH (tPAH) concentrations were also ranked: rank 1,
0
20
40
60
80
100
0
20
40
60
80
100
% T
ail D
NA
0
20
40
60
80
100
0
20
40
60
80
100
0
20
40
60
80
100
ConSite 4
a bSite 8
a bSite 11
a b ConSite 2
a bSite 9
a bSite 11
a b
ConSite 3
a bSite 5
a bSite 11
a bCon a bSite 10
a bSite 11
a bSite 1
ConSite 6
a bSite 7
a bSite 11
a b
*
*
*
* *
*#
* * ** **
* **
*
*#
*
**
*
*
*
#
#
* **
* *
*#
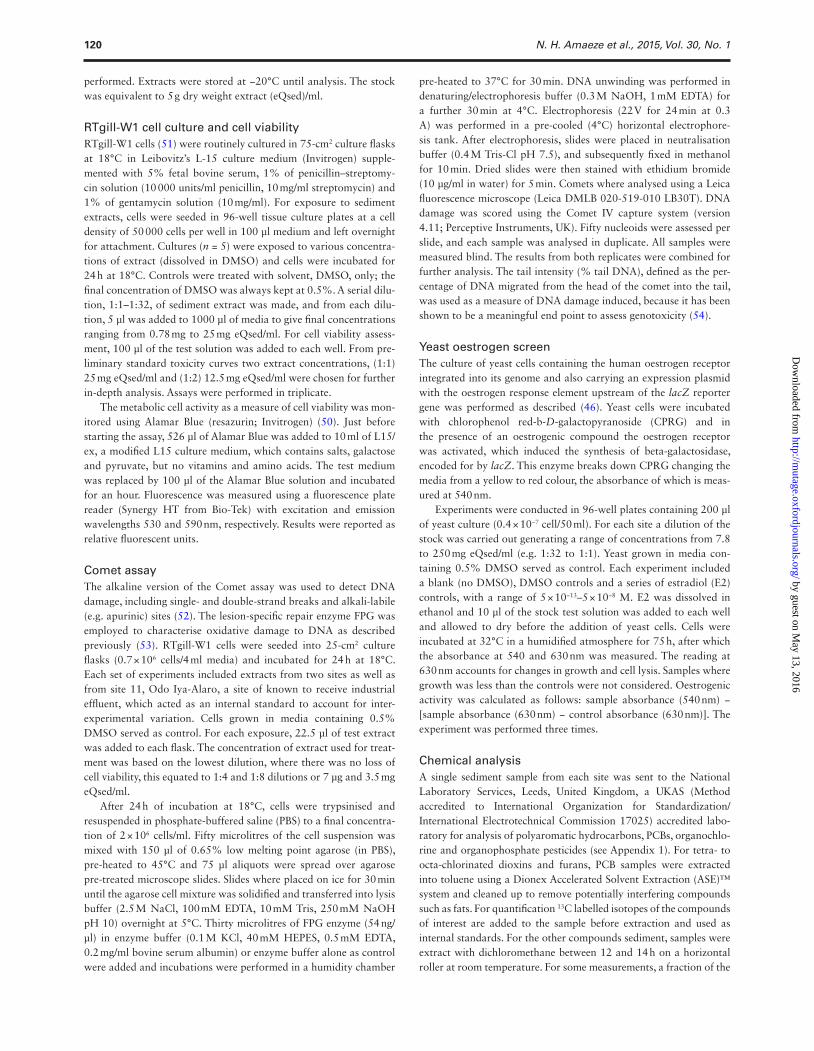
Figure 3. DNA damage as measured by the Comet assay in RT-gill W1 cells following 24-h exposure to (a) 7 and (b) 3.5 mg eQsed/ml. Boxes represent middle 50% range of data with the bar representing the median (n = 100). The whiskers represent the range and circles the outliers, which represent any value that lies more than one and a half times the length of the box from either end. Asterisks indicate significant differences to the solvent controls (Con), whereas # indicates significant difference between the two dilutions 7 and 3.5 mg eQsed/ml, if the data was normally distributed a Student’s t-test was applied, and if not normal a Mann–Whitney U-test was used, P < 0.05 was considered significant.
122 N. H. Amaeze et al., 2015, Vol. 30, No. 1
by guest on May 13, 2016
http://mutage.oxfordjournals.org/
Dow
nloaded from
tPAH > 3000 μg/kg; rank 2, tPAH 1000–2000 μg/kg; rank 3, tPAH 40–300 μg/kg and rank 4, <1 μg/kg.
Discussion
This study, for the first time, used the RTgill-W1 cell line and a suite of in vitro bioassays to assess the environmental quality of sedi-ments at various sites along the southern and western shore of Lagos lagoon, Nigeria. The bioassays included the cells’ ability to reduce Alamar Blue, a measure of energy metabolism that correlates with cell viability as well as the induction of DNA damage (including oxidative damage to DNA) via the Comet assay, a measure of geno-toxicity. In addition, a yeast oestrogen screen was used as a measure of the presence of endocrine disrupting compounds. DNA damage proved the most sensitive end point and was induced at each site. In the other two assays, some sites were not toxic whilst others proved toxic, particularly to the yeast cells, which hindered the assessment
of oestrogenic activity. However, sediment oestrogenic activity was detected at two sites (5 and 10). Interestingly, there was one site, 8, that ranked high on toxicity where sediment PAH measurements were also extremely high (Table 2); in other instances, this relation-ship was not always apparent suggesting that other cytotoxic and genotoxic contaminants were present.
The sites chosen have different pollutant inputs and hydrologi-cal characteristics (Table 1). The organic solvent extraction method released the majority of organic pollutants from the sediment. The chemical analysis was targeted towards a range of polyaromatic hydrocarbons, PCBs, organochlorine and organophosphate pesti-cides and revealed the presence of at least one compound at each site. The sediment contamination was dominated by PAHs; no PCBs were identified and only cypermethrin (308 μg/kg) at site 3 and dichlorodiphenyltrichloroethane (24 μg/kg) at site 2 was addition-ally detected. Based on tPAH, the contamination could be grouped into high: sites 8, 9 and 11 (tPAH > 3000 μg/kg); medium: sites 2,
Con 1 2 3 4 5 6 7 8 9 10 11
Oxi
dat
ive
dam
age
to D
NA
(ar
bit
rary
un
its)
0
5
10
15
20
25
30
Sampling sites in Lagos Lagoon
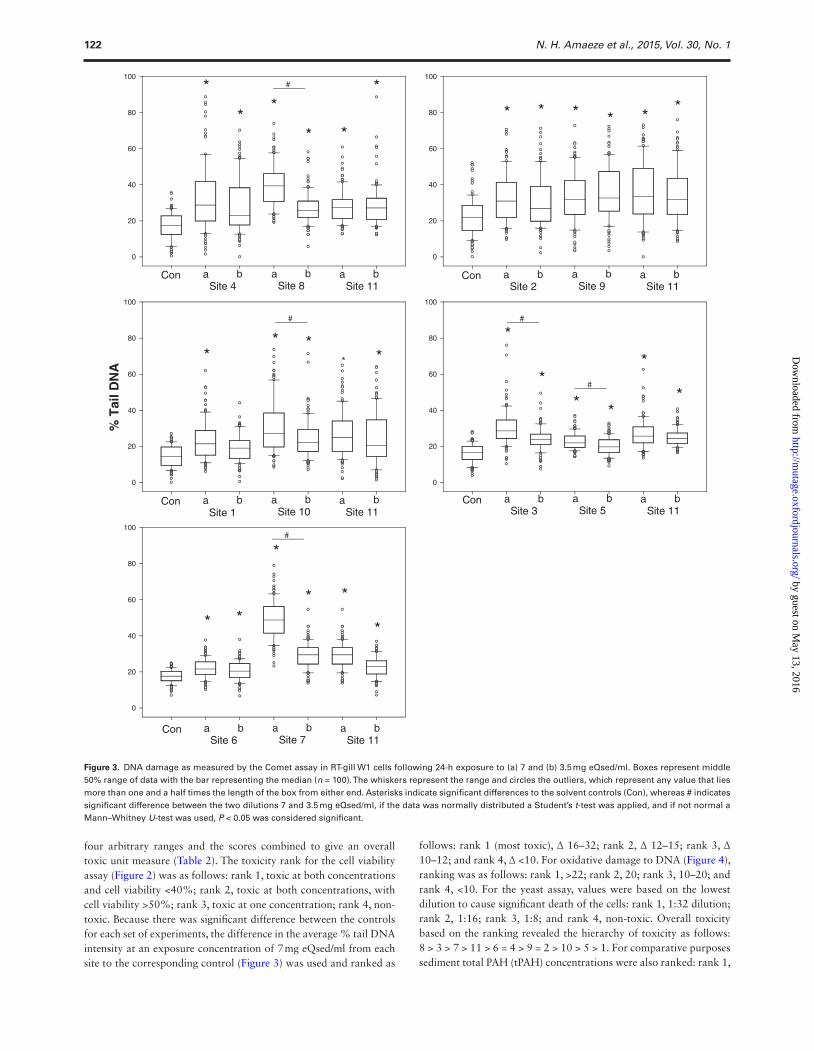
Figure 4. Oxidative damage to DNA assessed by the FPG-modified Comet assay in RT-gill W1 cells following 24-h exposure to 7 mg eQsed/ml. Values represent the difference in % DNA tail intensity recorded in the presence or absence of FPG. The values represent the average of repeats and the average % DNA tail intensity measured in 50 cells from each repeat (n = 100).
Table 2. Ranking of sites for total sediment PAH concentrations as well as cell viability, induced DNA damage and yeast toxicity
Sites in Lagos lagoon PAH Cell viability Comet assay (unmodified) FPG-modified Comet assay Yeast toxicity Total toxic unit
1 4 4 4 3 4 15 (11)2 2 3 3 4 2 12 (7)3 2 2 2 1 1 6 (2)4 2 4 2 3 2 11 (5)5 4 4 4 3 4 15 (10)6 3 2 4 1 4 11 (5)7 3 4 1 1 2 8 (3)8 1 1 1 2 1 5 (1)9 1 3 3 3 3 12 (7)10 3 4 1 4 4 13 (8)11 1 1 2 3 4 10 (4)
See text in Results for details of ranking ranges for Classes 1–4. Total toxic unit = sum of the rank for the cell viability, Comet assay, modified Comet assay and yeast toxicity. The number in parentheses equals rank of total toxicity.
Cytotoxic and genotoxic responses of the RTgill-W1 fish cells, 2015, Vol. 30, No. 1 123
by guest on May 13, 2016
http://mutage.oxfordjournals.org/
Dow
nloaded from
3 and 4 (tPAH 1000–2000 μg/kg); medium/low: sites 6, 7 and 10 (tPAH 40–300 μg/kg); and low, sites 1 and 5 (<1 μg/kg) (Table 3). These values are similar to those measured in the Yellow Sea, China (range 408–4032 μg/kg from 3 sites (39). It is difficult to relate the description of the surrounding industry and potential effluent inputs at each site to the tPAH load, the exception being site 1 where the description is ‘relatively undisturbed’ and there is minimal PAH contamination (Table 3). Site 6 is also described as relatively undis-turbed shallow site, but is tidally active receiving waters from other regions and this may in part explain the PAH contamination (tPAHs
263 μg/kg). In contrast, site 5 receives municipal and domestic sew-age as well as being located close to a waste dump, similar to the description of site 9, but the tPAHs at both sites are in marked con-trast, site 5, 0.8 μg tPAH/kg and site 9, 3510 μg tPAH/kg. The site descriptions give an indication of the pollutant inputs, but discrep-ancies are likely because of additional petrogenic sources of PAHs associated with the main port for Nigeria being situated in Lagos. In addition, hydrogeomorphological and hydrological processes within the lagoon are complex and will cause widespread dispersal of sedi-ments and their associated contaminants.
[E2] (M)
1e-13 1e-12 1e-11 1e-10 1e-9 1e-8 1e-7
Abs
540
nm -
(sa
mpl
e A
bs 6
30 -
bla
nk A
bs63
0)
0.8
1.0
1.2
1.4
1.6
1.8
2.0
2.2
2.4
2.6
2.8
Site Correctedabsorbance
5 1.27 ± 0.01
10 1.85 ± 0.09
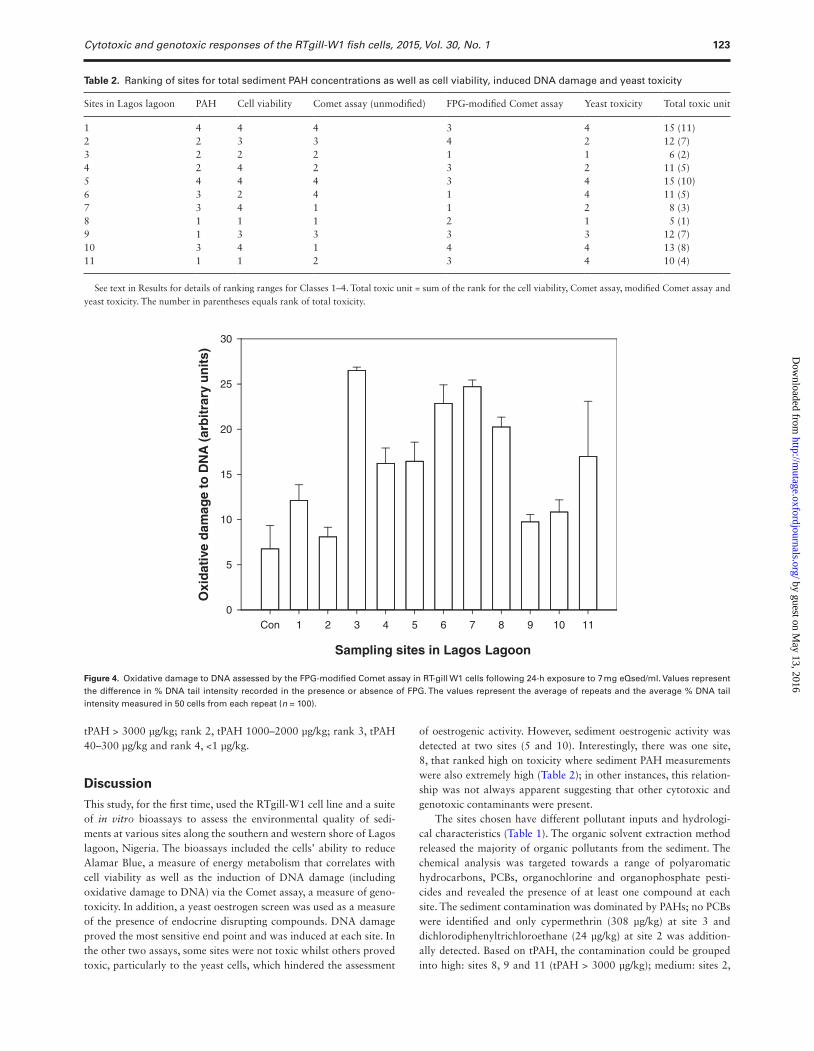
Figure 5. An example of the standard curve for estradiol (E2) stimulated oestrogen receptor activity in the yeast oestrogen screen (YES) assay. Inset indicates those sites (5 and 10) that induced oestrogen receptor activity and values in the table represent the average ± SEM (n = 3) of corrected absorbance [e.g. Abs. 540 nm − (sample Abs. 630 nm − blank abs. 630 nm)]. Sites 2, 3, 4, 7, and 9 proved toxic to the yeast cells whereas 1, 6 and 11 were non-toxic but did not induce any oestrogenic activity.
Table 3. PAH content of sediment samples in Lagos lagoon
Compounds 1 2 3 4 5 6 7 8 9 10 11
Acenaphthene 0.4 14.8 10.7 5.8 0.8 1.6 ND ND 29.7 1.8 73.8Acenaphthylene ND 15.5 ND 4.8 ND ND 1.18 ND ND ND NDAnthracene ND 20.8 ND 287 ND ND ND 69 104 ND 103Benzo[b+k]fluoranthene ND ND ND 80 ND 40 ND ND ND ND NDBenz[a]anthracene ND 58.2 62.4 70.1 ND 27.6 ND 311 374 ND 128Benzo[a]pyrene ND 76.4 73.1 ND ND 28.4 ND 253 393 ND 98.9Benzo[b]fluoranthene ND ND ND 78.1 ND 38.1 ND ND ND ND NDBenzo[e]pyrene ND 110 108 ND ND 21.3 ND 227 462 ND 146Benzo[ghi]perylene ND 115 108 48.4 ND 22.8 29.1 261 674 14.4 0Chrysene ND 63.1 82.7 115 ND ND ND 314 394 ND 107Coronene ND 58 56.5 21.5 ND ND ND 109 285 ND 97.9Cyclopenta[cd]pyrene ND 16.1 15.7 ND ND ND ND ND ND ND 0Dibenz[a,h]anthracene ND 14.2 16.7 9.7 ND 4.9 3.3 39.8 59.8 ND 16.2Fluoranthene ND 183 161 71 ND 39.3 31.4 715 843 ND 370Fluorene ND 46.5 30.5 42.8 ND ND 11.3 44.5 126 ND 210Indeno[1,2,3-cd]pyrene ND 96.8 92.6 ND ND ND ND ND 525 ND NDPerylene ND 238 73.3 153 ND ND 66.8 154 164 ND 280Phenanthrene ND 101 116 88.6 ND ND 31.7 390 514 ND 847Pyrene ND 348 290 88 ND 39.1 40.9 623 1040 24.6 610Total PAHs 0.4 1575 1297 1164 0.8 263 216 3510 5988 41 3088
All values expressed as μg/kg dry weight sediment. ND = not detected.
124 N. H. Amaeze et al., 2015, Vol. 30, No. 1
by guest on May 13, 2016
http://mutage.oxfordjournals.org/
Dow
nloaded from
The highest cytotoxicity in RTgill-W1 cells at 25 mg eQsed/ml was observed at site 8 (28.6% viable cells), with similar values at site 11 (32.7% viable cells); three other sites 3, 6 and 9 were cyto-toxic, the others non-toxic (Figure 2). Similar levels of cytoxicity, using the same assay but using PLHC-1 cells derived from topmin-now (Peociliopsis lucida) were observed at a number of sites from Northern Spain (49). However, this level of cytotoxicity was seen at sediment extract concentrations of 100 mg eQsed/ml, four times that in the current study. The tPAH content of the Spanish sediments also greatly exceeded, by an order of magnitude (~55 000 tPAHs μg/kg) (55) those measured in Lagos lagoon. The discrepancy in cytotoxic-ity may be because of the presence of unidentified cytotoxic com-pounds or because the cell line (RTgill-W1) used in the current study is more sensitive than PLHC-1. RTgill-W1 cell line was chosen for the study because it is derived from the gills, an organ of fish that is constantly bathed in water and thus the main site of waterborne tox-icant uptake and toxic action. RTgill-W1 cells lack CYP1A enzyme activity, a major phase 1 enzyme involved in biotransformation of many organic contaminants including PAHs (56). Thus, this cell line may be more susceptible if toxicity is due to the parent compound and not a metabolite.
All sites proved to be genotoxic at a sediment concentration of 7 mg eQsed/ml. A 2-fold dilution of the extract significantly reduced toxicity at sites 3, 5, 7, 8 and 10, but the testing of further con-centrations would be necessary to determine a dose–response curve and derivation of low- or no-effect concentrations. Of the three sites ranked most genotoxic, only site 8 is also ranked in the sites with the highest PAH content and PAHs are known to induce DNA damage (57). In other studies assessing genotoxic action via the Comet assay or other bioassays (e.g. micronuclei assay) in cell lines or zebrafish embryos, DNA damage has been observed on exposure to moder-ately PAH contaminated sediments (4.2–4.8 mg/kg) (56). The other two sites with elevated PAHs would also fit the moderately contami-nated category as defined by the US Environment Protection Agency; site 9 (5988 tPAH µg/kg) and site 11 (3088 tPAH µg/kg) (Table 3) are ranked in the third and second category for DNA damage. The genotoxicity of some PAHs may be attributed to their metabolites, e.g. benzo[a]pyrene (B[a]P) genotoxicity is due to the formation of B[a]P-7,8-dihydrodiol-9-10-epoxide that can bind to DNA-forming adducts, which, however, may not be efficiently detected by the Comet assay. In addition, the lack of CYP1A enzyme activity in RTgill-W1 cells (56) may mean that PAH like B[a]P that require metabolic activation to cause genotoxicity may not be well detected. The other two sites, 7 and 10, showing the most DNA damage are ranked in the third category, and the PAH content was 216 and 41 tPAHµg/kg, respectively. Site 7 is hydrologically dynamic (Table 1) and receives wastes from various sources in the lagoon, whereas site 10 is one of the main regions in the lagoon for sand-mining activity, and thus these sites may receive other classes of compounds that were not measured but are genotoxic. Taken together, this suggests that within a complex contaminant matrix there may be unknown interactions between compounds that may influence bioavailability and mode of action, as well as other compounds that have not been measured that are potent genotoxins. Similarly, chemical analysis did not correlate to Comet assay results in zebrafish embryos exposed to sediments from the Rhine River (58).
Recently, Kienzler et al. (10) have shown that RTgill-W1 and RTL-W1 cells have both functioning nucleotide excision repair and photoactivation repair when exposed to UV light. This observation has implications for the current study and others assessing environ-mental samples. This is because first, there may well be differences in
the DNA repair capabilities between cell lines and second, within the environmental matrix, there may be factors that stimulate or inhibit the DNA repair machinery resulting in an under- or overestima-tion of the maximum DNA damage potential, making comparisons between sites difficult.
To our knowledge, the FPG-modified Comet assay has, until now, not been used to measure DNA damage associated with oxida-tive stress in fish cell lines exposed to environmental samples. Two studies used the FPG-modified Comet assay to show that ultravio-let A in combination with titanium oxide nanoparticle induces oxi-dation of purine DNA bases in goldfish skin cell line (59) and the RT gonad cell Line (RTG2) (60). Kienzler et al. (4) also used the FPG-modified Comet assay to test the sensitivity of three cell lines, RTgill-W1, RTL-W1 and PLHC-1, to diuron, cadmium, methyl methane sulphonate, hydrogen peroxide, 3-4-dichloroalinie and B[a]P. FPG treatment increased the sensitivity between 10- and 1000-fold compared with the normal Comet assay, but this was dependent on cell line and chemical (4). FPG treatment identifies additional endog-enous DNA damage and Keinzler et al. (4) reported a 2-fold increase in % DNA tail intensity in each cell line under control conditions. The current results show a higher level of DNA damage detected following FPG treatment at sites 3, 6, 7 and sites 8, compared with the DMSO controls (Figure 4). Sites 7 and 8 were also amongst the sites with greatest DNA damage in the absence of FPG and site 3 in the second grouping (Table 2). Of interest is site 6, where only minor DNA damage was observed with the standard Comet assay, but sig-nificant damage was present in cells treated with FPG. Currently, we have no explanation for this observation. Metals are known to induce reactive oxygen species (ROS) production, but the organic solvent extraction used in the study would not remove metals form the sediment, and the sediments of site 6 have the lowest metal con-tents (Amaeze, Bury and Otitoloju, unpublished data). There are no untoward effluent inputs known at this site, but it would appear that there are compounds undetected that induce ROS resulting in DNA damage that the FPG treatment, an assay known to amplify the effects of agents in addition to oxidative stress (61), is capable of detecting.
Sediments from site 2, 4, 5, 6 10 and 11 were not toxic to the yeast cells, and of these, only sites 5 and 10 induced oestrogenic activity in the YES screen with site 10 being more potent than site 5 (Figure 5). At all other sites, yeast cell cytotoxicity was severe and prevented oestrogenic activity measurements. Oestrogenic properties of sediments have been observed previously (e.g. see recent articles, refs. (49,62)). Sites 5 and 10 have municipal and domestic waste effluent discharges that may explain the presence of oestrogenic compounds in the sediments. However, in contrast, sites 2 and 4 also received sewage effluent discharge.
Conclusion
Our study showed that at certain location in Lagos lagoon the sedi-ments possess contaminants that are cytotoxic, genotoxic and endo-crine disrupting. Chemical analysis of PAHs showed a gradient of contamination, but the concentrations did not always reflect site descriptions of known effluent discharge and sources of pollution. This suggests that the hydrologically dynamic lagoon widely distrib-utes sediments and contaminants. The lagoon is a vital source of fish protein and the potential for these contaminants to accumulate in the food chain poses a health risk and requires further attention.
Often regulation requires the measurement of a set of priority pol-lutants, such as certain PAHs, PCBs and organophosphate pesticides.
Cytotoxic and genotoxic responses of the RTgill-W1 fish cells, 2015, Vol. 30, No. 1 125
by guest on May 13, 2016
http://mutage.oxfordjournals.org/
Dow
nloaded from
This study analysed these groups of compounds, but found that the sediment PAH load did not correlate to toxicity in a number of cases, indicating the presence of other toxic compounds. Similar conclu-sions were drawn from a survey of Northern Spain marine sediments (49). It is not feasible, due to cost and time, to perform a chemical analysis of all known contaminants and thus a targeted approach based on bioassay-directed analysis may be an alternative. This is of particular interest to developing countries where there is a rapid rise in industry, intensive agriculture, population and standard of living resulting in greater domestic effluent discharge into the aquatic envi-ronment. Rapid cost-effective environmental bioassays for different classes of toxicants will help target areas of concern. The challenge is to demonstrate the ecological significance of these in vitro assay end points.
Funding
V.M.A. and O.S. are supported by Cancer Research UK, and N.H.A. received a University of Lagos Doctoral Grant for Staff Doctoral candidates 2011/2012 Session.Conflict of interest statement: None declared.
References 1. Fent, K. (2001) Fish cell lines as versatile tools in ecotoxicology: assess-
ment of cytotoxicity, cytochrome P4501A induction potential and estro-genic activity of chemicals and environmental samples. Toxicol. In Vitro, 15, 477–488.
2. Schirmer, K. (2006) Proposal to improve vertebrate cell cultures to estab-lish them as substitutes for the regulatory testing of chemicals and efflu-ents using fish. Toxicology, 224, 163–183.
3. Segner, H. (2004) Cytotoxicity assay with fish cells as an alternative to the acute lethality assay with fish. Altern. Lab. Anim., 32, 375–382.
4. Kienzler, A., Tronchère, X., Devaux, A. and Bony, S. (2012) Assessment of RTG-W1, RTL-W1, and PLHC-1 fish cell lines for genotoxicity testing of environmental pollutants by means of a FPG-modified comet assay. Toxi-col. In Vitro, 26, 500–510.
5. Devaux, A., Fiat, L., Gillet, C. and Bony, S. (2011) Reproduction impair-ment following paternal genotoxin exposure in brown trout (Salmo trutta) and Arctic charr (Salvelinus alpinus). Aquat. Toxicol., 101, 405–411.
6. Tice, R. R., Agurell, E., Anderson, D. et al. (2000) Single cell gel/comet assay: guidelines for in vitro and in vivo genetic toxicology testing. Envi-ron. Mol. Mutagen., 35, 206–221.
7. Azqueta, A. and Collins, A. R. (2013) The essential comet assay: a compre-hensive guide to measuring DNA damage and repair. Arch. Toxicol., 87, 949–968.
8. Albertini, R. J., Anderson, D., Douglas, G. R. et al. (2000) IPCS guidelines for the monitoring of genotoxic effects of carcinogens in humans. Mutat. Res., 463, 111–172.
9. Kienzler, A., Bony, S. and Devaux, A. (2013) DNA repair in fish and inter-est in ecotoxicology: a review. Aquat. Toxicol., 134–135, 47–56.
10. Kienzler, A., Tronchère, X., Devaux, A. and Bony, S. (2013) UV-induced nucleotide excision repair (NER) and photoreactivation repair (PER) in two trout fish cell lines used in ecotoxicological assessment studies. J. Pho-tochem. Photobiol. B, 125, 51–55.
11. Bols, N. C., Barlain, A., Chirino-Trejo, M., Caldwell, S. J., Goegan, P. and Lee, L. E. J. (1994) Development of a cell line from primary culture of rainbow trout Oncorhynchus mykiss (Walbaum) gills. J. Fish Dis., 17, 601–611.
12. Notch, E. G. and Mayer, G. D. (2009) 17α-Ethinylestradiol hinders nucle-otide excision repair in zebrafish liver cells. Aquat. Toxicol., 95, 273–278.
13. Papis, E., Davies, S. J. and Jha, A. N. (2011) Relative sensitivity of fish and mammalian cells to the antibiotic, trimethoprim: cytotoxic and genotoxic responses as determined by neutral red retention, Comet and micronucleus assays. Ecotoxicology, 20, 208–217.
14. Babich, H. and Borenfreund, E. (1991) Cytotoxicity and genotoxicity assays with cultured fish cells: a review. Toxic. In Vitro, 5, 91–100.
15. Kocan, R. M., Sabo, K. M. and Landolt, M. L. (1985) Cytotoxicity/geno-toxicity: the application of cell culture techniques to the measurement of marine sediment pollution. Aquat. Toxicol., 6, 165–177.
16. Llorente, M. T., Parra, J. M., Sánchez-Fortún, S. and Castaño, A. (2012) Cytotoxicity and genotoxicity of sewage effluent plant effluent in rainbow trout cells (RTG-2). Water Res., 46, 6351–6358.
17. Davoren, M., Ni Shuilleabhain, S., Hartl, M. G. J., Sheehan, D., O’Brien, N. M., O’Halloran, J., Van Belkt, F. N. and Mothersill, C. (2005) Assessing the potential of fish cell lines as tools for the cytotoxicity testing of estua-rine sediment aqueous extracts. Toxicol. In Vitro, 19, 421–431
18. Šrut, M., Traven, L., Štambuk, A., Kralj, S., Žaja, R., Mićović, V. and Klobučar, G. I. V. (2011) Genotoxicity of marine sediments in the fish hepatoma cell line PLHC-1 as assessed by Comet assay. Toxicol In Vitro, 25, 308–314.
19. Ternjej, I., Srček, V. G., Mihaljević, Z. and Kopjar, N. (2013) Cytotoxic and genotoxic effects of water and sediment samples from gypsum mining are in channel catfish ovary (CCO) cells. Ecotoxicol. Environ. Saf., 98, 119–127.
20. Boettcher, M., Grund, S., Keiter, S., Kosmehl, T., Reifferscheid, G., Seitz, N., Rocha, P. S., Hollert, H. and Braunbeck, T. (2010) Comparison of in vitro and in situ genotoxicity in the Danube River by means of the comet assay and the micronucleus test. Mutat. Res., 700, 11–17.
21. Kleinjans, J. C. S. and van Schooten, F. J. (2002) Ecogenotoxicity: the evolving field. Environ. Toxicol. Pharmacol., 11 (SI), 173–179.
22. Jha, A. N. (2008) Ecotoxicology applications and significance of the comet assay. Mutagenesis, 23, 207–221.
23. Odiete, W. O. (1999) Environmental Physiology of Animals and Pollution. Diversified Resources Ltd, Lagos, Nigeria.
24. Cundy, A. B., Croudace, I. W., Cearreta, A. and Irabien, M. J. (2003) Reconstructing historical trends in metal input in heavily-disturbed, con-taminated estuaries: studies from Bilbao, Southampton Water and Sicily. Appl. Geochem., 18, 311–325.
25. Singh, J., Hewawassam, H. and Moffat, D. (1995) Nigeria: Strategic Options for Redressing Industrial Pollution, Vol. 1. Industry and Energy Division, West Central Africa Department, West and Central Africa Dept. World Bank, Washington, DC.
26. Amaeze, N. H., Egonmwan, R. I, Jolaoso, A. F. and Otitoloju, A. A. (2012) Coastal environmental pollution and fish species diversity in Lagos Lagoon, Nigeria. Int. J. Environ. Protect., 2, 8–16.
27. Akpata, T. V. I. and Ekundayo, J. A. (1978) Faecal pollution of the Lagos lagoon. Niger. J. Sci., 12, 39–49.
28. Ajao, E. A. (1996) Review of the State of Pollution of the Lagos Lagoon. Technical Paper No. 106. Nigerian Institute of Oceanography and Mari-time Research (NIOMR).
29. Oyewo, E. O. (1998) Industrial sources and distribution of heavy metals in Lagos lagoon and their biological effects on estuarine animals. PhD Thesis. University of Lagos.
30. Otitoloju, A. A. and Don-Pedro, K. N. (2004) Integrated laboratory and field assessments of heavy metals accumulation in edible periwinkle, Tym-panotonus fuscatus var radula (L.). Ecotoxicol. Environ. Saf., 57, 354–362.
31. Otitoloju, A. A., Don-Pedro, K. N. and Oyewo, E. O. (2007) Assessment of potential ecological disruption based on heavy metal toxicity, accumu-lation and distribution in media of the Lagos lagoon. Afric. J. Ecol., 45, 454–463.
32. Ajagbe, F. E., Osibona, O. A. and Otitoloju, A. A. (2012) Diversity of the edible fishes of the Lagos Lagoon, Nigeria and the public health concerns based on their lead (Pb) content. Int. J. Fish. Aquacult., 2, 55–62.
33. Nubi, O. A., Ajao, E. A. and Nubi, A. T. (2008) Pollution assessment of the impact of coastal activities on Lagos Lagoon, Nigeria. Sci. World J., 3, 83–88.
34. Emmanuel, B. E. and Samuel, O. B. (2009) Comparative study of mercury accumulation in some water fishes in a tropical lagoon and its adjacent creek in south western Nigeria. Afric. J. Environ. Sci. Technol., 37, 180–185.
35. Osae-Addo, A. (1992) Nigeria: Industrial Pollution Control Program.
126 N. H. Amaeze et al., 2015, Vol. 30, No. 1
by guest on May 13, 2016
http://mutage.oxfordjournals.org/
Dow
nloaded from
36. Knott, N. A., Aulbury, J. P., Brown, T. H. and Johnston, E. L. (2009) Con-temporary ecological threats from historical pollution sources: impacts of large-scale resuspension of contaminated sediments on sessile invertebrate recruitment. J. Appl. Ecol., 46, 770–781.
37. Don-Pedro, K. N., Oyewo, E. O. and Otitoloju, A. A. (2004) Trend of heavy metal concentrations in Lagos lagoon ecosystem, Nigeria. West Afric. J. Ecol., 5, 103–114.
38. Traven, L., Žaja, R., Lončar, J., Smital, T. and Mićović, V. (2008) CYP1A induction potential and the concentration of priority pollutants in marine sediment samples—in vitro evaluation using PLHC-1 fish hepatoma cell line. Toxicol. In Vitro, 22, 1648–1656.
39. Yang, F., Zhang, Q., Guo, H. and Zhang, S. (2010) Evaluation of cyto-toxicity, genotoxicity and teratogenicity of marine sediments from Qing-dao coastal areas using in vitro fish cell assay, comet assay and zebrafish embryo test. Toxicol. In Vitro, 24, 2003–2011.
40. Menzel, R., Swain, S. C., Hoess, S., Claus, E., Menzel, S., Steinberg, C. E., Reifferscheid, G. and Stürzenbaum, S. R. (2009) Gene expression profiling to characterize sediment toxicity—a pilot study using Cae-norhabditis elegans whole genome microarrays. BMC Genomics, 10, 160.
41. Omogoriola, H. O., Williams, A. B., Ukaonu, S. C., Adegbile, O. M., Olakolu, F. C., Mbawuike, B. C., Akinnigbagbe, A. E. and Ajulo. A. A. (2012) Survey, biodiversity and impacts of economic activities on man-groves ecosystem in eastern part of Lagos Lagoon, Nigeria. Nat. Sci., 10, 30–34.
42. Bradshaw, C., Tjensvoll, I., Sköld, M., Allan, I. J., Molvaer, J., Magnusson, J., Naes, K. and Nilsson, H. C. (2012) Bottom trawling resuspends sedi-ment and releases bioavailable contaminants in a polluted Fjord. Environ. Pollut., 170, 232–241.
43. Eggleton, J. and Thomas, K. V. (2004) A review of factors affecting the release and bioavailability of contaminants during sediment disturbance events. Environ. Int., 30, 973–980.
44. Hedman, J. E., Tocca, J. S. and Gunnarsson, J. S. (2009) Remobilization of polychlorinated biphenyl from Baltic Sea sediment: comparing the roles of bioturbation and physical resuspension. Environ. Toxicol. Chem., 28, 2241–2249.
45. Hollert, H., Keiter, S., König, N., Rudolf, M., Ulrich, M. and Braunbeck, T. (2003) A new sediment contact assay to assess particle bound pollutants using zebrafish (Danio rerio) embryos. J. Solid Sediments, 3, 197–207.
46. Routledge, E. J. and Sumpter, J. P. (1997) Structural features of alkylphe-nolic chemicals associated with estrogenic activity. J. Biol. Chem., 272, 3280–3288.
47. Ames, B. N. (1983) Dietary carcinogens and anticarcinogens. Science, 221, 1256–1264.
48. Kamer, I. and Rinkevich, B. (2002) In vitro application of the comet assay for aquatic genotoxicity: considering a primary culture versus a cell line. Toxicol. In Vitro, 16, 177–184.
49. Schnell, S., Olivares, A., Piña, B., Echavarri-Erasun, B., Lacorte, S. and Porte, C. (2013) The combined use of the PLHC-1 cell line and the recom-binant yeast assay to assess the environmental quality of estuarine and coastal sediments. Mar. Pollut. Bull., 77, 282–289.
50. Dayeh, V. R., Schirmer, K., Lee, L. E. J. and Bols, N. C. (2003) The use of fish-derived cell lines for investigation of environmental contaminants. In Hodgson, E. (ed.), Current Protocols in Toxicology. Wiley, New York, pp. 1–17.
51. Bols. N. C., Dayeh, V. R., Lee, L. E. J. and Schirmer, K. (2005) Use of fish cell lines in the toxicology and ecotoxicology of fish. In Mommensen, T. P., Moon, T. W. (eds), Biochemistry and Molecular Biology of Fishes. Elsevier, B.V., Amsterdam, pp. 43–84.
52. Arlt, V. M., Cole, K. J. and Phillips, D. H. (2004) Activation of 3-nitroben-zanthrone and its metabolites to DNA-damaging species in human B lymphoblastoid MCL-5 cells. Mutagenesis, 19, 149–156.
53. Landvik, N. E., Arlt, V. M., Nagy, E. et al. (2010) 3-Nitrobenzanthrone and 3-aminobenzanthrone induce DNA damage and cell signaling in Hepa1c1c7 cells. Mutat. Res., 684, 11–23.
54. Kumaravel, T. S. and Jha, A. N. (2006) Reliable Comet assay measure-ments for detecting DNA damage induced by ionising radiation and chem-icals. Mutat. Res., 605, 7–16.
55. Sánchez-Avíla, J., Vicente, J., Eschavarri-Erasun, B., Porter, C., Tauler, R., Lacorte, S. (2013) Sources, fluxes and risk of organic micropollutants to the Cantabrian Sea (Spain). Mar. Pollut. Bull., 72, 119–132.
56. Bury, N. R., Schnell, S. and Hogstrand, C. (2014) Gill cell culture sys-tems as models for aquatic environmental monitoring. J. Exp. Biol., 217, 639–650.
57. Brinkmann, M., Blenkle, H., Salowsky, H., Bluhm, K., Schiwy, S., Tiehm, A. and Hollert, H. (2014) Genotoxicity of heterocyclic PAHs in the micro-nucleus assay with the fish liver cell line RTL-W1. PLoS One, 9, e85692.
58. Kosmehl, T., Krebs, F., Manz, W., Braunbeck, T. and Hollert, H. (2007) Differentiation between bioavailable and total hazard potential of sedi-ment-induced DNA fragmentation as measured by the comet assay with zebrafish embryos. J. Soils Sediments, 7, 377–387.
59. Vevers, W. F. and Jha, A. N. (2008) Genotoxic and cytotoxic potential of titanium dioxide (TiO2) nanoparticles on fish cells in vitro. Ecotoxicology, 17, 410–420.
60. Reeves, J. F., Davies, S. J., Dodd, N. J. F. and Jha, A. N. (2008) Hydroxyl radicals ((OH)-O-center dot) are associated with titanium dioxide (TiO2) nanoparticle-induced cytotoxicity and oxidative DNA damage in fish cells. Mutat. Res., 640, 113–122.
61. Azqueta, A., Arbillaga, L., López de Cerain, A. and Collins, A. (2013) Enhancing the sensitivity of the comet assay as a genotoxicity test, by com-bining it with bacterial repair enzyme FPG. Mutagenesis, 28, 271–277.
62. Creusot, N., Budzinski, H., Balaguer, P., Kinani, S., Porcher, J.-M., Aït-Aïssa, S. (2013) Effect-directed analysis of endocrine-disrupting com-pounds in multi-contaminated sediment: identification of novel ligands of estrogen and prename X receptors. Anal. Bioanal. Chem., 405, 2553–2566.
Appendix 1: The List of Polyaromatic Hydrocarbons, PCBs, Organochlorine and Organophosphate Pesticides Analysed for by the National Laboratory Service
1,2,3-Trichlorobenzene; 1,2,4-Trichlorobenzene; 1,3,5-Trichlorobenzene; 2,3,5,6-Tetrachloroaniline; 2,3,5,6-Tetrachlorothioanisole; Acenap-hthene; Acenaphthylene; Aldrin; Anthanthrene; Anthracene; Atrazine; Azinphos-ethyl; Azinphos-methyl; Bendiocarb; Benzo[b+k]fluoran-thene; Benz[a]anthracene; Benzo[a]pyrene; Benzo[b]fluoranthene; Benzo[e]yrene; Benzo[ghi]perylene; Benzo[k]fluoranthene; Bifenthrin; Carbophenothion; Chlordane-cis; Chlordane-trans; Chlorfenvinphos; Chlorpropham; Chlorpyrifos; Chlorpyrifos-ethyl; Chlorpyrifos-methyl; Chrysene; Coronene; Coumaphos; Cyanazine; Cyclopenta[cd]pyrene; Cyfluthrin; Cyhalothrin-Lambda; Cypermethrin; DDD-op; DDD-pp; DDE-op; DDE-pp; DDT-op + DDD pp; DDT-op; DDT-pp; Deltamethrin; Desethylatrazine; Desisopropylatrazine; Desmetryn; Diazinon; Dibenz[a,h]anthracene; Dichlobenil; Dichlorvos; Dieldrin; Dimethoate; Endosulfan A; Endosulfan B; Endrin; Ethion; Ethofumesate; Fenchlorphos; Fenitrothion; Fenthion; Fluoranthene; Fluorene; Fonofos; HCH-alpha; HCH-beta; HCH-delta; HCH-epsilon; HCH-gamma; Heptachlor; Heptachlor Epoxide-cis; Heptachlor Epoxide-trans; Heptachlor epoxide; Hexachlorobenzene; Hexachlorobutadiene; Indeno[1,2,3-cd] pyrene; Iodofenphos; Isodrin; Malathion; Metazachlor; Methoxychlor; Methyl Parathion; Mevinphos; Napropamide; Parathion-ethyl; Pendimethalin; Permethrin-cis; Permethrin-trans; Permethrin; Perylene; Phenanthrene; Pirimiphos-ethyl; Pirimiphos-methyl; Prometryn; Propachlor; Propazine; Propetamphos; Pyrene; Simazine; Tecnazene; Terbutryn; Triazophos; Trietazine; Trifluralin; Vinclozolin.
Cytotoxic and genotoxic responses of the RTgill-W1 fish cells, 2015, Vol. 30, No. 1 127
by guest on May 13, 2016
http://mutage.oxfordjournals.org/
Dow
nloaded from
Copyright © 2022 FDOKUMEN


![Anguilla anguilla L. Biochemical and Genotoxic Responses to Benzo[ a]pyrene](https://static.fdokumen.com/doc/165x107/631d4597f26ecf94330a787a/anguilla-anguilla-l-biochemical-and-genotoxic-responses-to-benzo-apyrene.jpg)


![W1 152> P1615=1 X28Y Z[ \28626 A 9]](https://static.fdokumen.com/doc/165x107/633679db29fb49e5aa0b3873/w1-152-p16151-x28y-z-28626-a-9.jpg)