Manh Ngoc Tran - SeS Home
257
The University of Sydney Installation of Suction Caissons in Dense Sand and the Influence of Silt and Cemented Layers By Manh Ngoc Tran B.E. (UNSW, First Class Honours) A thesis submitted for the degree of Doctor of Philosophy at The University of Sydney Department of Civil Engineering October 2005
-
Upload
khangminh22 -
Category
Documents
-
view
0 -
download
0
Transcript of Manh Ngoc Tran - SeS Home
The University of Sydney
Installation of Suction Caissons in Dense Sand and
the Influence of Silt and Cemented Layers
By
Manh Ngoc Tran
B.E.
(UNSW, First Class Honours)
A thesis submitted for the degree of Doctor of Philosophy
at
The University of Sydney
Department of Civil Engineering
October 2005

ii
Dedication
To my wife, Tường Vi, and my parents
i
Table of Contents
Synopsis vii
Preface ix
Acknowledgements xi
Chapter 1: Introduction
1.1 Overview ............................................................................................................... 1.1
1.2 Suction caissons: definition and terminology .................................................... 1.2
1.3 History of suction caissons .................................................................................. 1.3
1.3.1 History of field applications ....................................................................... 1.3
1.3.2 Advantages of suction caissons ................................................................. 1.4
1.3.3 Research history ......................................................................................... 1.6
1.4 Previous installation studies in sand ................................................................... 1.9
1.4.1 General mechanism of suction installation in sand .................................... 1.9
1.4.2 Review of previous installation in sand studies ....................................... 1.10
1.4.3 Remaining issues ..................................................................................... 1.16
1.5 Objectives of this study and thesis outline ....................................................... 1.17
Chapter 2: Test Apparatus and Experimental Procedures
2.1 Overview ............................................................................................................... 2.1
2.2 Merits and limitations of small-scale model testing .......................................... 2.2
2.3 Physical modelling in this study ......................................................................... 2.2
2.4 Normalisation of studied quantities ................................................................... 2.3
2.5 The PIV test development ................................................................................... 2.4
2.5.1 Background on PIV technique ................................................................... 2.4
2.5.2 Test apparatus and set-up ........................................................................... 2.5
ii
2.5.3 Test procedure ............................................................................................ 2.6
2.6 1g installation test development .......................................................................... 2.7
2.6.1 Test apparatus and set-up............................................................................ 2.7
2.6.2 Test procedure ............................................................................................ 2.9
2.6.3 Effect of movement on the differential pressure gauge reading ................ 2.9
2.7 Centrifuge installation test development .......................................................... 2.10
2.7.1 The geotechnical beam centrifuge and general scaling rules ................... 2.10
2.7.2 Test apparatus and set-up ......................................................................... 2.10
2.7.3 Test procedure .......................................................................................... 2.12
2.7.4 Effect of variations in centrifuge radial length ........................................ 2.13
2.7.5 Effect of relative model-soil size ............................................................. 2.14
2.8 Experimental programmes ............................................................................... 2.14
2.8.1 Seepage restriction due to test chamber boundaries ................................. 2.14
2.8.2 Experimental programmes ....................................................................... 2.15
Chapter 3: Soil Properties and Sample Preparation Techniques
3.1 Overview ............................................................................................................... 3.1
3.2 General soil description ....................................................................................... 3.2
3.3 Permeability test .................................................................................................. 3.3
3.3.1 Test description .......................................................................................... 3.3
3.3.2 Test results ................................................................................................. 3.3
3.4 Interface friction: direct shear test .................................................................... 3.4
3.4.1 Test description .......................................................................................... 3.4
3.4.2 Test results ................................................................................................. 3.5
3.5 Triaxial compression test ..................................................................................... 3.5
3.5.1 Test description .......................................................................................... 3.5
3.5.2 Test results ................................................................................................. 3.6
3.6 Cemented North Rankin calcareous sand .......................................................... 3.7
3.6.1 Preparation of cemented samples ............................................................... 3.7
3.6.2 Unconfined compressive strength .............................................................. 3.7
iii
3.7 Sample preparation techniques .......................................................................... 3.8
3.7.1 Homogenous sand ...................................................................................... 3.8
3.7.2 Layered sand-silt soil ............................................................................... 3.10
3.7.3 Layered uncemented-cemented soil ......................................................... 3.10
Chapter 4: Installation Behaviour at Normal Gravity (1g)
4.1 Overview ............................................................................................................... 4.1
4.2 Soil deformation investigation using PIV .......................................................... 4.2
4.2.1 Homogenous silica sand ............................................................................ 4.2
4.2.2 Layered sand-silt soil ................................................................................. 4.4
4.2.3 Summary .................................................................................................... 4.7
4.3 Installation in homogenous silica sand .............................................................. 4.9
4.3.1 Effect of pumping rate ............................................................................... 4.9
4.3.2 Effect of surcharge ................................................................................... 4.10
4.3.3 Effect of caisson geometry ....................................................................... 4.12
4.3.4 Effect of movement obstruction ............................................................... 4.13
4.3.5 Seepage flow behaviour ........................................................................... 4.13
4.3.6 Internal heave ........................................................................................... 4.15
4.3.7 Comparison with Oxford 1g test results .................................................. 4.17
4.3.8 Discussion ................................................................................................ 4.18
4.3.9 Summary .................................................................................................. 4.21
4.4 Installation in layered sand-silt soil .................................................................. 4.22
4.4.1 Layered soil with surface silt layer .......................................................... 4.22
4.4.2 Layered soil with silt layer below the surface ......................................... 4.23
4.4.3 Internal heave ........................................................................................... 4.25
4.4.4 Discussion ................................................................................................ 4.26
4.4.5 Summary .................................................................................................. 4.27
4.5 Conclusions ......................................................................................................... 4.27
iv
Chapter 5: Centrifuge Modelling: Installation Behaviour in
Homogenous Sand
5.1 Overview ............................................................................................................... 5.1
5.2 Installation in silica sand ..................................................................................... 5.2
5.2.1 Cone penetration tests ................................................................................ 5.2
5.2.2 Jacked installation and suction installation ................................................ 5.2
5.2.3 Effect of initial penetration depth and surcharge ....................................... 5.3
5.2.4 Effect of caisson geometry ......................................................................... 5.5
5.2.5 Seepage flow behaviour ............................................................................. 5.7
5.2.6 Internal heave and plug loosening ............................................................. 5.8
5.2.7 Comparison with previous 1g results ....................................................... 5.10
5.3 Installation in calcareous sand (uncemented) .................................................. 5.11
5.3.1 Cone penetration tests .............................................................................. 5.11
5.3.2 Jacked installation and suction installation .............................................. 5.11
5.3.3 Effect of initial penetration depth and surcharge ..................................... 5.12
5.3.4 Effect of caisson geometry ....................................................................... 5.13
5.3.5 Seepage flow, internal heave and plug loosening .................................... 5.13
5.4 Installation in mixed sand-silt soils ................................................................... 5.14
5.4.1 Cone penetration tests .............................................................................. 5.14
5.4.2 Installation results .................................................................................... 5.15
5.5 Discussion and comparison of installation results ........................................... 5.16
5.5.1 Discussion of the obtained results ............................................................ 5.16
5.5.2 Comparison of the general suction pressure trends ................................. 5.19
5.5.2 Comparison with current suction pressure prediction methods ............... 5.21
5.6 Summary and conclusions ................................................................................ 5.22
Chapter 6: Centrifuge Modelling: Installation Behaviour in
Layered Soils
6.1 Overview ............................................................................................................... 6.1
6.2 Installation in layered sand-silt soil .................................................................... 6.2

v
6.2.1 Cone penetration tests ................................................................................ 6.2
6.2.2 Layered soil with surface silt layer ............................................................ 6.2
6.2.3 Layered soil with silt layers below the surface .......................................... 6.5
6.2.4 Internal heave ............................................................................................. 6.7
6.2.5 Comparison with 1g results ....................................................................... 6.8
6.2.6 Summary .................................................................................................... 6.9
6.3 Installation in layered uncemented-cemented calcareous sand ..................... 6.10
6.3.1 Cone penetration tests .............................................................................. 6.10
6.3.2 Results ...................................................................................................... 6.11
6.3.3 Summary .................................................................................................. 6.14
6.4 Conclusions ......................................................................................................... 6.14
Chapter 7: Numerical Investigation of Suction Installation
Behaviour
7.1 Overview ............................................................................................................... 7.1
7.2 Numerical simulation approach ......................................................................... 7.2
7.2.1 Model description ...................................................................................... 7.2
7.2.2 Validation with measured data ................................................................... 7.3
7.2.3 Limitations of the modelling approach ...................................................... 7.4
7.3 Modelling of sand loosening ................................................................................ 7.5
7.3.1 Simulation of the PIV results ..................................................................... 7.5
7.3.2 Estimation of plug loosening in silica sand ............................................... 7.6
7.4 Modelling of installation in homogenous sand .................................................. 7.8
7.4.1 Review of the general suction pressure trend ............................................. 7.8
7.4.2 Development of hydraulic gradient along the caisson wall ....................... 7.8
7.4.3 Comparison with other installations ........................................................ 7.10
7.5 Modelling of installation in layered sand-silt soil ........................................... 7.11
7.6 Summary and conclusions ................................................................................ 7.13

vi
Chapter 8: Conclusions
8.1 Summary .............................................................................................................. 8.1
8.2 Installation in homogeneous dense sand ............................................................ 8.2
8.3 Installation in layered soils ................................................................................. 8.4
8.3.1 Installation in layered sand-silt soil ............................................................ 8.4
8.3.2 Installation in layered uncemented-cemented soil ..................................... 8.5
8.4 Recommendations and suggestions for further research.................................. 8.6
References
Tables
Figures
vii
Synopsis
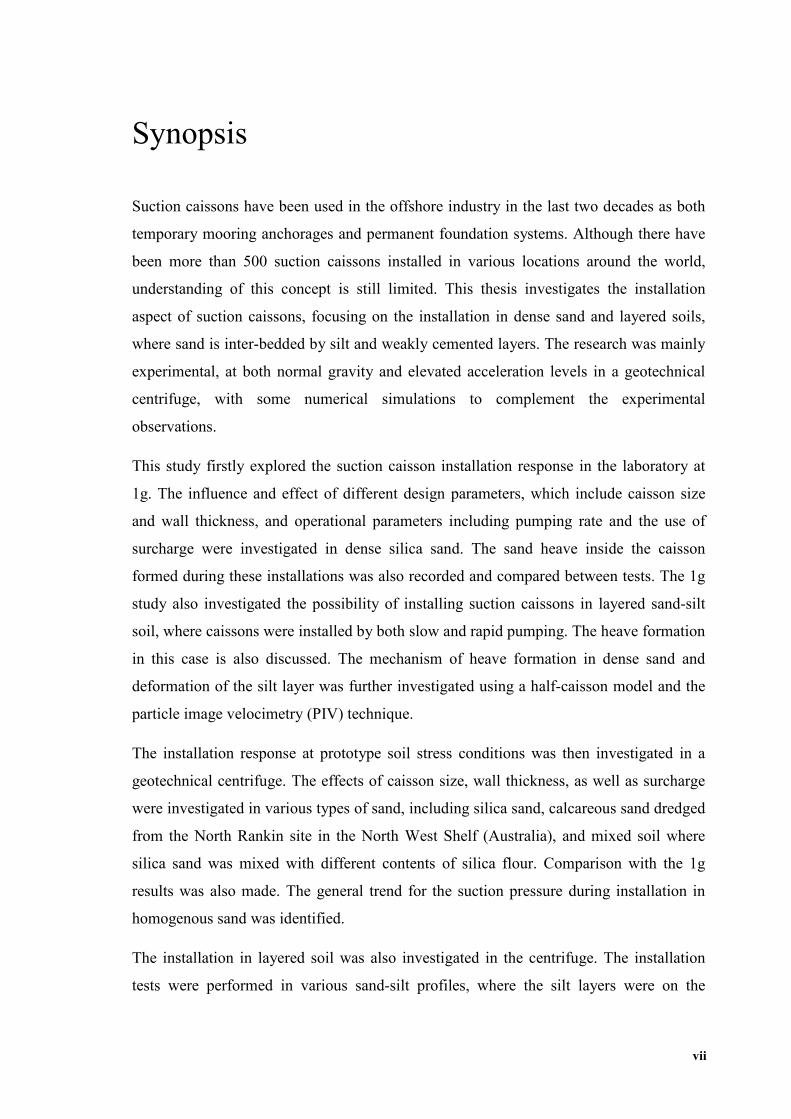
Suction caissons have been used in the offshore industry in the last two decades as both
temporary mooring anchorages and permanent foundation systems. Although there have
been more than 500 suction caissons installed in various locations around the world,
understanding of this concept is still limited. This thesis investigates the installation
aspect of suction caissons, focusing on the installation in dense sand and layered soils,
where sand is inter-bedded by silt and weakly cemented layers. The research was mainly
experimental, at both normal gravity and elevated acceleration levels in a geotechnical
centrifuge, with some numerical simulations to complement the experimental
observations.
This study firstly explored the suction caisson installation response in the laboratory at
1g. The influence and effect of different design parameters, which include caisson size
and wall thickness, and operational parameters including pumping rate and the use of
surcharge were investigated in dense silica sand. The sand heave inside the caisson
formed during these installations was also recorded and compared between tests. The 1g
study also investigated the possibility of installing suction caissons in layered sand-silt
soil, where caissons were installed by both slow and rapid pumping. The heave formation
in this case is also discussed. The mechanism of heave formation in dense sand and
deformation of the silt layer was further investigated using a half-caisson model and the
particle image velocimetry (PIV) technique.
The installation response at prototype soil stress conditions was then investigated in a
geotechnical centrifuge. The effects of caisson size, wall thickness, as well as surcharge
were investigated in various types of sand, including silica sand, calcareous sand dredged
from the North Rankin site in the North West Shelf (Australia), and mixed soil where
silica sand was mixed with different contents of silica flour. Comparison with the 1g
results was also made. The general trend for the suction pressure during installation in
homogenous sand was identified.
The installation in layered soil was also investigated in the centrifuge. The installation
tests were performed in various sand-silt profiles, where the silt layers were on the
viii
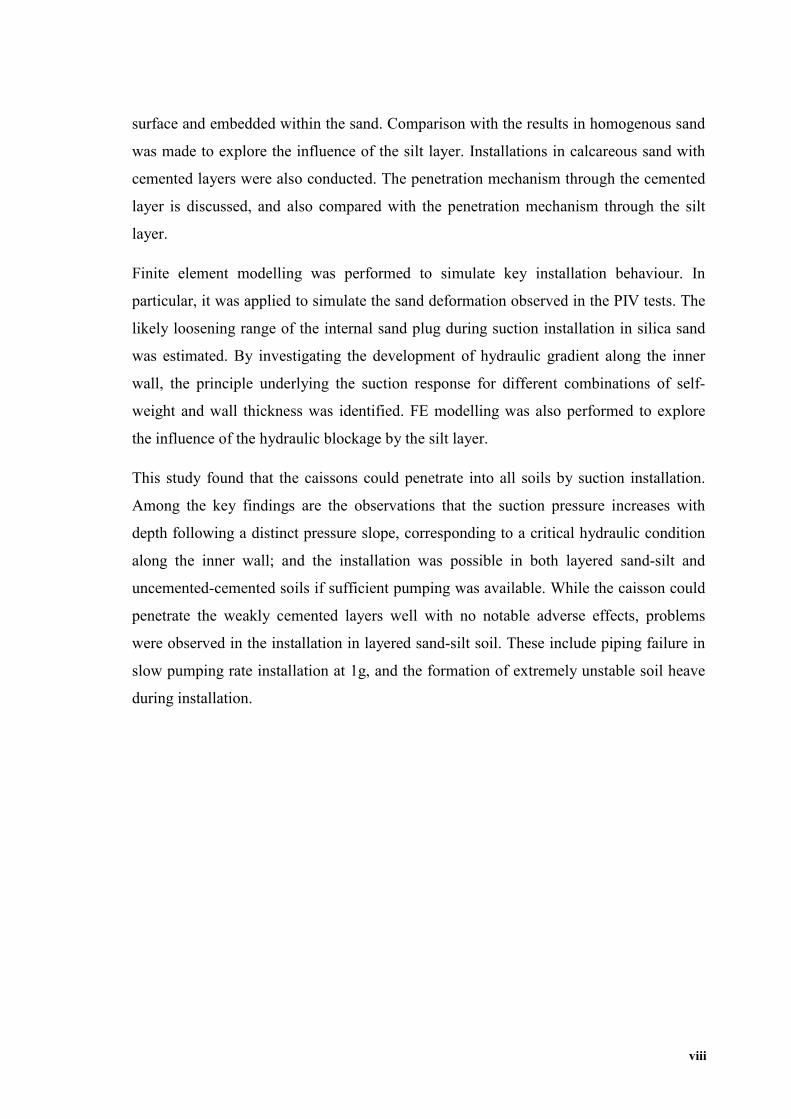
surface and embedded within the sand. Comparison with the results in homogenous sand
was made to explore the influence of the silt layer. Installations in calcareous sand with
cemented layers were also conducted. The penetration mechanism through the cemented
layer is discussed, and also compared with the penetration mechanism through the silt
layer.
Finite element modelling was performed to simulate key installation behaviour. In
particular, it was applied to simulate the sand deformation observed in the PIV tests. The
likely loosening range of the internal sand plug during suction installation in silica sand
was estimated. By investigating the development of hydraulic gradient along the inner
wall, the principle underlying the suction response for different combinations of self-
weight and wall thickness was identified. FE modelling was also performed to explore
the influence of the hydraulic blockage by the silt layer.
This study found that the caissons could penetrate into all soils by suction installation.
Among the key findings are the observations that the suction pressure increases with
depth following a distinct pressure slope, corresponding to a critical hydraulic condition
along the inner wall; and the installation was possible in both layered sand-silt and
uncemented-cemented soils if sufficient pumping was available. While the caisson could
penetrate the weakly cemented layers well with no notable adverse effects, problems
were observed in the installation in layered sand-silt soil. These include piping failure in
slow pumping rate installation at 1g, and the formation of extremely unstable soil heave
during installation.
ix
Preface
The candidate conducted the work reported in this thesis from March 2003 to October
2005. All the experimental work was conducted at the Centre for Offshore Foundation
Systems (COFS), the University of Western Australia, with the exception of some
suction installation tests at normal gravity, which were conducted at the University of
Oxford, UK. The test analyses were conducted in both COFS and the Department of
Civil Engineering at the University of Sydney, Australia. The candidate was supervised
by Professor Mark Randolph and Associate Professor David Airey.
The By-Laws of the University of Sydney require that the original sections of a thesis
submitted for the degree of Doctor of Philosophy be indicated. In accordance with the
By-Laws, information obtained from other sources has been appropriately acknowledged
and referenced in the text. The author claims originality for the following work:
� In Chapter 2: the design and development of all the test apparatus for both the
PIV tests and the suction installation experiments, including the 1g models
and the centrifuge models.
� In Chapter 3: all the soil tests reported, and the sample preparation techniques for
layered sand-silt soil, and layered uncemented-cemented sand.
� In Chapter 4: all the PIV tests, and the suction installation tests in both
homogenous sand and layered sand-silt soil, as well as interpretation of the
experimental data that are not explicitly acknowledged.
� In Chapter 5: all the centrifuge suction installation tests in homogenous silica
sand, in homogenous calcareous sand and in mixed soils, and interpretation
of the data.
� In Chapter 6: all the centrifuge suction installation tests in layered sand-silt soil,
and layered uncemented-cemented soils, and all the interpretations of the
experimental data.
� In Chapter 7: all the numerical analyses conducted for the PIV tests and the
suction installation tests; the simulation of the suction installation trend, and

x
the identification of the principles underlying the suction pressure trend in
homogenous sand; the simulation of suction installation in layered sand-silt
soil.
During the period of candidature, the author prepared several papers for publication.
They are listed as follows:
1. Tran, M.N., Randolph, M.F. and Airey, D.W. (2005). “Installation of suction
caissons in sand with silt layers”. Submitted to ASCE Journal of
Geotechnical and Geoenvironmental Engineering.
2. Tran, M.N. and Randolph, M.F. (2005). “Variation of suction pressure during
caisson installation in sand”. Submitted to Géotechnique.
3. Tran, M.N., Randolph, M.F. and Airey, D.W. (2005). “Study of sand heave
formation in suction caissons using particle image velocimetry (PIV)”, Proc.
International Symposium on Frontiers in Offshore Geotechnics - ISFOG,
Perth, Australia, 259-265.
4. Tran, M.N., Randolph, M.F. and Airey, D.W. (2005). “Study of seepage flow and
plug loosening in installation of suction caissons in sand”, Proc. 15th
International Offshore and Polar Engineering Conference - ISOPE, Seoul,
Korea, 2, 516-521.
5. Tran, M.N., Randolph, M.F. and Airey, D.W. (2004). “Experimental study of
suction installation of caissons in dense sand”, Proc. 23rd International
Conference on Offshore Mechanics and Artic Engineering - OMAE,
Vancouver, Canada. Paper: OMAE2004-51076.

xi
Acknowledgements
This research would not have been possible without the help and contribution of the
many individuals and organisations to whom I would like to express my thanks.
Firstly, I would like to thank my supervisors, Professor Mark Randolph and Associate
Professor David Airey, for their support and guidance during the research. To Mark, I
would like to express my sincerest thank for not only providing me with the opportunity
to work on this project, but also always being patient, understanding and kind to me
throughout the years. His insightful criticisms and advice have always been of great
value to me. Mark cared not only about my research, but also about my future, and that
is some thing that I will not forget. Very special thanks to David, who has always been
kind, supportive, and never seemed to be short of valuable comments and suggestions
(guarantee at least one full page for every submitted paper). It has been a pleasure and an
advantage to work with both of them, from whom I have learned so much. My sincere
thanks to them.
My research was funded by the International Postgraduate Research Scholarship and the
International Postgraduate Award, provided by the University of Sydney. Additional
financial support was provided by the Centre for Offshore Foundation Systems (COFS).
These are gratefully acknowledged.
I would like to thank Professor John Carter and Professor Martin Fahey for their help
during the initial stage of my candidature. I would also like to thank Dr David White for
providing the GeoPIV software, and kindly hosting me (with nice lunch sandwiches)
during my visit to Cambridge. I am extremely appreciative for the collaborative research
experience at the University of Oxford, which would not have been possible without the
support from Professor Guy Houlsby. I thank him for providing me with this
opportunity, and his helpful discussions during my time at Oxford. Dr Byron Byrne’s
help with the test set-up at Oxford is gratefully acknowledged.
Back at COFS, I would like to thank Ms Monica Mackman for her help with the
administrative matters throughout the years. Also thanks to the COFS technicians for

xii
their excellent support during my research. I am particularly grateful to UWA workshop
technician Mr John Bagrie, who has patiently listened to my lengthy explanation, and
tried so hard to work on my design. I wish him an enjoyable retirement in his Albany
home. I am also thankful to UWA electronics technician Mr John Breen. He has always
been of great help, and at times even stayed back long after 5 just to fix my broken
transducers. I am very grateful to him. The appreciation is also extended to Mr Don
Herley, Mr Bart Thompson, Mr Wayne Galbraith, Mr Binaya Bhattarai, Ms Claire
Bearman, Dr Wenge Liu, and other workshop personnel and electronics technicians.
Also many thanks to my UWA and USyd friends for enjoying discussions not only about
work, but also life and the world, which have made my postgraduate time memorable and
pleasant.
Finally but most importantly, I want to express my deepest gratitude to my wife, Vi, and
my family. Vi has always been there for me during the ups and downs, sharing my
excitement and frustration, listening patiently to my endless (and boring) stories about
my research. Her love and understanding have allowed me to make it this far. I am
deeply grateful to her. To my parents, brothers and sister, their continuing encouragement
and support have been a great source of inspiration. Especially to my parents, without
their unbounded love and care, I would not have been the person I am today. I am forever
indebted to them.
Manh Ngoc Tran
October 2005
MANH NGOC TRAN 1.1
Chapter One
Chapter 1
Introduction
1.1 Overview
Suction caissons have become increasingly popular in the offshore industry, especially
over the last decade. This chapter aims to provide a basic understanding of suction
caissons by firstly giving a general introduction to this concept. It then looks through the
history of their practical uses in the field and the potential for future applications. The
chapter discusses the advantages and benefits of suction caissons, and explains the
reasons behind their popularity, and also justifies why research is needed. The final parts
of this chapter give a general review of what studies have been conducted on suction
caissons, and later reveal the need for the research that is the focus of this thesis. In this
study, the research reviews and aims will be addressed by examining the following key
questions:
� What is a suction caisson ?
� Why are suction caissons used ?
� When can suction caissons be used ?
� How should suction caissons be used ?
The next sections in this chapter will address the first two questions, and part of the third.
The rest of this thesis will explore the latter two, focusing on installation in homogenous
and layered sandy soils.
Chapter 1: Introduction
MANH NGOC TRAN 1.2
1.2 Suction caissons: definition and terminology
Suction caissons are also known under a number of different names (Tjelta, 2001), such
as suction piles, suction cans, suction anchors, bucket foundations etc. Despite the name
differences, they all share the same installation principle, which will be described below.
In this thesis, the term “suction caisson” will be used. A suction caisson is a hollow
circular tube closed by a lid at the upper end. Literally, it resembles an upturned can. The
caisson lid can be a stiffened flat plate, or a dome. The maximum wall length to diameter
ratio is smaller than in a pipe pile, normally less than 10. Wall thickness to diameter ratio
is also smaller, generally in the range of 0.3% - 0.6%. In long caissons, stiffeners are
often added along the internal perimeter (ring stiffeners) or longitudinally to prevent
them from buckling during installation. Stiffeners are common in suction caissons in
clay, where the maximum wall length to diameter ratio can be as high as 9 (Tjelta, 2001),
but generally less common in caissons in sand due to a much lower ratio, often smaller
than 1. Illustrations of typical suction caissons can be seen in Figure 1.1.
Suction caissons are installed to the desired depth by first allowing them to penetrate into
soil under their self-weight. Then water is pumped out of the caisson interior, which
creates a net pressure difference across the lid that “sucks” (penetrates) the caisson into
soil to the targeted depth (which also explains the “suction caisson” name). There are a
number of terms associated with suction caissons and the installation process that will be
used frequently in this study. To avoid confusion, these terms are defined below, and will
imply these meanings throughout this thesis (these are further illustrated in Figure 1.2):
� Suction pressure, or differential pressure: the net pressure difference across the
caisson lid, created as a result of pumping water out of the caisson compartment.
� Maximum wall length: the length of the caisson wall measured from the lower lid
surface (i.e. the lid face inside the caisson) to the wall tip.
� Aspect ratio: ratio between maximum wall length to the caisson internal
diameter.
� Pumping rate: total flow rate at which water is pumped out of the caisson
interior.
� Sand heave (plug): the difference between the soil surface level inside the caisson
compartment and that of the surrounding soil outside the caisson.
Chapter 1: Introduction
MANH NGOC TRAN 1.3
1.3 History of suction caissons
1.3.1 History of field applications
Although suction caissons are still viewed as a relatively new concept in the offshore
industry, their first use as a type of anchorage and foundation system dated back to the
late 1950s. Since then, there have been numerous field applications of suction caissons
around the world. To limit this section to manageable length, only milestone applications
will be discussed.
Among the earliest reported use of this concept is probably the portable core sampler
device by Mackereth (1958). The equipment was used to core samples in a lake bottom,
where the sampling tube was lowered to the soil surface, and held in place during coring
by a small (0.45 m diameter, 1.2 m long) suction embedded caisson. It was later retrieved
by supplying compressed air into the compartment. In 1972, Shell developed a self-
operating unit to conduct cone tests in the North Sea, where a suction caisson was used to
resist the cone penetration force, and retrieved by reverse pumping, i.e. pumping water
into the caisson interior (North Sea report, 1972). The similarity between these early uses
of suction caissons is that they were both used as temporary anchorages to operate other
soil testing equipment, and were invented because of difficulties in operating
conventional devices in deep water. In 1980, suction caissons were first used
commercially at large scale in the Gorm field, North Sea (Senpere and Auvergne, 1982).
A total of 12 suction caissons, 3.5 m in diameter and 8.5 m to 9 m long, were installed
and used for anchoring mooring buoys. The first field observations of installation
problems, where excessive sand heave formed inside the caisson, were also recorded in
this project.
The year 1989 saw the first time the suction concept was applied to a permanent
foundation system in the Gullfaks C gravity platform (Tjelta et al., 1990). The foundation
wall was able to penetrate to the final depth of 22 m with the assistance of suction
pressure, created by pumping water out of the concrete cells. It was also observed that
most of the platform submerged weight was carried by the wall tip and the wall skin
friction. This observation, together with the successful suction-assisted installation of this
very large gravity platform (a similar structure is illustrated in Figure 1.3a) created
Chapter 1: Introduction
MANH NGOC TRAN 1.4
significant confidence in the concept, and led to further application for the Snorre
Tension Leg Platform (TLP) (Fines et al., 1991; Stove et al., 1992; Dyvik et al., 1993),
and later the Draupner E (previously Europipe 16/11E) and Sleipner T platforms (Bye et
al., 1995; Tjelta, 1995), all in the North Sea. It is worth noting here that the Draupner E
and Sleipner T plaforms (Figure 1.3b) marked the first time that suction caissons alone
were used as a permanent foundation in sand. They also demonstrated that with the use
of suction, wall penetration in very dense sand was possible.
The success of the above projects has led to a rapid increase in the use of suction caissons
in the offshore industry over the past decade. It is estimated that at present, there have
been nearly 500 suction caissons installed in more than 50 locations around the world
(Andersen et al., 2005a). This number may still be modest compared with traditional
piled foundations, but it is a significant increase from the limited field applications prior
to the early 1990s. Today, suction caissons are used virtually in all five continents
(Europe, Africa, Asia, America, Australia), in water depths varying from shallow water
(20-40 m) to ultra deep (over 1000 m). Evolved from the original anchorage intention,
they are now used in different soil types for numerous purposes, from mooring
anchorages to permanent foundations for platforms, support for ship salvage, means to
deploy other anchorage systems such as the Suction Embedded Plate Anchors (SEPLA)
etc. They have also been considered for military use (Bang et al., 1999), and as
foundation systems for future offshore wind turbines (Feld et al., 1999; Houlsby and
Byrne, 2000; Feld, 2001). The way suction caissons are put together in operation also
varies, from a single unit as in most cases, to single units with multiple compartments
(Masui et al., 2001) and cluster units, i.e. many caissons put together as a unit, such as
those in the Hanze project (Aas et al., 2002; Sparrevik, 2002) shown in Figure 1.4.
Significant projects using suction caissons and their references are listed in Table 1.1.
The rapid increase in field applications for a wide range of water depths over the last
decade, compiled from nearly 50 different projects, can be seen in Figure 1.5.
1.3.2 Advantages of suction caissons
The rapid increase in field applications discussed above is a direct indication of the many
advantages of suction caissons over traditional methods. A significant advantage of

Chapter 1: Introduction
MANH NGOC TRAN 1.5
suction caissons is cost effectiveness, which is perhaps the most important factor in their
consideration for offshore use (Tjelta, 2001; Bussemaker, 2005). This cost includes
geotechnical investigation cost, steel and fabrication cost, and installation cost. The use
of suction caissons does not appear to change the site investigation cost (Feld et al., 1999;
Feld, 2001), and normally loses out to traditional piling in fabrication expense despite
using less steel in most cases (Bussemaker, 2005). This is due to tight roundness
tolerances, and extensive welding in caisson fabrication, which requires expensive
welding materials and involves high labour costs. However, the suction installation
process is often so cost effective that it offsets the greater fabrication costs and reduces
the overall project expense to such an extent that suction caissons are a cost competitive
option (Bussemaker, 2005). This significant installation saving is possible because of the
use of simple installation equipment, much shorter installation times, normally within 24
hours compared with several days for a platform installation, and no requirement for
expensive large crane barges because the structures can be “self-installed”, as illustrated
conceptually in Figure 1.6. In deep and ultra deep water, suction caissons become even
more cost effective over traditional piling, where costly hammer modifications are
required to extend their operational limit to greater depths (Colliat, 2002). It is worth
noting here that the cost of installing the Draupner E platform suction caissons was
similar to that of conventional pile alternatives, but this was largely because of the lack
of previous experience, complicated and expensive monitoring systems, and the use of
large crane barges (Rusaas et al., 1995).
The mobility and flexibility of suction caissons when in use are additional reasons for
their attractiveness. They can be retrieved simply by reverse pumping for re-use, or
during installation if obstructions such as boulders are encountered. This was one of the
reasons that they were selected as the foundation choice in the Gorm field (Senpere and
Auvergne, 1982). In some cases, the rapid installation and retrieval time, normally of just
a few hours, and the flexibility during operation make them superior to other methods.
An example is the Kursk submarine salvage project in the Barents sea, where suction
caissons, used as supporting points for the sawing line, could be easily raised and
lowered in soil to adjust this line during the hull cutting (Figure 1.7). The same operation
would have been far more complicated if fixed anchoring systems, such as conventional
piles, had been used (Bussemaker, 2005).
Chapter 1: Introduction
MANH NGOC TRAN 1.6
The ability to position the caissons to high accuracy, together with no embedment
uncertainties also make suction caissons advantageous in congested seabeds, compared
with, say, drag anchors (Andersen and Jostad, 1999; Tjelta, 2001). In these cases,
interaction with other existing systems can be avoided, hence limiting potential damage
to other structures. They also create less disturbance of the seabed, thus minimising the
impact on the marine environment (i.e. being more environmentally friendly).
The discussion above has demonstrated the potential of suction caissons to provide a
versatile anchoring system, which may soon see them gaining a larger share in the
offshore foundation market (Riemers, 2005). However, future use and development of
suction caissons will depend on the outcome of assessments of the performance of
current installations and research to address some of the uncertainties still existing. These
uncertainties and research being conducted to address them are considered in the next
sections.
1.3.3 Research history
Planning and better design of suction caissons for field applications would not have been
possible without the knowledge gained from research. To date, there have been many
studies on various aspects of suction caissons in both clay and sand. This section will go
through the history of research into suction caissons, highlighting key studies and
findings.
In the early 1960s, Goodman et al. (1961), in a feasibility study that included perhaps
some of the earliest published research results on suction caissons, proposed the wider
use of the “vacuum” concept for marine anchoring purposes. During that time, it was
common practice to use gravity anchors because their holding capacity could be easily
calculated (Brown and Nacci, 1971). However, these soon showed their disadvantages.
The low pullout force to weight ratio often meant large and heavy anchors were required,
making them difficult to handle, inefficient and ineffective. To improve the anchorage
capacity, systems that allowed for more soil-structure interaction needed to be developed.
Although the “vacuum” anchor is a simple concept, it appears to be a brilliant idea as a
foundation system. By allowing the conventional footing block (the caisson lid in this
case) to extend some depth into soil to promote more soil-structure interaction, while at
Chapter 1: Introduction
MANH NGOC TRAN 1.7
the same time making use of the “vacuum” effect using a sealed lid, this system promised
improvement in holding capacity. Goodman et al.’s study was motivated by the military
demand for anchorage systems that allow for high mobility and rapid field deployment.
In their research, which focused on holding capacity, vertical pullout tests in various
types of soil with different moisture contents were conducted using transparent “vacuum
cups” (suction caissons). The key observations were that the system worked very well in
clayey soils. However, in more permeable soil such as sand, localised piping occurred,
causing the loss of vacuum, or fluidisation resulting in increased soil permeability.
Following these initial results, there have been a number of other studies to investigate
the behaviour of suction caissons in soil. Brown and Nacci (1971) explored the caisson
pullout performance in granular soil, and reported high force to weight ratio and a conical
failure surface. Wang et al. (1975, 1977) investigated the holding capacity in a wider
range of soils, including sand, silt and clay, and developed a breakout capacity equation
using Mohr-Coulomb failure theory. They also suggested that suction caissons could be
particularly useful for short-term anchorages, and had potential in many other
applications. A similar study was conducted for caissons in sand by Helfrich et al.
(1976), which showed that a Mohr-Coulomb criterion could predict failure loads to
within 13% of the measured values. The required caisson size in a field application was
also predicted by extrapolating their model test data. Wilson and Sohota (1980), Sohota
and Wilson (1982) presented studies using modified suction anchors, which were
installed by water jetting, and buried at some depth below the surface.
Most research work during this early period was focused on simple monotonic pullout
(short-term), with little investigation and discussion of the installation process, and the
caisson long-term behaviour under cyclic loading. Since the late 1980s, research work on
suction caissons has increased significantly. Apart from continuing studies on monotonic
breakout capacity (e.g. Steensen-Bach, 1992), initial investigations on the caisson cyclic
behaviour (Larsen, 1989) and computer modelling (Christensen and Haahr, 1992) were
also conducted. This increase is due to the recognition of their potential, and thus
increasing interest from the offshore industry, coupled with advances in technology,
especially computer technology, that has allowed more sophisticated modelling.
Chapter 1: Introduction
MANH NGOC TRAN 1.8
Recently, especially over the past few years, caisson studies have been reported in much
greater number and detail. They have ranged from numerical modelling to physical
testing at normal gravity (1g) and at elevated gravity levels in geotechnical centrifuges.
These studies may be divided into two main groups based on their research focus:
installation related studies and in-place capacity and performance studies. For the latter,
behaviour under both monotonic and cyclic loading has been considered. The soil types
considered by the studies were diverse, including sand (Byrne, 2000; Iskander et al.
2002; Byrne and Houlsby, 2002; Byrne and Houlsby, 2004), clay (Fuglsang and Stensen-
Bach, 1991; Andersen and Jostad, 1999; House, 2002; Iskander et al. 2002; Clukey et al.,
2004), layered sand-clay (Allersma et al., 2001a), and calcareous soils (Watson and
Randolph, 1997; Randolph et al., 1998; Watson, 1999). Along with experimental
modelling, numerical studies of suction caissons have also been reported (Deng and
Carter, 2000; Zdravkovic et al., 2001; Cao et al., 2002; Deng and Carter, 2002;
Supachawarote et al., 2004). In addition to small-scaled model testing and computer
modelling, research on this innovative foundation concept was also conducted through
large scale field trials. These included systematic field tests of suction caissons from as
early as the 1970s (Hogervorst, 1980) until recently (Stevenson, 2003; Fakharian and
Rismanchian, 2004). It may be noted that research activities into suction caissons have
mostly been conducted in the last decade, and are related to the rapid increase in field
applications noted previously in Figure 1.5.
An important consideration when using suction caissons is the ability to install them
successfully into the soil. Understanding of the installation process is also important, as
the suction and other effects in the soil can affect the subsequent caisson performance. At
present, there have been a number of research studies to investigate caisson installation in
both clay and sand. Among different installation studies in clay were the investigations of
limiting caisson aspect ratio to prevent plug upheaval (House et al., 1999), variations in
soil stress along the caisson wall and set-up effects (Rauch et al., 2003; Andersen et al.
2004; Masui et al., 2004; Chen and Randolph, 2004), penetration and upheaval in soft
clay (El-Gharbawy et al., 1999; Andersen et al., 2005b), and penetration prediction
(Andersen and Jostad, 1999; Houlsby and Byrne, 2005a). Generally speaking, the
installation in clay is fairly straightforward without notable problems, as long as the
Chapter 1: Introduction
MANH NGOC TRAN 1.9
caisson aspect ratio is smaller than the limit at which soil plug failure (i.e. where the
internal clay plug is pulled up by the suction) may occur.
In sand the installation is, however, more complex due to the seepage flow in the soil,
which may create excessive sand heave inside the caisson and piping failure. This was
observed in the caisson installation in the Gorm field (Senpere and Auvergne, 1982). In
this project, although the caissons were finally installed to the desired depth, excessive
sand heave was observed inside the caissons during penetration in sand, which had to be
removed by water jetting before the caissons could reach the intended embedment level.
This experience created a subsequent negative impact on suction caisson use in the field
(Tjelta, 2001). There have been a few subsequent research attempts to explore caisson
installation behaviour in sand, but the number is still rather modest, and many field data
are not available in the public domain. Hence, understanding is still limited, and more
research is required to investigate the associated issues. These are discussed in greater
detail in the next section.
1.4 Previous installation studies in sand
1.4.1 General mechanism of suction installation in sand
The general caisson installation mechanism in sand has been widely known and reported
in previous studies (e.g. Hogervorst, 1980; Tjelta, 1995; Erbrich and Tjelta, 1999), and is
summarised in this section. The mechanism is also illustrated schematically here in
Figure 1.8. In suction installation in granular materials, such as sands which have high
permeabilities, the suction pressure, while helps install the caisson by means of the
differential force, also induces seepage flow through the soil around the caisson tip into
the caisson interior. Depending on the flow direction (Figure 1.8), the seepage can have
different impacts on the soil. On the external caisson wall, the downward seepage
gradient resulting from the suction application leads to an increase in effective stress in
the soil, and hence the external skin friction. On the other hand, the upward flow gradient
inside the caisson reduces the soil effective stress at the caisson tip and along the inner
wall, thus reducing the tip resistance and internal skin friction. This reduction, especially
of the tip resistance, is normally large enough to easily offset the increased friction due to
Chapter 1: Introduction
MANH NGOC TRAN 1.10
the external downward flow, resulting in significant reduction in total driving force (the
penetration force degradation effect) which assists the installation. However, the upward
seepage can also create some sand loosening (reduced density) inside the caisson, leading
to the creation of internal sand heave, thus preventing the caisson penetrating to the
intended depth. The excessive heave observed in the Gorm field installation (Senpere &
Auvergne, 1982) mentioned above is a good example. Furthermore, sand liquefaction, or
“quick sand”, may occur, leading to the formation of piping channels and the loss of the
hydraulic seal in the soil. In this case, further pumping will create excessive water flow
into the caisson compartment without any notable penetration (installation failure).
1.4.2 Review of previous installation in sand studies
Various research programs investigating installation in sand have been reported by a
number of researchers around the world. Hogervorst (1980) described a series of field
installation tests of small suction caissons in a shallow lake in 1976. The promising
results from these initial tests led to more trials of larger caisson sizes (3.8 m diameter, 5
to 10 m long) in the following two years. The study found that small obstacles and
caisson tilting did not significantly affect the installation. It was observed that the sand
plug inside the caisson could become liquefied, hence reducing the internal skin friction.
A significant reduction in penetration resistance due to groundwater flow was recorded.
This was also observed in a large scale penetration test of an instrumented concrete
panel, which was attached in the middle of two 6.5 m diameter suction caissons, and
pushed into the soil by suction-installing these two caissons (Tjelta et al., 1986).
Although the general mechanism of suction caisson installation in sand was identified
and described in these early studies, no actual installation data were presented. The
influence of caisson geometry, surcharge, as well as the heave formation for different
installation conditions were not discussed.
Iskander et al. (1993) and Iskander et al. (2002) reported a 1g test program in sand, where
3 pressure transducers were fitted inside the caisson (along the wall) at different heights.
The installations were conducted using both least possible suction to cause penetration,
and full available suction. The tests found that although the penetration force (or suction
pressure) was lower in the installation with least possible suction than in the maximum
Chapter 1: Introduction
MANH NGOC TRAN 1.11
suction case, the measured pore pressures inside the caisson during penetration were very
similar for the two cases. They both indicated that a quick condition (liquefaction) in the
sand inside the caisson occurred, which was also reflected in the unavoidable formation
of excess sand heave and the reduction of suction penetration force compared with
jacking (nearly one order of magnitude smaller). These results agree well with the field
observations reported by Hogervorst (1980) and Tjelta et al. (1986) presented previously,
and experimental results in earlier 1g tests by Larsen (1989). While Iskander et al.’s
study could further support the observed mechanism of suction caisson installation in
sand with some pore pressure measurements, the published data in this study were
however still limited, with little information provided on the suction pressures for
different installations. The effect of the key factors such as caisson geometry and
surcharge on the suction installation behaviour (e.g. penetration resistance force, sand
heave etc) was again not reported.
Tjelta (1995), Erbrich and Tjelta (1999) described a test series using a highly
instrumented caisson model undertaken by the Norwegian Geotechnical Institute (NGI)
as part of the preparation program for the Draupner E and Sleipner T platform
installations. It was found that suction pressure could be applied at very shallow initial
wall embedment depth, and piping failure was hard to induce if the caisson was free to
move, even when the caisson was slightly tilted. This result is consistent with the
previous field observation by Hogervorst (1980). However, these studies also showed
that if the caisson was restrained, piping channels would form, but the caisson could
always continue to penetrate once the restraining force was removed. The effect of
surcharge (i.e. increase in dead weight) was investigated, and found to reduce the
required suction pressure to install the caisson. Sand heave, averaging at about 4% of the
penetrated wall depth, was recorded in the tests. A “safety mechanism”, where the
hydraulic gradient in the internal sand plug tends to drop due to sand loosening, was also
discussed. In this study, installation data for several cases including measurements of
suction pressures and pore pressures were presented. However, since only one caisson
geometry was tested, the influence of absolute caisson size and wall thickness on the
installation process and sand heave formation was still not known. Furthermore, the
effect of different pumping rates was not discussed.
Chapter 1: Introduction
MANH NGOC TRAN 1.12
Installations in sand at 1g were also investigated by Bang et al. (1999) and Cho et al.
(2002), who used minimum suction to penetrate the caissons. The studies found that plug
loosening and sand heave were formed during penetration despite the use of minimum
suction, which is similar to results from the studies discussed above. To quantify the
reduction in frictional capacity due to sand loosening, the study introduced a “mobilised
effective soil friction angle ratio” α, defined as follows:
'tan
'tan
φφ
α m= (1.1)
where φ’m = the mobilised effective soil friction angle required for the
equilibrium between the external force and the caisson bearing
capacity (the first being measured from the experiments; the latter
being calculated using conventional pile design for end bearing and
skin friction);
φ’ = the full available effective soil friction angle.
The study later proposed an empirical relationship between this α ratio and the
normalised “equivalent external pressure” X (or suction pressure), which was defined as:
mpb
bs
L
D
L
A
Fp
Xγ
+= (1.2)
where ps = applied suction pressure;
Fb = submerged weight of the caisson;
A = area of the internal plug;
γb = soil buoyant unit weight;
D = caisson diameter;
Lp = wall embedment depth;
Lm = maximum wall embedment depth, at which further penetration by
suction is not possible and causes piping failure.
However, the reliability of the α-X relationship is debatable due to the normalisation
against uncertain quantities such as the maximum penetrated wall depth Lm.
Chapter 1: Introduction
MANH NGOC TRAN 1.13
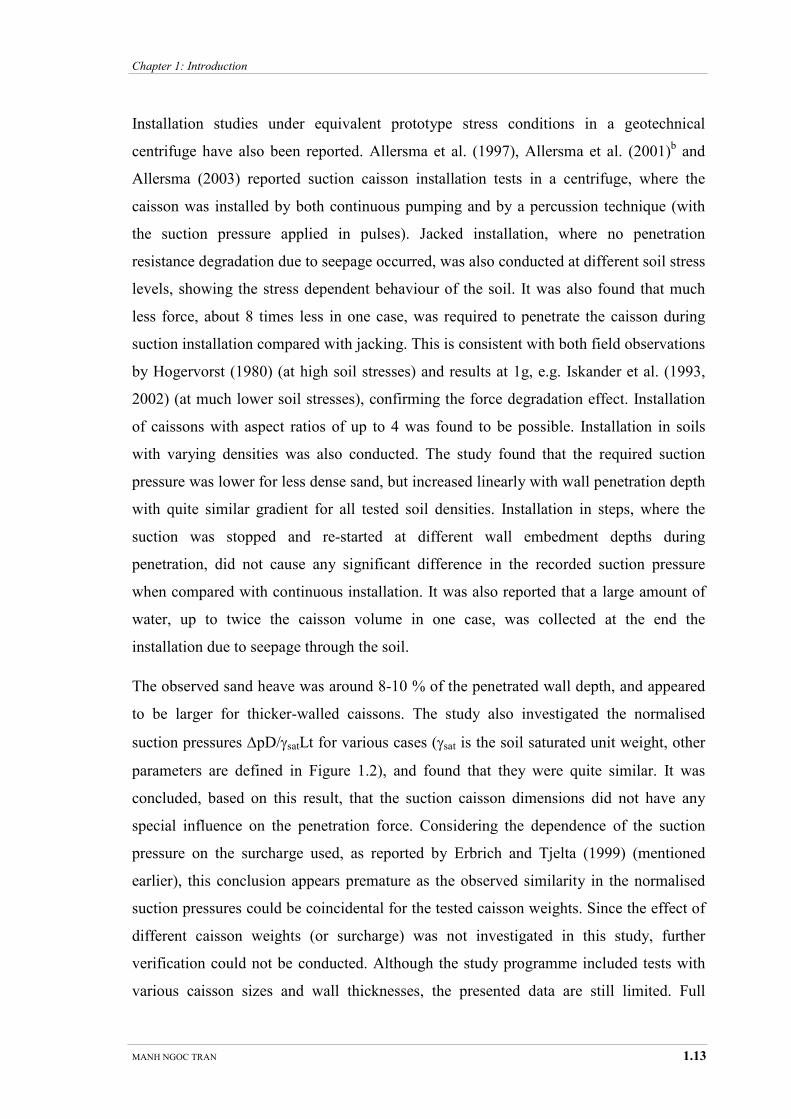
Installation studies under equivalent prototype stress conditions in a geotechnical
centrifuge have also been reported. Allersma et al. (1997), Allersma et al. (2001)b and
Allersma (2003) reported suction caisson installation tests in a centrifuge, where the
caisson was installed by both continuous pumping and by a percussion technique (with
the suction pressure applied in pulses). Jacked installation, where no penetration
resistance degradation due to seepage occurred, was also conducted at different soil stress
levels, showing the stress dependent behaviour of the soil. It was also found that much
less force, about 8 times less in one case, was required to penetrate the caisson during
suction installation compared with jacking. This is consistent with both field observations
by Hogervorst (1980) (at high soil stresses) and results at 1g, e.g. Iskander et al. (1993,
2002) (at much lower soil stresses), confirming the force degradation effect. Installation
of caissons with aspect ratios of up to 4 was found to be possible. Installation in soils
with varying densities was also conducted. The study found that the required suction
pressure was lower for less dense sand, but increased linearly with wall penetration depth
with quite similar gradient for all tested soil densities. Installation in steps, where the
suction was stopped and re-started at different wall embedment depths during
penetration, did not cause any significant difference in the recorded suction pressure
when compared with continuous installation. It was also reported that a large amount of
water, up to twice the caisson volume in one case, was collected at the end the
installation due to seepage through the soil.
The observed sand heave was around 8-10 % of the penetrated wall depth, and appeared
to be larger for thicker-walled caissons. The study also investigated the normalised
suction pressures ∆pD/γsatLt for various cases (γsat is the soil saturated unit weight, other
parameters are defined in Figure 1.2), and found that they were quite similar. It was
concluded, based on this result, that the suction caisson dimensions did not have any
special influence on the penetration force. Considering the dependence of the suction
pressure on the surcharge used, as reported by Erbrich and Tjelta (1999) (mentioned
earlier), this conclusion appears premature as the observed similarity in the normalised
suction pressures could be coincidental for the tested caisson weights. Since the effect of
different caisson weights (or surcharge) was not investigated in this study, further
verification could not be conducted. Although the study programme included tests with
various caisson sizes and wall thicknesses, the presented data are still limited. Full
Chapter 1: Introduction
MANH NGOC TRAN 1.14
suction data (e.g. suction pressure against penetration depth) were only available for one
caisson geometry. Also, no direct comparison of the suction pressure response with other
test results, such as those at 1g, was made, hence the parameters influencing the generic
caisson responses could not be fully determined from this study.
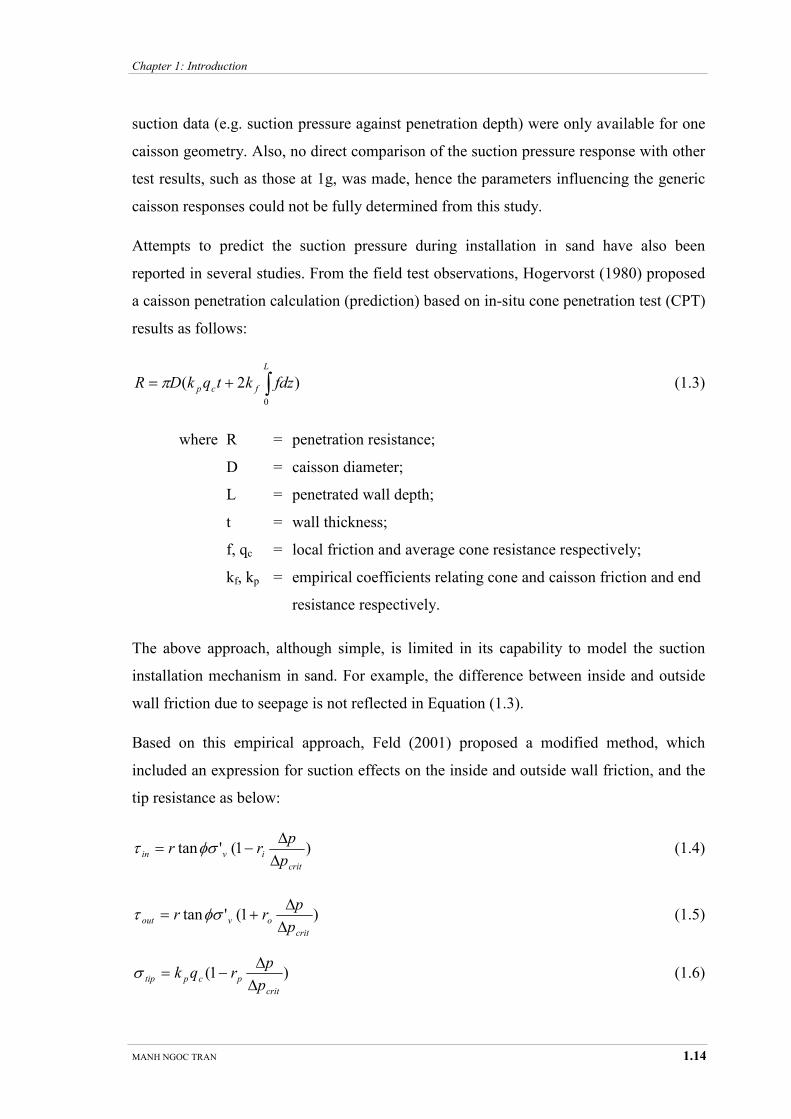
Attempts to predict the suction pressure during installation in sand have also been
reported in several studies. From the field test observations, Hogervorst (1980) proposed
a caisson penetration calculation (prediction) based on in-situ cone penetration test (CPT)
results as follows:
)2(0
∫+=L
fcp fdzktqkDR π (1.3)
where R = penetration resistance;
D = caisson diameter;
L = penetrated wall depth;
t = wall thickness;
f, qc = local friction and average cone resistance respectively;
kf, kp = empirical coefficients relating cone and caisson friction and end
resistance respectively.
The above approach, although simple, is limited in its capability to model the suction
installation mechanism in sand. For example, the difference between inside and outside
wall friction due to seepage is not reflected in Equation (1.3).
Based on this empirical approach, Feld (2001) proposed a modified method, which
included an expression for suction effects on the inside and outside wall friction, and the
tip resistance as below:
)1('tancrit
ivinp
prr∆
∆−= φστ (1.4)
)1('tancrit
ovoutp
prr∆
∆+= φστ (1.5)
)1(crit
pcptipp
prqk∆
∆−=σ (1.6)
Chapter 1: Introduction
MANH NGOC TRAN 1.15
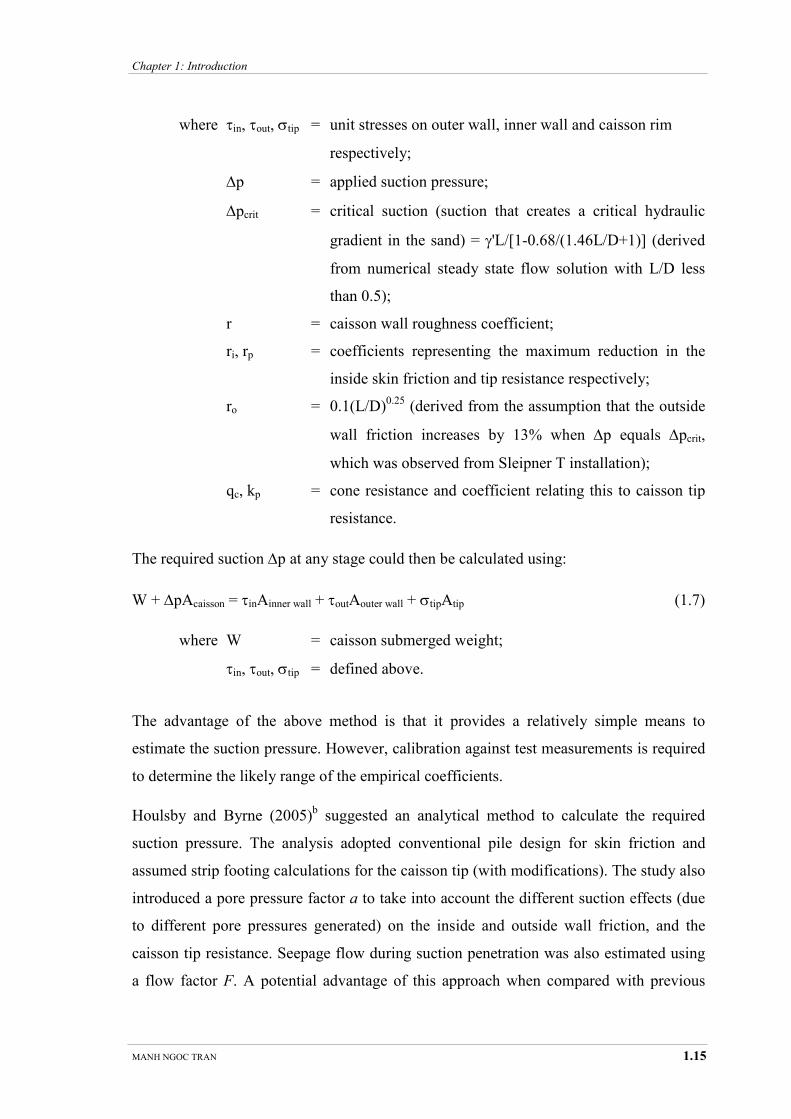
where τin, τout, σtip = unit stresses on outer wall, inner wall and caisson rim
respectively;
∆p = applied suction pressure;
∆pcrit = critical suction (suction that creates a critical hydraulic
gradient in the sand) = γ'L/[1-0.68/(1.46L/D+1)] (derived
from numerical steady state flow solution with L/D less
than 0.5);
r = caisson wall roughness coefficient;
ri, rp = coefficients representing the maximum reduction in the
inside skin friction and tip resistance respectively;
ro = 0.1(L/D)0.25
(derived from the assumption that the outside
wall friction increases by 13% when ∆p equals ∆pcrit,
which was observed from Sleipner T installation);
qc, kp = cone resistance and coefficient relating this to caisson tip
resistance.
The required suction ∆p at any stage could then be calculated using:
W + ∆pAcaisson = τinAinner wall + τoutAouter wall + σtipAtip (1.7)
where W = caisson submerged weight;
τin, τout, σtip = defined above.
The advantage of the above method is that it provides a relatively simple means to
estimate the suction pressure. However, calibration against test measurements is required
to determine the likely range of the empirical coefficients.
Houlsby and Byrne (2005)b suggested an analytical method to calculate the required
suction pressure. The analysis adopted conventional pile design for skin friction and
assumed strip footing calculations for the caisson tip (with modifications). The study also
introduced a pore pressure factor a to take into account the different suction effects (due
to different pore pressures generated) on the inside and outside wall friction, and the
caisson tip resistance. Seepage flow during suction penetration was also estimated using
a flow factor F. A potential advantage of this approach when compared with previous
Chapter 1: Introduction
MANH NGOC TRAN 1.16
methods is that it does not require cone penetration test results to calculate the suction
pressure. However, some key factors used in the analysis (e.g. the pore pressure factor a,
the flow factor F) were derived from theoretical analyses, and may need further
validation with experimental results. Care should also be taken when choosing the ratio
of the permeability of the loosened sand plug inside the caisson kin and that of the outside
sand kout (i.e. the kin/kout ratio, of which both factors a and F are a function), because the
actual permeability range corresponding to minimum and maximum void ratio in some
(non-liquefied) sands may be quite small.
A summary of the research on suction caisson installation in sand is shown in Table 1.2.
Although the review of these research studies has been presented above, discussion of the
published data available from some of the above studies is delayed until the main part of
this thesis. These data will be introduced and compared where applicable to supplement
the results of the present research and to help draw conclusions from the work.
1.4.3 Remaining issues
While the general installation mechanism was well recognised in the above studies, there
are still many issues remaining to be resolved to fully understand the suction installation
in sand. The effects of variation in pumping rate, which is perhaps the only controllable
parameter during installation, have not been thoroughly studied in previous research. The
influence of the caisson geometry, including sizes and wall thickness, on suction pressure
and other installation behaviour is still not clearly understood. Also, it is known that
seepage flow plays a very important role in installation in sand, but it has so far not been
adequately addressed. Few seepage measurements have been reported, hence the seepage
trend during wall penetration is not known. Another important aspect is the mechanism
of sand heave formation inside the caisson and its development during the wall
penetration. Whether the heave formed is caused by sand expansion, displaced sand
volume by the caisson wall, or the inflow of the surrounding sand under the influence of
the inwards seepage is not understood, and has not been fully investigated.
It is not uncommon to have layered soil conditions in the field, where sand is inter-
bedded with bands of silt, or layers of cemented sand. These are of particular concern
because they may obstruct the caisson installation. In layered sand-silt, the much less
Chapter 1: Introduction
MANH NGOC TRAN 1.17
permeable silt layers can block the seepage flow, hence may eliminate the beneficial
penetration force degradation effect (discussed above in Section 1.4.1). The seepage
blockage may not be as complete as the case for clay, since silt is still subjected to
scouring, i.e. erosion of silt particles (these particles may also flow into and through the
sand if the silt layer is overlain by the sand). This, as a result, may allow some seepage
flow to pass through. However, substantially larger tip resistances are expected in silt
than in clay, and this means higher driving pressures may be required to penetrate the
caisson. This high pressure, combined with the possibility of scouring could lead to
piping failure. Furthermore, under the influence of suction, a net differential force may
be created across the silt layer due to its low permeability. This may cause the uplift of
the silt layer, similar to the plug upheaval observed in clay, which as a result obstructs
further penetration and creates plug instability. In sand where weakly cemented layers are
present, the concern is mainly whether the caisson wall will “punch through” these
layers. Until now, there have been no reported studies to investigate suction installation
in these soils.
The above issues, together with the limited installation data in the literature for sand, and
the confidentiality of most field installations, were the motivation for the research
described in this thesis.
1.5 Objectives of this study and thesis outline
This study has investigated suction caisson installation in sand through the experimental
programmes at both 1g and in a geotechnical centrifuge. Numerical studies were also
conducted to simulate the test results. The objectives have been to extend the current
experimental database, which is small and limited, and hence to provide better
understanding of various aspects of the installation, including the effects of changing
pumping rate, the influence of caisson geometry and surcharge on the suction pressure
and other installation behaviour, and the likely sand heave formation mechanism. It also
aimed to identify the principles underlying the suction response in homogenous sand, and
to increase understanding of installation in layered soil, by providing some knowledge of
how silt and cemented layers can influence the installation behaviour.
Chapter 1: Introduction
MANH NGOC TRAN 1.18
This thesis is organised into 8 chapters. A brief description of each chapter is outlined as
follows:
� Chapter 2: summaries the test apparatus developed for the installation study, and
the experimental procedures for both 1g and centrifuge tests. It also includes a
discussion of the merits and limitations of small-scale model testing. The
physical modelling approach of this research is also presented.
� Chapter 3: describes the properties of the different soils used in the suction
installation tests. Details of various soil laboratory tests, and preparation of
cemented sand are presented. Different sample preparation techniques are
discussed for both homogenous and layered sands.
� Chapter 4: discusses the installation results for small-scale model tests at normal
gravity (1g). These include a study of internal heave and soil deformation
using the Particle Image Velocimetry (PIV) technique. Suction installation
results in both homogenous silica sand and layered sand-silt profiles are also
presented. The significance of these 1g results is discussed.
� Chapter 5: presents the caisson installation behaviour in homogenous sand for
both silica and calcareous (uncemented) sands in the centrifuge. Installations
in “artificially” mixed soil, where different proportions of silica flour were
mixed with sand, are presented. The results are compared with other
installations, including field data. The general suction pressure trends in sand
are also identified.
� Chapter 6: presents the results from centrifuge installations in layered sand-silt,
and layered cemented-uncemented calcareous soil. Comparisons are made
with the 1g results. Comparisons with installation in homogenous soils are
also made to explore the influence of the silt and cemented layers. Installation
issues in these heterogenous soils are identified.
� Chapter 7: presents numerical investigations of the suction installation process. A
numerical model is proposed and validated against experimental data. It is
then used to simulate the PIV results, as well as predict the likely sand
response during suction installation. The suction pressure trend in
Chapter 1: Introduction
MANH NGOC TRAN 1.19
homogenous sand is investigated, and the principles behind this trend are
identified. Simulation results in layered sand-silt are also presented.
� Chapter 8: summarises the significant findings of this research. Suggestions and
recommendation for further research are discussed.
MANH NGOC TRAN 2.1
Chapter Two
Chapter 2
Test Apparatus and Experimental
Procedures
2.1 Overview
This chapter describes all the experiment-related developments in this research. It starts
first by discussing the merits of conducting physical modelling, as well as some
limitations of small-scale testing. This is followed by the introduction of the physical
modelling proposed for this study, which includes 3 different test programmes.
Normalisation of the quantities investigated in this study is discussed. The chapter then
describes the test equipment and caisson models used in the research. These include
models for the suction installation experiments at both normal gravity (1g) and elevated
levels in a geotechnical centrifuge. For the latter, the general scaling rule and the effects
of variation in radial length and relative sand-caisson size are discussed. A half-caisson
model used to study the mechanism of sand deformation inside the caisson under the
influence of suction is also described. The later part of this chapter describes the
experimental procedure for each test programme. The theoretical seepage restriction due
to the test chamber boundaries is discussed. Details of all the tests conducted in this
research, including suction installation at 1g, at elevated g-levels in the centrifuge, and
the half-caisson model test, are then presented.

Chapter 2: Test apparatus and experimental procedures
MANH NGOC TRAN 2.2
2.2 Merits and limitations of small-scale model testing
Soil-structure interaction can be best investigated by conducting similar scale field tests.
However, in most cases, especially where the tested structure is very large, it is
practically difficult to do so. This is because of the high cost involved, and also the
potential danger to human life (e.g. simulation of a slope failure). In the context of
suction caisson installation studies, field installation tests can become very expensive due
to high offshore operation costs, and hence are not financially viable in most cases.
The above issues can be accommodated by conducting small-scale model tests. They are
not only considerably cheaper, but also more flexible, which allows changes in test
conditions to be made easily. As a result, this allows more thorough investigation of the
response of the structure at a much lower cost. However, a significant challenge of small-
scale model testing is how to extrapolate the results for prototype cases. The differences
in a number of aspects such as the soil stress and the relative soil-structure size can create
variations in soil-structure interaction and response, and hence often invalidate simple
extrapolation of the 1g data to large-scale cases. However, small-scale model tests can
reveal the general trend of the response of the structure under a specific condition. In
other words, they are useful in providing information on generic behaviour that can be
expected in the prototype structure. This, when incorporated with other field data and
numerical investigations, can be used to establish a design framework, which is also the
aim of the small-scale model testing presented in this thesis.
2.3 Physical modelling in this study
Physical modelling of the suction caisson installation using small-scale models can be
conducted at both 1g and in a centrifuge. Each of the test series, i.e. 1g or centrifuge
tests, has its benefits and disadvantages. For the 1g tests, their flexibility provides more
control of the experiments, allowing better investigation of many parameters such as the
pumping rate during penetration, or observation of internal sand heave developed during
the test. However, the soil stress in these 1g tests is much smaller than that in the field.
The centrifuge tests, on the other hand, achieved higher soil stress levels similar to those
in the field. However, with the current centrifuge set-up (presented later in this chapter),

Chapter 2: Test apparatus and experimental procedures
MANH NGOC TRAN 2.3
less control over the tests compared with 1g was available, making them less flexible. As
a result, the tests in this study were conducted at both 1g and in the centrifuge. The
purpose was that by investigating the installation under both conditions, the
disadvantages of each test series could be negated by the other. Hence, understanding of
the caisson response under different conditions is maximised.
In this research, the suction caisson installation was investigated in 3 different test
programmes:
� a half-caisson model test at 1g using the Particle Image Velocimetry (PIV)
technique;
� suction installation tests at 1g;
� suction installation tests in the centrifuge.
Details of the apparatus and experimental programmes for the above the tests will be
presented in the later sections of this chapter.
2.4 Normalisation of studied quantities
In the presentation of test results, normalisation of the measured quantities is generally
adopted to enable simple allowance for the effects of differences in these parameters, and
to reduce the number of variables involved. This was discussed in detail by Butterfield
(1999).
In this thesis, the suction pressure has been normalised using a combination of the
following group of parameters: the caisson penetrated wall depth L, the caisson diameter
D, and the soil submerged unit weight γ'. The suction pressure against the penetrated wall
depth relationship can be presented in a normalised form as either p/γ'D or p/γ'L against
L/D. Figure 2.1 shows a typical suction recorded during a centrifuge installation and the
normalised results. Figure 2.1a shows the data as recorded from the test in equivalent
prototype units, Figure 2.1b shows the pressure normalised as p/γ'D, and Figure 2.1c
shows the pressure normalised as p/γ'L. It can be seen that normalisation as p/γ'D not
only incorporates the importance of the overall foundation size on the resulting p, but
also retains the original suction pressure trend. This normalisation will hence be used in
Chapter 2: Test apparatus and experimental procedures
MANH NGOC TRAN 2.4
this thesis for the presentation of the suction results in the installation tests. The added
surcharge amount will also be discussed using the same normalisation, i.e. ∆p/γ'D, to
allow comparisons between different cases. However, normalisation as p/γ'L will be
presented in this thesis when discussing matters relating to the hydraulic gradients
developed in the sand, as the flow path is more related to L than to D.
There is also a need for normalisation of the seepage flow rate Qseepage. The same
absolute seepage can mean different groundwater flow conditions for caissons of
different geometry. Furthermore, Qseepage is directly influenced by the suction pressure
head applied H (or p/γw), and the soil permeability, especially permeability of the internal
soil plug kplug as this tends to change during suction installation. In order to take into
account these two components, whilst still being able to reflect the effect of different
caisson sizes, the seepage flow results Qseepage will be normalised against the caisson
diameter D, the plug permeability kplug and suction head H (i.e. Q/kplugHD). Similarly, the
total pumping rate will also be normalised to allow for comparisons of different
installations. The same absolute pumping rate Qpump can create different penetration rate
and seepage effects when applied to caissons of different geometry. For slow installation,
Qpump comprises a very significant amount of seepage flow Qseepage, which is highly
influenced by soil permeability k. In order to take into account the effect of different
caisson sizes, whilst still being able to reflect the seepage component, Qpump results will
be normalised against the caisson internal cross sectional area A, and permeability k.
Normalised seepage and pumping rate will be shown later in this thesis.
2.5 The PIV test development
2.5.1 Background on PIV technique
Particle Image Velocimetry (PIV) technique is a non-intrusive, image-based technique,
originally used in fluid mechanics to track the movement of objects. Details about the
PIV technique and its application in geotechnics were described by White et al. (2003).
In this study, the PIV technique was applied to study how the heave occurs inside the
caisson, and the soil deformation pattern under the influence of suction. For each test,
Chapter 2: Test apparatus and experimental procedures
MANH NGOC TRAN 2.5
soil movement was captured by a digital camera and subsequently analysed using
GeoPIV software, developed at Cambridge University Engineering Department, UK
(White & Take, 2002).
Although offering high resolution measurements, there are a number of factors that can
affect and reduce the performance in tests using PIV. These are caused by the PIV
analysis itself and by optical effects that cause image distortion, including non-
coplanarity of the CCD and object planes, camera lens distortion, and refraction through
viewing windows (White et al., 2003). It is therefore important to evaluate the accuracy
of deduced movements in each experimental set-up. In theory, with the current
equipment and the parameters used in subsequent PIV analyses, as described in detail in
the following section, a precision better than 1/100000th of the field of view (FOV) could
be easily reached. Noting that a typical FOV was around 150 mm, this corresponds to an
error of less than 1.5 µm.
2.5.2 Test apparatus and set-up
A half-caisson model, as shown in Figure 2.2, was developed to investigate the formation
of sand heave during the application of pumping. The caisson was 100 mm in both
diameter D and wall length L, and had a wall thickness t of 1.2 mm. A continuous rubber
seal (cut ‘O-ring’), 1 mm in diameter, was fitted along the caisson wall and top to prevent
leakage during pumping. A water evacuation valve, which was left open during pushed-
in penetration, was also available. It may be noted that the model caisson has a wall
thickness-to-diameter ratio t/D of 1.2%, which is higher than typical prototype values of
around 0.3%-0.5%. However this was necessary because the 1.2 mm thickness was the
smallest width that allowed the rubber seal (the cut ‘O-ring’) to be fitted on.
Tests were conducted in a chamber of 370 × 220 × 400 mm (width × thickness × height).
A transparent Perspex window was fitted in the front face to allow observations to be
made. The sample depth was 200 mm and water depth was 170 mm. The caisson was
held in place by a guide system, consisting of 3 arms with wheels. Each arm could
independently move inward and outward in the radial direction. Details can be seen in
Figure 2.3.
Chapter 2: Test apparatus and experimental procedures
MANH NGOC TRAN 2.6
The caisson was connected to a hose to allow water to be pumped out. Flow was
achieved using the water head difference between the test chamber and the hose outlet,
with the mass recorded continuously using an electronic balance. Taking the water
density as 1 g/cm3, the water volume in cm
3 could be evaluated from the weight in
grams, and hence the flow rate determined.
Differential pressure was measured using a differential pressure gauge. Since it could not
be submerged, pressure was measured by connecting the gauge to 2 soft plastic tubes.
With one tube embedded inside the caisson, and the other positioned on the caisson top,
the differential pressure could be measured.
During each test, sand movement was captured by close-range photography using a 4-
megapixel (2272 × 1704) digital still camera. It was set up at 0.3-0.5 m from the test
chamber’s Perspex window. Consecutive images were recorded at the rate of around 2
frames/second. The time between frames was determined from a watch (measuring down
to 1/100th of a second) positioned in front of the Perspex window. To capture the fast
movement of the soil skeleton, the camera shutter speed was set at 1/150th of a second.
Since the flash was disabled to prevent reflection from the test chamber window,
additional lighting was provided using a halogen light. Changes in lighting condition
between frames can affect the result in from the PIV analyses. Using a halogen light
helped avoid this as it gave constant lighting.
During the photo-taking period, continuous pressing of the camera “start” button was
required. At the same time, no camera movement was allowed. To perform the task, an
automatic device was developed. Details of this device, as well as the test set-up can be
seen in Figure 2.4.
The PIV investigation presented here is limited to fixed tests, where the half-caisson was
restrained from movement. The tests were, however, conducted at different wall
embedment. The philosophy behind these PIV tests, and the application of these results
to continuous suction caisson installations will be discussed in Chapter 4.
2.5.3 Test procedure
All tests followed the procedure given below:
Chapter 2: Test apparatus and experimental procedures
MANH NGOC TRAN 2.7
a) The soil sample was prepared and the surface was levelled.
b) The half-caisson model was slowly pushed to penetrate to the desired embedment
depth, with the evacuation valve left open.
c) The valve was then closed. Guide arms were adjusted to press the caisson against
the Perspex window, hence locking it in place. Care was taken not to apply
excessive force as it could result in caisson deformation.
d) The camera and light were then set up to capture the zone of interest. The camera
was then started, followed by the application of pumping by opening the butterfly
valve.
It was observed that immediately after commencing pumping, the suction quickly
increased to a peak, and soil deformations were recorded, but with no immediate sign of
piping channel formation. However, if pumping was maintained (for ~4-6 seconds), a
piping channel was seen to form, which was also evident from a rapid drop in suction,
and led to localised piping failure. If continuous caisson installation may be considered
as a series of discrete movements (self-balancing between the driving force and soil
resistance), the incremental sand heave that occurs at any given wall embedment depth
can be represented in this restrained test by results taken immediately after starting
pumping, i.e. when first sand movements were recorded.
PIV analyses were hence conducted on the results taken immediately after pumping,
using a patch size of 40 × 40 pixels. In real object-space, this was roughly equivalent to
2.5 × 2.5 mm. The centre-to-centre distance of the patches varied from 20 to 40 pixels
depending on the detail required.
2.6 1g installation test development
2.6.1 Test apparatus and set-up
Figure 2.5 shows a schematic diagram of the test apparatus used. It consists of a
cylindrical soil chamber 400 mm in diameter and 420 mm high, filled with sand to a
depth of 220 mm. The caisson model was positioned in the middle of the chamber, and
could move freely in the vertical direction via a guide system. This comprised a straight
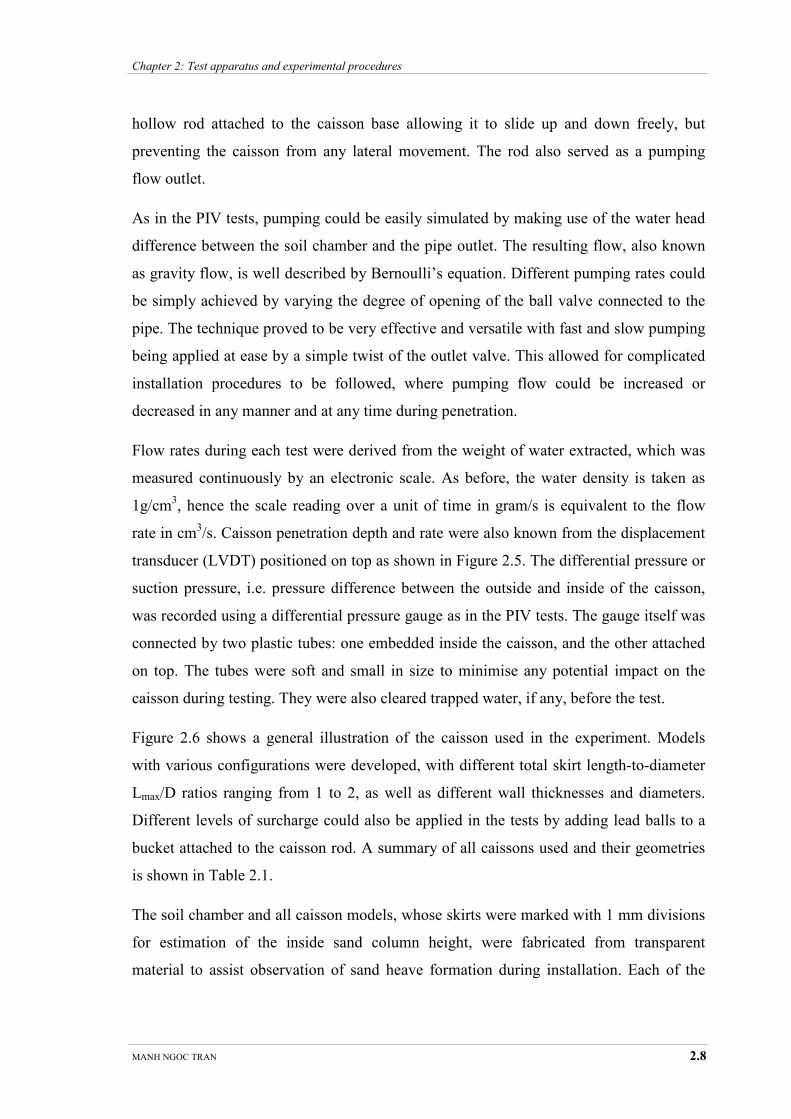
Chapter 2: Test apparatus and experimental procedures
MANH NGOC TRAN 2.8
hollow rod attached to the caisson base allowing it to slide up and down freely, but
preventing the caisson from any lateral movement. The rod also served as a pumping
flow outlet.
As in the PIV tests, pumping could be easily simulated by making use of the water head
difference between the soil chamber and the pipe outlet. The resulting flow, also known
as gravity flow, is well described by Bernoulli’s equation. Different pumping rates could
be simply achieved by varying the degree of opening of the ball valve connected to the
pipe. The technique proved to be very effective and versatile with fast and slow pumping
being applied at ease by a simple twist of the outlet valve. This allowed for complicated
installation procedures to be followed, where pumping flow could be increased or
decreased in any manner and at any time during penetration.
Flow rates during each test were derived from the weight of water extracted, which was
measured continuously by an electronic scale. As before, the water density is taken as
1g/cm3, hence the scale reading over a unit of time in gram/s is equivalent to the flow
rate in cm3/s. Caisson penetration depth and rate were also known from the displacement
transducer (LVDT) positioned on top as shown in Figure 2.5. The differential pressure or
suction pressure, i.e. pressure difference between the outside and inside of the caisson,
was recorded using a differential pressure gauge as in the PIV tests. The gauge itself was
connected by two plastic tubes: one embedded inside the caisson, and the other attached
on top. The tubes were soft and small in size to minimise any potential impact on the
caisson during testing. They were also cleared trapped water, if any, before the test.
Figure 2.6 shows a general illustration of the caisson used in the experiment. Models
with various configurations were developed, with different total skirt length-to-diameter
Lmax/D ratios ranging from 1 to 2, as well as different wall thicknesses and diameters.
Different levels of surcharge could also be applied in the tests by adding lead balls to a
bucket attached to the caisson rod. A summary of all caissons used and their geometries
is shown in Table 2.1.
The soil chamber and all caisson models, whose skirts were marked with 1 mm divisions
for estimation of the inside sand column height, were fabricated from transparent
material to assist observation of sand heave formation during installation. Each of the
Chapter 2: Test apparatus and experimental procedures
MANH NGOC TRAN 2.9
tests was recorded using a digital video camera, allowing the heave to be estimated at any
time during the penetration.
2.6.2 Test procedure
The tests were carried out in the same way as they are normally conducted in the field.
This typically consists of two phases: a self-weight installation phase, followed by
suction installation. During self-weight installation, the caisson penetrates into the soil
using its own weight and any additional surcharge as the driving force. Once the caisson
settles down under its self-weight, the suction installation phase is started by pumping
water out of the caisson compartment. The net downward force created as a result
provides the main driving force (other than the caisson’s self-weight and surcharge) that
penetrates the caisson to the desired depth.
All experiments were conducted in a way that resembles the above principle, following
the procedure described below:
a) Before each test was conducted, sand was levelled and densified by vibration to
obtain a flat surface.
b) The caisson, with water evacuation valve open, was lowered until its wall was in
contact with the sand surface. This touchdown position was recorded for later
determination of penetration depth.
c) The caisson was then slowly released to penetrate into the soil under self-weight,
with care being taken not to disturb the surrounding soil. Once penetration under
self-weight had ceased, the evacuation valve on the caisson base was closed
manually, and pumping was started and continued until installation was complete,
i.e. the caisson lid contacted the internal sand surface.
2.6.3 Effect of movement on the differential pressure gauge reading
As mentioned before, the differential pressure gauge could not be submerged. Hence the
suction pressure across the caisson lid was measured indirectly via two soft plastic tubes.
The changes in the levels of compression of the air inside these two tubes may affect the
gauge reading. Such changes may be induced by variations in the speed of movement of
Chapter 2: Test apparatus and experimental procedures
MANH NGOC TRAN 2.10
the tubes, as the rate of penetration of the caisson may vary in an installation test. To
check the potential effect of movement speed on the gauge reading, a series of tests was
conducted, where the tubes were moved at various speeds in the water. The gauge
readings in these cases were then compared, and the results are shown in Figure 2.7. It
can be seen that within the tested range, which covers the range of caisson penetration
speeds in suction installation tests presented later in this thesis, the pressure readings (via
the two plastic tubes) were essentially the same. The results suggest that indirect
measurement of the suction pressure via the two tubes is not affected by the movement
speed of tubes, and hence the caisson, within the investigated range.
2.7 Centrifuge installation test development
2.7.1 The geotechnical beam centrifuge and general scaling rules
The suction installation tests reported in this study were conducted in a geotechnical
beam centrifuge at the University of Western Australia, illustrated here in Figure 2.8. The
centrifuge is an Acutronic Model 661, with a maximum payload of 200 kg at the
maximum acceleration level of 200 g. It has a swinging platform with a radius of 1.8 m.
Further details were described by Randolph et al. (1991). In centrifuge tests, allowance
must be made for the elevated acceleration ng in evaluating the results. Many
publications have discussed the appropriate scaling laws, e.g. Taylor (1995). Table 2.2
presents a list of scaling factors for a number of common quantities.
2.7.2 Test apparatus and set-up
All installation tests were conducted in a standard centrifuge test box, or strongbox,
which has internal dimensions of 390 mm × 650 mm × 325 mm (width × length ×
height). However, the strongbox was modified by adding an extension, 100 mm deep, to
increase the overall height to 425 mm. The purpose was to increase the water depth to
ensure all caissons, especially the longer ones, were fully submerged at the start of
installation. The greater water depth also increased the pumping capacity, which was
simulated by gravity flow (discussed previously). Furthermore, the extended box height
allowed deeper soil samples to be tested, hence minimising boundary effects.
Chapter 2: Test apparatus and experimental procedures
MANH NGOC TRAN 2.11
The caissons were installed using the apparatus shown in Figure 2.9. This included a
guide system to ensure penetration of the caissons without tilting, and a weight control to
adjust the caisson self-weight and surcharge. The guide system comprised a rigid straight
rod screwed onto the caisson top. The rod could not move laterally, but could slide up
and down inside a guide tube, which was fitted with linear bearings to eliminate the
friction caused by the sliding motion. Any lateral effects on the motion, caused by the
fittings and hoses on the caissons, were hence eliminated. The guide rod was also
connected to a counter-balance bucket through a pulley system. By changing the amount
of lead balls in the bucket, it was possible to control the caisson self-weight (and
surcharge). However, this weight can change during caisson penetration due to the
variations in the distance from the centrifuge axis. This will be investigated and
discussed further in the next sections.
Two separate pore pressure transducers (PPTs) positioned on the caisson lid were used to
measure the suction pressure during installation, one inside the caisson and the other
outside the lid. The difference between the two PPT readings during installation, after
correction for the initial offset due to the difference in their elevations, gave the net
suction pressure across the caisson lid. Vertical caisson movement was recorded using a
displacement transducer (LVDT) as shown in Figure 2.9. The caisson top was fitted with
a pneumatically operated valve, which could be opened and closed in-flight. The valve
acted as a water evacuation outlet during self-weight penetration of the caisson. A pipe
fitting, connected to the pumping hose, was also located on the caisson lid. Details may
be seen in Figure 2.10.
The caissons were installed by continuously pumping water out of the caisson
compartment. Although a syringe pump is fitted within the base of the centrifuge
swinging platform and has been used for suction caisson installation in clay (e.g. Chen
and Randolph, 2004), its pumping capacity was insufficient to install the caissons in
sand. Therefore, pumping was achieved by gravity flow, as in the 1g tests, and was
created by the difference in water levels between the strongbox and the pumping hose
outlet. The hosing had an internal diameter of 10 mm. In each test, the water pumped out
of the caisson compartment was collected in a series of cylindrical reservoirs, connected
to each other by overflow pipes. Each of the reservoirs was fitted with a pressure
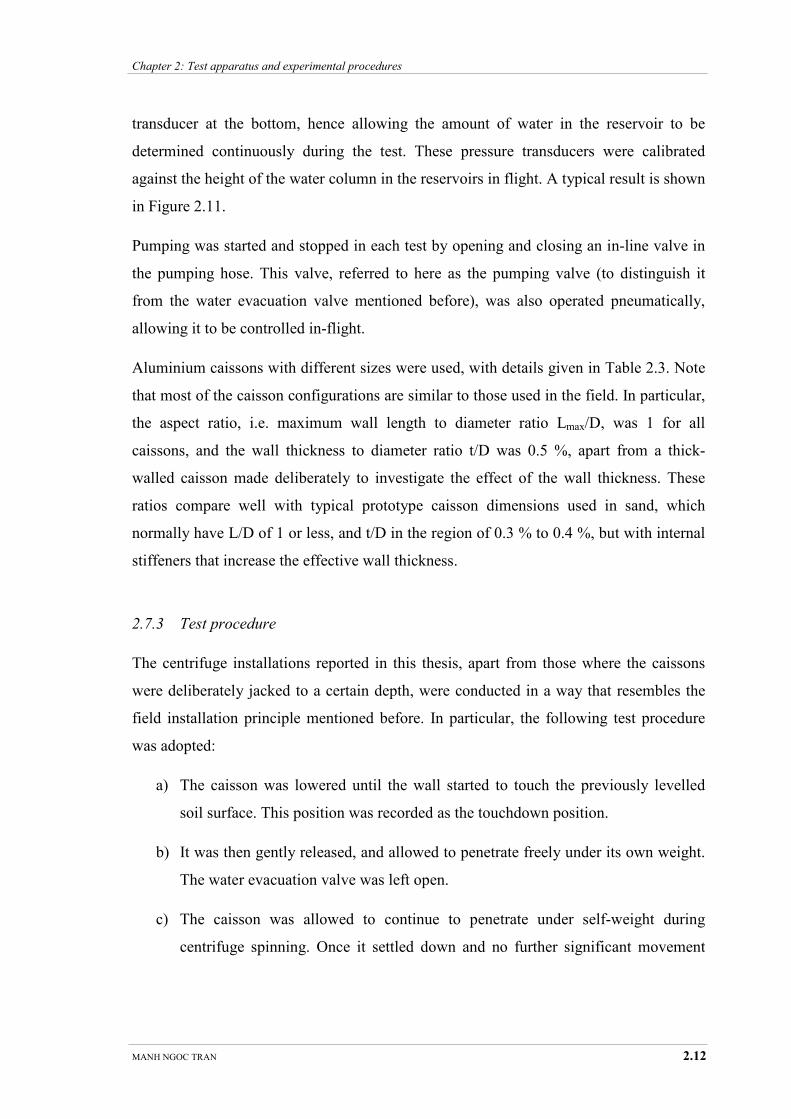
Chapter 2: Test apparatus and experimental procedures
MANH NGOC TRAN 2.12
transducer at the bottom, hence allowing the amount of water in the reservoir to be
determined continuously during the test. These pressure transducers were calibrated
against the height of the water column in the reservoirs in flight. A typical result is shown
in Figure 2.11.
Pumping was started and stopped in each test by opening and closing an in-line valve in
the pumping hose. This valve, referred to here as the pumping valve (to distinguish it
from the water evacuation valve mentioned before), was also operated pneumatically,
allowing it to be controlled in-flight.
Aluminium caissons with different sizes were used, with details given in Table 2.3. Note
that most of the caisson configurations are similar to those used in the field. In particular,
the aspect ratio, i.e. maximum wall length to diameter ratio Lmax/D, was 1 for all
caissons, and the wall thickness to diameter ratio t/D was 0.5 %, apart from a thick-
walled caisson made deliberately to investigate the effect of the wall thickness. These
ratios compare well with typical prototype caisson dimensions used in sand, which
normally have L/D of 1 or less, and t/D in the region of 0.3 % to 0.4 %, but with internal
stiffeners that increase the effective wall thickness.
2.7.3 Test procedure
The centrifuge installations reported in this thesis, apart from those where the caissons
were deliberately jacked to a certain depth, were conducted in a way that resembles the
field installation principle mentioned before. In particular, the following test procedure
was adopted:
a) The caisson was lowered until the wall started to touch the previously levelled
soil surface. This position was recorded as the touchdown position.
b) It was then gently released, and allowed to penetrate freely under its own weight.
The water evacuation valve was left open.
c) The caisson was allowed to continue to penetrate under self-weight during
centrifuge spinning. Once it settled down and no further significant movement
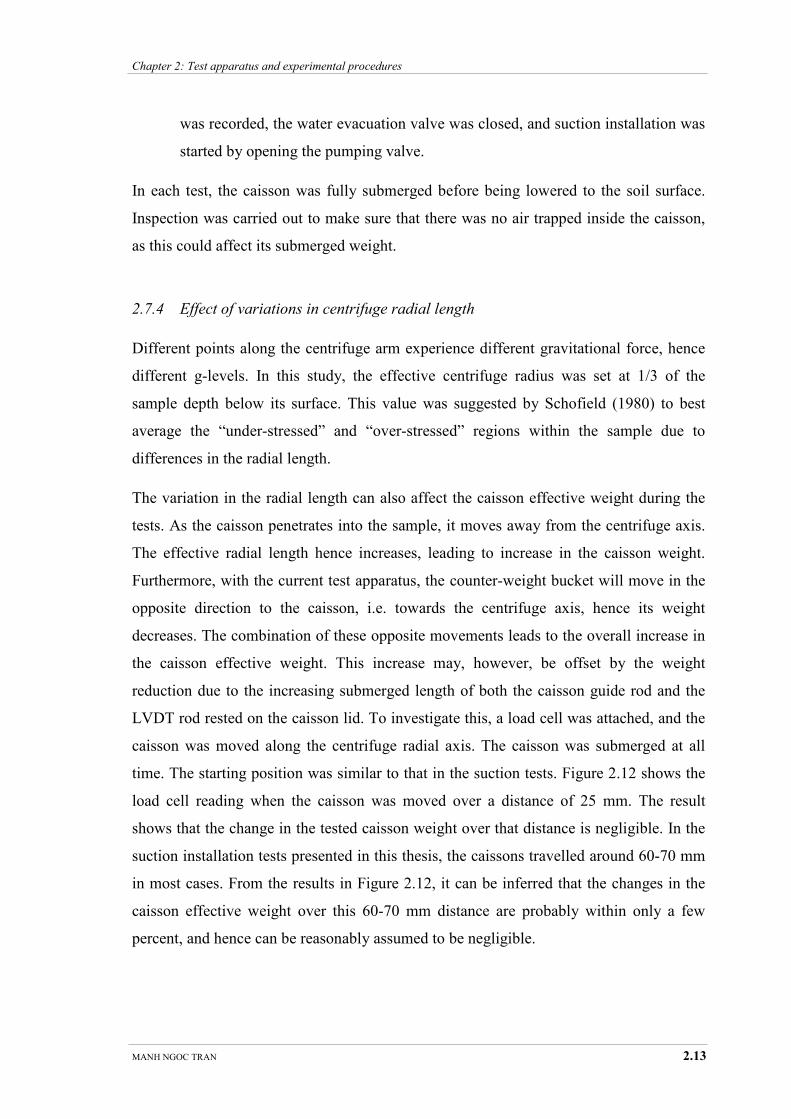
Chapter 2: Test apparatus and experimental procedures
MANH NGOC TRAN 2.13
was recorded, the water evacuation valve was closed, and suction installation was
started by opening the pumping valve.
In each test, the caisson was fully submerged before being lowered to the soil surface.
Inspection was carried out to make sure that there was no air trapped inside the caisson,
as this could affect its submerged weight.
2.7.4 Effect of variations in centrifuge radial length
Different points along the centrifuge arm experience different gravitational force, hence
different g-levels. In this study, the effective centrifuge radius was set at 1/3 of the
sample depth below its surface. This value was suggested by Schofield (1980) to best
average the “under-stressed” and “over-stressed” regions within the sample due to
differences in the radial length.
The variation in the radial length can also affect the caisson effective weight during the
tests. As the caisson penetrates into the sample, it moves away from the centrifuge axis.
The effective radial length hence increases, leading to increase in the caisson weight.
Furthermore, with the current test apparatus, the counter-weight bucket will move in the
opposite direction to the caisson, i.e. towards the centrifuge axis, hence its weight
decreases. The combination of these opposite movements leads to the overall increase in
the caisson effective weight. This increase may, however, be offset by the weight
reduction due to the increasing submerged length of both the caisson guide rod and the
LVDT rod rested on the caisson lid. To investigate this, a load cell was attached, and the
caisson was moved along the centrifuge radial axis. The caisson was submerged at all
time. The starting position was similar to that in the suction tests. Figure 2.12 shows the
load cell reading when the caisson was moved over a distance of 25 mm. The result
shows that the change in the tested caisson weight over that distance is negligible. In the
suction installation tests presented in this thesis, the caissons travelled around 60-70 mm
in most cases. From the results in Figure 2.12, it can be inferred that the changes in the
caisson effective weight over this 60-70 mm distance are probably within only a few
percent, and hence can be reasonably assumed to be negligible.
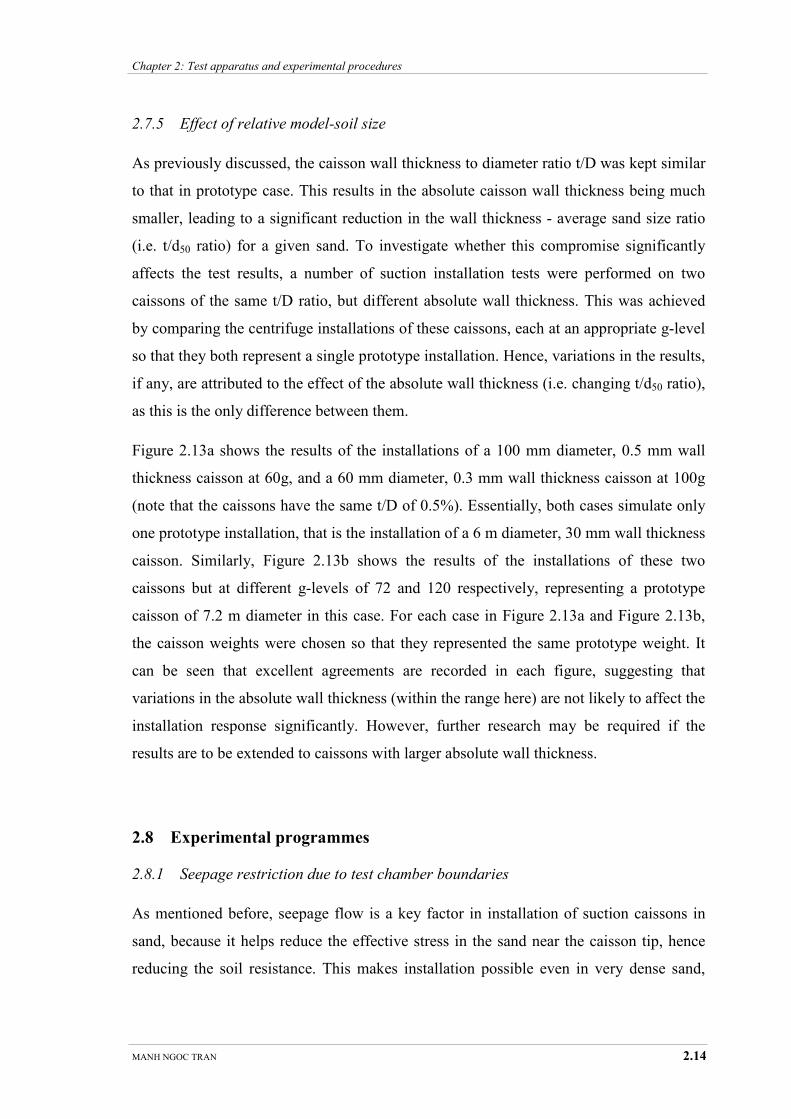
Chapter 2: Test apparatus and experimental procedures
MANH NGOC TRAN 2.14
2.7.5 Effect of relative model-soil size
As previously discussed, the caisson wall thickness to diameter ratio t/D was kept similar
to that in prototype case. This results in the absolute caisson wall thickness being much
smaller, leading to a significant reduction in the wall thickness - average sand size ratio
(i.e. t/d50 ratio) for a given sand. To investigate whether this compromise significantly
affects the test results, a number of suction installation tests were performed on two
caissons of the same t/D ratio, but different absolute wall thickness. This was achieved
by comparing the centrifuge installations of these caissons, each at an appropriate g-level
so that they both represent a single prototype installation. Hence, variations in the results,
if any, are attributed to the effect of the absolute wall thickness (i.e. changing t/d50 ratio),
as this is the only difference between them.
Figure 2.13a shows the results of the installations of a 100 mm diameter, 0.5 mm wall
thickness caisson at 60g, and a 60 mm diameter, 0.3 mm wall thickness caisson at 100g
(note that the caissons have the same t/D of 0.5%). Essentially, both cases simulate only
one prototype installation, that is the installation of a 6 m diameter, 30 mm wall thickness
caisson. Similarly, Figure 2.13b shows the results of the installations of these two
caissons but at different g-levels of 72 and 120 respectively, representing a prototype
caisson of 7.2 m diameter in this case. For each case in Figure 2.13a and Figure 2.13b,
the caisson weights were chosen so that they represented the same prototype weight. It
can be seen that excellent agreements are recorded in each figure, suggesting that
variations in the absolute wall thickness (within the range here) are not likely to affect the
installation response significantly. However, further research may be required if the
results are to be extended to caissons with larger absolute wall thickness.
2.8 Experimental programmes
2.8.1 Seepage restriction due to test chamber boundaries
As mentioned before, seepage flow is a key factor in installation of suction caissons in
sand, because it helps reduce the effective stress in the sand near the caisson tip, hence
reducing the soil resistance. This makes installation possible even in very dense sand,
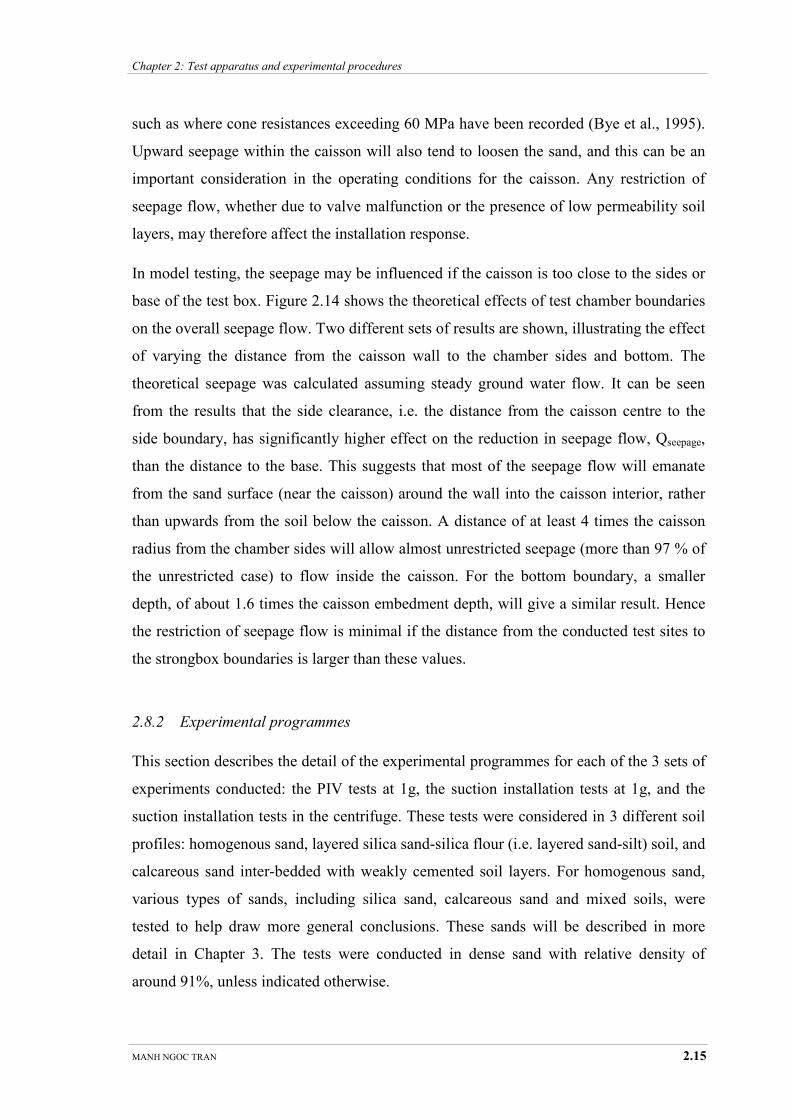
Chapter 2: Test apparatus and experimental procedures
MANH NGOC TRAN 2.15
such as where cone resistances exceeding 60 MPa have been recorded (Bye et al., 1995).
Upward seepage within the caisson will also tend to loosen the sand, and this can be an
important consideration in the operating conditions for the caisson. Any restriction of
seepage flow, whether due to valve malfunction or the presence of low permeability soil
layers, may therefore affect the installation response.
In model testing, the seepage may be influenced if the caisson is too close to the sides or
base of the test box. Figure 2.14 shows the theoretical effects of test chamber boundaries
on the overall seepage flow. Two different sets of results are shown, illustrating the effect
of varying the distance from the caisson wall to the chamber sides and bottom. The
theoretical seepage was calculated assuming steady ground water flow. It can be seen
from the results that the side clearance, i.e. the distance from the caisson centre to the
side boundary, has significantly higher effect on the reduction in seepage flow, Qseepage,
than the distance to the base. This suggests that most of the seepage flow will emanate
from the sand surface (near the caisson) around the wall into the caisson interior, rather
than upwards from the soil below the caisson. A distance of at least 4 times the caisson
radius from the chamber sides will allow almost unrestricted seepage (more than 97 % of
the unrestricted case) to flow inside the caisson. For the bottom boundary, a smaller
depth, of about 1.6 times the caisson embedment depth, will give a similar result. Hence
the restriction of seepage flow is minimal if the distance from the conducted test sites to
the strongbox boundaries is larger than these values.
2.8.2 Experimental programmes
This section describes the detail of the experimental programmes for each of the 3 sets of
experiments conducted: the PIV tests at 1g, the suction installation tests at 1g, and the
suction installation tests in the centrifuge. These tests were considered in 3 different soil
profiles: homogenous sand, layered silica sand-silica flour (i.e. layered sand-silt) soil, and
calcareous sand inter-bedded with weakly cemented soil layers. For homogenous sand,
various types of sands, including silica sand, calcareous sand and mixed soils, were
tested to help draw more general conclusions. These sands will be described in more
detail in Chapter 3. The tests were conducted in dense sand with relative density of
around 91%, unless indicated otherwise.
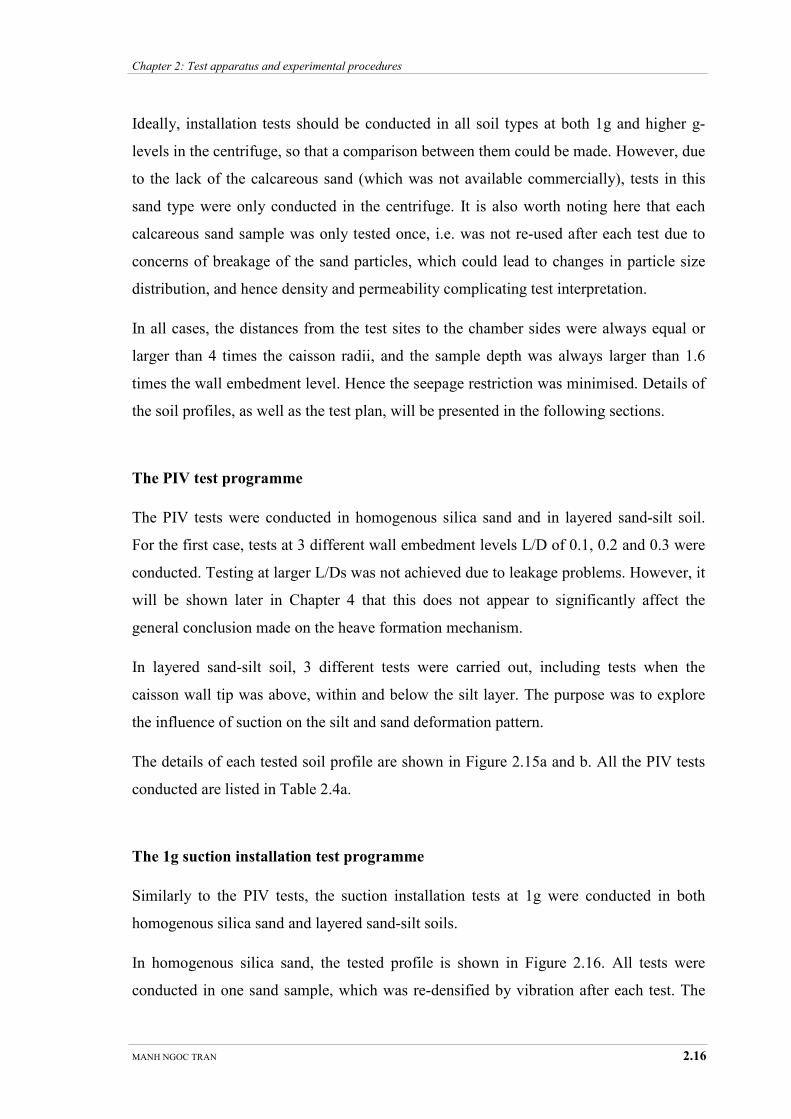
Chapter 2: Test apparatus and experimental procedures
MANH NGOC TRAN 2.16
Ideally, installation tests should be conducted in all soil types at both 1g and higher g-
levels in the centrifuge, so that a comparison between them could be made. However, due
to the lack of the calcareous sand (which was not available commercially), tests in this
sand type were only conducted in the centrifuge. It is also worth noting here that each
calcareous sand sample was only tested once, i.e. was not re-used after each test due to
concerns of breakage of the sand particles, which could lead to changes in particle size
distribution, and hence density and permeability complicating test interpretation.
In all cases, the distances from the test sites to the chamber sides were always equal or
larger than 4 times the caisson radii, and the sample depth was always larger than 1.6
times the wall embedment level. Hence the seepage restriction was minimised. Details of
the soil profiles, as well as the test plan, will be presented in the following sections.
The PIV test programme
The PIV tests were conducted in homogenous silica sand and in layered sand-silt soil.
For the first case, tests at 3 different wall embedment levels L/D of 0.1, 0.2 and 0.3 were
conducted. Testing at larger L/Ds was not achieved due to leakage problems. However, it
will be shown later in Chapter 4 that this does not appear to significantly affect the
general conclusion made on the heave formation mechanism.
In layered sand-silt soil, 3 different tests were carried out, including tests when the
caisson wall tip was above, within and below the silt layer. The purpose was to explore
the influence of suction on the silt and sand deformation pattern.
The details of each tested soil profile are shown in Figure 2.15a and b. All the PIV tests
conducted are listed in Table 2.4a.
The 1g suction installation test programme
Similarly to the PIV tests, the suction installation tests at 1g were conducted in both
homogenous silica sand and layered sand-silt soils.
In homogenous silica sand, the tested profile is shown in Figure 2.16. All tests were
conducted in one sand sample, which was re-densified by vibration after each test. The

Chapter 2: Test apparatus and experimental procedures
MANH NGOC TRAN 2.17
suction tests were conducted for different installation scenarios, including:
� Variation in pumping rate: includes slow pumping installation, fast pumping
installation, gradual change and sudden change in pumping rate during
installation.
� Variation in caisson geometry: includes changes in absolute size and changes in
wall thickness ratio t/D.
� Variation in the caisson effective weight.
For layered sand-silt soil, soil profiles where the silt layer was either on the surface, or
embedded in the sand were both tested. For the latter case, the thickness and the depth of
the silt layer below the surface was also varied. The tested soil profiles are shown in
Figures 2.17a, b and c. Due to the small size of the soil chamber, only one complete test
could be done in each layered sample. The disturbed sand-silt was removed after each
test, and a new sample was prepared using the technique and procedure described later in
Section 3.7. Details of all the suction installation tests at 1g are listed in Table 2.4b.
The centrifuge suction installation test programme
Suction installation tests in the centrifuge were conducted in the following soils:
� Homogenous sand: including silica sand, calcareous sand and mixed soils, where
silica sand was mixed with silica flour to create soils with 10%, 20% and 40%
fines contents.
� Layered sand-silt soils.
� Layered cemented-uncemented soils.
Variations in installation condition including caisson geometry, effective weight and
initial penetration depths were considered. For the layered sand-silt soil, installations in
profiles with the silt layer on the surface and below the surface were both investigated.
The thickness of the silt layer and its depth below the surface were varied (i.e. similar to
the 1g tests). Installations in soil with 2 bands of silt were also conducted. For layered
cemented-uncemented soils, installations were conducted in calcareous sand inter-bedded
by layers of weakly cemented soils. Two levels of cementation were tested: “weaker”
cemented soil with unconfined compressive strength (UCS) of 80 kPa, and the “stronger”
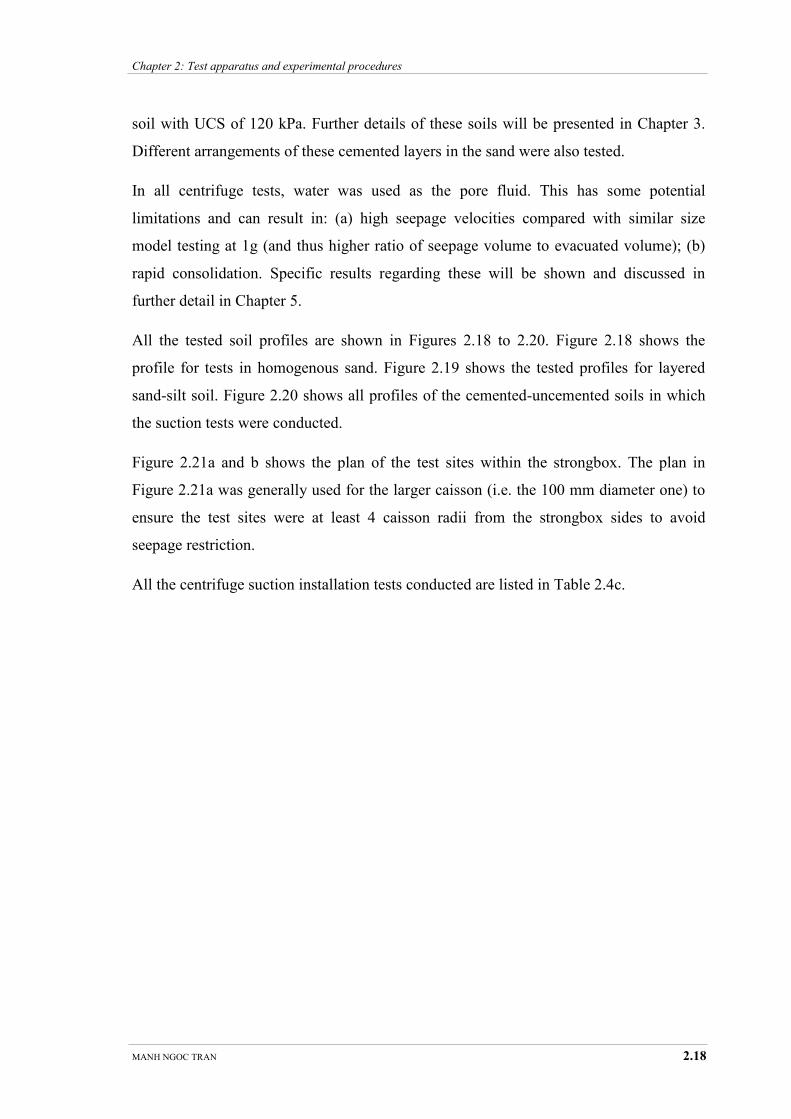
Chapter 2: Test apparatus and experimental procedures
MANH NGOC TRAN 2.18
soil with UCS of 120 kPa. Further details of these soils will be presented in Chapter 3.
Different arrangements of these cemented layers in the sand were also tested.
In all centrifuge tests, water was used as the pore fluid. This has some potential
limitations and can result in: (a) high seepage velocities compared with similar size
model testing at 1g (and thus higher ratio of seepage volume to evacuated volume); (b)
rapid consolidation. Specific results regarding these will be shown and discussed in
further detail in Chapter 5.
All the tested soil profiles are shown in Figures 2.18 to 2.20. Figure 2.18 shows the
profile for tests in homogenous sand. Figure 2.19 shows the tested profiles for layered
sand-silt soil. Figure 2.20 shows all profiles of the cemented-uncemented soils in which
the suction tests were conducted.
Figure 2.21a and b shows the plan of the test sites within the strongbox. The plan in
Figure 2.21a was generally used for the larger caisson (i.e. the 100 mm diameter one) to
ensure the test sites were at least 4 caisson radii from the strongbox sides to avoid
seepage restriction.
All the centrifuge suction installation tests conducted are listed in Table 2.4c.
MANH NGOC TRAN 3.1
Chapter Three
Chapter 3
Soil Properties and Sample
Preparation Techniques
3.1 Overview
All the soils used in this study will be described in this chapter, which starts by giving a
general description of the soils. This includes the description of the soil origins and their
particle size distributions. Then the result of a number of laboratory tests conducted to
characterise the soils are discussed. The soil permeability tests are first discussed; these
were conducted using both constant head and falling head test methods. Direct shear tests
against aluminium plates, similar to the tested caisson wall, are then presented. These are
followed by the results from a series of triaxial compression tests. Some of the triaxial
test results are also compared with those from other studies. This chapter then discusses
the preparation of cemented samples, which were used to create soil layers of various
strength levels in the suction installation tests. This section includes a detailed description
of the preparation technique, as well as the results from the unconfined compressive tests
(UCS). The last part of this chapter presents the sample preparation technique used to
create homogenous sand and layered soil for the model installation tests. The latter
includes layered sand-silt soil, and layered uncemented-cemented soils.
Chapter 3: Soil properties and sample preparation techniques
MANH NGOC TRAN 3.2
3.2 General soil description
4 different types of soils were used in this study. They are as follows:
� fine silica sand;
� silica flour;
� North Rankin calcareous sand (uncemented and cemented);
� mixed silica sand-silica flour soils.
Both the silica sand and silica flour, which is crushed silica sand, are commercially
available. The silica sand has rounded particles, its specific gravity Gs was measured at
2.67 (which was also the value for silica flour). The silica flour was used in this study to
simulate silt, and to create “silty” sands, which will be discussed below. The measured
maximum and minimum void ratio and density for the silica sand are listed in Table 3.1.
No measurement of maximum and minimum void ratio was conducted for silica flour
because, practically, it was difficult to do so. The saturated unit weight for silica flour for
“dense” conditions (similar to those in all suction test samples) was measured and found
to be around 20 kN/m3.
The North Rankin calcareous sand, on the other hand, was not commercially available. It
was dredged from the sea bed in the vicinity of the North Rankin site on the North West
Shelf of Western Australia. The soil contains flaky particles, and traces of coral
fragments and fish bones. In this study, sand particles larger than 0.3 mm were sieved
out. The specific gravity Gs of the sand was measured at 2.73. The soil void ratio and
density are also listed in Table 3.1. It is noted that this North Rankin sand has very high
void ratio, as is quite common in calcareous sand.
The mixed soils were created by mixing silica sand with different proportions of silica
flour. In this study, silica sand was mixed with silica flour to create soils with 10%, 20%
and 40% fines content (particle size < 0.075 mm), giving 3 different “silty” sands.
Previous studies of similar mixtures (Salgado et al., 2000; Cubrinovski and Ishihara,
2002) suggest that increasing fines up to a certain content, the minimum void ratio will
decrease to its lowest value because the voids between sand grains are occupied by these
fines. However, the minimum void ratio will increase again if more fines are added. As
for silica flour, the maximum and minimum void ratios were not measured for these soils
Chapter 3: Soil properties and sample preparation techniques
MANH NGOC TRAN 3.3
because of difficulties in the measurements, especially for soils with high silica flour
contents. This difficulty was also acknowledged by Salgado et al. (2000) and
Cubrinovski and Ishihara (2002). The saturated unit weight γsat for vibrated dense
samples, similar to those in the suction tests, was found quite similar for all 3 mixed
soils, slightly above 20 kN/m3. For practical purpose, it has been rounded to 20 kN/m
3 in
this study.
Figure 3.1 shows the particle size distribution for all soils. The particle size distribution
below 0.075 mm was determined using a laser sizing technique, described previously by
Bruno (1999). It can be seen that the silica sand is poorly graded, with most particle sizes
in the range of 0.07-0.3 mm. The sand has very low fines content (particle size < 0.075
mm), typically less than 5%. The North Rankin calcareous sand, on the other hand, has
quite significant amount fines content at around 15%. For silica flour, it can be seen that
all particle sizes are below 0.075 mm (i.e. the soil comprises 100% fines).
3.3 Permeability test
3.3.1 Test description
Two types of permeability tests were conducted: constant head and falling head tests. For
silica sand and loose North Rankin calcareous sand, the permeability for various soil
densities was determined from a constant head test. For dense North Rankin sand,
because the permeability was much lower, a falling head test was used to determine its
permeability. This method, however, could not be used to measure the permeability of
the silica flour, mainly because the filter at the bottom of the test apparatus could not
block silt particles. Instead, the permeability of this soil was obtained in a modified
constant head apparatus, which allows application of large pressure. The permeability for
silica flour (silt) was measured only for one density, similar to the density obtained from
the suction installation test sample.
3.3.2 Test results
Figures 3.2 a and b show the permeability k of the sands as a function of the soil void
Chapter 3: Soil properties and sample preparation techniques
MANH NGOC TRAN 3.4
ratio and relative density Dr, for silica sand and for the North Rankin calcareous sand
respectively. It can be seen consistently from these results that, as expected, the soil
permeability decreases when the sand becomes denser. For Dr of around 91%, which is
the sand density obtained in the suction installation test samples, the permeability of
silica sand is around 1.0 × 10⁻⁴ m/s, and that of North Rankin calcareous sand is about 1.5
× 10-5 m/s, roughly about 7 times less.
The permeability of silica flour for γsat of 20 kN/m3 was found to be around 1.3 × 10
-6
m/s, which is nearly two orders of magnitude lower than that of the silica sand. The
permeabilities of mixed soils with 10%, 20% and 40% fines content were not measured
and have been interpolated from those of silica sand and silica flour. Since the soil d10 is
likely to be an important parameter affecting its permeability (as suggested by the Hazen
formula: k = cd102), the interpolation of the permeabilities of the mixed soils was based
on this parameter. The results gave the permeability values of around 8 × 10⁻⁵ m/s, 2 ×
10-5 m/s and 6 × 10
-6 m/s for soils with 10%, 20% and 40% fines respectively.
3.4 Interface friction: direct shear test
3.4.1 Test description
The direct shear test apparatus used is shown in Figure 3.3a. The shear box, as seen in
Figure 3.3b, has an internal dimension of 100 × 60 mm. The shear tests were conducted
over a normal stress range of 50-200 kPa. This is slightly higher than the soil effective
stress range experienced by the caisson wall in the centrifuge tests, which was typically
less than 100 kPa, or less than 10 m soil depth at prototype scale. However, range was
chosen because shear test results at lower normal stresses are likely to be affected by the
system friction. The shearing rate was 0.2 mm/min.
All soil samples were prepared to densities similar to those in the suction installation
tests. The soil was sheared against an aluminium plate (the same material as the
centrifuge caissons). The surface roughness of the plate was similar to that of the caisson,
measured at around 0.3 µm for both cases.

Chapter 3: Soil properties and sample preparation techniques
MANH NGOC TRAN 3.5
3.4.2 Test results
Figures 3.4a shows the direct shear results obtained from the tests for silica sand. Figure
3.4b plots the measured peak interface shear stresses against the normal stress. Figures
3.5 and 3.6 show similar results for the calcareous sand and the silica flour, respectively.
It can be seen from the results that the shear stresses at lower normal stresses, e.g. the 50
kPa normal stress case for silica flour, is slightly above the common trend, represented
by the straight line through the origin. This is probably because of the friction introduced
from the test apparatus. Furthermore, particle jamming, especially for the silt case, was
observed, resulting in additional friction. Nonetheless, it can be deduced from the results
that the peak interface friction angles for calcareous sand, silica sand and silica flour are
190, 22
0 and 30
0 respectively. These fitted well with the peak interface friction angle-
surface roughness relationship proposed by Kishida and Uesugi (1987).
Similarly, the residual friction angles can also be deduced from the results, and found to
be around 150, 19
0 and 27
0 for calcareous sand, silica sand and silica flour respectively.
The residual interface friction angles for mixed soils were assumed from the interpolation
of those for silica sand and silica flour, which led to values of around 200, 21
0 and 22
0 for
soils with 10%, 20% and 40% fines respectively.
3.5 Triaxial compression test
3.5.1 Test description
The soil densities in the triaxial compression tests, as in the shear tests, were kept similar
to those in the suction installation tests. The triaxial samples were prepared by
compacting dry soil in 4 layers in a 72 mm diameter mould. The typical sample length
was around 150 mm. It was saturated by first flushing them with CO2 to facilitate the
saturation process. Water was then flushed through the soil using a small pressure head
(10 kPa) over a 45-minute period. The confining stress during this saturation period was
around 20 kPa. The sample saturation was checked before shearing. The “B-values” for
all samples were found to be 0.95 and above, indicating that a good degree of saturation
was achieved.
Chapter 3: Soil properties and sample preparation techniques
MANH NGOC TRAN 3.6
The shearing rate was 0.1 mm/min, or ~ 0.067% axial strain/min. The effective confining
stress σ3' during shearing was 100 kPa. All the tests conducted were isotropically
consolidated drained tests (CID).
3.5.2 Test results
Figure 3.7 shows the triaxial compression test results for different soils. The result for
soil with 40% silt may not be reliable, since post-test inspection of this sample showed a
very soft base, with apparently less fines particles. This was probably caused by the
accidental application of very large pressure during CO2 flushing (which could blow the
silt particles from the soil base). Also, no data were available for the volumetric change
of that sample (due to problematic GDS readings). For the mixed soil with 10% silt, the
strange response at 10% axial strain may be due to local non-uniformity of the sample.
Nonetheless, the trend is clear from the result. It was observed from the test that for silica
soils, especially for soil mixed with the non-plastic silt, very stiff response was recorded
during shearing. This is consistent with the observation that, physically, the saturated
mixed soil was very hard. The stiff responses observed here are consistent with other
triaxial tests of similar mixed soils, reported by Salgado et al. (2000).
For calcareous sand, very different response was observed. Very high compressibility
was recorded, and no stress peak was observed for the sand. The volumetric
measurement in Figure 3.7 indicates that the soil volume decreased continuously during
the test. This is consistent with the post-test inspection of the sample, showing that it
bulged out significantly, with no visible shear plane. The behaviour is very different from
those for silica sand and mixed soils, where a clear shear plane was always seen (see
Figure 3.8). The calcareous sand behaviour is in fact similar to that of loose silica sand,
although the tested sample was very dense. The response may be due to the very high
void ratio and brittle nature of the particles, resulting in high compressibility.
The friction angles were calculated for the soils, giving peak values of 490 for soils with
10% and 20% silt, 430 for silica sand, and 40
0 for North Rankin sand. The residual
friction angles for mixed soils were quite similar, at around 380. The corresponding
values for silica sand and calcareous sand were 360 and 40
0 respectively.
Chapter 3: Soil properties and sample preparation techniques
MANH NGOC TRAN 3.7
3.6 Cemented North Rankin calcareous sand
3.6.1 Preparation of cemented samples
Gypsum was added to the North Rankin calcareous sand to produce cemented samples.
The gypsum used in this study was commercially available hard wall plaster. The amount
of gypsum was varied to create different levels of cementation in the soil. In the tests
presented here, different cemented soils were created by mixing the calcareous North
Rankin sand with 5%, 10% and 15% gypsum (by dry weight).
The cemented samples were prepared by first mixing dry sand with the required gypsum
content. The mixture was then poured into a 72 mm diameter mould. For loose samples
(γsat ~ 14 kN/m3), no vibration was applied. However, for dense ones (γsat ~ 16 kN/m
3),
the soil was prepared in 4 layers, with vibration being applied to each layer. In all cases,
the sample length was around 150-160 mm. Saturation was then achieved by slowly
flushing water from the bottom of the sample. The process was continued for at least two
hours before all samples were submerged and left to cure overnight before testing. This
procedure closely resembles that used to create the cemented samples in the centrifuge,
which will be described later in this chapter. The water contents for loose and dense
samples (after saturation and curing) were measured after the test, and found consistently
to be 63% and 47%.
Unconfined compressive strength (UCS) tests were conducted to determine the strength
of the cementation. The loading rate was 0.2 mm/min.
3.6.2 Unconfined compressive strength
Figures 3.9 to 3.11 show the UCS tests results for sand with 5%, 10% and 15% gypsum
content respectively. It can be seen that a clear peak and drop in strength were only
observed in the cemented soil with 15% gypsum content (the “strongest” cementation).
In other cases, no clear drop in strength was recorded. This indicates that the cementation
in these soils was very weak, which was also confirmed by the low peak values and their
failure modes. Figure 3.12a and b show the post-test dense samples with 5% and 15%
gypsum respectively. It can be seen that for the first case, the soil column tended to bulge
out during loading, indicating low strength. For the latter case, crack formation in the
Chapter 3: Soil properties and sample preparation techniques
MANH NGOC TRAN 3.8
tested sample can be clearly observed, suggesting that higher strength and a more brittle
response has been obtained.
Figure 3.13 plots the highest load applied to each sample (including the self-weight of the
cap). The trend is clear from the results: the strength of the cemented soils increases with
higher gypsum content used. It is also higher for denser soil. The results in Figure 3.13
also suggest that the rate of increment in the cemented strength (for the same added
amount of gypsum) is higher for dense soils. These observations are consistent with
previous results reported by Huang (1994).
For the suction installation tests, the soils with 10% and 15% gypsum were chosen to
simulate “weak” and “strong” cemented layers. Their densities were also similar to those
of the dense samples here (both also similar to the density of the uncemented sand tested
in the centrifuge). The corresponding unconfined compressive strengths, as seen in
Figure 3.13, are 80 kPa and 120 kPa respectively.
3.7 Sample preparation techniques
Due to the differences in the properties of the various soils tested, different techniques
were used to prepare the samples. These are described in the following sections of this
chapter. The soil density in each sample was estimated from the total mass of soil used,
and the volume occupied in the test chamber. The sample uniformity was checked by
conducting cone penetration test (details shown later in this thesis).
3.7.1 Homogenous sand
It can be seen from above that the three different types of sands, namely the fine silica
sand, the North Rankin calcareous sand, and the mixed soils, have very different particle
size distributions. While most of the silica sand particles are larger than silt size, the latter
two sands contain a significant amount of fines. Therefore, different techniques were
needed to prepare the homogenous sand samples.
The saturated silica sand sample was prepared by first placing the test chamber on the
vibrating table, then filling it with water. Dry sand was then pluviated into the chamber at
Chapter 3: Soil properties and sample preparation techniques
MANH NGOC TRAN 3.9
a slow rate. Continuous vibration was applied during the sand pluviation process.
Additional vibration was also applied to the chamber sides by a pneumatic hammer. It
was found that the technique created very dense samples. The soil density was calculated
afterwards, and found to give a relative density Dr of around 91 %. From the Dr-k
relationship shown before in Figure 3.2a, this corresponds to a soil permeability ko of 1.0
× 10-4 m/s. Saturation was also checked by stirring a separate sample prepared using the
same technique. No air bubbles were observed, hence it is likely that the technique
produced a satisfactory saturated condition. Subsequent cone penetration tests (presented
later in Chapter 5) also indicated that very uniform samples were created.
For North Rankin calcareous sand and mixed soils, the above technique could not be
used. Initial trials indicated significant separation of the fines from the coarser particles
during pluviation through water, especially for the mixed soils. Hence these soil samples
were prepared using a different technique. Dry soil was first poured loosely into the test
chamber. Two different techniques were then tried: (a) the dry loose soil was vibrated for
30 minutes, before flushing water from the bottom of the sample to saturate; (b) water
was flushed through the loose soil deposit first, with vibration applied once the saturation
was complete.
In both techniques, slight (and unavoidable) segregation was observed. For the first
technique, it occurred during the dry vibration. For the second technique, it happened
when the saturated samples was vibrated. In this case, a small amount of fines were
transported upwards as the water in the loose sample escaped to the surface. Nonetheless,
the created samples in all cases were dense and uniform, as indicated by subsequent cone
test results (shown in Chapter 5). The North Rankin calcareous sand relative density was
also found to be around 91% (or saturated unit weight of ~16 kN/m3), corresponding to a
permeability of 1.5 × 10⁻⁵ m/s (from Figure 3.2b). The mixed soil unit weight was
estimated at around 20 kN/m3, quite similar to that of silica sand.
During flushing, the water head difference was always kept less than 200 mm to prevent
piping. The saturation process was achieved overnight for method (a), but only within a
few hours for method (b). It is noted here that silica sand samples could also have been
prepared by this flushing method. However, this is likely to result in a longer saturation
process without creating much advantage.
Chapter 3: Soil properties and sample preparation techniques
MANH NGOC TRAN 3.10
3.7.2 Layered sand-silt soil
The bottom sand layer in a layered sand-silt sample was prepared following the same
procedure for silica sand described above. The silt (silica flour) layer was then added on
top of the vibrated dense sand, and was allowed enough time to settle before vibration
was again applied to clear the remaining air bubbles trapped in the silt. The same process
was repeated if there were more sand or silt layers on top. Additional vibration was also
applied to the box sides using a pneumatic hammer. However, once a silt layer was
present, a shorter vibration period (~5-10 minutes) was applied. This was because the silt
at the sand-silt interface would tend to mix with silica sand if a long vibration period was
applied. As a result, the top sand layer in some cases was not as dense as the lower ones,
for example profile 4 in the centrifuge test shown in Figure 2.19.
The saturated unit weight γsat for silt (silica flour) was around 20 kN/m3, also similar to
γsat of silica sand. As mentioned in the previous section, the silt permeability for this
density is about 1.3 × 10⁻⁶ m/s, roughly 2 orders of magnitude lower than the sand.
3.7.3 Layered uncemented-cemented soil
The bottom sand was prepared using the previously described technique, i.e. by first
vibrating the loosely deposited dry sand. The dry sand-gypsum mixture was added on top
of the vibrated dense sand, and the soil was levelled. Vibration was then again applied to
densify the soil in this layer. The same process was repeated for the overlaying sand, or
cemented layers.
As for the layered sand-silt, when a cemented layer was present, less vibration was
applied due to concern that the soil at the interface would be mixed. As a result, the top
sand was generally less dense, with relative density estimated at around 80%. Once the
required profile was achieved, water was then flushed from the bottom of the sample,
following the procedure in the UCS tests mentioned previously. Immediately after the
saturation, the sample was put on the centrifuge, and left overnight (with the centrifuge
stationary) for curing before the suction installation tests were performed. Examples of
the cementation can be seen in Figure 3.14, where cemented layers can be observed from
the oven-dried soil cores taken from the tested samples.

Chapter 3: Soil properties and sample preparation techniques
MANH NGOC TRAN 3.11
It is noted here that the above method was not applied to prepare the sand-silt soils
because, unlike the calcareous sand-gypsum mixture, dry vibration of the silt (silica
flour) was found ineffective. On the other hand, cemented layers were not created by
pluviation through water as in the sand-silt case, mainly because of concerns that this
would affect the uniformity of the mixture and the gypsum content in the soil, hence
affect the cementation. The cemented soil layers are assumed to have the same
permeability as that of the uncemented sand (although the addition of the fine gypsum
particles and the subsequent cementation occurs may lower the soil permeability).
MANH NGOC TRAN 4.1
Chapter Four
Chapter 4
Installation Behaviour at Normal
Gravity (1g)
4.1 Overview
Results of all installation tests at 1g are presented in this chapter. This chapter first
investigates the plug formation mechanism by using a half-caisson model and particle
image velocimetry (PIV) technique, which was described previously in Sections 2.5 and
2.8. It then presents results for the 1g suction installation tests, whose details can be seen
in Sections 2.6 and 2.8. Results of the derived seepage flow, and the internal heave
development during the test will also be shown. The latter is also discussed in relation to
the previous PIV observations. The last part of this chapter investigates the caisson
installation in sand-silt soils. The aim here is to provide more knowledge of the generic
behaviour of suction caissons during installation in different conditions. This chapter
concentrates only on examining the test observations and drawing general conclusions
based on those results. Further discussions, including attempts to explain some of the key
behaviour by numerical simulations are deliberately left until the caisson response at
higher soil stress levels (similar to those in the field) has been addressed. Such
discussions are presented in Chapters 5, 6 and 7.
Chapter 4: Installation behaviour at normal gravity (1g)
MANH NGOC TRAN 4.2
4.2 Soil deformation investigation using PIV
4.2.1 Homogenous silica sand
Figure 4.1 shows a typical raw post-analysis PIV result for L/D of 0.3 (each pixel
represents 1/16 mm for this case) superimposed on the photo taken from the test. Figures
4.2 to 4.4 present the displacement fields from tests with different penetration depths in
mm. To assist with the interpretation, these displacements have been scaled up as
indicated on the figures. The average measured suction pressure for each case is also
shown.
The sand displacement field for shallow penetration depth L/D of 0.1 (i.e. L = 10 mm) is
shown in Figure 4.2a. Note that the magnitudes (lengths) of the arrows divided by the
scaling factor represents the measured (average) displacement of soil within that patch. It
can be seen from the results that there are two distinct areas of sand movement: a large
displacement zone in the two regions (a single semi-toroidal region) close to the inner
caisson wall, and the remaining field with essentially no movement. The largest
displacements are observed along the wall, but these reduce quite rapidly towards the
plug centre, where no sand movement is recorded. This field of large movement forms a
wedge shape adjacent to the inner wall.
More details of the displacements around the caisson’s left hand side, shown in Figure
4.2a, are shown in Figure 4.2b. While there is a clear trend that the sand tends to flow
around the tip into the caisson compartment, the level of inflow movement is very small
compared to the vertical movement along the inner wall. The zone of influence, where
movement is still recorded, extends to only a small depth below the caisson tip. At the
same time, almost no movement is observed in regions adjacent to the outside caisson
wall.
The results are interesting, as it is might be expected that a large amount of sand,
especially from along the outer caisson wall, could flow into the caisson during suction
installation, thus contributing to the internal heave. Observations here suggest that this is
unlikely to be the case. Rather they suggest that the sand inflow is likely to be small, and
the majority of the sand heave in the wedge formed along the inner caisson wall is the
result of its own expansion in volume, not an extra supply of sand due to inflow.

Chapter 4: Installation behaviour at normal gravity (1g)
MANH NGOC TRAN 4.3
Although unexpected, the results are, however, explainable. Under suction, sand adjacent
to the inner caisson wall will experience the most extreme seepage flow conditions due to
the location of the shortest hydraulic path along the caisson wall. As the sand in this
region loses its equilibrium (under the influence of the seepage body force), it moves up
and loosens, causing it to expand in volume. For dense sand, the expansion can be quite
substantial. In addition, the material immediately adjacent to the inner caisson wall will
undergo shearing at the same time. This action will lead to dilation of the dense sand,
causing additional loosening and expansion of the sand inside the caisson in the vicinity
of the walls.
Figures 4.3 and 4.4 show test results for deeper wall embedment depths of L/D of 0.2 and
0.3 respectively. Unlike previously, where no movement was observed for the central
plug, considerable upward movement of the whole sand plug occurred at these deeper
penetration levels. There are large displacements within wedge zones along the inner
wall in both cases. It is noted that the displacement zone only extends to a relatively
small distance below the caisson wall embedment, less than about 30% of the penetrated
depth in these cases. Apart from zones next to the caisson wall, the displacement level
appears to be quite uniform for the rest of the plug inside the caisson, but reduces quickly
with further depth below the tip embedment level. Only modest sand displacement is
recorded in the outer caisson wall areas and below the caisson tip, showing a similar
trend to the previous observations at shallow penetration. It should be noted here that the
tests were only conducted for wall embedment depth L/D of up to 0.3 due to leakage
problems at greater depth. Nonetheless, the similarity in the results at L/D of 0.2 and 0.3
seen here suggests that the soil deformation mechanism at greater L/D is likely to be
similar.
The results are interesting considering the high suction pressure recorded for each case.
The normalised pressures p/γ'D, where p is the measured peak pressure, γ' is the soil
submerged unit weight (= 10 kN/m3), and D is the diameter of the full caisson, are 0.75,
4.1 and 5.1 for L/D = 0.1, 0.2 and 0.3 respectively. For comparison, at similar depths, the
values of p/γ'D during suction installation using similar pumping rates (which will be
presented in the next sections of this chapter) are only around 0.5, 0.8 and 1.0
respectively. The results clearly indicate that, at least for the soil type and test conditions
Chapter 4: Installation behaviour at normal gravity (1g)
MANH NGOC TRAN 4.4
here, no excessive sand inflow occurs even under very large suction pressures. Rather,
the sand heave formed during the recording period, either in the form of the small
wedges seen in the shallow penetration case, or the whole plug motion at greater caisson
embedment depths, is primarily due to volumetric expansion of the sand. Only a very
small amount of sand inflow contributes to the overall sand heave.
The philosophy of these restrained tests was to explore what happens in the most critical
situations, and determine how the results can be safely interpreted during installation
when the caisson is free to move. It is believed that the fixed caisson experiment
represents the worst installation condition, where a very high suction pressure is suddenly
applied (through fast pumping) while no movement is permitted. The restrained
conditions create a very significant preferential flow region, because of the pronounced
loosening in the wedge zones, and optimal conditions for triggering a piping failure. The
initial expectation was that the sand outside would move into the caisson under the
influence of this very high suction. However, the results obtained clearly show that this is
not the case, and that the heave is mostly caused by plug expansion. This result, to some
extent, can be applied to the moving cases. Although the expansion along the inner wall
may be less extreme (due to lower suction) in the moving cases, the generic heave
formation mechanism is likely to be the same. Indeed, considering effective heave (i.e.
total heave minus the caisson wall volume embedded in the sand) as the result of sand
inflow and expansion, if the heave in these extreme cases is mainly caused by plug
expansion, not the sand inflow, then in the moving cases it is most likely that sand heave
will be created in the same manner. This is because in the moving caisson installation,
there is even more restriction to sand inflow due to much lower suction pressures and the
continuous extension of the cut-off wall length.
4.2.2 Layered sand-silt soil
This section investigates the soil deformation where a layer of low permeability silt is
present. Details of the tested soil profiles were described in Section 2.9. Figure 4.5 shows
the results for the case where the caisson wall is above, but close to the silt layer. Figure
4.5a shows the raw displacement field relative to the experimental set-up, and Figure
4.5b shows the analysed displacements (in mm). It can be seen from Figure 4.5 that

Chapter 4: Installation behaviour at normal gravity (1g)
MANH NGOC TRAN 4.5
within the caisson, there is a clear trend of upward soil movement under the influence of
the suction pressure, similar to previous observations in homogenous sand. An interesting
observation is that the silt layer “bends” slightly upward when pumping is applied. Note
that the caisson wall tip has not penetrated into the silt, and is still above it in this case;
this clearly indicates that the suction pressure is likely to have some effect on the
underlying silt layer as the caisson wall approaches it. The silt deformation, however,
only occurs in the section within the projection of the caisson wall. The sections outside
that zone appear unaffected, having negligible deformation. This can be explained by the
creation of a pressure difference across that section of the silt layer, which results in a net
uplift force. This will be discussed in detail later in this section. Figure 4.5b also shows
that as the silt layer “bends” up, the sand below it also moves upward, indicating that
sand loosening occurs below the silt layer.
It is also observed that there is relatively uniform soil displacement inside the caisson
above the silt. The sand movement along the inner wall appears to be larger than that
towards the plug centre, a pattern which is similar to that observed previously in
homogenous sand. However, unlike the homogenous sand case, the difference between
the displacements along the wall and towards to plug centre is much smaller in this case.
Sand movement in the regions adjacent to the outer caisson wall is also recorded, but is
negligible. This once again indicates that the sand inflow (around the caisson wall) is
insignificant. While this soil deformation pattern appears to be similar to that in
homogenous sand, seen in the previous section, the heave formation mechanism is likely
to be slightly different in this case due to the presence of the silt layer. Indeed, apart from
the plug expansion caused by seepage as discussed before, the upward deformation of the
silt layer also lifts the overburden sand with it, hence further contributes to the total
displacement of the sand inside the caisson as seen. Since the expansion caused by the
seepage is likely to be limited here due to the flow restriction caused by the silt layer, the
uplift action may contribute significantly to the total recorded movement of the internal
sand plug in this case.
The result where the caisson wall tip is inside the silt layer is shown in Figure 4.6. It is
clear from the displacements that the silt layer section within the caisson wall projection
moves upward when suction is applied. The movement appears uniform throughout the
Chapter 4: Installation behaviour at normal gravity (1g)
MANH NGOC TRAN 4.6
whole section, which is slightly different from that in the previous case, where larger
displacements are seen towards the middle of the plug. Outside the caisson, there is no
significant displacement of the silt.
Figure 4.6 also shows that the sand above the silt layer inside the caisson moves upward
very uniformly. It should be noted that the caisson tip is inside the low permeability silt
layer in this case, which, as a result, reduces most of the seepage flow into the caisson
interior. The observed sand displacement is quite significant, and therefore unlikely to be
due to plug expansion as a result of the seepage alone, because this would require large
seepage body force acting on the soil skeleton. Rather, the recorded displacement can
also be attributed to the upward movement of the silt layer. Indeed, as the silt layer
moves up uniformly, it “lifts” the overburden sand with it. Assuming insignificant
expansion results from the seepage, the overburden sand above the silt should move in
the same manner and in fact, by a similar amount as the silt, which appears to be the case
here. Displacement is also seen in the sand below the silt layer, similar to that when the
caisson tip was just above the silt layer. Displacement occurs in a conical zone, and
extends to some depth below the wall tip, about 100% of the wall embedment depth in
this case. Apart from this region, no significant displacement is recorded for other zones,
including those adjacent to the outer caisson wall.
Figure 4.7 shows the result where the caisson tip is at a small depth below the silt layer.
The recorded displacement field is essentially similar to that discussed in the above case
(i.e. Figure 4.6). In particular, the silt layer within the caisson is seen to move up, and
uniform movement is observed for the overburden sand. Movement is also seen in the
sand below the silt as before, but the zone of movement appears to larger. In fact, in all
three cases, whether the caisson tip is above, inside or below the silt layer, sand
movement in a conical zone below the silt is consistently observed. Note that no
significant sand movement is recorded in the adjacent regions. The conical zone is
interpreted as a zone of sand expansion (loosening) occurring below silt. This loosening
zone appears to be more significant than that in homogenous sand, where the
displacement field only extended to a relatively small depth below the wall tip (see
Figures 4.2 to 4.4). It is clearly larger in sand-silt soils, indicating that the loosening zone
extends deeper in these cases. The displacement of sand below the silt layer also
Chapter 4: Installation behaviour at normal gravity (1g)
MANH NGOC TRAN 4.7
indicates that the upward movement of the silt layer results in the transfer of suction to
the underlying sand, and this is believed to be the main reason for it to loosen. This will
be discussed further in Chapter 6.
It is seen consistently from the above results that the silt layer is lifted up when suction is
applied. It was discussed before that this is likely to be due to the creation of a pressure
difference across the silt layer, which is further explained here by the schematic diagrams
in Figures 4.8a and b. As the caisson approaches and penetrates into the low permeability
silt layer, a significant differential water pressure develops across the layer. While the
pressure on the lower interface remains relatively constant, possibly close to the
hydrostatic pressure, the pressure on the upper interface reduces due to the influence of
the suction pressure inside the caisson (see Figure 4.8a). This, as a result, creates a net
upward pressure, hence uplift force, that pushes the silt layer up (Figure 4.8b). Note that
the pressure on the upper sand-silt interface is only affected in the region within the
projection of the caisson wall; a differential pressure is hence only created in this zone.
No differential pressure, hence uplift force, was created across the silt layer outside the
caisson. This is indeed reflected in the recorded deformation of the silt layer, where no
movement is recorded in the silt layer outside the caisson. It is also worth noting that, in
these tests, very fast pumping was applied causing high suctions, thus large soil
displacement. In smaller pumping tests, where the suction pressure is lower, the
magnitude of the sand movement and silt deformation may be less. Nonetheless, the
generic soil deformation behaviour and the plug formation mechanism in these smaller
pumping cases are likely to be the same as those discussed above.
4.2.3 Summary
The soil deformation in both homogenous silica sand and sand-silt soil was investigated
directly using a half caisson model. The soil movements were traced using the particle
image velocimetry (PIV) technique. The following conclusions can be made:
In homogenous sand:
� The sand movement patterns were different for shallow (L/D of 0.1) and deeper
caisson wall embedment. For the first case, no soil deformation was observed
Chapter 4: Installation behaviour at normal gravity (1g)
MANH NGOC TRAN 4.8
towards the middle of the plug, while for the latter, fairly uniform movement was
recorded for the whole soil plug.
� When pumping was applied, most of the instantaneous sand heave was created by
volumetric expansion (loosening) of the sand. Negligible sand inflow was
observed, even in regions adjacent to the outer caisson wall.
� Larger displacements were recorded along the inner caisson wall. This may be
due to the higher hydraulic gradient (due to more critical flow path) along there,
which results in large upward movement of the sand, accompanied by dilation as
it shears against the inner wall, and loosening.
� The sand displacement extended to only a small depth below the caisson wall tip,
less than about 30% of the penetrated wall depth for these cases.
In layered sand-silt soil:
� Upward deformation of the silt layer was recorded in all tests, where the caisson
tip was above (but close to), inside and below the silt layer. The deformation
however, only occurred in the section of the silt layer within the projection of the
caisson wall.
� Quite uniform displacement was observed for the sand plug inside the caisson.
This is thought to be due to both the sand expansion and slight upward movement
of the silt in the case where the caisson tip is above the silt layer. However, where
the wall tip is inside and below the silt, the seepage is greatly reduced, and the
upward movement corresponds to a piston movement of the silt layer and the
overlying sand.
� Upward sand movement was seen below the silt layer, indicating that the upward
silt movement results in transfer of suction to the underlying sand. The movement
is likely due to volumetric expansion, since no significant displacement was
recorded in the surrounding regions, including those along the outer caisson wall.
� The zone of movement extended considerably further than in homogenous sand,
up to 100% of the penetrated wall depth in these cases. This indicates that soil
may loosen to a deeper depth below the wall tip in sand-silt soil.
Chapter 4: Installation behaviour at normal gravity (1g)
MANH NGOC TRAN 4.9
4.3 Installation in homogenous silica sand
4.3.1 Effect of pumping rate
Figures 4.9a to h show the test results where the caissons were installed by very slow and
very rapid pumping (or slow and fast installations). In this context, “slow” refers to the
pumping corresponding to a penetration rate of around 0.5 mm/s (or 1.8 m/hr) and below,
and “fast” for a rate of 6-7 mm/s (22 m/hr) and above. The slow pumping was created by
a minimum opening of the “pump control” butterfly valve, and the fast one was achieved
by fully opening the valve. In both cases, the pumping rate was relatively constant during
installation. All installations proceeded well, with no piping occurring. The installation
rate for each test can be seen in Table 2.4b. The marginal differences in the initial
penetration depth (less than 3 millimetres), as observed in some cases in Figure 4.9, were
caused by small disturbances created when manually closing the water evacuation valve
on the caisson lid. This nonetheless does not affect the observed trends, which are
consistent for various installations as seen in Figure 4.9. The results show that changes in
pumping rate clearly have a very significant influence on the suction pressure. Fast
pumping (which results in fast penetration, or fast installation) creates a sharp increase in
differential pressure, which can be twice as high as for the slow pumping in these tests.
This effect, however, requires a very significant increase in pumping rate, of almost 20
times higher. The differential pressures appear to vary quite linearly with wall
penetration depth, but at a slightly higher gradient for the fast pumping installations.
This behaviour was further checked by varying the pumping rate during installation. The
results obtained are presented in Figures 4.10a and b. Figure 4.10a shows the effect on
the differential pressure of a rapid change in pumping rate. In the test, pumping was
initially started at a rate similar to that of the slow installation shown in Figures 4.9a and
b. As expected, the resulting suction pressure trends are very close to each other. At a
skirt depth-to-diameter embedment ratio (L/D) of around 0.5, pumping was suddenly
increased to a very high value. An immediate jump in differential pressure occurred, with
the pressure subsequently following the trend in the previous fast pumping test. Figure
4.10b shows the response of the differential pressure where, instead of applying a sudden
change, the pumping rate was increased gradually from slow to fast during installation.
The suction pressure can be seen to change accordingly from the lower trend to the

Chapter 4: Installation behaviour at normal gravity (1g)
MANH NGOC TRAN 4.10
higher one, closely resembling previous data. The results once again confirm the
significance of pumping, or installation rate, on the resulting pressure difference across
the caisson base. It is also observed that, although pumping was applied in very different
manners (i.e. constant, sudden change or gradual change) and at different wall
penetration depths, the resulting suction values still remained similar for a given value of
pumping rate. In other words, the suction pressure reported here appears to be closely
related to the magnitude of the pumping rate (hence installation rate), and independent of
the sequence of changes in pumping rate.
Another interesting observation is that there seems to be a “lower bound” for the suction
pressure, i.e. below a certain threshold, no matter how much slower the installation is, the
suction pressure will not drop any further. Figure 4.11 compares the slow installation
seen previously in Figure 4.9a with another one where the penetration rate varies, but
remains below 0.5 mm/s. The results show that although the penetration rate is reduced
to as low as 0.04 mm/s (0.14 m/hr), which is almost 10 times lower than the highest rate
of 0.4 mm/s in Figure 4.11b, it does not create any recognisable changes or drop in the
resulting suction pressures, suggesting that there seems indeed to be a lower bound value
for the suction pressure required at any given penetration. The threshold for “lower
bound suction pressure” mentioned before appears to be around 0.8 mm/s for this case.
This is observed from the gradually increasing pumping installation, where the suction
pressure only starts to increase above that in the slow pumping case once the rate is
above 0.8 mm/s. Details can be seen in Figure 4.12. This threshold may, however, be
different for other geometries.
On the “upper bound” side, although the fast installation in this test series represents the
highest pumping that could be achieved with the current set-up, the test results, e.g.
Figure 4.10b, suggest that any upper limit has yet to be reached. Further results including
comparisons with different tests with a larger pumping range, and more discussion
regarding this upper bound value, as well as the general rate effect, will be presented in
sections 4.3.7 and 4.3.8.
4.3.2 Effect of surcharge
Figure 4.13 shows the installations where the 70 mm and 100 mm diameter caissons were
Chapter 4: Installation behaviour at normal gravity (1g)
MANH NGOC TRAN 4.11
installed under self-weight p/γ'D of 0.33 (or 2.6 N at model scale) and at various
surcharge levels (or increases in caisson weight above p/γ'D of 0.33). For the 100 mm
caisson, the results are compared for both slow (i.e. “lower bound suction”) and fast
installations. It has been shown before that while the suction pressure in slow installation
is not very much affected by the rate as long as it is below a certain threshold, it is
closely related to the magnitude of pumping in fast installations. Hence, to enable
comparisons between fast installations with different surcharge, the pumping rates, or
penetration rates, were kept similar in these tests so that the effect caused by different
pumping could be eliminated. It is seen from Figure 4.13 that, in all cases, the increase in
the caisson effective weight by adding more surcharge reduces the required differential
pressure for a given penetration depth. Apart from an unexpected increase in pressure
towards the end of the caisson installation with surcharge ∆p/γ'D of 0.25 (or 4.6 N
caisson weight) in Figure 4.13b, the rest of the data show a consistent trend in suction
reduction with increasing level of surcharge. These results are in good agreement with
previous observations by Tjelta (1995), Erbrich and Tjelta (1999).
The suction pressures are observed to increase quite linearly with depth, and the response
curves appear to be quite parallel to each other, i.e. the shape of the curves are quite
similar for installations with different surcharge. This suggests that changes in the
caisson effective weight, while resulting in variations in the magnitude of the required
suction pressure, do not seem to alter the general suction pressure trend. Comparison of
results in Figures 4.13b and c also shows that for a given surcharge (or 1.5 N at model
scale in this case), the pressure reduction ∆p/γ'D in the 70 mm caisson is higher than in
the 100 mm case. This is consistent with the force-pressure conversion trend (e.g. 1 N
converts to a ∆p/γ'D of 0.26 in the 70 mm caisson, but only 0.13 for the 100 mm one).
Back calculations of the force reduction due to the added surcharge yield mixed results.
The average pressure drops in Figure 4.13b and c suggest an equal, or larger, force
reduction compared with the added weight, while results in Figure 4.13a show otherwise,
indicating that the reduction is lower. It is difficult to make a firm conclusion based on
these results because only slight differences in the suction pressure drop could lead to an
opposite conclusion. However, it is believed that the reduction in the required suction
force should be lower than the added weight amount, especially under higher soil stress
Chapter 4: Installation behaviour at normal gravity (1g)
MANH NGOC TRAN 4.12
condition. Further reasoning will be presented in Chapter 5. Nonetheless, it is clear that
the increase in the caisson effective weight by adding surcharge lowers the required
suction pressure.
4.3.3 Effect of caisson geometry
The effect of the caisson wall thickness and sizes is investigated in this section by
comparing caissons of the same diameter but different wall thickness; then comparing
caissons of the same thickness ratio, but different diameters (i.e. one caisson being a
scaled copy of the other); and finally comparing all of them. The caissons were of the
same self-weight (2.6 N), and were installed at a similar slow rate. This was intended to
eliminate any effects caused by different caisson weights (which form part of the driving
force) and rapid installations, allowing any changes in suction pressure to be evaluated
solely as due to differences in geometry. Figure 4.14 shows the installation results of two
caissons of the same 80 mm internal diameter, but different wall thicknesses. As shown,
the caisson with larger t/D requires higher suction pressure for penetration. Note that as
the rest of the geometry and installation conditions in the two cases are similar, this
suction increase is believed to be required to overcome the increase in end bearing due to
the larger wall tip area. However, this increase is only marginal. The required pressure
for a caisson with thickness ratio (t/D) of 2% is on average only about 10-15 % more
than that for the thinner-walled caisson, in spite of a 100% increase in t/D (i.e. twice the
thickness).
The influence of absolute caisson size on the differential pressure can also be seen in
Figure 4.15. Installation results of the 100 mm and 70 mm diameter caissons, both with
the same thickness ratio t/D of 0.5 %, show that the required suction pressures for a given
normalised penetration depth L/D are almost identical for the two cases. The similarity in
their magnitudes seen here may, however, be just a coincidence for the tested caisson
weight. If a different self weight is chosen, say, 3.6 N (i.e. 1 N surcharge is added), the
suction pressure in the smaller diameter 70 mm caisson may drop below that of the 100
mm one due to the force-pressure conversion discussed before. To compare further the
effect of both size and wall thickness, the suction pressures in Figure 4.14 and 4.15 are
plotted together, and shown in Figure 4.16. The results once again indicate that for the
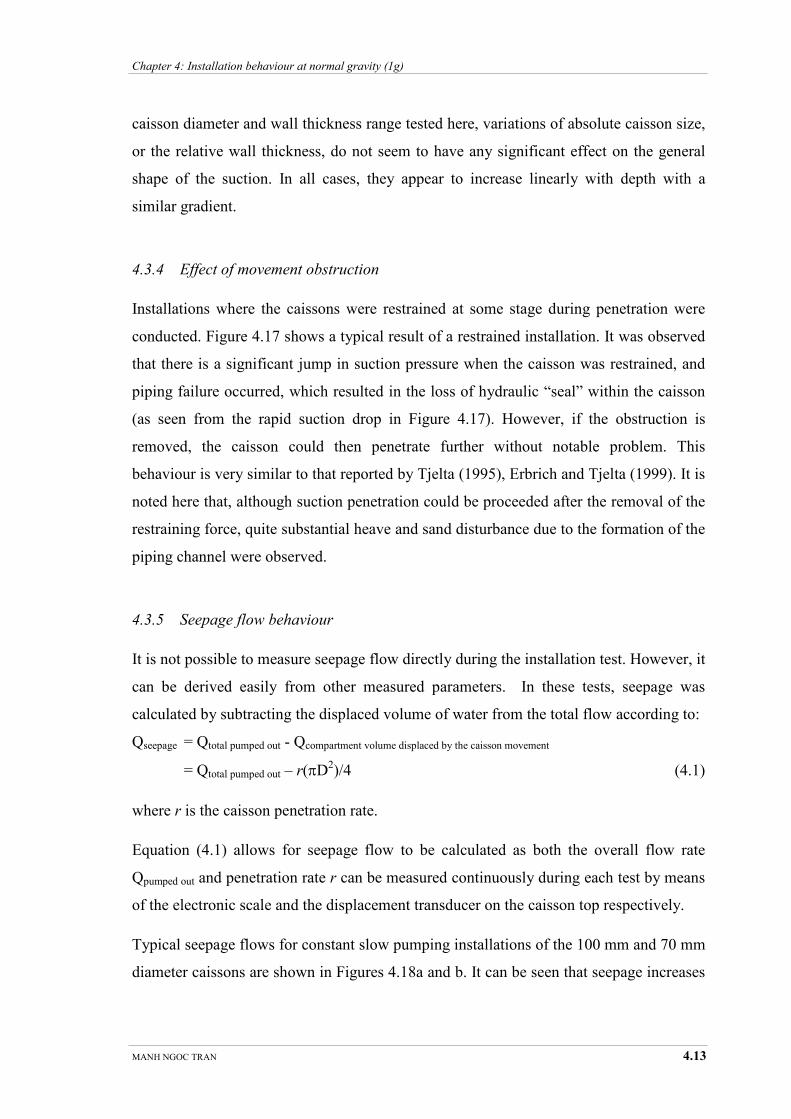
Chapter 4: Installation behaviour at normal gravity (1g)
MANH NGOC TRAN 4.13
caisson diameter and wall thickness range tested here, variations of absolute caisson size,
or the relative wall thickness, do not seem to have any significant effect on the general
shape of the suction. In all cases, they appear to increase linearly with depth with a
similar gradient.
4.3.4 Effect of movement obstruction
Installations where the caissons were restrained at some stage during penetration were
conducted. Figure 4.17 shows a typical result of a restrained installation. It was observed
that there is a significant jump in suction pressure when the caisson was restrained, and
piping failure occurred, which resulted in the loss of hydraulic “seal” within the caisson
(as seen from the rapid suction drop in Figure 4.17). However, if the obstruction is
removed, the caisson could then penetrate further without notable problem. This
behaviour is very similar to that reported by Tjelta (1995), Erbrich and Tjelta (1999). It is
noted here that, although suction penetration could be proceeded after the removal of the
restraining force, quite substantial heave and sand disturbance due to the formation of the
piping channel were observed.
4.3.5 Seepage flow behaviour
It is not possible to measure seepage flow directly during the installation test. However, it
can be derived easily from other measured parameters. In these tests, seepage was
calculated by subtracting the displaced volume of water from the total flow according to:
Qseepage = Qtotal pumped out - Qcompartment volume displaced by the caisson movement
= Qtotal pumped out – r(πD2)/4 (4.1)
where r is the caisson penetration rate.
Equation (4.1) allows for seepage flow to be calculated as both the overall flow rate
Qpumped out and penetration rate r can be measured continuously during each test by means
of the electronic scale and the displacement transducer on the caisson top respectively.
Typical seepage flows for constant slow pumping installations of the 100 mm and 70 mm
diameter caissons are shown in Figures 4.18a and b. It can be seen that seepage increases

Chapter 4: Installation behaviour at normal gravity (1g)
MANH NGOC TRAN 4.14
initially with deeper penetration, indicating that the increase in cut-off wall length (and
thus average length of flow path) does not fully compensate for the greater suction
pressure that induces more seepage. After some stage, at L/D of about 0.5-0.6 in this
case, seepage appears to reach a terminal value, and remains relatively constant, or with a
very modest increase afterwards. The seepage behaviour during faster installation was
also investigated. Figure 4.19 shows typical seepages for fast installations. It is seen that
the trend is similar to that in the slow cases, but the values are much higher. Figure 4.20
presents results where the pumping rate was suddenly increased during penetration (the
suction pressure response for this installation was shown previously in Figure 4.10a). The
effect is an almost immediate response in the seepage, with the seepage flow jumping to
a very high value. Figure 4.21 compares the ratios between seepage flow and total
pumping for typical slow and fast installations. It can be seen that although the seepage
during fast installation is higher in terms of absolute values (Figures 4.18a and 4.19a), it
is lower when compared as a percentage of the total flow. Figure 4.21 shows that in fast
installation, the seepage flow rate is only about 8-9% of the total pumping rate. However,
in slow installation, the seepage can be up to 35-40% of the total pumping flow. The
results indicate that, in fast installation, most of the pumping is to remove the water
volume in the caisson compartment, while in slow installation, it includes both the
displaced water volume, and a significant proportion of seepage.
Typical seepage results, normalised against suction head H = p/γw, caisson diameter D
and permeability k, are shown in Figure 4.22. The data include the seepage flow derived
from both slow and fast pumping tests. The same value of permeability k = 1.0 × 10⁻⁴ m/s
(typical for sand with Dr of 91%) was used for all sets of results, i.e. ignoring any
potential change due to loosening of the sand. As seen, there is quite good agreement
between the normalised seepage values in the slow installations, including the two “lower
bound” suction installations of the 100 mm diameter caisson with normalised weights
p/γ'D of 0.33 and 0.59 (or 2.6 N and 4.6 N respectively). The theoretical seepage
response (details are given later in Chapter 7) shows a similar trend, but slightly lower
values. In fast installations, the normalised seepage is, however, considerably higher than
that for the slower ones, suggesting that assuming a constant permeability for both
installation cases may not be suitable. Instead, a higher (average) permeability value may
be inferred.
Chapter 4: Installation behaviour at normal gravity (1g)
MANH NGOC TRAN 4.15
4.3.6 Internal heave
The formation of excessive sand heave inside the caisson compartment as a direct result
of seepage flow through sand, including any localised piping, is one of the key indicators
of the success or failure of the installation process. In this study, sand heave was
monitored on video during installation, aiming to explore and understand the effect of
changing installation conditions on the amount of sand heave. At any time, heave was
taken as the difference in height between the inside and outside sand surfaces. It was
observed that the sand plug formed quite uniformly during the tests, and there was no
notable movement of the outside sand surface during installation. A typical heave
observation taken from these videos during penetration can be seen in Figure 4.23.
Figure 4.24a shows the typical sand heave recorded from the slow and fast installation of
the 100 mm diameter caisson. Figure 4.24b compares the resulting sand heave during
slow and rapid installations for various caisson geometries. In all but the thickest walled
case (t/D of 2 %), sand heave is significantly less for the quicker installation, suggesting
that, in these tests, fast installation is in fact better than slow installation in preventing
heave. It also appears from the results that increasing the caisson wall t/D ratio tends to
reduce this beneficial effect, with almost no difference in the resulting sand heave from
fast and slow installation of the caisson with t/D of 2 %.
The rate of sand heave also appears to vary with the caisson wall penetration depth.
Figure 4.25 shows the results for various installations, plotting the average incremental
sand heave as a ratio of the incremental wall penetration. The results, calculated for every
20 mm wall embedment depth, show that for caissons with t/D of 1% or less, sand heave
formation increases with increasing penetration (although the trend slows down towards
the end), indicating that higher proportion of the total resulting sand heave is likely to
form during the later stages of installation. However, this appears not to be the case for
the caisson with t/D of 2%, where very high incremental heave ratios were observed from
the beginning, and remained relatively constant throughout installation. This shows that
for thicker-walled caissons, sand heave appears to increase quite linearly with the wall
penetration depth.

Chapter 4: Installation behaviour at normal gravity (1g)
MANH NGOC TRAN 4.16
Surcharge also has an important impact on heave formation. Figure 4.26a shows test
results of similarly fast installations using the 100 mm diameter caisson, where different
levels of surcharge were used (the suction pressures for these installations were shown
previously in Figure 4.13b). Figure 4.26a shows that the use of surcharge appears to
improve the installation performance by reducing sand heave formation. At a penetration
depth L/D of 0.8, while the recorded sand heave for a caisson with no surcharge was as
high as 6 % of the skirt penetration, this was reduced by almost 3 times to as little as 2 %
with ∆p/γ'D of 0.25 (2 N) surcharge. The difference, however, tends to reduce at greater
penetrations (after L/D of 0.8 in this case). It also appears that the amount of reduction in
sand heave is quite consistent with the increment in the level of surcharge used, with the
heave observed in the test with ∆p/γ'D of 0.13 (1 N) surcharge lying about midway
between the heave values from self-weight alone and with ∆p/γ'D of 0.25 (2 N)
surcharge. A similar result is also found for the ∆p/γ'D of 0.19 (1.5 N) surcharge case.
The general heave reduction trend here is consistent with the decreasing suction
pressures, shown in Figure 4.13b, and the reduction in the absolute seepage amount
shown in Figure 4.26b.
The effect of wall thickness on sand heave formation is investigated further with results
shown in Figure 4.27. It is noted again that operating conditions such as the installation
rate and self-weight were kept similar to minimise their influence on the results obtained.
The installation rates here were 0.4 mm/s on average, and the self-weight was 2.6 N. The
results show that for shallower L/D (up to about 1 here), the heave ratio (ratio of sand
heave h to wall penetration L) increases quite rapidly with penetration. However, this
ratio levels out and remains relatively constant for greater penetration depths. It is also
seen that the caisson wall thickness has a significant effect on the resulting sand heave
with much higher heave recorded for thicker-walled caissons. For similar installation
conditions, sand heave resulting for a caisson with t/D of 2% is several times higher than
for a caisson with t/D of 0.5 %, particularly for penetration depths L/D < 1. If it is
assumed that all the sand displaced by the caisson wall moves into the caisson interior
(i.e. moves in the seepage flow direction) and only effective heave values are compared,
the heave differences are then significantly reduced as seen in Figure 4.27. As discussed
above, the effective sand heave is calculated by subtracting the penetrated wall volume
Chapter 4: Installation behaviour at normal gravity (1g)
MANH NGOC TRAN 4.17
from the total recorded heave volume. For the installations reported here, the effective
heave ratios appear stable for L/D of over 1, with the h/L remaining within the range of
11-14 %.
As mentioned before, it was generally observed that there were insignificant
displacements of the sand surface near the caisson outer wall, even in cases where there
were large heaves inside the caisson, for example in the thick-walled t/D of 2% caisson
installations. Only small conical depressions around the outside of the caissons were
seen. These observations suggest that the amount of sand flowing into the caisson during
installation is not significant (otherwise, large soil depressions around the caisson should
have been observed, especially where there is large heave such as in the thicker-walled
case). This is consistent with the results recorded in the PIV tests, which indicated that
the majority of the effective heave (i.e. minus the wall volume) forming during
installation was due to plug expansion, and not sand inflow. All recorded sand plugs
were stable, i.e. the heave height did not reduce after the test. It was also observed that in
the fast installations, no piping channel developed, demonstrating that for the test
conditions and soil type, rapid pumping could be used. In fact, fast installation was also
found possible in previous field trials, where installation rates of up to 5 mm/s (18 m/hr)
was applied without any notable problems (Hogervorst, 1980).
4.3.7 Comparison with Oxford 1g test results
1g installation tests were also conducted by the author at the University of Oxford, and
the results of these tests are presented in this section. The test set-up and the guide system
were similar to that in this study (which was described previously in Section 2.6). The
steel caisson used in the experiment was 150 mm in diameter, with a wall thickness of
around 1.5 mm (t/D of 1%). The maximum wall length was also 150 mm. However,
larger pumping rates could be achieved by connecting the pumping hose (10 mm internal
diameter) to a vacuum chamber. By varying the vacuum level, and the degree of opening
of the butterfly valve, a large range of pumping rates could be simulated. The suction
pressure was measured using a pair of pressure transducers, one inside the caisson, the
other attached outside on the lid. The installations were conducted in dense Redhill 110
sand, with d50 of 0.12 mm, γsat of around 18 kN/m3, and k of 1.5 × 10
-4 m/s. Other sand
Chapter 4: Installation behaviour at normal gravity (1g)
MANH NGOC TRAN 4.18
properties were reported by Kelly et al. (2004). Figure 4.28a shows the results where the
caisson was installed at a wide range of penetration rates, which are shown accordingly
in Figure 4.28b. The highest pumping seen in Figure 4.28 represents the fastest pumping
available with this set up, using full vacuum (-100 kPa) and full opening of the flow
control valve. The irregularities in suction pressure for higher speed installations may be
caused by the friction in the guide rod. Nonetheless, it is clear from the results that
suction pressures are indeed dependant on the installation rate, which agrees with the
results discussed earlier.
Figure 4.29 plots the average increase in suction pressure against the increase in
penetration rate. The Ox-150-1 test (the lowest line in Figures 4.28a and b) was chosen as
the “base” case. The results show a relatively linear relationship between them. The
results also do not seem to show that an upper limit for suction pressure has been
reached. However, a lower bound value for suction pressure was recorded. Figures 4.30a
and b show the results where the caisson was installed at different rates under 0.3mm/s.
In one case, the rate was varied between 0.04 mm/s and 0.13 mm/s during installation.
Despite these variations, Figure 4.30a shows no recognisable changes in the suction
pressures as a result, suggesting that differences in rates do not appear to affect the
suction pressure in these installations. This is once again very consistent with previous
results in Section 4.3.1, confirming that there is indeed a lower limit for suction pressure.
The rate threshold for this to occur was however not investigated in this test series.
Figure 4.31 shows the comparison between the “lower bound” suction here with that in
the UWA 1g test discussed previously. It can be seen from the results that although the
Oxford result gives a slightly higher normalised suction, the suction pressure gradients
are almost identical for the two cases. Since the pressure here is normalised against the
soil unit weight γ', the similarity in the responses suggests that γ' may be an important
parameter. This will be investigated in more detail in Chapters 5 and 7.
4.3.8 Discussion
It has been observed in this study that the suction pressure can vary with installation rate.
Considering that the suction pressure is related to the soil resistance at each stage, the

Chapter 4: Installation behaviour at normal gravity (1g)
MANH NGOC TRAN 4.19
results indicate the sand resistance at any wall embedment is not unique, but increases
with faster installation rates. A possible explanation is that in faster pumping
installations, the seepage is higher, thus increasing the soil effective stress on the external
caisson wall. This increases the outside skin friction, and results in a higher resistance,
hence higher suction pressure as seen. While this line of argument seems reasonable,
especially from the test results that show seepage was indeed higher during faster
pumping installations, it cannot explain what causes the high seepage that occurs
immediately after pumping commences. Note that seepage is induced by the suction
pressure, the higher seepage must be the direct result of the higher suction. In other
words, higher suction pressure (hence higher soil resistance) must exist first. Hence, there
is likely to be a different mechanism that causes higher sand resistance, at least
immediately after pumping.
Although the true causes are not yet fully understood, a possible reason that may be
important is the transient, time dependent effect on the generation of pore pressure and
any subsequent sand loosening. It is known that the penetration resistance (both tip and
skin) is a function of the effective stress, which is affected by the change in the pore
pressure, and subsequent sand loosening (if any). Hence, different changes in pore
pressure and sand loosening at a specific wall depth are likely to result in different levels
of soil resistance obtained. Practically, it may take a certain amount of time, although this
will be small in sand, for the seepage flow net to fully develop. Even so, the created
seepage flow still requires time to mobilise the sand particles to reach a final stable
loosening state (corresponding to that seepage value). This is similar to the observation
that sand loosening propagates progressively up, rather than occurring by spontaneous
expansion, when a saturated sand column is subjected to upward seepage (Vardoulakis,
2004). In other words, changes in pore pressure and subsequent loosening (that lead to
changes in the soil resistance) as a result of the generated seepage are unlikely to reach
their final states instantaneously. This time effect in turn influences the penetration
resistance. The faster the installation is, the less time is available for the pore pressure
generation and any subsequent sand loosening to occur. This, in turn, results in less
reduction in soil effective stress, causes larger penetration resistance, and hence higher
suction pressure at a certain wall depth.

Chapter 4: Installation behaviour at normal gravity (1g)
MANH NGOC TRAN 4.20
The time effect on any subsequent loosening, which was observed by Vardoularkis
(2004), is also consistent with the observation that no piping channel developed in fast
installations despite very high suction pressure. The reason is possibly because at a
specific wall depth, there is insufficient time for mobilising the sand particles, thus piping
channels to form, while at the same time the caisson penetrated rapidly into new soil.
This is also consistent with the PIV observations that no instantaneous sand movement
was observed in regions along the outer caisson wall, where piping channels would form,
despite the high suction pressures applied.
The observation that below a certain penetration rate threshold, suction pressure does not
vary with rate suggests that in those cases, similar soil resistance has been obtained. For
these cases, it may be argued that sufficient time was available for seepage to create a
stable hydraulic set-up and loosening condition. Even if more time is allowed by slowing
down the installation, the effect of seepage on the soil remains relatively unchanged
because stable conditions are developed, which results in a single value of soil resistance
for a specific wall depth. The above threshold is likely to be related to the time to create a
stable seepage flow net in the soil, which will be a function of the sand consolidation
coefficient cv.
An interesting question is how the suction pressure would respond when the installation
is extremely fast, and whether there is an upper limit for the suction increase. In this case,
the upper limit for suction is probably similar to the pressure required to jack the caisson
into soil (i.e. there is no influence of the ground water field). This, however, requires
verification from further experiments.
The variation in sand heave observed in fast and slow installations is also puzzling. In
faster installations, higher suction pressures and higher absolute seepage flows were
obtained. It is therefore expected that the resulting sand heave would also be larger as
this is directly influenced by the seepage body force. However, the test results show quite
consistently the opposite, that heave is lower in faster installations (apart from the thick-
walled caisson with t/D of 2%). This unexpected result leads to the suggestion that
consideration of seepage alone may not be sufficient in determination of sand heave
formation. Rather it may be a combination of a number of factors that affect the heave. In
faster installations, although the overall calculated seepage is larger, it does not
Chapter 4: Installation behaviour at normal gravity (1g)
MANH NGOC TRAN 4.21
necessarily mean that the flow is uniformly distributed throughout the whole plug, which
of course if true would tend to suggest increased risk of piping, and greater resulting sand
heave. Rather, a large proportion of the total seepage may flow along the wall-soil
interface, because this is the shortest and most critical flow path, and as a result is likely
to loosen sand more in this region (i.e. sand permeability here will be higher). This
localised effect makes the remaining part of the flow, through the bulk of the soil plug,
less significant, and hence minimises its effect on heave formation. The fast penetration
of the wall may also help reduce heave by preventing sand inflow, and possibly forcing
some of the displaced sand outwards. The time effect on subsequent sand loosening
discussed before may also further contribute to the prevention of sand heave.
4.3.9 Summary
This 1g test series has revealed that the suction pressure is rate dependant when the
installation rate is faster than a certain threshold. Below this rate, however, the suction
pressure appears to be unique for a given geometry and surcharge. Although this
behaviour is not yet fully understood, it is thought that it may be caused by the time
necessary for the seepage flow net to be established and any subsequent sand loosening.
Variations in the caisson diameter and wall thickness within the range used here do not
seem to change the general shape and trend of the suction pressure. In all cases, the
suction pressures increase quite linearly with depth, following a very similar gradient
despite differences in the geometry. The use of surcharge lowers the required suction
pressure at a given wall embedment depth, but does not appear to change the shape of the
suction pressure response. Surcharge also tends to lower the amount of sand heave, a
trend which was observed in all installations. In this study, fast pumping installation
could be achieved without any negative effects. The tests also demonstrate that the
installation of long caissons with L/D of up to 2 is possible in dense sand, but a large
amount of heave may occur, especially at deeper wall embedment.
Chapter 4: Installation behaviour at normal gravity (1g)
MANH NGOC TRAN 4.22
4.4 Installation in layered sand-silt soil
The following section investigates the influence of a silt layer on the suction installation.
Note that all tests were conducted using the 100 mm caisson with 2.6 N self-weight.
Physically, the saturated silica flour (silt) layer was considerably “harder” than the sand,
possibly due to its greater dilational characteristics. This is also evident from the cone tip
resistance in the centrifuge, which will be shown and discussed later in Chapter 6. The
tested soil profiles were shown previously in Chapter 2 (Figure 2.17). It is also noted that
the submerged unit weight γ' of the tested sand and silt were found to be quite similar,
around 10 kN/m3.
4.4.1 Layered soil with surface silt layer
Installations were conducted for the soil profile shown in Figure 2.17a, using both slow
and fast pumping. For slow installation (around 0.1-0.4 mm/s), especially when the
caisson wall was still within the silt layer, penetration could not be achieved, and piping
failure occurred. The corresponding suction pressures are shown in Figure 4.32, where
the slow installation was attempted 3 times. For each attempt, a large jump in suction
pressure is observed, followed by a quick drop afterwards. This drop coincides with the
occurrence of the piping failure, indicating the loss of pressure seal in the caisson
compartment. The large jump in suction pressure, which created piping, shows that
significant driving force is required to penetrate the caisson in this case.
Installation was, however, possible when fast pumping was applied (the possible reasons
will be discussed later in this chapter). The suction pressure recorded during the fast
installation test (~6-7mm/s) is shown in Figure 4.33. The soil profile is the same as
before (Figure 2.17a). The required suction pressure for similar installation in
homogenous sand is also included for comparison. The results show that the presence of
the silt layer on top of sand clearly influences the installation behaviour. The suction
pressure in this case is significantly higher than that for homogenous sand, consistent
with the expectation that the hydraulic blockage created by the silt reduces the seepage
gradient and hence the reduction of the soil effective stress in the underlying sand. As a
result, the penetration resistance increases. During the initial penetration, the suction
Chapter 4: Installation behaviour at normal gravity (1g)
MANH NGOC TRAN 4.23
pressure increases relatively linearly with depth, before dropping to a lower level at L/D
between 0.4 and 0.5. This drop is likely to be created by a reduction in the hydraulic
blockage caused by the silt. Indeed, it occurred at the same moment where silt scourings
along the caisson wall were observed, followed by a significant flow of water emerging
from below the silt layer. This, however, did not cause any penetration disruption. The
pressure is then seen to increase slowly with penetration, before suddenly increasing to
very high value at L/D of 0.7 and greater. Note that the internal plug did not touch the
caisson lid until L/D of around 0.8, so the increase in suction pressure between L/D of
0.7 and 0.8 is not the result of contact between the plug and the caisson lid. Rather, it
may indicate that the caisson installation could be close to a penetration refusal limit for
this particular case. This, however, may require further test investigation.
It was also observed that there were some disturbances at the interface between the silt
and sand during installation. This was also often seen at the base of the silt in other sand-
silt installation tests (described later in Section 4.4.3). However, a large disruption of the
silt layer, as occurred in the test shown in Figure 4.33, leading to significant upward
water flow at the inner wall-soil interface was not common. It is possible that local
weaknesses in the silt layer (where the disruption in the layer was observed) may have
been caused by disturbance to the surface of the silt layer when manually closing the
water evacuation valve on the caisson lid. Nonetheless, the results here have clearly
illustrated the flow blockage effect of the silt layer during installation, which causes a
significant increase in the required suction pressure to penetrate the caisson in the
underlying sand.
4.4.2 Layered soil with silt layer below the surface
This section explores the installation behaviour when the silt layer is inter-bedded in the
middle of sand. Figure 4.34 shows the slow installation result in soil profile 2 (Figure 2.
17b). The average penetration rate in this case is around 0.3-0.4 mm/s. A similar slow
installation result in homogenous sand is also shown in the graph for comparison. It can
be seen that the suction pressure during penetration in the upper sand layer is almost
identical to that in the homogenous case. However, as the caisson approaches the silt
layer, the suction pressure starts to increase at L/D from 0.2 to 0.25. There could be
Chapter 4: Installation behaviour at normal gravity (1g)
MANH NGOC TRAN 4.24
several reasons for this observation. It could be caused by different head loss
distributions and seepage restrictions due to the decreasing gap between the wall tip and
the low permeability silt layer, or increased caisson penetration resistance due to the
stiffer response of the silt layer, or a combination of both.
When the caisson reaches the silt layer at L/D of around 0.25, a large jump in suction
pressure is observed, showing that a large driving force is required to penetrate the silt
layer. It was seen from the test that during this stage, a localised piping channel started to
form along the wall, and eventually led to piping failure. This is also clearly reflected by
the sudden drop in suction pressure. Silt traces were seen in the caisson compartment
during this piping failure, indicating that scouring in silt indeed occurred (note that the
top soil was sand in this case). The pumping was then stopped, and attempts to re-start
the installation by slow pumping were not successful and still created piping failure.
Figure 4.35 shows another installation in a similar soil profile. As shown, the results
obtained are quite similar, where the suction pressure was initially close to slow
installation in homogenous sand, and jumped to a high value when the caisson penetrated
into silt, followed by localised piping failure. At this stage, the suction installation
process was stopped and re-started by applying rapid pumping instead of slow as
previously (the fast installation rate was about 4-5 mm/s). Unlike re-starting the
installation by slow pumping, the caisson penetrated into the soil in this case. Figure 4.35
shows the suction pressure significantly higher than for similar fast installation in
homogenous sand. This is consistent with the previous observations from installation
where the silt layer was on the soil surface.
The suction pressure from an installation where fast pumping was applied from the
beginning can be seen in Figure 4.36. The soil profile for this test is illustrated in Figure
2.17c (the depth of the silt layer for this case is a bit shallower than the cases in Figures
4.34 and 4.35 above). It was observed that there was no piping failure in this case, and
the caisson could penetrate well into the soil. It can be seen from Figure 4.36 that the
suction pressure increased quite linearly with depth, before rapidly jumping to a high
value as the caisson penetrated through the silt. After reaching a peak at wall embedment
depth L/D of around 0.2, it then declined sharply, and continued to increase linearly with
depth afterwards. It is noted that the pressure peak and rapid decline occurred while the
Chapter 4: Installation behaviour at normal gravity (1g)
MANH NGOC TRAN 4.25
caisson wall tip was still within the silt layer, indicating significant changes in the
penetration resistance during that period. Discussion of possible reasons for this
observation are presented later in Chapter 6.
The above results are plotted together with that for a surface silt layer and installations in
homogenous sand in Figure 4.37. In general, the suction pressures are seen to increase
quite linearly with depth, but at a higher gradient when silt layers are present. The results
also show that the required suction pressures for penetration in sand below a silt layer are
significantly higher than those in the homogenous sand, on average about 2 to 2.5 times
more in this study.
4.4.3 Internal heave
In all installations with the silt layer, either on the surface or embedded within sand, large
sand heaves were observed, on average about 12-20 % of the penetration wall depth at
L/D of about 0.8. These are considerably higher than those in similar installations in
homogenous sand, which ranged from 5-8 % at the same penetration. During the tests, as
the internal plug moved upward, soil disturbance in the form of regions of mixed sand
and silt, and small water pockets were observed at, and below, the sand-silt interface.
However, complete separation of the silt layer from the underlying sand was not
observed at any stage during the installation. Scouring of silt along the inner caisson wall
was also seen.
At the end of the test, when pumping was terminated, a small amount of water from
below the silt layer was seen to continue to flow up into the caisson compartment through
the scoured channels in the silt along the caisson wall (for 4-5 seconds). This suggests
that a pressure balancing process across the silt layer was occurring, which was indeed
evident from the gradual reduction in suction pressure over 20 seconds shown in Figure
4.38. For comparison, the pressure balancing normally took less than 4 seconds in
homogenous sand. The heave was observed to reduce during the period of suction
reduction, creating a gap of 3-6 mm between the soil surface and the caisson lid. This
suggests that soil in the region below the silt layer is very loose and unstable. As noted
above, there were also some water pockets formed during the installation process.
Chapter 4: Installation behaviour at normal gravity (1g)
MANH NGOC TRAN 4.26
4.4.4 Discussion
It was observed in these tests with silt layers that fast pumping helped penetrate the
caisson through the silt layer, while slow pumping was ineffective and resulted in piping
failure. The reason for the success of fast pumping installation is believed to be due to the
time required for the development of piping channels, and the available driving force
during that stage. As previously discussed, it takes a certain amount of time for a piping
channel (leading to piping failure) to develop. In slow pumping, as the caisson penetrates
into the hard silt layer, the large suction pressure required starts to induce soil scouring
and a piping channel. Because of the slow motion of the caisson wall, the wall does not
provide sufficient increase in effective wall cut-off to prevent piping from occurring. In
other words, the piping channel is allowed enough time to develop, leading to subsequent
piping failure. However, in rapid pumping, this is not the case. The large available
driving “thrust” to quickly penetrate the caisson through the silt layer into new soil
effectively cuts off the formation of piping channels when these start to form, or even
does not allow enough time for them to occur altogether. As a result, the caisson
penetrates into the soil without piping failure being observed. This is similar to the fast
installations in homogenous sand seen before, where the suction pressure was very high
but there was no piping failure.
It has been observed before that a small amount of water still flowed into the caisson
interior from below the silt even after pumping was stopped. A question arising from this
observation is where this water came from. There appear to be two possible sources:
continuing seepage flow induced by the net suction pressure remaining in the caisson
(Figure 4.38), or the extra water originating from the soil due to the changes in void ratio.
Note that because pumping has already been stopped, water inflow due to continuing
seepage from the outside is not the cause. Therefore, the upward water flow seen here
must emerge from the soil below the silt layer. The observed water pockets below the silt
are obvious sources, but a further contribution to the total upward flow may come from
the sand below the silt layer itself as a result of the reduction in void ratio. This is
consistent with the observation that sand heave was seen to reduce gradually with time,
and once again suggests that the soil below the silt layer is indeed very loose and
significantly disturbed. The hypothesis is consistent with the previous PIV results, where
Chapter 4: Installation behaviour at normal gravity (1g)
MANH NGOC TRAN 4.27
significant sand loosening was observed below the silt layer (reflected in the zone with
large sand displacement recorded).
4.4.5 Summary
It was found here that the hydraulic blockage created by the silt layer has a significant
effect on the caisson response during installation. The required suction pressure to
penetrate the caisson in sand below the silt layer is significantly higher than in the
homogenous sand case, by almost a factor of two in this study. The possible reason for
this is the effect of the hydraulic blockage of the silt on the underlying sand, and will be
discussed in more details in Chapters 6 and 7 of this thesis. In penetration in sand above
the silt layer, the pressure appears to increase slightly as the caisson wall tip approaches
the layer. Some scouring of silt along the caisson wall was observed in the tests. Soil
disturbances and small water pockets at the lower silt-sand interface were also seen. Slow
installations (~ 0.3-0.4 mm/s) could not penetrate the caisson through the hard silt layer,
and piping failure occurred. However, penetration was possible in faster installations (~
4-5mm/s). This was thought to be because, in this case, insufficient time was available
for the development of a piping channel in the silt (similar to that in fast installation in
sand discussed previously). In addition, the penetration was further facilitated by the
availability of higher “thrust” to penetrate the silt. In all cases, a large amount of heave,
about 2-3 times higher than in homogenous sand, was observed. The soil plugs were
unstable, with the heave heights observed to reduce after pumping was terminated.
4.5 Conclusions
The experimental study presented in this chapter has explored the caisson behaviour
during installation in sand and layered sand-silt soil at normal gravity. In general, it was
found that the model suction caissons with Lmax/D of up to 2 could be installed in very
dense sand by either slow or fast pumping. Above a certain installation rate threshold, the
suction pressure will be rate dependent, where faster pumping resulted in higher suction.
An upper limit for the suction increase with pumping rate was not observed in the tests.
Below that threshold, a “lower bound” suction was, however, observed. During
Chapter 4: Installation behaviour at normal gravity (1g)
MANH NGOC TRAN 4.28
installation in sand, significant sand heave, especially in longer and thicker-walled
caissons, could result. The majority of the effective heave (i.e. minus the caisson wall
volume) is likely due to sand plug expansion (loosening), not sand inflow. In soils where
there was a layer of low permeability silt inter-bedded with sand, the installations were
possible with sufficiently fast pumping. However, problems during installation were also
recorded in the tests, including piping failure in slow installation, and the creation of
large and extremely unstable sand heave.
So far, the tests presented in this chapter have revealed important caisson generic
responses that can be expected in similar installations at larger scale. However, care
should be taken in further interpretation of the 1g results here, such as extrapolation of
the results to prototype scales. In these cases, as discussed previously in Chapter 2, such
interpretations are often complicated by differences in soil-structure interaction response
due to the stress dependant behaviour of the soil, as shown by Allersma et al. (1997).
Nonetheless, the caisson behaviour in the 1g tests here can be compared with other test
results at high soil stress levels to help draw more general conclusions. This is covered in
the following chapters of this thesis.
MANH NGOC TRAN 5.1
Chapter Five
Chapter 5
Centrifuge Modelling: Installation
Behaviour in Homogenous Sand
5.1 Overview
The expected caisson response during installation in homogenous dense sand was
investigated previously through small scale models tested under low soil stress
conditions, as described in Chapter 4. However, the low soil stress levels can affect the
installation response due to the stress dependent behaviour of soil. This chapter presents
results from investigations of the suction installation process through a series of tests at
higher soil stress levels, similar to those in the field, by means of centrifuge model tests
conducted at 100g. Initially, the installation in silica sand is examined, using the same
type of sand that was used in the previous 1g tests. Direct comparisons with jacked
installation, where no sand loosening due to seepage occurred, and comparisons with the
1g results are also made. The investigation is then extended to uncemented calcareous
sand from the North Rankin site, and “artificially” mixed soils with 10%, 20% and 40%
fines contents. The installation responses in all tested soils are then compared, and
general trends for the suction pressures required for a given penetration are identified.
The suction pressures predicted using a qc-based method and an analytical method are
compared with the experimental results. The installation results are presented here in a
similar format to that for the 1g tests in Section 4.3. In cases where similar results are
obtained, only typical ones will be shown. In the discussion of the results in this chapter
and the next one, equivalent prototype dimensions will be used.
Chapter 5: Centrifuge modelling: Installation behaviour in homogenous sand
MANH NGOC TRAN 5.2
5.2 Installation in silica sand
5.2.1 Cone penetration tests
The sample uniformity and strength were evaluated by conducting cone penetration tests
(CPTs) in the sand, using a 10 mm diameter cone penetrating at a rate of 0.2 mm/s.
Figure 5.1 shows typical CPT results for a number of tests. It can be seen from the results
that excellent consistency and repeatability of soil strength was achieved, and the very
high tip resistance confirms that the sand is very dense. The relatively constant strength
gradient, as shown in the CPT results, suggests that fairly uniform sand is achieved in
each sample. The slight concavity is possibly due to the depth needed to achieve steady-
state resistance, since the cone has an equivalent prototype diameter of 1 m. The depth
required to achieve stable cone reading in silica sand could be up to 10 cone diameter
(Bolton et al., 1999). Below a depth of about 120 mm (i.e. 12 m at equivalent prototype
scale), the curvature increases slightly, probably due to interference with the base of the
box (the sample thickness being 180 mm).
5.2.2 Jacked installation and suction installation
Figure 5.2 shows the soil resistance when the two 6 m diameter caissons were
continuously jacked (pushed) into sand at the rate of 0.1 mm/s. This is equivalent to an
extended self-weight installation phase, where the caisson penetrates under its own
weight (the jacking force in this case). Figure 5.2a shows the jacking force and depth in
prototype units, while Figure 5.2b shows the results in terms of normalised pressure p/γ'D
and normalised wall penetration L/D, where the pressure p equals the force divided by
the caisson internal cross sectional area, γ' is the soil submerged weight (taken as 10
kN/m3 here), and L is the wall embedment depth. Note that the jacking of the thicker-
walled caisson, with t/D = 1.0 %, was stopped at a depth of 2/3Lmax due to concerns of
damaging the caisson. However, this does not affect the observed trends. Indeed, for the
same caisson diameter of 6 m, the results show that the jacking force for the thicker-
walled caisson is approximately double that for the thinner-walled case (t/D = 0.5 %).
Given that the wall roughness was similar for the two caissons, this suggests that the
resistance is dominated by the wall tip resistance. This result is expected due to the very
Chapter 5: Centrifuge modelling: Installation behaviour in homogenous sand
MANH NGOC TRAN 5.3
high cone resistance as seen previously in Figure 5.1. The jacking forces also show a
non-linear behaviour, with increasing force gradient observed at greater penetration
depths, as the component of resistance due to side friction increases.
The above jacked installation is compared with a typical result from suction installation
in Figure 5.3. The suction test was conducted following the 2-phase installation described
in Chapter 2. In the self-weight phase, it can be seen that the initial caisson penetration is
in good agreement with that obtained from jacking, with an embedment ratio L/D of
around 0.1 reached at an equivalent prototype force of 500 kN (or caisson mass of 50-
tonnes). However, diverging responses are observed during the suction installation phase.
A very significant reduction in force in the suction-installed case is seen in Figure 5.3,
where the required force is several times smaller than that during jacking. This clearly
illustrates the significant effect of seepage flow in degrading the tip bearing resistance.
As mentioned in Chapters 2 and 4, while upward seepage inside the caisson reduces the
effective stress and hence the friction along the inner wall, downward flow along the
outside wall has the reverse effect. Although there may be some net difference in these
relative effects, most of the force degradation observed here can be attributed to
reduction in tip resistance, particularly given the dominance of tip resistance deduced
from Figure 5.2.
5.2.3 Effect of initial penetration depth and surcharge
The effect of initial penetration depth on installation behaviour is shown in Figure 5.4.
The slight increase in suction at the end of the installation was most likely caused by the
increasing contact between the caisson lid and the internal plug. It is noted here that the
installation set-up was kept similar in all installations so that similar total outflows
(pumping) could be obtained. Therefore, effects due to different pumping rates as
observed previously in Chapter 4 could be minimised, allowing the results to be directly
compared. Furthermore, it was observed that, within the range of the pumping rates in
this study, the installations in the centrifuge with water as pore fluid did not appear to be
rate dependent, i.e. similar to the “lower bound” installations at 1g. This will be
discussed in detail later in Section 5.5.
Chapter 5: Centrifuge modelling: Installation behaviour in homogenous sand
MANH NGOC TRAN 5.4
The results show comparisons between tests where (a) the caisson penetrated under its
self-weight following the procedure described in Section 2.7.3, and (b) where it was
arbitrarily pushed to different initial wall depths before applying pumping, but with the
self-weight maintained at the equivalent prototype weight of 500 kN (or ∆p/γ'D of 0.29)
during suction installation. It is clear that for a constant self-weight, pushing the caisson
further into the soil does not appear to have any advantage, in terms of suction pressure
or penetration capacity, over cases where the caisson was installed at a shallower initial
depth. For the cases with artificially increased initial embedment, the pressures quickly
rise to join the pressure level for the shallower embedment case. This illustrates that, as
long as the caisson weight remains constant, a similar amount of extra suction force will
be required to penetrate the caisson further. In other words, the soil resistance on the
caisson does not change. It also implies that irrespective of the initial wall cut-off length,
seepage still creates the same force degradation due to reduction in effective stress and
sand loosening, providing the caisson has the same self-weight.
In other tests, instead of arbitrarily pushing the caisson to a greater initial embedment as
before, the caisson was allowed to penetrate further by increasing its weight (i.e. adding
surcharge), before pumping. The results of installations with different surcharges are
summarised in Figure 5.5. In this case, it can be seen that the use of additional surcharge
reduces the required suction pressure throughout installation. The pressure responses
appear to be parallel. The average normalised pressure reduction ∆p/γ'D seen in
Figure 5.5 is around 0.05, equivalent to a weight of 85 kN. Since the added surcharge
was about 500 kN (at equivalent prototype scale), the suction reduction is therefore much
smaller than the amount of extra weight added. Further discussion of the pressure
reduction will be included in Section 5.5.
Figure 5.6 shows the results where the suction curves in Figure 5.5 are arbitrarily shifted
to the same starting point, in this case the start of the ∆p/γ'D of 0.29 (500 kN) self-weight
caisson installation by translating parallel to the embedment axis. The purpose is to
compare and see how the shapes of the suction curves differ as a result of variations in
the caisson weight. The result is interesting, with a virtually unique response curve
obtained. This suggests that installation with higher surcharge does not appear to change
the suction behaviour. Rather, the suction curve is just simply shifted along the wall
Chapter 5: Centrifuge modelling: Installation behaviour in homogenous sand
MANH NGOC TRAN 5.5
embedment depth axis to the new starting point, i.e. the new self-weight penetration
position caused by the added surcharge. This result is very useful in predicting the
required suction pressures for installations with different surcharge. In particular, if the
above unique curve (details of which will be investigated in Chapter 7) for a caisson can
be derived, the required suction for installation can be predicted easily for any self-
weight and surcharge.
5.2.4 Effect of caisson geometry
Installations of caissons with different wall thicknesses are illustrated in Figure 5.7. The
results show the installation behaviour of a 6 m (60mm model), t/D = 0.5 % caisson and
the same size, same self-weight caisson but with a thicker wall with t/D = 1.0 %. Figure
5.27a shows the result for the caisson weight p/γ'D of 0.29 (500 kN), and Figure 5.7b
shows the result for the caisson weight p/γ'D of 0.88 (1500 kN, or 1000 kN surcharge). It
is seen in both cases that the thinner-walled caisson penetrates deeper under self-weight
because of the reduced wall tip resistance, which is consistent with the jacking results
shown in Figure 5.2. The behaviour during suction installation, where the suction curves
appear to be quasi-parallel, is interesting when compared with the jacking results, and
essentially mimics that seen for different self-weights shown in the previous section. For
suction installation, there is only a small increase in force for the thicker-walled caisson,
compared with the difference shown in Figure 5.2. The result again confirms the
significant effect of seepage flow on reducing the resistance, particularly tip resistance.
The observation of parallel suction curves for both cases shown in Figure 5.7 suggests
that the difference in the wall thickness does not seem to have any noticeable effect on
the subsequent force gap between the two cases (i.e. the gap remains relatively constant
for deeper depth). This is markedly different from the rapidly diverging trend for jacked
installation.
The larger pressures in the thicker-walled cases in Figure 5.7 indicate that the thicker
caissons require larger driving forces than the thin-walled caissons, not only during self-
weight penetration but also during suction installation. The higher suction pressures
suggest that although most of the tip resistance is reduced as seen in Figure 5.3 and
discussed above, it is not fully eliminated. Indeed, if there was no tip resistance during
Chapter 5: Centrifuge modelling: Installation behaviour in homogenous sand
MANH NGOC TRAN 5.6
suction installation, the wall thickness would become almost irrelevant and there would
be no difference in suction required for a given installation depth for caissons of different
wall thickness (providing all other geometry and load conditions were the same, which is
the case here). However, the results here indicate otherwise, showing that thicker-walled
caissons still require higher pressures to penetrate; this confirms the presence of tip
resistance, even if small, during suction installation.
The effect of absolute caisson size on suction pressure behaviour was also investigated,
by comparing the installations of caissons with identical wall thickness ratio t/D, but
different diameters of 6 m and 10 m. Each installation of the 10 m diameter caisson was
conducted twice to check the repeatability of the tests. As seen in Figure 5.8, excellent
consistency between the installations was observed. It should be noted here that the
caisson was installed only up to L/D of about 0.65-0.7 because of insufficient pumping
capacity. Modifications to increase the pumping capacity, such as by increasing the water
depth difference, were not feasible because of the physical limitations of the centrifuge.
Nonetheless, this does not affect the observed seepage trend, as seen in the graphs.
Typical results from the 10 m diameter caisson installation are compared with those of
the 6 m diameter caisson on Figure 5.9a. It can be seen that despite a slight difference
initially, the results show very similar pressure gradient for deeper wall embedment
depth. It is also observed from Figure 5.9a that for the same surcharge increment of 1000
kN, the (normalised) pressure drop for the 10 m diameter caisson is smaller than that in
the 6 m case. However, this is consistent with the force-pressure conversion, since a 1000
kN weight converts to a normalised pressure change ∆p/γ'D of 0.59 for the 6 m diameter
caisson, but only 0.13 for the 10 m diameter case. This is similar to the 1g observations
discussed in Chapter 4.
Figure 5.9b compares typical results for each caisson installation in absolute dimensions,
of pressure and prototype penetration depth. It is seen that the trend in this comparison is
almost the same, including the early stage. Hence the differences seen in Figure 5.9a are
partly the result of normalisation. The suction curve for the 10 m caisson with larger
surcharge has also been shifted as seen; the identical curves obtained once again confirm
the previous observation for the smaller 6 m diameter caisson shown in Figure 5.6.
Chapter 5: Centrifuge modelling: Installation behaviour in homogenous sand
MANH NGOC TRAN 5.7
5.2.5 Seepage flow behaviour
A typical seepage result during installation of the 10 m diameter caisson is shown in
Figure 5.10a. The seepage was calculated using Equation (4.1) in Chapter 4. In this case,
the total flow was determined from the water collected in the four outflow containers.
The seepage value shown is at model scale, i.e. as collected from the test. It can be seen
from the results that seepage flow increases very rapidly during the initial stage of
installation. However, the rate reduces rapidly with penetration and only very minor
increases in seepage occur afterwards. For deeper caisson penetrations, seepage appears
to reach a terminal value. This behaviour is very similar to that observed in the previous
1g tests, with a typical result (also for a 100 mm diameter caisson model) re-shown here
in Figure 5.10b for comparison. It can be seen that the centrifuge seepage value is much
higher than the 1g seepage. This is due to the much larger suction pressure obtained in
the centrifuge, which in turn induces more seepage. The observation of large amounts of
seepage obtained in the centrifuge (with water as pore fluid) is consistent with results
reported by Allersma (2003). Note that the seepage resulting from the “lower bound
pressure” 1g installation is chosen here because the centrifuge behaviour is similar to the
1g “lower bound” installations. Further details will be discussed later in Section 5.5.
Figure 5.11 shows the typical seepage flow for the 6 m diameter caisson. It can be seen
that although the data are very scattered, a general trend for the seepage flow to be
relatively constant at deeper depth, averaged at ~40 cm3/s, can be observed. The larger
scatter range, compared with the 10 m caisson case, is believed to be due to more
influence of the transducer noise on the (markedly) smaller absolute seepage, due to
smaller caisson size.
Figure 5.12 shows the seepage results in normalised form (with kplug = ko = 1.0 × 10⁻⁴
m/s). The 1g seepage and a theoretical result (assuming a single permeability as ko) are
also included. It can be seen that although the data were a bit scattered during the initial
stage and the seepage is slightly higher than the theoretical one (which is most likely due
to the increase in sand permeability as a result of loosening during installation), the
general trends of the normalised seepage are very similar: they gradually reduce to a
terminal value for larger wall embedment depths.
Chapter 5: Centrifuge modelling: Installation behaviour in homogenous sand
MANH NGOC TRAN 5.8
5.2.6 Internal heave and plug loosening
In these tests, the sand heave could not be observed continuously during the installation
as in the 1g case. Hence, the heave discussed here was the final sand heave measured at
the end of the installation, when the internal sand plug was in contact with the caisson
lid. It was taken as the difference between the maximum and the actual penetrated wall
lengths. Note that the installations of the 10 m caisson were not complete (i.e. the internal
plug did not reach the caisson lid); sand heave was hence not obtained for these cases. In
the 6 m caissons, the final heave could be deduced because post-test inspection showed
that the internal plug was in good contact with the bottom of the caisson lid.
Table 5.1 shows the final values of heave obtained from the tests. In general, it can be
seen that, for the thinner-walled caisson (t/D of 0.5%), the total heave was around 7-9 %
of the penetrated wall depth. In the thicker-walled case (t/D of 1%), total sand heave was
marginally higher, at around 10-11 %. This appears to be consistent with the previous 1g
result, where larger heaves were recorded in thicker-walled caissons. The heave
measurements here are also similar to those recorded from centrifuge tests of similar
caissons by Allersma et al. (1997). In their study, the reported heave ratio was around
9%. Compared with the average 3-4 % heave ratio reported by Erbrich and Tjelta (1999),
the heave values in this study are higher. However, values of heave from Erbrich and
Tjelta (1999) were measured at much shallower penetration, with L/D ~0.5.
There also seems to be a slight reduction in heave in installations with higher surcharge.
However, it is difficult to make a firm conclusion here because the observations of small
heave differences in these cases (normally less than 0.1 m, or 1 mm at true model scale)
could be influenced by minor variations in experimental conditions (e.g. the soil surface
not being absolutely flat). Nonetheless, it was observed quite consistently that final heave
was in the range of 0.4-0.6 m, or 7-11 % of the wall embedment depth. The effective
heave, i.e. minus the wall volume, was around 5-8 % for all cases.
As discussed before in Chapter 4, the heave is due partially to the caisson volume, and
partially to plug expansion, which will result in a looser, and hence weaker, internal sand
plug. To investigate this further, a number of cone penetration tests were conducted
inside the suction-installed caissons. The results were then compared with those inside

Chapter 5: Centrifuge modelling: Installation behaviour in homogenous sand
MANH NGOC TRAN 5.9
jacked caissons, where no seepage-induced sand loosening occurred. In all cases, the
cone penetration tests were conducted in the same manner, i.e. using the same cone,
penetrating at the same rate and through the same opening on the caisson lid. This
enabled relative comparison between results to be made. Indeed, since the cone test
conditions were kept the same, any difference in the results was hence caused by the
difference in soil condition in the plug. In these tests, the cone diameter was 10 mm (or 1
m prototype), and the tests were conducted at a penetration rate of 0.2 mm/s (i.e. 0.02
diameter per second). A typical test set-up can be seen in Figure 5.13.
Figure 5.14 shows the cone test results inside the 6 m, t/D = 0.5% caisson. If the sand
inside the caisson had loosened, the cone tests would be expected to show a low
resistance. However, initially very high tip resistances were obtained which later reached
a peak value, before dropping down to a consistent increasing trend with depth. This
unexpected behaviour is believed to be the result of the soil confinement inside the
caisson (i.e. the internal sand plug was confined by the caisson wall). However, this
confinement does not affect the test conclusions because as mentioned above, the results
were compared relatively to each other.
It is observed that the cone resistance is much lower in soil inside the suction-installed
caisson, compared with that in “non-loosened” soil inside the jacked caisson. This
provides an additional indication of sand plug loosening inside the caisson compartment.
The larger cone resistance for the caisson installed with a larger surcharge (Figure 5.14)
also suggests that installation with a surcharge tends to reduce the extent of loosening in
sand. This seems to be consistent with the apparent trend of lower suction and less heave
with increasing surcharge, presumably partly as a result of less plug loosening. This was
particularly clear in the previous 1g installations discussed in Chapter 4 (Figures 4.13b
and 4.26a).
Cone penetration tests inside the thicker-walled 6 m caisson with t/D = 1% yielded very
similar behaviour, as seen in Figure 5.15. Indeed, it is observed here again that the plug
inside the suction-installed caisson is looser for the installation of a lighter caisson (i.e.
the caisson effective weight is less). In other words, the use of higher surcharge (or
increase in caisson dead weight) appears to reduce the loosening. It is noted here that the
cone resistance inside the thicker-walled caisson is higher that that in the thinner-walled
Chapter 5: Centrifuge modelling: Installation behaviour in homogenous sand
MANH NGOC TRAN 5.10
installations, which is likely to be due to different confinement effects between the two
cases (i.e. the stiffer thicker-walled caisson creates larger confinement). However, the
overall trend and conclusions are not affected because the results are compared relatively
for each case.
5.2.7 Comparison with previous 1g results
Figure 5.16 compares a typical normalised suction pressure response obtained from the
centrifuge installation to that from a 1g test. It can be seen that although both appear to
increase linearly with depth, the pressure gradient in the 1g case is slightly higher. This
difference may be caused by the stress dependent behaviour of sand, which was also
observed by Allersma et al. (1997). Nonetheless, it may be seen that there are similarities
in the caisson generic behaviour between the centrifuge installations presented here and
the 1g installations seen previously in Chapter 4. These are summarised as follows:
� For similar pumping rates, the use of surcharge reduces the required suction
pressure. Surcharge also appeares to reduce the sand heave and plug loosening.
For the same amount of surcharge, the reduction in the suction pressure was
smaller for the larger caisson, consistent with the force-pressure conversion.
� Variations in caisson geometry including caisson size and wall thickness,
although resulting in significant differences for jacked caissons, did not seem to
alter the general suction pressure behaviour. In all cases, the suction pressure
curves were observed to increase relatively linearly with depth with very similar
gradient. The suction pressure value was, however, slightly higher for the same
diameter, but thicker-walled caisson, indicating the presence of some small tip
resistance.
� The seepage rate increased rapidly during initial penetration, but remained
relatively constant afterwards, appearing to approach a terminal value.
Chapter 5: Centrifuge modelling: Installation behaviour in homogenous sand
MANH NGOC TRAN 5.11
5.3 Installation in calcareous sand (uncemented)
5.3.1 Cone penetration tests
Figure 5.17 shows the average cone penetration resistance in the North Rankin
calcareous sand. For the upper 6 m soil, the resistance increases quite linearly with depth,
suggesting quite uniform soil in this region. At the depth of around 6m, the tip resistance
gradient reduces. This may be because the soil at that depth was slightly less dense.
However, it may also be due to the cone having to penetrate to several cone diameters
before a steady state cone reading is obtained. The result here suggests that steady state
conditions are achieved at depth of ~6 m. It is also observed that the cone resistance in
this case is significantly smaller than that in silica sand seen previously (see Figure 5.18),
reflecting the greater compressibility of the sand. This will also reduce the tip resistance
for caisson installation.
5.3.2 Jacked installation and suction installation
Figure 5.19a shows the normalised pressure for the two 6 m diameter caissons during
jacking. The jacking of the 6 m diameter, t/D of 0.5% caisson was repeated, and the
results show very good consistency. Figure 5.19b compares the force required to jack in
the thinner-walled caisson in calcareous sand with that required in silica sand. The results
are presented in prototype units. It can be seen that, for both caissons, the jacking force in
the North Rankin calcareous sand increases quite linearly with depth, being very different
from the non-linear behaviour in silica sand. This may be the result of less influence of
the wall friction component due to lower frictional capacity in calcareous sand, caused by
lower confining stress σn’ at a given depth (due to smaller γ'). The jacking force is also
significantly lower than that in the silica sand case, about 2-3 times less. This is
consistent with the lower cone resistance obtained for the calcareous sand, although the
ratio of the qc values for silica and calcareous sand is higher, ranging from 5-10. The
force difference between the thinner and thicker-walled caissons is also smaller for
calcareous sand, indicating lower end bearing. This is again consistent with the lower
cone resistance in calcareous sand.
Chapter 5: Centrifuge modelling: Installation behaviour in homogenous sand
MANH NGOC TRAN 5.12
Figure 5.20a shows the comparison between a typical suction installation result and the
above jacking result. Figure 5.20b includes similar results in silica sand for comparison.
As seen, it is clear that the required driving pressure in suction installation is lower than
that in jacked installation. However, the level of reduction for calcareous sand is less than
that in the silica sand case. At the end of the installation (L/D of around 0.9), the required
pressure is about half of the jacking value, while it was only 1/5 in silica sand.
Nonetheless, the observed reduction clearly illustrates that reduction in soil effective
stress, which resulted in penetration force degradation, has actually occurred.
5.3.3 Effect of initial penetration depth and surcharge
The effect of initial penetration depth and surcharge can be seen in Figures 5.21 and 5.22.
As seen in Figure 5.21, the suction pressure in the arbitrarily pushed caisson quickly rises
and joins that of the shallower case (but same self-weight). This once again suggests that
variation in the initial penetration depth does not appear to have any effect on the suction
pressure trend, if the rest of the installation conditions are kept similar.
Figure 5.22 shows the effect of increasing caisson weight (or adding surcharge) on the
suction pressure. It can be seen that the weight variations do result in changes in the
suction pressure behaviour, with lower suction pressure being observed for higher self-
weight. The average reduction in p/γ'D is about 0.12, equivalent to 200 kN weight (at
prototype scale). This is significantly lower than the added weight of 500 kN (p/γ'D of
0.29), which is consistent with previous observations in silica sand. However, the p/γ'D
reduction of 0.12 here is more than that in silica sand, which was only around 0.05.
Further discussion will be presented in Section 5.5. The results also show that in all
cases, there is a pressure jump when starting pumping, indicating that large force is
required to mobilise the caisson in this case.
Figure 5.23 shows the results where the response curves have been shifted horizontally
towards a common starting point, in this case the p/γ'D of 0.29 (500 kN) self-weight
installation. Once again, as in the silica case, it is observed here that the suction pressure
trend is almost identical, suggesting that the use of surcharge does not alter the general
suction trend. Rather, it is just moved along the wall penetration axis.
Chapter 5: Centrifuge modelling: Installation behaviour in homogenous sand
MANH NGOC TRAN 5.13
5.3.4 Effect of caisson geometry
Figure 5.24 shows the comparison between the two 6 m diameter caissons, but with
different wall thicknesses. Some irregularities seen in the thicker-walled caisson result
may be due to small variations in the soil condition at that site. However, a general trend
can still be observed for the suction pressure in the thicker-walled caisson installation to
be higher than for the thinner-walled one, confirming the presence of some tip resistance
during installation. When compared with the silica sand results, the pressure difference
between the two installations seen here is higher. This indicates that the level of tip
resistance degradation in this sand is lower, presumably due to a lesser reduction of the
sand effective stress at the tip (although, overall, a net reduction in soil effective stress
leading to force reduction has occurred, e.g. Figure 5.20). It is also observed from this
result that the suction pressures increase with depth following a quite similar gradient,
which is significantly different from the diverging trend seen in Figure 5.19a. This is
very consistent with observations in silica sand.
The effect of caisson diameter was also explored. Figure 5.25 plots the results of the
installations of 6 m diameter and 10 m diameter caissons, both with the same thickness
ratio t/D of 0.5%. The suction pressure trends between these installations are similar,
again showing good consistency with previous observations in silica sand.
5.3.5 Seepage flow, internal heave and plug loosening
The seepage flows during the 6 m diameter caisson installations were calculated, but the
data obtained were very scattered. A typical result can be seen in Figure 5.26. Although
the data seem to be scattered around a constant value close to zero, the large variability
makes it difficult to draw a firm conclusion. However, a clearer seepage trend could be
observed for the larger caisson, where the larger flow was less influenced by the noise in
the measuring transducer. The calculated seepage flow during the installation of the
larger 10 m diameter caisson is shown in Figure 5.27a. Figure 5.27b shows the
comparison with the similar installation in silica sand. It can be seen that in calcareous
sand, the seepage behaviour is very different. Although the seepage data are also quite
scattered, the results, especially Figure 5.27b, clearly show that very small seepage flow
(compared with silica sand) was obtained in this case. This observation is consistent with
Chapter 5: Centrifuge modelling: Installation behaviour in homogenous sand
MANH NGOC TRAN 5.14
previous permeability measurements in Chapter 3, where the North Rankin calcareous
sand was found to be much less permeable (by nearly one order of magnitude for the
densities tested). Reducing the seepage measured in the silica sand by a factor of 10
would result in a rate of ~8 cm3/s, which is within the noise range for the tests on
calcareous sand.
Examination of the final sand heave also reveals very different results compared with the
installations in silica sand. Table 5.2 gives a summary of the final heave measured at the
end of the suction installations. It can be seen that the amounts of heave were very small,
generally around 0.1 m (1 mm at model scale) and less, or lower than 2% of the
penetrated wall depth. Although small variations in test conditions (e.g. flatness of soil
surface) are likely to affect these heave results, it is still consistently observed that the
heave values are significantly smaller than those in silica sand. The negligible heave
suggests that sand plug loosening during installation was less significant, which also
appeared consistent with the small seepage result. Indeed, the effective heave, minus the
wall volume, is close to zero, indicating again that almost no loosening occurred.
This was further checked by conducting cone tests inside the caisson. The cone tests were
conducted in the same manner as in silica sand, which was discussed in the previous
section. Figure 5.28 compares the cone resistance inside the suction-installed caisson and
the jacked one. It can be seen that very similar cone resistances were obtained in both
cases. This is markedly different from the results shown previously for silica sand. The
cone resistance in the suction-installed caisson in this case is even slightly higher, but this
could be due to small variations in the soil conditions. The insignificant difference in the
plug strength in the suction-installed and jacked caisson observed here clearly indicates
that negligible loosening, or even no loosening, occurred during the suction installation.
This is consistent with the seepage and heave observations discussed before.
5.4 Installation in mixed sand-silt soil
5.4.1 Cone penetration tests
Figure 5.29 show the cone penetration test results in silica sand mixed with different
Chapter 5: Centrifuge modelling: Installation behaviour in homogenous sand
MANH NGOC TRAN 5.15
silica flour (silt) contents. The average cone resistance in clean silica sand (0% silt) is
also included for comparison. Note that a 35 MPa cone were used in the mixed soils,
hence the penetration was terminated when the reading reached this value. Nonetheless, a
consistent trend can be clearly observed from the results. The cone resistance is higher
for soils with larger silica flour content, suggesting larger caisson tip resistance would be
found in these cases. The results here are consistent with the observations that,
physically, the mixed soils were very stiff. This was also reflected by the triaxial
compression test results in Chapter 3, which showed that the mixed soil had very low
compressibility. The smooth cone resistance profiles and their relatively constant
gradient with depth indicate that the soil samples were uniform.
5.4.2 Installation results
The installations were conducted using the 6 m diameter, t/D of 0.5% caisson. The
caisson weight was 1500 kN at prototype, or scale p/γ'D of 0.88. Considering the very
high cone resistance in these soils (Figure 5.29), jacked installations were not conducted
because of concerns that the caissons could be damaged. The suction installation results
in different mixed soils are shown in Figures 5.30a and b. Figure 5.30a shows the results
in prototype units, while Figures 5.30b presents them in the normalised form. The result
for silica sand with the same size, same weight caisson is also included in Figure 5.30b
for comparison. It is noted that the installation in the soil with 40% silt content (the one
with the highest cone penetration resistance in Figure 5.29) was terminated early because
further penetration could not be achieved due to lack of pumping capacity. Post-test
inspection also revealed that the caisson deformed (buckled) slightly in that case, which
was not surprising considering the very high pressure at very shallow penetration depth.
Nonetheless, a clear installation trend can be observed from these results. It can be seen
that the required suction pressures are larger in soils with higher silt content, indicating
that the soil resistance was higher in those cases. These appear consistent with the cone
penetration results in Figure 5.29. Part of this increase in resistance force may be caused
by the increase in wall friction, as the interface friction angle is likely to be higher in
these soils (shown previously in Chapter 3). However, the other important increase is due
to the higher tip resistance. Considering the very high cone resistance seen previously in
Chapter 5: Centrifuge modelling: Installation behaviour in homogenous sand
MANH NGOC TRAN 5.16
Figure 5.29, it is likely that the contribution of the tip resistance component to the
observed suction pressure increase is significant.
The above argument is based on the assumption that the tip resistance does not reduce to
zero during suction installation, which was indeed indicated by the results presented here.
Figure 5.31 compares the installations of the thinner-walled and thicker-walled caissons.
It can be seen that the suction pressure in the thicker-walled case is higher, indicating the
presence of some tip resistance. The result is very similar to those recorded in previous
installations in clean silica sand and calcareous sand.
The behaviour of suction pressure with depth is also interesting. In all cases, it is seen
ultimately to reach a steady rate of increase with depth, following very similar gradients
despite differences in the silt content. This pressure trend will be discussed further in the
next section.
5.5 Discussion and comparison of the installation results
5.5.1 Discussion of the obtained results
It was seen in Chapter 4 that the suction pressure behaviour with depth was rate
dependent if the pumping rate (or installation rate) was above a certain value. However,
the suction pressure obtained in the centrifuge tests appeared to be unique, i.e. similar to
the “lower bound suction pressure” discussed in Chapter 4. This was investigated by
conducting another series of centrifuge installations, using a much smaller pumping rate.
This was achieved by using smaller tubing with internal diameter of 4 mm compared to
the 10 mm tubing used in all the other tests.
Figures 5.32a and b compare the suction pressure and the measured outflow in these low
pumping rate centrifuge installations with the results from the tests discussed in the
previous sections of this chapter (which used larger rates of pumping). The results are for
the 6 m diameter caisson. Figures 5.33a and b show a similar comparison for the 10 m
diameter caisson. In both cases, the installations with low pumping rates could not be
completed because of insufficient pumping capacity. However, this does not affect the
observed trend. It is clear from the results that despite large variations in total flow (the
Chapter 5: Centrifuge modelling: Installation behaviour in homogenous sand
MANH NGOC TRAN 5.17
difference could be up to one order of magnitude), the suction pressures in both cases
remain very similar. The behaviour is the same as that observed in the “lower bound
suction” installation at 1g, where variation in pumping rate (below a threshold) does not
affect the suction. Figures 5.34a and b show the seepage flow calculated for these fast
and slow pumping rate centrifuge tests. It can be seen that the seepage results in the two
cases are very similar. This is again consistent with the seepage behaviour for 1g “lower
bound” installations seen previously in Figure 4.22.
The rate-independent behaviour observed in the centrifuge tests, as observed here, is
likely to be attributed to the rapid generation of a seepage flow net in the centrifuge. This
is probably due to increased stiffness (as soil stiffness is proportional to the soil stress),
and therefore value of soil consolidation cv. The increase in cv allows for a full seepage
flow net to develop quickly. As a result, a stable soil effective stress condition at each
wall embedment depth can be reached faster, which hence results in similar penetration
resistance.
The above argument also appears consistent with the behaviour observed in installations
starting from different initial penetration depths. It was seen that for installations with
artificially large initial penetration depths (i.e. greater than achieved by self-weight), the
suction pressure quickly rose to the same level and joined the previous pressure trend
(e.g. Figure 5.4). This is similar to observations by Allersma et al. (1997), where the
pressure also responded in the same way in step installations. These results imply that a
similar effective soil stress condition (hence penetration resistance) was created very
rapidly after pumping was initiated, which again is possibly due to the rapid creation of a
full seepage flow net in the centrifuge.
It was seen quite consistently from the centrifuge results that for installations with higher
surcharge, the equivalent pressure reduction is smaller than the added surcharge
(expressed as equivalent pressure), but by different amounts in silica and calcareous
sands. However, in some 1g installations, it appeared that the reduction was larger than
the added weight. These variations in pressure reduction are further investigated using a
schematic diagram (which mimics Figure 5.3) as shown in Figure 5.35. It shows typical
suction installation forces, with total force paths AA' and BB' resulting from two
different self-weights (and hence initial penetrations). Note that the jacking line OAB can

Chapter 5: Centrifuge modelling: Installation behaviour in homogenous sand
MANH NGOC TRAN 5.18
be straight, as observed in calcareous sand. The slope of the suction installation lines AA'
and BB' also appears to be distinct for a certain type of sand. This slope will be discussed
later in the next section, and investigated in greater detail in Chapter 7.
Strictly speaking, to allow for the inclusion of self-weights on the graph, the suction
response should be plotted as OAA' or OBB'. However, the results plotted so far were not
presented in this way. Rather, they were compared relatively on the same axis O'x'. This
was done by shifting point B down to level with A (see the dashed curve starting from
B''). It can be seen from the diagram that by plotting the results like this, it gives a force
(pressure) reduction of A''B'' in the larger surcharge installation. Depending on the
proximity of the suction-installed line (e.g. AA') and the jacking line (OAB), the amount
of reduction A''B'' in comparison to the added weight ∆W (BB'') may vary. If the suction
installation line is closer to the jacking line (i.e. gradient BB' is closer to that for jacked
installation, see Figure 5.36) such as the case in calcareous sand, the A''B''/BB'' ratio is
higher, i.e. the average reduction is closer to the added amount. Similarly, if they are
further apart such as the silica sand case, the average reduction is less, which was indeed
observed in the previous test results. Note that in both cases in Figures 5.35 and 5.36, if
the total force (self-weight plus suction force) had been plotted in the previous results,
represented by lines AA' and BB' in the diagram, then the separation given by A''B shows
an increase in total penetration force resulting from a larger self-weight or surcharge,
which is consistent with previous observations by Tjelta (1995).
It has been suggested from the installation results that although the tip resistance is likely
to reduce significantly during suction installation, it does not appear to be fully
eliminated (i.e. reduced to zero). It will be influenced by the seepage flow direction
around the caisson tip. It is known that on the inner side of the caisson tip, the upward
seepage gradient reduces the soil effective stress, and possibly creates some subsequent
loosening, which reduces the tip resistance. However, on the outer corner of the wall tip,
the seepage flows around the wall in the downward direction (see the illustrations in
Figure 5.37), hence increasing the local soil stress. Therefore, although the upward
seepage and part of the horizontal flow may reduce the tip resistance significantly, a
small proportion of tip resistance is likely to be present at the outer corner of the caisson
Chapter 5: Centrifuge modelling: Installation behaviour in homogenous sand
MANH NGOC TRAN 5.19
wall during penetration. This was clearly observed in the installations with a thicker-
walled caisson (e.g. Figure 5.7) and stiffer soils (Figure 5.30).
5.5.2 Comparison of the general suction pressure trends
It is observed from the tests that despite differences in installation conditions, geometry
and soil type, the suction curves appear to follow a very similar trend, consisting of two
stages. In the first stage, referred to here as the transitional stage, the pressures are seen to
rise rapidly as pumping is initiated as in calcareous sand; or rapidly rise and then to
increase quasi-linearly with depth as in silica sand and mixed soils. In the second stage,
the pressure increases with depth at a virtually constant gradient for the rest of the
installation. The described behaviour is illustrated in Figures 5.38 a,b and c, which show
the results for silica sand, mixed soils and calcareous sand respectively. A significant
observation is that while the installation pressures can increase in a highly non-linear
manner for jacked installation, with significant differences for different caisson
geometries, the corresponding responses during suction installation always follow a very
distinct slope. The best example is for installation of caissons with different wall
thickness t/D, as seen in Figure 5.2 and Figure 5.7.
Figures 5.39a and b plot typical suction installation pressures in different soils together
for comparison. Figure 5.39a plots the data in engineering units (at prototype scale), and
Figure 5.39b shows the results in normalised form. It can be seen from the results in
Figure 5.39a that after the transitional stage, the pressures increase with depth following
very similar slopes for silica sand and mixed silica sand-silica flour soils, but at a lower
slope for calcareous sand. However, the normalised data are interesting, showing that all
pressures appear to follow a similar slope. The identical results observed for the
installations in silica sand and calcareous sand are coincidental for the particular case of
The caisson weight was 1500 kN at prototype scale, or p/γ'D of 0.88 (indeed, comparing
installations of say, p/γ'D of 0.29 (500 kN) self-weight does not give such close
similarity). Note that in Figure 5.39b, the pressure is normalised against the soil
submerged unit weight γ', which also determines the critical hydraulic gradient ic for that
soil (as ic = γ'/ γw). Hence, the obtained similarity in normalised pressure slopes suggests
Chapter 5: Centrifuge modelling: Installation behaviour in homogenous sand
MANH NGOC TRAN 5.20
that the critical hydraulic gradient is an important factor during suction installation. This
will be investigated in greater detail in Chapter 7.
The above results were also compared with other published data. Figure 5.40 shows the
suction pressure trend from the NGI model tests in similar sand, where different levels of
surcharge were used (Erbrich and Tjelta, 1999). Note that the NGI installations were
conducted in a pressurised chamber with a relatively large caisson model (0.55 m
diameter). The results show a relatively clear trend of the installation, where the
pressures are seen to increase following a distinct slope, similar to the behaviour
discussed above. It can also be seen that the average pressure drop ∆p/γ'D due to the
addition of p/γ'D of 0.77 (1 kN) surcharge is around 0.12, significantly smaller than the
added amount of 0.77. This is similar to centrifuge results observed here. The installation
results with larger surcharges have been shifted to the same starting point in Figure 5.41.
Although the data points are limited and the installation depth is small, the shifted results
appear to show good agreement in the pressure response. This is consistent with previous
centrifuge test results, where the pressure responses were very similar, but simply offset
by different amounts according to the extra self-weight penetration depth. Figure 5.42
compares these with typical results from centrifuge installations in silica sand in this
study. As seen, the pressure slope with depth appears to be very similar in these results.
The results from field installations are also compared. Figure 5.43a shows the results
from the suction caisson installations for the Draupner E and Sleipner T platforms
(Tjelja, 1995; Bye et al., 1995; Lacasse, 1999). The soil conditions for both sites also
comprised very dense sand, similar to the silica sand tested in this study. It can be seen
from these results that, in both cases, the pressures are seen to increase quite linearly with
depth initially, but then the gradient reduces sharply at some point and remains constant
for the rest of the installation, which mimics the previous centrifuge behaviour. When
compared with the installations here, as seen in Figure 5.43b, the results again show that
consistent pressure trends are obtained. In fact, the field results are relatively similar to
the centrifuge case for mixed soil with 10% silt.
The similarity in the suction pressure behaviour suggests that there is a common
mechanism developing during installation. This mechanism will be investigated in
greater detail in Chapter 7.
Chapter 5: Centrifuge modelling: Installation behaviour in homogenous sand
MANH NGOC TRAN 5.21
5.5.3 Comparison with current suction pressure prediction methods
In this section, the suction pressure obtained from the centrifuge tests will be compared
against the suction pressure predicted using both a qc-based method (Feld, 2001), and an
analytical method (Houlsby and Byrne, 2005b). Figure 5.44 shows the predicted suction
pressures using the qc-based method, assuming a maximum reduction of 90% in the tip
resistance and skin friction (due to the application of suction). It can be seen that the
predicted suction pressures do not match well with those from the experiment. The main
reason may be because the cone resistance in the centrifuge has not reached a stable
condition. Bolton et al. (1999) suggests that results only appeared to stabilise at depths
around 10 cone diameters or more. Noting that the diameter of the cone used in the
centrifuge tests in this study is 10 mm, the depth for stable cone reading in this case
should be 100 mm or more. The cone results used in the prediction were for depths of
60mm and less.
Figure 5.45 shows the predicted suction using the analytical method proposed by
Houlsby and Byrne (2005). K of 1.9 and kf of 1 were assumed, and the sand friction
angles and interface friction angle reported in Chapter 3 were used. It is noted that K is
the ratio of vertical effective stress and horizontal effective stress, and can vary between
K of soil “at rest” (Ko), and Kpassive during the installation, i.e. typically between 0.5 and
3 .The results show that the predicted suction is relatively close to the experimental
suction for silica sand, but does not match well in other cases. Especially for the mixed
sand-silt case, the experimental trend where the pressure slope changed rapidly at L =
1.5m could not be captured. It is also noted that the suction pressure predicted using the
Houlsby and Byrne method is quite sensitive to the choice of K (or Ktanδ), which can
vary in a relatively wide range during installation.
The results shown in Figures 4.44 and 4.45 indicate that the current methods did not
predict well the suction pressures in the centrifuge installations reported here.
Furthermore, the general suction pressure trend, where similar suction pressure slopes
were observed for installations in different sands, were not reflected in any of the
predicted suctions, either using a qc-based method or an analytical method. This
similarity in suction pressure trend will be investigated further in a series of numerical
analyses in Chapter 7.
Chapter 5: Centrifuge modelling: Installation behaviour in homogenous sand
MANH NGOC TRAN 5.22
5.6 Summary and conclusion
Caisson installations at prototype effective stress conditions have been investigated in a
geotechnical centrifuge. The installations were conducted in various types of sand: clean
silica sand, calcareous sand and silty sand (mixed silica sand and silica flour). The results
were also compared with other published data, including field installations. The
following conclusions can be drawn from the results in this chapter:
� In both silica sand and calcareous sand, the suction pressure required to penetrate
the caisson during suction installation was significantly smaller than that during
jacking (the reduction being less for calcareous sand). This clearly illustrates that
reduction in the soil effective stress due to the generated seepage gradient in the
soil, which leads to penetration force degradation, has occurred during suction
installation.
� Tip resistance was significantly reduced during suction installation, but was not
reduced to zero, i.e. a fraction of the tip resistance still remained.
� Forced differences in initial penetration depth did not have any ultimate effect on
the suction pressure response.
� The use of surcharge reduced the required suction pressure, but did not seem to
affect the general pressure trend. For installation with higher surcharge, the
suction pressure curve was simply shifted along the wall embedment depth axis
to the new starting point, i.e. the new self-weight penetration position caused by
the added surcharge.
� Variations in caisson geometry, including caisson size and wall thickness, did not
affect the pressure behaviour. In all cases, similar pressure curves (shapes) were
obtained.
� Internal plug loosening was observed in silica sand, but not in calcareous sand.
Nonetheless, in both cases, a reduction in soil effective stress at the tip and along
the inner caisson wall occurred, as inferred from the reduction in penetration
resistance (compared with jacking).
� The general trend for the suction pressure was found to be very similar for
different caisson geometries in all sands tested, and for installations reported in

Chapter 5: Centrifuge modelling: Installation behaviour in homogenous sand
MANH NGOC TRAN 5.23
other studies. It consisted of two different stages: a transitional stage, and a stable
pressure slope stage. In the transitional stage, the pressure comprised a pressure
jump (calcareous sand), or a jump and a quasi-linear increase with depth (clean
and silty silica sands). In the second stage, the pressure increased with depth
following a distinct slope.
� The suction pressure predicted using a qc-based method and an analytical method
could not match all the test results. Especially, the general suction pressure trend
observed in the test was not reflected in the predicted suction.
MANH NGOC TRAN 6.1
Chapter Six
Chapter 6
Centrifuge Modelling: Installation
Behaviour in Layered Soils
6.1 Overview
This chapter investigates the centrifuge installation of suction caissons in layered soils. In
particular, it explores the influence of the silt and cemented layers on the installation
process. The detailed soil profiles and test programme have been presented previously in
Chapter 2. The first part of the chapter studies the installation in layered silica sand-silt
soil, similar to the tests discussed previously in Chapter 4. The key difference between
them is that the installations in this chapter were conducted at high soil stress levels
similar to those in the field, whereas those in Chapter 4 were at low stress. The results are
presented in a similar order to those in Section 4.4. In particular, the installation in soils
with surficial silt layer is first discussed. Then the results in soils with silt layers below
the surface are presented, followed by the observations of internal soil heave formation in
the installations. The centrifuge results are then compared with those at 1g (previously
shown in Section 4.4), and the caisson generic behaviour is discussed. The second part of
this chapter investigates a different layered soil type, where uncemented calcareous sand
is inter-bedded by weakly cemented layers. In both cases (sand-silt and uncemented-
cemented layered soils), the results are also compared with those for homogenous sands.

Chapter 6: Centrifuge modelling: Installation behaviour in layered soils
MANH NGOC TRAN 6.2
6.2 Installation in layered sand-silt soil
6.2.1 Cone penetration tests
Figures 6.1 to 6.4 show cone penetration test results for different soil profiles. Figure 6.5
compares them with that in homogenous sand. Figure 6.1 shows the cone resistance in
soil profiles where a surficial layer of silt overlies sand. Two curves are shown, one
where the thickness of the silt layer is around 0.5 m, and a second with a thickness of 1.0
m. Figures 6.2 and 6.3 show the cone penetration test results for two different soil
profiles containing a single silt layer: one with the silt layer at a depth of 0.8 m below the
sand surface, and the other with the silt layer at the deeper depth of 2 m. The sand above
the silt in the latter case was also less dense, having a relative density of around 60 %. In
both cases, the thickness of the silt layer was the same, around 1 m. Figure 6.4 shows the
cone penetration test result for a soil profile containing two silt layers. Inspection of all
these figures shows that when the cone enters the silt layer the penetration resistance
increases, as does the rate of increase of the resistance with depth. As the cone
approaches the bottom of the silt layers the rate of increase of resistance drops and the
penetration resistance reverts towards that for the homogeneous sand. The higher
penetration resistance of the silt (silica flour) compared with the sand as seen here may
be attributed to the greater dilational characteristics at low effective stresses. The smooth
resistance profiles indicate that the soil is uniform, and the high values suggest that the
sand is in a very dense state. Only for the case with the thin silt layer (0.5 m thick) on the
surface was the greater resistance in the silt not observed, possibly because the soil layer
was too thin to have much influence as the cone diameter (1 m) was twice the thickness
of the silt layer.
6.2.2 Layered soil with surface silt layer
Figures 6.6a and b show the suction penetration responses during caisson installation into
sand with a surficial layer of silt 1.0 m thick. Figure 6.6a shows the suction results for
three different caisson submerged weights. Figure 6.6b compares these with the
responses in homogenous sand discussed previously in Chapter 5 (for both suction and
jacked installations, with 500 kN and 1500 kN self-weights). It can be seen in Figure 6.6a
that very similar suction trends are observed in each case, and that the suction required
Chapter 6: Centrifuge modelling: Installation behaviour in layered soils
MANH NGOC TRAN 6.3
appears to increase relatively linearly with depth over the recorded range of wall
embedment, i.e. up to L/D of about 0.8. Note that because of sand heave within the
caisson, the maximum penetration was always less than the aspect ratio of the caisson
Lmax/D = 1. More discussion on the sand heave will be presented later.
Comparison with the suction response in homogeneous sand in Figure 6.6b shows that
greater suctions, by 50-80 % on average, are required to penetrate the caisson when the
silt layer is present. This can be explained by the low permeability of the silt layer which
causes most of the loss of hydraulic head to occur across the silt layer, and hence restricts
the development of the upward seepage gradient in the caisson interior. This reduces its
effect on the sand adjacent to the inner wall and around the caisson tip, causing less
reduction in the effective stress level, and thus leading to higher penetration resistance.
However, the suctions are still much less than the pressures required to jack the caisson
into the sand, suggesting that there is still significant reduction of the soil effective stress,
especially in the region of the tip. The smaller suctions compared with jacked pressures
indicate that the hydraulic blockage is less than would be expected with an intact layer of
low permeability material. This incomplete blockage is believed to be the result of silt
scouring in preferential flow zones that develop adjacent to the inner caisson wall. Such
preferential flow zones were observed in homogeneous sand, as seen in the PIV test
results in Chapter 4. The mechanism of silt scouring is reasonable as the non-plastic fines
can be transported when flow rates are sufficient. Further evidence supporting this
scouring mechanism was provided by the observation of silt particles in the pumping
hose at the end of the tests. In this case, it could be argued that the silt particles observed
in the hose could have come from the surficial silt itself, particularly when the caisson lid
comes into contact with the soil plug (note that the filter used could not block silt
particles). However, silt was also observed in the hose when the silt layer was not at the
surface (as discussed in the next section), supporting the silt scouring argument. This
force reduction compared with jacked installation may also be caused by the effect of the
uplift of the silt layer, which will be discussed later in this paper.
It can also be seen from Figure 6.6 that the effective caisson weight apparently has little
effect on the required suctions. This is in contrast to the behaviour in homogeneous sand
where larger caisson weights led to smaller suctions being required for a given
Chapter 6: Centrifuge modelling: Installation behaviour in layered soils
MANH NGOC TRAN 6.4
penetration. The absence of any clear effect of caisson weight, within the range
investigated here, may be attributed to the hydraulic blockage caused by the silt layer.
Considering the very large difference in penetration resistance between jacked
installation (complete blockage) and suction installation (no blockage) in Figure 6.6, it is
likely that even small variations to the extent of hydraulic blockage may result in
significant differences in soil resistance. In the non-plastic silt used here, the silt tendency
to move upward and its scouring may both assist the generation of the upward seepage
gradient in the sand. During a test, these effects are unlikely to develop identically, which
as a result may cause variations in the soil resistance, and effectively mask any
dependence on the required suction due to variations in the caisson weight. The hydraulic
blockage variations could also explain the pressure ‘humps’ (at L/D of about 0.6) seen in
Figure 6.6a, which were not expected from the cone resistance profiles (Figure 6.1)
which indicated uniform and homogeneous sand layers. Despite these effects, the general
linear increase of the suction with depth is still clear.
Figure 6.6 also shows that there is initially a rapid suction pressure increase for the 500
kN caisson. In this case the wall embedment at the end of self-weight penetration, i.e. just
before suction was started, was less than 1 m, so that the caisson tip was still in the silt
layer. A higher penetration force would be expected because of the higher penetration
resistance in the silt indicated by the cone penetration tests. This was indeed reflected in
the observed pressure jump. For the other installations in Figure 6.6, similar pressure
jumps were not recorded because the caisson tip had probably penetrated through the silt
layer under self-weight.
Figure 6.7 shows the suctions required for installation in the case where the surface silt
layer is only 0.5 m thick. The installation was repeated, giving reasonably consistent
results as seen. The suction required for a given penetration is very similar to that in the
previous case with a 1 m thick silt layer. In both cases the suction increases linearly with
penetration, and the suction gradient (the slopes of the responses) are almost the same.
The results obtained here show that varying the thickness of the top silt layer from 0.5 m
to 1.0 m does not have any discernible effect on the suction pressures, indicating that
similar soil effective stress below the silt layer (along the inner wall and at caisson tip
level) has been created in these cases.
Chapter 6: Centrifuge modelling: Installation behaviour in layered soils
MANH NGOC TRAN 6.5
6.2.3 Layered soil with silt layers below the surface
Figure 6.8 shows the suctions required for installation of caissons with equivalent
prototype self-weights of 500 kN and 1500 kN (or 50 and 150 tonnes mass) in the soil
profile with a 1 m thick silt layer, 0.8 m below the soil surface. The initial wall
embedment level during self-weight penetration depends on the caisson weight. For the
500 kN caisson the wall tip is in the upper sand layer at the end of self-weight
penetration, while in the heavier 1500 kN caisson case, the tip has penetrated some depth
into the silt layer. This explains the difference in the initial suction pressure responses,
where the pressure increases relatively linearly over a small depth before increasing
rapidly in the 500 kN case, compared with an immediate pressure jump in the 1500 kN
case. Despite these initial differences, the pressures required for penetration through the
silt layer are much the same. Indeed, as the caisson starts to penetrate into the silt layer, a
rapid and very significant increase in suction was observed. The pressure peaks while the
caisson wall tip is still embedded within the silt layer, then drops rapidly until the tip
reaches the silt-sand interface, after which it increases again with further penetration. The
behaviour is very similar to that observed in the 1g tests discussed in Chapter 4.
The large jump in suction pressures indicates large soil resistances are mobilised as the
caisson penetrates into the silt. This appears to be consistent with the higher cone
resistance in the silt at lower effective stresses (as expected at the caisson tip during
suction penetration). The sharp suction increase also suggests that initially, little force
degradation occurred in the silt with the result that the penetration resistance is probably
more similar to that in jacked installation. The rapid drop in pressure while the caisson
tip is still within the silt is interesting, because the cone test results (Figure 6.2) do not
show any drop in resistance within the silt layer. However, interpretation of the caisson
wall penetration based on the cone resistance profile is complicated by the size of the
cone (1 m in prototype diameter) compared to the 0.03 m equivalent prototype thickness
of the caisson wall. However, it is believed that the rapid drop can be mostly explained
by the uplift of the silt layer caused by the suction, which was observed and discussed
previously in the PIV results in Chapter 4. As this uplift force builds up with the suction,
it weakens and ultimately shears the silt layer along the path of the caisson tip movement,
resulting in a loss of soil resistance, especially at the tip (see the illustration in Figure

Chapter 6: Centrifuge modelling: Installation behaviour in layered soils
MANH NGOC TRAN 6.6
6.9). The sudden drop in suction, as observed in the results, suggests that the reduction in
the penetration resistance is quite substantial. This is consistent with the results in
Chapter 5 that the tip resistance is a significant component, and a reduction in the tip
resistance is likely to cause significant reduction in total penetration resistance. A very
similar behaviour is observed when the caisson penetrates the silt for the soil with the silt
layer at 2 m below the surface, as shown in Figure 6.10.
As the caisson tip penetrates through sand, the suctions in all cases appear to increase
linearly with depth both above and below the silt layers. It is expected that above the silt
layer, the installation would be similar to that in homogeneous sand. However, as the
wall tip approaches the silt layer, a (small) rise in suction pressure can be seen. This is
similar to the observations from the 1g results in Chapter 4. The possible reasons for this
suction rise were mentioned before in Section 4.4.2. Below the silt, some increase in
suction compared with the case of homogeneous sand can be seen, as expected due to the
hydraulic blockage by the silt discussed before. It is also observed that the relatively
linear relationship between suction and wall embedment depth recorded in these soil
profiles is very similar to that observed before in installations through a surficial silt
layer. Figure 6.11 shows a comparison of all these installation responses. They show that
not only are the gradients of the required suction pressures during penetration in sand
very similar, but also the actual values of suction lie within a narrow range for any given
wall embedment. This clearly shows that for the tests reported here, the effect of the silt
layer on the underlying trend of suction required for penetration through the sand is not
significantly affected by the depth of the silt layer below the surface.
These trends are further confirmed by the penetration into the soil profile with two layers
of silt shown in Figure 6.12. This shows that the suction pressures required for
penetration in either the sand layer trapped between the silt layers, or in sand below the
lower silt layer, are very similar to those observed previously. In particular, the suction
pressures required for caisson installation before reaching the second silt layer is very
similar to installations in soil profiles in Figure 6.11 discussed above. The presence of a
second silt layer does not seem to have any significant effect on the installation results
other than the increase in suction required to penetrate the layer itself (a behaviour
consistently observed in this test series).
Chapter 6: Centrifuge modelling: Installation behaviour in layered soils
MANH NGOC TRAN 6.7
It was observed that silt particles were present in the pumping hose in these tests, where
the silt layer had an overlaying layer of sand. This suggests that scouring of the silt layer
was occurring. The inner caisson wall-soil interface is subjected to the most critical
hydraulic flow conditions, and hence scouring of silt is most likely in this region. This
hypothesis is consistent with the observations from the transparent caisson installations in
Chapter 4, where silt scouring at the inner wall-soil interface was seen. The scoured silt
particles can then be transported up along the inner wall by the seepage into the water in
the caisson compartment (which was being gradually pumped out). It is also possible that
not all of the silt collected in the pumping hose came from scoured areas along the inner
caisson perimeter. Given the evidence from the large heave of the internal plug, and
subsequent settling once suction was stopped (discussed in the next section), it is possible
that the complete soil plug became fluidised and that the silt particles could have been
drawn from the body of the internal plug.
6.2.4 Internal heave
The installation of suction caissons in these soil profiles could be achieved, but not
without complications. One of the significant observations in these tests was that
substantial heave occurred inside the caissons, which, as a result, can introduce scouring
around the foundation, and hence adversely affects its performance. The heave discussed
here is defined as in Chapter 5, i.e. the difference between the soil surface levels inside
and outside the caisson. It was determined at the end of installation, when the caisson lid
was considered to be in full contact with the internal soil plug. The contact could be
inferred from both the cessation of caisson movement and a sudden, rapid increase in
suction pressure. For most of the tests with silt layers reported here, the final internal
heave was found to vary between 15% and 20% of the wall penetration. This heave was
considerably higher than for installations in homogeneous sand, where typical final heave
ratios were around 7-9 % at a similar wall depth. After the end of the tests once the
centrifuge was stopped, a small gap, around 5% of the wall embedment (~2 to 3 mm at
model scale) between the caisson lid and the internal soil surface was observed in the
tests with the silt layers, whereas no gap was observed in homogeneous sand. This
suggests that the heave in the sand-silt cases reduced after the termination of suction,
Chapter 6: Centrifuge modelling: Installation behaviour in layered soils
MANH NGOC TRAN 6.8
indicating that the plug was extremely unstable, and could contain water voids or
extremely loose pockets of soil (which was indeed observed and discussed in Chapter 4).
The different post-installation heave observations between homogeneous sand and sand
with silt layers suggest that suction across the silt layers is responsible. As discussed
previously in Chapter 4, the presence of a low permeability silt layer creates a net uplift
force. In other words, the suction pressure may suck the silt disc upward when the
caisson penetrates into the sand below the silt layer. This upward movement would result
in water being drawn into the region immediately below the silt, possibly accompanied
by unstable loosening of the silt (and any overlying material) within the plug.
Essentially, this will lead to a transfer of the suction down to the sand, causing reduction
of the soil effective stress, which assists further penetration of the caisson. The transfer of
suction to the underlying sand, causing it to loosen was indeed observed in the PIV
results shown previously in Chapter 4. When pumping is stopped, the unstable soil,
above where water has been drawn in at the silt-sand interface, will settle down as the
excess pore pressure there dissipates, resulting in a reduction of the overall plug height.
The soil disturbance below the silt, and the water dissipation after the test, were observed
in the 1g experiments presented before in Chapter 4.
6.2.5 Comparison with 1g results
Figure 6.13 shows a comparison between some typical centrifuge and 1g caisson
installation results. It can be seen that the normalised suction in the 1g case is
considerably higher than that in the centrifuge installation, a trend similar to that
observed in the comparison in homogeneous sand (shown previously in Chapter 5). The
difference may again be attributed to the stress dependant behaviour of sand. In addition,
interpretation from direct comparison as the one presented here is complicated by
uncertainties in the differences between 1g and centrifuge test conditions, such as scaling
of the caisson weights. However, in both cases, the average increase in suction pressure
when compared with homogenous sand is observed to be quite similar, in the range of
50% to 100%. It is also noted that the installation in the centrifuge was fast, averaged at
40-60 mm/s, and no piping leading to installation failure (i.e. large amount of water flows
into the caisson without significant penetration) was recorded. The result is consistent
Chapter 6: Centrifuge modelling: Installation behaviour in layered soils
MANH NGOC TRAN 6.9
with the 1g tests observation, where piping did not occur in fast installations (the possible
reasons having been discussed before in Chapter 4).
Although being different quantitatively, in general, there are similarities in the caisson
generic response between centrifuge installations and those at 1g, which may be
summarised as follows:
� During penetration in silt, the suction pressure quickly increased to a peak value,
then rapidly dropped until the wall tip reaches the silt-sand interface. A small rise
in the pressure was also observed when the tip approaches near the silt layer.
� The effect of the silt layer is clear: the suction pressure required during
penetration in sand below the silt layer was higher than that in homogenous sand,
and appeared to increase quite linearly with depth.
� Excessive sand heave was recorded at the end of each test. The soil plug, unlike
that in homogenous sand, was very unstable and the heave reduced after
termination of the applied suction.
� Scouring (erosion) of the silt layer occurred, even in cases where the silt layer
was below the surface.
6.2.6 Summary
This centrifuge test series has revealed typical caisson behaviour that can be expected at
high soil stress levels (similar to prototype stress conditions) in installation of suction
caisson in layered sand-silt soil, where the seepage flow is restricted by the silt layers. It
was found that installation in those soils was possible if sufficient pumping was
available. However, the formation of excessive heave (up to 20% of the penetrated wall
depth), unstable internal soil plug, and silt scouring were also observed. The recorded
suction pressures showed a clear influence of the silt layer. The required pressures in
these cases were higher than for installations in homogenous sand, about 50-80 % higher
on average, but still much less than the equivalent pressure for jacked installation,
indicating that the seepage gradient has caused partial reduction of the soil effective
stress at the caisson tip and along the inner wall. For the tested conditions, the suction
pressures during penetration in sand appeared to increase quite linearly with depth
Chapter 6: Centrifuge modelling: Installation behaviour in layered soils
MANH NGOC TRAN 6.10
despite some differences in the thickness of the silt layer, and its depth below the surface.
The presence of a second silt layer did not seem to affect this trend. The effect of the
caisson self-weight on the suction pressure (within the tested range here) was not clearly
observed in the tests. This may be due to the variations in the seepage blockage of the
silt, which masks the influence of the caisson weight. Comparison with test results at 1g
showed that the caisson generic responses were similar in the two cases.
6.3 Installation in layered uncemented-cemented calcareous sand
This section investigates the caisson installation in North Rankin calcareous sand inter-
bedded by cemented layers. For referencing convenience, the cemented sand layers with
10% and 15% gypsum contents (UCS of 80 kPa and 120 kPa respectively) are referred as
“weaker” and “stronger” cemented layers respectively in this section. Note that these
“strong” and “weak” concepts are used in the context that the strengths of these two
layers are compared relatively to each other. They should not be confused with the
absolute strength of the cementation, which, from the unconfined compressive strength
values, may be classified as weak cementation in both cases. The equivalent prototype
weight of the caisson used (i.e. the 60 mm diameter, 0.3 mm wall thickness caisson) was
500 kN in all tests.
6.3.1 Cone penetration tests
Figures 6.14 to 6.16 show the cone penetration resistance results in the tested soil profiles
(shown previously in Section 2.8). Figure 6.14 shows the cone penetration results in soil
with a cemented layer below the surface. Two curves are shown, one for the soil with a
weaker cemented layer, and the other for the soil with a stronger layer. The thickness of
the cemented layer in both cases is similar. Figure 6.15 shows the cone resistance in the
soil where the weaker (and thinner) cemented layer overlays a stronger one, and Figure
6.16 shows the cone profile in soil where these two layers are separated by a layer of
homogenous sand. It can be observed that, unlike the case in silt, the cone resistance in
these cases generally decreases as the cone penetrates into the cemented layer. The
results are contrary to the expectation that higher resistance should be encountered in
Chapter 6: Centrifuge modelling: Installation behaviour in layered soils
MANH NGOC TRAN 6.11
cemented soils, where the soil becomes harder due to the cementation. This may be due
to the cemented layer being fractured, ahead of the advancing cone, due to the stresses
generated by the cone as it penetrates the overlying sand. However, it is noted here that
further evaluation of the effects of cementation from the cone penetration tests is difficult
here, because the thickness of the cemented layers is small compared with the diameter
of the cone (1 m at prototype scale), and the layers are weakly cemented.
Nonetheless, it is observed in Figure 6.14 that the cone resistance is slightly higher for
the soil with the stronger cemented layer. Although this is consistent with the expectation
that the soil is harder, the results are not interpreted further here as the observed increase
is not significant, and may be influenced by small variations in the soil strength. In
Figure 6.16, the effect of the upper cemented layer was not clearly observed in the cone
results. This is, as mentioned above, probably because the cemented layer is too thin to
be detected by the cone. The observation is also similar to that in the layered sand-silt
soil with a 0.5 m silt layer discussed in the previous section.
Figure 6.17 plots all cone penetration results together. The cone profile in homogenous
sand is also included for comparison. It can be seen that the results show relatively
similar trends, and the cone resistance values lie within a narrow range, indicating the
consistency in the soil strength between samples. It also appears that during penetration
in cemented layers, the cone resistance in soils with two cemented layers is higher than
for a single layer. However, this may be again influenced by small variations in the soil
strength, as seen from the range of cone values. Nonetheless, the smooth cone profiles in
sand indicate that the sand in these cases is relatively uniform.
6.3.2 Results
The installation results in soils with a single layer of cemented sand can be seen in Figure
6.18. Figure 6.18a shows the suction pressure response in soils with both weak and
strong cemented layer, and Figure 6.18b compares them with similar installations in
homogenous calcareous sand (which was discussed previously in Chapter 5). As
observed from the results, the effect of the cemented layer on the installation is clear.
Initially, the suction pressures are seen to increase relatively linearly with depth. As the
caisson wall tip reaches the cemented layer, the suction pressure increases to a peak
Chapter 6: Centrifuge modelling: Installation behaviour in layered soils
MANH NGOC TRAN 6.12
value, and then rapidly drops while the caisson tip is still within the cemented layer.
When the wall tip enters the homogenous sand below the cemented layer, a rapid
increase in the suction pressures is observed, followed by a linear trend with depth.
Figure 6.18b shows that the observed linear trend of the suction pressures during caisson
penetration in sand is similar to that in installations in homogenous sand. The suction
pressures in the sand above the cemented layer are, however, lower than that in the
caisson installation with the same self-weight (500 kN equivalent prototype) in
homogenous sand. This is due to the top sand in this case being less dense because of less
vibration time applied during the sample preparation (mentioned before in Chapter 3). In
the sand below the cemented layer, the suction pressures are similar in both gradient and
values, indicating that installation in sand below the cemented layers is the same as that
in homogenous sand. This is consistent with the expectation that since the cemented layer
does not create a hydraulic blockage (as the silt case), its presence will not affect the
seepage flow net in the soil, and hence the penetration resistance will not be affected.
The observed caisson response during penetrating the cemented layers is interesting. For
the weak layer, the suction increase relative to the uncemented sand is not significant.
The suction is, however, clearly larger for the installation through the stronger cemented
layer, with a higher pressure peak recorded. This is consistent with the higher unconfined
compressive strength obtained for the soil. The drop in suction afterwards indicates a
reduction in penetration resistance. As this occurs while the caisson tip is still in the
cemented layer, the results suggest that the reduction is due to the loss of soil resistance
within this layer during the wall penetration. The pressure drop, after reaching a peak, is
similar to the observation during caisson penetration through the silt layers discussed
previously. It is worth noting here that core samples from the test sites, as shown in
Figure 3.14, indicated that cementation occurred throughout the whole layer. Hence the
reduction in suction observed during the penetration in the lower part of the layer is
unlikely to be due to the possibility that cementation may not occur there.
While the general behaviour in caisson penetration through silt and cemented layers is
similar (i.e. the suction pressure peaks and rapidly drops while the caisson wall tip is still
within the layer), the mechanisms leading to the suction reduction in the two cases are
likely to be very different. In the silt case, it has been suggested that the reduction occurs
Chapter 6: Centrifuge modelling: Installation behaviour in layered soils
MANH NGOC TRAN 6.13
because of the uplift of the silt layer, which shears and weakens the soil along the caisson
tip path. However, no uplift occurred in the cemented layer because a hydraulic barrier
was not created. This was evident from the penetration results below the cemented layer
presented above, and the observation of insignificant heave, discussed later in this
section.
Hence, it is likely that a different mechanism was involved. Further examination of the
results in Figure 6.18b show that the suction pressure drops to a value lower than that in
homogenous sand, indicating that the soil resistance in this part of the cemented layer is
lower than that in sand. A possible explanation for this observation is the formation of
cracks in the cemented layer. As the caisson tip penetrates into this “brittle” soil layer,
the stresses exerted on this layer may create cracking in the soil (similar to those
observed from UCS tests in Figure 3.12b) underneath the caisson wall tip. The cracks
may result in very significant reduction of the soil resistance on the caisson rim, which is
indeed reflected by the large suction drop in the results in Figure 6.18. The mechanism
discussed is further illustrated in Figure 6.19.
Figure 6.20 shows the result in the soil where the weaker cemented layer overlays the
stronger one (profile shown in Figure 6.15). Figure 6.21 shows the result in similar soil,
but where the two layers are separated by a thin layer of sand (profile in Figure 6.16).
Figure 6.22 compares all the installations through a single and two cemented layers. It
can be seen from the results that, in all cases, very consistent behaviour is observed. The
pressure peaks during penetrating the cemented soil, then rapidly drops to below that in
homogenous sand before picking up and increasing with depth following the same trend
in homogenous sand thereafter. No significant differences in the pressure peaks were
observed in the installations through the two cemented layers. For the case in Figure
6.20, the caisson wall penetrated into the upper cemented layer under self-weight. No
increase in suction pressure was observed, possibly because the layer was too thin and
the cementation was weak.
The results show that the caisson could “punch through” the cemented layer with no
significant adverse effects. In all cases, negligible sand heave was observed, only around
2% of the wall embedment. This is very similar to the result in homogenous sand. Post-
test inspection revealed good contact between the caisson lid and the internal sand plug.
Chapter 6: Centrifuge modelling: Installation behaviour in layered soils
MANH NGOC TRAN 6.14
These observations further suggest that uplift of the cemented layers did not occur in the
tests.
6.3.3 Summary
The study here shows that it is possible to install caissons in sand inter-bedded by weakly
cemented soil layers. During the installation, no piping failure or excessive internal sand
have were observed. When the caisson penetrated through the cemented layers, the
suction pressure was observed to peak, and then dropped rapidly to a very low value,
below that required in uncemented sand. This was consistently observed in all
installations. A possible explanation is due to a crack forming through the cemented layer
underneath the tip, leading to significantly reduced caisson tip resistance. In sand below
and above the cemented layers, the suction pressure trend is very similar to that in
homogeneous sand, consistent with the expectation that since the cemented layers do not
create a hydraulic blockage, their presence will not affect the seepage flow net in the soil,
hence the penetration resistance.
6.4 Conclusions
The centrifuge tests in this chapter have shown that installation of suction caissons is
possible in layered sands-silt and layered cemented-uncemented soils. In both cases, the
suction response during penetrating the layer was similar, where the pressures were seen
to increase to a peak, then rapidly dropped while the caisson wall tip was still within the
layer. This pressure reduction is, however, likely to be caused by very different
mechanisms in the two cases. In the layered sand-silt case, the reduction (to the level for
homogenous sand) is thought to be because of the uplift of the silt under the influence of
the suction pressure. In the layered cemented-uncemented soil, the reduction (to well
below the level for homogenous sand) was most likely caused by the formation of cracks
in the cemented soil.
Penetration in sand below the silt layered required higher suction pressure compared with
homogenous sand, while penetration below the cemented layer was found to be very
Chapter 6: Centrifuge modelling: Installation behaviour in layered soils
MANH NGOC TRAN 6.15
similar to that in sand. The difference is caused by the hydraulic blockage created by the
silt layer. Although the installation in layered sand-silt was possible, excessive sand
heave was observed in all cases. However, the height of the soil plug reduced after the
suction was turned off, indicating that the soil plug was extremely unstable. The
installation in cemented soil, on the other hand, proceeded well with no significant
internal heave being recorded.
MANH NGOC TRAN 7.1
Chapter Seven
Chapter 7
Numerical Investigation of Suction
Installation Behaviour
7.1 Overview
This chapter presents the numerical simulations of the installation responses observed
previously in Chapters 4, 5 and 6. The numerical analysis is limited to considering the
seepage flow nets and condition for critical hydraulic gradient, under various uniform
and non-uniform permeability regimes corresponding to the model tests. No attempt has
been made to simulate the penetration resistance directly, as this would require good
understanding of the rate effect on the soil resistance, especially at the caisson tip. This
will be discussed further in Chapter 8. In this chapter, the modelling approach is first
described, and the simulated results are then validated against experimental and field data
to check on the applicability of the model. Limitations of the proposed modelling
approach are also discussed. The model is then applied to simulate the sand loosening
observed in the PIV tests discussed in Chapter 4, and to predict the range of loosening in
silica sand during suction installation. The suction pressure trend in the caisson
installations in homogenous sand, including silica sand, calcareous sand and mixed soils,
is then simulated, with the aim to establish the general principles underlying the suction
Chapter 7: Numerical investigation of suction installation behaviour
MANH NGOC TRAN 7.2
response for different combinations of self-weight and wall thickness. This simulation is
also extended to other installations, including field ones. The last part of this chapter
explores the influence of the hydraulic blockage created by the silt layer on the
installation in layered sand-silt soil. For this case, different penetration stages during the
installation, where the caisson wall tip is above, in and below the silt layer, are
investigated, focusing on the groundwater head distribution in the soil.
7.2 Numerical simulation approach
7.2.1 Model description
The caisson penetration at any stage can be considered as a self-balancing process
between the total driving force, which includes the caisson submerged dead weight and
the suction force acting on the caisson lid, and the soil resistance. In other words, at any
wall embedment level, the total driving force is in equilibrium with the soil resistance,
and the caisson will not penetrate deeper until a higher driving force is applied (through
suction in this case). Therefore, it is possible to assume that the continuous caisson
penetration is a combination of a series of discrete movements. This allows the process to
be modelled using the finite element (FE) method.
The numerical simulations in this study were conducted based on the above assumption.
The FE package PLAXIS was used to simulate the test results. At any specific wall
embedment, the seepage induced by the pressure difference (suction) at that stage is
assumed to be at an instantaneous steady state. The validity of this assumption will be
checked and discussed in the next section. The experimentally recorded wall penetration
depth and differential pressure at that depth were used as inputs. Permeability k is another
important input parameter, which varies depending on the density of the investigated
sand. This will be investigated later in this chapter.
The model geometry and boundary conditions for each simulation were similar to those
from the test. In particular, the side and bottom boundaries (i.e. the test chamber
boundaries) were chosen as “no flow” boundaries. The boundary along the caisson centre
line (note that only half caisson was modelled) was also chosen as “no flow” due to the
Chapter 7: Numerical investigation of suction installation behaviour
MANH NGOC TRAN 7.3
caisson symmetry. Fine mesh was used in all simulations, although it was found that
using a coarser mesh did not result in significant differences in the seepage flow results.
7.2.2 Validation with measured data
To check the applicability of the proposed modelling approach, the FE results will be
compared with test data. These are performed for both 1g tests and centrifuge tests.
Comparison with the field data from the Draupner E platform installation will also be
made.
Figures 7.1 compares the theoretical seepage calculated from the FE modelling with test
results from both a 1g installation of a 100 mm diameter caisson, and a centrifuge
installation of a same diameter caisson model (i.e. 100 mm diameter). The theoretical
seepage was calculated using the suction pressures recorded from the tests, which
resulted in an identical curve for both 1g and centrifuge installations as seen. The
simulations were conducted assuming a single value of sand permeability kplug = ko = 1.0
× 10-4 m/s (typical permeability value for the tested density), where kplug is the
permeability of the internal sand plug, and ko is that of the surrounding sand (see the
illustration in Figure 7.2). The same value of kplug was also used in the normalisation of
the experimental data in Figure 7.1. It can be seen from these results that while the
theoretical flow appears somewhat lower than the experimental one, it captures the
behaviour of the measured seepage very well. This suggests that the method of breaking
down the installation into a series of discrete self-balancing movements can satisfactorily
simulate the process. The assumption that the seepage flow, which occurs as a result of
the differential pressure at any instant, can be described as steady state flow at that
instant also appears to work well. The higher measured seepage values can be explained
by loosening of the sand plug inside the caisson, and the resulting increase of
permeability in the plug. This is illustrated in the results in Figure 7.3a and b, where
kplug/ko ratios were increased to 1.5 and 2.0 to account for sand loosening (a more
thorough investigation of the likely loosening range of the internal sand plug during
suction installation will be presented later in this chapter). It can be seen that better
agreement was indeed obtained in these cases.
Chapter 7: Numerical investigation of suction installation behaviour
MANH NGOC TRAN 7.4
The modelling approach is further checked by comparing the theoretical hydraulic
gradient developed along the inner caisson wall and that measured during the installation
of the Draupner E platform installation. Figure 7.4 shows the results assuming a single
value of permeability ko, also taken as 1.0 × 10⁻⁴ m/s. It is worth noting here that
assuming a different (absolute) value of the soil permeability does not affect groundwater
head distribution, and hence the hydraulic gradient result. It can be observed that the
theoretical hydraulic gradient captures the measured trend very well, once again
illustrating that the modelling approach performs reasonably well. The higher theoretical
hydraulic gradient is likely to be due to the assumption of a single permeability value
kplug = ko. Figure 7.5 shows the results where kplug is assumed to increase to 1.5 and 2.0ko.
It can be seen that the results in these cases, especially in the latter case, indeed agree
much better with the recorded one.
7.2.3 Limitations of the modelling approach
The above results have shown that the proposed FE modelling method can simulate the
installation reasonably well. However, this approach has some limitations. Strictly
speaking, the seepage flow during installation may never be in a true steady state because
both the suction pressure (seepage creator) and embedded wall length (seepage cut-off)
vary continuously during caisson penetration. Hence, the proposed model, which
assumes steady seepage flow, only work in cases where either the installation is slow
(such as the “lower bound” slow installation at 1g), or a full seepage flow net develops
very rapidly (such as at the higher effective stress level in a centrifuge test, with water as
the pore fluid). In other words, it may not be applicable to installations such as those
involving fast pumping rates at 1g, where a steady state seepage flow net was thought not
to have been achieved at each wall penetration depth.
The model capability is also limited by the difficulties in correctly simulating the plug
loosening during installation. Practically, the sand in regions along the inner wall is likely
to loosen more than those towards the centre of the plug. This was indeed observed in the
PIV test results shown previously in Chapter 4, although the loosening in these PIV
results is believed to be excessive due to the caisson being fixed. The exact extent to
which these regions extend towards the plug, and the sand permeability in those regions

Chapter 7: Numerical investigation of suction installation behaviour
MANH NGOC TRAN 7.5
are not known (see the illustration in Figure 7.6), which, to some extent, may affect the
model performance. In this study, a single value of average permeability was assumed for
the whole plug to simplify the problem when predicting the average plug loosening
(during a suction installation test), or in the calculations of the hydraulic gradient.
7.3 Modelling of sand loosening
7.3.1 Simulation of the PIV results
In this section, the silica sand deformation recorded in the PIV tests will be numerically
simulated. It should be noted that the observed sand movement is created by seepage.
Indeed, when seepage flows through sand, it tends to drag the sand particles with it
(through the seepage body force), and eventually mobilises the particles once the drag
force is large enough. Therefore, a study of seepage flow may help explain the recorded
pattern of sand movement. Theoretically, the soil movement velocity should be less than
the seepage flow velocity unless piping occurs. The test geometry and suction pressures
measured in the experiment were used as the input parameters in the simulations. A
uniform value of permeability ko = 1.0 × 10⁻⁴ m/s was adopted.
Figures 7.7a, b and c show the contours of the experimentally recorded sand movement
velocities (in mm/s). The theoretical seepage velocities, also in mm/s, on the right hand
half of each wall embedment case from the FE simulations are shown in Figures 7.8a, b
and c accordingly. The results clearly show a close relationship between the theoretical
velocities of the seepage flow and the measured velocities of the sand in the caisson. The
simulated results show that seepage velocities around the caisson tip are very high, with
extreme flow conditions near tip level. Considering the direct influence of seepage
velocity on the sand stability as indicated above, this leads to the impression that under
the applied suction, significant sand mobilisation will occur not only in the region
immediately inside the wall, but also in the region outside the caisson wall, possibly by
flowing into the caisson. While this is indeed reflected by the high measured sand
velocities inside the caisson in Figure 7.7, it is clearly not the case for the outside zone
where no significant movements are recorded. This may be because, unlike the inside
zone where upward flow lifts the soil up and creates volume expansion and piping
Chapter 7: Numerical investigation of suction installation behaviour
MANH NGOC TRAN 7.6
conditions, the outside downward flow increases the effective stress on the soil skeleton,
hence restricting its movement.
It is also noted that the theoretical seepage flow distribution for the inside region in
Figure 7.8 compares well with the recorded sand velocity pattern. However, the values of
seepage velocity from the simulated results are smaller than the sand velocities in the
high velocity zones (i.e. in the ‘wedge’ regions). This is unexpected as seepage flow
velocity is expected to be higher or equal to the sand velocities because the soil is
transported by seepage. These results may be due to adopting a uniform value of
permeability in the simulations. In reality, sand expansion will increase the soil
permeability in these high flow velocity zones, in turn leading to faster seepage flow.
Indeed, PLAXIS simulations, shown in Figures 7.9a,b and c, where “wedges” with twice
the initial permeability were modelled (i.e. kwedge = 2ko = 2.0 × 10⁻⁴ m/s) clearly show
much higher seepage velocity in these zones, and hence agrees better with the measured
sand velocity pattern.
7.3.2 Estimation of plug loosening in silica sand
This section discusses the estimation of the level of loosening observed in silica sand.
Loosening of the internal sand plug inside the caisson in this case cannot easily be
investigated directly, but can be achieved instead by examining the seepage flow field
into the caisson. When the sand plug loosens, its permeability will also change, resulting
in differences in the amount of seepage. As mentioned above, it is likely that sand
loosens more adjacent to the caisson wall than towards the middle of the plug due to the
shorter hydraulic path (hence higher hydraulic gradient) as seen in Figure 7.6. However,
as discussed, different values of k along the wall and towards the plug centre will be
represented by a single average permeability value, kplug, for the whole plug as illustrated
in Figure 7.3. To some extent, this assumption is not unreasonable as observations from
previous 1g installation tests showed that the sand plug moved up quite uniformly. By
varying kplug until the theoretical seepage matches the measured one from the tests, the
level of loosening at that stage can be predicted using the permeability - void ratio
relationship shown previously in Figure 3.2. Figures 7.10a and b show a typical result
where kplug was unchanged (Figure 7.10a), and kplug was varied (Figure 7.10b) to match
Chapter 7: Numerical investigation of suction installation behaviour
MANH NGOC TRAN 7.7
the experimentally recorded seepage (note: the seepage shown in the figure is as recorded
from the test, and the kplug/ko ratio used to calculate the results in Figure 7.10b will be
presented next).
The above process was conducted for various installation tests, and the predicted plug
permeability change during installation is shown in Figure 7.11a. It shows the results as a
function of permeability ratio, i.e. the ratio between the estimated kplug (to match the
measured seepage rate) and the initial permeability ko (= 1.0 × 10⁻⁴ m/s) when the test
was started. It is seen that, for the reported sand and test conditions, the ratio remains
below 2, typically varying between 1 and 2 with an average of around 1.5. These values
appears reasonable considering the sand kmax and kmin in Figure 3.2, where the maximum
permeability ratio that can be achieved is only about 4, unless piping of the sand occurs.
For the investigated sand, this is probably the highest value for the plug to remain
practically stable. The relatively small permeability range predicted here suggests that
assuming a larger k ratio for the tested sand, say 4 or 5, in a numerical analysis is
unlikely to be true unless the sand in the plug is unstable (piping).
Based on the permeability change estimated above, the plug loosening can be predicted
using the relative density-permeability relationship shown in Figure 3.2a. The results are
shown in Figure 7.11b. The majority of the centrifuge tests show a similar trend of
reducing relative density with increasing penetration, reaching an average relative density
Dr of about 60%. This is consistent with previous 1g test observations that more heave is
likely to form with deeper wall embedment. However, the 1g test included on Figure
7.11b shows a much more rapid loosening of the soil than in the centrifuge tests. This can
be explained by the lower stress levels at 1g, allowing more sand dilation. In one test, the
relative density dropped to as low as 42%, but on average the estimated final plug
relative density is about 60-70 %, suggesting that the initially dense soil column is likely
to loosen to a medium, medium-dense condition during installation.
The predicted plug loosening estimated above was also checked against the experimental
measurements. This was achieved by comparing the theoretical heave resulted from the
estimated sand loosening against the recorded final sand heave. The expansion associated
with the k/ko ratio of 1.5 gives an average heave of 5-6 % of the final embedded wall
length. This may be compared with typical total heaves averaged at 8% measured in the
Chapter 7: Numerical investigation of suction installation behaviour
MANH NGOC TRAN 7.8
tests. In suction installation in sand, the total heave is caused by the volumetric expansion
of the loosened sand, the sand displaced by the caisson wall and the sand inflow, if any,
into the caisson. Hence heave caused by the sand expansion alone should be smaller than,
or at most equal to, the total recorded heave. The estimated loosening thus appears to be
in reasonable agreement with the experiments. The heave due to loosening (or sand
expansion in volume) is only slightly lower than the total heave, consistent with the
previous PIV observations that most of the heave is created by plug expansion.
7.4 Modelling of installation in homogenous sand
7.4.1 Review of the general suction pressure trend
Before the results from the numerical simulations on the variation of suction pressures in
installation in homogenous sand are presented, the general suction trends are briefly
summarised here. The trends being investigated here are those from the centrifuge tests,
where the suction pressure was observed to be unique (i.e. similar to the “lower bound”
suction in the 1g tests), and the soil stress condition was more similar to that in prototype
cases. These centrifuge observations also represent a more general behaviour, because
the results were taken from different installations for various conditions and soil types.
As discussed previously in chapter 5, the suction curves always appear to follow a very
similar trend, consisting of two stages: a transitional stage (1st stage), where the pressures
either rise almost instantaneously (calcareous sand), or rise rapidly to start with before
increasing relatively quasi-linearly with depth (silica sand and mixed soils). In the second
stage, the pressure increases with depth following a distinct pressure slope. The slopes of
the suction pressure, when normalised against the soil submerged weight γ', are seen to
be very similar for installation in different soils. This trend was illustrated before in
Chapter 5 in Figures 5.38 and 5.39.
7.4.2 Development of hydraulic gradient along the caisson wall
A series of FE simulations of the suction installation were conducted to investigate the
above suction pressure trend, using the recorded suction values as inputs. It has been
Chapter 7: Numerical investigation of suction installation behaviour
MANH NGOC TRAN 7.9
observed in Chapter 5 that in suction installation in sand, the generated seepage gradient
(i.e. hydraulic gradient) significantly reduces the sand resistance, evident from the
comparison of the suction installation and jacked installation results. Furthermore, it was
also shown in Chapter 5, and above, that in various types of soils, including silica sand,
calcareous sand and mixed soils, normalisation of suction pressures by the soil γ', which
also determines the critical hydraulic gradient as ic = γ'/γw (ic is the critical hydraulic
gradient of the soil), gives a very similar suction penetration slope. This result suggests
that the hydraulic gradient is a key parameter in installation in sand. Therefore, the FE
simulations focused on the pore pressure field within the caisson, and in particular the
hydraulic gradient i developed along the inner caisson wall during installation. The
purpose of these analyses has been to investigate if there is a link between this gradient
and the pressure response described above.
Figure 7.12a shows the hydraulic gradient results from the FE simulations for installation
in silica sand, using the recorded suction seen in Figure 5.5 as inputs. The permeability
ratio kplug/ko was assumed as 1.5 in all cases, which corresponds to the average plug
loosening estimated before. The analyses reveal two different mechanisms for the
development of hydraulic gradient i during suction installation: a rapid increase in i
initially, and a relatively stable i during the remaining installation. It is found that there is
good link between this hydraulic gradient pattern and the suction pressure response. A
typical result is illustrated in Figure 7.12b. It is seen that the rapid increase in gradient i
coincides with the initially higher slope in the recorded suction, while the stable i, of
around 1 here, is observed for the rest of the installation, where the pressure increase with
depth following the linear (distinct) trend. Note that the critical hydraulic gradient ic =
γ'/γw is about 1 for the soil conditions tested, this suggests that the observed distinct
pressure slope corresponds to a critical hydraulic gradient condition existing along the
inner caisson wall.
This observation was checked in a second series of FE simulations, where the hydraulic
gradient along the inner wall was forced to equal ic (i.e. the critical condition) for
installations in different soils. For silica sand which has soil unit weight γ'= 10 kN/ m3, ic
was taken as 1, and kplug/ko of 1.5 was assumed in the simulations. For calcareous sand, ic
was taken as 0.6 as γ' is only 6 kN/m3, and kplug/ko = 1 was assumed because no plug
Chapter 7: Numerical investigation of suction installation behaviour
MANH NGOC TRAN 7.10
loosening was observed for this soil. The resulting variations in pressure for silica sand
and calcareous sand are shown in Figure 7.13 and 7.14. The results are for both 6 m and
10 m diameter caissons. It can be that these theoretical pressure responses agree very
well with the recorded ones. The simulations also show that changes in caisson size do
not appear to have much influence on the suction gradient. This is consistent with the
previous experimental observations in Chapter 5, where the suction responses followed
very similar slopes for the 6 m and 10 m caissons. It is also noted that the caisson wall
thickness (within the range of those used here) has little effect on the suction slope in the
simulations. This explains well the similar slopes obtained in the thin-walled and thicker-
walled caisson installations in Figures 5.7, 5.24 and 5.31. For mixed soils, the value of γ'
was similar to that for silica sand, thus ic was also the same. The above result suggests
that the critical pressure slope for these soils should be similar to that in silica sand. This
was indeed observed from the installation results (e.g. Figure 5.39).
It is also found that normalising the suction pressure by the effective overburden stress at
tip level, p/γ'L, is a good indicator of the hydraulic gradient along the caisson wall.
Figure 7.15 shows similar behaviour for the hydraulic gradient i and normalised pressure
p/γ'L, with the latter seen to increase when i increases, and peaking when i also reaches
its terminal stable value. The similarity in behaviour is not surprising, as the term p/L in
fact reflects the average hydraulic gradient along the inner wall (after allowing for some
head loss occurring outside the caisson). As discussed above, the behaviour of the
gradient i agrees well with the suction response, hence the pressure term p/γ'L can also be
used to check quickly which stage the installation has reached. An increasing p/γ'L
indicates that the installation is in the transitional stage, while a peak p/γ'L, or the point
where p/γ'L reduces to a stable value, signals the stage of installation where the suction
response follows the slope corresponding to critical hydraulic gradient along the inner
caisson wall. This, as seen in Figures 7.16a and b, also works well for mixed soil and
calcareous sand. For mixed soils, since similar results are obtained, only a typical one is
shown here (in this case, the installation soil with 10% fines content).
7.4.3 Comparison with other installations
This section considers test results from both field installations and model studies and
Chapter 7: Numerical investigation of suction installation behaviour
MANH NGOC TRAN 7.11
compares them with the above findings. Figure 7.17 shows the results from the suction
caisson installations for the Draupner E and Sleipner T platforms (Tjelja, 1995; Bye et
al., 1995; Lacasse, 1999). The soil conditions for both sites comprised very dense sand,
similar to that tested in this study. It can be seen from these results that, in both cases, the
pressures are seen to increase quite linearly with depth initially, but then the gradient
reduces sharply at some point and remains constant for the rest of the installation. The
hydraulic gradient measured along the caisson wall during installation in the Draupner E
platform, shown in Figure 7.17a, agrees well with the observed changes in these suction
slopes. It shows that the hydraulic gradient i increases rapidly initially, then remains
relatively constant at a value of around 1. This confirms that the pressure slope during the
later stage of installation corresponds to conditions for critical hydraulic gradient. These
results are very consistent with the responses discussed in the previous section. Figure
7.17 also includes the hydraulic gradient obtained from FE simulations. It is seen in
Figure 7.17 that in both cases, the point of reaching the critical hydraulic gradient ic is
also the point of slope change in the applied suction. The normalised pressures p/γ'L are
shown to also reflect well the hydraulic gradient responses. In both cases, kplug/ko = 2 was
assumed because this provides the best match with the measured data (see Figure 7.5).
Figure 7.18 shows a typical model test result in dense sand, similar to the sand tested in
the present study, conducted by the Norwegian Geotechnical Institute (NGI) (Erbrich and
Tjelta, 1999). The installation tests were conducted in a pressurised chamber with various
surcharge levels applied to the caisson. The results show a relatively clear trend of the
installation, where the pressures are seen to increase following a distinct slope. This slope
compares well with that corresponding to critical i from FE simulations (in the analyses,
a kplug/ko = 1.5, i.e. similar to that predicted in this study, was assumed).
7.5 Modelling of installation in layered sand-silt soil
FE simulations were also conducted to investigate the installation behaviour in layered
sand-silt soil discussed in Chapter 6. The simulations focused on the distribution of the
groundwater head, as this is thought to be greatly influenced by the presence of a silt
layer. The purpose is to see if the groundwater pattern can be used to explain the

Chapter 7: Numerical investigation of suction installation behaviour
MANH NGOC TRAN 7.12
installation behaviour observed in the tests. Soil permeability values documented in
Chapter 3 were used, i.e. k = 1.0 × 10⁻⁴ m/s for silica sand, and k = 1.3 × 10⁻⁶
m/s for silt.
Due to the caisson symmetry, only the results on the right half of the caisson are shown.
Because the aim here is to explain the installation behaviour conceptually, the
simulations will be conducted only for a typical soil profile.
Figure 7.19a shows the groundwater head distribution for a typical layered sand-silt
profile (similar to the one in Figure 6.3), as the caisson wall tip approaches close to the
silt layer. The groundwater head for homogeneous sand is shown in Figure 7.19b for
comparison. The sand properties in the two cases were kept the same. It is clear from
these simulations that the silt layer causes differences in the ground water head
distribution. More head loss occurs outside the caisson in the sand-silt soil (Figure
7.19a), compared with the homogeneous sand (Figure 7.19b). This implies that with a silt
layer, the downward seepage gradient outside the caisson is higher, which as a result
increases the external wall friction. In addition, the upward seepage gradient inside the
caisson is lower, hence its effect on the reduction of the soil resistance along the inner
wall and especially at the tip is less. Both lead to an increase in the overall penetration
resistance, which explains the observed (small) increase in suction as the wall tip
approaches the silt layer in both 1g tests and centrifuge tests (see Figures 4.34 and 6.10).
Figures 7.20 and 7.21 show the groundwater head distributions when the caisson wall
penetrates in the silt and below the silt layer respectively. As seen from the results, all of
the head loss occurs in the silt layer for both cases. The groundwater heads along the
outside wall and the inner wall (above the silt) are constant, implying that the seepage
gradients are effectively zero along there, diminishing their influence on the penetration
force. In other words, the penetration resistance, especially for the situation in Figure
7.21, would be very much the same as that with no seepage flow (equivalent to jacked
installation). This is obviously not what was measured in the tests, mainly because the
silt layer would not be able to withstand the differential hydraulic head across it, and
would be sucked up. This was clearly observed from the PIV test results in Chapter 4.
The instability can be confirmed by a simple back-calculation from the recorded results
in Figure 6.10. Below the silt layer, at L/D of ~0.5, the recorded normalised suction was
around 0.87 (or ~52 kPa), corresponding to a net uplift force of 147 N. The two force
Chapter 7: Numerical investigation of suction installation behaviour
MANH NGOC TRAN 7.13
components resisting this uplift are the overburden weight, which was around 90 N in
this case, and the skin friction acting at the inner wall-soil interface. The latter is
estimated using the conventional skin friction calculation method, assuming Ktanδ = 0.24
(δ is the interface friction angle). This gives a skin friction of around 24 N, and hence a
total uplift resistance of around 114 N, which is clearly smaller than the uplift force.
Hence the silt disc seen in Figure 7.21 is not in equilibrium. Its upward movement allows
the transfer of the suction to the underlying sand (the mechanism similar to that created
by a moving piston), which reduces the soil effective stress and thus soil resistance.
Changing the silt thickness to 0.5 m, as seen in the results Figure 7.22, does not create
any difference. The groundwater head distribution is essentially the same. As a result, the
uplift mechanism and its subsequent effects on underlying sand can be expected to be
similar in this case.
The caisson penetration can also be assisted by the scouring of the silt along the inner
caisson wall. Figure 7.23 shows the result where the same simulation as in Figure 7.21
was implemented, but allowing a small breakage in the silt layer (simulating the silt
scouring). The results show that although most of the head loss still occurs within the silt
layer, some losses are observed in regions above and below the silt (unlike previously,
where the ground water head was constant in these regions). This leads to the creation of
net seepage gradient in the soil along the caisson wall. Therefore, it is expected to create
some (small) degradation effects on the penetration resistance, which further assists the
installation. In addition, it is observed that since most of the head loss still occurs within
the silt layer, a pressure difference is maintained across this layer. Hence the uplift
movement of the silt, and the transfer of suction to the underlying sand (discussed
previously) still occurs. This illustrates that during suction installation below the silt, it is
likely that the reduction in the penetration resistance compared with jacked installation
(seen in Chapter 6) is caused by both of the silt uplift and silt scouring mechanisms.
7.6 Summary and conclusions
In this chapter, numerical modelling was conducted to simulate the experimental data. It
was shown that the sand deformation pattern recorded in the PIV tests could be well
Chapter 7: Numerical investigation of suction installation behaviour
MANH NGOC TRAN 7.14
simulated by the pattern of seepage velocities. The level of sand loosening observed in
the caisson installations in silica sand was predicted, and found that the internal plug was
likely to be in the medium, medium dense state. The average relative density was
estimated in the range of 60-70 %, resulting in an increase in average permeability by a
factor of 1.5 to 2. Modelling of the variation in suction pressure in homogenous sand was
also conducted. The most significant observation is that the suction pressures will
ultimately increase with wall embedment depth following a distinct pressure slope. This
‘critical hydraulic gradient’ slope corresponds to that where critical hydraulic conditions
are developed along the inner caisson wall. Installation data from field and other model
tests also show similar results. In layered-silt soil, the FE modelling has also illustrated
conceptually some important installation mechanisms observed in the tests.
MANH NGOC TRAN 8.1
Chapter Eight
Chapter 8
Conclusions
8.1 Summary
This thesis has investigated different aspects of the installation of suction caissons.
Extensive experimental programmes on model caissons at both normal gravity and at
elevated levels in a geotechnical centrifuge have been conducted to explore the caisson
response during installation. The study focused on installation in various types of dense
sand, including silica sand, calcareous North Rankin sand, and mixed soils where silica
sand was mixed with various contents of silica flour. The effect of pumping rate, caisson
geometry and the use of surcharge on the suction response and internal sand heave
formation was investigated. The thesis also explored the influence of silt and cemented
layers on the installation response. In particular, tests were conducted in various profiles
of layered sand-silt soils and layered uncemented-cemented soils. The formation
mechanism of the sand heave, and the deformation of the silt layer under the influence of
suction were also examined in a separate test programme using a half-caisson model and
particle image velocimetry (PIV) technique. In addition, finite element modelling of flow
patterns was performed to simulate key installation behaviour, including the plug
loosening during suction installation, the principle underlying the suction pressure
Chapter 8: Conclusions
MANH NGOC TRAN 8.2
variation, and the influence of the hydraulic blockage by the silt layer. The conclusions
drawn from this research programme are presented in the following sections.
8.2 Installation in homogenous dense sand
The following conclusions are made for suction caisson installation in homogenous dense
sand:
� The 1g tests showed that pumping rate had some effects on the suction pressure.
When the rate was above a certain threshold, increase in the rate results in an
increase in the suction pressure required at a given wall embedment depth. No
upper limit for this increase in suction was observed in the tests. However, a
lower bound value for the suction pressure was observed for installation rates
below that threshold. In this case, no matter how slow the installation was, the
suction pressure always followed the same response with penetration depth. The
installations in the centrifuge, using water as pore fluid, did not show any rate
dependant behaviour, i.e. the suction pressures obtained in the centrifuge tests did
not vary with installation rate (similar to the “lower bound” suction in the 1g
tests). Although the true cause is not fully understood, the rate dependant
behaviour at 1g is thought to be due to transient effects delaying the development
of seepage flow in the soil, as well as some effects of the downward seepage
gradient on the external caisson wall friction.
� Test observations, especially in the centrifuge, showed that the suction pressure
(i.e. the “lower bound” suction) required during caisson penetration followed very
similar trends in all sands tested. It comprised two different stages: an initial
transitional stage, and a stable pressure slope stage. In the transitional stage, the
pressure response comprised a pressure jump (calcareous sand), or a jump and a
quasi-linear increase with depth (clean and silty silica sands). In the latter stage,
the pressure increased with depth following a distinct slope. Normalisation of this
slope against the soil submerged weight γ' gave a unique response for all sands.
Finite element (FE) simulations show that this unique slope corresponds to the
generation of a critical hydraulic gradient along the inner caisson wall. The
Chapter 8: Conclusions
MANH NGOC TRAN 8.3
numerical simulations also show that the transitional stage corresponds to the
stage during which the hydraulic gradient along the caisson wall is increasing.
Normalisation of suction pressure against penetrated wall depth L (i.e. p/γ'L) is a
good indicator of this hydraulic gradient.
� Centrifuge test results showed that the overall penetration force required during
suction installation was several times smaller than that in jacked installation,
clearly indicating that force degradation has occurred as a result of the generated
seepage gradient in the sand.
� Surcharge lowered the suction pressure required to penetrate the caisson to a
given wall depth. However, it did not appear to change the shape of the suction
pressure response. In cases where larger surcharge was applied (i.e. a heavier
caisson was used), the resulting suction pressure curve was simply shifted along
the wall penetration axis.
� Variations in the caisson absolute size did not appear to affect the suction
pressure trend, which was observed to increase following a very similar pressure
gradient to that for the smaller size caisson, i.e. the “critical hydraulic gradient”
path. Subsequent numerical simulations showed consistent results, in which the
“critical” pressure gradient did not vary significantly with larger absolute caisson
size.
� At a given wall depth, caissons with a thicker wall required higher suction
pressure to penetrate. The increase in the suction force was however very small
compared with the force required during jacking. This suggested that the soil
resistance on the caisson rim reduced significantly during suction installation, but
was unlikely to reduce to zero. Rather, some fraction of the tip resistance was still
present, most likely at the outer corner of the caisson wall due to the downward
seepage gradient, which would increase the soil effective stress there. The suction
pressure trend in the installation of thicker-walled caissons was very similar to
that for the thinner-walled case, increasing with depth following the same
pressure slope (the “critical hydraulic gradient” slope). This was unlike the jacked
results, where a diverging trend was observed. The similar pressure slope
Chapter 8: Conclusions
MANH NGOC TRAN 8.4
observation was further supported by the results from the FE simulations, which
indicated that the caisson wall thickness (within the range in this study) had little
effect on the “critical” suction pressure slope.
� As long as the caisson effective weight remains the same, variation in the initial
penetration wall depth does not cause any ultimate affect on the suction pressure.
In cases where the caisson was arbitrarily pushed to larger depth, the suction
pressure was seen to quickly rise and join that of the installation with shallower
initial wall embedment depth.
� Sand heave and plug loosening was observed in silica sand. Most of the effective
heave (i.e. minus the caisson wall volume) formed during the caisson installation
is likely to be due to the volumetric expansion of the sand plug (sand loosening).
The sand inflow was deduced to be insignificant. Fast pumping surprisingly
reduced the amount of sand heave in the 1g tests. This was probably because the
majority of the seepage flowed along the caisson wall-soil interface, leaving a less
significant portion flowing through the soil bulk. Larger heave was observed in
the installation of thicker-walled caissons. The use of surcharge was found to
reduce the amount of internal heave.
8.3 Installation in layered soils
8.3.1 Installation in layered sand-silt soil
� Installation in layered sand-silt soil was possible if adequate pumping was
applied. In slow pumping installation, piping failure was encountered when the
caisson first penetrated through the silt. However, in rapid pumping installation,
the penetration proceeded well, with no sign of soil piping. This was considered
due to the large thrust available to penetrate the caisson quickly through the silt,
hence effectively cutting off the formation of potential piping channels.
� Scouring of the silt layer was observed in all cases, including in soil where the silt
layer was below the soil surface. This occurred not only along the caisson wall-
soil interface, but probably also from the body of the silt layer. Uplift of the silt
Chapter 8: Conclusions
MANH NGOC TRAN 8.5
layers during caisson penetration is believed to have occurred, as indicated by the
back-calculation from the test results, and the numerical simulations.
� The effect of the hydraulic blockage created by the silt layer on the caisson wall
penetration resistance was clear. It was found that the suction pressure required to
penetrate the caisson in sand below the silt layer was higher than that in
homogenous sand, about 50-80 % higher in this study. The penetration force
below the silt layer was, however, still much less than that during jacking,
indicating that a mechanism leading to a reduction in the soil resistance was
generated. This mechanism is thought to be due to a combination of silt scouring
along the caisson wall-soil interface, reducing the hydraulic blockage, and uplift
of the silt layer, allowing the transfer of the suction to the underlying sand.
� In all cases, the suction pressure increased quite linearly with depth, but at a
higher gradient compared with homogenous sand. This trend was not significantly
affected by the thickness of the silt layer, or its depth below the sand (within the
range in this study). Installation in soils with 2 silt layers did not result in any
noticeable change in the suction pressure trend when compared with that for a
single silt layer.
� Excessive sand heave was observed during the suction installation, with large
voids or extremely loose pockets of soil being observed below the silt layer. For
most of the tests, the final internal heave was found to vary between 15% and
20% of the wall penetration depth, nearly twice that in homogenous sand at the
same wall depth. The plug height was seen to reduce after the suction was turned
off, and water dissipation from below the silt layer was observed. The results
suggest that the resulting soil plug was extremely unstable.
8.3.2 Installation in layered uncemented-cemented soil
� Installation of suction caissons in sand inter-bedded by weakly cemented soil
layers was found to be possible. No negative effects, such as piping or excessive
internal sand heave, were observed. In all cases, the caisson penetration through
the cemented layers proceeded well.
Chapter 8: Conclusions
MANH NGOC TRAN 8.6
� When penetrating the cemented layers, the suction pressure was observed to rise
initially, and then dropped rapidly to a very low value, below that required in
uncemented sand. This observation was thought to be attributed to crack
formation through the cemented layer, underneath the tip. This led to significant
reduction in the caisson tip resistance, which is a major component of the soil
resistance force component, hence reducing the required suction pressure.
� Higher suction pressure was required to penetrate the stronger cemented layer,
compared to weaker layer, or uncemented soil.
� During penetration in sand below the cemented layers, the suction pressure trend
was very similar to that in homogeneous sand. Similar behaviour is also observed
in the sand above the cemented layers. This is consistent with the expectation that
since the cemented layers do not create a hydraulic blockage such as in the silt
case, their presence will not significantly affect the seepage flow net in the soil,
hence the penetration resistance.
8.4 Recommendations and suggestions for further research
An interesting result from this study is the installation rate effect on the suction pressure,
provided this rate is above a certain threshold. However, this was only observed in 1g
tests, not in the centrifuge tests with water as the pore fluid. The mechanism of this
behaviour is not fully understood. The generalised value for this rate threshold for
different cases is also not known. However, this behaviour has potentially significant
implications to offshore practice. It implies that the suction pressure at a certain wall
penetration depth can be “manipulated” by varying the pumping rate (if this rate is above
the “lower bound suction” threshold). The result, if true at prototype scale, will greatly
affect the suction pressure prediction methodology. So far, the rate effect has not been
addressed in any of the proposed methods to predict the suction pressure (e.g.
Hogervorst, 1980; Feld, 2001; Houlsby and Byrne, 2005). Furthermore, it is likely to
affect the structural design of a caisson because the resulting suction force on the
structure may vary depending on the pumping rate. Hence further research into this issue
is recommended, both experimentally and theoretically.
Chapter 8: Conclusions
MANH NGOC TRAN 8.7
Experimentally, it would be preferable if the behaviour can be confirmed in field
installations. Further research on small-scale models is also recommended. This includes
more 1g tests in different installation conditions, focusing on the installation rate around
the “threshold” region, and installation tests in the centrifuge with appropriate silicon oil
as the pore fluid (to account for the effect of increased cv in the centrifuge). On the
theoretical side, it is envisaged that modelling involving the timing effect (i.e. probably
involving the soil cv value) is required to account for this rate effect.
Installations with different rates using fast and slow pumping have their own advantages
and disadvantages. Slow installation can be more beneficial in terms of structural design
of the caisson because the resulting suction force is lower. Furthermore, in cases where
the installation is slow enough to achieve the “lower bound suction” condition, the
suction pressure is more predictable as this is independent of the installation rate.
However, in slow pumping, the installations may be unnecessarily long. In some cases,
such as the sand-silt case in this study, it was not possible to install the caisson by slow
pumping because of piping failure. Fast installations, on the other hand, could prevent
piping in the sand-silt soil, and in other cases, have so far not been found to cause any
negative effects on the installation. Sand heave in these cases even appeared to be smaller
(although this requires further research to reach a firm conclusion). However, the very
large resulting suction during fast installations is clearly not beneficial in terms of caisson
structural design. In addition, if obstructions such as large boulders, or restraint from
other structures, are encountered during fast pumping installations, sand piping failure
could develop very quickly. As a result, less time is available for preventative and
remedial action. These observations are suggested to be taken into account when
choosing the pumping method.
The study here has shown that the “lower bound” suction pressure curve is unique. It is
shifted along the wall embedment axis if a different caisson weight is applied. Hence if
this pressure curve for, say, zero caisson weight is identified, the pressure required in
installations with any other weight can be easily predicted. This study has found that the
general trend of this curve can be predicted from the “critical hydraulic gradient”.
However, the exact position where this curve lies varies depending on the soil resistance,
especially the remaining fraction of tip resistance (for example, the results in Figure
Chapter 8: Conclusions
MANH NGOC TRAN 8.8
5.39b). It is possible that this can be predicted using a CPT-based method, similar to that
proposed by Feld (2001). However, this was not attempted here because of uncertainties
in the cone results in the centrifuge, especially at lower penetration depths. In this study,
the maximum soil depth to which the caisson penetrated corresponded to only 6-7 cone
diameters, whereas Bolton et al. (1999) suggested that the cone results only appeared to
stabilise at depths around 10 cone diameters or more. Hence, more research is suggested
in order to calibrate the caisson tip resistance against cone resistance qc.
In the installation in layered soils, further studies on various issues are needed. These
include the effect of stopping and re-starting pumping during installation on the silt uplift
and subsequent penetration resistance below the silt layers; the effective of caisson size
and pumping rate below the silt; the relationship between the cemented soil strength
(UCS) and the tip resistance required to penetrate these layers.
So far, the installations in this study have been conducted under idealised conditions,
where the lateral movement of the caisson was prevented. In practice, this is unlikely to
be the case. In most installations, the caissons are free to move laterally or tilt. Although
there have been some initial studies on this issue (e.g. Erbrich and Tjelta, 1999), the
understanding is still limited. Therefore, research into installations where the caisson is
allowed to tilt during penetration is also recommended.
MANH NGOC TRAN R.1
References
Aas, P.M., Sparrevik, P. and Hylen, S. (2002). “SAL suction anchor in shallow water and
layered soil – a competitive alternative”, 12th International Offshore and Polar
Engineering Conference, Kitakyushu, Japan, presented-only paper.
Alhayari, S. (1998). “Innovative developments in suction pile technology”, Offshore
Technology Conference, Houston, USA. Paper: OTC 8836.
Allersma, H.G.B., Plenevaux, F.J.A. and Wintgens, J.F.P.C.M.E. (1997). “Simulation of
suction pile installation in sand in a centrifuge”, Proc. 7th International Offshore
and Polar Engineering Conference, Honolulu, USA, 1, 761-766.
Allersma, H.G.B, Hogervorst, J.R. and Pimoulle, M. (2001)a. “Centrifuge modelling of
suction pile installation in layered soil by percussion method”, Proc. 20th
International Conference on Offshore Mechanics and Artic Engineering, Rio de
Janeiro, Brazil. Paper: OMAE2001/OFT-1036.
Allersma, H.G.B, Hogervorst, J.R. and Pimoulle, M. (2001)b. “Centrifuge modelling of
suction pile installation using a percussion technique”, Proc. 11th International on
Offshore and Polar Engineering Conference, Stavanger, Norway, 2, 620-625.
Allersma, H.G.B. (2003). “Centrifuge research on suction piles: installation and bearing
capacity”, Proc. BGA International Conference on Foundations, Dundee, UK,
91-98.
Andersen, K.H. and Jostad, H.P. (1999). “Foundation design of skirted foundations and
anchors in clay”, Offshore Technology Conference, Houston, USA. Paper: OTC
10824.
Andersen, K.H., Andersen, L., Jostad, H.P. and Clukey, E.C. (2004). “Effect of skirt-tip
geometry on set-up outside suction anchors in soft clay”, Proc. 23rd International
Conference on Offshore Mechanics and Artic Engineering, Vancouver, Canada.
Paper number: OMAE2004-51564.
Andersen, K.H., Murff, J.D., Randolph, M.F., Clukey, E.C., Erbrich, C., Jostad, H.P.,
Hansen, B., Aubeny, C., Sharma, P. and Supachawarote, C. (2005)a. “Suction
anchors for deepwater applications”, Proc. International Symposium on Frontiers
in Offshore Geotechnics IS-FOG, Perth, Australia, 3-30.
Andersen, K.H., Jeanjean, P., Luger, D. and Jostad, H.P. (2005)b. “Centrifuge tests on
installation of suction anchors in soft clay”, Ocean Engineering, 32, 845-863.
Audibert, J.M.E., Clukey, E. and Huang, J. (2003). “Suction caisson installation at Horn
Mountain – A case study”, Proc. 13th International Offshore and Polar
Engineering Conference, Honolulu, USA, 2, 762-769.
References
MANH NGOC TRAN R.2
Bang, S., Cho, Y., Preber, T. and Thomason, J. (1999). “Model testing and calibration of
suction pile in sand”, Proc. 11th Asian Regional Conference of the International
Society of Soil Mechanics and Geotechnical Engineering ISSMGE, Seoul, Korea,
1, 253-256.
Barusco, P. (1999). “Mooring and anchoring systems developed in Marlim field”,
Offshore Technology Conference, Houston, USA. Paper: OTC 10720.
Bolton, M.D., Garnier, M.W., Corte, J., Bagge, J.F., Laue, G. and Renzi, R. (1999).
“Centrifuge cone penetration tests in sand”, Géotechnique, 49(4), 543-552.
Brown, G.A. and Nacci, V.A. (1971). “Performance of hydrostatic anchors in granular
soil”, Offshore Technology Conference, Houston, USA. Paper number: OTC
1472.
Bruno, D. (1999). “Dynamic and static load testing of driven piles in sand”, PhD thesis,
the University of Western Australia.
Bussemaker, H. (2005). Operations and Engineering Manager, SPT Offshore B.V., the
Netherlands. Private conversation.
Butterfield, R. (1999). “Dimensional analysis for geotechnical engineers”, Géotechnique,
49(3), 357-366.
Bye, A., Erbrich, C., Rognlien, B. and Tjelta, T.I. (1995). “Geotechnical design of bucket
foundations”, Offshore Technology Conference, Houston, USA. Paper: OTC
7793.
Byrne, B.W. (2000). “Investigations of suction caissons in dense sand”, PhD thesis,
University of Oxford, UK.
Byrne, B.W. and Houlsby, G.T. (2002). “Experimental Investigations of the Response of
Suction Caissons to Transient Vertical Loading”, Journal of Geotechnical and
Geoenvironmental Engineering, 128(11), 926-939.
Byrne, B.W. and Houlsby, G.T. (2004). Experimental investigations of the response of
suction caissons to transient combined loading. Journal of Geotechnical and
Geoenvironmental Engineering, 130 (3), 240-253.
Cao, J., Phillips, R., Popescu, R., Ausibert, J.M.E. and Al-Khafaji, Z. (2002). “Numerical
analysis of the behavior of suction caissons in clay”, Proc. 12th International
Offshore and Polar Engineering Conference, Kitakyushu, Japan, 2, 795-799.
Chen, W. and Randolph, M. (2004). “Radial stress around caissons installed in clay by
jacking and by suction”, Proc. 14th International Offshore and Polar Engineering
Conference, Toulon, France, 2, 493-499.
Cho, Y., Bang, S. and Preber, T. (2002). “Transition of soil friction during suction pile
installation”, Canadian Geotechnical Journal, 39, 1118-1125.

References
MANH NGOC TRAN R.3
Christensen, N.H. and Haahr, F. (1992). “A computer program to analyse suction
effects”, Offshore Technology Conference, Houston, USA. Paper number: OTC
6845.
Clukey, E.C., Templeton, J.S., Randolph, M.F. and Phillips, R. (2004). “Suction caisson
response under sustained loop current loads”, Offshore Technology Conference,
Houston, USA. Paper: OTC 16843.
Colliat, J-L., Boisard, P., Andersen, K. and Schoeder, K. (1995). “Caisson foundations as
alternative anchors for permanent mooring of a process barge offshore Congo”,
Offshore Technology Conference, Houston, USA. Paper: OTC 7797.
Colliat, J-L., Boisard, P., Gramet, J-C. and Sparrevik, P. (1996). “Design and installation
of suction anchor piles at a soft clay site in the Gulf of Guinea”, Offshore
Technology Conference, Houston, USA. Paper: OTC 8150.
Colliat, J-L. (2002). “Anchors for deepwater to ultradeepwater moorings”, Offshore
Technology Conference, Houston, USA. Paper: OTC 14306.
Colliat, J-L. and Dendani, H. (2002). “Girassol: geotechnical design analyses and
installation of suction anchors”, Proc. SUT Offshore Site Investigation and
Geotechnics, 107-119.
Cubrinovski, M. and Ishihara, K. (2002). “Maximum and minimum void ratio
characteristics of sands”, Soils and Foundations, 42(6), 65-78.
Deng, W. and Carter, J.P. (2000). “Inclined uplift capacity of suction caissons in sand”,
Offshore Technology Conference, Houston, USA. Paper: OTC 12196.
Deng, W. and Carter, J.P. (2002). “A theoretical study of the vertical uplift capacity of
suction caissons”, International Journal of Offshore and Polar Engineering,
12(2), 89-97.
Dyvik, R., Andersen, K.H., Hansen, S.B. and Christophersen, H.P. (1993). “Field tests of
anchors in clay I: Description”, ASCE Journal of Geotechnical Engineering,
119(10), 1515-1531.
El-Gharbawy, S.L., Olson, R.E. and Scott, S.A. (1999). “Suction anchor installation for
deep Gulf of Mexico applications”, Offshore Technology Conference, Houston,
USA. Paper: OTC 10992.
Erbrich, C.T. and Tjelta, T.I. (1999). “Installation of bucket foundations and suction
caissons in sand - Geotechnical performance”. Offshore Technology Conference,
Houston, USA. Paper: OTC 10990.
Erbrich, C. and Hefer, P. (2002). “Installation of the Laminaria suction piles – A case
history”, Offshore Technology Conference, Houston, USA. Paper: OTC 14240.
Fakharian, K. and Rismanchian, A. (2004). “A new method for reduction of trial and
error in design of suction piles and its application in the Caspian Sea”, Proc. 14th
References
MANH NGOC TRAN R.4
International Offshore and Polar Engineering Conference, Toulon, France, 2,
545-551.
Feld, T., Rasmussen, J.L. and Sorensen, P.H. (1999). “Structural and economic
optimisation of offshore wind turbine support structure and foundation”, Proc.
18th International Conference on Offshore Mechanics and Artic Engineering, St
John’s, Canada.
Feld, T. (2001). “Suction buckets, a new innovative foundation concept, applied to
offshore wind turbines”, PhD thesis, Aalborg University, Demark.
Fines, S., Stove, O.J. and Guldberg, F. (1991). “Snorre TLP tethers and foundation”,
Offshore Technology Conference, Houston, USA. Paper: OTC 6623.
Fuglsand, L.D. and Stensen-Bach, J.O. (1991). “Breakout resistance of suction piles in
clay”, Proc. International Conference Centrifuge 91, Colorado, USA, 153-159.
Goodman, L.J., Lee, C.N. and Walker, F.J. (1961). “Feasibility of vacuum anchorage in
soil”, Correspondence, Géotechnique, 11(4), 356-359.
Haland, G. (2002). “Pro’s and con’s of foundations used for the Aasgard field
development”, Proc. SUT Offshore Site Investigation and Geotechnics, 93-105.
Helfrich, S.C., Brazill, R.L. and Richards, A.F. (1976). “Pullout characteristics of a
suction anchor in sand”, Offshore Technology Conference, Houston, USA. Paper
number: OTC 2469.
Hesar, M. (2003). “Geotechnical design of the Barracuda and Caratinga suction anchors”,
Offshore Technology Conference, Houston, USA. Paper: OTC 15137.
Hogervorst, J.R. (1980). “Field trials with large diameter suction piles”, Offshore
Technology Conference, Houston, USA. Paper: OTC 3817.
Houlsby, G.T. and Byrne, B.W. (2000). “Suction caisson foundations for offshore wind
turbines and Anemometer masts”. Wind Engineering, 24 (4), 249-255.
Houlsby, G.T. and Byrne, B.W. (2005)a. “Design procedures for installation of suction
caissons in clay and other soils”, Proc. ICE - Geotechnical Engineering, 158(2),
75-82.
Houlsby, G.T. and Byrne, B.W. (2005)b. “Design procedures for installation of suction
caissons in sand”, Proc. ICE - Geotechnical Engineering, 158(3), 135-144.
House, A.R., Randolph, M.F. and Borbas, M.E. (1999). “Limiting aspect ratio for suction
caisson installation in clay”, Proc. 9th International Offshore and Polar
Engineering Conference, Brest, France, 676-683.
House, A.R. (2002). “Suction caisson foundations for buoyant offshore facilities”, PhD
thesis, University of Western Australia, Australia.

References
MANH NGOC TRAN R.5
Huang, J.T. (1994). “The effects of density and cementation on cemented sands”, PhD
thesis, University of Sydney, Australia.
Iskander, M.G., Olson, R.E. and Pavlicek, R.W. (1993). “Behavior of suction piles in
sand”, Proc. Design and Performance of Deep Foundations, Dallas, USA, 157-
171.
Iskander, M., El-Gharbawy, S. and Olson, R. (2002). “Performance of suction caisson in
sand and clay”, Canadian Geotechnical Journal, 39, 576-584.
Kelly, R.B., Byrne, B.W., Houlsby, G.T. and Martin, C.M. (2004). “Tensile loading of
model caisson foundations for structures on sand”, Proc. 14th International
Offshore and Polar Engineering Conference, Toulon, France, 2, 638-641.
Kim, Y., Kim, S., Park, J., Kim, S., Kim, H. and Kim, K. (2001). “A centrifuge study of
suction pile installation in sand”, Proc. 11th International Offshore and Polar
Engineering Conference, Stavanger, Norway, 2, 615-619.
Kishida, H. and Uesugi, M. (1987). “Tests of the interface between sand and steel in
simple shear apparatus”, Géotechnique, 37(1), 45-52.
Lacasse, S. (1999). “Ninth OTRC Honors Lecture: Geotechnical contributions to
offshore development”, Offshore Technology Conference, Houston, USA. Paper:
OTC 10822.
Larsen, P. (1989). “Suction anchors as an anchoring system for floating offshore
construction”, Offshore Technology Conference, Houston, USA. Paper number:
OTC 6029.
Mackereth, F.J.H. (1958). “A portable core sampler of lake deposits”, Limnology and
Oceanography, 3(2), 181-191.
Masui, N., Yoneda, H., Zenda, Y., Ito, M., Iida, Y. and Hermstad, J. (2001). “Installation
of offshore concrete structure with skirt foundation”, Proc. 11th International
Offshore and Polar Engineering Conference, Stavanger, Norway, 2, 626-630.
Masui, N., Ito, M., Inoue, A., Shimada, Y. and Hermstad, J. (2004). “Recovery of wall
friction after penetration in skirt suction foundation”, Proc. 14th International
Offshore and Polar Engineering Conference, Toulon, France, 2, 462-646.
Mello, J.R.C., Moretti, M.J., Sparrevik, P., Schoder, K. and Hansen, S.B. (1998). “P19
and P26 moorings at the Marlim field. The first permanent taut leg mooring with
fibre rope and suction anchors”, Proc. FPS’98 Conference on Floating and
Production Systems, 1-11.
Newlin, J.A. (2003). “Suction anchor piles for the Na Kita FDS mooring system. Part 2:
Installation performance”, Proc. International Symposium on Deep Mooring
Systems, Houston, USA, 55-75.

References
MANH NGOC TRAN R.6
North Sea report (1972). “Submersible sounding tools to test North Sea floor”, The Oil
and Gas Journal, 74-77.
Randolph, M.F., Jewell, R.J., Stone, K.J.L., Brown, T.A. (1991). “Establishing a new
centrifuge facility”, Proc. International Conference Centrifuge 1991, Colorado,
USA, 3-9.
Randolph, M.F., O’Neil, M.P. and Stewart, D.P. (1998). “Performance of suction anchors
in fine-grained calcareous soils”, Offshore Technology Conference, Houston,
USA. Paper: OTC 8831.
Rauch, A.F., Olson, R.E., Luke, A.M. and Mecham, E.C. (2003). “Measured response
during laboratory installation of suction caissons”, Proc. 13th International
Offshore and Polar Engineering Conference, Honolulu, USA, 2, 780-787.
Riemers, M. (2005). Managing Director, SPT Offshore B.V., the Netherlands. Private
conversation.
Rusaas, P., Giske, S.R., Barrett, G., Christiansen, P.E. and Baerheim, M. (1995).
“Design, operations planning and experience from the marine operations for the
Europipe jacket with bucket foundations”, Offshore Technology Conference,
Houston, USA. Paper: OTC 7794.
Salgado, R., Bandini, P. and Karim, A. (2000). “Shear strength and stiffness of silty
sand”, Journal of Geotechnical and Geoenvironmental Engineering, 126(5), 451-
462.
Schofield, A.N. (1980). “Cambridge Geotechnical Centrifuge Operations”,
Géotechnique, 30(3), 227-268.
Senpere, D. and Auvergne, G.A. (1982). “Suction anchor piles – A proven alternative to
driving or drilling”, Offshore Technology Conference, Houston, USA. Paper:
OTC 4206.
Sohota, B.S. and Wilson, Q. (1982). “The break-out behaviour of suction anchors
embedded in submerged sands”, Offshore Technology Conference, Houston,
USA. Paper number: OTC 4175.
Solhjell, E., Sparrevik, P., Haldorsen, K. and Karlsen, V. (1998). “Comparison and back
calculation of penetration resistance from suction anchor installation in soft to
stiff clay at the Njord and Visund fields in the North Sea”, Proc. SUT Conference
on Offshore Site Investigation and Foundation Behaviour ’98, 325-349.
Sparrevik, P. (1998). “Suction anchors – A versatile foundation concept finding its place
in the offshore market”, Proc. 17th International Conference on Offshore
Mechanics and Artic Engineering, Lisbon, Portugal. Paper: OMAE98-3096.
Sparrevik, P. (2002). “Suction pile technology and installation in deep water”, Offshore
Technology Conference, Houston, USA. Paper: OTC 14241.
References
MANH NGOC TRAN R.7
Steenseb-Bach, J.O. (1992). “Recent model tests with suction piles in clay and sand”,
Offshore Technology Conference, Houston, USA. Paper number: OTC 6844.
Stevenson, P.R. (2003). “Large scale instrumented offshore suction caisson tests to study
set-up around suction caissons”, Suction caisson research report, Fugro-
McClelland Geosciences, Inc.
Stove, O.J., Bysveen, S. and Christophersen, H.P. (1992). “New Foundation Systems for
the Snorre development”, Offshore Technology Conference, Houston, USA.
Paper: OTC 6882.
Supachawarote, C., Randolph, M. F. and Gourvenec, S. (2004). “Inclined pull-out
capacity of suction caissons”, Proc. 14th International Offshore and Polar
Engineering Conference, Toulon, France, 2, 500-506.
Taylor, R.N. (ed.) (1995). Geotechnical centrifuge technology. 1st edition, Glasgow:
Blackie Academic & Professional.
Tjelta, T.I., Guttormsen, T.R. and Hermstad, J. (1986). “Large-scale penetration test at a
deepwater site”, Offshore Technology Conference, Houston, USA. Paper: OTC
5103.
Tjelta, T.I., Aas, P.M., Hermstad, J. and Andenaes, E. (1990). “The skirted piled Gullfaks
C platform installation”, Offshore Technology Conference, Houston, USA. Paper:
OTC 6473.
Tjelta, T.I (1995). “Geotechnical experience from the installation of the Europipe jacket
with bucket foundations”, Offshore Technology Conference, Houston, USA.
Paper: OTC 7795.
Tjelta, T.I. (2001). “Suction piles: Their position and application today”, Proc. 11th
International Conference on Offshore and Polar Engineering, Stavanger,
Norway, 2, 1-6.
Vardoulakis, I. (2004). “Fluidisation is artesian flow conditions: Hydromechanically
stable granular media”, Géotechnique, 54(2), 117-130.
Wang, M.C., Nacci, V.A. and Demars, K.R. (1975). “Behaviour of underwater suction
anchor in soil”, Ocean Engineering, 3, 47-62.
Wang, M.C., Demars, K.R. and Nacci, V.A. (1977). “Breakout capacity of model suction
anchors in soil”, Canadian Geotechnical Journal, 14, 246-257.
Watson, P.G. and Randolph, M.F. (1997). “Vertical capacity of caisson foundations in
calcareous sediments”, Proc. 7th International Offshore and Polar Engineering
Conference, Honolulu, USA, 2, 784-790.
Watson, P.G. (1999). “Performance of skirted foundations for offshore structures”, PhD
thesis, University of Western Australia, Australia.
References
MANH NGOC TRAN R.8
White, D.J. and Take, W.A. (2002). “GeoPIV: Particle Image Velocimetry (PIV)
software for use in geotechnical testing”. Software manual.
White, D.J., Take, W.A., Bolton, M.D. (2003). “Soil deformation measurement using
particle image velocimetry (PIV) and photogrammetry”, Géotechnique, 53(7),
619-631.
Wilson, Q. and Sohota, B.S. (1980). “Pull-out parameters for buried suction anchors”,
Offshore Technology Conference, Houston, USA. Paper number: OTC 3816.
Yang, S.L., Grande, L.O., Qi, J.F. and Feng, X.L. (2003). “Excessive soil plug and anti-
failure mechanism of bucket foundation during penetration by suction”. Proc.
13rd International Offshore and Polar Engineering Conference, Honolulu, USA,
2, 660-665.
Zdravkovic, L., Potts, D.M. and Jardine, R.J. (2001). “A parametric study of the pullout
capacity of bucket foundations in soft clay”, Géotechnique, 51(1), 55-67.
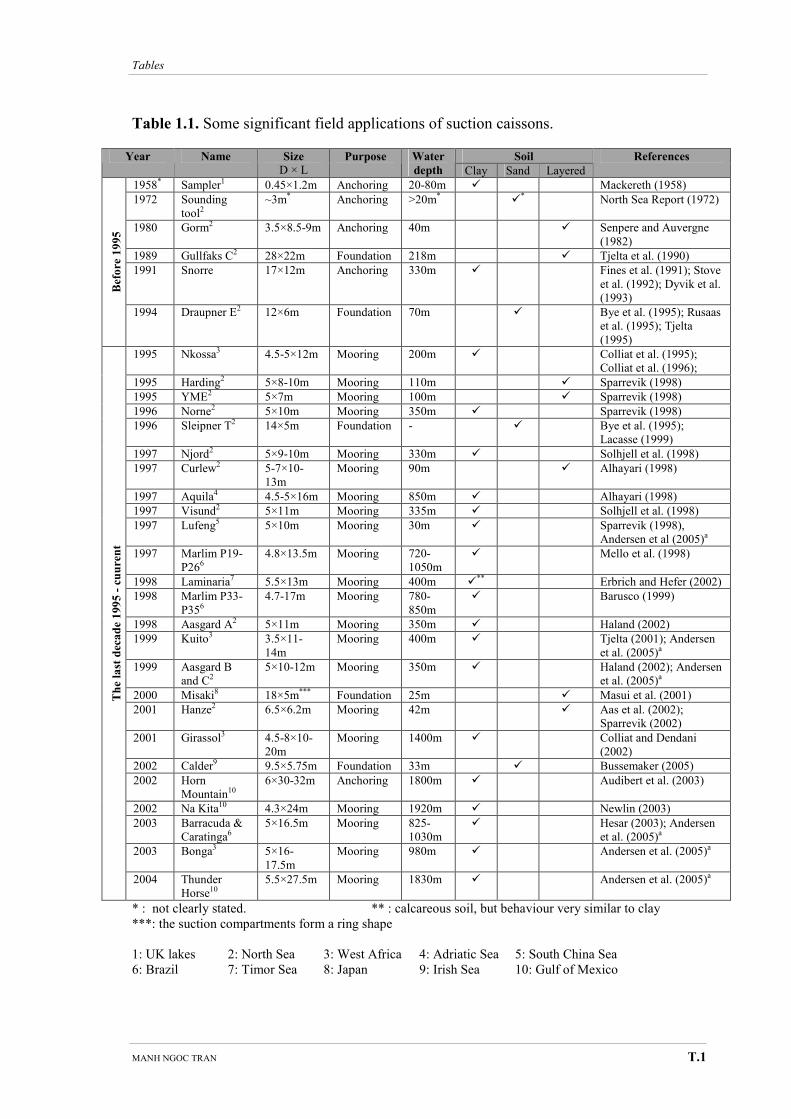
Tables
MANH NGOC TRAN T.1
Table 1.1. Some significant field applications of suction caissons.
Soil Year Name Size
D × L Purpose Water
depth Clay Sand Layered
References
1958* Sampler1 0.45×1.2m Anchoring 20-80m � Mackereth (1958)
1972 Sounding
tool2 ~3m* Anchoring >20m* �
* North Sea Report (1972)
1980 Gorm2 3.5×8.5-9m Anchoring 40m � Senpere and Auvergne
(1982)
1989 Gullfaks C2 28×22m Foundation 218m � Tjelta et al. (1990)
1991 Snorre 17×12m Anchoring 330m � Fines et al. (1991); Stove
et al. (1992); Dyvik et al.
(1993)
Before 1995
1994 Draupner E2 12×6m Foundation 70m � Bye et al. (1995); Rusaas
et al. (1995); Tjelta
(1995)
1995 Nkossa3 4.5-5×12m Mooring 200m � Colliat et al. (1995);
Colliat et al. (1996);
1995 Harding2 5×8-10m Mooring 110m � Sparrevik (1998)
1995 YME2 5×7m Mooring 100m � Sparrevik (1998)
1996 Norne2 5×10m Mooring 350m � Sparrevik (1998)
1996 Sleipner T2 14×5m Foundation - � Bye et al. (1995);
Lacasse (1999)
1997 Njord2 5×9-10m Mooring 330m � Solhjell et al. (1998)
1997 Curlew2 5-7×10-
13m
Mooring 90m � Alhayari (1998)
1997 Aquila4 4.5-5×16m Mooring 850m � Alhayari (1998)
1997 Visund2 5×11m Mooring 335m � Solhjell et al. (1998)
1997 Lufeng5 5×10m Mooring 30m � Sparrevik (1998),
Andersen et al (2005)a
1997 Marlim P19-
P266
4.8×13.5m Mooring 720-
1050m
� Mello et al. (1998)
1998 Laminaria7 5.5×13m Mooring 400m �** Erbrich and Hefer (2002)
1998 Marlim P33-
P356
4.7-17m Mooring 780-
850m
� Barusco (1999)
1998 Aasgard A2 5×11m Mooring 350m � Haland (2002)
1999 Kuito3 3.5×11-
14m
Mooring 400m � Tjelta (2001); Andersen
et al. (2005)a
1999 Aasgard B
and C2 5×10-12m Mooring 350m � Haland (2002); Andersen
et al. (2005)a
2000 Misaki8 18×5m*** Foundation 25m � Masui et al. (2001)
2001 Hanze2 6.5×6.2m Mooring 42m � Aas et al. (2002);
Sparrevik (2002)
2001 Girassol3 4.5-8×10-
20m
Mooring 1400m � Colliat and Dendani
(2002)
2002 Calder9 9.5×5.75m Foundation 33m � Bussemaker (2005)
2002 Horn
Mountain10 6×30-32m Anchoring 1800m � Audibert et al. (2003)
2002 Na Kita10 4.3×24m Mooring 1920m � Newlin (2003)
2003 Barracuda &
Caratinga6 5×16.5m Mooring 825-
1030m
� Hesar (2003); Andersen
et al. (2005)a
2003 Bonga3 5×16-
17.5m
Mooring 980m � Andersen et al. (2005)a
The last decade 1995 - cuurent
2004 Thunder
Horse10
5.5×27.5m Mooring 1830m � Andersen et al. (2005)a
* : not clearly stated. ** : calcareous soil, but behaviour very similar to clay
***: the suction compartments form a ring shape
1: UK lakes 2: North Sea 3: West Africa 4: Adriatic Sea 5: South China Sea
6: Brazil 7: Timor Sea 8: Japan 9: Irish Sea 10: Gulf of Mexico
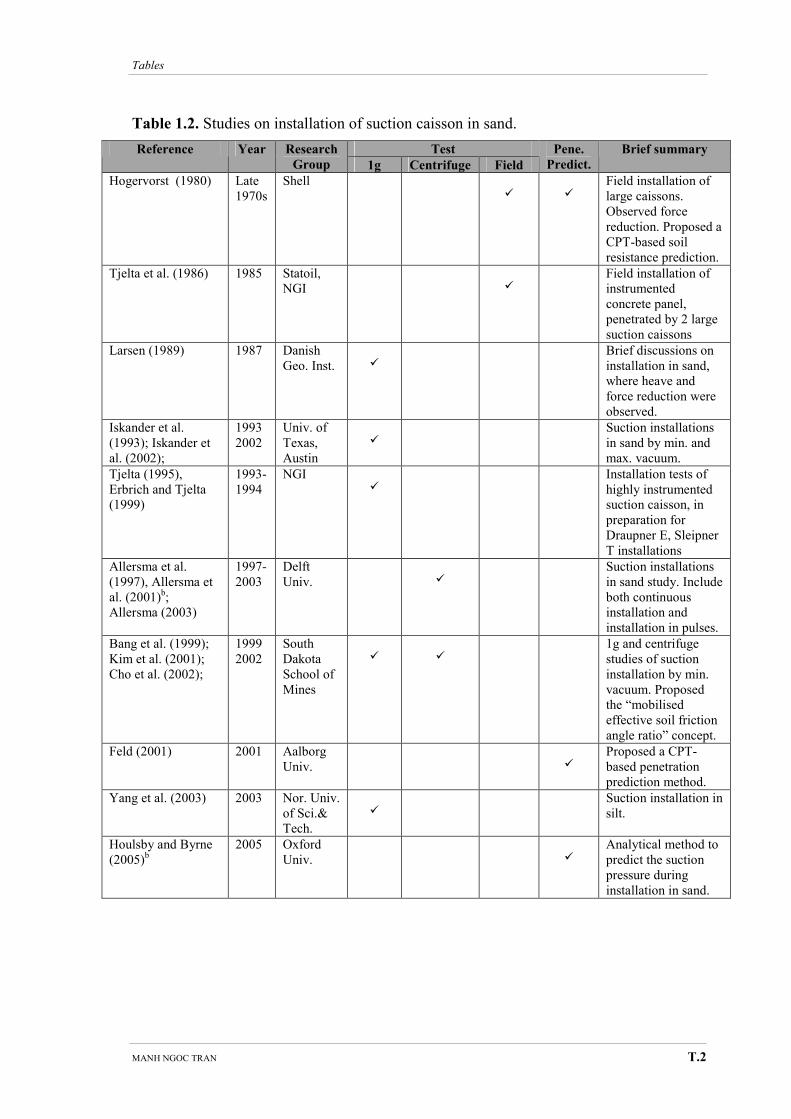
Tables
MANH NGOC TRAN T.2
Table 1.2. Studies on installation of suction caisson in sand.
Test Reference Year Research
Group 1g Centrifuge Field
Pene.
Predict.
Brief summary
Hogervorst (1980) Late
1970s
Shell
�
� Field installation of
large caissons.
Observed force
reduction. Proposed a
CPT-based soil
resistance prediction.
Tjelta et al. (1986) 1985 Statoil,
NGI
� Field installation of
instrumented
concrete panel,
penetrated by 2 large
suction caissons
Larsen (1989) 1987 Danish
Geo. Inst.
�
Brief discussions on
installation in sand,
where heave and
force reduction were
observed.
Iskander et al.
(1993); Iskander et
al. (2002);
1993
2002
Univ. of
Texas,
Austin
�
Suction installations
in sand by min. and
max. vacuum.
Tjelta (1995),
Erbrich and Tjelta
(1999)
1993-
1994
NGI �
Installation tests of
highly instrumented
suction caisson, in
preparation for
Draupner E, Sleipner
T installations
Allersma et al.
(1997), Allersma et
al. (2001)b;
Allersma (2003)
1997-
2003
Delft
Univ.
�
Suction installations
in sand study. Include
both continuous
installation and
installation in pulses.
Bang et al. (1999);
Kim et al. (2001);
Cho et al. (2002);
1999
2002
South
Dakota
School of
Mines
�
�
1g and centrifuge
studies of suction
installation by min.
vacuum. Proposed
the “mobilised
effective soil friction
angle ratio” concept.
Feld (2001) 2001 Aalborg
Univ.
�
Proposed a CPT-
based penetration
prediction method.
Yang et al. (2003) 2003 Nor. Univ.
of Sci.&
Tech.
�
Suction installation in
silt.
Houlsby and Byrne
(2005)b
2005 Oxford
Univ.
� Analytical method to
predict the suction
pressure during
installation in sand.
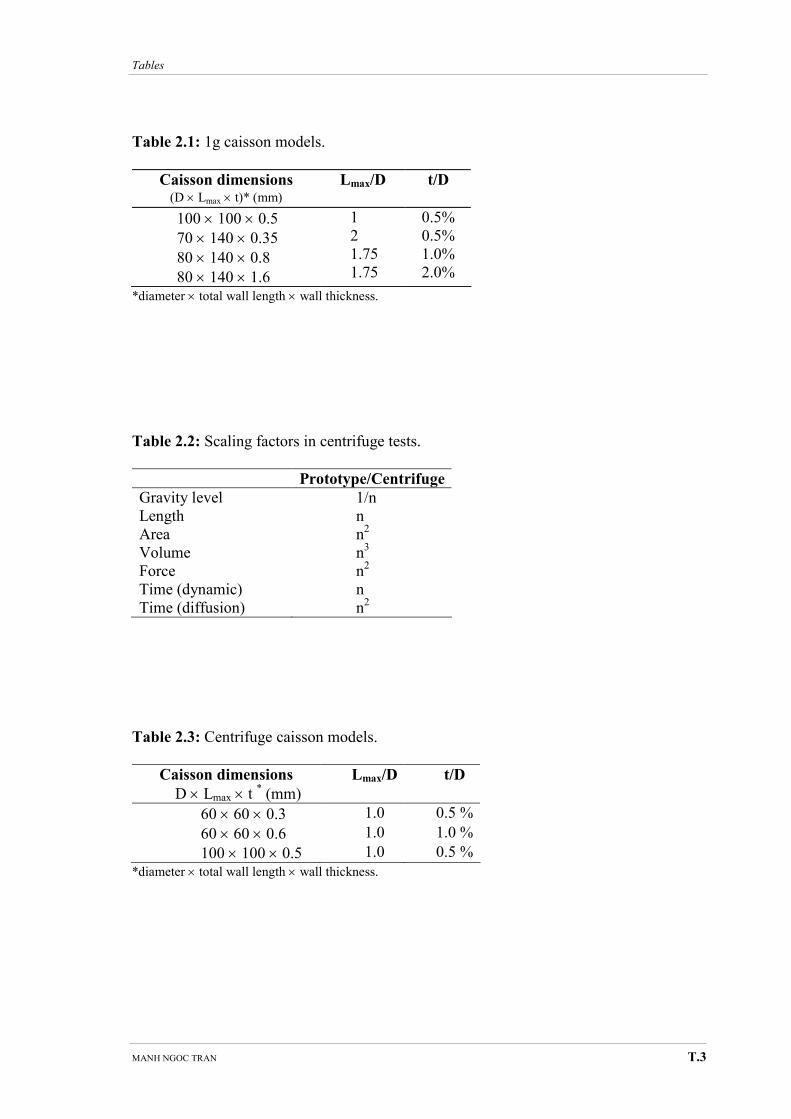
Tables
MANH NGOC TRAN T.3
Table 2.1: 1g caisson models.
Caisson dimensions (D × Lmax × t)* (mm)
Lmax/D t/D
100 × 100 × 0.5
70 × 140 × 0.35
80 × 140 × 0.8
80 × 140 × 1.6
1
2
1.75
1.75
0.5%
0.5%
1.0%
2.0%
*diameter × total wall length × wall thickness.
Table 2.2: Scaling factors in centrifuge tests.
Prototype/Centrifuge
Gravity level 1/n
Length n
Area n2
Volume n3
Force n2
Time (dynamic) n
Time (diffusion) n2
Table 2.3: Centrifuge caisson models.
Caisson dimensions
D × Lmax × t * (mm)
Lmax/D t/D
60 × 60 × 0.3 1.0 0.5 %
60 × 60 × 0.6 1.0 1.0 %
100 × 100 × 0.5 1.0 0.5 %
*diameter × total wall length × wall thickness.
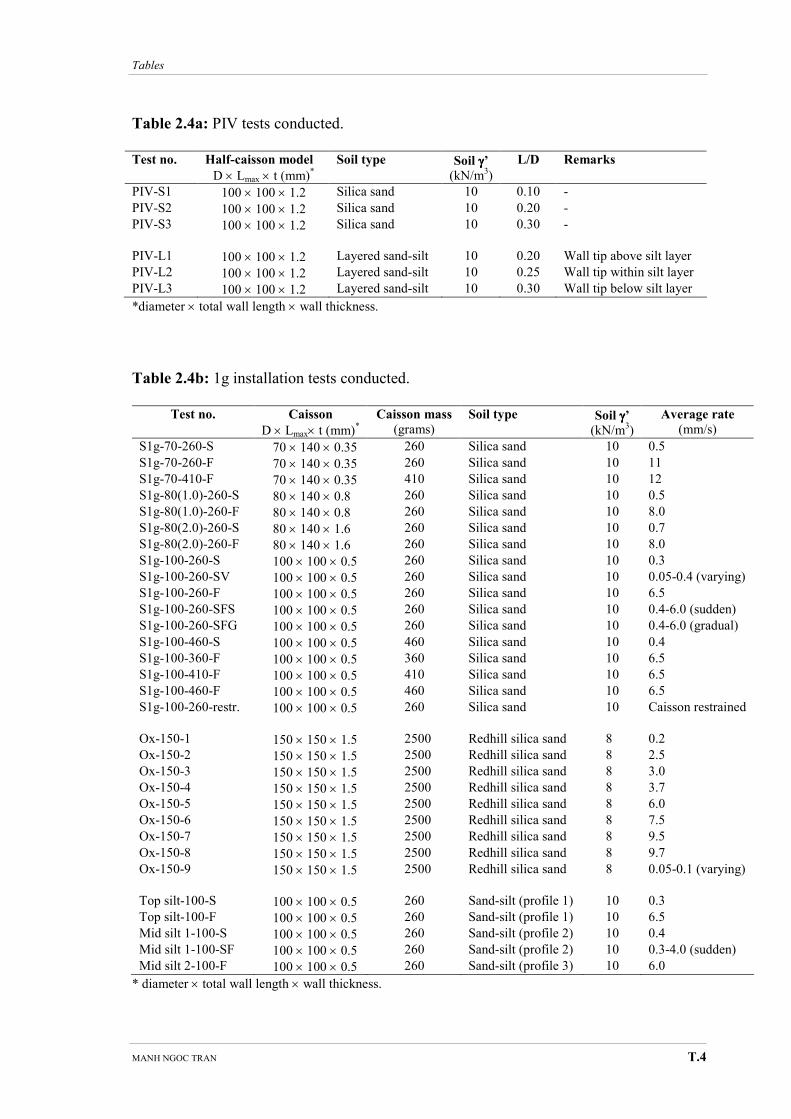
Tables
MANH NGOC TRAN T.4
Table 2.4a: PIV tests conducted.
Test no. Half-caisson model
D × Lmax × t (mm)*
Soil type Soil γγγγ’ (kN/m
3)
L/D Remarks
PIV-S1 100 × 100 × 1.2 Silica sand 10 0.10 -
PIV-S2 100 × 100 × 1.2 Silica sand 10 0.20 -
PIV-S3 100 × 100 × 1.2 Silica sand 10 0.30 -
PIV-L1 100 × 100 × 1.2 Layered sand-silt 10 0.20 Wall tip above silt layer
PIV-L2 100 × 100 × 1.2 Layered sand-silt 10 0.25 Wall tip within silt layer
PIV-L3 100 × 100 × 1.2 Layered sand-silt 10 0.30 Wall tip below silt layer
*diameter × total wall length × wall thickness.
Table 2.4b: 1g installation tests conducted.
Test no. Caisson
D × Lmax× t (mm)*
Caisson mass
(grams) Soil type Soil γγγγ’
(kN/m3)
Average rate
(mm/s)
S1g-70-260-S 70 × 140 × 0.35 260 Silica sand 10 0.5
S1g-70-260-F 70 × 140 × 0.35 260 Silica sand 10 11
S1g-70-410-F 70 × 140 × 0.35 410 Silica sand 10 12
S1g-80(1.0)-260-S 80 × 140 × 0.8 260 Silica sand 10 0.5
S1g-80(1.0)-260-F 80 × 140 × 0.8 260 Silica sand 10 8.0
S1g-80(2.0)-260-S 80 × 140 × 1.6 260 Silica sand 10 0.7
S1g-80(2.0)-260-F 80 × 140 × 1.6 260 Silica sand 10 8.0
S1g-100-260-S 100 × 100 × 0.5 260 Silica sand 10 0.3
S1g-100-260-SV 100 × 100 × 0.5 260 Silica sand 10 0.05-0.4 (varying)
S1g-100-260-F 100 × 100 × 0.5 260 Silica sand 10 6.5
S1g-100-260-SFS 100 × 100 × 0.5 260 Silica sand 10 0.4-6.0 (sudden)
S1g-100-260-SFG 100 × 100 × 0.5 260 Silica sand 10 0.4-6.0 (gradual)
S1g-100-460-S 100 × 100 × 0.5 460 Silica sand 10 0.4
S1g-100-360-F 100 × 100 × 0.5 360 Silica sand 10 6.5
S1g-100-410-F 100 × 100 × 0.5 410 Silica sand 10 6.5
S1g-100-460-F 100 × 100 × 0.5 460 Silica sand 10 6.5
S1g-100-260-restr. 100 × 100 × 0.5 260 Silica sand 10 Caisson restrained
Ox-150-1 150 × 150 × 1.5 2500 Redhill silica sand 8 0.2
Ox-150-2 150 × 150 × 1.5 2500 Redhill silica sand 8 2.5
Ox-150-3 150 × 150 × 1.5 2500 Redhill silica sand 8 3.0
Ox-150-4 150 × 150 × 1.5 2500 Redhill silica sand 8 3.7
Ox-150-5 150 × 150 × 1.5 2500 Redhill silica sand 8 6.0
Ox-150-6 150 × 150 × 1.5 2500 Redhill silica sand 8 7.5
Ox-150-7 150 × 150 × 1.5 2500 Redhill silica sand 8 9.5
Ox-150-8 150 × 150 × 1.5 2500 Redhill silica sand 8 9.7
Ox-150-9 150 × 150 × 1.5 2500 Redhill silica sand 8 0.05-0.1 (varying)
Top silt-100-S 100 × 100 × 0.5 260 Sand-silt (profile 1) 10 0.3
Top silt-100-F 100 × 100 × 0.5 260 Sand-silt (profile 1) 10 6.5
Mid silt 1-100-S 100 × 100 × 0.5 260 Sand-silt (profile 2) 10 0.4
Mid silt 1-100-SF 100 × 100 × 0.5 260 Sand-silt (profile 2) 10 0.3-4.0 (sudden)
Mid silt 2-100-F 100 × 100 × 0.5 260 Sand-silt (profile 3) 10 6.0
* diameter × total wall length × wall thickness.
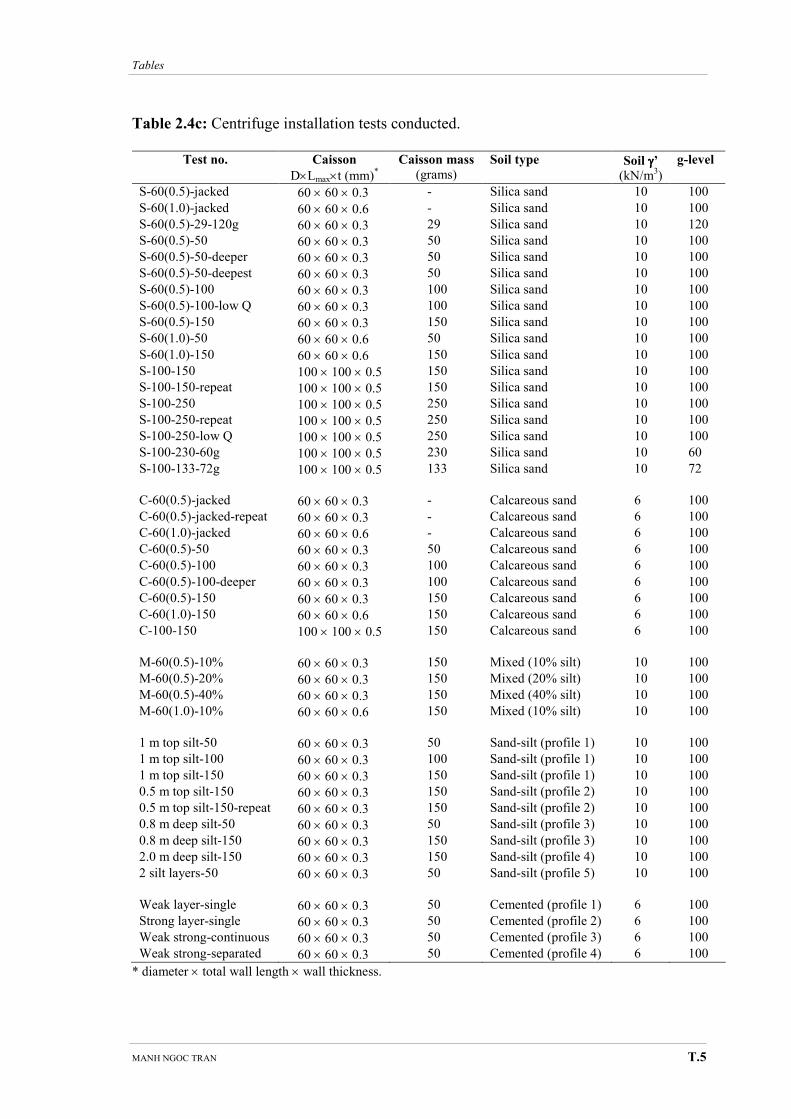
Tables
MANH NGOC TRAN T.5
Table 2.4c: Centrifuge installation tests conducted.
Test no. Caisson
D×Lmax×t (mm)*
Caisson mass
(grams) Soil type Soil γγγγ’
(kN/m3)
g-level
S-60(0.5)-jacked 60 × 60 × 0.3 - Silica sand 10 100
S-60(1.0)-jacked 60 × 60 × 0.6 - Silica sand 10 100
S-60(0.5)-29-120g 60 × 60 × 0.3 29 Silica sand 10 120
S-60(0.5)-50 60 × 60 × 0.3 50 Silica sand 10 100
S-60(0.5)-50-deeper 60 × 60 × 0.3 50 Silica sand 10 100
S-60(0.5)-50-deepest 60 × 60 × 0.3 50 Silica sand 10 100
S-60(0.5)-100 60 × 60 × 0.3 100 Silica sand 10 100
S-60(0.5)-100-low Q 60 × 60 × 0.3 100 Silica sand 10 100
S-60(0.5)-150 60 × 60 × 0.3 150 Silica sand 10 100
S-60(1.0)-50 60 × 60 × 0.6 50 Silica sand 10 100
S-60(1.0)-150 60 × 60 × 0.6 150 Silica sand 10 100
S-100-150 100 × 100 × 0.5 150 Silica sand 10 100
S-100-150-repeat 100 × 100 × 0.5 150 Silica sand 10 100
S-100-250 100 × 100 × 0.5 250 Silica sand 10 100
S-100-250-repeat 100 × 100 × 0.5 250 Silica sand 10 100
S-100-250-low Q 100 × 100 × 0.5 250 Silica sand 10 100
S-100-230-60g 100 × 100 × 0.5 230 Silica sand 10 60
S-100-133-72g 100 × 100 × 0.5 133 Silica sand 10 72
C-60(0.5)-jacked 60 × 60 × 0.3 - Calcareous sand 6 100
C-60(0.5)-jacked-repeat 60 × 60 × 0.3 - Calcareous sand 6 100
C-60(1.0)-jacked 60 × 60 × 0.6 - Calcareous sand 6 100
C-60(0.5)-50 60 × 60 × 0.3 50 Calcareous sand 6 100
C-60(0.5)-100 60 × 60 × 0.3 100 Calcareous sand 6 100
C-60(0.5)-100-deeper 60 × 60 × 0.3 100 Calcareous sand 6 100
C-60(0.5)-150 60 × 60 × 0.3 150 Calcareous sand 6 100
C-60(1.0)-150 60 × 60 × 0.6 150 Calcareous sand 6 100
C-100-150 100 × 100 × 0.5 150 Calcareous sand 6 100
M-60(0.5)-10% 60 × 60 × 0.3 150 Mixed (10% silt) 10 100
M-60(0.5)-20% 60 × 60 × 0.3 150 Mixed (20% silt) 10 100
M-60(0.5)-40% 60 × 60 × 0.3 150 Mixed (40% silt) 10 100
M-60(1.0)-10% 60 × 60 × 0.6 150 Mixed (10% silt) 10 100
1 m top silt-50 60 × 60 × 0.3 50 Sand-silt (profile 1) 10 100
1 m top silt-100 60 × 60 × 0.3 100 Sand-silt (profile 1) 10 100
1 m top silt-150 60 × 60 × 0.3 150 Sand-silt (profile 1) 10 100
0.5 m top silt-150 60 × 60 × 0.3 150 Sand-silt (profile 2) 10 100
0.5 m top silt-150-repeat 60 × 60 × 0.3 150 Sand-silt (profile 2) 10 100
0.8 m deep silt-50 60 × 60 × 0.3 50 Sand-silt (profile 3) 10 100
0.8 m deep silt-150 60 × 60 × 0.3 150 Sand-silt (profile 3) 10 100
2.0 m deep silt-150 60 × 60 × 0.3 150 Sand-silt (profile 4) 10 100
2 silt layers-50 60 × 60 × 0.3 50 Sand-silt (profile 5) 10 100
Weak layer-single 60 × 60 × 0.3 50 Cemented (profile 1) 6 100
Strong layer-single 60 × 60 × 0.3 50 Cemented (profile 2) 6 100
Weak strong-continuous 60 × 60 × 0.3 50 Cemented (profile 3) 6 100
Weak strong-separated 60 × 60 × 0.3 50 Cemented (profile 4) 6 100
* diameter × total wall length × wall thickness.

Tables
MANH NGOC TRAN T.6
Notes: (for all tests in tables 2.4a,b and c)
� All sands were in very dense state (Dr ≈ 91%) except:
+ The top sand layer in the centrifuge sand-silt profile 4 (i.e. in test 2.0m deep silt-150),
which had Dr ≈ 60%, and
+ The top sand layer in layered uncemented-cemented soil, which had Dr ≈ 80%.
� In the layered soils, the listed soil γ’ applies to all materials, i.e.:
+ γ’silt ≈ γ’sand =10 kN in layered sand-silt, and
+ γ’cemented sand ≈ γ’uncemented sand = 6 kN in layered cemented-uncemented soil).
(Details on soil properties are shown in Chapter 3).
� Permeability of the soils:
+ Silica sand: k = 1.0 × 10⁻⁴ m/s
+ Calcareous sand: k = 1.5 × 10⁻⁵ m/s (cemented and uncemented)
+ Silica flour: k = 1.3 × 10⁻⁶ m/s
+ Mixed soils: k = 8 × 10
-5 m/s, 2 × 10
-5 m/s and 0.6 × 10
-5 m/s for soils with 10%,
20% and 40% fines content respectively.
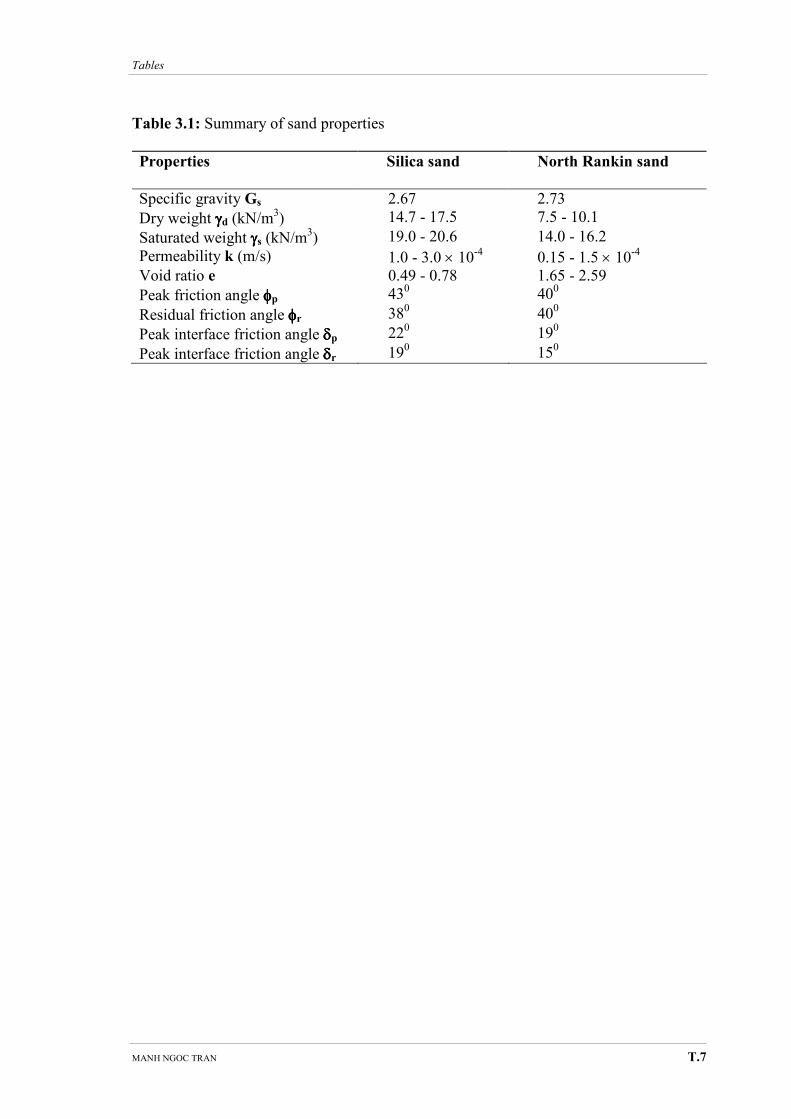
Tables
MANH NGOC TRAN T.7
Table 3.1: Summary of sand properties
Properties Silica sand North Rankin sand
Specific gravity Gs 2.67 2.73
Dry weight γγγγd (kN/m3) 14.7 - 17.5 7.5 - 10.1
Saturated weight γγγγs (kN/m3) 19.0 - 20.6 14.0 - 16.2
Permeability k (m/s) 1.0 - 3.0 × 10⁻⁴ 0.15 - 1.5 × 10
-4
Void ratio e 0.49 - 0.78 1.65 - 2.59
Peak friction angle φφφφp 430 40
0
Residual friction angle φφφφr 380 40
0
Peak interface friction angle δδδδp 220 19
0
Peak interface friction angle δδδδr 190 15
0
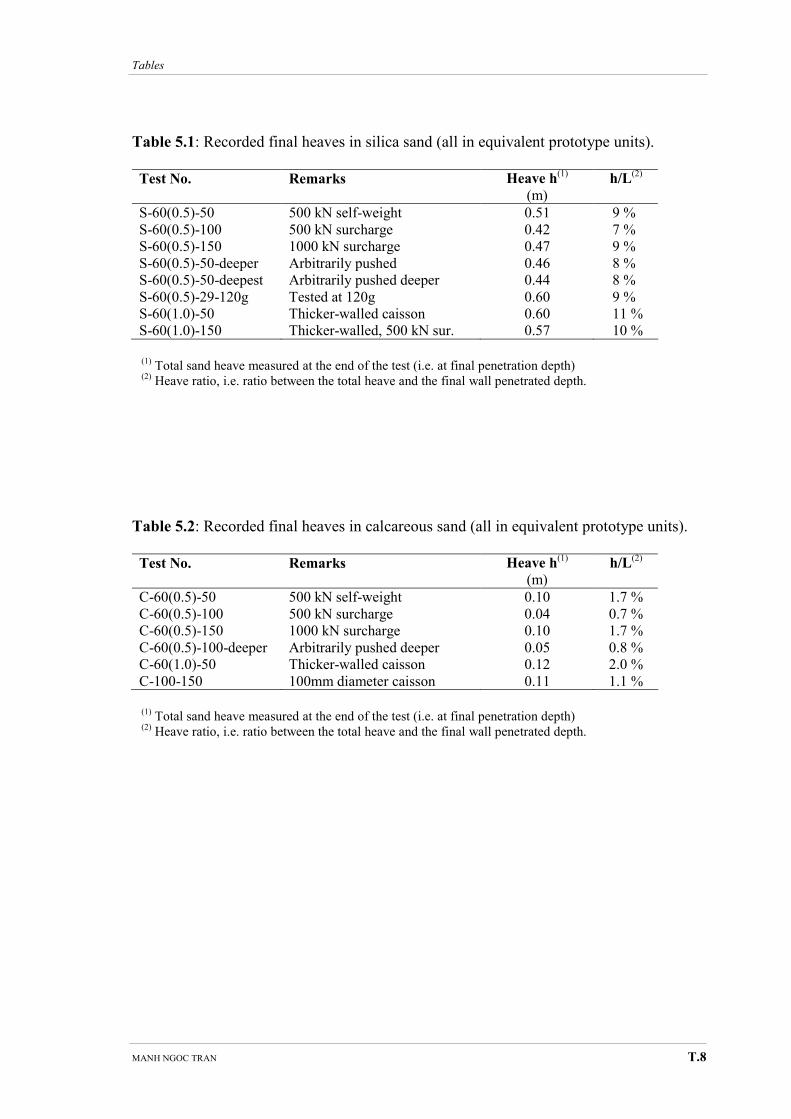
Tables
MANH NGOC TRAN T.8
Table 5.1: Recorded final heaves in silica sand (all in equivalent prototype units).
Test No. Remarks Heave h(1)
(m)
h/L(2)
S-60(0.5)-50 500 kN self-weight 0.51 9 %
S-60(0.5)-100 500 kN surcharge 0.42 7 %
S-60(0.5)-150 1000 kN surcharge 0.47 9 %
S-60(0.5)-50-deeper Arbitrarily pushed 0.46 8 %
S-60(0.5)-50-deepest Arbitrarily pushed deeper 0.44 8 %
S-60(0.5)-29-120g Tested at 120g 0.60 9 %
S-60(1.0)-50 Thicker-walled caisson 0.60 11 %
S-60(1.0)-150 Thicker-walled, 500 kN sur. 0.57 10 %
(1)
Total sand heave measured at the end of the test (i.e. at final penetration depth) (2)
Heave ratio, i.e. ratio between the total heave and the final wall penetrated depth.
Table 5.2: Recorded final heaves in calcareous sand (all in equivalent prototype units).
Test No. Remarks Heave h(1)
(m)
h/L(2)
C-60(0.5)-50 500 kN self-weight 0.10 1.7 %
C-60(0.5)-100 500 kN surcharge 0.04 0.7 %
C-60(0.5)-150 1000 kN surcharge 0.10 1.7 %
C-60(0.5)-100-deeper Arbitrarily pushed deeper 0.05 0.8 %
C-60(1.0)-50 Thicker-walled caisson 0.12 2.0 %
C-100-150 100mm diameter caisson 0.11 1.1 %
(1)
Total sand heave measured at the end of the test (i.e. at final penetration depth) (2)
Heave ratio, i.e. ratio between the total heave and the final wall penetrated depth.
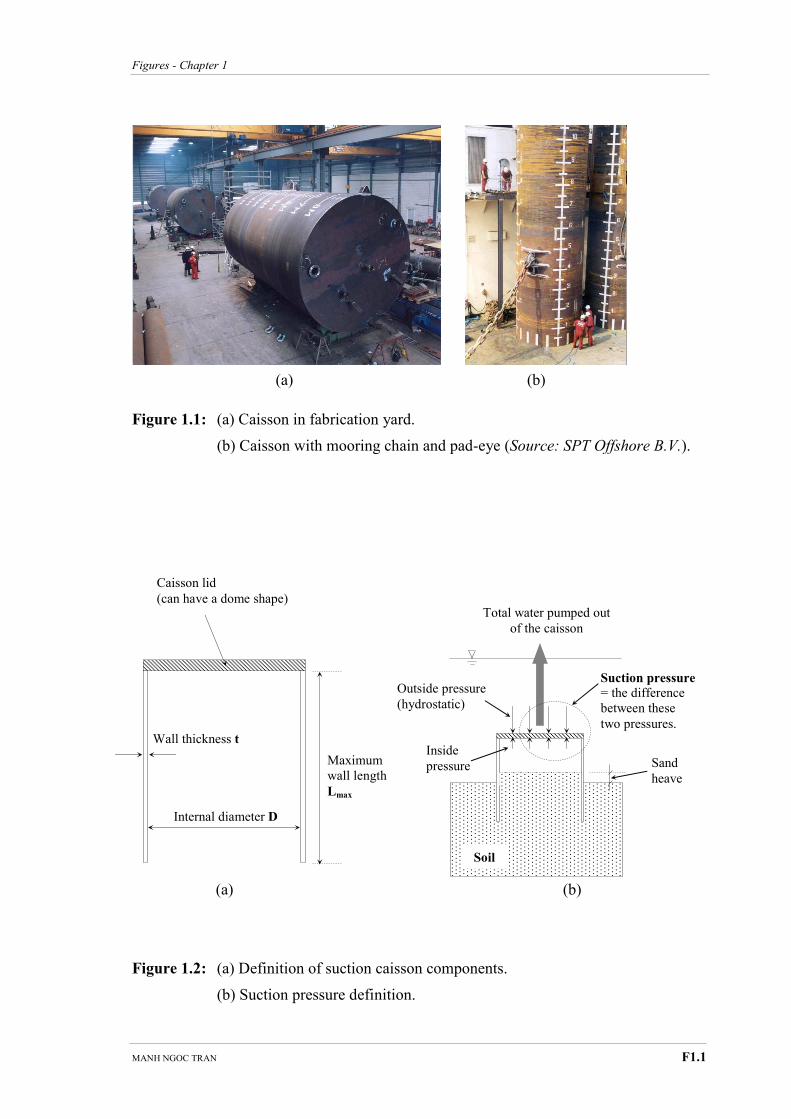
Figures - Chapter 1
MANH NGOC TRAN F1.1
Chapter Nine
(a) (b)
Figure 1.1: (a) Caisson in fabrication yard.
(b) Caisson with mooring chain and pad-eye (Source: SPT Offshore B.V.).
(a) (b)
Figure 1.2: (a) Definition of suction caisson components.
(b) Suction pressure definition.
Internal diameter D
Wall thickness t
Maximum
wall length
Lmax
Caisson lid
(can have a dome shape)
Soil
Outside pressure
(hydrostatic)
Inside
pressure
Total water pumped out
of the caisson
Suction pressure = the difference
between these
two pressures.
Sand
heave
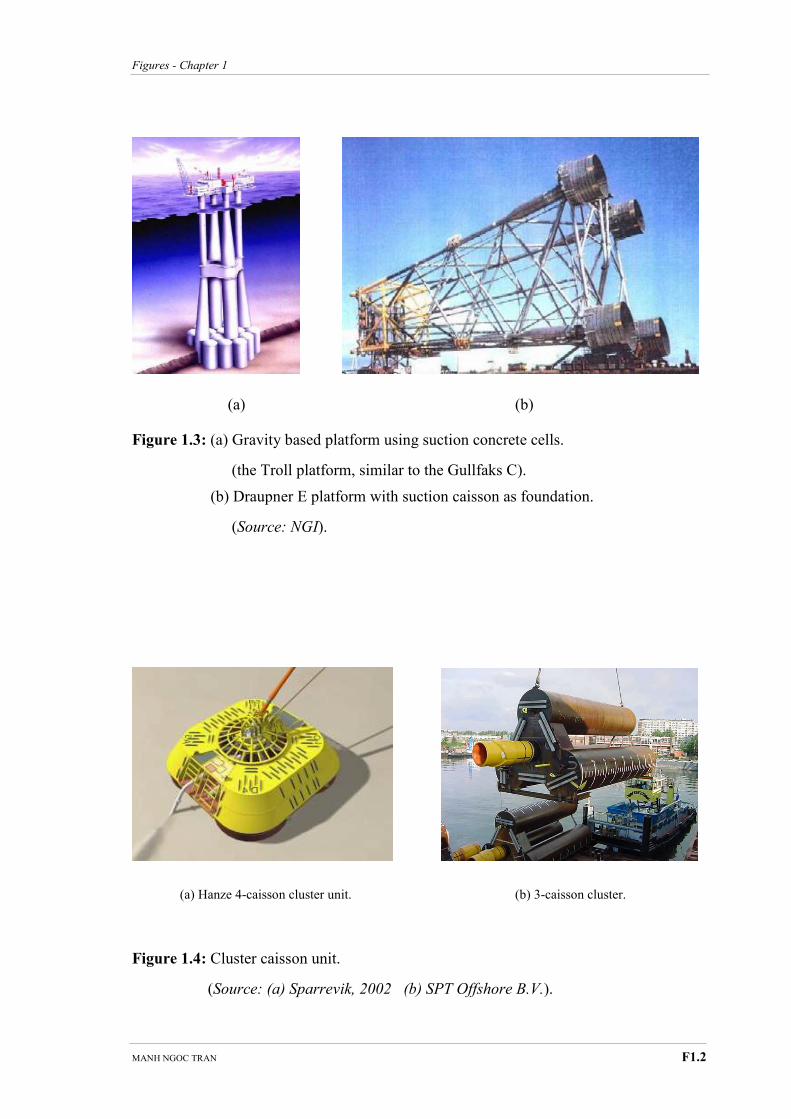
Figures - Chapter 1
MANH NGOC TRAN F1.2
(a) (b)
Figure 1.3: (a) Gravity based platform using suction concrete cells.
(the Troll platform, similar to the Gullfaks C).
(b) Draupner E platform with suction caisson as foundation.
(Source: NGI).
(a) Hanze 4-caisson cluster unit. (b) 3-caisson cluster.
Figure 1.4: Cluster caisson unit.
(Source: (a) Sparrevik, 2002 (b) SPT Offshore B.V.).
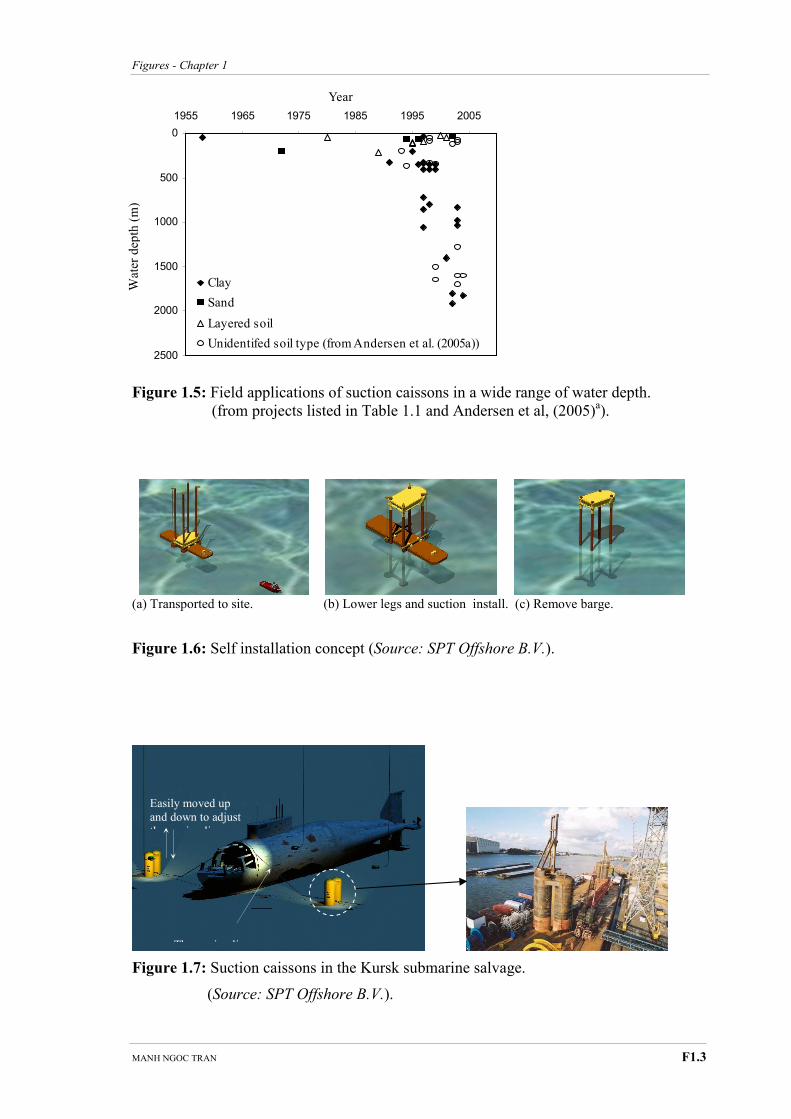
Figures - Chapter 1
MANH NGOC TRAN F1.3
Figure 1.5: Field applications of suction caissons in a wide range of water depth.
(from projects listed in Table 1.1 and Andersen et al, (2005)a).
(a) Transported to site. (b) Lower legs and suction install. (c) Remove barge.
Figure 1.6: Self installation concept (Source: SPT Offshore B.V.).
Figure 1.7: Suction caissons in the Kursk submarine salvage.
(Source: SPT Offshore B.V.).
Easily moved up
and down to adjust
the sawing line
The sawing line
0
500
1000
1500
2000
2500
1955 1965 1975 1985 1995 2005
Year
Wte
r depth
(m
)
Clay
Sand
Layered soil
Unidentifed soil type (from Andersen et al. (2005a))
Wat
er d
epth
(m
)
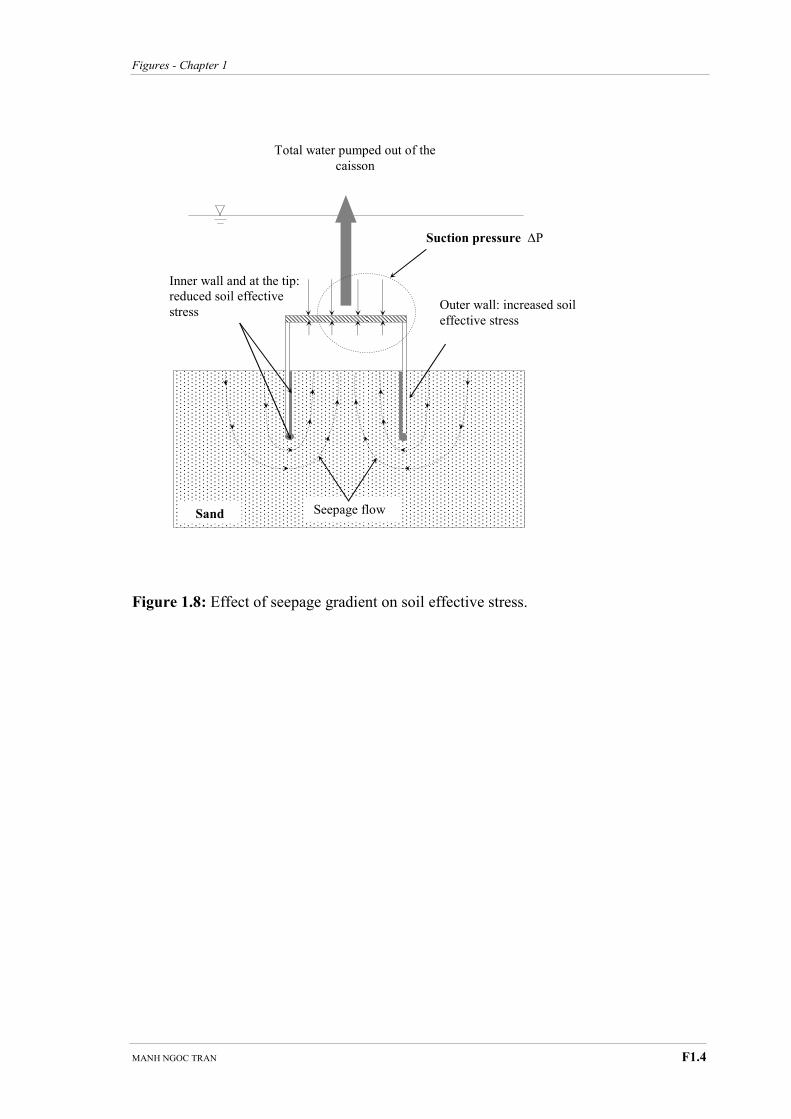
Figures - Chapter 1
MANH NGOC TRAN F1.4
Figure 1.8: Effect of seepage gradient on soil effective stress.
Sand
Total water pumped out of the
caisson
Suction pressure ∆P
Outer wall: increased soil
effective stress
Inner wall and at the tip:
reduced soil effective
stress
Seepage flow
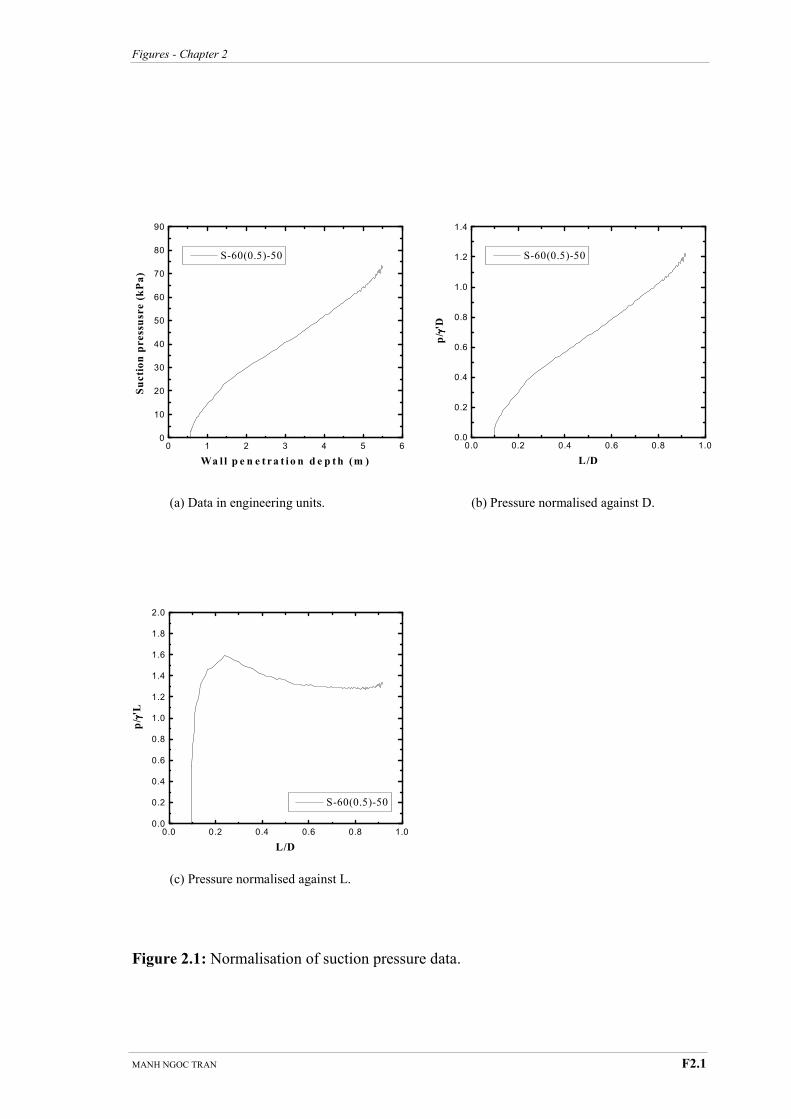
Figures - Chapter 2
MANH NGOC TRAN F2.1
(a) Data in engineering units. (b) Pressure normalised against D.
(c) Pressure normalised against L.
Figure 2.1: Normalisation of suction pressure data.
0.0 0.2 0.4 0.6 0.8 1.00.0
0.2
0.4
0.6
0.8
1.0
1.2
1.4
S-60(0.5)-50
p/ γγ γγ'D
L/D
0 1 2 3 4 5 60
10
20
30
40
50
60
70
80
90
S-60(0.5)-50
Suction pressusre (kPa)
Wa l l p e n e t ra t i o n d e p th (m )
0.0 0.2 0.4 0.6 0.8 1.00.0
0.2
0.4
0.6
0.8
1.0
1.2
1.4
1.6
1.8
2.0
S-60(0.5)-50
p/ γγ γγ'L
L/D
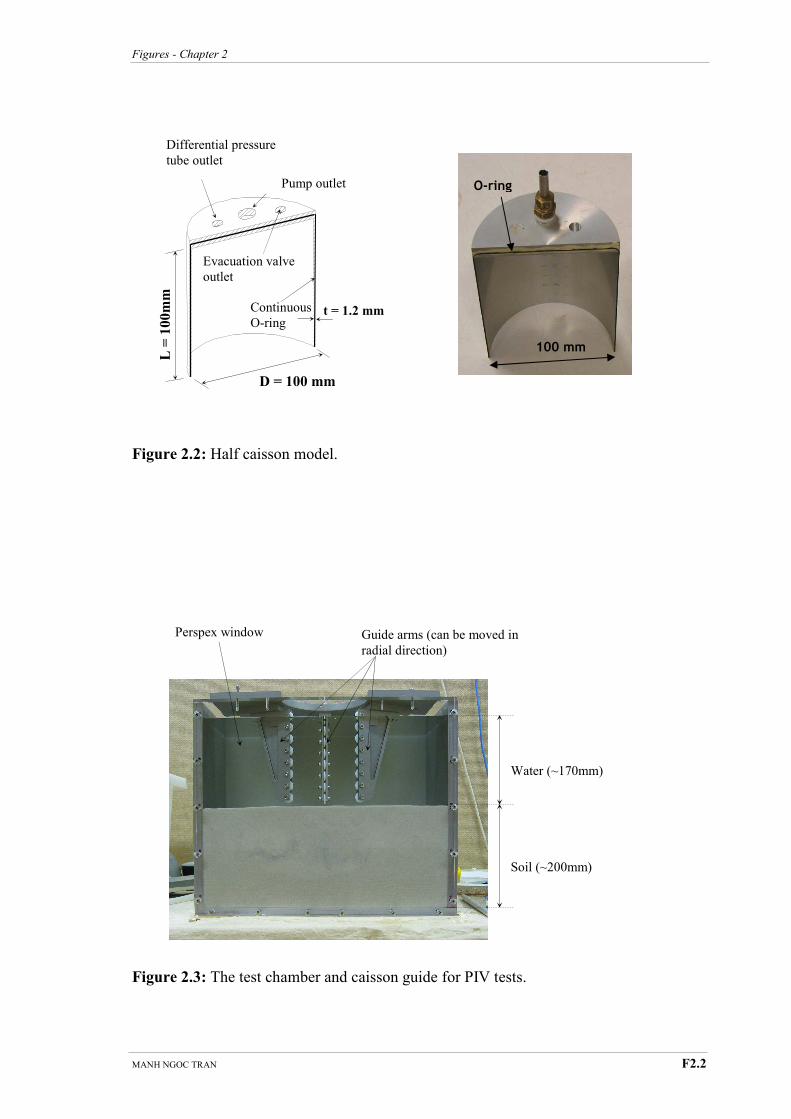
Figures - Chapter 2
MANH NGOC TRAN F2.2
Figure 2.2: Half caisson model.
Figure 2.3: The test chamber and caisson guide for PIV tests.
Continuous
O-ring
Pump outlet
Differential pressure
tube outlet
Evacuation valve
outlet
D = 100 mm
t = 1.2 mm
L = 100mm
100 mm
O-ring
Guide arms (can be moved in
radial direction)
Perspex window
Water (~170mm)
Soil (~200mm)
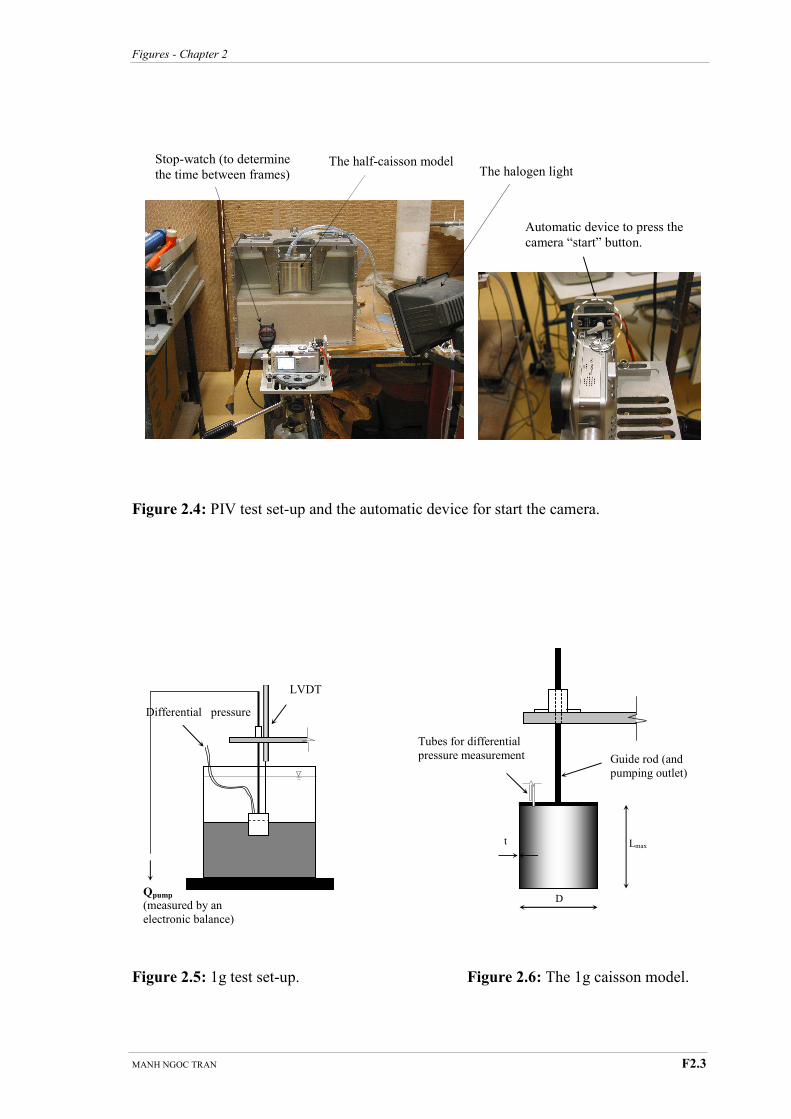
Figures - Chapter 2
MANH NGOC TRAN F2.3
Figure 2.4: PIV test set-up and the automatic device for start the camera.
Figure 2.5: 1g test set-up. Figure 2.6: The 1g caisson model.
LVDT
Differential pressure
Qpump
(measured by an
electronic balance)
Tubes for differential
pressure measurement
D
t Lmax
Guide rod (and
pumping outlet)
Automatic device to press the
camera “start” button.
The half-caisson model Stop-watch (to determine
the time between frames) The halogen light
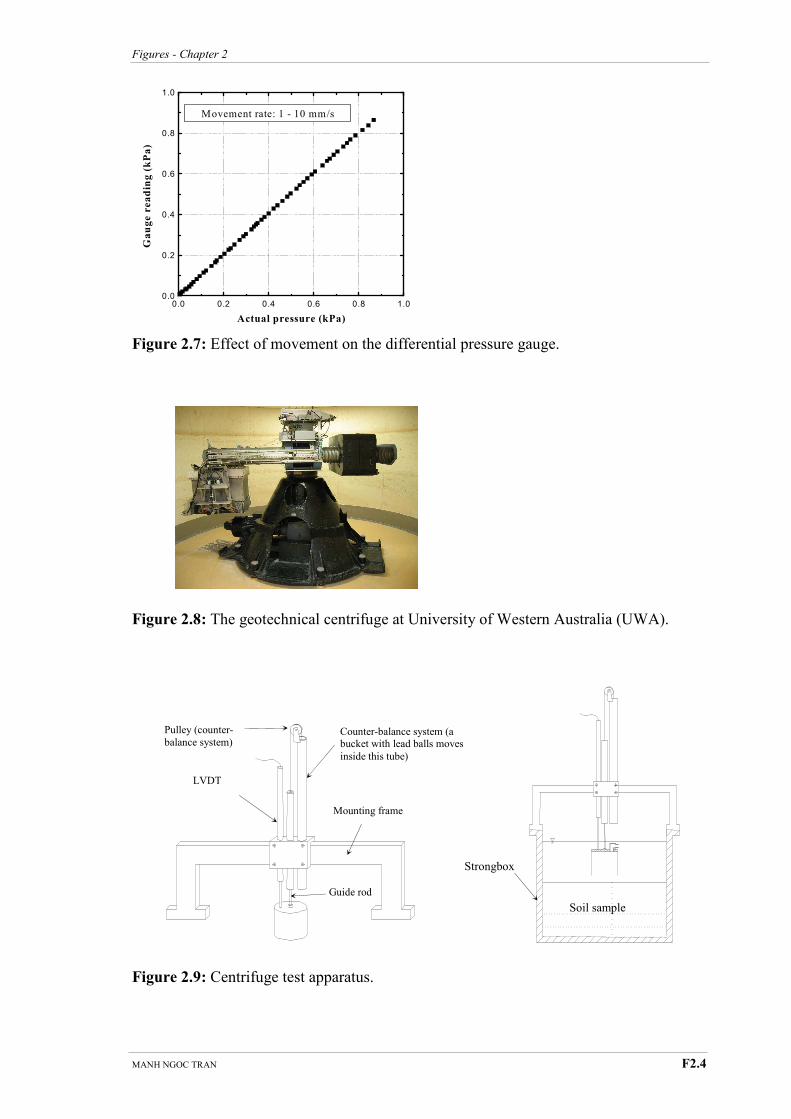
Figures - Chapter 2
MANH NGOC TRAN F2.4
Figure 2.7: Effect of movement on the differential pressure gauge.
Figure 2.8: The geotechnical centrifuge at University of Western Australia (UWA).
Figure 2.9: Centrifuge test apparatus.
0.0 0.2 0.4 0.6 0.8 1.00.0
0.2
0.4
0.6
0.8
1.0
Movement rate: 1 - 10 mm/s
Gauge reading (kPa)
Actual pressure (kPa)
Counter-balance system (a bucket with lead balls moves
inside this tube)
Guide rod
LVDT
Pulley (counter-
balance system)
Mounting frame
Strongbox
Soil sample
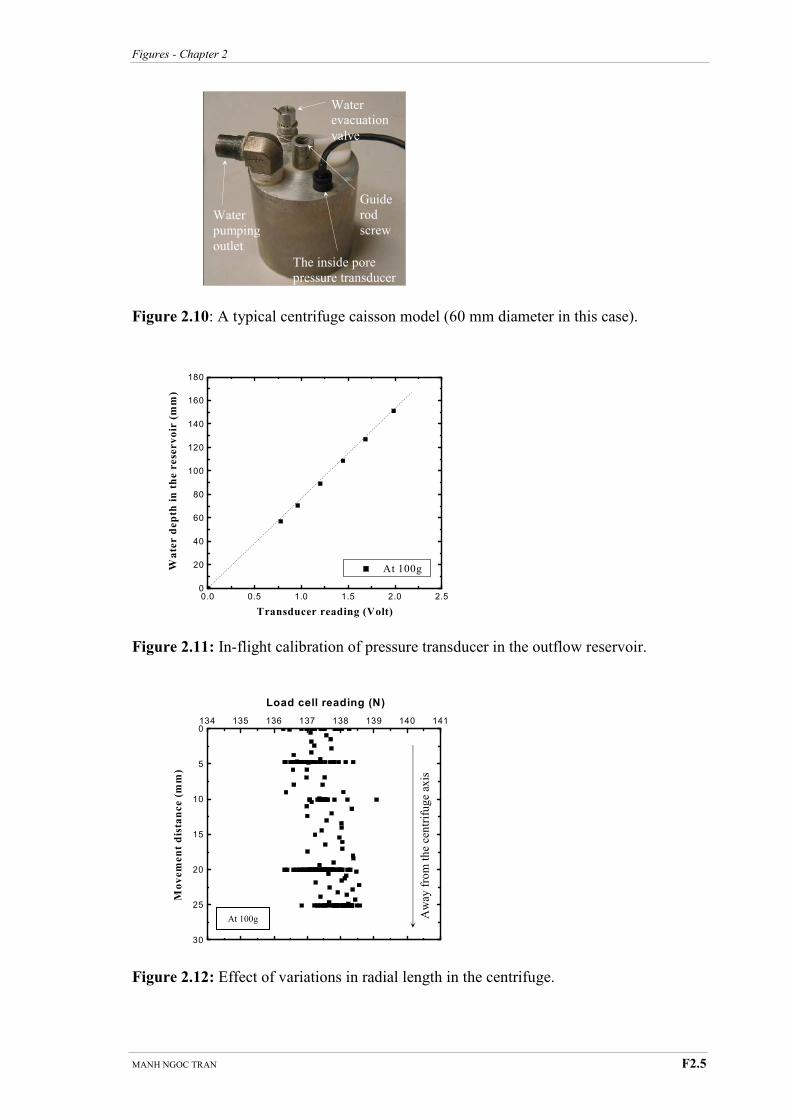
Figures - Chapter 2
MANH NGOC TRAN F2.5
Figure 2.10: A typical centrifuge caisson model (60 mm diameter in this case).
Figure 2.11: In-flight calibration of pressure transducer in the outflow reservoir.
Figure 2.12: Effect of variations in radial length in the centrifuge.
Water
evacuation
valve
Guide
rod
screw
Water
pumping
outlet
The inside pore
pressure transducer
(PPT)
30
25
20
15
10
5
0134 135 136 137 138 139 140 141
Load cell reading (N)
Movement distance (mm)
Aw
ay fro
m the
centrifuge
axis
At 100g
0.0 0.5 1.0 1.5 2.0 2.50
20
40
60
80
100
120
140
160
180
At 100gWater depth in the reservoir (mm)
Transducer reading (Volt)
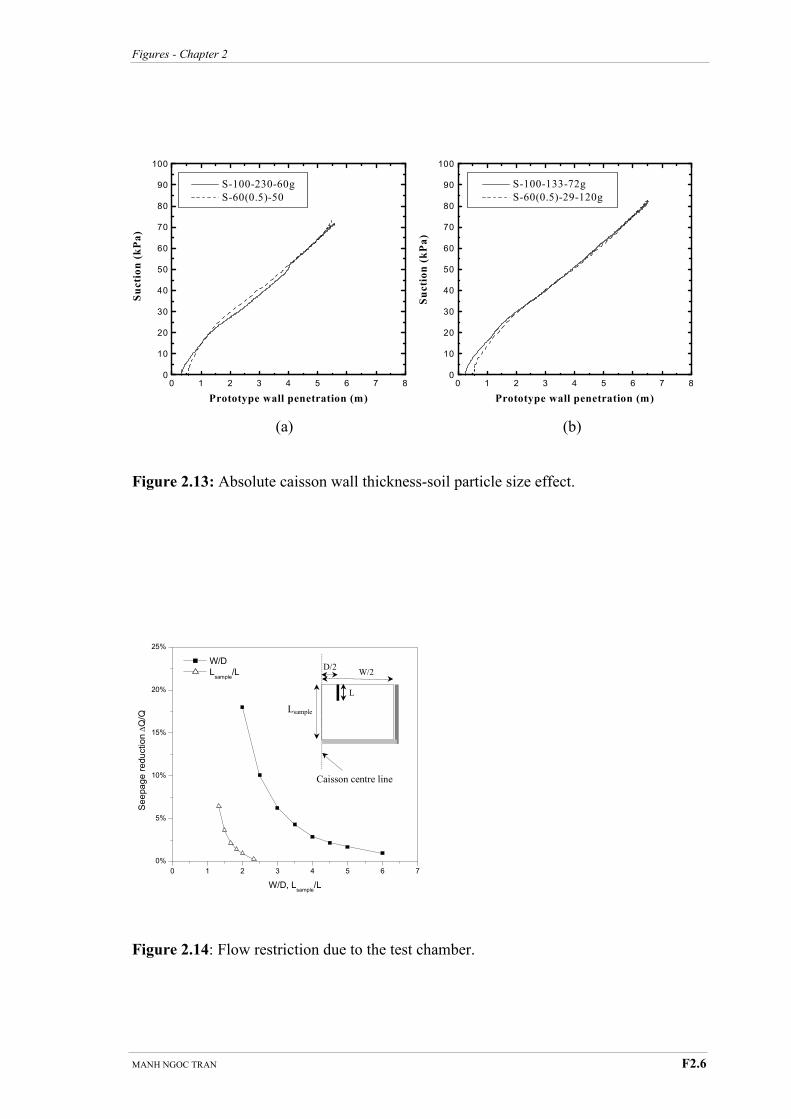
Figures - Chapter 2
MANH NGOC TRAN F2.6
(a) (b)
Figure 2.13: Absolute caisson wall thickness-soil particle size effect.
Figure 2.14: Flow restriction due to the test chamber.
0 1 2 3 4 5 6 7
0%
5%
10%
15%
20%
25%
W/D
Lsample
/L
Se
ep
ag
e r
ed
uc
tio
n ∆
Q/Q
W/D, Lsample
/L
D/2 W/2
L sam p l e
L
Caisson centre line
0 1 2 3 4 5 6 7 80
10
20
30
40
50
60
70
80
90
100
S-100-133-72g
S-60(0.5)-29-120g
Suction (kPa)
Prototype wall penetration (m)
0 1 2 3 4 5 6 7 80
10
20
30
40
50
60
70
80
90
100
S-100-230-60g
S-60(0.5)-50
Suction (kPa)
Prototype wall penetration (m)
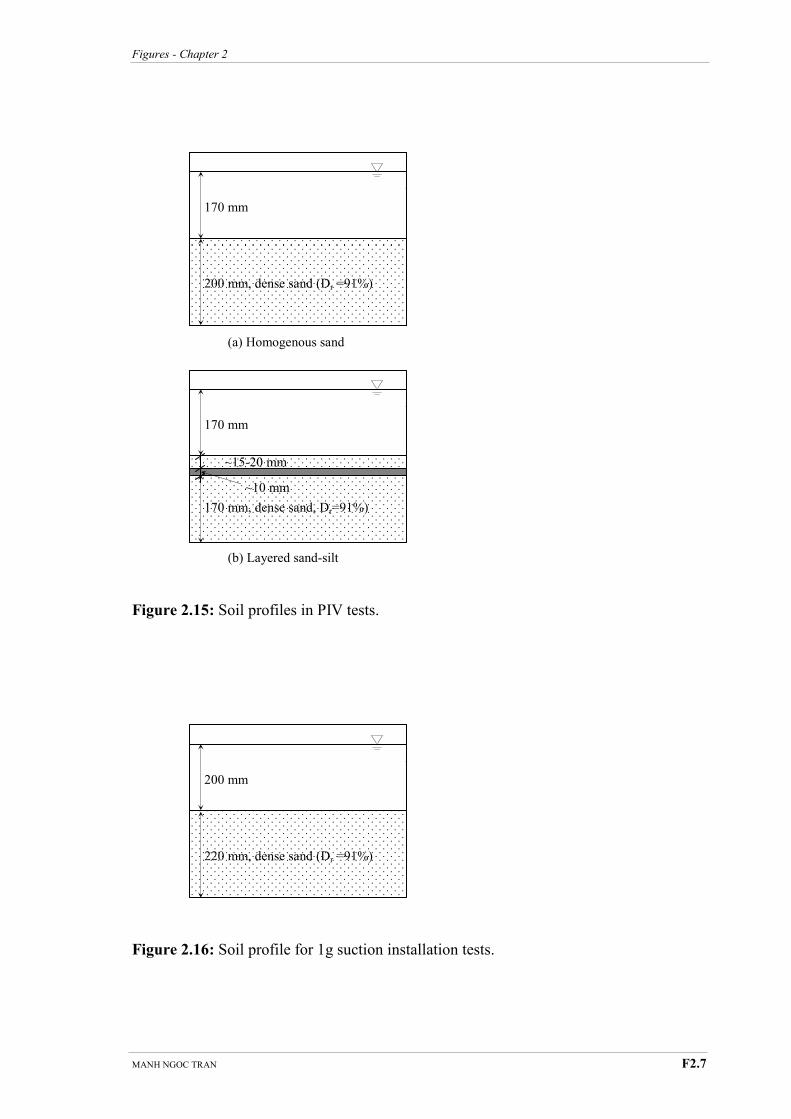
Figures - Chapter 2
MANH NGOC TRAN F2.7
(a) Homogenous sand
(b) Layered sand-silt
Figure 2.15: Soil profiles in PIV tests.
Figure 2.16: Soil profile for 1g suction installation tests.
170 mm
200 mm, dense sand (Dr =91%)
170 mm
170 mm, dense sand, Dr=91%)
~15-20 mm
~10 mm
200 mm
220 mm, dense sand (Dr =91%)
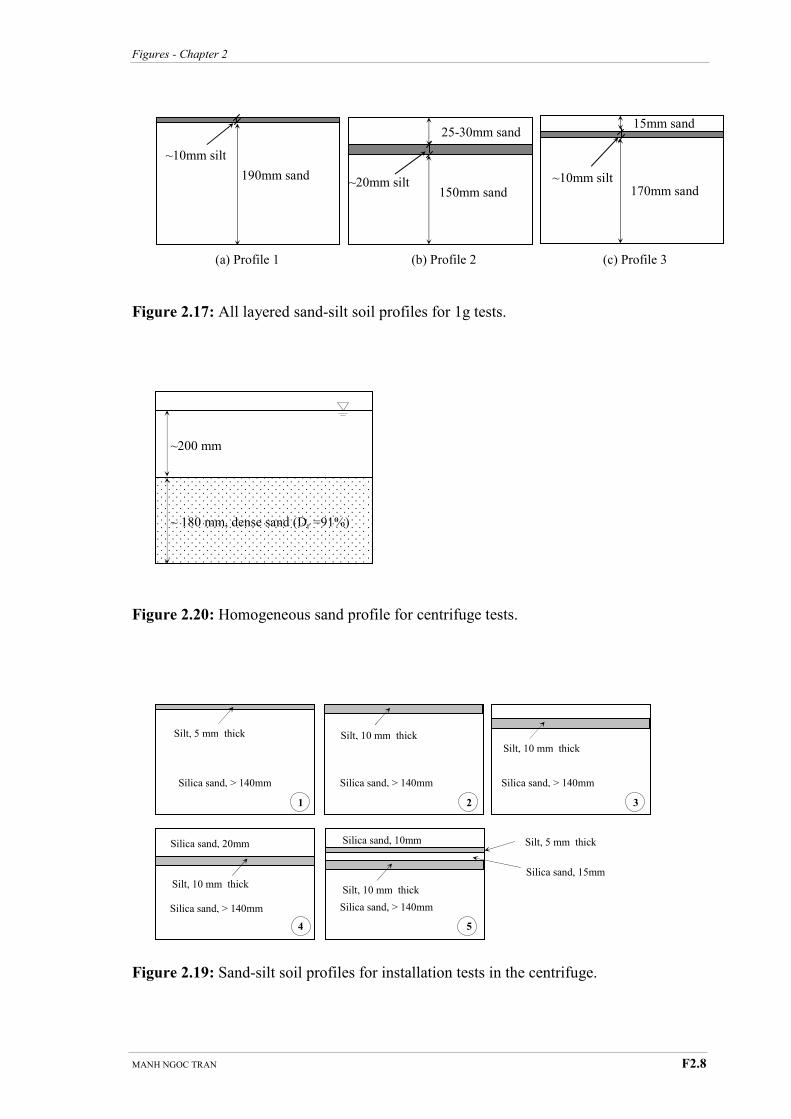
Figures - Chapter 2
MANH NGOC TRAN F2.8
(a) Profile 1 (b) Profile 2 (c) Profile 3
Figure 2.17: All layered sand-silt soil profiles for 1g tests.
Figure 2.20: Homogeneous sand profile for centrifuge tests.
Figure 2.19: Sand-silt soil profiles for installation tests in the centrifuge.
~200 mm
~ 180 mm, dense sand (Dr =91%)
190mm sand
~10mm silt
150mm sand ~20mm silt
25-30mm sand
170mm sand ~10mm silt
15mm sand
Silica sand, > 140mm
Silica sand, > 140mm Silica sand, > 140mm
Silica sand, > 140mm Silica sand, > 140mm
Silica sand, 20mm Silica sand, 10mm
Silt, 5 mm thick Silt, 10 mm thick
Silt, 10 mm thick
Silt, 10 mm thick Silt, 10 mm thick
Silt, 5 mm thick
Silica sand, 15mm
1 2 3
4 5
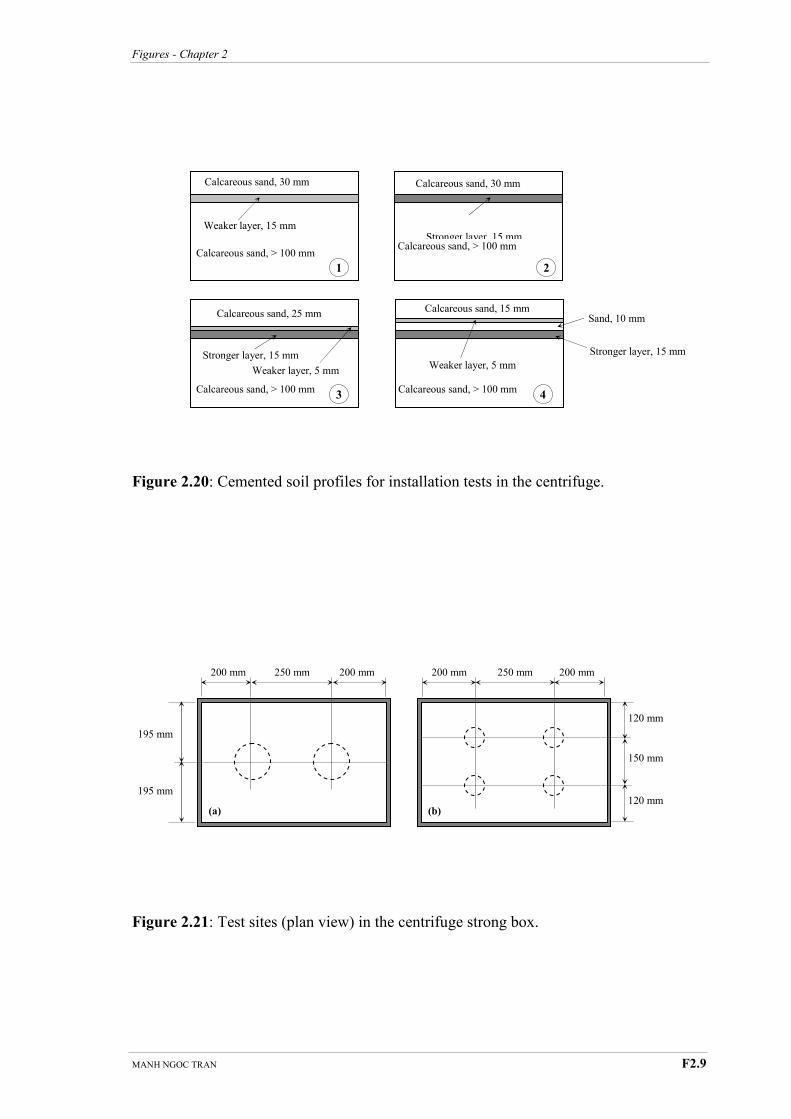
Figures - Chapter 2
MANH NGOC TRAN F2.9
Figure 2.20: Cemented soil profiles for installation tests in the centrifuge.
Figure 2.21: Test sites (plan view) in the centrifuge strong box.
200 mm 200 mm 250 mm
195 mm
195 mm
(a)
200 mm 200 mm 250 mm
120 mm
120 mm
150 mm
(b)
Stronger layer, 15 mm
Sand, 10 mm Calcareous sand, 15 mm
Weaker layer, 5 mm
4
Stronger layer, 15 mm
Calcareous sand, 25 mm
Weaker layer, 5 mm
3
Calcareous sand, 30 mm
Weaker layer, 15 mm
1
Stronger layer, 15 mm
Calcareous sand, 30 mm
2
Calcareous sand, > 100 mm Calcareous sand, > 100 mm
Calcareous sand, > 100 mm Calcareous sand, > 100 mm

Figures - Chapter 3
MANH NGOC TRAN F3.1
Chapter Ten
Chapter Eleven Chapter Twelve
Figure 3.1: Particle size distribution of all the tested soils.
(a) (b)
Figure 3.2: Permeability for silica sand and North Rankin sand.
0.75 0.70 0.65 0.60 0.55 0.500.0
0.5
1.0
1.5
2.0
2.5
3.0
3.5
4.0
Permeability k (x 10-4 m
/s)
Void ratio e
0 20 40 60 80 100
Silica sand
Relative density Dr
2.5 2.4 2.3 2.2 2.1 2.0 1.9 1.8 1.70.0
0.2
0.4
0.6
0.8
1.0
1.2
1.4
1.6
Permeability k (x 10-4 m
/s)
Void ratio e
0 20 40 60 80 100
North Rankin sand
Relative density Dr
1E-5 1E-4 1E-3 0.01 0.1 1 100
20
40
60
80
100
Silica sand
Silica flour
Calcareous sand
Mixed soil-10% fines
Mixed soil-20% fines
Mixed soil-40% fines
% passing
Particle size (mm)
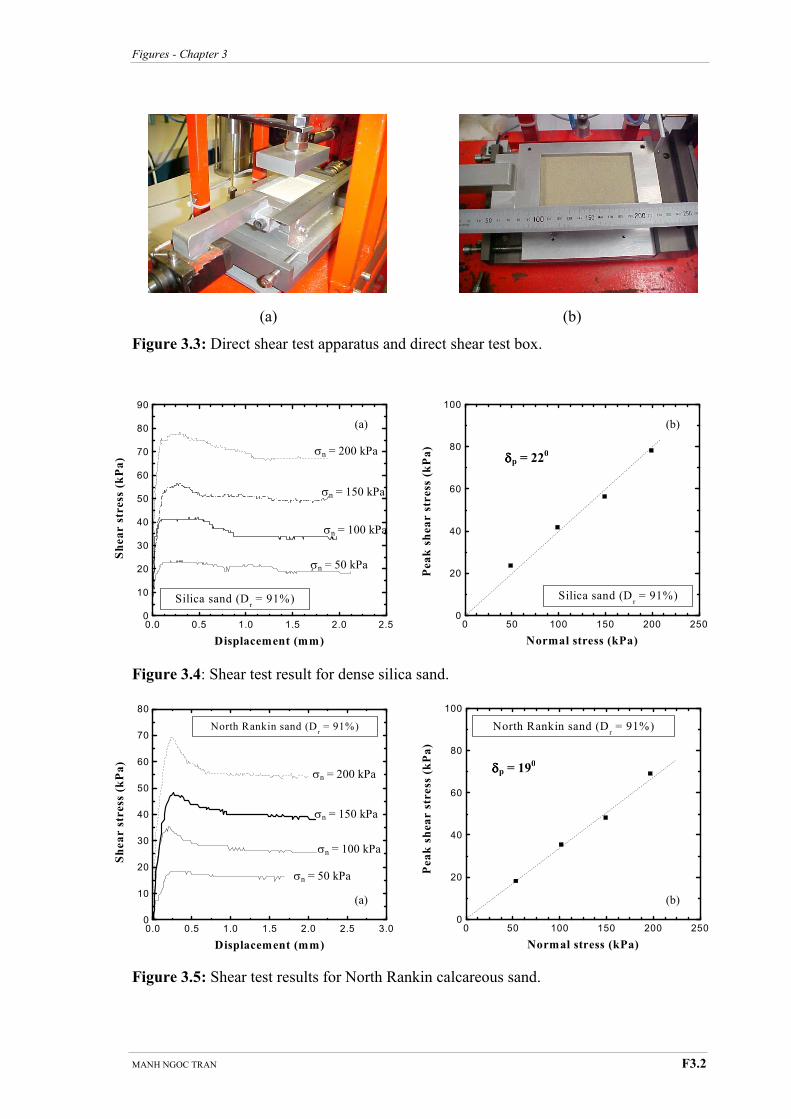
Figures - Chapter 3
MANH NGOC TRAN F3.2
(a) (b)
Figure 3.3: Direct shear test apparatus and direct shear test box.
Figure 3.4: Shear test result for dense silica sand.
Figure 3.5: Shear test results for North Rankin calcareous sand.
0 50 100 150 200 2500
20
40
60
80
100
Silica sand (Dr = 91%)
Peak shear stress (kPa)
Normal stress (kPa)
0.0 0.5 1.0 1.5 2.0 2.50
10
20
30
40
50
60
70
80
90
Silica sand (Dr = 91%)
Shear stress (kPa)
Displacement (mm)
(a) (b)
σn = 50 kPa
σn = 100 kPa
σn = 150 kPa
σn = 200 kPa δδδδp = 220
0 50 100 150 200 2500
20
40
60
80
100
North Rankin sand (Dr = 91%)
Peak shear stress (kPa)
Normal stress (kPa)
(a) (b)
σn = 50 kPa
σn = 100 kPa
σn = 150 kPa
σn = 200 kPa δδδδp = 19
0
0.0 0.5 1.0 1.5 2.0 2.5 3.00
10
20
30
40
50
60
70
80
North Rankin sand (Dr = 91%)
Shear stress (kPa)
Displacement (mm)
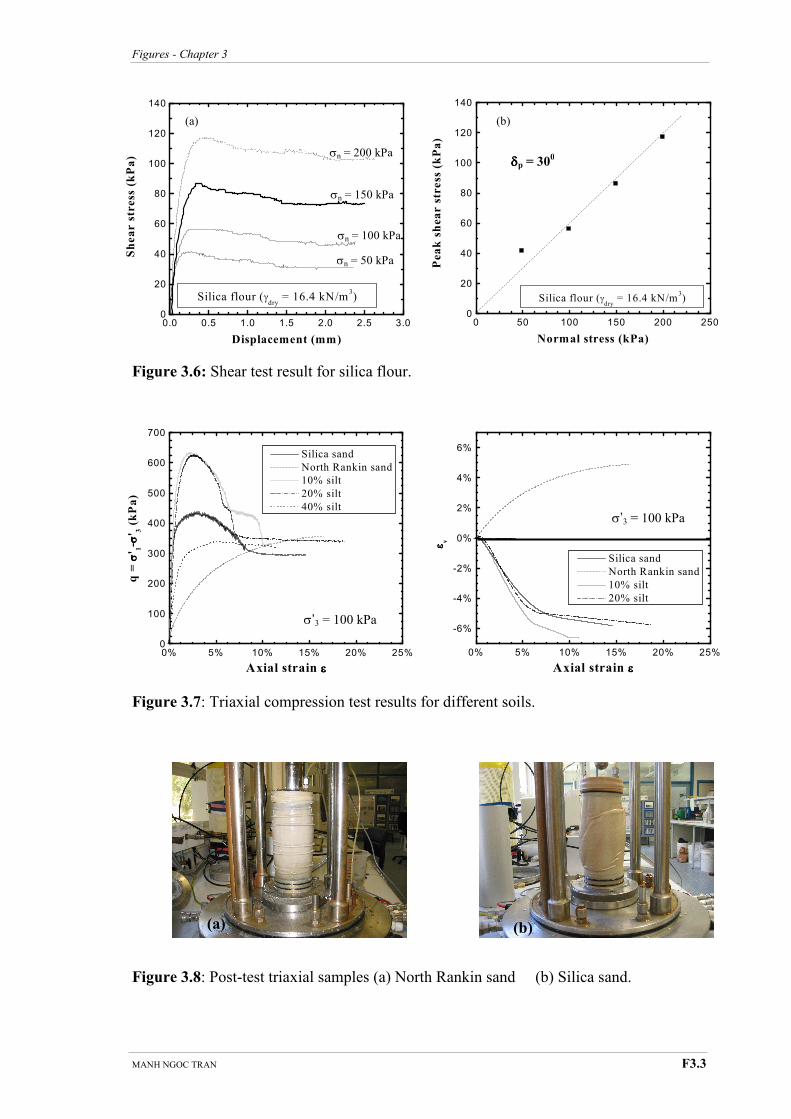
Figures - Chapter 3
MANH NGOC TRAN F3.3
Figure 3.6: Shear test result for silica flour.
Figure 3.7: Triaxial compression test results for different soils.
Figure 3.8: Post-test triaxial samples (a) North Rankin sand (b) Silica sand.
0.0 0.5 1.0 1.5 2.0 2.5 3.00
20
40
60
80
100
120
140
Silica flour (γdry
= 16.4 kN/m3)
Shear stress (kPa)
Displacement (mm)
0 50 100 150 200 2500
20
40
60
80
100
120
140
Silica flour (γdry
= 16.4 kN/m3)
Peak shear stress (kPa)
Normal stress (kPa)
σn = 50 kPa
σn = 100 kPa
σn = 150 kPa
σn = 200 kPa δδδδp = 30
0
(a) (b)
(a) (b)
0% 5% 10% 15% 20% 25%
-6%
-4%
-2%
0%
2%
4%
6%
Silica sand
North Rankin sand
10% silt
20% silt
εε εε v
Axial strain εεεε
σ’3 = 100 kPa
σ’3 = 100 kPa
0% 5% 10% 15% 20% 25%0
100
200
300
400
500
600
700
Silica sand
North Rankin sand
10% silt
20% silt
40% silt
q = σσ σσ' 1- σσ σσ' 3 (kPa)
Axial strain εεεε
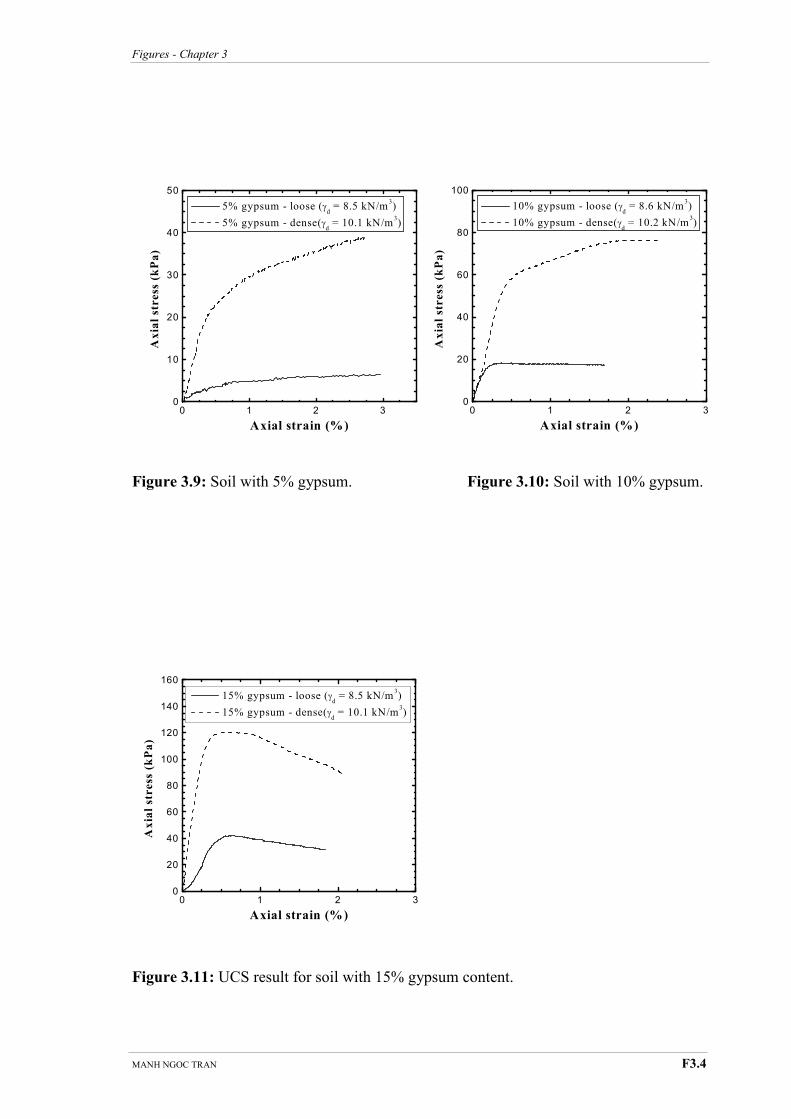
Figures - Chapter 3
MANH NGOC TRAN F3.4
Figure 3.9: Soil with 5% gypsum. Figure 3.10: Soil with 10% gypsum.
Figure 3.11: UCS result for soil with 15% gypsum content.
0 1 2 30
20
40
60
80
100
10% gypsum - loose (γd = 8.6 kN/m
3)
10% gypsum - dense(γd = 10.2 kN/m
3)
Axial stress (kPa)
Axial strain (%)
0 1 2 30
10
20
30
40
50
5% gypsum - loose (γd = 8.5 kN/m
3)
5% gypsum - dense(γd = 10.1 kN/m
3)
Axial stress (kPa)
Axial strain (%)
0 1 2 30
20
40
60
80
100
120
140
160
15% gypsum - loose (γd = 8.5 kN/m
3)
15% gypsum - dense(γd = 10.1 kN/m
3)
Axial stress (kPa)
Axial strain (%)
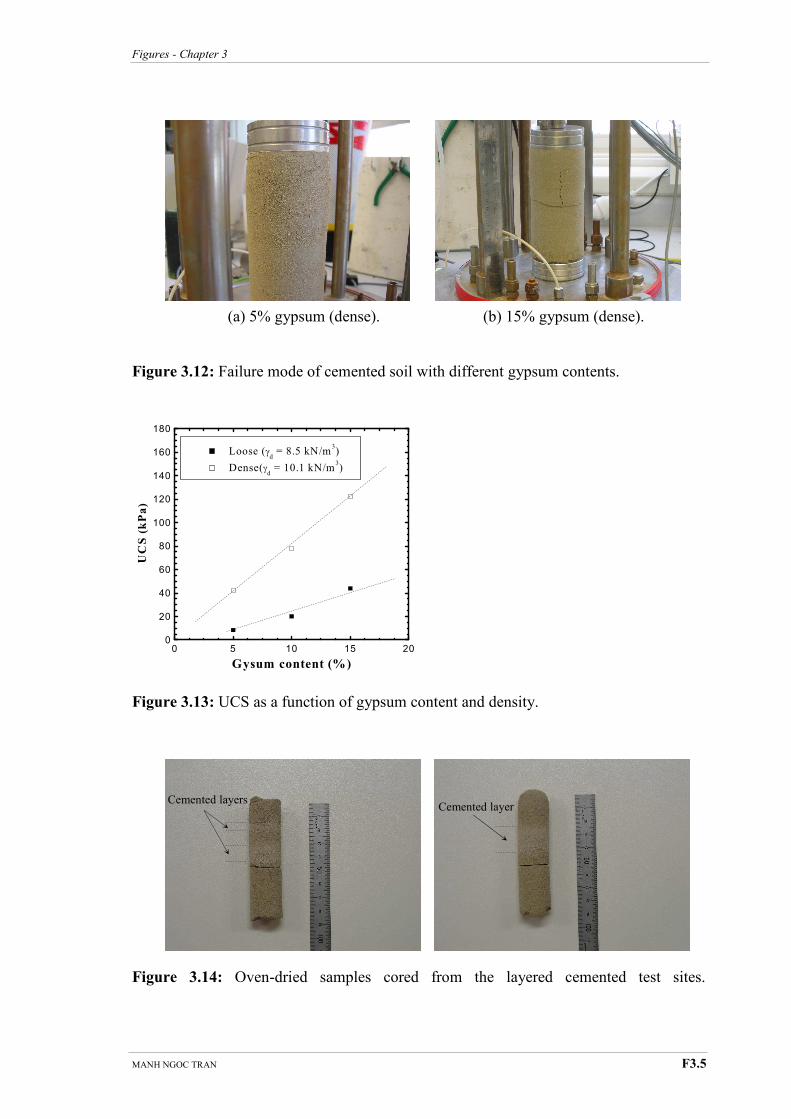
Figures - Chapter 3
MANH NGOC TRAN F3.5
(a) 5% gypsum (dense). (b) 15% gypsum (dense).
Figure 3.12: Failure mode of cemented soil with different gypsum contents.
Figure 3.13: UCS as a function of gypsum content and density.
Figure 3.14: Oven-dried samples cored from the layered cemented test sites.
0 5 10 15 200
20
40
60
80
100
120
140
160
180
Loose (γd = 8.5 kN/m
3)
Dense(γd = 10.1 kN/m
3)
UCS (kPa)
Gysum content (%)
Cemented layers Cemented layer

Figures - Chapter 4
MANH NGOC TRAN F4.1
Chapter Thirteen
Chapter Fourteen Chapter Fifteen Chapter Sixteen
Figure 4.1: Soil deformation result using PIV technique.
Figure 4.2: Soil deformation for L/D = 0.1 (p/γ'D = 0.75).
Scale × 10
mm
mm
mm
mm Scale × 10
(a)
(b)
pixel
pixel
Scale ××××6

Figures - Chapter 4
MANH NGOC TRAN F4.2
Figure 4.3: Soil deformation for L/D = 0.2 (p/γ'D = 4.1).
Figure 4.4: Soil deformation for L/D = 0.3 (p/γ'D = 5.1).
Scale × 6
mm
mm
Scale × 6
mm
mm
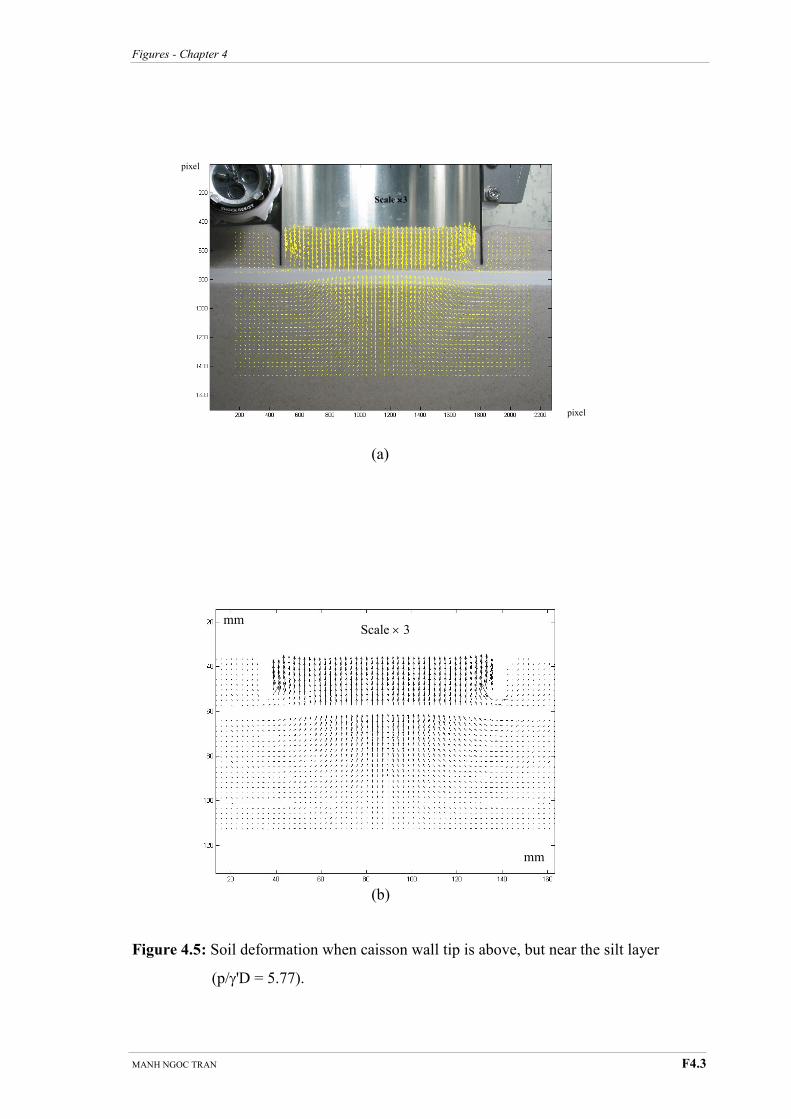
Figures - Chapter 4
MANH NGOC TRAN F4.3
(a)
(b)
Figure 4.5: Soil deformation when caisson wall tip is above, but near the silt layer
(p/γ'D = 5.77).
Scale × 3
mm
mm
pixel
pixel
Scale ××××3
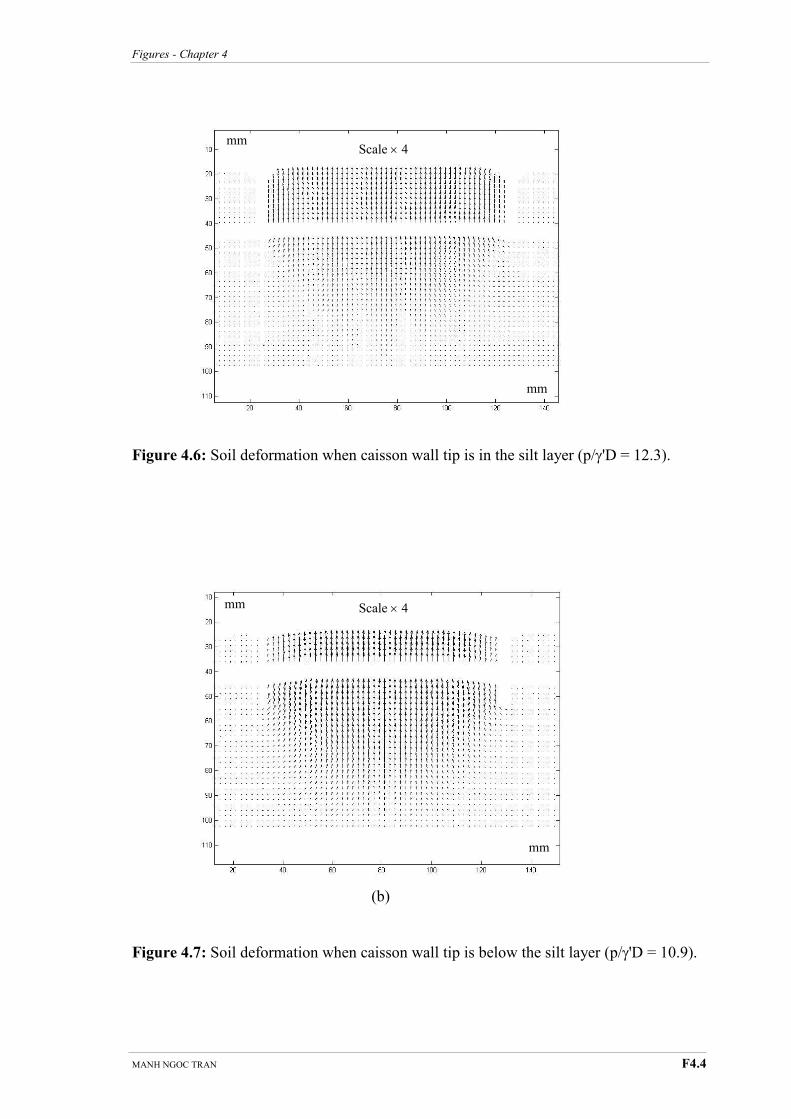
Figures - Chapter 4
MANH NGOC TRAN F4.4
Figure 4.6: Soil deformation when caisson wall tip is in the silt layer (p/γ'D = 12.3).
(b)
Figure 4.7: Soil deformation when caisson wall tip is below the silt layer (p/γ'D = 10.9).
Scale × 4
mm
mm
Scale × 4
mm
mm
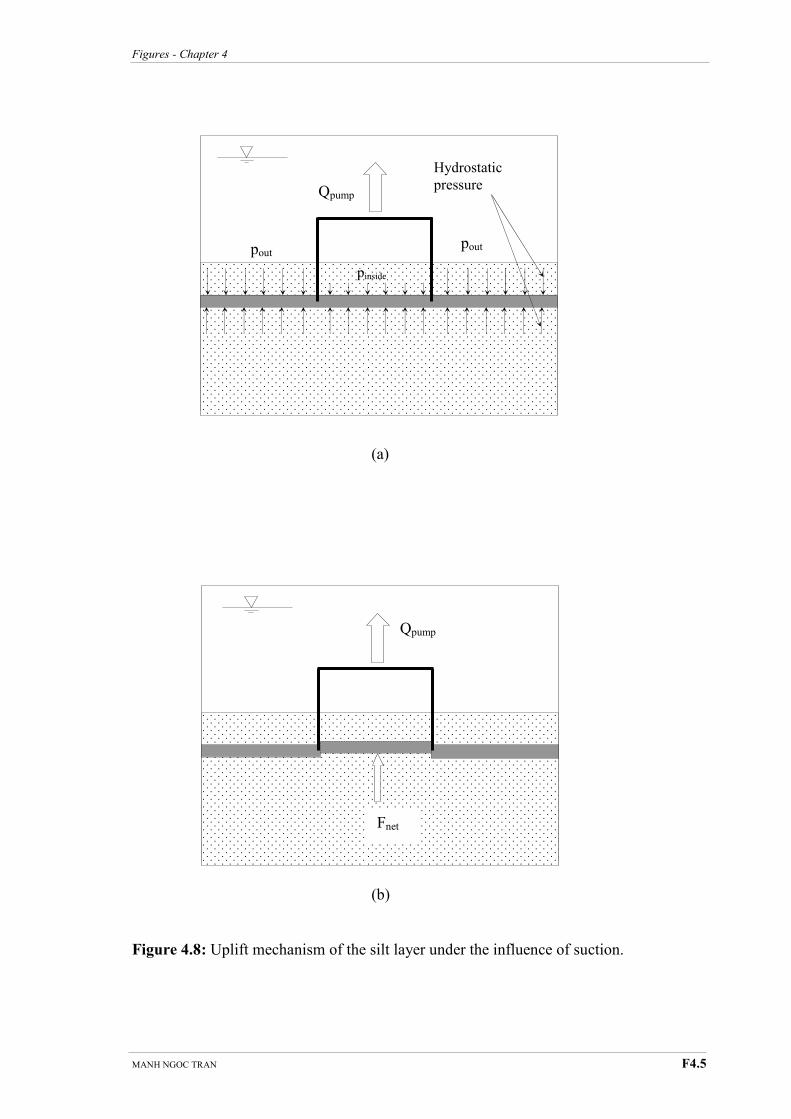
Figures - Chapter 4
MANH NGOC TRAN F4.5
(a)
(b)
Figure 4.8: Uplift mechanism of the silt layer under the influence of suction.
Fnet
Qpump
Hydrostatic
pressure
pinside
pout pout
Qpump
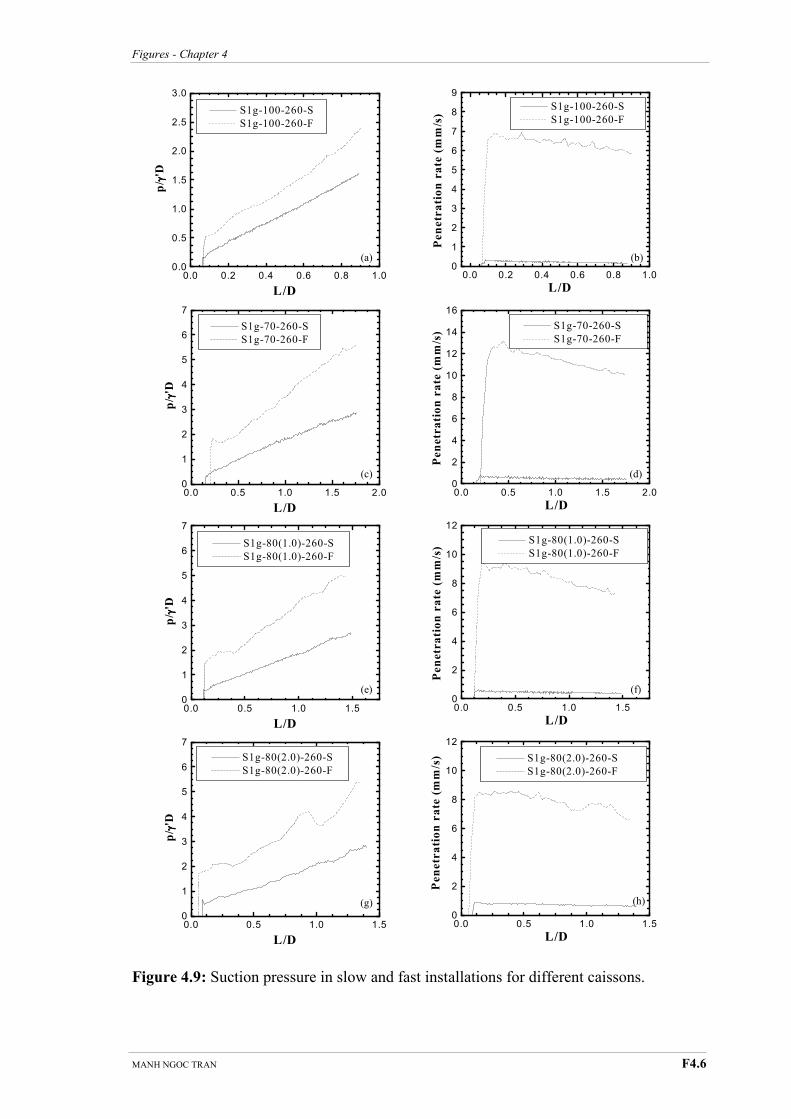
Figures - Chapter 4
MANH NGOC TRAN F4.6
Figure 4.9: Suction pressure in slow and fast installations for different caissons.
0.0 0.5 1.0 1.50
2
4
6
8
10
12
S1g-80(2.0)-260-S
S1g-80(2.0)-260-F
Penetration rate (mm/s)
L/D
0.0 0.2 0.4 0.6 0.8 1.00
1
2
3
4
5
6
7
8
9
S1g-100-260-S
S1g-100-260-F
Penetration rate (mm/s)
L/D0.0 0.2 0.4 0.6 0.8 1.0
0.0
0.5
1.0
1.5
2.0
2.5
3.0
S1g-100-260-S
S1g-100-260-F
p/ γγ γγ'D
L/D
(a)
(c)
(e)
(g)
(b)
(d)
(f)
(h)
0.0 0.5 1.0 1.5 2.00
1
2
3
4
5
6
7
S1g-70-260-S
S1g-70-260-F
p/ γγ γγ'D
L/D
0.0 0.5 1.0 1.5 2.00
2
4
6
8
10
12
14
16
S1g-70-260-S
S1g-70-260-F
Penetration rate (mm/s)
L/D
0.0 0.5 1.0 1.50
1
2
3
4
5
6
7
S1g-80(1.0)-260-S
S1g-80(1.0)-260-F
p/ γγ γγ'D
L/D
0.0 0.5 1.0 1.50
2
4
6
8
10
12
S1g-80(1.0)-260-S
S1g-80(1.0)-260-F
Penetration rate (mm/s)
L/D
0.0 0.5 1.0 1.50
1
2
3
4
5
6
7
S1g-80(2.0)-260-S
S1g-80(2.0)-260-F
p/ γγ γγ'D
L/D
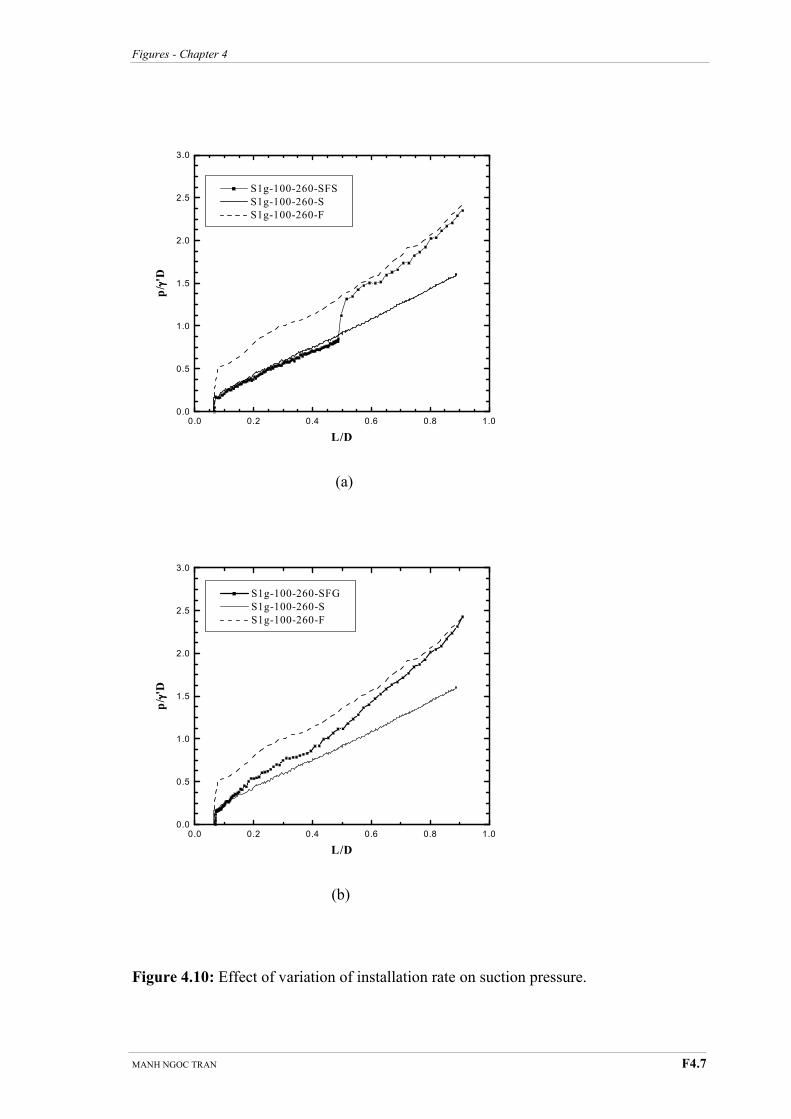
Figures - Chapter 4
MANH NGOC TRAN F4.7
(a)
(b)
Figure 4.10: Effect of variation of installation rate on suction pressure.
0.0 0.2 0.4 0.6 0.8 1.00.0
0.5
1.0
1.5
2.0
2.5
3.0
S1g-100-260-SFS
S1g-100-260-S
S1g-100-260-F
p/ γγ γγ'D
L/D
0.0 0.2 0.4 0.6 0.8 1.00.0
0.5
1.0
1.5
2.0
2.5
3.0
S1g-100-260-SFG
S1g-100-260-S
S1g-100-260-F
p/ γγ γγ'D
L/D
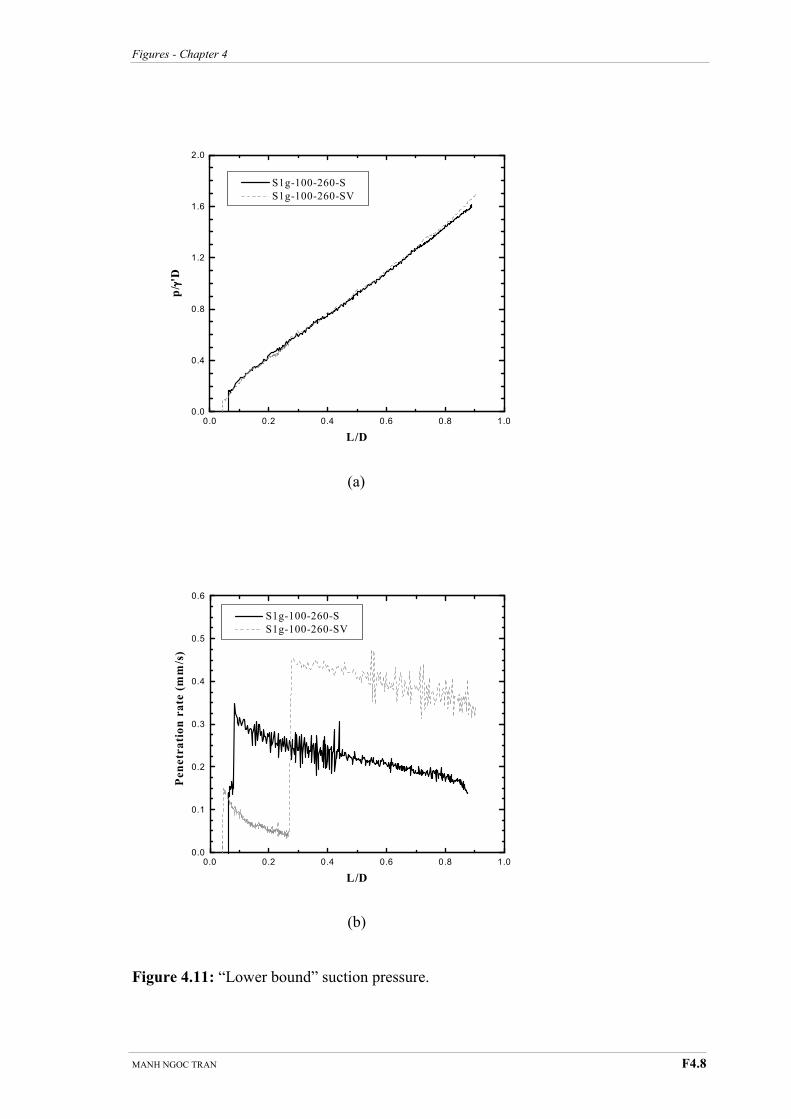
Figures - Chapter 4
MANH NGOC TRAN F4.8
(a)
(b)
Figure 4.11: “Lower bound” suction pressure.
0.0 0.2 0.4 0.6 0.8 1.00.0
0.1
0.2
0.3
0.4
0.5
0.6
S1g-100-260-S
S1g-100-260-SV
Penetration rate (mm/s)
L/D
0.0 0.2 0.4 0.6 0.8 1.00.0
0.4
0.8
1.2
1.6
2.0
S1g-100-260-S
S1g-100-260-SV
p/ γγ γγ'D
L/D
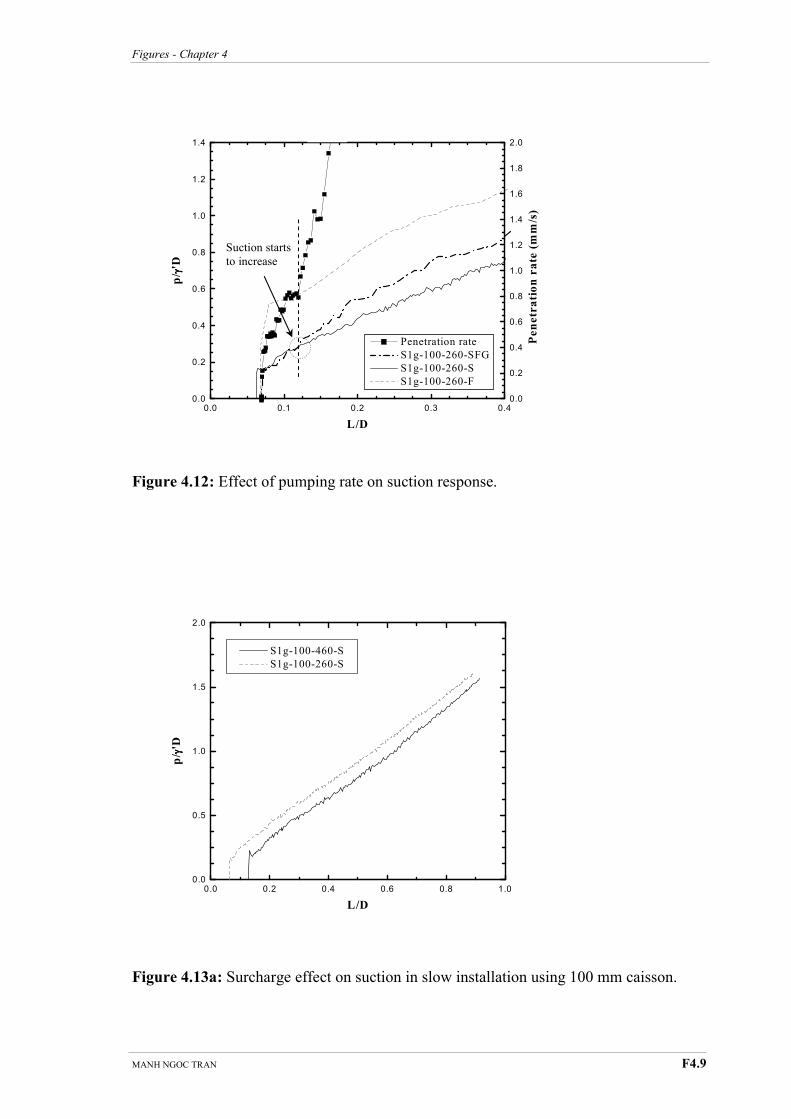
Figures - Chapter 4
MANH NGOC TRAN F4.9
0.0 0.2 0.4 0.6 0.8 1.00.0
0.5
1.0
1.5
2.0
S1g-100-460-S
S1g-100-260-S
p/ γγ γγ'D
L/D
Figure 4.12: Effect of pumping rate on suction response.
Figure 4.13a: Surcharge effect on suction in slow installation using 100 mm caisson.
Suction starts
to increase
0.0 0.1 0.2 0.3 0.40.0
0.2
0.4
0.6
0.8
1.0
1.2
1.4
S1g-100-260-SFG
S1g-100-260-S
S1g-100-260-F
p/ γγ γγ'D
L/D
0.0
0.2
0.4
0.6
0.8
1.0
1.2
1.4
1.6
1.8
2.0
Penetration rate Penetration rate (mm/s)
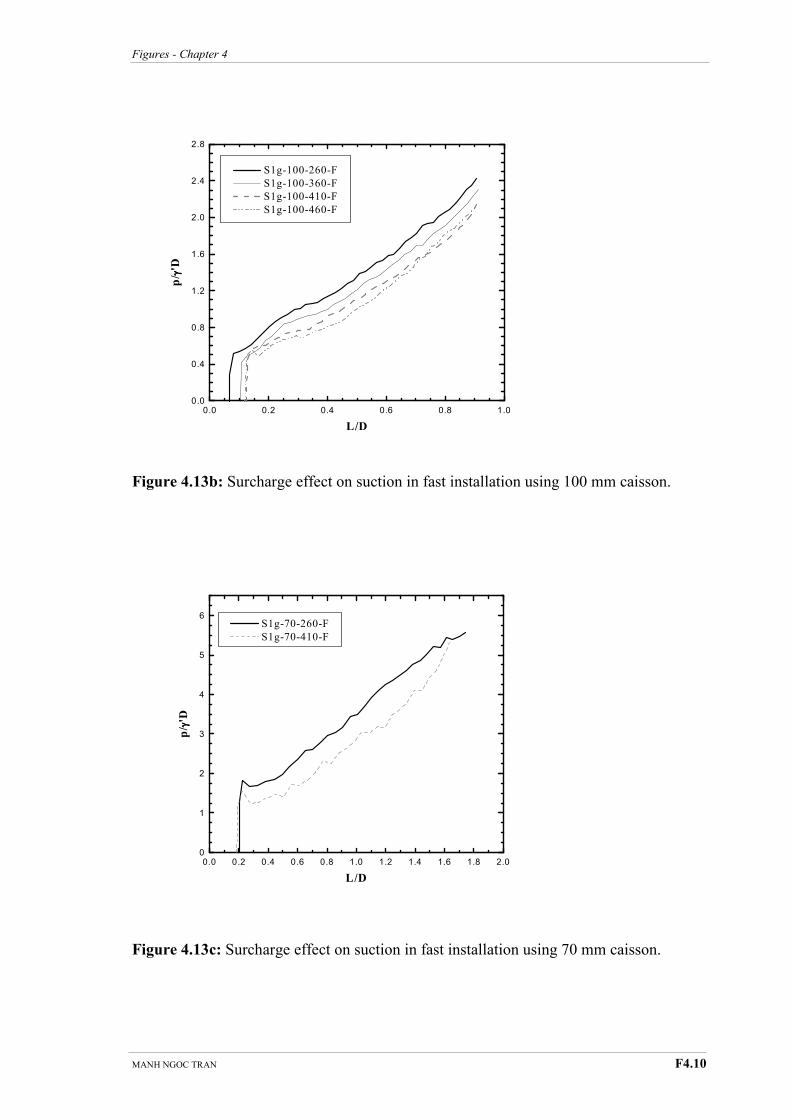
Figures - Chapter 4
MANH NGOC TRAN F4.10
Figure 4.13b: Surcharge effect on suction in fast installation using 100 mm caisson.
Figure 4.13c: Surcharge effect on suction in fast installation using 70 mm caisson.
0.0 0.2 0.4 0.6 0.8 1.00.0
0.4
0.8
1.2
1.6
2.0
2.4
2.8
S1g-100-260-F
S1g-100-360-F
S1g-100-410-F
S1g-100-460-F
p/ γγ γγ'D
L/D
0.0 0.2 0.4 0.6 0.8 1.0 1.2 1.4 1.6 1.8 2.00
1
2
3
4
5
6 S1g-70-260-F
S1g-70-410-F
p/ γγ γγ'D
L/D

Figures - Chapter 4
MANH NGOC TRAN F4.11
Figure 4.14: Effect of wall thickness on suction pressure during installation.
Figure 4.15: Effect of absolute caisson size on suction pressure.
0.0 0.2 0.4 0.6 0.8 1.0 1.2 1.4 1.60.0
0.4
0.8
1.2
1.6
2.0
2.4
2.8
3.2
S1g-80(1.0)-260-S
S1g-80(2.0)-260-S
p/ γγ γγ'D
L/D
0.0 0.5 1.0 1.5 2.00.0
0.5
1.0
1.5
2.0
2.5
3.0
3.5
S1g-100-260-S
S1g-70-260-S
p/ γγ γγ'D
L/D
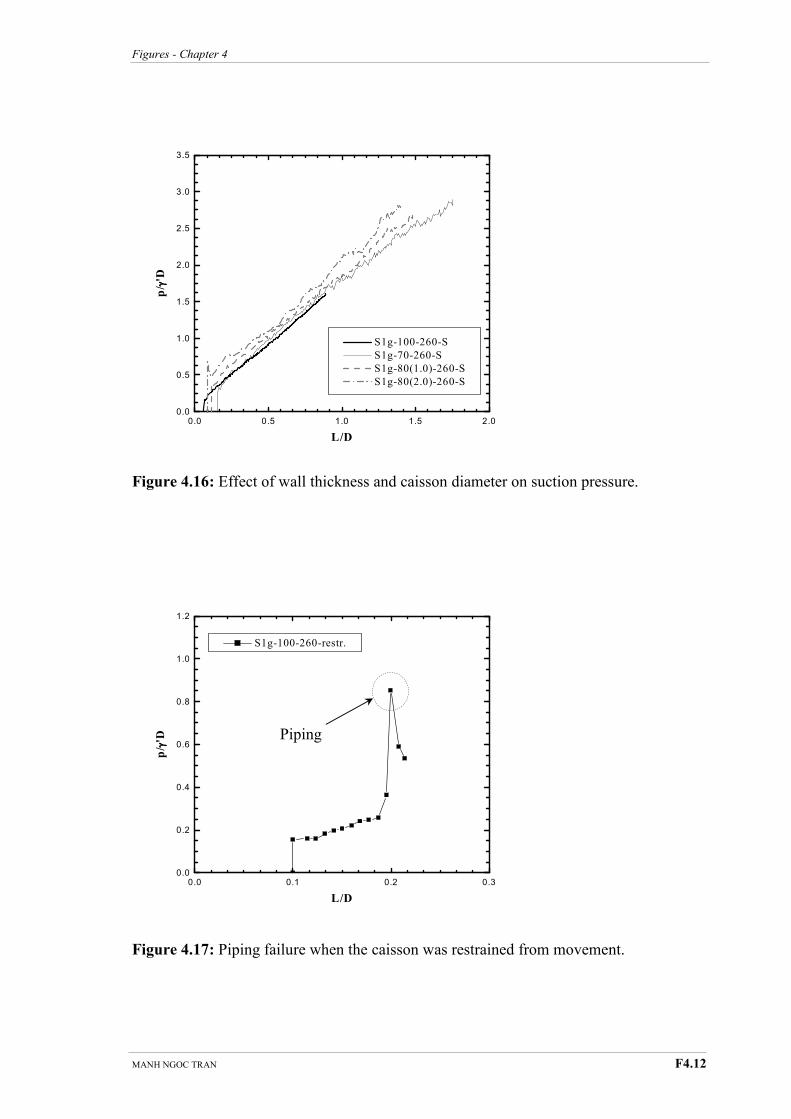
Figures - Chapter 4
MANH NGOC TRAN F4.12
Figure 4.16: Effect of wall thickness and caisson diameter on suction pressure.
Figure 4.17: Piping failure when the caisson was restrained from movement.
0.0 0.1 0.2 0.30.0
0.2
0.4
0.6
0.8
1.0
1.2
S1g-100-260-restr.
p/ γγ γγ'D
L/D
Piping
0.0 0.5 1.0 1.5 2.00.0
0.5
1.0
1.5
2.0
2.5
3.0
3.5
S1g-100-260-S
S1g-70-260-S
S1g-80(1.0)-260-S
S1g-80(2.0)-260-S
p/ γγ γγ'D
L/D
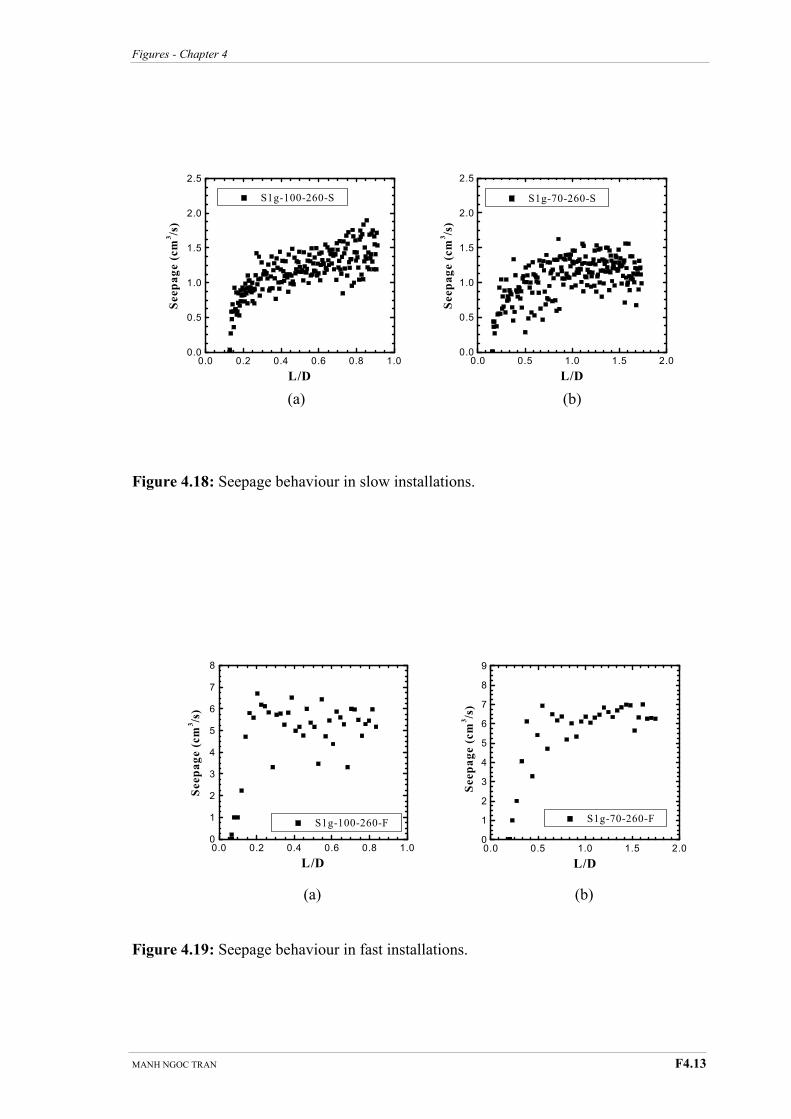
Figures - Chapter 4
MANH NGOC TRAN F4.13
(a) (b)
Figure 4.18: Seepage behaviour in slow installations.
(a) (b)
Figure 4.19: Seepage behaviour in fast installations.
0.0 0.2 0.4 0.6 0.8 1.00.0
0.5
1.0
1.5
2.0
2.5
S1g-100-260-S
Seepage (cm
3/s)
L/D
0.0 0.5 1.0 1.5 2.00.0
0.5
1.0
1.5
2.0
2.5
S1g-70-260-S
Seepage (cm
3/s)
L/D
0.0 0.2 0.4 0.6 0.8 1.00
1
2
3
4
5
6
7
8
S1g-100-260-F
Seepage (cm
3/s)
L/D
0.0 0.5 1.0 1.5 2.00
1
2
3
4
5
6
7
8
9
S1g-70-260-F
Seepage (cm
3/s)
L/D
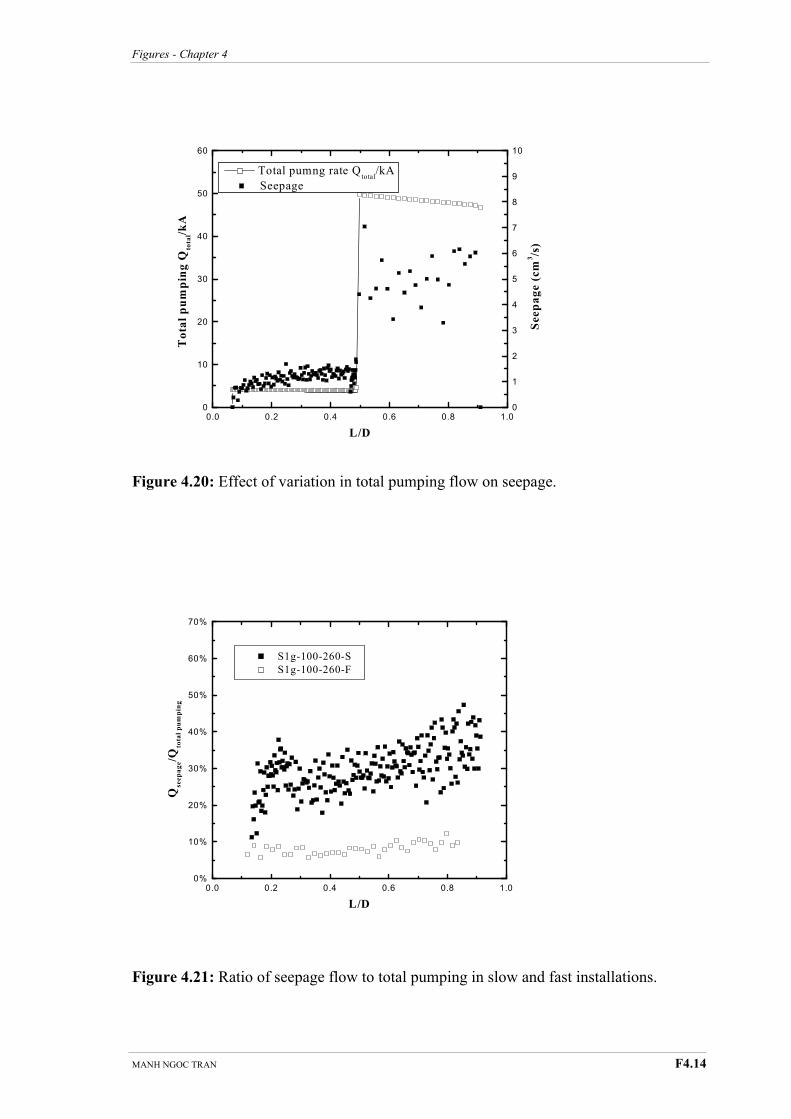
Figures - Chapter 4
MANH NGOC TRAN F4.14
Figure 4.20: Effect of variation in total pumping flow on seepage.
Figure 4.21: Ratio of seepage flow to total pumping in slow and fast installations.
0.0 0.2 0.4 0.6 0.8 1.00
10
20
30
40
50
60
Total pumng rate Qtotal
/kATotal pumping Q
total/kA
L/D
0
1
2
3
4
5
6
7
8
9
10
Seepage (cm
3/s)
Seepage
0.0 0.2 0.4 0.6 0.8 1.00%
10%
20%
30%
40%
50%
60%
70%
S1g-100-260-S
S1g-100-260-F
Qseepage/Q
total pumping
L/D
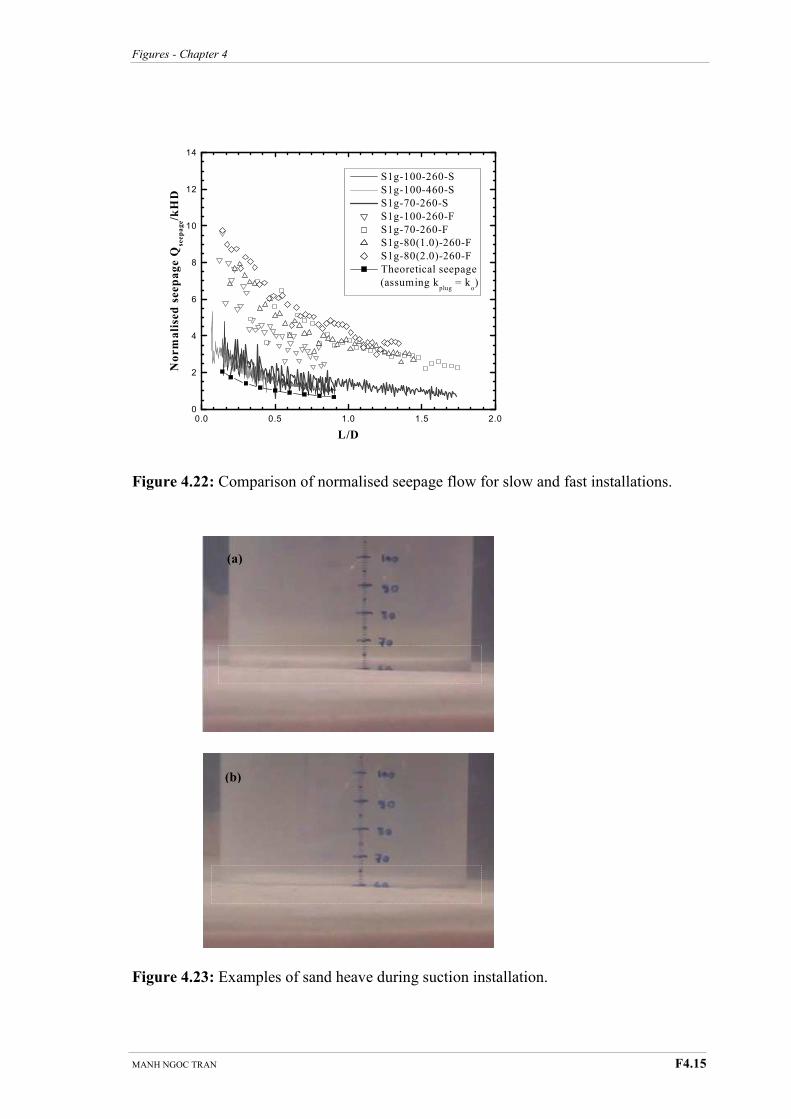
Figures - Chapter 4
MANH NGOC TRAN F4.15
Figure 4.22: Comparison of normalised seepage flow for slow and fast installations.
Figure 4.23: Examples of sand heave during suction installation.
0.0 0.5 1.0 1.5 2.00
2
4
6
8
10
12
14
S1g-100-260-S
S1g-100-460-S
S1g-70-260-S
S1g-100-260-F
S1g-70-260-F
S1g-80(1.0)-260-F
S1g-80(2.0)-260-F
Theoretical seepage
(assuming kplug
= ko)
Normalised seepage Q
seepage/kHD
L/D
(b)
(a)
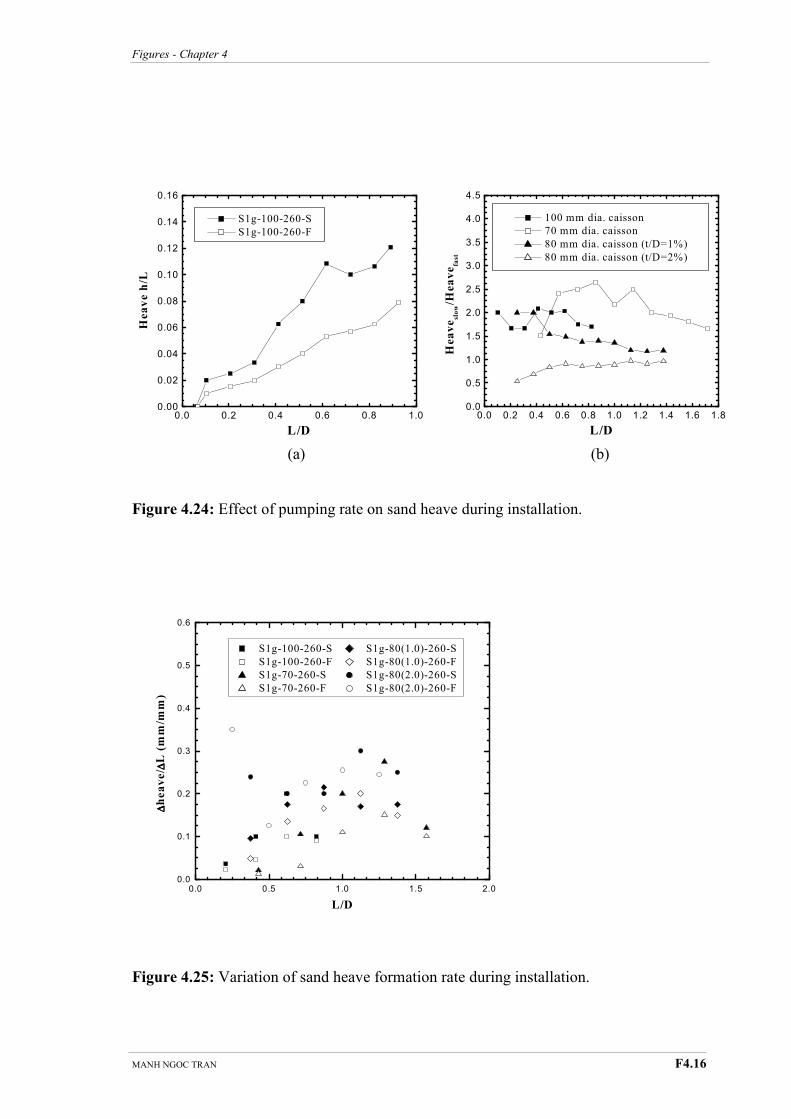
Figures - Chapter 4
MANH NGOC TRAN F4.16
(a) (b)
Figure 4.24: Effect of pumping rate on sand heave during installation.
Figure 4.25: Variation of sand heave formation rate during installation.
0.0 0.2 0.4 0.6 0.8 1.0 1.2 1.4 1.6 1.80.0
0.5
1.0
1.5
2.0
2.5
3.0
3.5
4.0
4.5
100 mm dia. caisson
70 mm dia. caisson
80 mm dia. caisson (t/D=1%)
80 mm dia. caisson (t/D=2%)
Heaveslow/H
eavefast
L/D
0.0 0.2 0.4 0.6 0.8 1.00.00
0.02
0.04
0.06
0.08
0.10
0.12
0.14
0.16
S1g-100-260-S
S1g-100-260-F
Heave h/L
L/D
0.0 0.5 1.0 1.5 2.00.0
0.1
0.2
0.3
0.4
0.5
0.6
S1g-100-260-S S1g-80(1.0)-260-S
S1g-100-260-F S1g-80(1.0)-260-F
S1g-70-260-S S1g-80(2.0)-260-S
S1g-70-260-F S1g-80(2.0)-260-F
∆∆ ∆∆heave/ ∆∆ ∆∆L (mm/m
m)
L/D

Figures - Chapter 4
MANH NGOC TRAN F4.17
(a)
(b)
Figure 4.26: Effect of surcharge on sand heave.
0.0 0.2 0.4 0.6 0.8 1.00
1
2
3
4
5
6
7
8
9
10
S1g-100-260-F
S1g-100-460-F
Seepage (cm
3/s)
L/D
0.0 0.2 0.4 0.6 0.8 1.00.00
0.02
0.04
0.06
0.08
0.10
S1g-100-260-F
S1g-100-360-F
S1g-100-410-F
S1g-100-460-F
h/L
L/D

Figures - Chapter 4
MANH NGOC TRAN F4.18
Figure 4.27: Effect of caisson wall thickness on sand heave.
Figure 4.28a: Suction pressures in the Oxford tests.
0.0 0.5 1.0 1.5 2.00.00
0.05
0.10
0.15
0.20
0.25
0.30
S1g-70-260-S S1g-80(1.0)-260-S S1g-80(2.0)-260-S
Total heave Total heave Total heave
No wall vol. No wall vol. No wall vol.
h/L
L/D
0.0 0.2 0.4 0.6 0.8 1.00
1
2
3
4
5
6
7
8
9
10
11
Ox-150-1 Ox-150-5
Ox-150-2 Ox-150-6
Ox-150-3 Ox-150-7
Ox-150-4 Ox-150-8
p/ γγ γγ'D
L/D
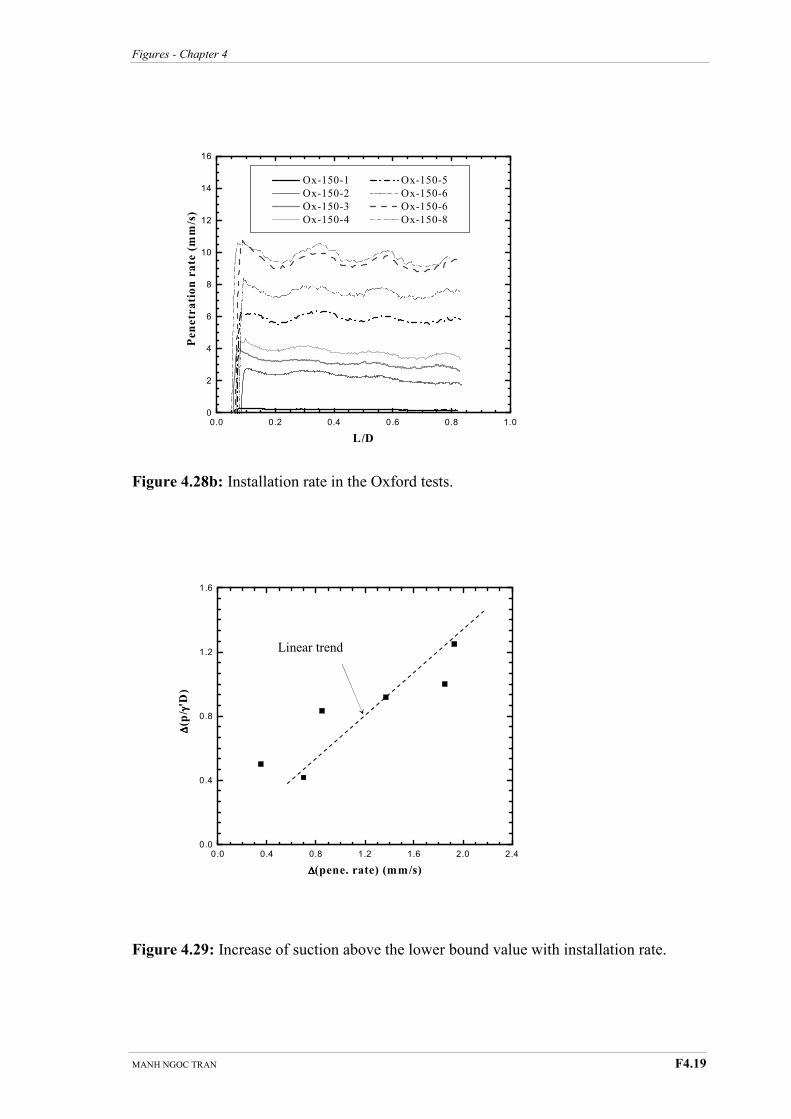
Figures - Chapter 4
MANH NGOC TRAN F4.19
Figure 4.28b: Installation rate in the Oxford tests.
Figure 4.29: Increase of suction above the lower bound value with installation rate.
0.0 0.2 0.4 0.6 0.8 1.00
2
4
6
8
10
12
14
16
Ox-150-1 Ox-150-5
Ox-150-2 Ox-150-6
Ox-150-3 Ox-150-6
Ox-150-4 Ox-150-8
Penetration rate (mm/s)
L/D
0.0 0.4 0.8 1.2 1.6 2.0 2.40.0
0.4
0.8
1.2
1.6
∆∆ ∆∆(p/ γγ γγ'D
)
∆∆∆∆(pene. rate) (mm/s)
Linear trend

Figures - Chapter 4
MANH NGOC TRAN F4.20
(a)
(b)
Figure 4.30: (a) Suction pressure (b) Installation rate in “lower bound” suction test.
0.0 0.2 0.4 0.6 0.8 1.00.0
0.2
0.4
0.6
0.8
1.0
1.2
1.4
1.6
1.8
2.0
2.2
Ox-150-1
Ox-150-9
p/ γγ γγ'D
L/D
0.0 0.2 0.4 0.6 0.8 1.00.0
0.1
0.2
0.3
0.4
Ox-150-1
Ox-150-9
Penetration rate (mm/s)
L/D
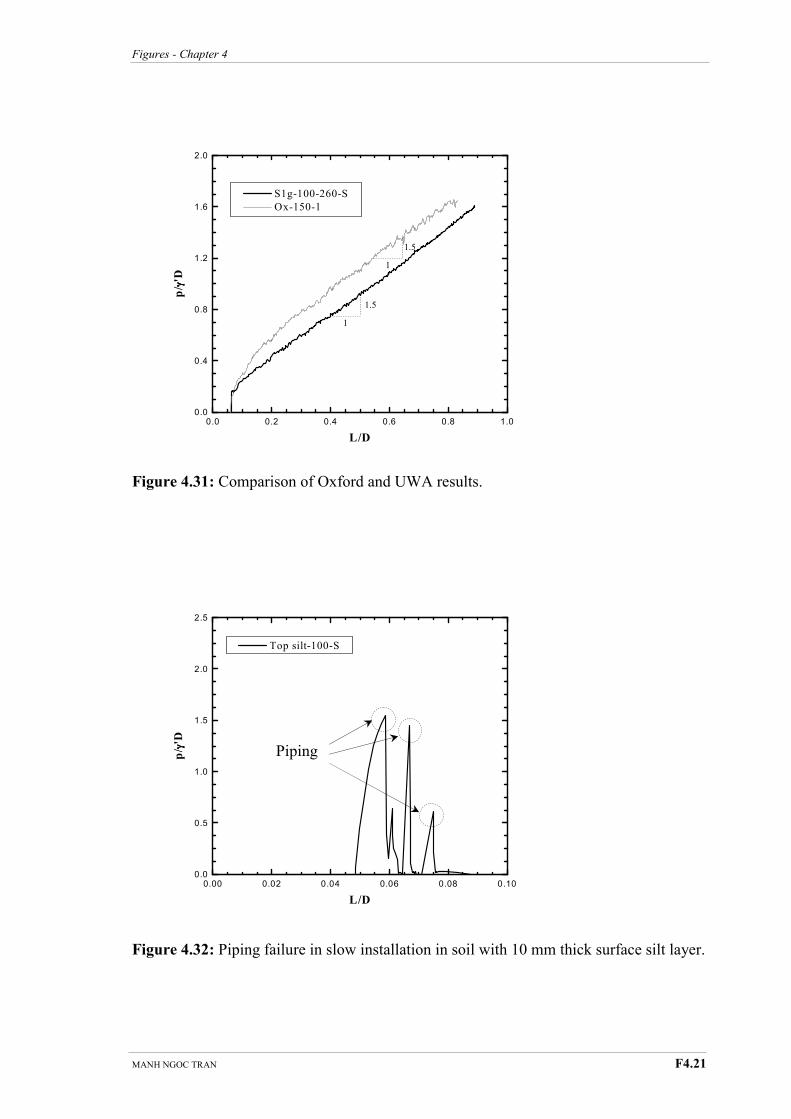
Figures - Chapter 4
MANH NGOC TRAN F4.21
Figure 4.31: Comparison of Oxford and UWA results.
Figure 4.32: Piping failure in slow installation in soil with 10 mm thick surface silt layer.
0.00 0.02 0.04 0.06 0.08 0.100.0
0.5
1.0
1.5
2.0
2.5
Top silt-100-S
p/ γγ γγ'D
L/D
Piping
0.0 0.2 0.4 0.6 0.8 1.00.0
0.4
0.8
1.2
1.6
2.0
S1g-100-260-S
Ox-150-1
p/ γγ γγ'D
L/D
1
1.5
1
1.5
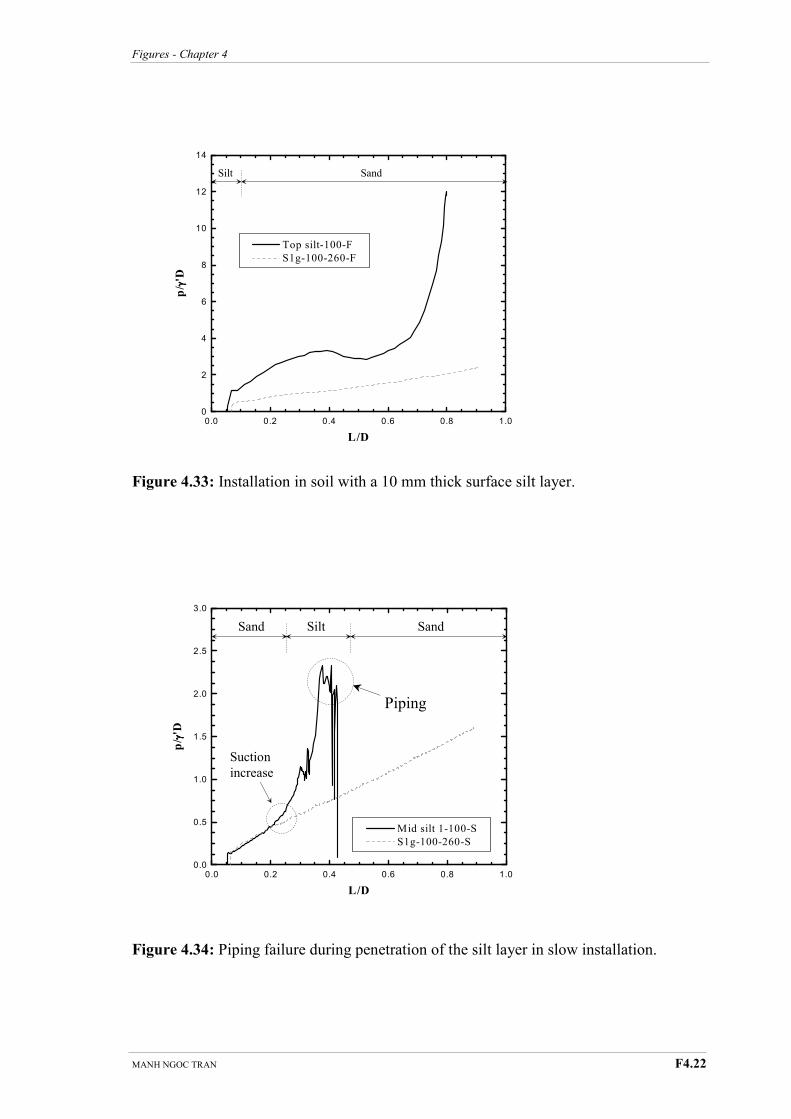
Figures - Chapter 4
MANH NGOC TRAN F4.22
Figure 4.33: Installation in soil with a 10 mm thick surface silt layer.
Figure 4.34: Piping failure during penetration of the silt layer in slow installation.
0.0 0.2 0.4 0.6 0.8 1.00.0
0.5
1.0
1.5
2.0
2.5
3.0
Mid silt 1-100-S
S1g-100-260-S
p/ γγ γγ'D
L/D
Sand Silt
Piping
Sand
Suction
increase
Silt Sand
0.0 0.2 0.4 0.6 0.8 1.00
2
4
6
8
10
12
14
Top silt-100-F
S1g-100-260-F
p/ γγ γγ'D
L/D
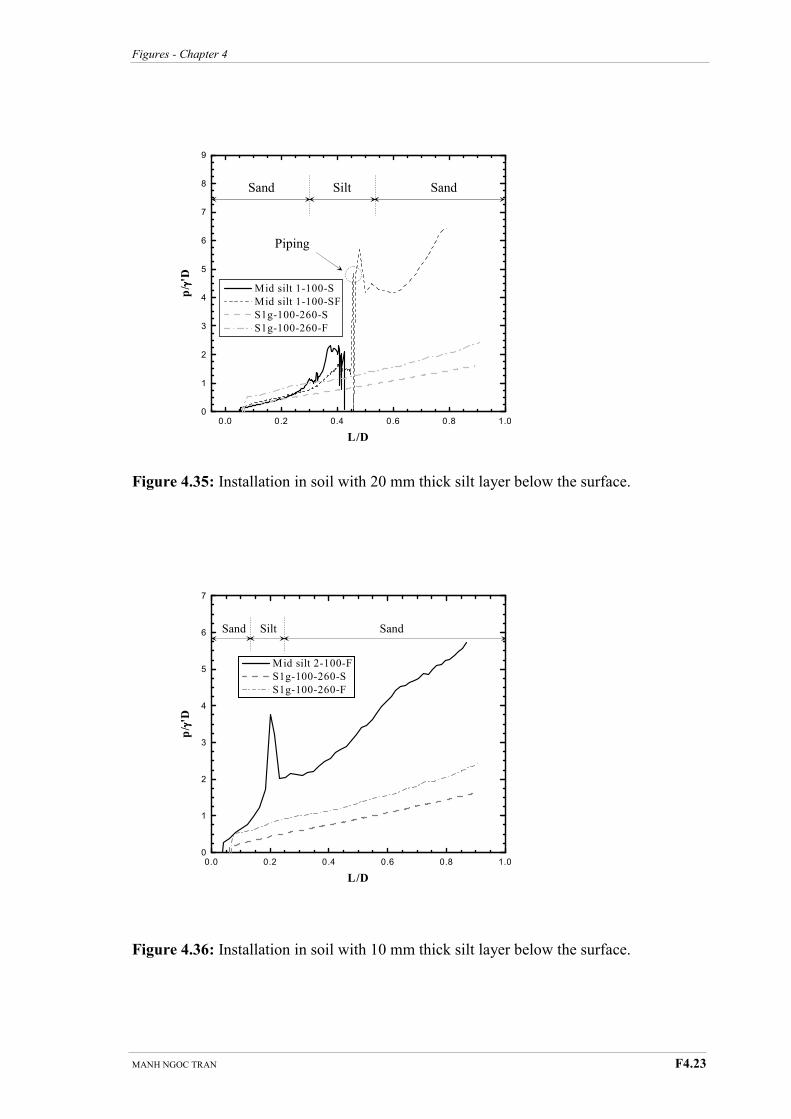
Figures - Chapter 4
MANH NGOC TRAN F4.23
Figure 4.35: Installation in soil with 20 mm thick silt layer below the surface.
Figure 4.36: Installation in soil with 10 mm thick silt layer below the surface.
0.0 0.2 0.4 0.6 0.8 1.00
1
2
3
4
5
6
7
8
9
Mid silt 1-100-S
Mid silt 1-100-SF
S1g-100-260-S
S1g-100-260-F
p/ γγ γγ'D
L/D
Sand Silt Sand
Piping
0.0 0.2 0.4 0.6 0.8 1.00
1
2
3
4
5
6
7
Mid silt 2-100-F
S1g-100-260-S
S1g-100-260-F
p/ γγ γγ'D
L/D
Silt Sand Sand
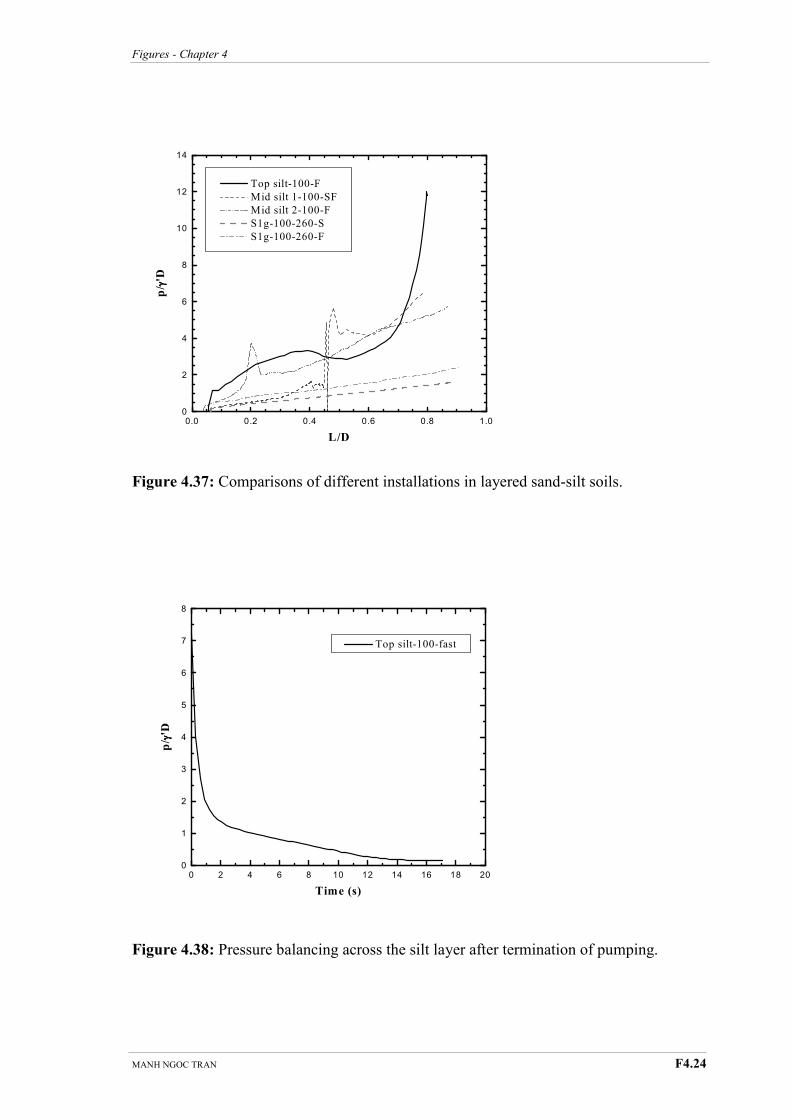
Figures - Chapter 4
MANH NGOC TRAN F4.24
Figure 4.37: Comparisons of different installations in layered sand-silt soils.
Figure 4.38: Pressure balancing across the silt layer after termination of pumping.
0 2 4 6 8 10 12 14 16 18 200
1
2
3
4
5
6
7
8
Top silt-100-fast
p/ γγ γγ'D
Time (s)
0.0 0.2 0.4 0.6 0.8 1.00
2
4
6
8
10
12
14
Top silt-100-F
Mid silt 1-100-SF
Mid silt 2-100-F
S1g-100-260-S
S1g-100-260-F
p/ γγ γγ'D
L/D
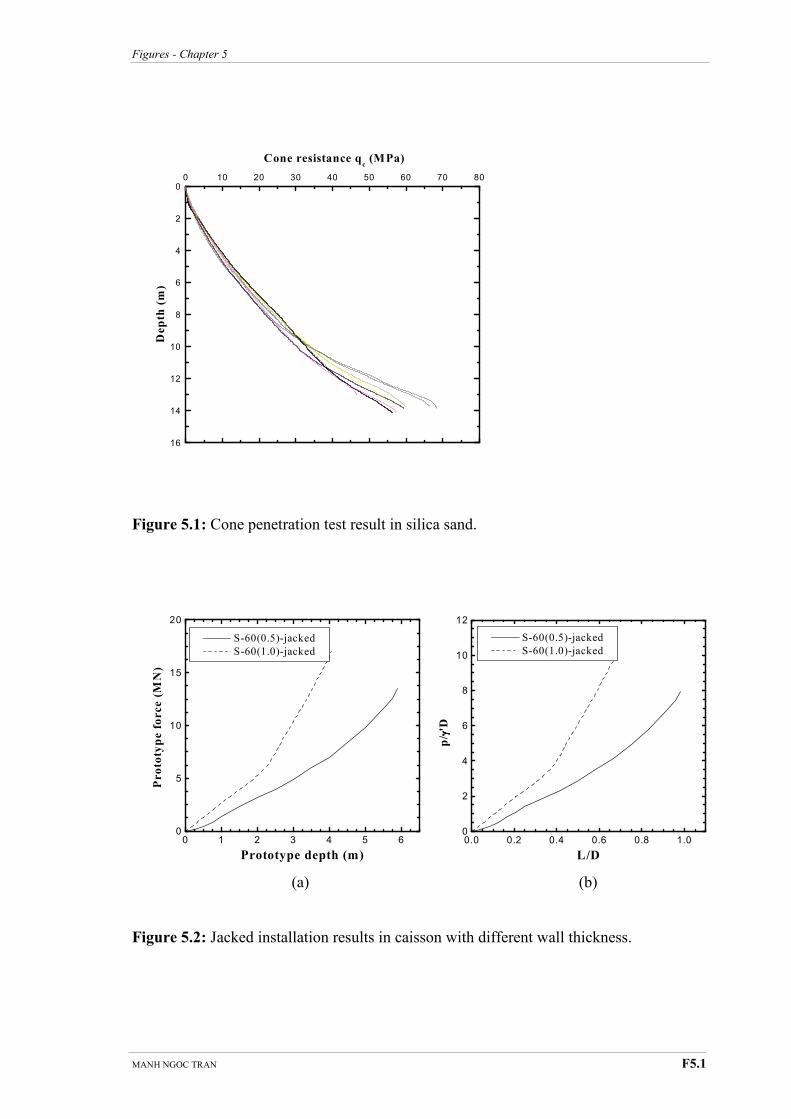
Figures - Chapter 5
MANH NGOC TRAN F5.1
Chapter Seventeen
Chapter Eighteen Chapter Nineteen Chapter Twenty Chapter Twenty-one
Figure 5.1: Cone penetration test result in silica sand.
(a) (b)
Figure 5.2: Jacked installation results in caisson with different wall thickness.
16
14
12
10
8
6
4
2
00 10 20 30 40 50 60 70 80
Cone resistance qc (MPa)
Depth (m)
0 1 2 3 4 5 60
5
10
15
20
S-60(0.5)-jacked
S-60(1.0)-jacked
Prototype force (M
N)
Prototype depth (m)
0.0 0.2 0.4 0.6 0.8 1.00
2
4
6
8
10
12
S-60(0.5)-jacked
S-60(1.0)-jacked
p/ γγ γγ'D
L/D
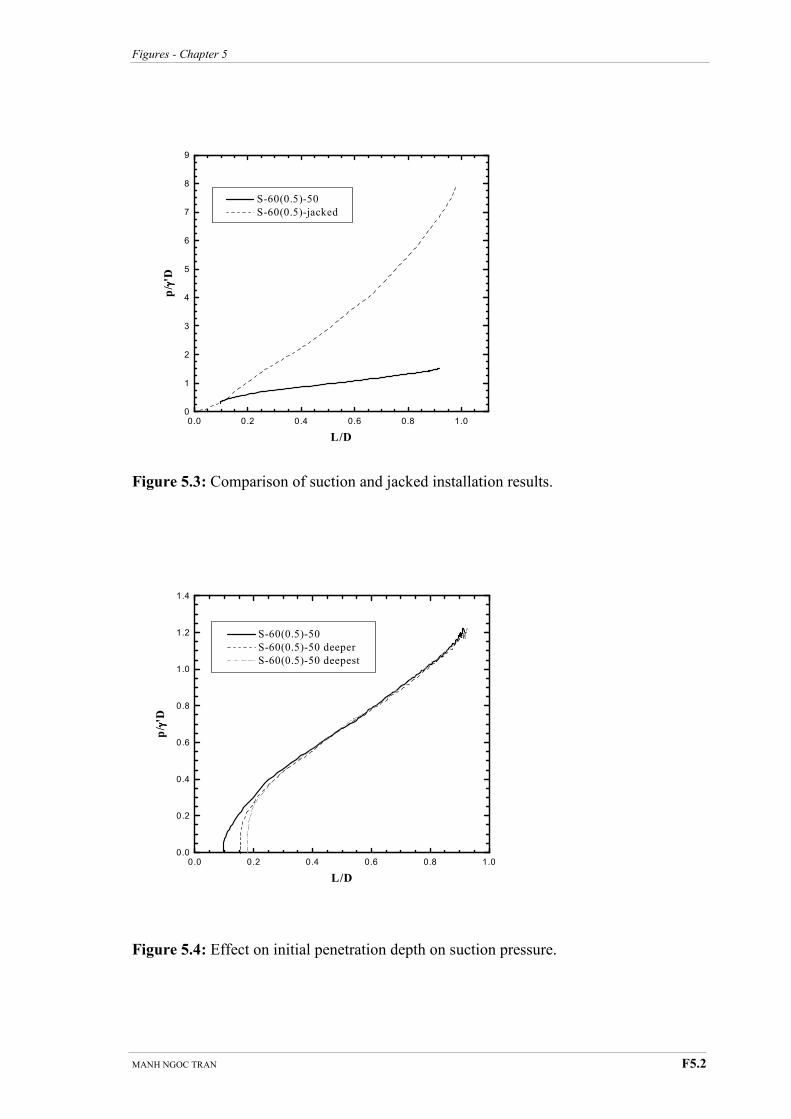
Figures - Chapter 5
MANH NGOC TRAN F5.2
Figure 5.3: Comparison of suction and jacked installation results.
Figure 5.4: Effect on initial penetration depth on suction pressure.
0.0 0.2 0.4 0.6 0.8 1.00.0
0.2
0.4
0.6
0.8
1.0
1.2
1.4
S-60(0.5)-50
S-60(0.5)-50 deeper
S-60(0.5)-50 deepest
p/ γγ γγ'D
L/D
0.0 0.2 0.4 0.6 0.8 1.00
1
2
3
4
5
6
7
8
9
S-60(0.5)-50
S-60(0.5)-jacked
p/ γγ γγ'D
L/D
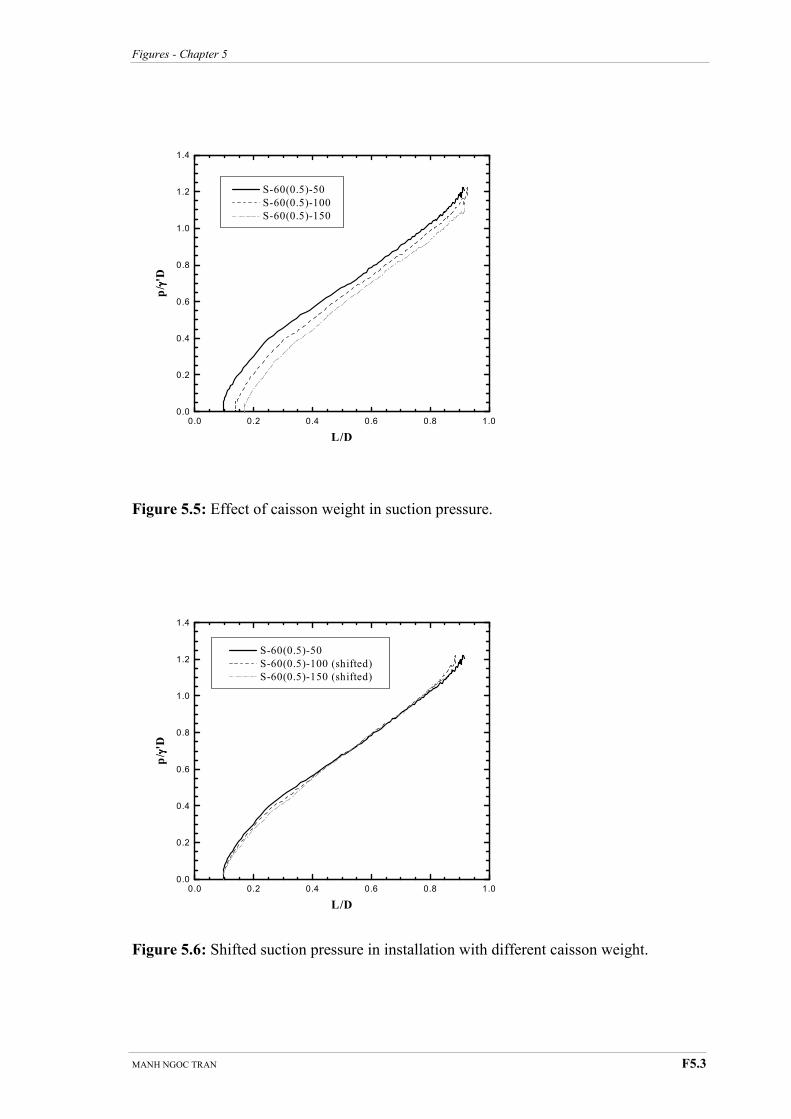
Figures - Chapter 5
MANH NGOC TRAN F5.3
Figure 5.5: Effect of caisson weight in suction pressure.
Figure 5.6: Shifted suction pressure in installation with different caisson weight.
0.0 0.2 0.4 0.6 0.8 1.00.0
0.2
0.4
0.6
0.8
1.0
1.2
1.4
S-60(0.5)-50
S-60(0.5)-100 (shifted)
S-60(0.5)-150 (shifted)
p/ γγ γγ'D
L/D
0.0 0.2 0.4 0.6 0.8 1.00.0
0.2
0.4
0.6
0.8
1.0
1.2
1.4
S-60(0.5)-50
S-60(0.5)-100
S-60(0.5)-150
p/ γγ γγ'D
L/D
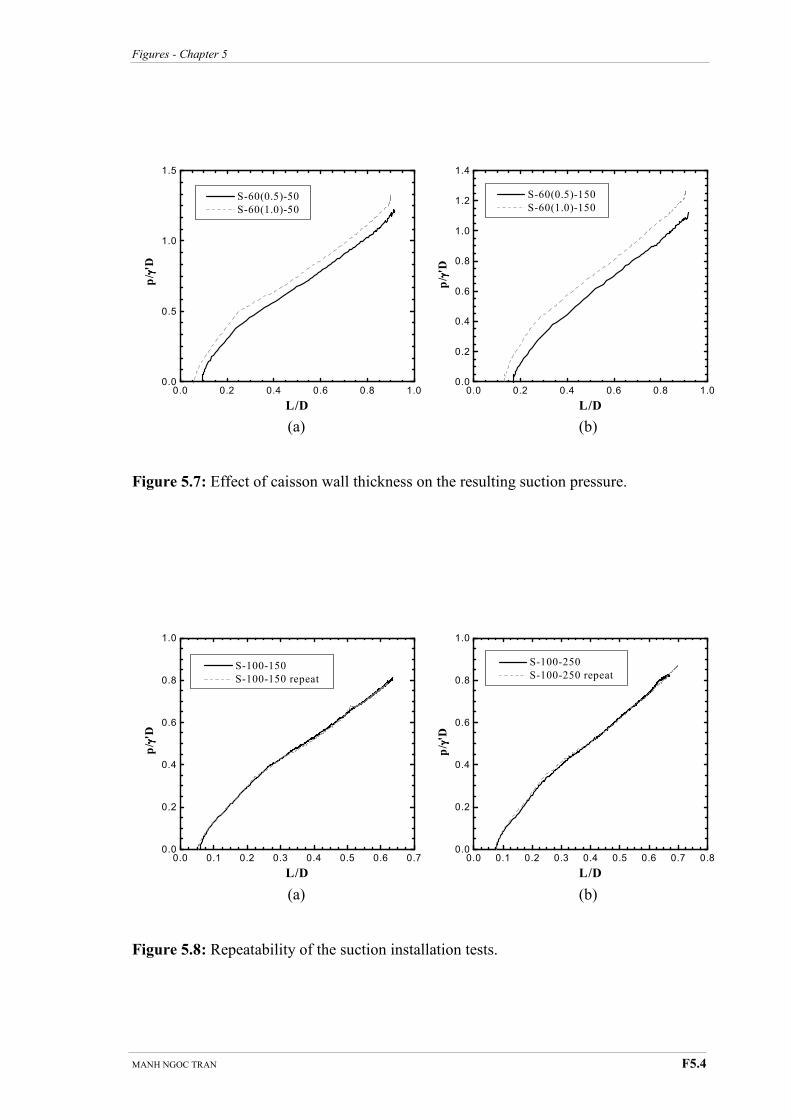
Figures - Chapter 5
MANH NGOC TRAN F5.4
(a) (b)
Figure 5.7: Effect of caisson wall thickness on the resulting suction pressure.
(a) (b)
Figure 5.8: Repeatability of the suction installation tests.
0.0 0.2 0.4 0.6 0.8 1.00.0
0.5
1.0
1.5
S-60(0.5)-50
S-60(1.0)-50
p/ γγ γγ'D
L/D
0.0 0.1 0.2 0.3 0.4 0.5 0.6 0.7 0.80.0
0.2
0.4
0.6
0.8
1.0
S-100-250
S-100-250 repeat
p/ γγ γγ'D
L/D
0.0 0.1 0.2 0.3 0.4 0.5 0.6 0.70.0
0.2
0.4
0.6
0.8
1.0
S-100-150
S-100-150 repeat
p/ γγ γγ'D
L/D
0.0 0.2 0.4 0.6 0.8 1.00.0
0.2
0.4
0.6
0.8
1.0
1.2
1.4
S-60(0.5)-150
S-60(1.0)-150
p/ γγ γγ'D
L/D
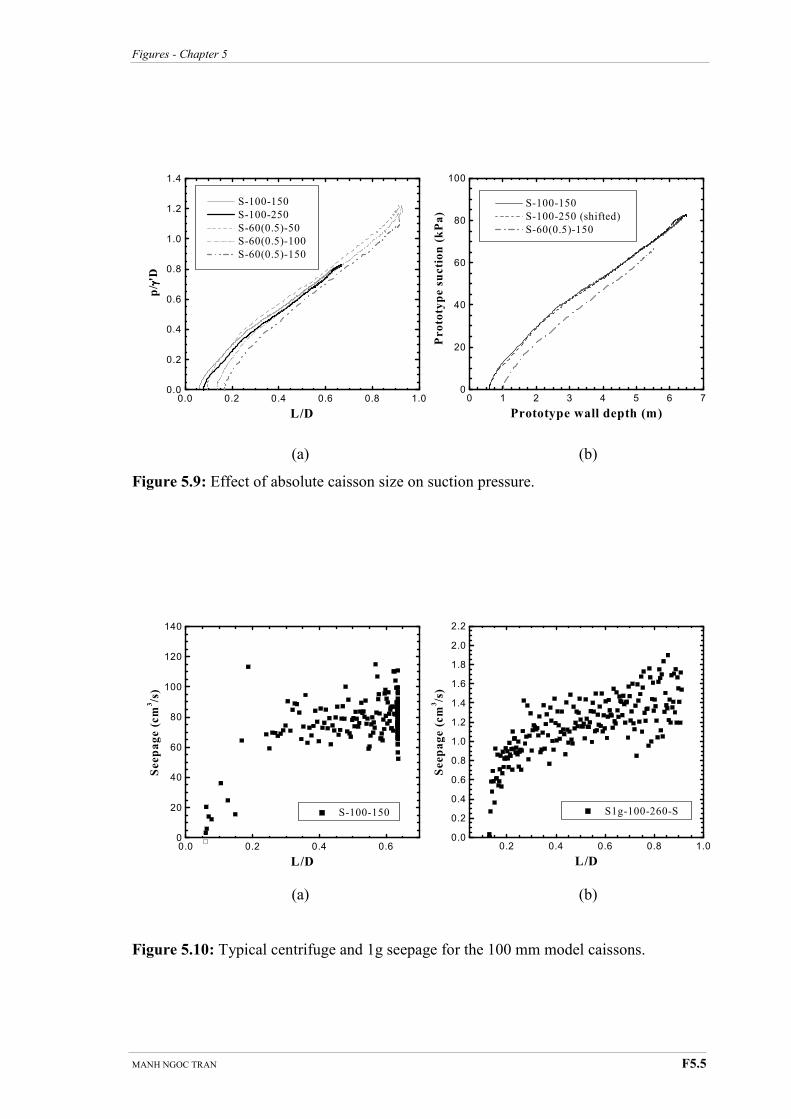
Figures - Chapter 5
MANH NGOC TRAN F5.5
(a) (b)
Figure 5.9: Effect of absolute caisson size on suction pressure.
(a) (b)
Figure 5.10: Typical centrifuge and 1g seepage for the 100 mm model caissons.
0.0 0.2 0.4 0.60
20
40
60
80
100
120
140
S-100-150
Seepage (cm
3/s)
L/D
0.0 0.2 0.4 0.6 0.8 1.00.0
0.2
0.4
0.6
0.8
1.0
1.2
1.4
S-100-150
S-100-250
S-60(0.5)-50
S-60(0.5)-100
S-60(0.5)-150
p/ γγ γγ'D
L/D
0 1 2 3 4 5 6 70
20
40
60
80
100
S-100-150
S-100-250 (shifted)
S-60(0.5)-150
Prototype suction (kPa)
Prototype wall depth (m)
0.2 0.4 0.6 0.8 1.00.0
0.2
0.4
0.6
0.8
1.0
1.2
1.4
1.6
1.8
2.0
2.2
S1g-100-260-S
Seepage (cm
3/s)
L/D
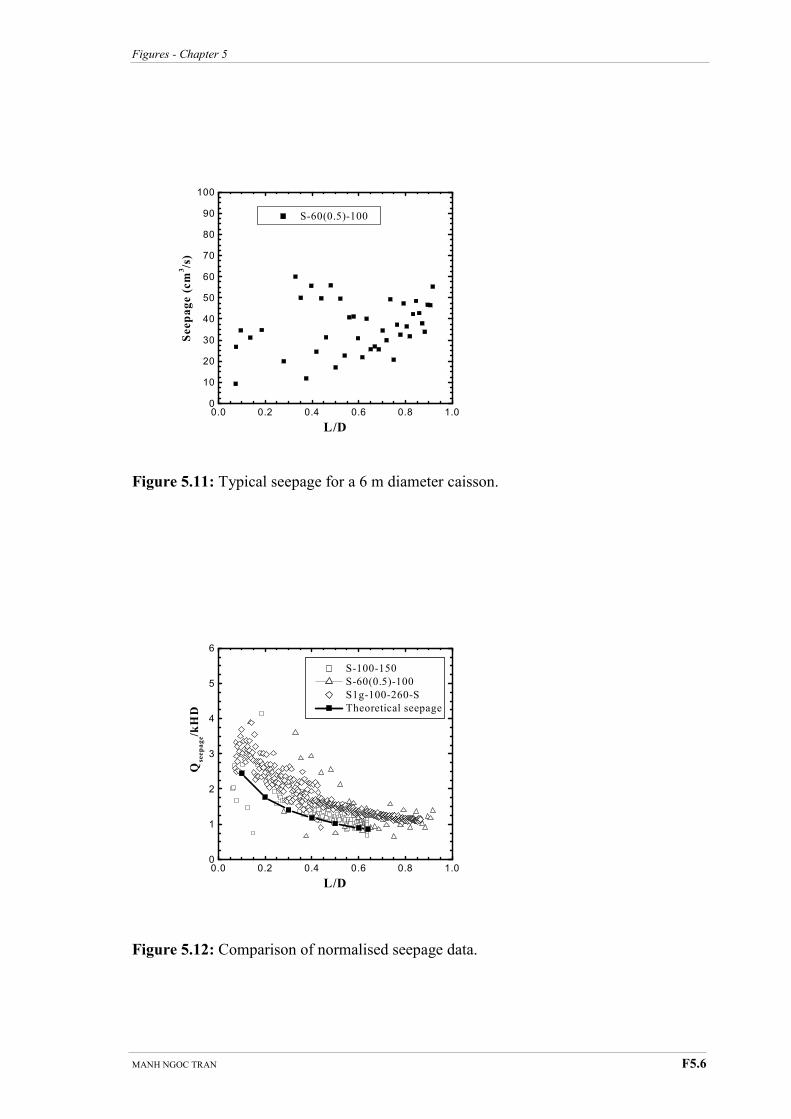
Figures - Chapter 5
MANH NGOC TRAN F5.6
Figure 5.11: Typical seepage for a 6 m diameter caisson.
Figure 5.12: Comparison of normalised seepage data.
0.0 0.2 0.4 0.6 0.8 1.00
10
20
30
40
50
60
70
80
90
100
S-60(0.5)-100
Seepage (cm
3/s)
L/D
0.0 0.2 0.4 0.6 0.8 1.00
1
2
3
4
5
6
S-100-150
S-60(0.5)-100
S1g-100-260-S
Theoretical seepage
Qseepage/kHD
L/D
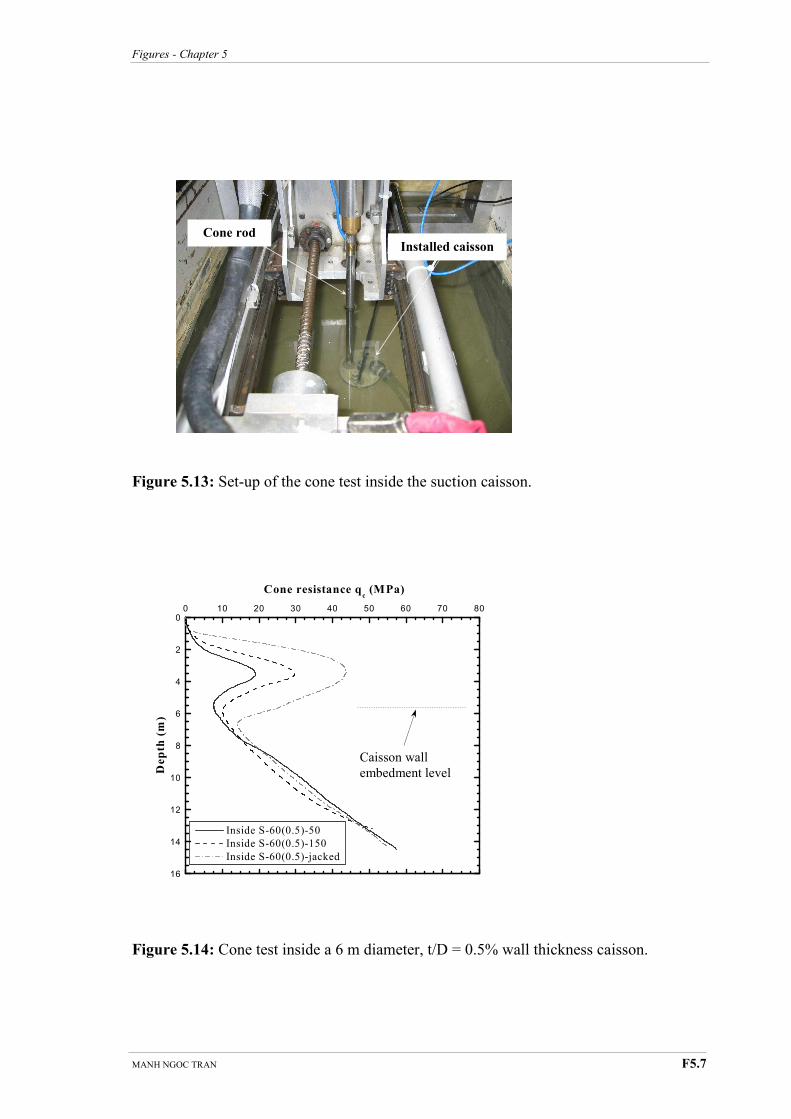
Figures - Chapter 5
MANH NGOC TRAN F5.7
Figure 5.13: Set-up of the cone test inside the suction caisson.
Figure 5.14: Cone test inside a 6 m diameter, t/D = 0.5% wall thickness caisson.
Installed caisson Cone rod
16
14
12
10
8
6
4
2
00 10 20 30 40 50 60 70 80
Inside S-60(0.5)-50
Inside S-60(0.5)-150
Inside S-60(0.5)-jacked
Cone resistance qc (MPa)
Depth (m)
Caisson wall
embedment level
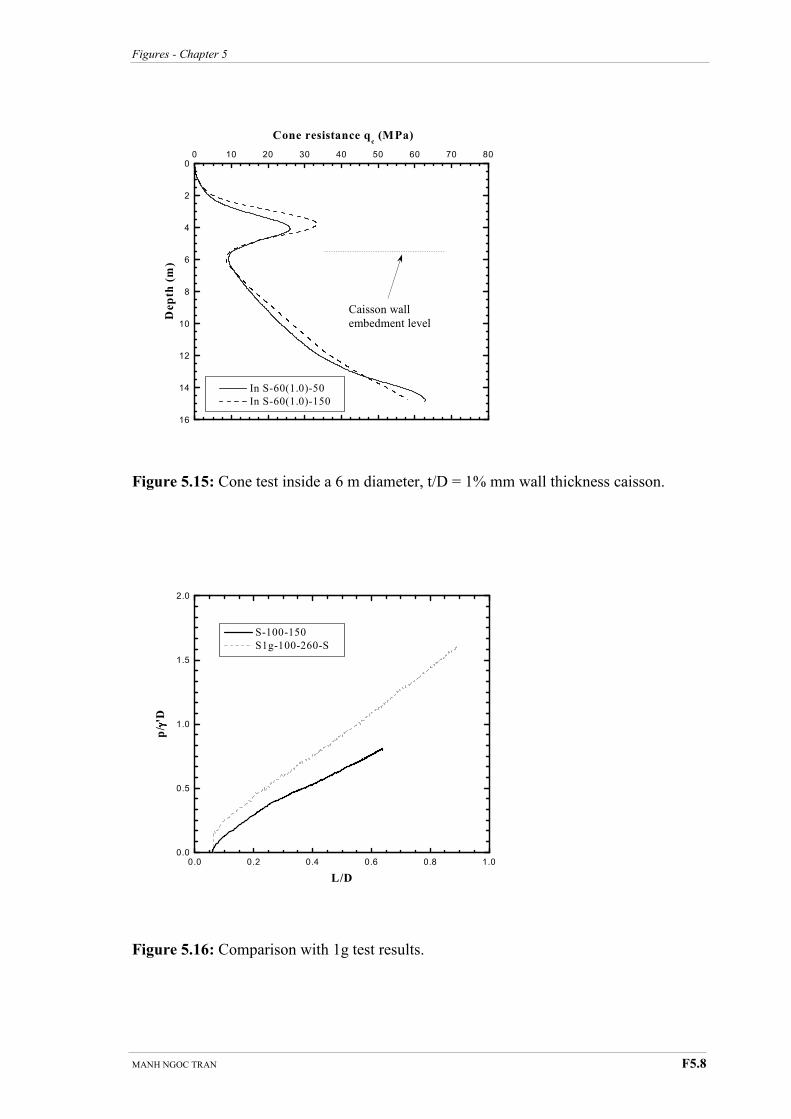
Figures - Chapter 5
MANH NGOC TRAN F5.8
Figure 5.15: Cone test inside a 6 m diameter, t/D = 1% mm wall thickness caisson.
Figure 5.16: Comparison with 1g test results.
16
14
12
10
8
6
4
2
00 10 20 30 40 50 60 70 80
In S-60(1.0)-50
In S-60(1.0)-150
Cone resistance qc (MPa)
Depth (m)
Caisson wall
embedment level
0.0 0.2 0.4 0.6 0.8 1.00.0
0.5
1.0
1.5
2.0
S-100-150
S1g-100-260-S
p/ γγ γγ'D
L/D
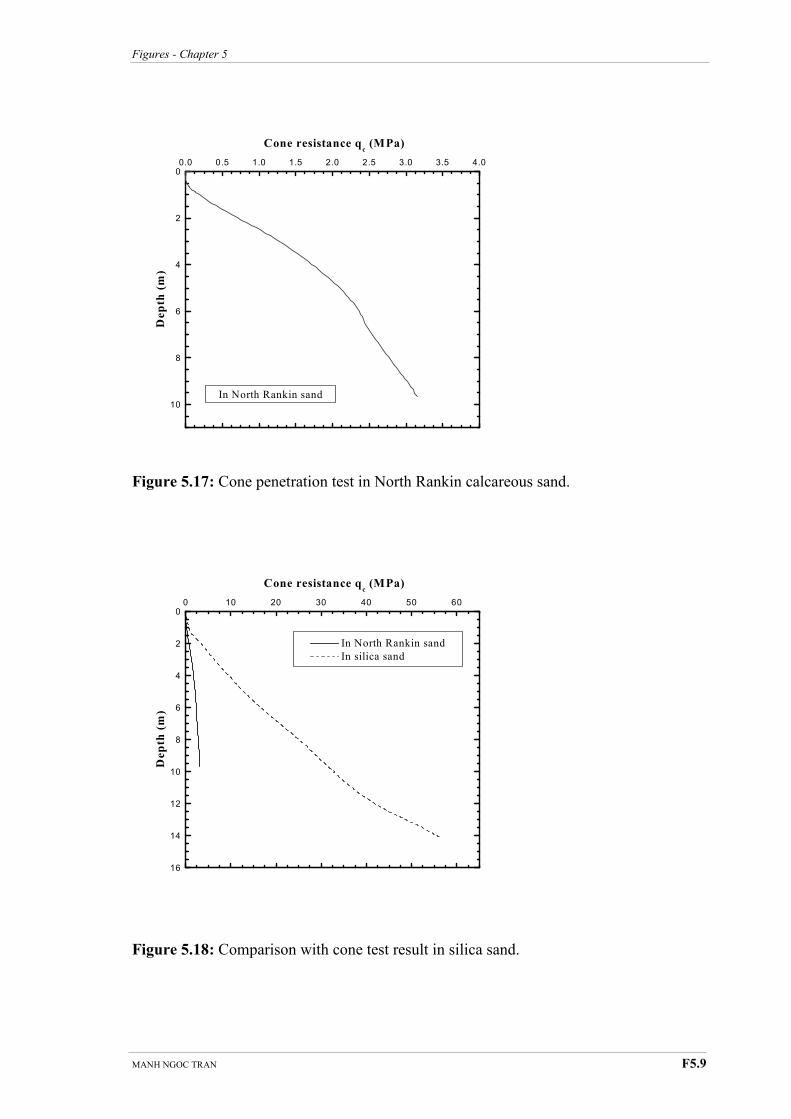
Figures - Chapter 5
MANH NGOC TRAN F5.9
Figure 5.17: Cone penetration test in North Rankin calcareous sand.
Figure 5.18: Comparison with cone test result in silica sand.
10
8
6
4
2
00.0 0.5 1.0 1.5 2.0 2.5 3.0 3.5 4.0
In North Rankin sand
Cone resistance qc (MPa)
Depth (m)
16
14
12
10
8
6
4
2
00 10 20 30 40 50 60
In North Rankin sand
In silica sand
Cone resistance qc (MPa)
Depth (m)
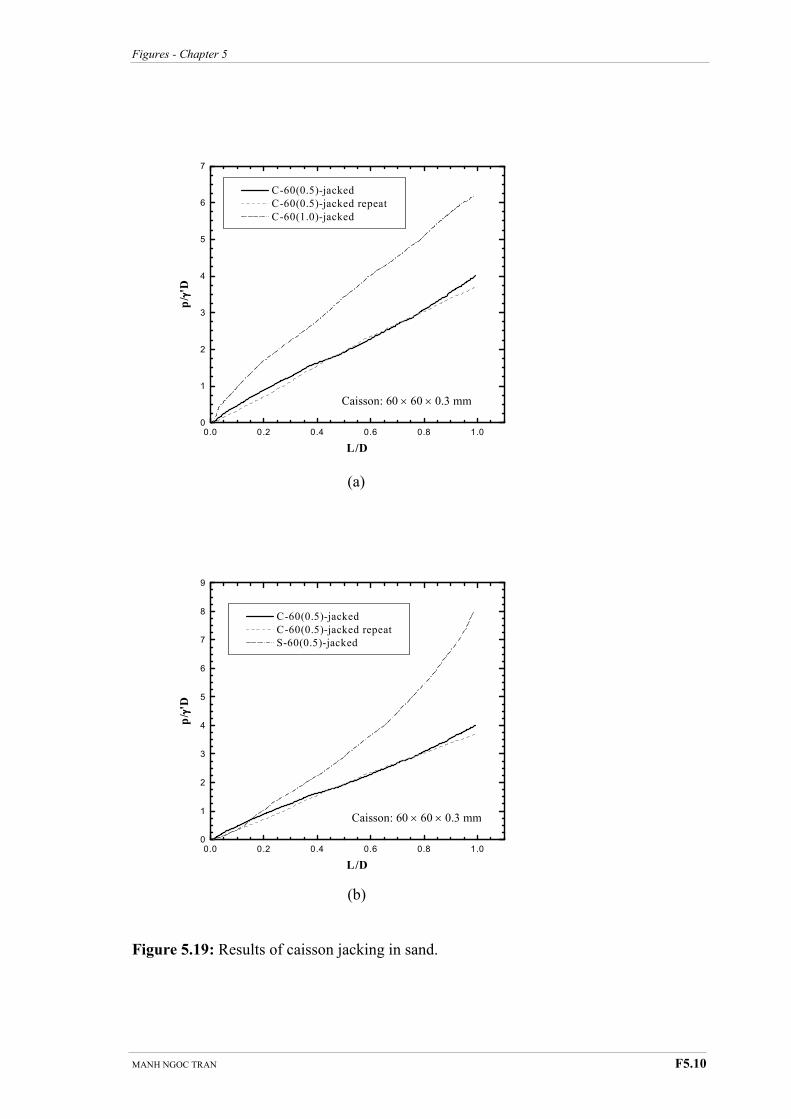
Figures - Chapter 5
MANH NGOC TRAN F5.10
(a)
(b)
Figure 5.19: Results of caisson jacking in sand.
0.0 0.2 0.4 0.6 0.8 1.00
1
2
3
4
5
6
7
8
9
C-60(0.5)-jacked
C-60(0.5)-jacked repeat
S-60(0.5)-jacked
p/ γγ γγ'D
L/D
Caisson: 60 × 60 × 0.3 mm
0.0 0.2 0.4 0.6 0.8 1.00
1
2
3
4
5
6
7
C-60(0.5)-jacked
C-60(0.5)-jacked repeat
C-60(1.0)-jacked
p/ γγ γγ'D
L/D
Caisson: 60 × 60 × 0.3 mm
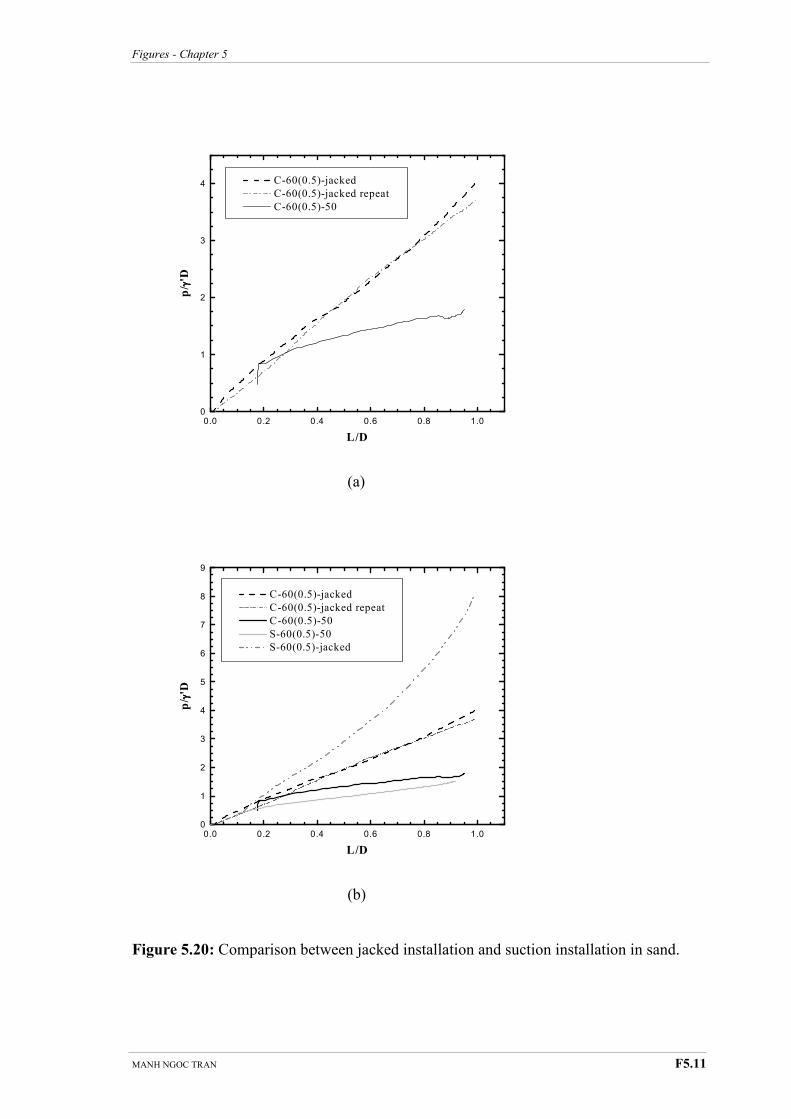
Figures - Chapter 5
MANH NGOC TRAN F5.11
(a)
(b)
Figure 5.20: Comparison between jacked installation and suction installation in sand.
0.0 0.2 0.4 0.6 0.8 1.00
1
2
3
4 C-60(0.5)-jacked
C-60(0.5)-jacked repeat
C-60(0.5)-50
p/ γγ γγ'D
L/D
0.0 0.2 0.4 0.6 0.8 1.00
1
2
3
4
5
6
7
8
9
C-60(0.5)-jacked
C-60(0.5)-jacked repeat
C-60(0.5)-50
S-60(0.5)-50
S-60(0.5)-jacked
p/ γγ γγ'D
L/D
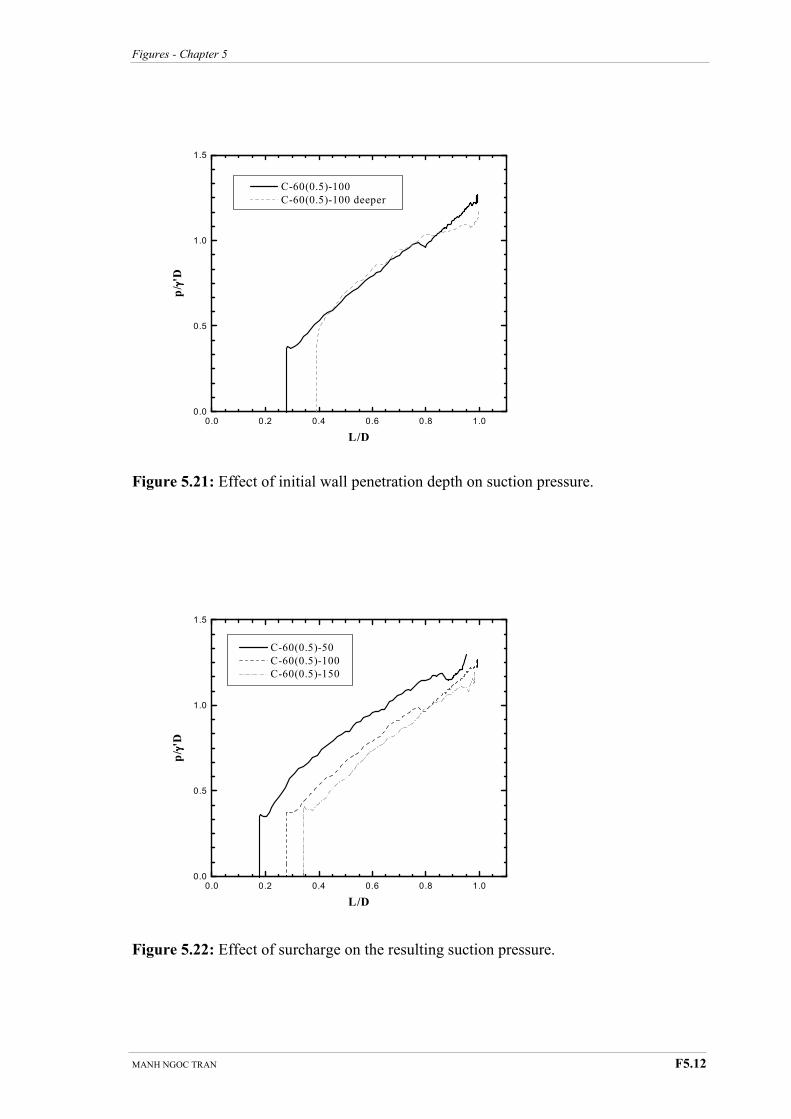
Figures - Chapter 5
MANH NGOC TRAN F5.12
Figure 5.21: Effect of initial wall penetration depth on suction pressure.
Figure 5.22: Effect of surcharge on the resulting suction pressure.
0.0 0.2 0.4 0.6 0.8 1.00.0
0.5
1.0
1.5
C-60(0.5)-100
C-60(0.5)-100 deeper
p/ γγ γγ'D
L/D
0.0 0.2 0.4 0.6 0.8 1.00.0
0.5
1.0
1.5
C-60(0.5)-50
C-60(0.5)-100
C-60(0.5)-150
p/ γγ γγ'D
L/D
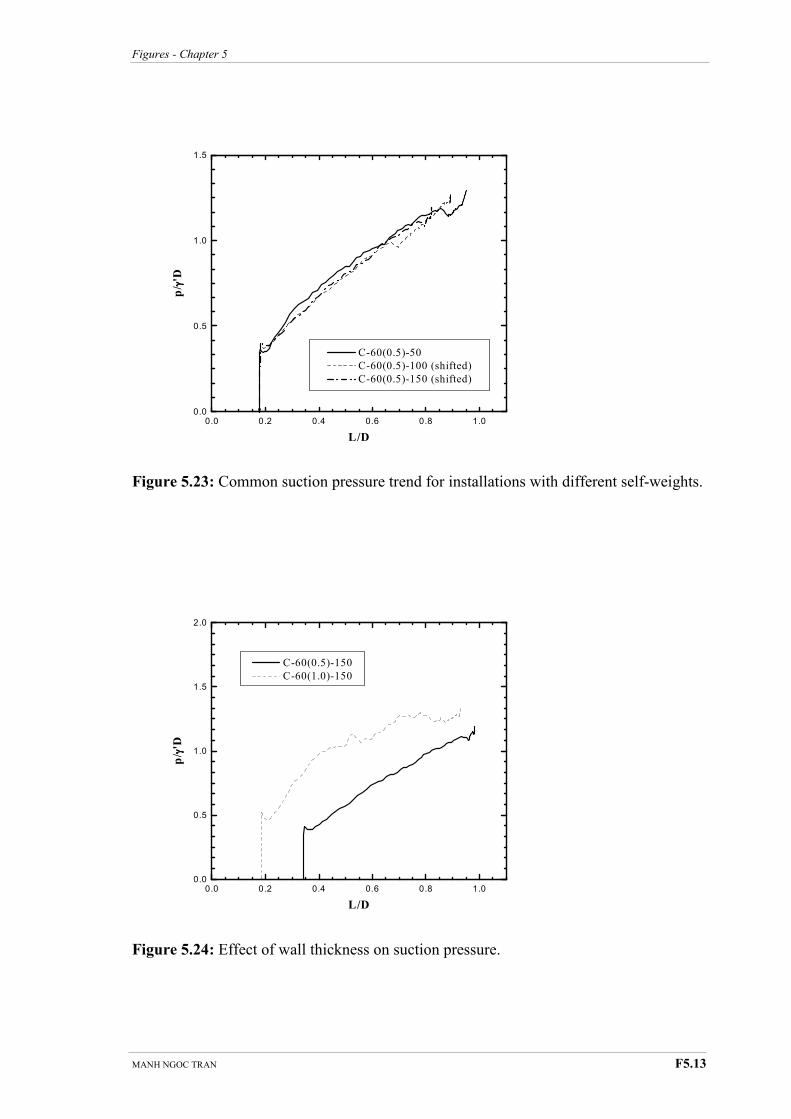
Figures - Chapter 5
MANH NGOC TRAN F5.13
Figure 5.23: Common suction pressure trend for installations with different self-weights.
Figure 5.24: Effect of wall thickness on suction pressure.
0.0 0.2 0.4 0.6 0.8 1.00.0
0.5
1.0
1.5
C-60(0.5)-50
C-60(0.5)-100 (shifted)
C-60(0.5)-150 (shifted)
p/ γγ γγ'D
L/D
0.0 0.2 0.4 0.6 0.8 1.00.0
0.5
1.0
1.5
2.0
C-60(0.5)-150
C-60(1.0)-150
p/ γγ γγ'D
L/D
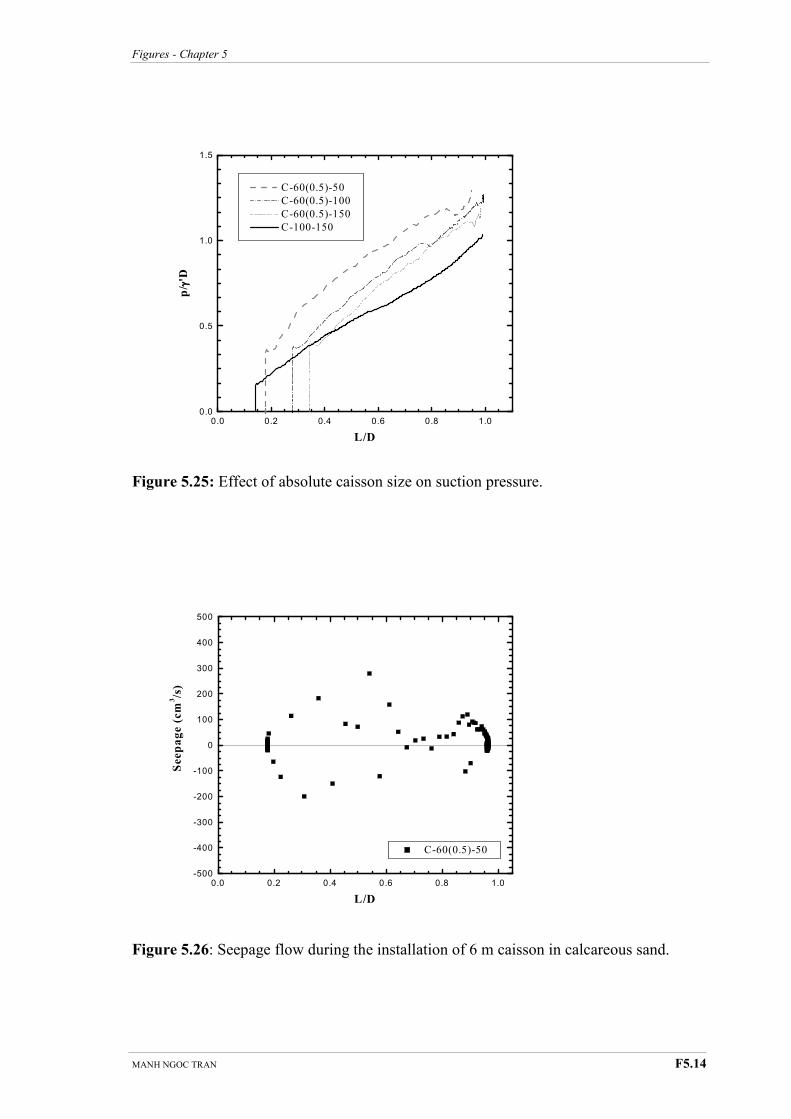
Figures - Chapter 5
MANH NGOC TRAN F5.14
Figure 5.25: Effect of absolute caisson size on suction pressure.
Figure 5.26: Seepage flow during the installation of 6 m caisson in calcareous sand.
0.0 0.2 0.4 0.6 0.8 1.0-500
-400
-300
-200
-100
0
100
200
300
400
500
C-60(0.5)-50
Seepage (cm
3/s)
L/D
0.0 0.2 0.4 0.6 0.8 1.00.0
0.5
1.0
1.5
C-60(0.5)-50
C-60(0.5)-100
C-60(0.5)-150
C-100-150
p/ γγ γγ'D
L/D
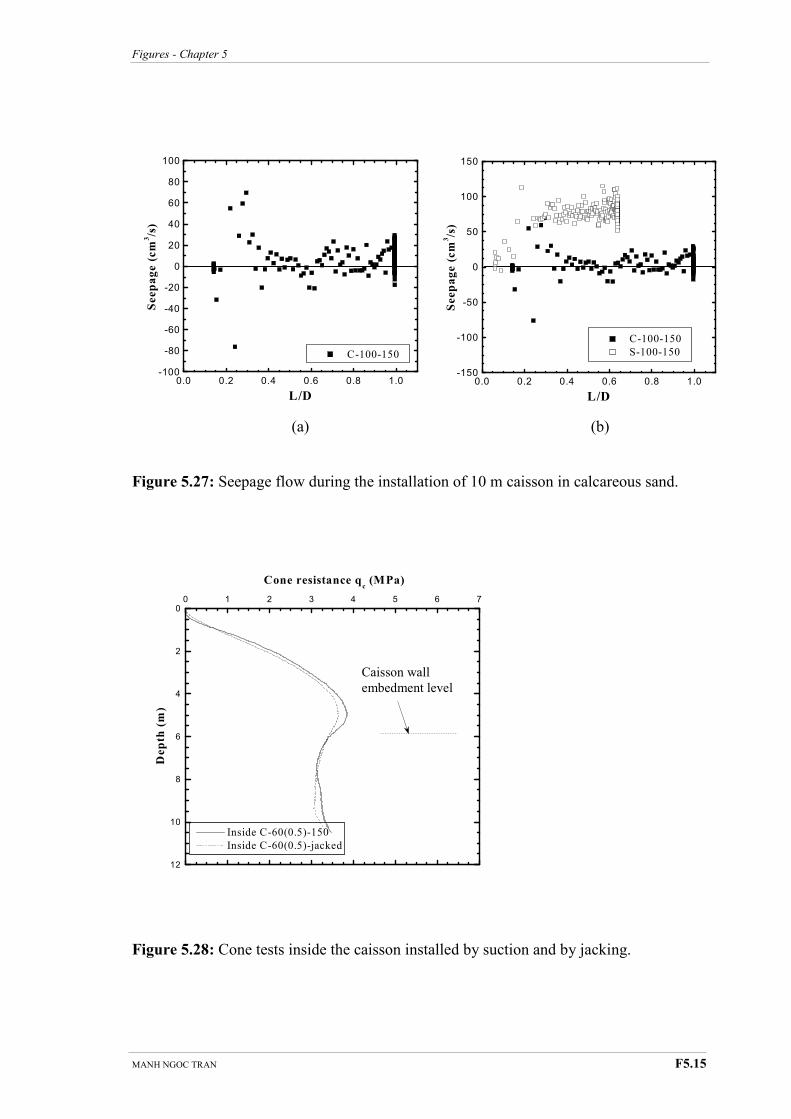
Figures - Chapter 5
MANH NGOC TRAN F5.15
(a) (b)
Figure 5.27: Seepage flow during the installation of 10 m caisson in calcareous sand.
Figure 5.28: Cone tests inside the caisson installed by suction and by jacking.
0.0 0.2 0.4 0.6 0.8 1.0-100
-80
-60
-40
-20
0
20
40
60
80
100
C-100-150
Seepage (cm
3/s)
L/D
12
10
8
6
4
2
00 1 2 3 4 5 6 7
Inside C-60(0.5)-150
Inside C-60(0.5)-jacked
Cone resistance qc (MPa)
Depth (m)
Caisson wall
embedment level
0.0 0.2 0.4 0.6 0.8 1.0-150
-100
-50
0
50
100
150
C-100-150
S-100-150
Seepage (cm
3/s)
L/D
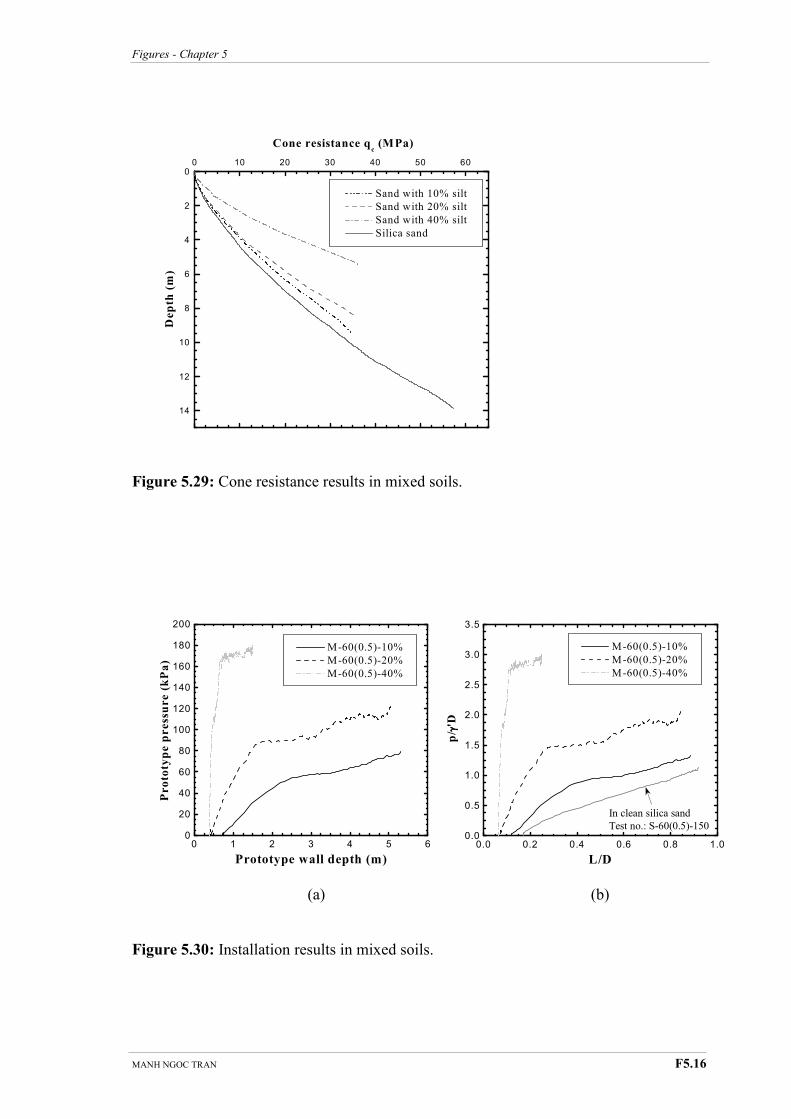
Figures - Chapter 5
MANH NGOC TRAN F5.16
Figure 5.29: Cone resistance results in mixed soils.
(a) (b)
Figure 5.30: Installation results in mixed soils.
14
12
10
8
6
4
2
00 10 20 30 40 50 60
Sand with 10% silt
Sand with 20% silt
Sand with 40% silt
Silica sand
Cone resistance qc (MPa)
Depth (m)
0 1 2 3 4 5 60
20
40
60
80
100
120
140
160
180
200
M-60(0.5)-10%
M-60(0.5)-20%
M-60(0.5)-40%
Prototype pressure (kPa)
Prototype wall depth (m)
0.0 0.2 0.4 0.6 0.8 1.00.0
0.5
1.0
1.5
2.0
2.5
3.0
3.5
M-60(0.5)-10%
M-60(0.5)-20%
M-60(0.5)-40%
p/ γγ γγ'D
L/D
In clean silica sand
Test no.: S-60(0.5)-150
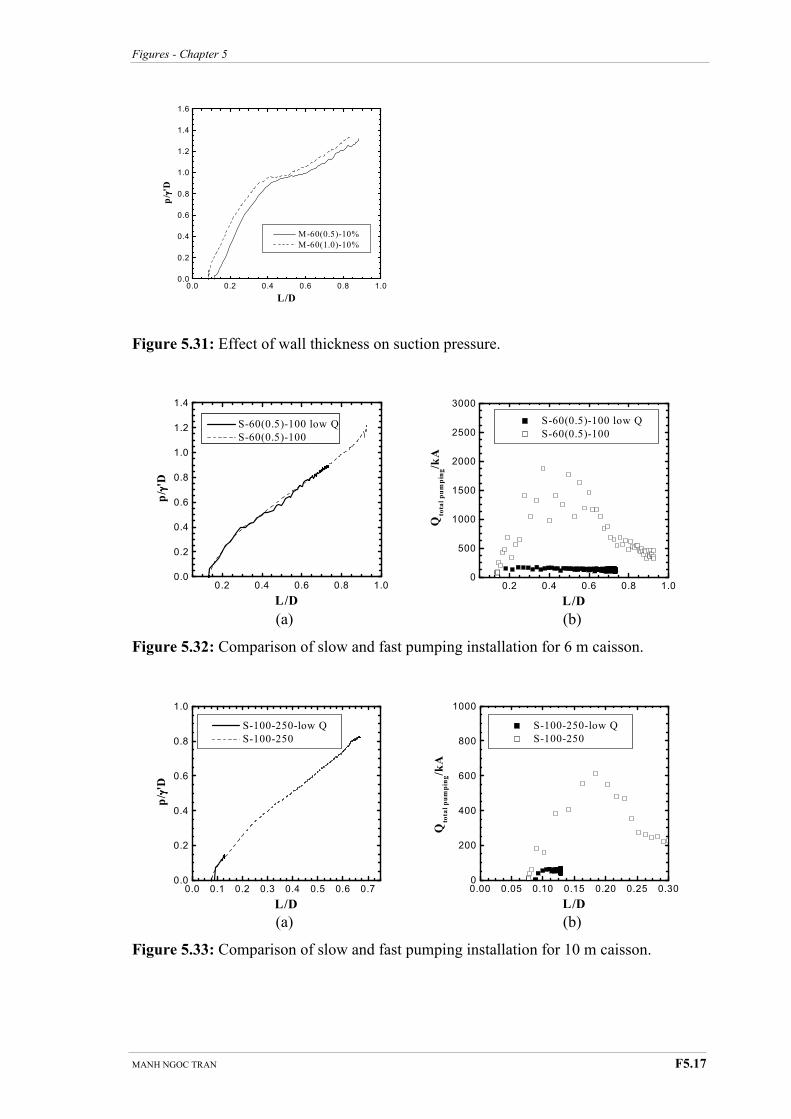
Figures - Chapter 5
MANH NGOC TRAN F5.17
Figure 5.31: Effect of wall thickness on suction pressure.
(a) (b)
Figure 5.32: Comparison of slow and fast pumping installation for 6 m caisson.
(a) (b)
Figure 5.33: Comparison of slow and fast pumping installation for 10 m caisson.
0.0 0.2 0.4 0.6 0.8 1.00.0
0.2
0.4
0.6
0.8
1.0
1.2
1.4
1.6
M-60(0.5)-10%
M-60(1.0)-10%
p/ γγ γγ'D
L/D
0.2 0.4 0.6 0.8 1.00.0
0.2
0.4
0.6
0.8
1.0
1.2
1.4
S-60(0.5)-100 low Q
S-60(0.5)-100
p/ γγ γγ'D
L/D
0.2 0.4 0.6 0.8 1.00
500
1000
1500
2000
2500
3000
S-60(0.5)-100 low Q
S-60(0.5)-100
Qtotal pumping/kA
L/D
0.0 0.1 0.2 0.3 0.4 0.5 0.6 0.70.0
0.2
0.4
0.6
0.8
1.0
S-100-250-low Q
S-100-250
p/ γγ γγ'D
L/D
0.00 0.05 0.10 0.15 0.20 0.25 0.300
200
400
600
800
1000
S-100-250-low Q
S-100-250
Qtotal pumping/kA
L/D
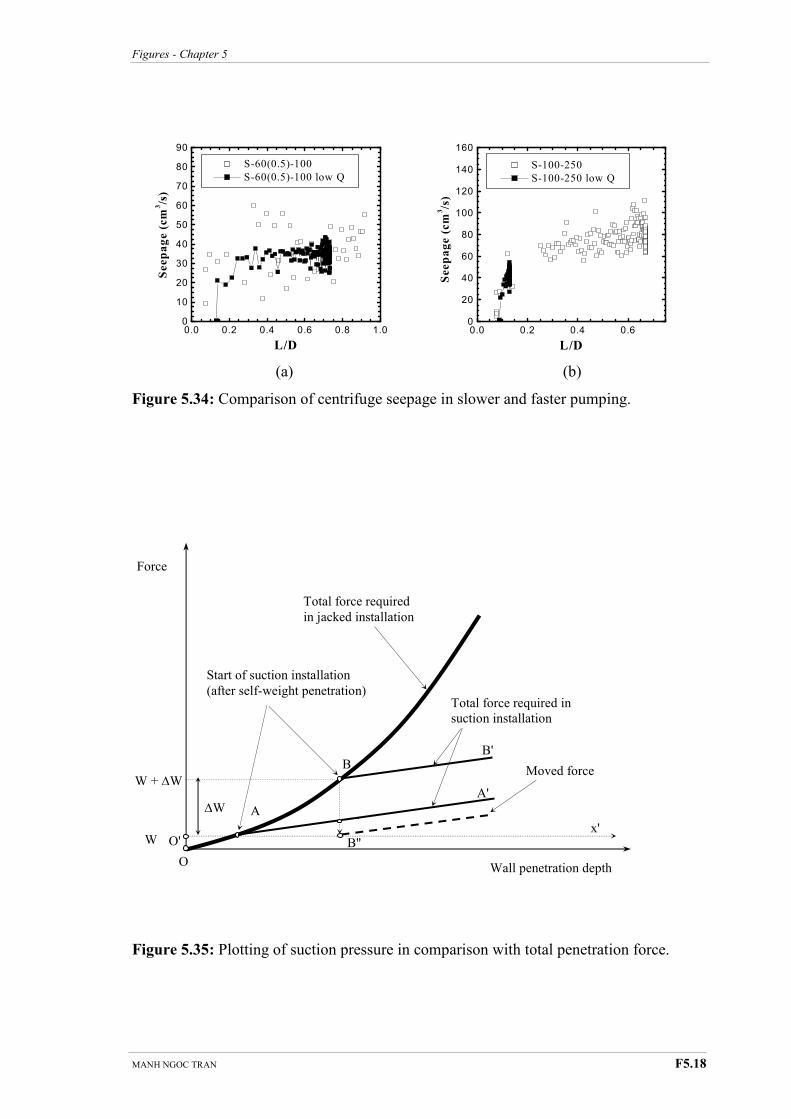
Figures - Chapter 5
MANH NGOC TRAN F5.18
(a) (b)
Figure 5.34: Comparison of centrifuge seepage in slower and faster pumping.
Figure 5.35: Plotting of suction pressure in comparison with total penetration force.
0.0 0.2 0.4 0.6 0.8 1.00
10
20
30
40
50
60
70
80
90
S-60(0.5)-100
S-60(0.5)-100 low Q
Seepage (cm
3/s)
L/D
0.0 0.2 0.4 0.60
20
40
60
80
100
120
140
160
S-100-250
S-100-250 low Q
Seepage (cm
3/s)
L/D
∆W
Start of suction installation
(after self-weight penetration)
Total force required
in jacked installation
Wall penetration depth
Force
Total force required in
suction installation
A
B
B''
O
A''
O' x'
Moved force
W
W + ∆W
B'
A'
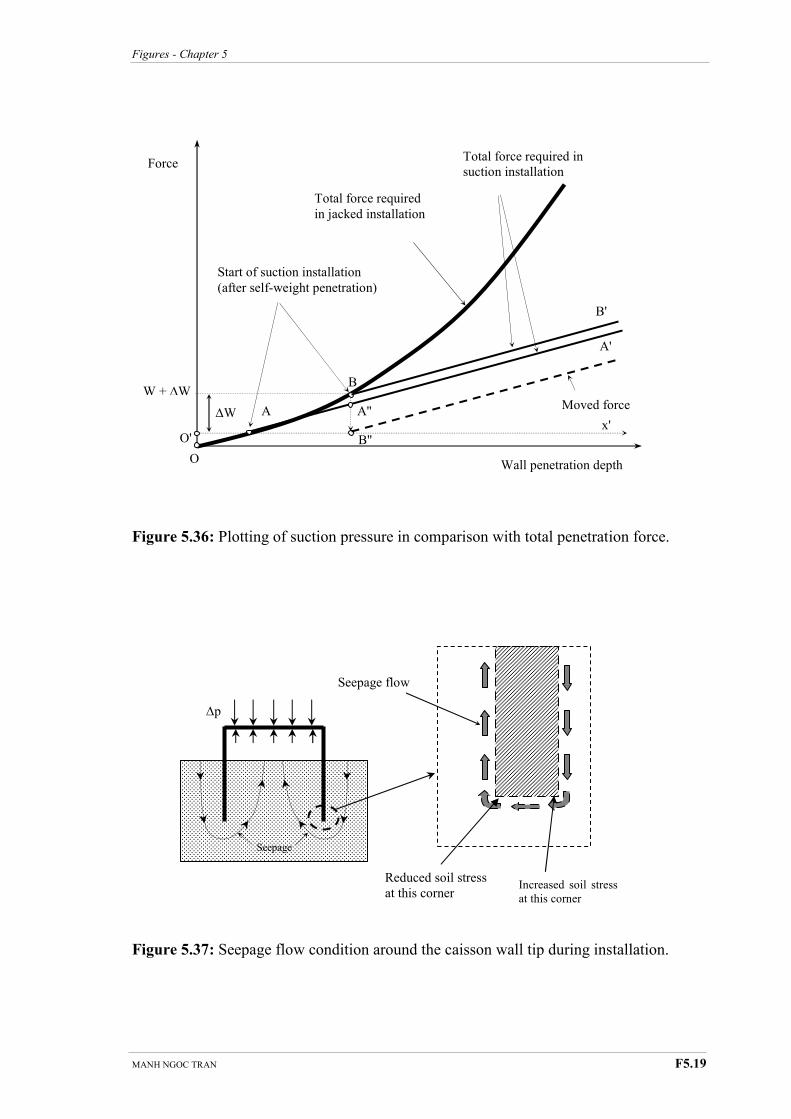
Figures - Chapter 5
MANH NGOC TRAN F5.19
Figure 5.36: Plotting of suction pressure in comparison with total penetration force.
Figure 5.37: Seepage flow condition around the caisson wall tip during installation.
∆W
Start of suction installation
(after self-weight penetration)
Total force required
in jacked installation
Wall penetration depth
Force Total force required in
suction installation
A
B
B''
O
A''
O' x'
Moved force
W
W + ∆W
B'
A'
Increased soil stress
at this corner
Reduced soil stress
at this corner
Seepage flow
∆p
Seepage
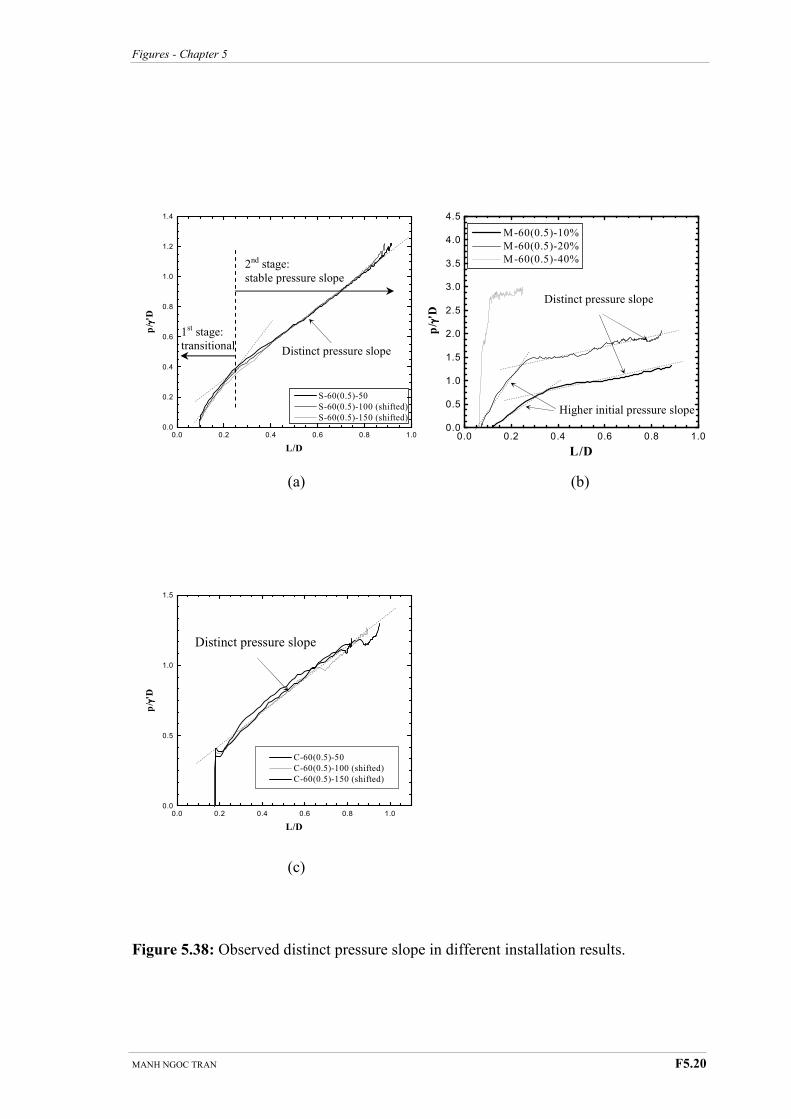
Figures - Chapter 5
MANH NGOC TRAN F5.20
(a) (b)
(c)
Figure 5.38: Observed distinct pressure slope in different installation results.
0.0 0.2 0.4 0.6 0.8 1.00.0
0.5
1.0
1.5
C-60(0.5)-50
C-60(0.5)-100 (shifted)
C-60(0.5)-150 (shifted)
p/ γγ γγ'D
L/D
Distinct pressure slope
0.0 0.2 0.4 0.6 0.8 1.00.0
0.2
0.4
0.6
0.8
1.0
1.2
1.4
S-60(0.5)-50
S-60(0.5)-100 (shifted)
S-60(0.5)-150 (shifted)
p/ γγ γγ'D
L/D
0.0 0.2 0.4 0.6 0.8 1.00.0
0.5
1.0
1.5
2.0
2.5
3.0
3.5
4.0
4.5
M-60(0.5)-10%
M-60(0.5)-20%
M-60(0.5)-40%
S-60(0.5)-150
p/ γγ γγ'D
L/D
Distinct pressure slope
Higher initial pressure slope
1st stage:
transitional
2nd stage:
stable pressure slope
Distinct pressure slope

Figures - Chapter 5
MANH NGOC TRAN F5.21
(a)
(b)
Figure 5.39: Comparison of suction pressure trends in various soil types.
0.0 0.2 0.4 0.6 0.8 1.00.0
0.5
1.0
1.5
2.0
2.5
3.0
3.5
M-60(0.5)-10%
M-60(0.5)-20%
M-60(0.5)-40%
S-60(0.5)-150
C-60(0.5)-150
p/ γγ γγ'D
L/D
Similar pressure
slope
Pressure slope
0 1 2 3 4 5 60
40
80
120
160
200 M-60(0.5)-10%
M-60(0.5)-20%
M-60(0.5)-40%
S-60(0.5)-150
C-60(0.5)-150
Suction pressure (kPa)
L/D
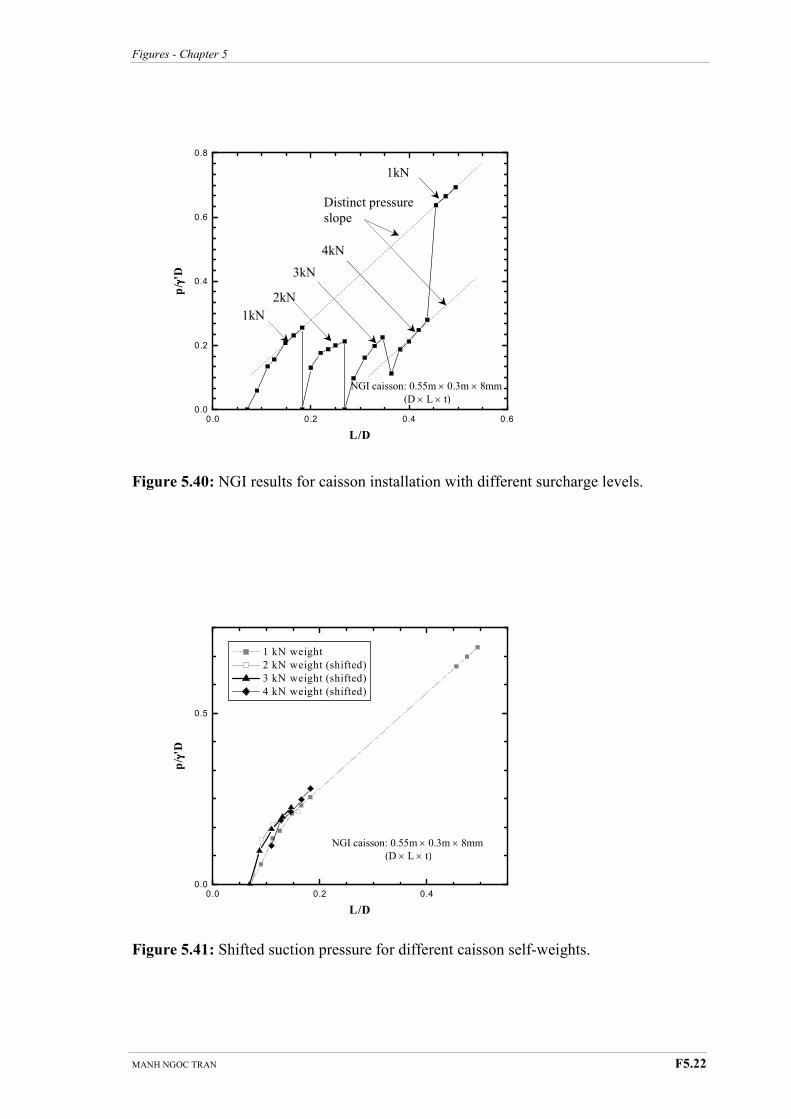
Figures - Chapter 5
MANH NGOC TRAN F5.22
Figure 5.40: NGI results for caisson installation with different surcharge levels.
Figure 5.41: Shifted suction pressure for different caisson self-weights.
0.0 0.2 0.4 0.60.0
0.2
0.4
0.6
0.8
p/ γγ γγ'D
L/D
NGI caisson: 0.55m × 0.3m × 8mm
(D × L × t)
Distinct pressure
slope
1kN
2kN
3kN
4kN
1kN
0.0 0.2 0.40.0
0.5
1 kN weight
2 kN weight (shifted)
3 kN weight (shifted)
4 kN weight (shifted)
p/ γγ γγ'D
L/D
NGI caisson: 0.55m × 0.3m × 8mm
(D × L × t)
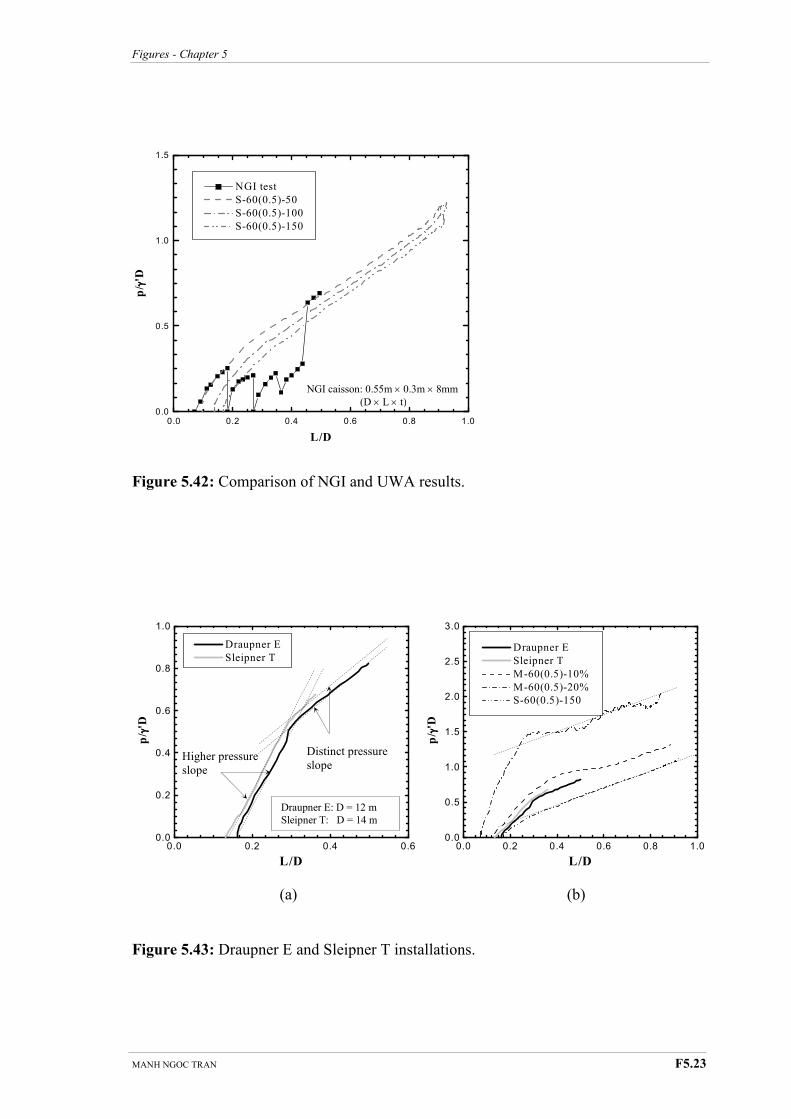
Figures - Chapter 5
MANH NGOC TRAN F5.23
Figure 5.42: Comparison of NGI and UWA results.
(a) (b)
Figure 5.43: Draupner E and Sleipner T installations.
0.0 0.2 0.4 0.6 0.8 1.00.0
0.5
1.0
1.5
NGI test
S-60(0.5)-50
S-60(0.5)-100
S-60(0.5)-150
p/ γγ γγ'D
L/D
NGI caisson: 0.55m × 0.3m × 8mm
(D × L × t)
Higher pressure
slope
0.0 0.2 0.4 0.60.0
0.2
0.4
0.6
0.8
1.0
Draupner E
Sleipner T
p/ γγ γγ'D
L/D
0.0 0.2 0.4 0.6 0.8 1.00.0
0.5
1.0
1.5
2.0
2.5
3.0
Draupner E
Sleipner T
M-60(0.5)-10%
M-60(0.5)-20%
S-60(0.5)-150
p/ γγ γγ'D
L/D
Distinct pressure
slope
Draupner E: D = 12 m
Sleipner T: D = 14 m

Figures - Chapter 5
MANH NGOC TRAN F5.24
0 1 2 3 4 5 60
20
40
60
80
100
120
140
160
Predicted for S-60(0.5)-150
Predicted for C-60(0.5)-150
Predicted for M-60(0.5)-20%
M-60(0.5)-20%
S-60(0.5)-150
C-60(0.5)-150
Suction (kPa)
L (m)
0 1 2 3 4 5 60
20
40
60
80
100
120
140
160
Predicted for S-60(0.5)-150
Predicted for C-60(0.5)-150
Predicted for M-60(0.5)-20%
S-60(0.5)-150
C-60(0.5)-150
M-60(0.5)-20%
Pressure (kPa)
L (m)
Figure 5.44: Comparison with suction pressure prediction proposed by Feld (2001).
Figure 5.45: Comparison with suction pressure prediction proposed by Houlsby and
Byrne (2005).

Figures - Chapter 6
MANH NGOC TRAN F6.1
Chapter Twenty-two
Chapter Twenty-three Chapter Twenty-four Chapter Twenty-five Chapter Twenty-six Chapter Twenty-seven
Figure 6.1: Cone tests in soil with surface silt layer.
Figure 6.2: Cone test in soil with a silt layer 0.8 m below the surface.
14
12
10
8
6
4
2
00 10 20 30 40 50
Cone resistance qc (MPa)
Depth (m)
Sand ~0.8m
Sand >14m
Silt ~1.0m
Silt ~0.5m -1.0m
Sand >14m
1m silt
0.5m silt
14
12
10
8
6
4
2
00 10 20 30 40 50
1.5
1.0
0.5
0.00 1 2 3
Cone resistance qc (MPa)
0.5m top silt
1.0m top silt
Depth (m)
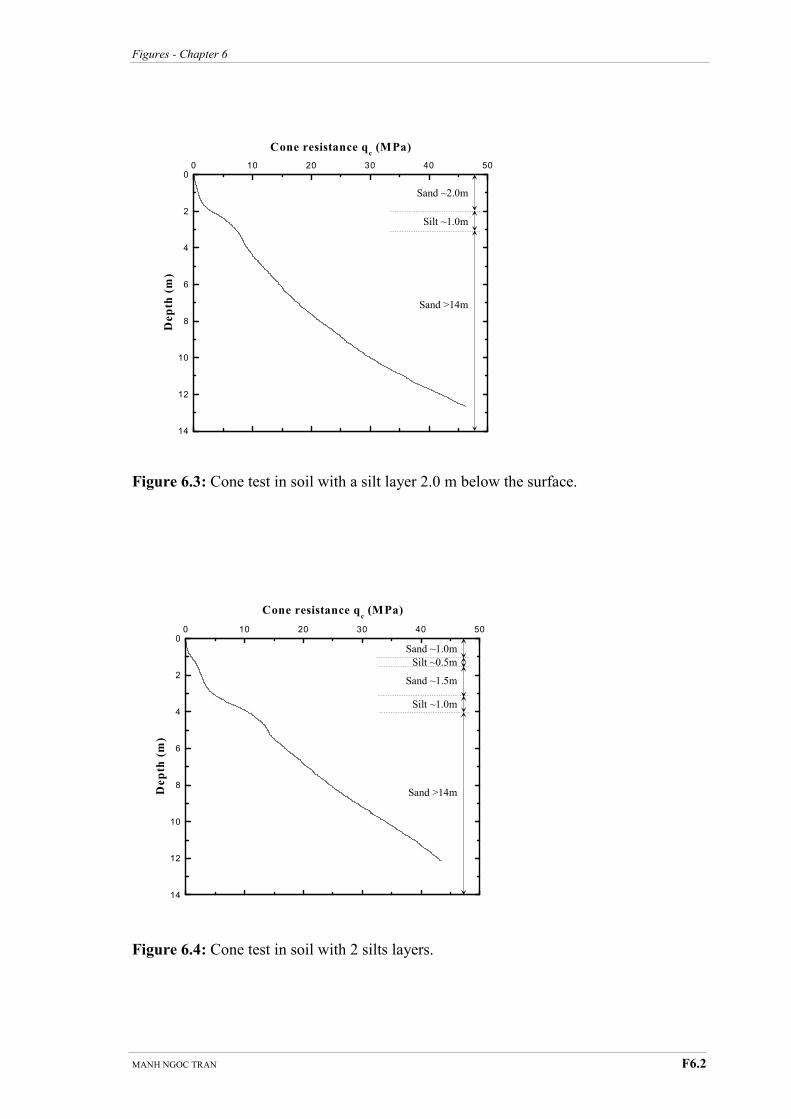
Figures - Chapter 6
MANH NGOC TRAN F6.2
Figure 6.3: Cone test in soil with a silt layer 2.0 m below the surface.
Figure 6.4: Cone test in soil with 2 silts layers.
14
12
10
8
6
4
2
00 10 20 30 40 50
Cone resistance qc (MPa)
Depth (m)
Sand >14m
Silt ~1.0m
Sand ~2.0m
14
12
10
8
6
4
2
00 10 20 30 40 50
Cone resistance qc (MPa)
Depth (m)
Sand >14m
Silt ~1.0m
Sand ~1.5m
Sand ~1.0m
Silt ~0.5m

Figures - Chapter 6
MANH NGOC TRAN F6.3
Figure 6.5: Comparison with cone test in homogenous sand.
Figure 6.6: (a) Suction pressure in soil 1.0 m thick surface silt layer.
14
12
10
8
6
4
2
00 10 20 30 40 50
0.5 m top silt
1.0 m top silt
0.8 m deep silt
2.0 m deep silt
2 silt layers
Homogenous sand
Cone resistance qc (MPa)
Depth (m)
0.0 0.2 0.4 0.6 0.8 1.00.0
0.4
0.8
1.2
1.6
2.0
1.0 m top silt-50
1.0 m top silt-100
1.0 m top silt-150
p/ γγ γγ'D
L/D
Linear trend
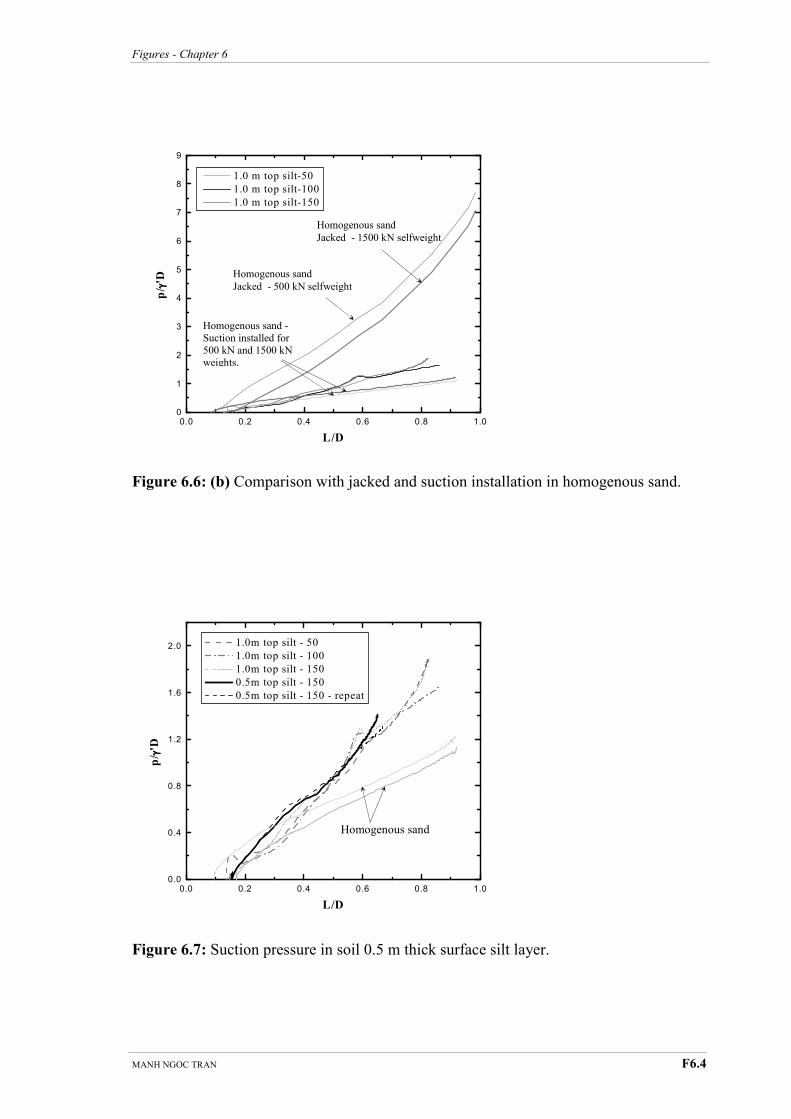
Figures - Chapter 6
MANH NGOC TRAN F6.4
Figure 6.6: (b) Comparison with jacked and suction installation in homogenous sand.
Figure 6.7: Suction pressure in soil 0.5 m thick surface silt layer.
0.0 0.2 0.4 0.6 0.8 1.00
1
2
3
4
5
6
7
8
9
1.0 m top silt-50
1.0 m top silt-100
1.0 m top silt-150
p/ γγ γγ'D
L/D
Homogenous sand
Jacked - 500 kN selfweight
Homogenous sand
Jacked - 1500 kN selfweight
Homogenous sand -
Suction installed for
500 kN and 1500 kN weights.
0.0 0.2 0.4 0.6 0.8 1.00.0
0.4
0.8
1.2
1.6
2.0
1.0m top silt - 50
1.0m top silt - 100
1.0m top silt - 150
0.5m top silt - 150
0.5m top silt - 150 - repeat
p/ γγ γγ'D
L/D
Homogenous sand
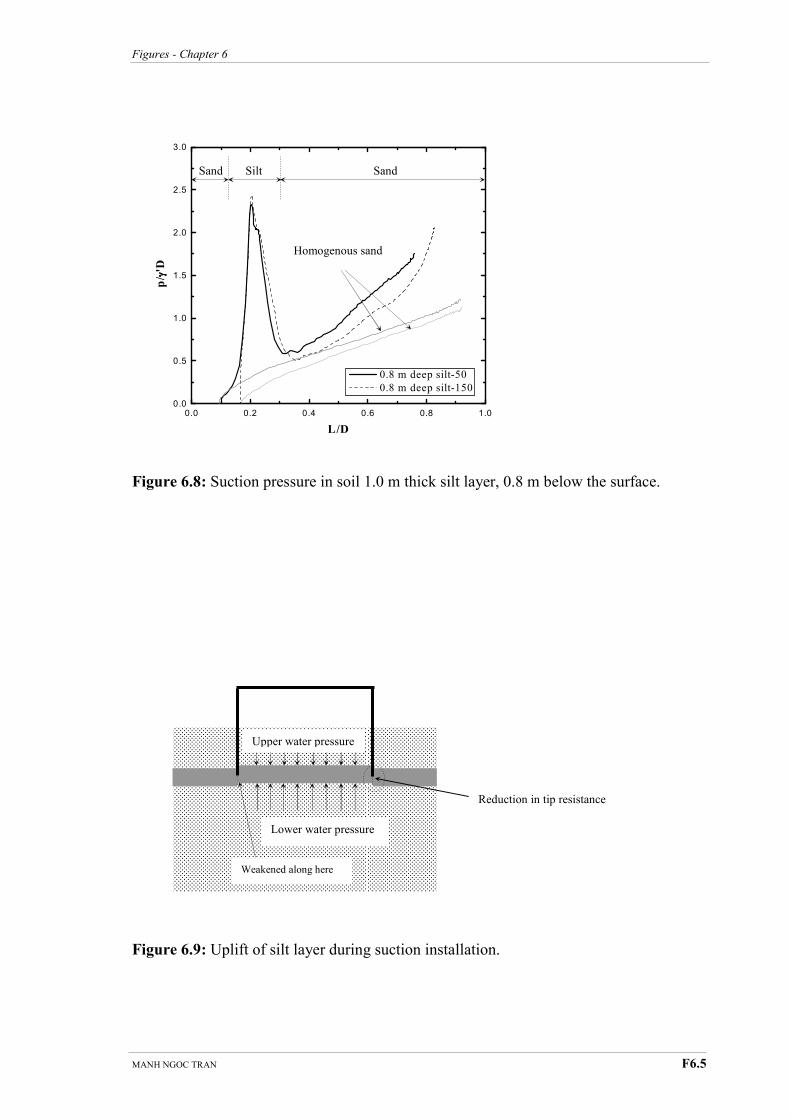
Figures - Chapter 6
MANH NGOC TRAN F6.5
Figure 6.8: Suction pressure in soil 1.0 m thick silt layer, 0.8 m below the surface.
Figure 6.9: Uplift of silt layer during suction installation.
Lower water pressure
Upper water pressure
Weakened along here
Reduction in tip resistance
0.0 0.2 0.4 0.6 0.8 1.00.0
0.5
1.0
1.5
2.0
2.5
3.0
0.8 m deep silt-50
0.8 m deep silt-150
p/ γγ γγ'D
L/D
Silt Sand Sand
Homogenous sand
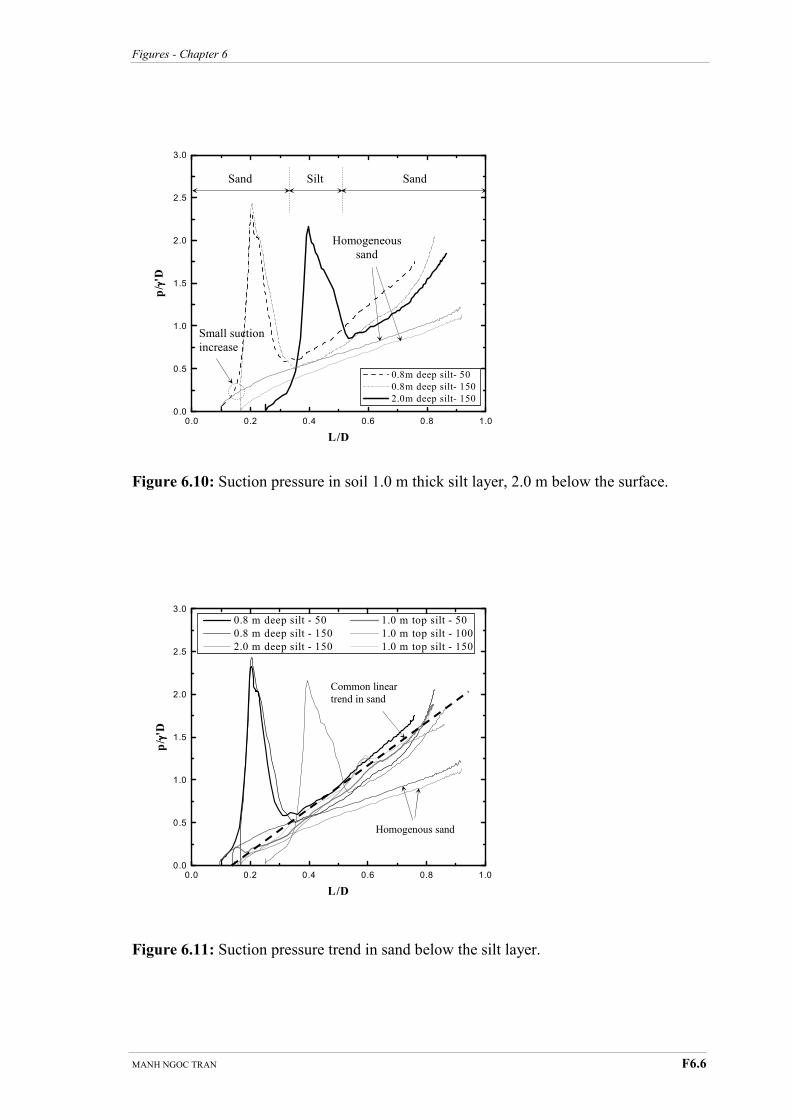
Figures - Chapter 6
MANH NGOC TRAN F6.6
Figure 6.10: Suction pressure in soil 1.0 m thick silt layer, 2.0 m below the surface.
Figure 6.11: Suction pressure trend in sand below the silt layer.
0.0 0.2 0.4 0.6 0.8 1.00.0
0.5
1.0
1.5
2.0
2.5
3.0
0.8 m deep silt - 50 1.0 m top silt - 50
0.8 m deep silt - 150 1.0 m top silt - 100
2.0 m deep silt - 150 1.0 m top silt - 150
p/ γγ γγ'D
L/D
Common linear
trend in sand
Homogenous sand
Silt Sand Sand
Homogeneous
sand
Small suction
increase
0.0 0.2 0.4 0.6 0.8 1.00.0
0.5
1.0
1.5
2.0
2.5
3.0
0.8m deep silt- 50
0.8m deep silt- 150
2.0m deep silt- 150
p/ γγ γγ'D
L/D
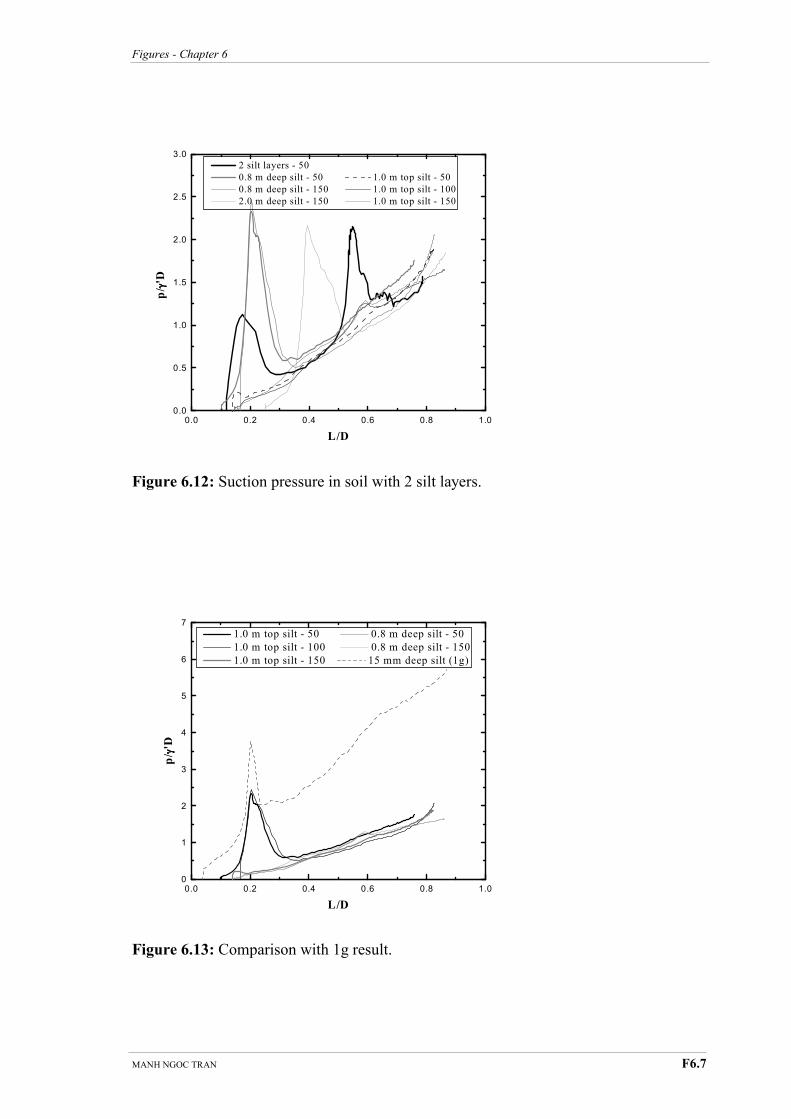
Figures - Chapter 6
MANH NGOC TRAN F6.7
Figure 6.12: Suction pressure in soil with 2 silt layers.
Figure 6.13: Comparison with 1g result.
0.0 0.2 0.4 0.6 0.8 1.00.0
0.5
1.0
1.5
2.0
2.5
3.0
2 silt layers - 50
0.8 m deep silt - 50 1.0 m top silt - 50
0.8 m deep silt - 150 1.0 m top silt - 100
2.0 m deep silt - 150 1.0 m top silt - 150
p/ γγ γγ'D
L/D
0.0 0.2 0.4 0.6 0.8 1.00
1
2
3
4
5
6
7
1.0 m top silt - 50 0.8 m deep silt - 50
1.0 m top silt - 100 0.8 m deep silt - 150
1.0 m top silt - 150 15 mm deep silt (1g)
p/ γγ γγ'D
L/D
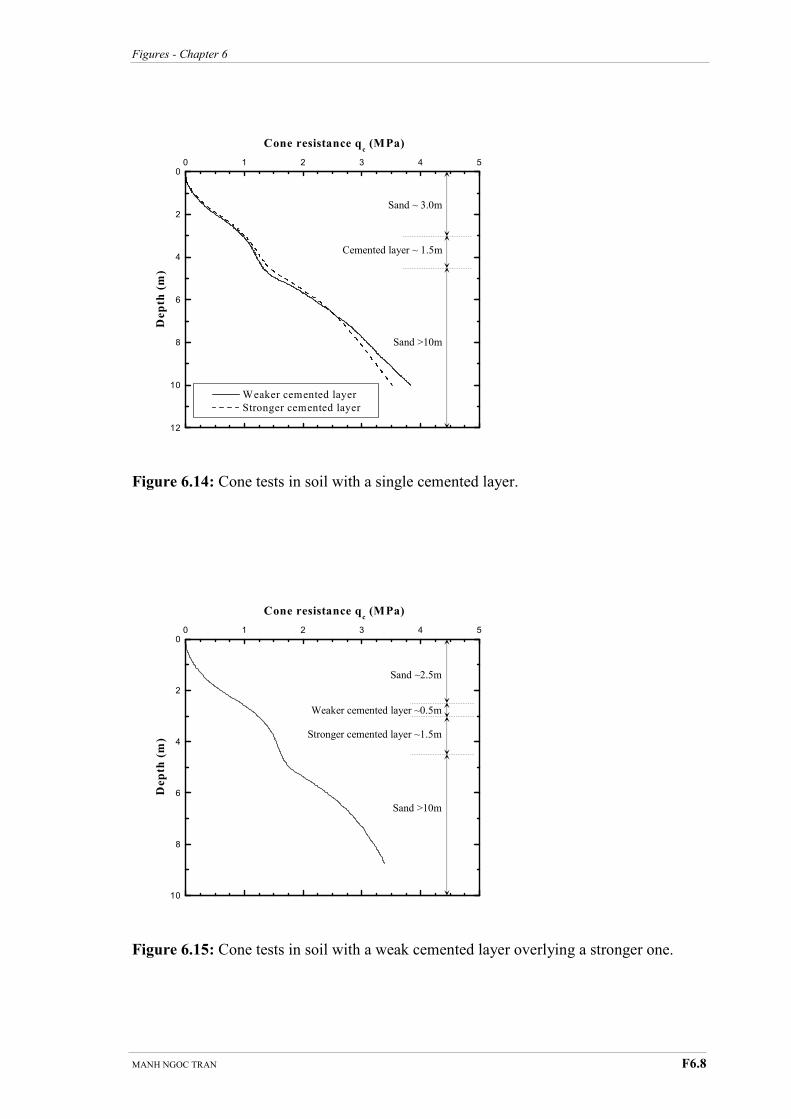
Figures - Chapter 6
MANH NGOC TRAN F6.8
Figure 6.14: Cone tests in soil with a single cemented layer.
Figure 6.15: Cone tests in soil with a weak cemented layer overlying a stronger one.
10
8
6
4
2
00 1 2 3 4 5
Cone resistance qc (MPa)
Depth (m)
Sand ~2.5m
Weaker cemented layer ~0.5m
Stronger cemented layer ~1.5m
Sand >10m
12
10
8
6
4
2
00 1 2 3 4 5
Weaker cemented layer
Stronger cemented layer
Cone resistance qc (MPa)
Depth (m)
Sand ~ 3.0m
Cemented layer ~ 1.5m
Sand >10m
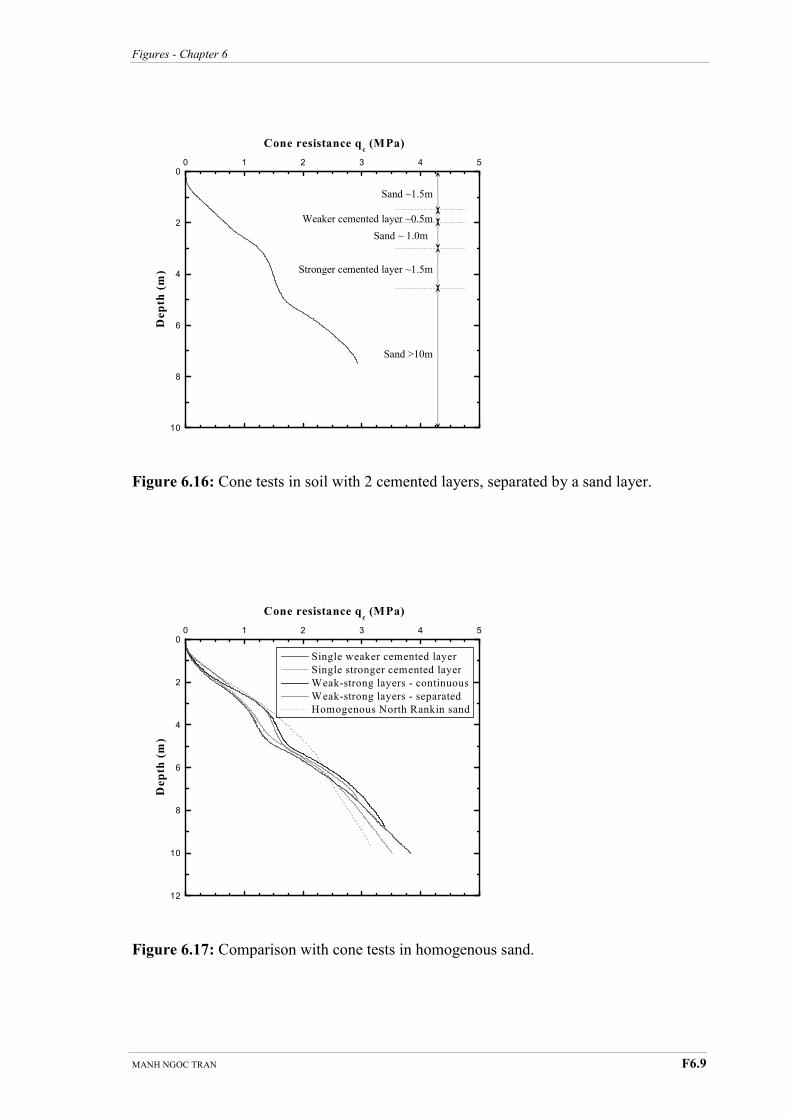
Figures - Chapter 6
MANH NGOC TRAN F6.9
Figure 6.16: Cone tests in soil with 2 cemented layers, separated by a sand layer.
Figure 6.17: Comparison with cone tests in homogenous sand.
10
8
6
4
2
00 1 2 3 4 5
Cone resistance qc (MPa)
Depth (m)
Sand ~1.5m
Weaker cemented layer ~0.5m
Sand ~ 1.0m
Sand >10m
Stronger cemented layer ~1.5m
12
10
8
6
4
2
00 1 2 3 4 5
Single weaker cemented layer
Single stronger cemented layer
Weak-strong layers - continuous
Weak-strong layers - separated
Homogenous North Rankin sand
Cone resistance qc (MPa)
Depth (m)
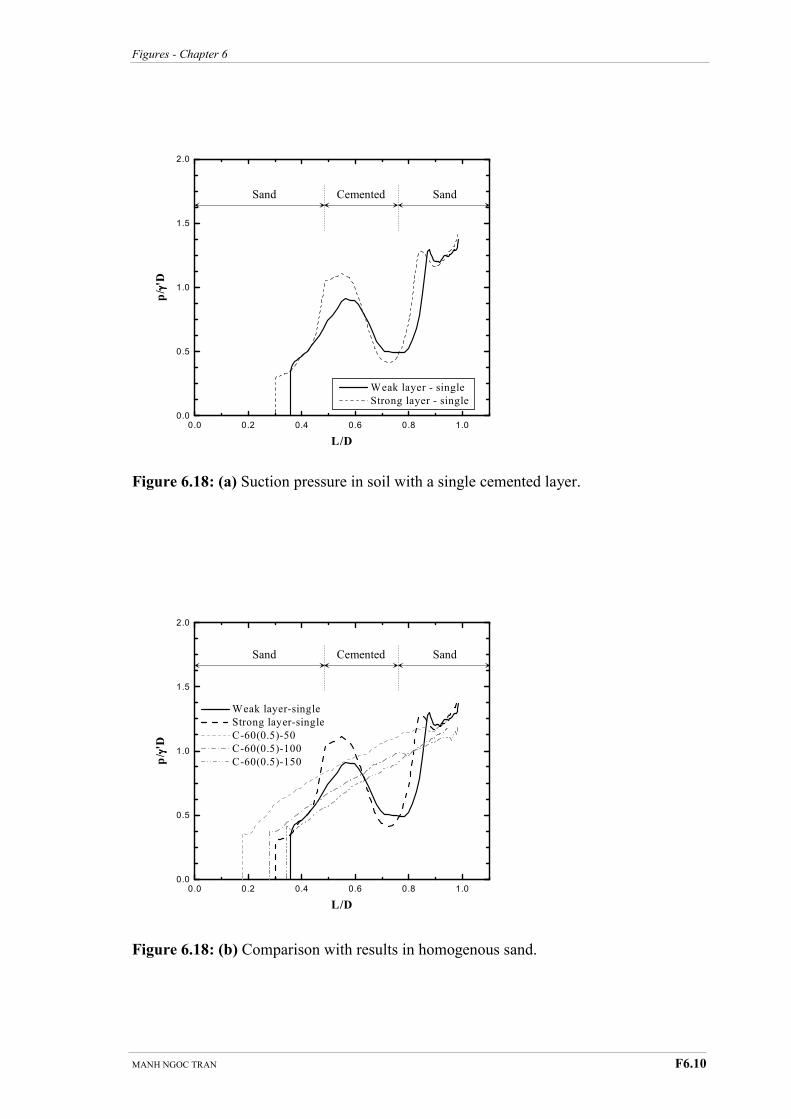
Figures - Chapter 6
MANH NGOC TRAN F6.10
Figure 6.18: (a) Suction pressure in soil with a single cemented layer.
Figure 6.18: (b) Comparison with results in homogenous sand.
Sand Sand Cemented
0.0 0.2 0.4 0.6 0.8 1.00.0
0.5
1.0
1.5
2.0
Weak layer - single
Strong layer - single
p/ γγ γγ'D
L/D
Sand Sand Cemented
0.0 0.2 0.4 0.6 0.8 1.00.0
0.5
1.0
1.5
2.0
Weak layer-single
Strong layer-single
C-60(0.5)-50
C-60(0.5)-100
C-60(0.5)-150
p/ γγ γγ'D
L/D
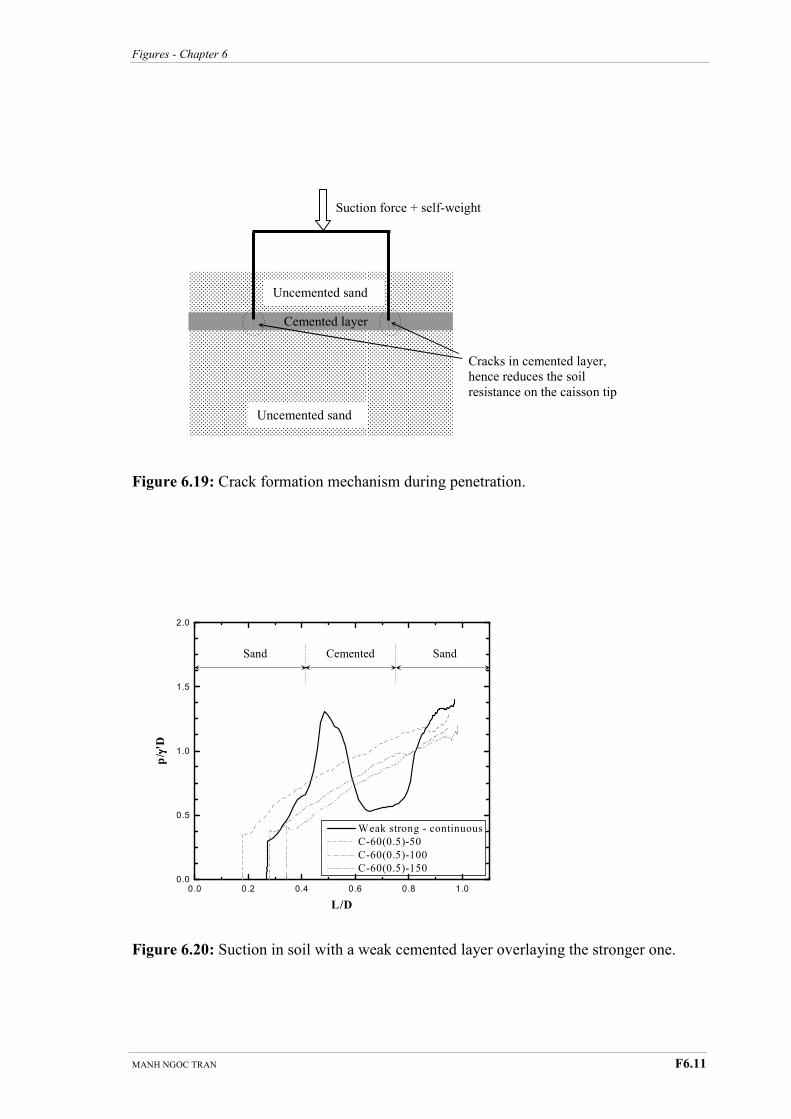
Figures - Chapter 6
MANH NGOC TRAN F6.11
Figure 6.19: Crack formation mechanism during penetration.
Figure 6.20: Suction in soil with a weak cemented layer overlaying the stronger one.
Uncemented sand
Cracks in cemented layer,
hence reduces the soil
resistance on the caisson tip
Cemented layer
Suction force + self-weight
Uncemented sand
Cemented Sand Sand
0.0 0.2 0.4 0.6 0.8 1.00.0
0.5
1.0
1.5
2.0
Weak strong - continuous
C-60(0.5)-50
C-60(0.5)-100
C-60(0.5)-150
p/ γγ γγ'D
L/D
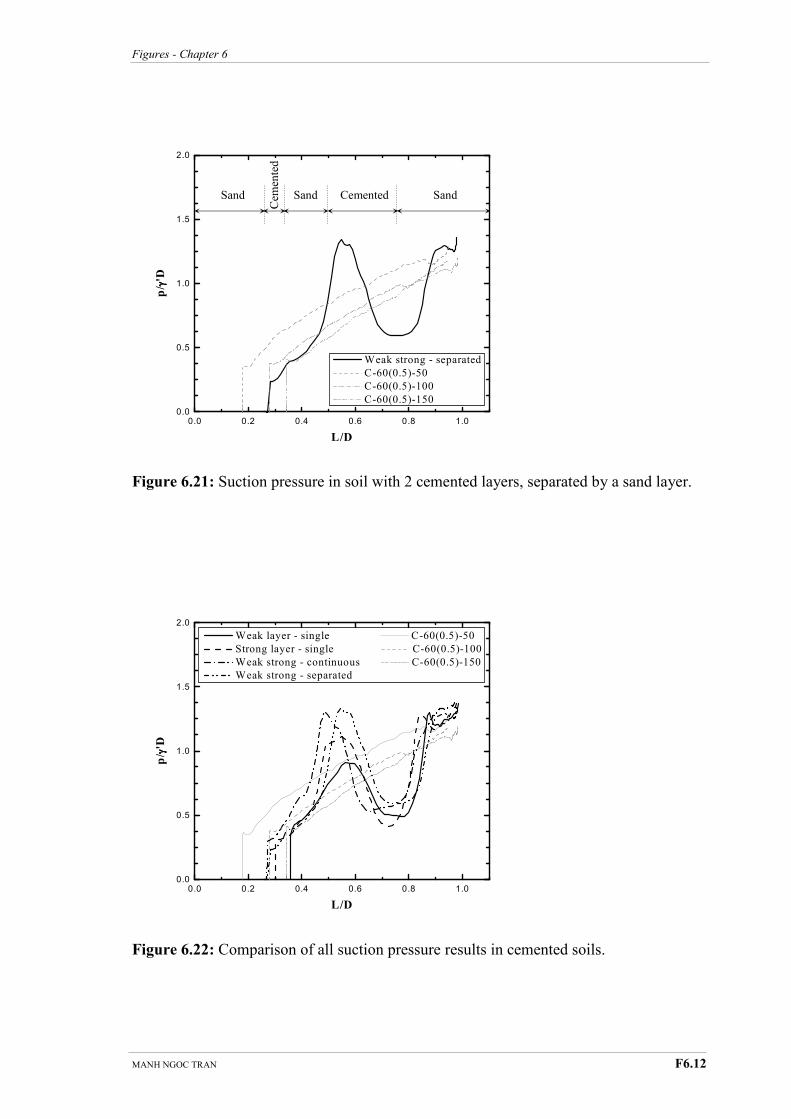
Figures - Chapter 6
MANH NGOC TRAN F6.12
Figure 6.21: Suction pressure in soil with 2 cemented layers, separated by a sand layer.
Figure 6.22: Comparison of all suction pressure results in cemented soils.
Sand Sand Sand Cemented
Cem
ente
d
0.0 0.2 0.4 0.6 0.8 1.00.0
0.5
1.0
1.5
2.0
Weak strong - separated
C-60(0.5)-50
C-60(0.5)-100
C-60(0.5)-150
p/ γγ γγ'D
L/D
0.0 0.2 0.4 0.6 0.8 1.00.0
0.5
1.0
1.5
2.0
Weak layer - single C-60(0.5)-50
Strong layer - single C-60(0.5)-100
Weak strong - continuous C-60(0.5)-150
Weak strong - separated
p/ γγ γγ'D
L/D
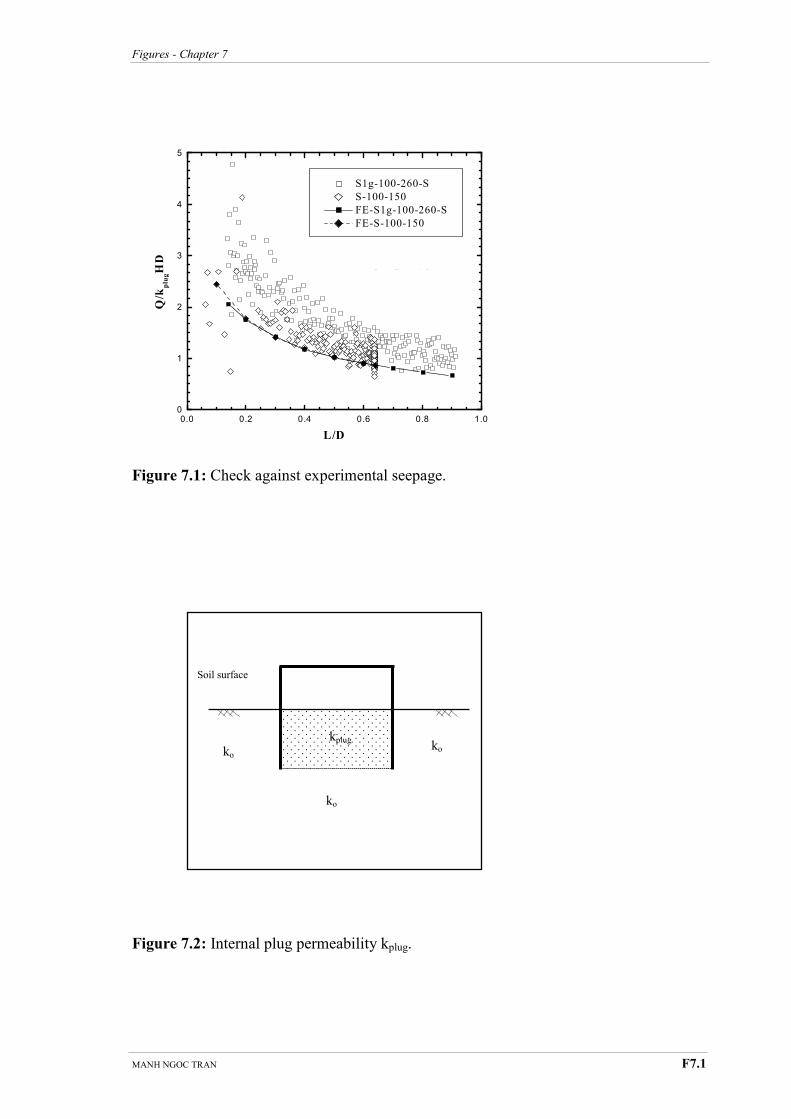
Figures - Chapter 7
MANH NGOC TRAN F7.1
Chapter Twenty-eight
Chapter Twenty-nine Chapter Thirty Chapter Thirty-one Chapter Thirty-two Chapter Thirty-three Chapter Thirty-four
Figure 7.1: Check against experimental seepage.
Figure 7.2: Internal plug permeability kplug.
ko
ko ko
kplug
Soil surface
k /k = 1.0
0.0 0.2 0.4 0.6 0.8 1.00
1
2
3
4
5
S1g-100-260-S
S-100-150
FE-S1g-100-260-S
FE-S-100-150
Q/k
plugHD
L/D
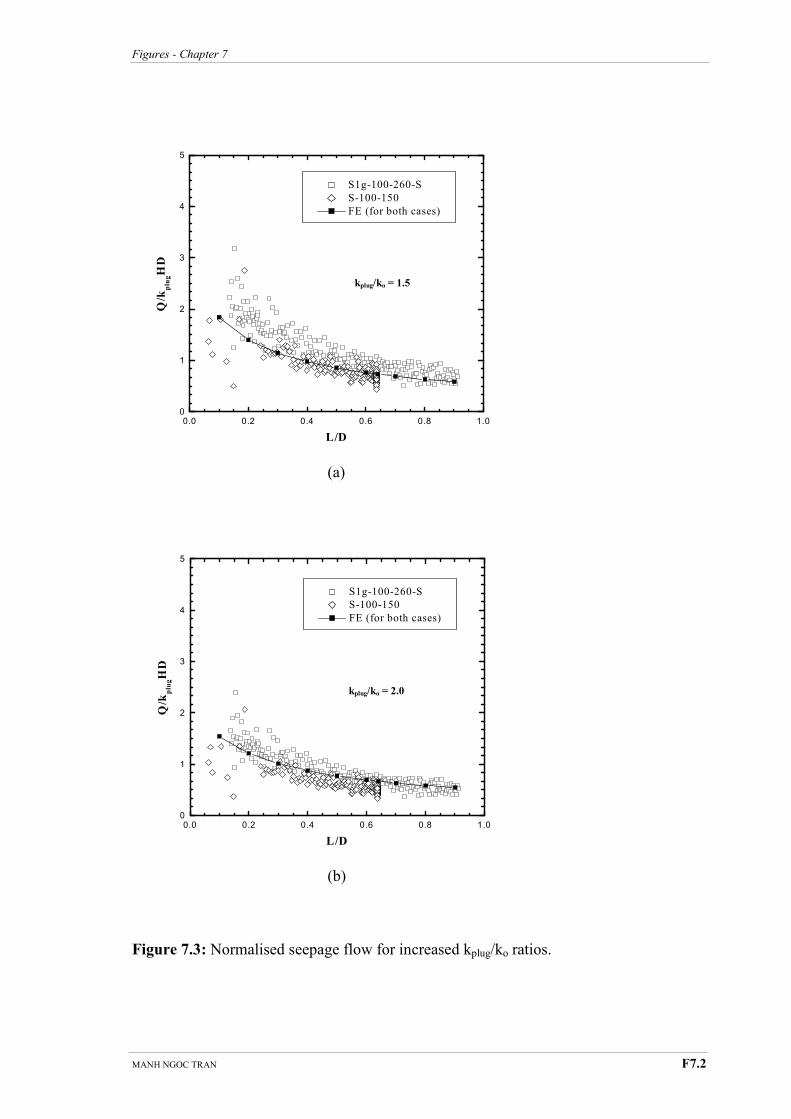
Figures - Chapter 7
MANH NGOC TRAN F7.2
(a)
(b)
Figure 7.3: Normalised seepage flow for increased kplug/ko ratios.
0.0 0.2 0.4 0.6 0.8 1.00
1
2
3
4
5
S1g-100-260-S
S-100-150
FE (for both cases)
Q/k
plugHD
L/D
0.0 0.2 0.4 0.6 0.8 1.00
1
2
3
4
5
S1g-100-260-S
S-100-150
FE (for both cases)
Q/k
plugHD
L/D
kplug/ko = 1.5
kplug/ko = 2.0
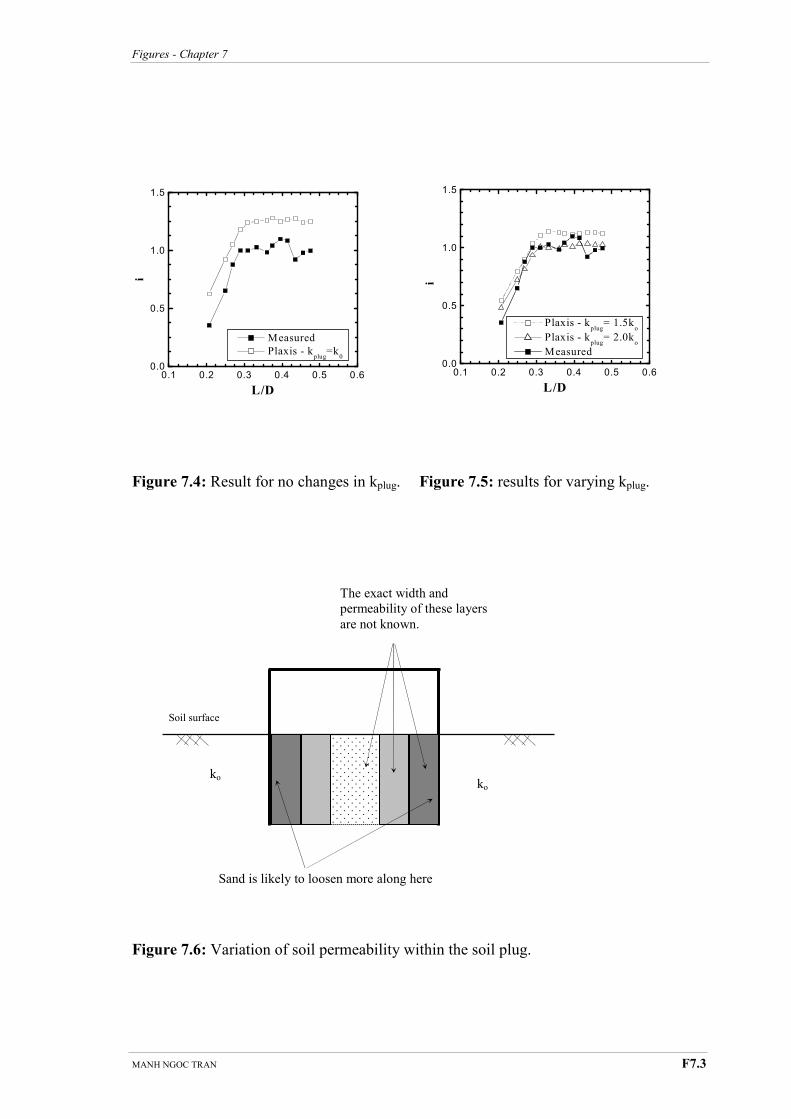
Figures - Chapter 7
MANH NGOC TRAN F7.3
Figure 7.4: Result for no changes in kplug. Figure 7.5: results for varying kplug.
Figure 7.6: Variation of soil permeability within the soil plug.
The exact width and
permeability of these layers
are not known.
ko
ko
Sand is likely to loosen more along here
Soil surface
0.1 0.2 0.3 0.4 0.5 0.60.0
0.5
1.0
1.5
Measured
Plaxis - kplug
=k0
i
L/D
0.1 0.2 0.3 0.4 0.5 0.60.0
0.5
1.0
1.5
Plaxis - kplug
= 1.5ko
Plaxis - kplug
= 2.0ko
Measured
i
L/D
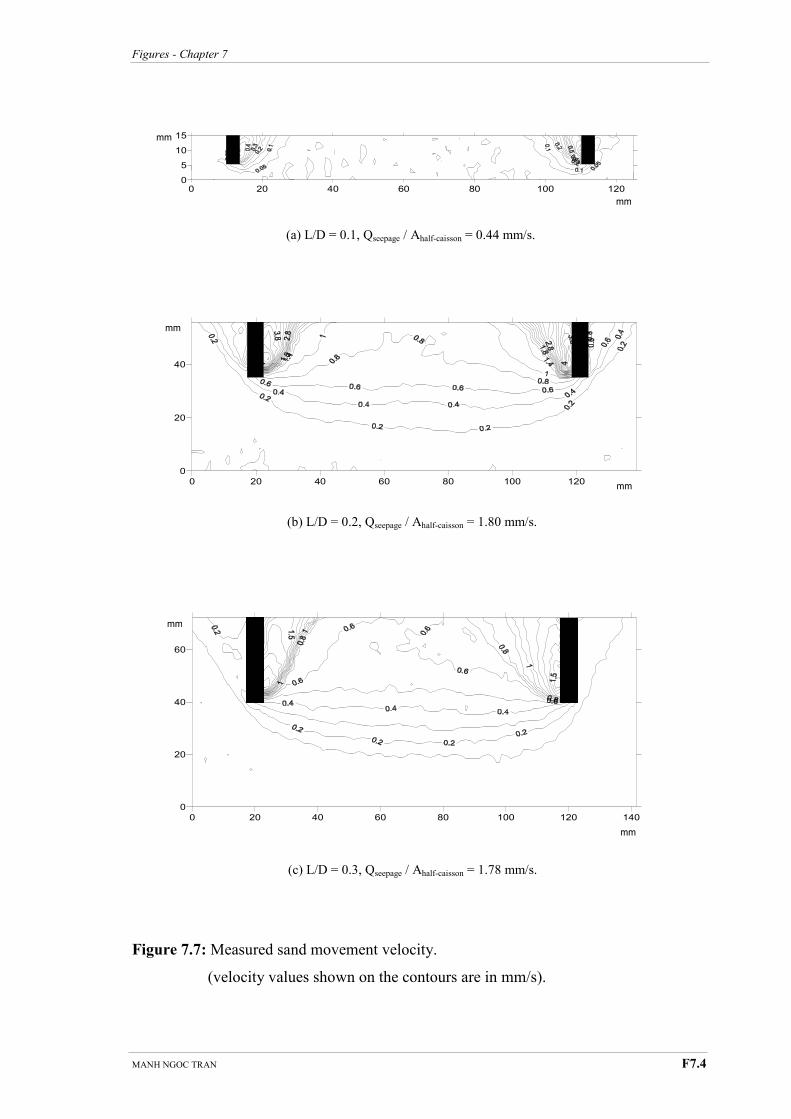
Figures - Chapter 7
MANH NGOC TRAN F7.4
Figure 7.7: Measured sand movement velocity.
(velocity values shown on the contours are in mm/s).
(b) L/D = 0.2, Qseepage / Ahalf-caisson = 1.80 mm/s.
0 20 40 60 80 100 120
0
20
40
mm
mm
(c) L/D = 0.3, Qseepage / Ahalf-caisson = 1.78 mm/s.
0 20 40 60 80 100 120 140
0
20
40
60
mm
mm
(a) L/D = 0.1, Qseepage / Ahalf-caisson = 0.44 mm/s.
0 20 40 60 80 100 1200
5
10
15
mm
mm
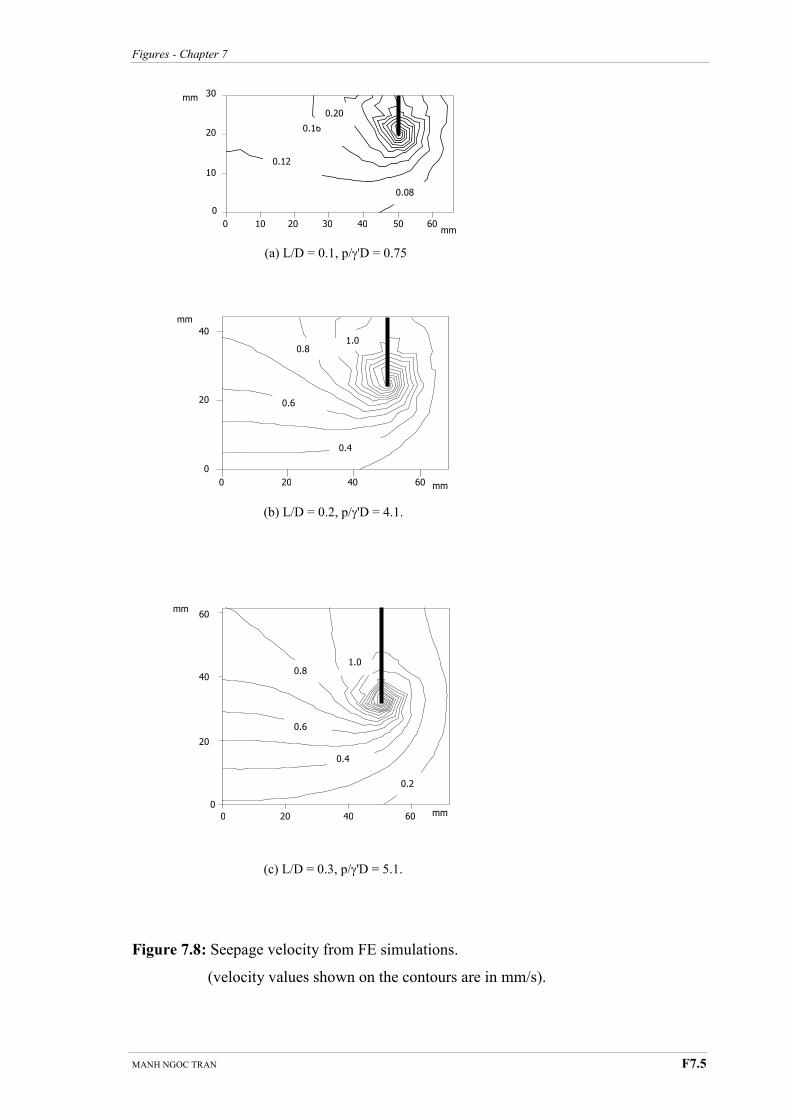
Figures - Chapter 7
MANH NGOC TRAN F7.5
Figure 7.8: Seepage velocity from FE simulations.
(velocity values shown on the contours are in mm/s).
20 40 60 0 mm
40
20
0.4
0.6
0.8 1.0
0
mm
(b) L/D = 0.2, p/γ'D = 4.1.
(c) L/D = 0.3, p/γ'D = 5.1.
20 40 60 0
0.2
0.4
0.6
0.8 1.0
0
40
60
20
mm
mm
(a) L/D = 0.1, p/γ'D = 0.75
10 20 30 40 50 60
10
0
0.12
0.08
0.16
0.20
20
30
0 mm
mm
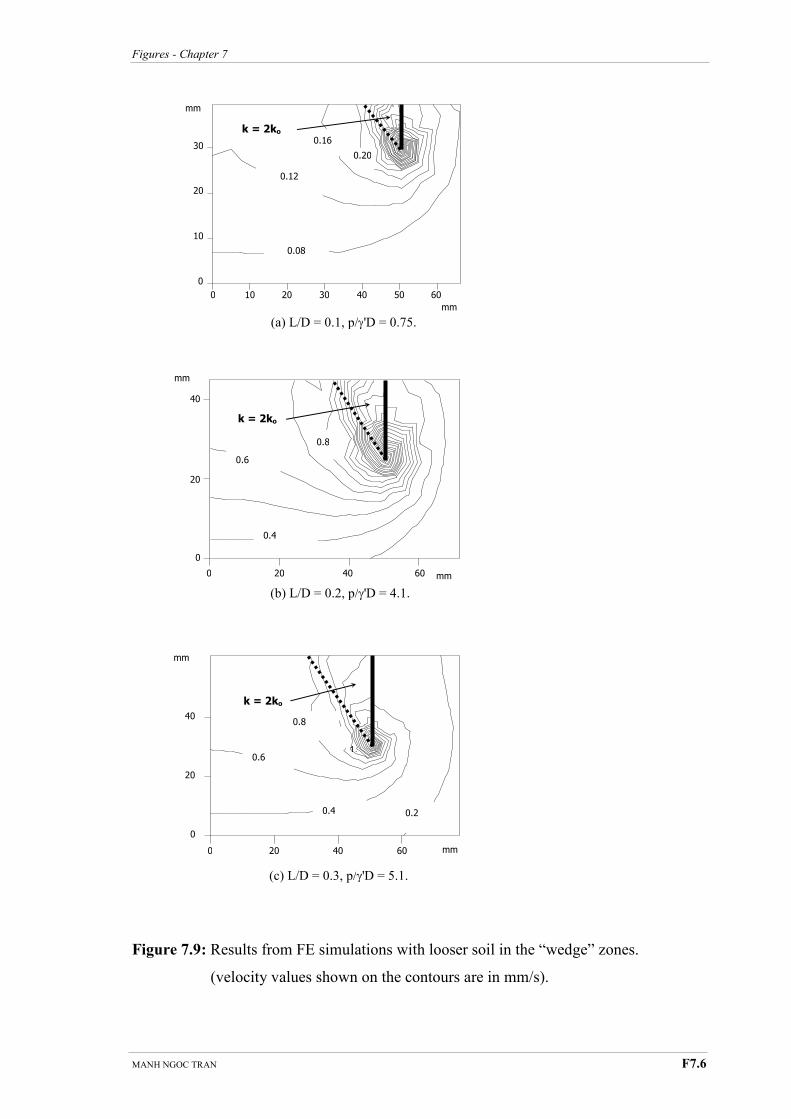
Figures - Chapter 7
MANH NGOC TRAN F7.6
Figure 7.9: Results from FE simulations with looser soil in the “wedge” zones.
(velocity values shown on the contours are in mm/s).
(a) L/D = 0.1, p/γ'D = 0.75.
(b) L/D = 0.2, p/γ'D = 4.1.
(c) L/D = 0.3, p/γ'D = 5.1.
0.2 0.4
0.6
0.8
k = 2ko
40 60 20 0 mm
0
20
40
mm
1.
0.4
0.6
k = 2ko
60 40 20 0
0
20
40
mm
mm
0.8
10
0.08
20 30 40 50 60 0
10
20
30
0
0.12
mm
mm
k = 2ko
0.16
0.20
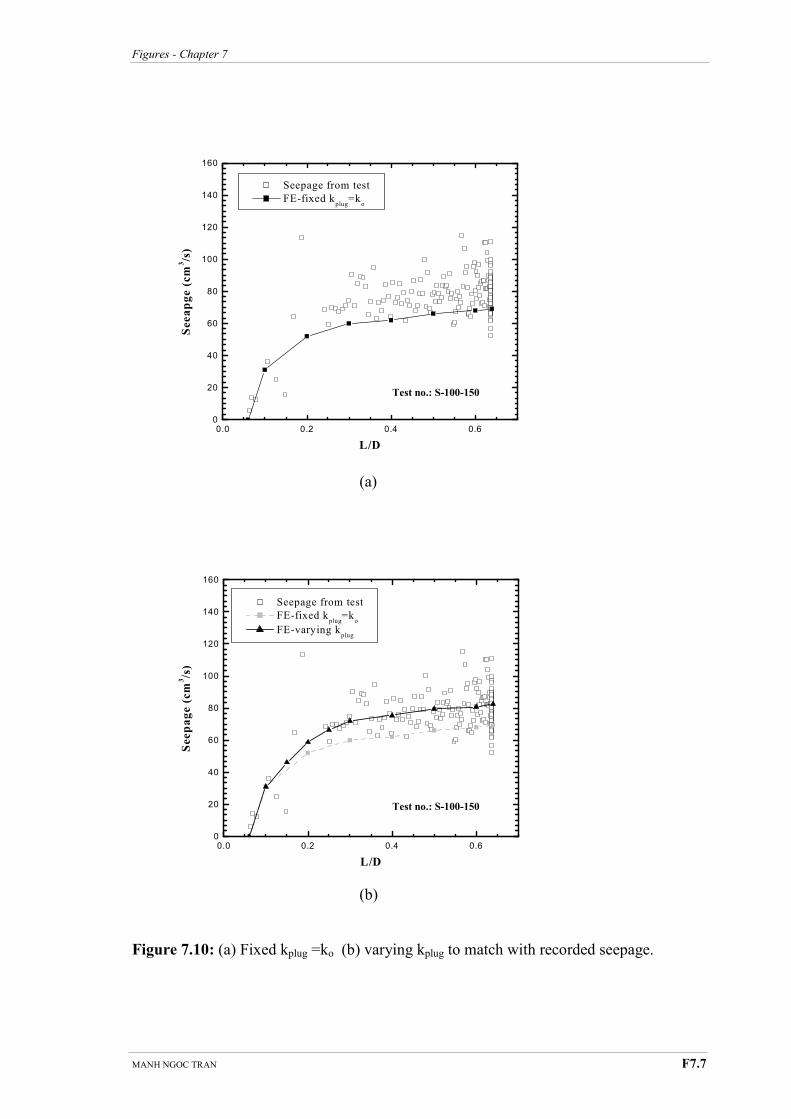
Figures - Chapter 7
MANH NGOC TRAN F7.7
(a)
(b)
Figure 7.10: (a) Fixed kplug =ko (b) varying kplug to match with recorded seepage.
0.0 0.2 0.4 0.60
20
40
60
80
100
120
140
160
Seepage from test
FE-fixed kplug
=ko
Seeapge (cm
3/s)
L/D
Test no.: S-100-150
0.0 0.2 0.4 0.60
20
40
60
80
100
120
140
160
Seepage from test
FE-fixed kplug
=ko
FE-varying kplug
Seepage (cm
3/s)
L/D
Test no.: S-100-150
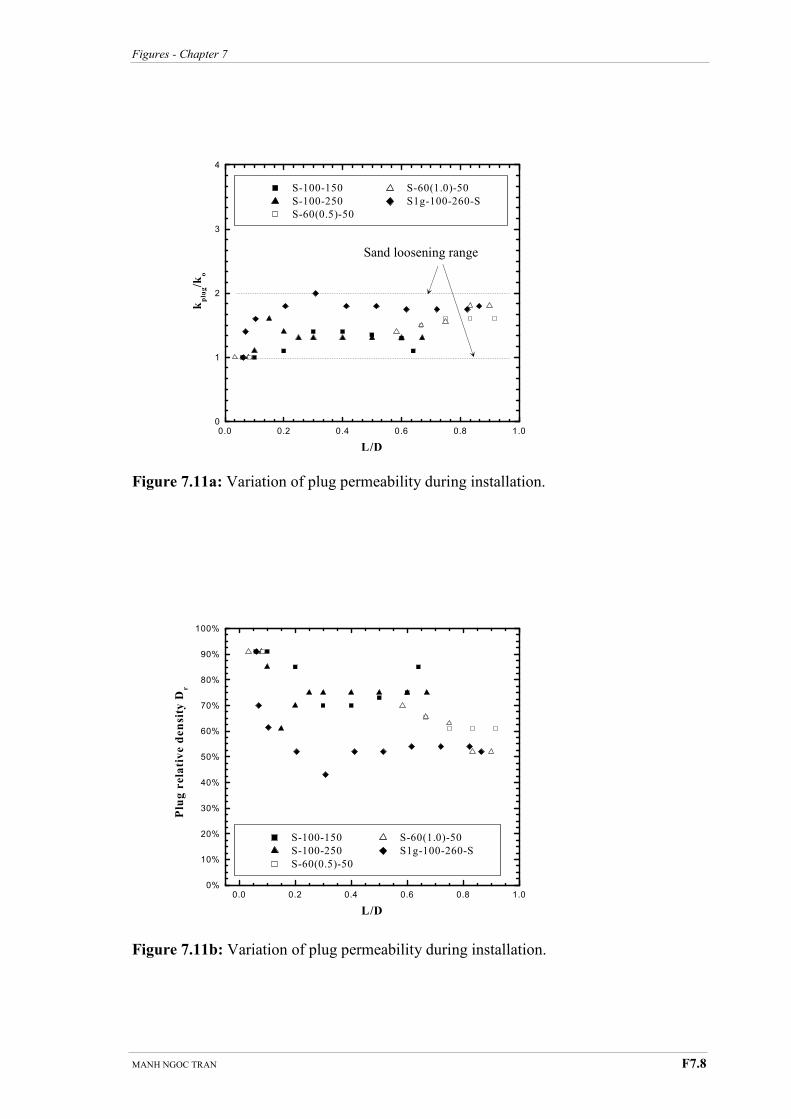
Figures - Chapter 7
MANH NGOC TRAN F7.8
Figure 7.11a: Variation of plug permeability during installation.
Figure 7.11b: Variation of plug permeability during installation.
0.0 0.2 0.4 0.6 0.8 1.00%
10%
20%
30%
40%
50%
60%
70%
80%
90%
100%
S-100-150 S-60(1.0)-50
S-100-250 S1g-100-260-S
S-60(0.5)-50
Plug relative density D
r
L/D
0.0 0.2 0.4 0.6 0.8 1.00
1
2
3
4
S-100-150 S-60(1.0)-50
S-100-250 S1g-100-260-S
S-60(0.5)-50
kplug/k
o
L/D
Sand loosening range
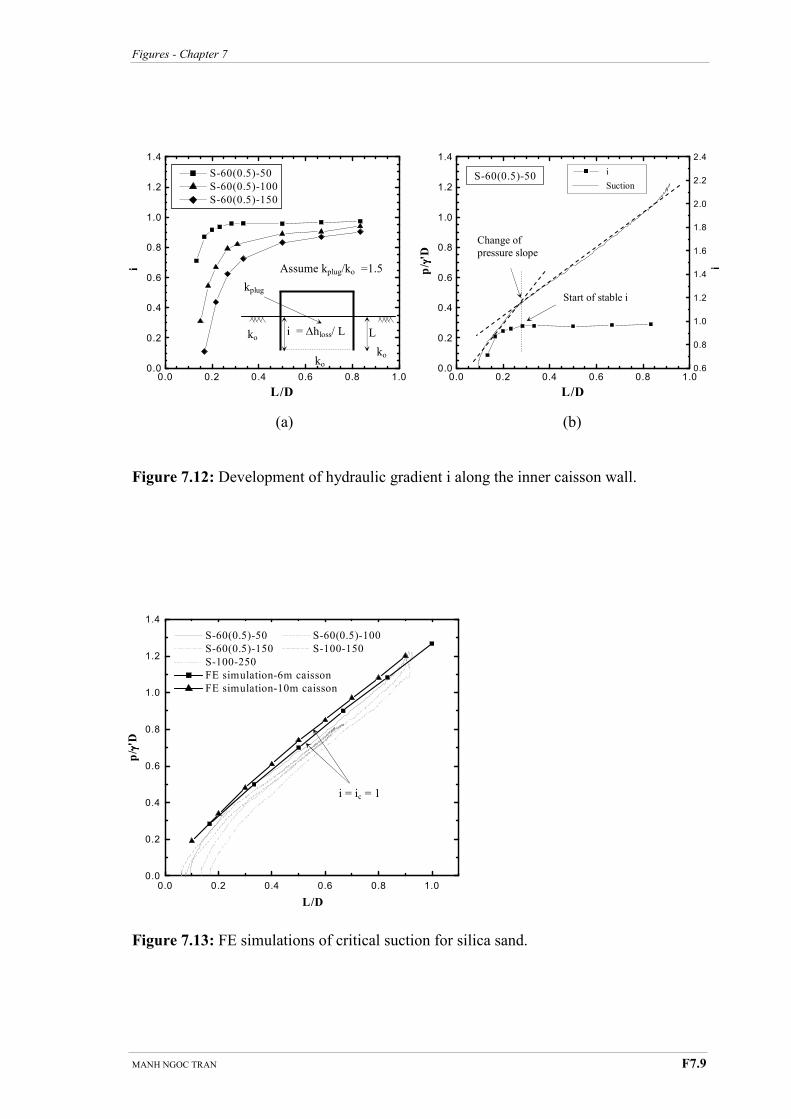
Figures - Chapter 7
MANH NGOC TRAN F7.9
(a) (b)
Figure 7.12: Development of hydraulic gradient i along the inner caisson wall.
Figure 7.13: FE simulations of critical suction for silica sand.
0.0 0.2 0.4 0.6 0.8 1.00.0
0.2
0.4
0.6
0.8
1.0
1.2
1.4
S-60(0.5)-50 S-60(0.5)-100
S-60(0.5)-150 S-100-150
S-100-250
FE simulation-6m caisson
FE simulation-10m caisson
p/ γγ γγ'D
L/D
i = ic = 1
0.0 0.2 0.4 0.6 0.8 1.00.0
0.2
0.4
0.6
0.8
1.0
1.2
1.4
S-60(0.5)-50
S-60(0.5)-100
S-60(0.5)-150
i
L/D
i = ∆hloss/ L
Assume kplug/ko =1.5
ko
ko
ko
L
kplug
0.0 0.2 0.4 0.6 0.8 1.00.0
0.2
0.4
0.6
0.8
1.0
1.2
1.4
p/ γγ γγ'D
L/D
0.6
0.8
1.0
1.2
1.4
1.6
1.8
2.0
2.2
2.4
S-60(0.5)-50
i
Change of
pressure slope
Start of stable i
i
Suction

Figures - Chapter 7
MANH NGOC TRAN F7.10
Figure 7.14: FE simulations of critical suction for calcareous sand.
Figure 7.15: FE simulations of critical suction for calcareous sand.
0.0 0.2 0.4 0.6 0.8 1.00.0
0.5
1.0
1.5
C-60(0.5)-50
C-60(0.5)-100
C-60(0.5)-150
C-100-150
FE - 6 m caisson
FE - 10 m caisson
p/ γγ γγ'D
L/D
i = ic = 0.6
0.0 0.2 0.4 0.6 0.8 1.00.0
0.5
1.0
1.5
2.0
p/γ'L i (FE)
p/γ'D
i, p/ γγ γγ'L
, p/ γγ γγ'D
L/D
“peak”
Start of critical pressure slope

Figures - Chapter 7
MANH NGOC TRAN F7.11
(a) (b)
Figure 7.16: Normalisation against L for mixed soil and calcareous sand.
Figure 7.17a: Draupner E installation result.
0.2 0.4 0.6 0.8 1.00
1
2
3
4 p/γ'L
p/ γγ γγ'L
L/D
0.0
0.2
0.4
0.6
0.8
1.0
1.2
p/γ'D
p/ γγ γγ'D
C-60(0.5)-150
Critical pressure
slope
Start of critical
pressure slope
No “peak”
0.0 0.2 0.4 0.6 0.8 1.00.0
0.5
1.0
1.5
2.0
2.5
3.0
p/γ'L
p/ γγ γγ'L
L/D
0.0
0.4
0.8
1.2
1.6
p/γ'D
p/ γγ γγ'D
Start of critical
pressure slope
“Peak”
M-60(0.5)-10%
0.1 0.2 0.3 0.4 0.5 0.60.0
0.2
0.4
0.6
0.8
Average suction measured (Tjelta, 1995)
p/ γγ γγ'D
0.0
0.5
1.0
1.5
2.0
2.5
3.0
3.5
4.0
L/D
i - measured (Erbrich & Tjelta, 1999)
i - FE simulation (assume kplug
/ko=2)
p/γ'L
i, p/ γγ γγ'L
Critical i slope stage
Transitional stage
Critical i slope
Draupner E (D = 12m)
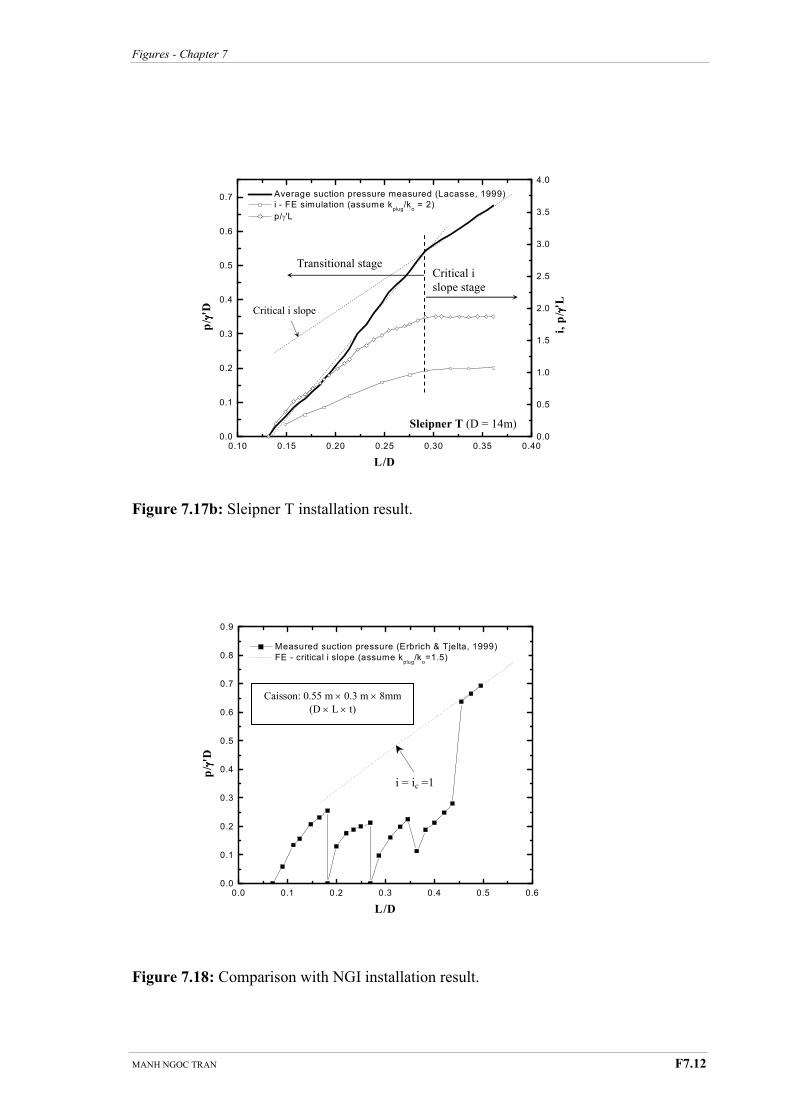
Figures - Chapter 7
MANH NGOC TRAN F7.12
Figure 7.17b: Sleipner T installation result.
Figure 7.18: Comparison with NGI installation result.
0.10 0.15 0.20 0.25 0.30 0.35 0.400.0
0.1
0.2
0.3
0.4
0.5
0.6
0.7
Average suction pressure measured (Lacasse, 1999)
p/ γγ γγ'D
L/D
0.0
0.5
1.0
1.5
2.0
2.5
3.0
3.5
4.0
i - FE simulation (assume kplug
/ko = 2)
p/γ'L
i, p/ γγ γγ'L
Critical i
slope stage
Transitional stage
Critical i slope
Sleipner T (D = 14m)
0.0 0.1 0.2 0.3 0.4 0.5 0.60.0
0.1
0.2
0.3
0.4
0.5
0.6
0.7
0.8
0.9
Measured suction pressure (Erbrich & Tjelta, 1999)
FE - critical i slope (assume kplug
/ko=1.5)
p/ γγ γγ'D
L/D
Caisson: 0.55 m × 0.3 m × 8mm
(D × L × t)
i = ic =1
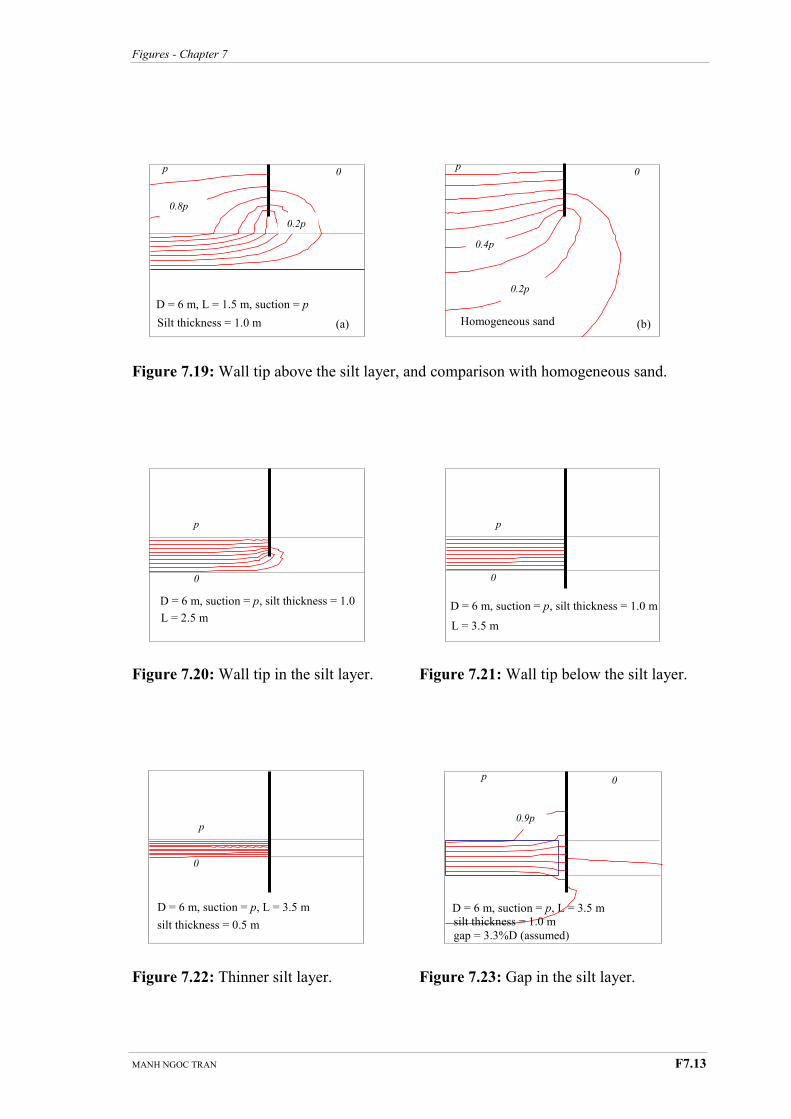
Figures - Chapter 7
MANH NGOC TRAN F7.13
Figure 7.19: Wall tip above the silt layer, and comparison with homogeneous sand.
Figure 7.20: Wall tip in the silt layer. Figure 7.21: Wall tip below the silt layer.
Figure 7.22: Thinner silt layer. Figure 7.23: Gap in the silt layer.
(a)
0
D = 6 m, L = 1.5 m, suction = p
0.8p
0.2p
p
Silt thickness = 1.0 m
D = 6 m, suction = p, silt thickness = 1.0 m
0
p
L = 3.5 m
(b)
0
0.2p
0.4p
p
Homogeneous sand
p
0
L = 2.5 m
D = 6 m, suction = p, silt thickness = 1.0
m
0
p
silt thickness = 0.5 m
D = 6 m, suction = p, L = 3.5 m D = 6 m, suction = p, L = 3.5 m
0 p
silt thickness = 1.0 m
gap = 3.3%D (assumed)
0.9p


![POR QUE FRACASAN LOS PA╓SES (1)[1]](https://static.fdokumen.com/doc/165x107/63453b68f474639c9b04bfec/por-que-fracasan-los-pases-11.jpg)