PRODUCT CATALOG - SES Instruments Pvt Ltd
141
PRODUCT CATALOG
-
Upload
khangminh22 -
Category
Documents
-
view
2 -
download
0
Transcript of PRODUCT CATALOG - SES Instruments Pvt Ltd

PRODUCT CATALOG

IndexFormerly known as Scientific Equipment & Services, we have the pleasure ofintroducing ourselves as a reputed manufacturers of complete laboratoryexperimentsandprecisionmeasuring instruments for BSandMS laboratoriesofPhysicsandElectronics.
For the last 39 years, we have been catering to the needs of over 1200institutions in over 32 countries. We, while orienting ourselves to the need oflaboratories havebeen tryingourbest todevelopand introduceprogressivelymore advanced laboratory experiments and general-purpose measuringinstruments.
Our strict quality control ensures uncompromising quality of our instruments,low overheads and direct sales to the customers have enabled us to keep ourrates veryaffordable.
The product catalogue highlights some of our manufacturing activities. Thetechnical specifications given here aremeant to give an accurate statementofperformanceof instrumentsmanufacturedbyus.
We at SES Instruments Pvt. Ltd.( ), aregreatful to the staff of IIT-Roorkee, particularly Professor K.C. Mittal, andProfessorM.K. Srivastava, for their tremendous support all through these yearsby giving innovative suggestions and constructive criticism thereby helping inconstantlyaddingnewproductsand improving theexistingones.
All our products aremanufacturedunder high level of quality control. Theyarewarranted free from defects for a period of one year from the date ofpurchase. We will repair or replace as find suitable, any piece of defectiveequipment during this period. Even after this period after sales service isundertakenat verynominal charges.
Specifications of all products are subject to change without notice. SESInstruments Pvt. Ltd. reserves the right to make improvements to the productswithout incurring any obligation to incorporate these changes in productspreviously sold.
Equipment in this cataloguearedesigned tooperate from220V ±10%, 50Hz. Allthe equipment are also available for use with 110V ±10%, 60Hz power at noadditional cost.
Formerly Scientific Equipment & Services
About us
Note of thanks
Warranty
Specifications
Power requirement

Index
1. Digital D.C. Microvoltmeter: DMV-001 & DMV-001-C2 5
2. Digital Nanometer: DNM-121 & DNM-121-C2 7
3. Digital Picoammeter: DPM-111 9
4. Digital Picoammeter: DPM-111-C 10
5. High Voltage Power Supply: EHT-11 & EHT-11-C1 12
6. True RMS A.C. Millivoltmeter: ACM-102/ACM-103 13
7. Electromagnet & Power Supply: EMU-75 & DPS-175M 14
8. Electromagnet & Power Supply: EMU-75 & DPS-175-C2 16
9. Electromagnet & Power Supply: DPS-175-BPC 18
10. Electromagnet & Power Supply: EMU-50 20
11. Constant Current Power Supply: DPS-50 & DPS-50-C1 21
12. Digital Gaussmeter: DGM-102 22
13. Digital Gaussmeter: DGM-202 & DGM-202-C1 23
14. Digital Gaussmeter: : DGM-103 24
15. Digital Gaussmeter: : DGM-204&DGM-204-C2 25
16. Digital Gaussmeter: : DGM-401 27
17. Hand Held Gaussmeter: : DGM-HH-02 28
18. Hand Held Gaussmeter: : DGM-HH-02C 29
19. Teslameter : TM-400 30
20. PID Controlled Oven: PID-TZ/ PID-TZ-CT 31
21. PID Controlled Oven: PID-TZ-C1 32
22. Travelling Microscope: TVM-02 33
23. Travelling Microscope: TVM-03 34
24. Regulated Power Supply: : PS-12 35
25. Function Generator: FG-01 36
26. DDS Function Generator: JDS-6600 37
27. X-Ray Diffraction Simulation Experiment: XDE-01 39
28. Magnetic Field Measurement Apparatus: MFM-01 41
29. Study of Dielectric Constant and Curie Temperature of Ferroelectric Ceramics: DEC-01
42
30. Frequency Dependence of Dielectric Constant: FDD-01 44
31. Dielectric Constant of Liquids: : DCL-01 46

32. Dielectric Constant of Solids & Liquids: : DSL-01 47
33. Dielectric Measurement Setup: DEC-600 48
34. Zeeman Effect Experiment: ZEX-01 50
35. Millikan’s Oil Drop Experiment: MOD-01 (LED TV) 51
36. e/m Experiment: EMX-01 53
37. Planck’s Constant by Photoelectric Effect: PC-101 55
38. Determination of Planck’s Constant by means of LED’s: PCA-01 57
39. Frank Hertz Experiment: FH-3001 59
40. Ionisation Potential Set-up: IP-01 61
41. Resistivity of Semiconductors by Four Probe Method at Different Temperatures and Determination of the Band-gap: DFP-02 (Basic :)
63
42. Resistivity of Semiconductors by Four Probe Method at Different Temperatures and Determination of the Band-gap: DFP-03 (Advance :)
65
43. Four Probe set-up for measuring the resistivity of very low to highly resistive samples at temperatures upto 200ºC with PID controlled oven: DFP-RM-200 (Research :)
67
44. Four Probe Set-Up for measuring the resistivity of very low to highly resistive thin sheet samples at different temperatures: DFP-RM-200NC (Research :)
69
45. Four Probe measurement set-up for wide range of resistivity samples from -190ºC to 200ºC temperatures: DFP-LH
72
46. Four Probe Set-up for Mapping the Resistivity of Large Samples: FP-01 (Mapping :)
75
47. Van der Pauw Experiment for measuring both resistivity and hall coefficients of given semiconductor samples: VDX-01
77
48. Measurement of Magnetoresistance of Semiconductors: MRX-01 79
49. Measurement of Magnetoresistance in Different Samples: MRX-RM 81
50. Measurement of Magnetoresistance in Bismuth: MRB-11 83
51. Two Probe Method for Resistivity Measurement of Insulators: TPX-200
(upto 1013.cm.) at Different Temperatures 85
52. Two Probe Method for Resistivity Measurement of Insulators: TPX-200C
(upto 1013.cm.) at Different Temperatures with USB based computer interface
86
53. High Temperature Two Probe Set-up: TPX-600
54. High Temperature Two Probe Set-up: TPX-600C with USB based computer interface facility
89
55. Electron Spin Resonance Spectrometer: ESR-105 91
Index

Index53. NMR Experiment: NMR-01 93
54. Study of Thermoluminescence of F-centres in Alkali Halide Crystals: TLX-02 95
55. Thermoluminescence Irradiation Unit: TIU-02 97
56. Hall Effect Experiment: HEX-21 98
57. Hall Effect Experiment: HEX-21C 100
58. Hall Effect Experiment: HEX-RM-150 102
59. Hall Effect in Bismuth: HEX-Bi 105
60. Hall Effect in Metals: HEM-01 107
61. Dependence of Hall Coefficient on Temperature: HEX-33 109
62. Dependence of Hall Coefficient on Temperature: HEX-33C 111
63. Apparatus for the Measurement of Susceptibility of Paramagnetic Solution by Quinck's Tube Method: QTX-01
113
64. Apparatus for the Measurement of Susceptibility of Solids by Gouy’s Method: GMX-01 (with EMU-75 & DPS-175M)
115
65. Apparatus for the Measurement of Susceptibility of Solids by Gouy’s Method: GMX-02 (with EMU-50T & DPS-50)
116
66. Apparatus for the Measurement of Susceptibility of Solids by Gouy’s Method: GMX-02 (with EMU-75T & DPS-175)
119
67. Magnetic Hysteresis Loop Tracer: HLT-111 120
68. Magnetic Hysteresis Loop Tracer: HLT-111C 122
69. Study of the energy band-gap and diffusion potential of P-N Junctions: PN-01 124
70. Diode Characteristics &Boltzman Constant: DCBC-01 126
71. Study of a Transistor Amplifier (RC Coupled) Cum-Feed Back Amplifier: RC-01 127
72. Study of Multivibrators: MV-01 128
73. Study of Characteristics of Semiconductors Diodes Si: Ge: Zener & LED: D-1 129
74. Study of Hybrid Parameters of Transistors: HP-01 130
75. Study of a Solid State Power Supply: SSPS-02 131
76. Study of Modulation & Demodulation with Built-in Carrier Frequency (Solid State): MD-01
132
77. Study of a Basic Operational Amplifier Type-74l: 741-01 133
78. Study of Op Amp 74l Applications: 741-03 134
79. Signal Generation Applications of Op Amp 74l: 741-05 135
80. Study of Op Amp Based LC Oscillators : 741-07 136
81. Study of Active Filters: Type AF-01 137
82. Study of Astable& Monostable Multivibrators using Timer IC: 555 138
83. Study of an Integrated Circuit Regulator: 723 139
84. Vibrating Sample Magnetometer: VSM-1000 140

INSTRUMENTS PVT. LTD.
452 Adarsh Nagar, Roorkee-247667 (Uttarakhand) INDIAPh.: +91-1332-272852, 277118, 271712 • Email: [email protected] • Web: www.sesinstruments.com
SES
ISO 9001:2015
DMV-001DMV-001 Digital MicrovoltmeterDigital Microvoltmeter
Speci�cation
Range : 1mV, 10mV, 100mV, 1V & 10V with 100%
over-ranging.
Resolution : 1µV
Accuracy : ±0.2% ±1 digit
Stability : Within ±1 digit
Input Impedance : >1000MW (10MW on 10V range)
Display : 3½ digit, 7 segment LED with autopolarity and
decimal indication
Interfacing : USB (in DMV-001-C2 only)
Software : DACC and CAMM, both Window compatible
Power Supply : 220V ±10%, 50Hz
Weight : 2.5Kg
Dimensions : 245mm X 280mm X 120mm
� Very low temperature drift
� Low dc input bias current-10pA
� Measures voltage down to 1µV
� Automatic polarity indication
� Built-in polarity indication
� Recorder facility (optional)
Applications
� DC voltage measurements from high impedance sources; output of
photomultiplier tubes, photo cells, radiation detector etc.
� Very low voltage measurement, direct measurement of
thermocouple output to read temperatures with a resolution of
1/40th of a degree (Chromel-Alumel).
� General purpose laboratory instrument for voltages upto
19.99VDC. (Hall Effect, Four Probe, Thermoluminescence,
Transistor and Diode characteristics etc.).Introduction
Digital Microvoltmeter, DMV-001 is a very
versatile multipurpose instrument for the
measurement of low dc voltage. It has 5 decade
ranges from 1mV to 10V with 100% over-
ranging. For better accuracy and convenience,
readings are directly obtained on 3½ digit DPM
(Digital Panel Meter). This instrument uses a
very well designed chopper stabilized IC
ampli�er. This ampli�er offers exceptionally low
offset voltage and input bias parameters,
combined with excellent speed characteristics.
Filter circuit is provided to reduce the line
pickups of 50Hz. All internal power supplies are
IC regulated.

INSTRUMENTS PVT. LTD.
452 Adarsh Nagar, Roorkee-247667 (Uttarakhand) INDIAPh.: +91-1332-272852, 277118, 271712 • Email: [email protected] • Web: www.sesinstruments.com
SES
ISO 9001:2015
DMV-001DMV-001 Digital MicrovoltmeterDigital Microvoltmeter Page-2Page-2
Computer Interface, SES-DAAC (In DMV-001-C2
only)
The unit can be connected directly to a PC through an USB.
SES-Data Access And Control is a built-in interface which
gives user an option to store a value as displayed on the
meter and tabulate it by the click of a button on the screen.
Alternatively the data may be automatically entered into a
table at user selectable interval. An �END� button on the
screen terminates the automatic tabulation. The data
stored in the table may then be displayed as a graph on the
screen and may also be stored in an excel file for further
processing. The software supplied with the unit is menu
driven and is simple to operate.
SES-CAMM Compatible (In DMV-001-C2 only)
This unit can also be connected to a PC through an interface
module SES-CAMM to record the voltage values. SES-
CAMM is a computer aided measurement module for
connecting multiple subunits of experiments, such as Four
Probe Setup, to same interface on a computer. This feature
is particularly useful in making this model compatible with
computerized versions of complete experiments from our
company.

INSTRUMENTS PVT. LTD.
452 Adarsh Nagar, Roorkee-247667 (Uttarakhand) INDIAPh.: +91-1332-272852, 277118, 271712 • Email: [email protected] • Web: www.sesinstruments.com
SES
ISO 9001:2015
Digital Nanoammeter
DNM-121DNM-121Digital Nanoammeter
� Measures current down to 100pA
� All solid state and IC design
� Accepts either polarity of input current
� Build-in computer interface
IntroductionDigital Nanoammeter, DNM-121, a rugged and low
cost instrument, is a product of extensive R&D using
high input impedance integrated circuits. It has 4
decade ranges with 100% over-ranging. The unit is
suitable for current measurement in the range of
100pA to 200pA. For the ease, readings are directly
obtained on a 31/2 digit DPM. The instrument is
capable of accepting either polarity of the input
current.
The very low leakage current of the input stage
combined with the high linearity fast response due to
high negative feedback enables accurate and easily
reproducible measurements. The instrument uses a
FET input operational amplifier that offers the very
low input bias current, low offset voltage, low drift
and noise. These characteristics have been fully
utilized in the present Nanoammeter. This operational
amplifier is used in low level current to voltage
configuration.
Applications� To measure current from photomultiplier tubes, photometer etc.
� Leakage currents in solid state devices. FET gate and tube grid
voltages without loading errors.
� Current through very high resistance in conjunction with a
power supply.
� Potentials across semiconductors, piezoelectric systems & pH
electrodes.
SpecificationsRange : 100nA, 1µA, 10µA, 100µA with 100% over-
ranging
Accuracy : 0.2% for all ranges
Resolution : 0.1nA
Input Impedance : 25W, 2.5W, 0.25W, 0.025W Display : 3½ digit 7 segment LED (12.5mm height)
with auto polarity and decimal indication
Input : Through BNC connector
Interfacing : USB (In DNM-121-C2 only)
Software : DACC and CAMM, both Window compatible
(In DNM-121-C2 only)
Power Supply : 220V ±10%, 50Hz
Weight : 2.5Kg

INSTRUMENTS PVT. LTD.
452 Adarsh Nagar, Roorkee-247667 (Uttarakhand) INDIAPh.: +91-1332-272852, 277118, 271712 • Email: [email protected] • Web: www.sesinstruments.com
SES
ISO 9001:2015
Digital Nanoammeter
DNM-121DNM-121Digital Nanoammeter Page-2Page-2
Computer Interface, SES-DAAC (In DNM-121-C2 only)
The unit can be connected directly to a PC through an USB. SES-
Data Access And Control is a built-in interface which gives user
an option to store a value as displayed on the meter and tabulate
it by the click of a button on the screen. Alternatively the data
may be automatically entered into a table at user selectable
interval. An 'END� button on the screen terminates the
automatic tabulation. The data stored in the table may then be
displayed as a graph on the screen and may also be stored in an
excel �le for further processing. The software supplied with the
unit is menu driven and is simple to operate.
SES-CAMM Compatible (In DNM-121-C2 only)
This unit can also be connected to a PC through an interface
module SES-CAMM. SES-CAMM is a computer aided
measurement module for connecting multiple subunits of
experiments such as Two Probe Setup to same interface on a
computer. This feature is particularly useful in making this model
compatible with computerized versions of complete
experiments from our company.

INSTRUMENTS PVT. LTD.452 Adarsh Nagar, Roorkee-247667 (Uttarakhand) INDIAPh.: +91-1332-272852, 277118, 271712 • Email: [email protected] • Web: www.sesinstruments.com
SES
ISO 9001:2015
DPM-111DPM-111
Digital PicoammeterDigital Picoammeter
• Measures current down to 1pA
• All solid state and IC design
• Very low offset current
• Built-in computer interface
Introduction
This is a very versatile multipurpose equipment for the
measurement of low dc currents. It has 6 decade ranges
with 100% over-ranging from 10-9A to 10-4A. For the
ease, readings are directly obtained on a 3½ digit DPM. The
instrument uses a well designed precision FET input
electrometer operational amplifier AD549, which offers
the lowest input bias currents (5OfA with ±5V supplies)
available in any standard operational amplifier. The
excellent characteristics of AD549, ultra low bias current,
low offset voltage, low drift and low noise have been fully
utilized to obtain best results in the present picoammeter.
The first operational amplifier AD549 is used in low level
current to voltage configuration and the output has been
directly read on a 3½ digit panel meter. The instrument is
capable of accepting either polarity of the input current.
Well-regulated power supplies are incorporated to use the
instrument upto 10% changes in a.c. main’s voltage.
Applications
• Current from photo multiplier tubes, photometers etc.
• Leakage currents in solid state devices.
• FET gate and tube grid-currents.
• Current through very high resistance’s in conjunction with a power supply. Potentials across semiconductors, piezoelectric system & pH/plon sensitive electrodes.
• Electrical conductivity of air.
• Very low current oxygen sensors.
Specifications
Multiplier : X1, X10, X10², X10³, X104, X105
Accuracy : 0.2% for all ranges
Resolution : 1pA, 10pA, 100pA, 1nA, 10nA,
100nA
Input Resistance : 2.5KW, 0.25KW, 25W, 2.5W, 0.25W
, 0.025W
Display : 3½ digit 7 segment LED
Power Supply : 220V ±10%, 50Hz
Input : Through BNC connector
Interfacing : USB (DPM-111-C2 model)
Software : DACC and CAMM, both Window
compatible (DPM-111-C2 model)

INSTRUMENTS PVT. LTD.452 Adarsh Nagar, Roorkee-247667 (Uttarakhand) INDIAPh.: +91-1332-272852, 277118, 271712 • Email: [email protected] • Web: www.sesinstruments.com
SES
ISO 9001:2015
DPM-111-C2DPM-111-C2
Digital PicoammeterDigital Picoammeter
• Measures current down to 1pA
• All solid state and IC design
• Very low offset current
• Built-in computer interface
Introduction
This is a very versatile multipurpose equipment for the
measurement of low dc currents. It has 6 decade ranges
with 100% over-ranging from 10-9A to 10-4A. For the
ease, readings are directly obtained on a 3½ digit DPM. The
instrument uses a well designed precision FET input
electrometer operational amplifier AD549, which offers
the lowest input bias currents (5OfA with ±5V supplies)
available in any standard operational amplifier. The
excellent characteristics of AD549, ultra low bias current,
low offset voltage, low drift and low noise have been fully
utilized to obtain best results in the present picoammeter.
The first operational amplifier AD549 is used in low level
current to voltage configuration and the output has been
directly read on a 3½ digit panel meter. The instrument is
capable of accepting either polarity of the input current.
Well-regulated power supplies are incorporated to use the
instrument upto 10% changes in a.c. main’s voltage.
Applications
• Current from photo multiplier tubes, photometers etc.
• Leakage currents in solid state devices.
• FET gate and tube grid-currents.
• Current through very high resistance’s in conjunction with a power supply. Potentials across semiconductors, piezoelectric system & pH/plon sensitive electrodes.
• Electrical conductivity of air.
• Very low current oxygen sensors.
Specifications
Multiplier : X1, X10, X10², X10³, X104, X105
Accuracy : 0.2% for all ranges
Resolution : 1pA, 10pA, 100pA, 1nA, 10nA,
100nA
Input Resistance : 2.5KW, 0.25KW, 25W, 2.5W, 0.25W
, 0.025W
Display : 3½ digit 7 segment LED
Power Supply : 220V ±10%, 50Hz
Input : Through BNC connector
Interfacing : USB
Software : DACC and CAMM, both Window
compatible

INSTRUMENTS PVT. LTD.452 Adarsh Nagar, Roorkee-247667 (Uttarakhand) INDIAPh.: +91-1332-272852, 277118, 271712 • Email: [email protected] • Web: www.sesinstruments.com
SES
ISO 9001:2015
Page-2Page-2
Computer Interface, SES-DAAC (In DPM-111-C2 only)
The unit can be connected directly to a PC through an
USB. SES-Data Acess And Control is a buit-in interface
which gives user an option to store a value as displayed on
the meter and tabulate it by the click of a button on the
screen. Alternatively the data may be automatically
entered into a table at user selectable interval. An ‘END’
button on the screen terminates the automatic
tabulation.
The data stored in the table may then be displayed as
graph on the screen and may also be stored in an excel file
for further processing. The software supplied with the
unit is menu driven and is simple to operate.
SES-CAMM Compatible (In DPM-111-C2 only)
This unit can also be connected to a PC through an
interface module SES-CAMM to record current values.
SES-CAMM is a computer aided module for connecting
multiple subunits of experiments, such as Two Probe
Setup, to same interface on a computer. This feature is
particularly useful in making this model compatible with
computerized versions of complete experiments from our
company.
DPM-111-C2DPM-111-C2
Digital PicoammeterDigital Picoammeter

SES-CAMM Compatible (In EHT-11-C1 only)
This unit can also be connected to a PC through an interface module SE5-CAMM to record voltage values. SES-CAMM is a computer aided module for connecting multiple subunits of experiments such as Two Probe Setup to same interface on a computer. This feature is particularly useful in making this model compatible with computerized versions of complete experiments from our company.
Specifications
Output : 0-1500V continuously adjustable
Current : 1mA (max.)
Polarity : +ve or -ve, as required
Regulation : ±0.05% for 0 to 1mA load
Stabilization : ±0.02% for ±10% mains variation
Display : 3½ digit, 7 segment LED DPM
Connection : Output through a TNC connector on the front panel
Protection : Fully protected against overload and short circuit by current limiting technique
Interfacing : Through SES-CAMM module (In EHT-11-C1 model only)
Software : Software provided with SES-CAMM is Window compatible ( In EHT-11-C1 model only(
Power requirements : 220V ±10%, 50Hz
Weight : 5Kg
Dimensions : 240mm X 390mm X 130mm
� Continuously variable
� Electronically regulated
� Fully solid state circuit
� Low power
consumption
� Computer connectivity
through SES-CAMM
Introduction
Power supply, EHT�11 principle of operation is entirely different from conventional supplies, and thereby eliminating many drawbacks; bulky high voltage transformer, need of high voltage components and excessive heating of components etc., associated with them.
This power supply consists of a stable power oscillator whose output is controlled by an input signal. The output of this oscillator is boosted with the help of a step-up transformer and then rectified and filtered. A portion of this output is compared with a high stability, temperature compensated reference and the error signal is used in the feedback path to control the oscillator�s output. There is a built-in protection against accidental overloading.
For h igh re l iab i l i ty, compactness and ruggedness, integrated circuits are extensively used along with a few discrete silicon devices. The components are mounted in a glass epoxy printed circuit card.
Applications
EHT-11 is designed to meet the power requirements of a broad range of radiation de tec to rs : G .M . Counte rs , I on i za t i on Chambers, Scintillation Detectors, Photo multiplier Tubes and any application where a high voltage source with high degree of regulation and stability is required.
INSTRUMENTS PVT. LTD.
452 Adarsh Nagar, Roorkee-247667 (Uttarakhand) INDIAPh.: +91-1332-272852, 277118, 271712 • Email: [email protected] • Web: www.sesinstruments.com
SES
ISO 9001:2015
EHT-11EHT-11
High Voltage Power SupplyHigh Voltage Power Supply

INSTRUMENTS PVT. LTD.
452 Adarsh Nagar, Roorkee-247667 (Uttarakhand) INDIAPh.: +91-1332-272852, 277118, 271712 • Email: [email protected] • Web: www.sesinstruments.com
SES
ISO 9001:2015
ACM-102, ACM-103ACM-102, ACM-103
True RMS A.C. MillivoltmeterTrue RMS A.C. Millivoltmeter
� Measures True RMS
Voltage
� Accuracy 1%
� High Input Impedance
� High Stabilility
� Excellent Linearity
Applications
Measurement of low signal like
microphone outputs e.g. in r.m.s.
sound level monitoring Ampli�er
frequency response well beyond audio ranges RMS voltage
measurement of modulated signals Power measurements with
external standard resistance.
ACM-102: True RMS A.C. Millivoltmeter, ACM-102 is based on
AD536. This is a completely monolithic integrated circuit
which performs true rms-to-dc conversion of any waveform.
The true rms value of a waveform is more useful quantity than
average recti�ed value, since it relates directly to the power of
the signal. The crest factor compensation scheme of the AD536
allows measurement of highly complex signals with wide
dynamic range. The crest factor is often overlooked in
determining the accuracy of an ac measurement. Crest factor
is de�ned as the ratio of the peak signal amplitude to the rms
value of the signal (C.F.=V /V ). Input signal is appropriately p rms
processed through a FET input wide band, extremely fast
settling time, low noise ampli�er.
ACM-103: In model ACM-103 besides all features of
ACM-102, an IC based 1KHz oscillator followed by a
buffer, is in-built. This eliminate the need of an external
oscillator for purpose, such as determination of h-
parameters of a transistor, bridge measurement etc.,
where spot frequency of 1KHz is most commonly used.
Speci�cations
Voltage Range : 20mV, 200mV, 2V and 20V
Frequency Range : 10Hz to 200KHz
Input Impedance : 1MW shunted by 25pf on all
ranges
Accuracy : 1% in the range 10Hz-100KHz;
2% in the range 100KHz-200KHz
Display : 3½ digit, 7 segment LED (12.5mm
height) with decimal and
over�ow indication
Power Supply : 220V ±10%, 50Hz
Weight : 2.5Kg & 3Kg
Accessories : 75cm shielded cable with a
coaxial connector at one end and
banana plugs on the other end
ACM-103 (Additional Features)
Oscillator Output : 0-300mV continuously variable
Frequency : 1KHz �xed

EM
U-7
5
DP
S-1
75
M
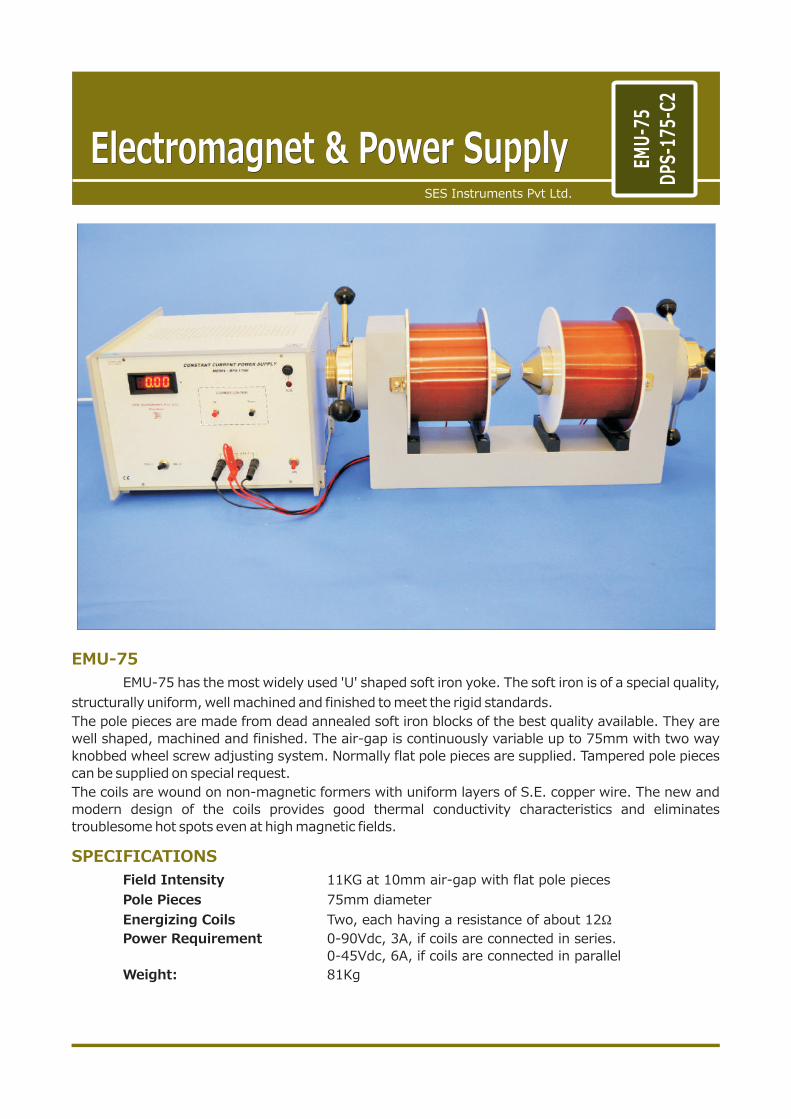
EMU-75 has the most widely used ‘U’ shaped soft iron yoke. The soft iron is of a special quality,
structurally uniform, well machined and finished to meet the rigid standards.
The pole pieces are made from dead annealed soft iron blocks of the best quality available. They
are well shaped, machined and finished. The air-gap is continuously variable upto 75mm with two
way knobbed wheel screw adjusting system. Normally flat pole pieces are supplied. Tappered pole
pieces can be supplied on special request.
The coils are wound on non-magnetic formers with uniform layers of S.E. copper wire. The new and
modern design of the coils provides good thermal conductivity characteristics and eliminates
troublesome hot spots even at high magnetic fields.
Specifications
Field Intensity
Pole Pieces
Energising Coils
Power Requirement
11KG at 10mm air-gap with flat pole pieces
75mm diameter
Two, each having a resistance of about 12
0-90Vdc, 3A, if coils are connected in series.0-45Vdc, 6A, if coils are connected in parallel
W

DPS-175M is designed to be used with the
Electromagnet, Model: EMU-75 as a
constant current power supply to generate
magnetic field upto 11KG. The current
requirement of 3A per coil, i.e. a total of
6A is met by connecting six closely
matched constant current sources in
parallel. In this arrangement the first unit
works as the ‘master’ with current
adjustment control. All others are ‘slave’
units generating exactly the same current
as the master. All the six constant current
sources are individually IC controlled. The
current is set by Up/ Down push button
switches under the control of a
microcontroller. The embedded software
further ensures low power dissipation by
selecting the primary and secondary
tappings of the mains transformer
approximately. The unit is therefore
capable of continuosly operations for
long periods. The supply is protected
against overload, short circuit and
transients caused by the load inductance.
EMU-75 & DPS-175M
Specifications
Current Range :
Load Regulation :
Line Regulation :
Display :
Power :
Weight :
Dimensions :
Up/ Down switch operated, 0-3A per coil, i.e. 6A
0.1% for load variation from 0 to max.
0.1% for ±10% mains variation
3½ digit, 7 segment LED DPM
220V ±10%, 50Hz
13Kg
340mm X 350mm X 235mm


INSTRUMENTS PVT. LTD.452 Adarsh Nagar, Roorkee-247667 (Uttarakhand) INDIAPh.: +91-1332-272852, 277118, 271712 • Email: [email protected] • Web: www.sesinstruments.com
SES
ISO 9001:2015
EMU-50EMU-50
ElectromagnetElectromagnet
EMU-50, EMU-50T
These electromagnets have the most widely used ‘U’
shaped soft iron yoke. The soft iron is of a special
quality, structurally uniform, well machined and
finished to meet the rigid standards.
The pole pieces are made from dead annealed soft iron
blocks of the best quality available. They are well
shaped, machined and finished. The air-gap is
continuously variable with two way knobbed wheel
screw adjusting system. EMU-50V is supplied with flat
pole pieces and EMU-50T is supplied with tapered pole
pieces.
The coils are wound on non-magnetic former with
uniform layers of S.E. copper wire. The new and modern
design of the coils provides good thermal conductivity
characteristics and eliminates troublesome hot spots
even at high magnetic fields.
Specifications
Field Intensity : 7.5KG at 10mm air-gap with flat pole
pieces ( In EMU-50V)
9.0KG at 10mm air-gap with tapered
pole pieces ( In EMU-50T)
Pole Pieces : 50mm diameter
Energising Coils : Two, each with a resistance of about
3.0W
Power Requirement : 0-30Vdc, 4A, if coils are connected in
series
Weight : 33Kg
Constant Current Power Supply, DPS-50 shown in above picture
need to be purchased separately and it is not included in the cost
of Electromagnet.

DPS-50, DPS-50-C1
DPS-50 is an inexpensive and high performance constant
current source suitable for small and medium sized
electromagnets. Although the equipment is designed for the
Electromagnet, Model: EMU-50, it can be used satisfactorily
with any other electromagnet provided the coil resistance
does not exceed 6W.
The current regulation circuit is IC controlled and hence
results in the highest quality of performance. Matched
power transistors are used to share the load current. The
supply is protected against overload, short circuit and
transient caused by the inductive load of the magnet.
Specifications
Current Range : Smoothly adjustable from 0-4A
Load Regulation : 0.1% for load variation from 0 to
max.
Line Regulation : 0.1% for ±110% mains variation
Display : 3½ digit, 7 segment LED DPM
Power : 220V ±10%, 50Hz
Weight : 9Kg
Dimensions : 335mm X 305mm X 155mm
INSTRUMENTS PVT. LTD.452 Adarsh Nagar, Roorkee-247667 (Uttarakhand) INDIAPh.: +91-1332-272852, 277118, 271712 • Email: [email protected] • Web: www.sesinstruments.com
SES
ISO 9001:2015
DPS-50DPS-50
Constant Current Power SupplyConstant Current Power Supply
SES-CAMM Compatible (In DPS-50-C1 only)
This unit can also be connected to a PC through an interface
module SES-CAMM SES-CAMM is a computer aided module
for connecting multiple subunits of experiment such as Hall
Effect Setup to same interface on a computer. This feature is
particularly useful in making this model compatible with
computerized versions of complete experiments from our
company.

Introduction
DGM-102 operates on the principle of Hall Effect in
Semiconductors. A semiconductor carrying current
develops an electromotive force, when placed in a
magnetic �eld, in a direction perpendicular to the
direction of both electric current and magnetic �eld. The
magnitude of this e.m.f. is proportional to the �eld
intensity, if the current is kept constant. This e.m.f. is
called the Hall Voltage. The small Hall Voltage is ampli�ed
through a high stability ampli�er so that a millivoltmeter
connected at the output of the ampli�er can be calibrated
directly in magnetic �eld unit (gauss).
Applications� Wide application
in industry where accurate measurements of magnetic �eld is required.
� Measurement of steady magnetic �eld e.g. in loud speakers, dynamos, moving coil instruments etc.
INSTRUMENTS PVT. LTD.
452 Adarsh Nagar, Roorkee-247667 (Uttarakhand) INDIAPh.: +91-1332-272852, 277118, 271712 • Email: [email protected] • Web: www.sesinstruments.com
SES
ISO 9001:2015
DGM-102DGM-102
Digital Gaussmeter (Basic Model)Digital Gaussmeter (Basic Model)
� Useful in laboratory experiments involving electromagnets.
Speci�cations
Range : 0-2KG & 0-20KG
Resolution : 1G at 0-2KG range
Accuracy : ±0.5%
Temperature : Upto 50ºC
Display : 3½ digit, 7 segment LED DPM
with auto polarity and over�ow
indication
Power : 220V ±10%, 50Hz
Transducer : Hall Probe � GaAs
Special Feature : Indicate the direction of the
magnetic �eld
Weight : 3Kg
Dimensions : 280mm X 255mm X 120mm
� Mag. Field Measurement
� Excellent Linearity
� IC Controlled Circuit
� Excellent Stability

INSTRUMENTS PVT. LTD.
452 Adarsh Nagar, Roorkee-247667 (Uttarakhand) INDIAPh.: +91-1332-272852, 277118, 271712 • Email: [email protected] • Web: www.sesinstruments.com
SES
ISO 9001:2015
DGM-202DGM-202
Digital Gaussmeter (with interchangeable probe)Digital Gaussmeter (with interchangeable probe)
� Wide range (1G to 20KG)� Excellent linearity� E xcellent stability� I nterchangeable Hall probes
IntroductionDGM-202 operates on the principle of Hall Effect in Semiconductors. A semiconductor carrying current develops an electromotive force, when placed in a magnetic �eld, in a direction perpendicular to the direction of both electric current and magnetic �eld. The magnitude of this e.m.f. is proportional to the �eld intensity if the current is kept constant. This e.m.f. is called the Hall Voltage. The small Hall Voltage is ampli�ed through a high stability ampli�er so that a millivoltmeter connected at the output of the ampli�er can be calibrated directly in magnetic �eld unit (gauss).
Applications
� Wide application in industry where accurate measurements of magnetic �eld is required.
� Measurement of steady magnetic �eld e.g. in loud speakers, dynamo, moving coil instruments etc.
� Useful in laboratory experiment involving measurement of magnetic �eld.
� With easy interchangeability of Hall Probe, same guassmeter can be used with both transverse and axial probe.
SES-CAMM Compatible (In DGM-
202-C1 only)
This unit can also be connected to a PC through an interface module SES-CAMM. SES-CAMM is a computer aided module for connecting multiple subunits of experiments, such as Hall Effect Setup, to same interface on a computer. This feature is particularly
useful in making this model compatible with computerized versions of complete experiments from our company.
Speci�cations
Resolution : 1 gauss at 2 kilogauss range
Range : 2KG and 20KG
Accuracy : ±0.5%
Temperature : Upto 40ºC
Display : 3½ digit, 7 segment LED DPM with auto
polarity and over�ow indication
Power : 220V ±10%, 50Hz
Transducer : Hall Probe-GaAs
Special Feature : Indicates the direction of the magnetic �eld
Interfacing : USB (In DGM-202-C1 model only)
Software : DACC and CAMM, both Window compatible
(In DGM-202-C1 model only)
Weight : 3Kg
Dimensions : 280mm X 255mm X 120mm

INSTRUMENTS PVT. LTD.
452 Adarsh Nagar, Roorkee-247667 (Uttarakhand) INDIAPh.: +91-1332-272852, 277118, 271712 • Email: [email protected] • Web: www.sesinstruments.com
SES
ISO 9001:2015
DGM-103DGM-103
Digital Gaussmeter (with differential mode)Digital Gaussmeter (with differential mode)
� Differential mode facility
� Wide Range (1G to 40KG)
� Excellent Linearity
� Excellent Stability
� Easy replacement of Hall Probe
IntroductionDGM-103 operates on the principle of Hall Effect in
Semiconductors. A semiconductor carrying current
develops an electromotive force, when placed in a
magnetic �eld, in a direction perpendicular to the
direction of both electric current and magnetic �eld. The
magnitude of this e.m.f. is proportional to the �eld
intensity if the current is kept constant This e mf is called
the Hall Voltage. The small Hall Voltage is ampli�ed
through a high stability ampli�er so that a millivoltmeter
connected at the output of the ampli�er can be
calibrated directly in magnetic �eld unit (gauss).
Applications
� Wide application in industry where accurate measurements of magnetic �eld is required.
� Measurement of steady magnetic �eld e.g. in loud speakers, dynamo, moving coil instruments etc.
� Usefu l in l aboratory exper iment invo lv ing measurement of magnetic �eld.
� With the differential mode facility, the instrument is especially useful for testing the homogeneity/ variation of magnetic �eld in a particular region.
Speci�cations
Range : 0-2KG, 0-20KG & 0-40KG
Resolution : 1G at 0-2KG range in normal mode
1G at 20KG & 40KG range in
differential mode
Accuracy : ±0.5%
Temperature : Upto 50ºC
Display : 3½ digit, 7 segment LED DPM with
auto polarity and over�ow
indication
Power : 220V ±10%, 50Hz
Transducer : Hall Probe � GaAs
Special Feature : Indicate the direction of the
magnetic �eld
Weight : 3Kg
Dimensions : 280mm X 255mm X 120mm

INSTRUMENTS PVT. LTD.
452 Adarsh Nagar, Roorkee-247667 (Uttarakhand) INDIAPh.: +91-1332-272852, 277118, 271712 • Email: [email protected] • Web: www.sesinstruments.com
SES
ISO 9001:2015
DGM-204DGM-204
Digital Gaussmeter (with wide measurement range)Digital Gaussmeter (with wide measurement range)
� Wide range (0.1G to 40KG)
� Excellent linearity
� Excellent stability
� Interchangeable Hall probes
� Built-in computer interface
IntroductionDGM-204 operates on the principle of Hall Effect in
semiconductors. A semiconductor carrying current develops
an electromotive force, when placed in a magnetic �eld in a
direction perpendicular to the direction of both electric
current and magnetic �eld. The magnitude of this e.m.f. is
proportional to the �eld intensity if the current is kept
constant. This e.m.f. is called the Hall Voltage. This small Hall
Voltage is ampli�ed through a high stability ampli�er so that a
millivoltmeter connected at the output of the ampli�er can be
calibrated directly in magnetic �eld unit (gauss).
Applications
� Current from photo multiplier tubes, photometers etc.
� Wide application in industry where accurate measurements
of magnetic �eld is required.
� Measurement of steady magnetic �eld e.g. in loud
speakers, dynamo, moving coil instruments etc.
� Useful in laboratory experiment involving measurement
of magnetic �eld.
� With easy interchangeability of Hall Probe, same
gaussmeter can be used with both transverse and axial
probe.
Speci�cations
Resolution : 0.1 gauss at 200G range
Range : 200G, 2KG, 20KG and 40KG.
Accuracy : ±0.5%, ±½ digit at 2KG, 20KG &
40KG range
±1%; ±1 digit at 200G range
Temperature : Upto 40ºC
Display : 3½ digit, 7 segment LED with
autopolarity and decimal indication
Power : 220V ±10%, 50Hz
Special Feature : Indicate the direction of the magnetic
�eld
Interfacing : USB ( In DGM-204-C2 model)
Software : DACC and CAMM, both Window
compatible (In DGM-204-C2 model)
Weight : 3Kg
Dimensions : 280mm X 255mm X 120mm
Computer interface available in DGM-204-C2 Model.

INSTRUMENTS PVT. LTD.
452 Adarsh Nagar, Roorkee-247667 (Uttarakhand) INDIAPh.: +91-1332-272852, 277118, 271712 • Email: [email protected] • Web: www.sesinstruments.com
SES
ISO 9001:2015
Page-2Page-2
Computer Interface, SES-DAAC (In DGM-204-C2
only)
The unit can be connected directly to a PC through an USB
port. SES-Data Access And Control is a built-in interface
which gives user an option to store a value as displayed on
the meter and tabulate it by the click of a button on the
screen. Alternatively the data may be automatically
entered into a table at user selectable interval. An �END�
button on the screen terminates the automatic tabulation.
The data stored in the table may then be displayed as a
graph on the screen and may also be stored in an excel �le
for further processing. The software supplied with the unit
is menu driven and is simple to operate.
SES-CAMM Compatible (In DGM-204-C2 only)
This unit can also be connected to a PC through an
interface module SES-CAMM to record magnetic �eld
values. SES-CAMM is a computer aided module for
connecting multiple subunits of experiments such as Hall
Effect Setup to same interface on a computer. This feature
is particularly useful in making this model compatible with
computerized versions of complete experiments from our
company.
DGM-204DGM-204
Digital Gaussmeter (with wide measurement range)Digital Gaussmeter (with wide measurement range)

INSTRUMENTS PVT. LTD.
452 Adarsh Nagar, Roorkee-247667 (Uttarakhand) INDIAPh.: +91-1332-272852, 277118, 271712 • Email: [email protected] • Web: www.sesinstruments.com
SES
ISO 9001:2015
DGM-401DGM-401
Digital Gaussmeter (Measure a.c./d.c. magnetic field)Digital Gaussmeter (Measure a.c./d.c. magnetic field)
� AC and DC Mag. Field
� Wide Range (1G to 40KG)
� Excellent Linearity
� Excellent Stability
� Interchangable Hall Probe
IntroductionDGM-401 operates on the principle of Hall Effect in
Semiconductors. A semiconductor carrying current
develops an electromotive force, when placed in a
magnetic �eld, in a direction perpendicular to the
direction of both electric current and magnetic �eld. The
magnitude of this e.m.f. is proportional to the �eld
intensity if the current is kept constant. This e.m.f. is
called the Hall Voltage. The small Hall Voltage is ampli�ed
through a high stability ampli�er so that a millivoltmeter
connected at the output of the ampli�er can be
calibrated directly in magnetic �eld unit (gauss). In the
AC range and rms to dc conversion circuit displays the
rms value of the �eld.
Applications
� Wide application in industry where accurate measurements of magnetic �eld is required.
� Measurement of steady magnetic �eld e.g. in loud speakers, dynamo, moving coil instruments etc.
� Useful in laboratory experiment involving measurement of magnetic field.
� With easy interchangebility of Hall Probe, same guassmeter can be used with both transverse and axial probe.
� Both ac and dc magnetic fields may be measured.
Speci�cations
Resolution : 1G at 2KG range & 10G at 20KG/ 40KG
range
Range : 2KG, 20KG and 40KG
Accuracy : ±0.5%, ±½ digit at 2KG to 40KG range for
both AC and DC measurements
Temperature : Upto 50°C
Display : 3½ digit, 7 segment LED DPM with auto
polarity and overflow indication
Power : 220V ±10%, 50Hz
Transducer : Hall Probe � GaAs
Special Feature : Indicate the direction of the magnetic
field
Weight : 3Kg

DG
M-H
H-0
2
Long Battery Life
Measurement range (1G to 20KG)
DC to 50 kHz frequency range
Max. and Min. field capture
20 data storage location
Self calibration of Hall Probe
Introduction
DGM-HH-02 operates on the principle of Hall Effect in semiconductors. A semiconductor carrying current
develops an electromotive force when placed in a magnetic field. The direction of this emf is perpendicular
to both the electric current and the magnetic field directions. Also this emf, called hall voltage, is
proportional to the intensity of the magnetic field if the current is kept constant. The small Hall Voltage is
amplified in the unit by highly stable amplifiers so that its value could be read on an 16x2 LCD. The complete
unit operates from a 3200mAH Li-ion battery pack, ensuring 7-8 hrs of continuous operation. Charging cable
comes with the unit.
Specifications
Resolution
Range
Display Units
Field
Measurement
Feature
Memory
Accuracy
Temperature
Display
Power
Transducer
Special Feature
1G at 2KG range & 10G at 20KG/ 40KG
range
2KG, 20KG
Gauss (G), millTesla (mT)
DC/ AC magnetic fields
Selectable Range, Max/Min Hold
Upto 20 data sample storage
±0.5% ±½ digit
Upto 60°C (typical)
(Sensor temperature can go higher)
16x2 digit, backlit LCD
Li-ion 3200mAH in-built chargeable
battery
Hall Probe – GaAs (Included)
Indicate the direction of the magnetic
field
Applications
Wide application in industry where accurate
measurements of magnetic field are required.
Laboratory experiments involving electromagnets.
Extremely convenient magnetic field measurement in
industrial environment. Can operate on battery for
long durations without recharging.
Multiple measurements can be stored and checked
later.
To check maximum and minimum fields of a surface.
452 Adarsh Nagar, Roorkee-247667 (Uttarakhand) India
email: [email protected], website: www.sesinstruments.com

DG
M-H
H-0
2C
Long life rechargeable
Measurement range (1G to 0KG)
DC to 30kHz frequency range
Max. and min. field capture
25 data storage location
Self calibration of Hall Probe
Computer link with software
battery
2
Introduction
DGM-HH-02 operates on the principle of Hall Effect in semiconductors. A semiconductor carrying current
develops an electromotive force when placed in a magnetic field. The direction of this emf is perpendicular
to both the electric current and the magnetic field directions. Also this emf, called hall voltage, is
proportional to the intensity of the magnetic field if the current is kept constant. The small Hall Voltage is
amplified in the unit by highly stable amplifiers so that its value could be read on an 16x2 LCD. The complete
unit operates from a 3200mAH Li-ion battery pack, ensuring 7-8 hrs of continuous operation. Charging cable
comes with the unit.
Specifications
Resolution
Range
Display Units
Field
Measurement
Memory
Accuracy
Temperature
Display
Power
Transducer
Connectivity
Special Feature
Calibration
1G at 2KG range & 10G at 20KG range
2KG, 20KG
Gauss (G), millTesla (mT)
DC/ AC magnetic fields
Selectable Range, Max/Min Hold
Feature
Upto 20 data sample storage
±0.5% ±½ digit
Upto 60°C (typical)
(Sensor temperature can go higher)
16x2 digit, backlit LCD
Li-ion 3200mAH in-built chargeable
battery
Hall Probe – GaAs (Included)
USB connectivity for data transfer
Indicate the direction of the magnetic
field
Auto-Calibration
Applications
Wide application in industry where accurate
measurements of magnetic field are required.
Laboratory experiments involving electromagnets.
Extremely convenient magnetic field measurement in
industrial environment. Can operate on battery for
long durations without recharging.
Multiple measurements can be stored and checked
later.
To check maximum and minimum fields of a surface.
452 Adarsh Nagar, Roorkee-247667 (Uttarakhand) India
email: [email protected], website: www.sesinstruments.com
TM
-40
0
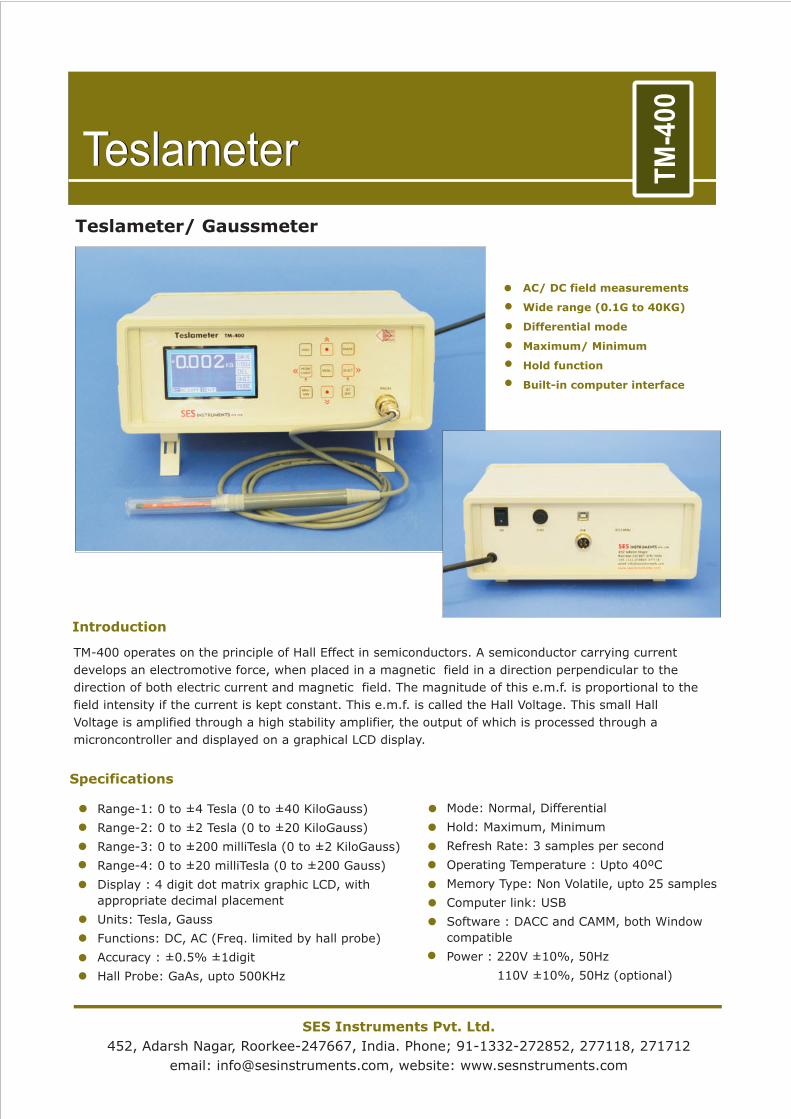
Introduction
TM-400 operates on the principle of Hall Effect in semiconductors. A semiconductor carrying current
develops an electromotive force, when placed in a magnetic field in a direction perpendicular to the
direction of both electric current and magnetic field. The magnitude of this e.m.f. is proportional to the
field intensity if the current is kept constant. This e.m.f. is called the Hall Voltage. This small Hall
Voltage is amplified through a high stability amplifier, the output of which is processed through a
microncontroller and displayed on a graphical LCD display.
Range-1: 0 to 4 Tesla (0 to 40 KiloGauss)
Range-2: 0 to Tesla (0 to 0 KiloGauss)
Range-3: 0 to esla (0 to KiloGauss)
Range- : 0 to esla (0 to Gauss)
Display : 4 digit dot matrix graphic LCD, with
appropriate decimal placement
Units: Tesla, Gauss
Functions: DC, AC (Freq. limited by hall probe)
Accuracy :
± ±
±2 ±2
±200 milliT ±2
4 ±20 milliT ±200
±0.5% ±1digit
Hall Probe: GaAs, upto 500KHz
Teslameter
Teslameter/ Gaussmeter
Teslameter
Specifications
SES Instruments Pvt. Ltd.
452, Adarsh Nagar, Roorkee-247667, India. Phone; 91-1332-272852, 277118, 271712
email: [email protected], website: www.sesnstruments.com
AC/ DC field measurements
Wide range (0.1G to 40KG)
Differential mode
Maximum/ Minimum
Hold function
Built-in computer interface
Mode: Normal, Differential
Hold: Maximum, Minimum
Refresh Rate: 3 samples per second
Operating Temperature : Upto 40ºC
Memory Type: Non Volatile, upto 25 samples
Computer link: USB
Software : DACC and CAMM, both Window
compatible
Power : 220V ±10%, 50Hz
110V ±10%, 50Hz (optional)

IntroductionSmall ovens are frequently used in class
room experiments for the determination
o f t e m p e ra t u re c o e f fi c i e n t s o f
resistances, capacitances, zener diodes,
and also for studying the leakage currents
of semiconductor devices at various
temperatures. Conventional arrangement
with oven fed from an auto transformer
and thermometer type temperature
measurement is unsatisfactory due to the
long time it takes the oven to heat or cool,
l a rge t ime constant of mercury
thermometers and difficulty in setting
a n d m a i n t a i n i n g a p a r t i c u l a r
temperature.
DescriptionThe unit is a high quality PID controller wherein the
temperatures can be set and controlled easily. The P, I
and D parameters are factory set for immediate use
however the user may adjust these for specific
applications as well as auto-tune the oven whenever
required. The steps for these are given in the user
manual. The controller can be used for both small oven,
up to 200°C or a larger oven up to 600°C. The controller
uses thermocouple as temperature sensor.
Specifications Of The Oven ControllerThe controller is designed around Autonics Temperature Controller
Model TZN4S. Although this is a very versatile piece of equipment,
below is a summary of the specifications that are relevant to the
present application.
Temperature Range : Ambient to 600°C (as per order)
Power Supply : 00-240VAC; 50/60Hz
Display Method : 7 Segment LED display [Process value
(PV):Red, Set value (SV):Green]
Input Sensor : Thermocouple (Chromel - Alumel)
Control Method : PID, PIDF, PIDS
Display Accuracy : ±0.3%
Setting Type : Setting by front push bottons
Proportional Band (P) : 0 to 100.0%
Integral Time (I) : 0 to 3600 Sec
Derivative Time (D) : 0 to 3600 Sec
Control Time (T) : 1 to 120 Sec
Sampling Time : 0.5 Sec
Setting (P, I & D) : Manual / Auto-tuned
INSTRUMENTS PVT. LTD.452 Adarsh Nagar, Roorkee-247667 (Uttarakhand) INDIAPh.: +91-1332-272852, 277118, 271712 • Email: [email protected] • Web: www.sesinstruments.com
SES
ISO 9001:2015
PID-TZPID-TZ
PID Controlled Oven PID Controlled Oven
Above is 200° oven which is supplied with this unit. 600°c oven is also available on order.


IntroductionThe bed is of a heavy casting, thoroughly
aged and machined, is �tted with leveling
screws. On the dovetail guide ways slides
the horizontal carriage which can be
clamped at any position by means of a
thumbscrew. A second sliding carriage
slides along a gunmetal vertical pillar �tted
on the horizontal carriage. The slow
motion guide bars are made of sturdy
material and the motion is very smooth.
For reading convenience, screw gauge
arrangement is provided with a large dial.
Microscope Tubeinclinable in any angle. True vertical and
horizontal positions marked focusing.
Guide WaysThe guide ways over which slides the
carriage is made of gunmetal and this
makes the instrument Rust Proof, because
this is the part which is directly exposed to
the weather.
Scale and VerniersMade of lifetime Stainless Steel.
Optics(i) True achromatic objective with 7.5
cm. focussing distance from object
(ii) 10X Ramsden Eyepiece with �ne
cross wire
Scale and Verniers(i) Horizontal scale : 18cm divided at
1mm interval
(ii) Vertical scale : 16cm divided at 1mm
interval
(iii) Screw gauge dial : 100 divisions with
a least count of 0.01mm
INSTRUMENTS PVT. LTD.
452 Adarsh Nagar, Roorkee-247667 (Uttarakhand) INDIAPh.: +91-1332-272852, 277118, 271712 • Email: [email protected] • Web: www.sesinstruments.com
SES
ISO 9001:2015
TVM-02TVM-02
Traveling MicroscopeTraveling Microscope

IntroductionThe bed is of a heavy casting, thoroughly aged and machined, is �tted with leveling screws. On the dovetailed guide ways slide the carriage which can be clamped at any position by means of a thumbscrew. A sliding carriage slides along a gunmetal Vertical pillar �tted on the horizontal carriage. The slow motion guide bars are made of sturdy material and the motion is very smooth. For reading convenience, screw gauge arrangement is provided with a large dial.
Microscope Tubeinclinable in any angle. True vertical and horizontal positions marked focusing.
Guide Ways
The guide ways over which slides the carriage is made of gunmetal and this makes the instrument Rust Proof, because this is the part which is directly exposed to the weather.
Scale and VerniersMade of lifetime Stainless Steel.
OpticsTrue achromatic objective with 7.5 cm. focusing distance from object 10X Ramsden Eyepiece with �ne cross wire is provided.
Scale20 cm. Horizontally, 15 cm. Vertically and 6 cm Lateral.
Scale and Verniers(I) horizontal scale : 20cm divided at 1mm
interval (Screw gauge dial 100 divisions with a least count of 0.01 mm)
(ii) Vertical scale : 15cm divided at 1mm interval(iii) Lateral scale : 6cm divided at 1mm interval
Scale and Verniers
Horizontal scale : 0.001 cm.
Lateral Scale : 0.001 cm.
Vertical scale : 0.001 cm.
INSTRUMENTS PVT. LTD.
452 Adarsh Nagar, Roorkee-247667 (Uttarakhand) INDIAPh.: +91-1332-272852, 277118, 271712 • Email: [email protected] • Web: www.sesinstruments.com
SES
ISO 9001:2015
TVM-03TVM-03
Traveling MicroscopeTraveling Microscope

Speci�cations
Output voltage : + 12 V, - 12 V, + 5 V, - 5 V �xed
Current : 300 mA (each supply)
Line Regulation : ± 0.05 % for 10 % variation of mains voltage.
Load Regulation : ± 0.1% for a full load of 300 mA
Protection : Thermal and overcurrent.
Dimensions : 210 m.m. X 180 m.m. X 100 m.m.
Weight : 2.25 Kg
Introduction
PS-12 is general purpose power supply consists of four
independent �xed voltage regulated sources viz. +12
V, -12 V, +5 V and -5 V referred to a common ground.
The current rating for each is speci�ed at 300 mA,
although it is possible to exceed this limit safely when
all four sources are not operating simultaneously. The
compact power supply unit is well suited for any
general laboratory which uses linear and digital
circuits and lC's. At the same time the excellent
performance of the 3- terminal regulators enables the
supplies to be used equally satisfactorily for
sophisticated inst-rumentation applications. The
built-in protection of the regulator in the form of over
current and safe area shutdown ensure continued
fault free operation of the unit without any
maintenance.
INSTRUMENTS PVT. LTD.
452 Adarsh Nagar, Roorkee-247667 (Uttarakhand) INDIAPh.: +91-1332-272852, 277118, 271712 • Email: [email protected] • Web: www.sesinstruments.com
SES
ISO 9001:2015
PS-12PS-12
IC Regulated Power SupplyIC Regulated Power Supply

Speci�cations
Waveforms : Square/ Sine/ Triangular (switch selectable)
Frequency : 10 Hz - 2 MHz in �ve ranges
Amplitude : Square 0-3V (p-p)
Triangular 0-3V (p-p)
Sine 0-3V (p-p)
Output Impedance : 50 W
Frequency Readout : 4-digit, counter based, automatic decimal point
Power Supply : 220V±10%, 50 Hz
� 4-digit counter based frequency display-Maximum error ONE LSB
� Square, sine and triangular output upto 2 MHZ
� IC based circuit - high stability, low distortion
� Regulated power supply
INSTRUMENTS PVT. LTD.
452 Adarsh Nagar, Roorkee-247667 (Uttarakhand) INDIAPh.: +91-1332-272852, 277118, 271712 • Email: [email protected] • Web: www.sesinstruments.com
SES
ISO 9001:2015
FG-01FG-01Function GeneratorFunction Generator
IntroductionThis is an economically priced signal source for a wide variety of applications in electronics, communication and control systems laboratory. The IC used is a high frequency function generator that produces low distortion sine, triangular, sawtooth and square waveforms from frequencies less than a Hz. To 20MHz. A minimal of external components are needed which make the unit very reliable and robust. The desired output waveform is selected by logic control and may therefore be done electronically as well.
Basic principal of function generation used is the relaxation oscillation with periodic charging and discharging of a capacitor through constant current source. The charging/discharging currents are accurately controllable and the associated circuits support high frequencies very well. A sine shaping circuit coverts the triangular waveform to sine wave of constant amplitude. The sine wave is useful for frequency response studies of ampli�ers, �lters and other electrical systems, while the square wave �nds applications in transient response studies. Triangular wave is a standard input signal for the study of steady state error in feedback control systems. All power supplies are IC regulated.

INSTRUMENTS PVT. LTD.
452 Adarsh Nagar, Roorkee-247667 (Uttarakhand) INDIAPh.: +91-1332-272852, 277118, 271712 • Email: [email protected] • Web: www.sesinstruments.com
SES
ISO 9001:2015
JDS-6600JDS-6600
DDS Function GeneratorDDS Function Generator
� 2.4" Color TFT display� 2.4" Color TFT display
� Precise stable, low distortion output
� Dual channel output
� Storage Feature
� Counter function
� USB interface
� A ritary waveform editing function
PHOTO N/A
15MHZ Digital Control Dual-channel DDS Function Signal Generator/frequency meter15MHZ Digital Control Dual-channel DDS Function Signal Generator/frequency meter15MHZ Digital Control Dual-channel DDS Function Signal Generator/frequency meter
IntroductionThis is a dual�channel high precision multifunctional signal
generator. It adopts large scale of FPGA integrated circuits,
high�speed MCU microprocessor and high precision oscillator,
which make the signals highly stable. It contains two independent
dual�channel DDS signal and Tl'L level output and is capable of
generating sine/triangle/square/sawtooth/pulse wave, white noise,
etc. This is a multifunction instrument capable of generating signal,
scanning waveform and measuring various electrical parameters.
With frequency range of upto 15MHz, it has built-in functions
including amplitude modulation and frequency sweep function etc.
Output signal amplitude and frequency are continuously displayed.
It's a great testing/ measuring instrument for electronics engineers,
electronic laboratory, teaching and research.

INSTRUMENTS PVT. LTD.
452 Adarsh Nagar, Roorkee-247667 (Uttarakhand) INDIAPh.: +91-1332-272852, 277118, 271712 • Email: [email protected] • Web: www.sesinstruments.com
SES
ISO 9001:2015
JDS-6600JDS-6600
DDS Function GeneratorDDS Function Generator
Speci�cations
Frequency Characteristics
Sine frequency range : 15MHz
Square/Triangle frequency range : 15MHz
Pulse frequency range : 6MHz
Square rise time : 25nS
Waveform Characteristics
Waveform : Sine, Square, Triangle,
Pulse), Partial Sine,
DC level, Half-wave,
Full-Wave, Positive
Ramp, Negative
Ramp, and many
other user de�ned
waveforms
Waveform length : 2048 points
Waveform sampling rate : 266 MSamples/s
Waveform vertical resolution : 14 bits
External Measurement Function
Frequency meter function : 1Hz-100MHz
Counter function : 0-4294967295 counts
Input signal voltage range : 2Vpp-20Vpp
Pulse width measurement : 0.01us (resolution),
Period measurement : 20s (max measuring time)
General technical parameters
Display : 2.4 inch TFT color LCD
Interface : USB to serial interface
Communication speed : 115200bps
Communication protocol : Command-line mode, Open protocol
Power supply voltage : 5V±0.5V DC
Manufacturing process : Surface-mount technology, FPGA design, high reliability, long service life
Environmental conditions
Temperature : 0-40C, Humidity:<80%


INSTRUMENTS PVT. LTD.
452 Adarsh Nagar, Roorkee-247667 (Uttarakhand) INDIAPh.: +91-1332-272852, 277118, 271712 • Email: [email protected] • Web: www.sesinstruments.com
SES
ISO 9001:2015
MFM-01MFM-01
Magnetic Field Measurement Appartus (Biot Savartʼs Law Set-up)Magnetic Field Measurement Appartus (Biot Savartʼs Law Set-up)
The following studies Biot Savart�s Law The following studies Biot Savart�s Law can be carried out with the set-up:can be carried out with the set-up:
LegendLegend
Introduction
The experiment consists of two coils,
Constant Current Power Supply and
Gaussmeter. The Gaussmeter probe is
mounted on a rail with a scale. It can move
smoothly and precisely for measurement of
magnetic �eld along the centre of the coils.
The following studies Biot Savart�s Law can be carried out with the set-up:
1. Study of magnetic �eld due to one coil
and calculation of its diameter.
2. Study of Principal of super-imposition of
magnetic �eld due to 2 coils by keeping the
distance between the coils at a, >a and <a,
where a is the radius of the coil.
Legend
Line 1 : Magnetic Pro�le when the
distance between the coils is
>a
Line 2 : Magnetic Pro�le when the
distance between coils is =a
Line 3 : Magnetic Pro�le when the
distance between coils is <a
Superimposition overlaps
completely
Apparatus consists of the followingApparatus consists of the followingApparatus consists of the following
1. Digital Gaussmeter
Range : 0-200
Resolution : 0.1G
Accuracy : ± 0.5%
Display : 3½ digit 7 segment LED with
autopolarity.
2. Two Coil
Diameter : 200mm
Number of turn : 1000
3. Constant Current Power Supply
Current : 0-0.5A Smoothly adjustable
Line Regulator : ± 0.2%for 10% mains variation.
Load Regulator : ± 0.2% for 0 to full load
Display : 3½ digit 7 Segment LED Display
Protection : Against overload/ short current.
The 2 coils are mounted on platform one coil is �xed and other coil move
smoothly on a rail along with the axis of the coils.
The experiment is complete in itself.

INSTRUMENTS PVT. LTD.452 Adarsh Nagar, Roorkee-247667 (Uttarakhand) INDIAPh.: +91-1332-272852, 277118, 271712 • Email: [email protected] • Web: www.sesinstruments.com
SES
ISO 9001:2015
DEC-01DEC-01Study Dielectric ConstantStudy Dielectric Constant
Dielectric or electrical insulating material are understood as the material in which electrostic field can persist for long times. Layers of such substance are c o m m o n l y i n s e r t e d i n t o capacitors to improve their perfomance, and the term dielectric refers specifically to this application.
An electric field polarizes the m o l e c u l e s o f d i e l e c t r i c producing concentrations of charge on its surface that create an e lect r i c fie ld opposed ( a n t i p a ra l l e l ) t o t h a t o f capacitor. This reduces the electric potential. Considered in reverse, this means that, with a dielectric, a given electric potential causes the capacitor to accumulate a larger charge.
Applications
Beside the common and well known application of capacitors in electrical and electronic circuits, the capacitors with an exposed and porous dielectric can be used to measure humidity in air.
A huge leap in the research on dielectric (ferroelectric materials) came in 1950’s, leading to the wide spread use of Barium Titanate (BaTiO -Perovskite Structure) based ceramics 3
Study of Dielectric Constant and Curie Temperature of Ferroelectric Ceramics
in capacitor applications and piezoelectric transducer devices. Since then, many other ferroelectric ceramics have been developed and utilized for variety of applications: various type of capacitors, non volatile memories in computers, etc.
Perovskite Structure
Perovskite is family name of a group of materials and the mineral name of calcium titanate (CaTiO ) having a structure 3
of the type (Fig 1)ABO3
A practical advantage of perovskite structure is that many different cations can be substituted on both A and B sites without changing the over all structure. Even though two cations are compatible in solution, their behaviour can be radically different when apart from each other. Thus it is possible to manipulate material’s properties such as Curie temperature or dielectric constant with only a small substitution of given cation.
All ferroelectric material have a transition called the Curie point (T ). At T>T , the crystal does not exhibit ferroelectricity, c c
while for T<T it is ferroelectric. If there is more than one c
ferroelectric phase, the temperature at which the crystal transforms one phase to another is called transition temperature. Near the Curie temperature point or transition temperatures, the thermodynamic properties including dielectric, elastic, optical and thermal constants show an anomalous behavior.
Fig.2 shows the variation of dielectric constant (e) with temperature for Lanthanum doped Lead Zirconate Titanate ( ) ceramic, which is cooled from its paraelectric cubic PLZTphase to ferroelectric rhombohedral phase.
Fig 1 Perovskite ABO structure with the A and B cations on the corner 3
and body centre positions, respectively. Three oxygen anions per unit cell occupy the faces and form octahedra surrounding the B-site.

rates, which enhances the effectiveness of the controller.
4. Main Units
The Set-up consists of two units housed in the same cabinet.
(i) Oven Controller
Platinum (A class) has been used for sensing the RTDtemperature . A Wheatstone br idge and an instrumentation amplifier are used for signal conditioning. Feedback circuit ensures offset and linearity trimming and a fast accurate control of the oven temperature.
Specifications
Temperature Range : Ambient to 200°C
Display : 3½ digit, 7 segment with LEDautopolarity & decimal indication
Resolution : 0.1°C
Accuracy : ±0.5°C (typical)
Stability : ±0.1°C
Power : 150W
(ii) Digital Capacitance Meter
This a compact direct reading Instrument for the measurement of capacitance of the sample.
Specifications
Range : 50-6000 pf
Resolution : 1pf
Display : 3½ digit, 7 segment LED
Typical results obtained with the above set-up are as shown in the graph
INSTRUMENTS PVT. LTD.452 Adarsh Nagar, Roorkee-247667 (Uttarakhand) INDIAPh.: +91-1332-272852, 277118, 271712 • Email: [email protected] • Web: www.sesinstruments.com
SES
ISO 9001:2015
Page-2Page-2
DEC-01DEC-01Study Dielectric ConstantStudy Dielectric Constant
Description of the Experimental Set-up
1. Probes Arrangement
It has two individually spring loaded probes. The probes arrangement is mounted in a suitable stand, which also holds the sample plate. To ensure the correct measurement of sample temperature, the is RTDembedded in the sample plate just below the sample. This stand also serves as the lid of temperature controlled oven. Proper leads are provided for connection to Capacitance Meter and Temperature Controller.
2. Sample
Barium Titanate (BaTiO )3
3. Oven
This is a high quality temperature controlled oven. The oven has been designed for fast heating and cooling

Frequency Dependence of Dielectric Constant
FD
D-0
1
Introduction
Frequency Dependence of Dielectric Constant
Capacitance measurement from 1-50kHz
Dedicated Schering Bridge with built-in oscillator
Computation of dielectric constant and loss factor
Samples of Barium Titanate, MLCC and conventional capacitor
Temperature variation studies with additional equipmentoven and controller (optional)
Barium Titanate, BaTiO , is a well known and widely investigated dielectric material. It is
mainly used in capacitors due to its high dielectric constant. The dielectric properties of
BaTiO are controlled by purity and microstructure which are dependent on the methods
of preparation. The ability of the dielectric material to store energy is attributed to the
polarization which can result in an increase in capacitance. It is well known that dielectric
properties of every solid are very sensitive to the local electric field distribution in the
sample. The temperature and frequency dependence of dielectric constant and loss can
therefore give useful information about structure changes, transport mechanism and
defect behaviour of a solid.
The present experiment is designed to study the variation of capacitance and dielectric
losses as a function of frequency and hence compute the change in dielectric constant,
and loss factor, tan with frequency. While the behaviour of Barium Titanate is distinctly
3
3
e d
Essential accessory a CRO, for all the experiments

frequency dependent, the performance of a standard multi layer ceramic capacitor
(MLCC) and conventional ceramic capacitors are not as prominent. A comparison of
these three therefore is an interesting part of the study.
In addition, an optional experiment to study the variation of dielectric constant with
temperature at different frequencies is also possible with the help of our PID controlled
oven, PID-TZ
Experiments
Study of dielectric constant variation with
frequency of a Barium Titanate sample
Study of loss factor with frequency of a
Barium Titanate sample
Study of capacitance variation with
frequency of an MLCC capacitor
Study of capacitance variation with
frequency of a conventional ceramic cap.
Typical result for Barium Titanate is shown in Fig 1.
Fig 1 vs frequency of Barium Titanate samplee
Optional Experiment (Using an additional PID-TZ)
Study of Dielectric Constant of Barium
Titanate as a function of temperature
(curie point experiment) and its variation
with frequency
Typical results are shown in Fig 2.
Fig 2 vs temperature at various frequencies ofBarium Titanate samplee
452 Adarsh Nagar, Roorkee-247667 (UK) India, Ph.: +91-1332-272852, 277118, Fax 271712
Website: www.sesinstruments.com Email: [email protected]; [email protected]

Speci�cation
Range : 0pf � 50mf
Resolution : 0.01pf
Display : 16 x 2 LCD display with back light
Accuracy : Better than 1%
Zero Setting : Push button zero setting
Introduction
Dielectric or electrical insulating materials are the substances in
which electrostatic �eld can persist for long times. When a
dielectric is placed between the plates of a capacitor and the
capacitor is charged, the electric �eld between the plates
polarizes the molecules of the dielectric. This produces
concentration of charge on its surface that creates an electric
�eld which is antiparallel to the original �eld (which has
polarized the dielectric). This reduces the electric potential
difference between the plates. Considered in reverse, this means
that, with a dielectric between the plates of a capacitor, it can
hold a larger charge. The extent of this effect depends on the
dipole polarizability of molecules of the dielectric, which in turn
determines the dielectric constant of the material.
The method for determination of dielectric constants of
l iquids consists in the successive measurement of
capacitance, first in a vacuum, and then when the capacitor is
immersed in the liquid under investigation. A cylindrical
capacitor has been used here.
Dielectric measurement of non-conducting liquidsDielectric measurement of non-conducting liquidsDielectric measurement of non-conducting liquids
� High Precision Smooth movement� Accurate measurement� Easy change of sample�
Description of the Experiment Set-up
1. Probes Arrangement
It consists of two polished brass cylinders fixed coaxially with
insulating gaskets at the two ends. These gaskets have holes,
in the lower one for allowing the experimental liquid to flow
in between the cylinders, and in the upper one for
communication with the atmosphere. This arrangement is
mounted vertically and can be moved up and down with a
rack-and-pinion set-up. It is put in a vessel containing the
experimental liquid. The outer surface of the outer cylinder
has a vertical scale to measure the height of the liquid with in
the cylinders. Proper leads are provided for connection to the
Capacitance Meter.
Sample : Carbon Tetra Chloride
2. Digital Capacitance Meter
This is a compact direct reading micro-controller based
high resolution instrument for the measurement of
capacitance of the sample.
DCL-01DCL-01Dielectric Measurement SetupDielectric Measurement Setup
INSTRUMENTS PVT. LTD.
452 Adarsh Nagar, Roorkee-247667 (Uttarakhand) INDIAPh.: +91-1332-272852, 277118, 271712 • Email: [email protected] • Web: www.sesinstruments.com
SES
ISO 9001:2015

INSTRUMENTS PVT. LTD.452 Adarsh Nagar, Roorkee-247667 (Uttarakhand) INDIAPh.: +91-1332-272852, 277118, 271712 • Email: [email protected] • Web: www.sesinstruments.com
SES
ISO 9001:2015
DSL-01DSL-01Dielectric Constant of Solids & LiquidsDielectric Constant of Solids & Liquids
· High Precision
· Smooth movement
· Accurate measurement
· Easy change of sampleIntroduction
Dielectric or electrical insulating materials are the substances in which electrostatic field can persist for long times. When a dielectric is placed between the plates of a capacitor and the capacitor is charged, the electric field between the plates polarizes the molecules of the dielectric. This produces concentration of charge on its surface that creates an electric field which is antiparallel to the original field (which has polarized the dielectric). This reduces the electric potential difference between the plates. Considered in reverse, this means that, with a dielectric between the plates of a capacitor, it can hold a larger charge. The extent of this effect depends on the dipole polarizability of molecules of the dielectric, which in turn determines the dielectric constant of the material.
The method for determination of dielectric constant of liquids consist of the successive measurement of capacitance, first outside liquid and then when the capacitor is immersed in the liquid under investigation. A cylindrical capacitor has been used for liquid samples and different size parallel plate capacitors for solid samples.
1. Probes Arrangement
Three probe arrangements are provided with the setup. For solids, two different size arrangements are given, one for 10mm sample pellets and the other for 50mm sample pellets. Both consist of parallel plates set in insulated medium. Sturdy parallel wire lead is used to minimize external disturbance.
For liquids a separate arrangement is provided consisting of two polished brass cylinders fixed coaxially with insulating gaskets at the two ends. These gaskets have holes, in the lower one for allowing the experimental liquid to flow in between the cylinders, and in the upper one for communication with the atmosphere. This arrangement is mounted vertically and can be moved up and down with a rack-and-pinion set-up. It is put in a vessel containing the experimental liquid. The outer surface of the outer cylinder
Determination of Dielectric measurement of different materials
has a vertical scale to measure the height of the liquid within the cylinders. Proper leads are provided for connection to the Capacitance Meter.
2. SamplesGlass, Bakelite, Teflon, PZT Sample (Lead Titanate), Carbon Tetrachloride Liquid
3. Digital Capacitance MeterThis is a compact direct reading microcontroller based high resolution instrument for the measurement of capacitance of the sample.
Specifications
Range : 0pf – 50mf
Resolution : 0.01pf
Display : 16 x 2 LCD display with back light
Accuracy : Better than 1%
Zero Setting : Push button zero setting

Speci�cation
Temperature Range Ambient to 600° C
Power Supply 100-240VAC; 50/60Hz
Display Method 7 Segment LED display [Processing value (PV)
:Red, Setting value (SV) :Green]
Input Sensor Thermocouple (Chromel - Alumel)
Control Method PID, ON/OFF Control, P, PI, PD, PIDF, PIDS
Display Accuracy ± 0.3%
Setting Type Setting by front push bottons
Proportional Band (P) 0 to 100.0%
Integral Time (I) 0 to 3600 Sec
Derivative Time (D) 0 to 3600 Sec
Sampling Time 0 to 120 Sec
Sampling Time 0.5 Sec
Setting (P, I & D) Manual / Auto
IntroductionBeside the common and well known
application of capacitors in electrical
and electronic circuits, the capacitors
with an exposed and porous dielectric
can be used to measure humidity in air.
A huge leap in the research on
dielectrics (ferroelectric materials)
came in 1950's, leading to the wide
spread use of ceramics in capacitor
appl icat ions and p iezoelectr ic
transducer devices. Since then, many
other ferroelectric ceramics have been
developed and utilized for a variety of
app l i ca t ions : va r ious t ype o f
capacitors, nonvolatile memories in
computers, etc.
Measurement of dielectric constant at high temperature (ambient to 600°C)
Description of the Experiment Set-up1. Probes Arrangement
It has two individually spring loaded probes. The
probes arrangement is mounted in a suitable stand of
high quality alumina which also holds the sample
plate. To ensure the correct measurement of sample
temperature, the thermocouple junction is embedded
in the sample plate just below the sample. This stand
also serves as the lid of temperature controlled oven.
Proper leads are provided for connection to
Capacitance Meter and Temperature Controller.
2. Sample
Modi�ed lead titanate (test sample)
3. Oven
This is a high quality temperature controlled oven. The
heating element used is a high grade Kanthal-D. It is
cover. Further the top portion is also suitably covered
to meet the safety standard. The oven has been
designed for fast heating and cooling rates, which
enhances the effectiveness of the controller.
INSTRUMENTS PVT. LTD.
452 Adarsh Nagar, Roorkee-247667 (Uttarakhand) INDIAPh.: +91-1332-272852, 277118, 271712 • Email: [email protected] • Web: www.sesinstruments.com
SES
ISO 9001:2015
DEC-600DEC-600Dielectric Measurement SetupDielectric Measurement Setup
4. Main Units
The Set-up consists of two units housed in the same cabinet.
(i) Temperature ControllerIt is a high quality PID controller where the temperatures can be set and controlled easily. P, I and D can be adjusted by the user and can also be kept on Auto-tuning.

(ii) Digital Capacitance Meter
It is a handheld instrument, mounted in a cabinet for convenience, It uses CMOS double level A/D convertor that is automatic in
zeroing and polar selection.
Features
LCD Display
Data - Hold Switch (HOLD)
Cx+, Cx - Input Jack
Back Light Button Switch
Rotary Switch: Use this switch to select functions and ranges
Wide measuring range, covering 9 measuring sections from 0.1pf to 20,000µF that includes nominal value of any
capacitance
Power: One 9V battery
Speci�cation Range Accuracy De�nition Testing frequence
200pF ±0.5% 0.1pF 800Hz
2000pF ±0.5% 1pF 800Hz
20nF ±0.5% 10pF 800Hz
200nF ±0.5% 0.1pF 800Hz
2uF ±0.5% 1nF 800Hz
20uF ±0.5% 10nF 80Hz
200uF ±0. 5% 0.1µF 8Hz
2000uF ±2. 5% 1µF 8Hz
INSTRUMENTS PVT. LTD.
452 Adarsh Nagar, Roorkee-247667 (Uttarakhand) INDIAPh.: +91-1332-272852, 277118, 271712 • Email: [email protected] • Web: www.sesinstruments.com
SES
ISO 9001:2015
Page-2Page-2
DEC-600DEC-600Dielectric Measurement SetupDielectric Measurement Setup

Introduction
The Zeeman effect is the
splitting of spectral lines of
atoms when they are placed in
a magnetic �eld. It exhibits
space quantization and is one
of the few fundamental atomic
physics experiments which can
be performed in a teaching
laboratory.
Description of the Experimental Set-up
Experimentental Set-up for Zeeman
Experiment
The set-up consists of the following:
1. High Resolution Fabry Perot Etalon, FP-01
2. Mercury Discharge Tube, MT-01 (Low
Pressure Mercury Discharge Tube)
3. Power Supply for MT-01, ZPS-02 (High
Voltage Power Supply for Discharge Tube)
4. Narrow Band Interference Filter, IF-01
� Central Wave Length: 546nm
� Tmax: 74%
� HBW: 8nm
5. Polarizer with lens, PL-01
6. Optical Bench: OB-01
7. CCD Camera: CAM-700 (High Resolution
CCD Camera)
8. Telescope with Focussing Lens: FL-01
9. Monitor 17�: TV-17
10. Electromagnet, EMU-50T (Speci�cations as per datasheet)
11. Constant Current Power Supply, DPS-50 (Speci�cations as per datasheet)
12. Digital Gaussmeter, DGM-
102 (Speci�cations as per
datasheet)
The experimental set-up is
complete in all respect.
Result
The interference pattern is in
the form of circular rings. These
are split when the magnetic
�eld is switched on. The amount
of splitting depends on the
external magnetic �eld, charge
to mass ratio of electron and
Lande �s g-factors of the
e l e c t ron i c ene rgy l e ve l s
involved in the transition. These
INSTRUMENTS PVT. LTD.
452 Adarsh Nagar, Roorkee-247667 (Uttarakhand) INDIAPh.: +91-1332-272852, 277118, 271712 • Email: [email protected] • Web: www.sesinstruments.com
SES
ISO 9001:2015
ZEX-01ZEX-01
Zeeman Effect ExperimentZeeman Effect Experiment

INSTRUMENTS PVT. LTD.452 Adarsh Nagar, Roorkee-247667 (Uttarakhand) INDIAPh.: +91-1332-272852, 277118, 271712 • Email: [email protected] • Web: www.sesinstruments.com
SES
ISO 9001:2015
MOD-01MOD-01
Millikans Oil Drop ExperimentMillikans Oil Drop Experiment
Introduction This experiment aims at measuring the charge of an electron and is perhaps the most basic of all atomic physics or modern physics laboratory experiments. It won Millikan the Nobal Prize in the year 1923.
The experiment depends on the ability to control, -14measure and balance very small force of the order 10 N.
The set-up consists of two horizontal parallel plates separated by about 5mm. The upper plate has a small hole through which microscopic oil droplets are sprayed in between the two plates with the help of an atomizer which is like a common perfume sprayer. These droplets get charged due to the frictional force during spraying. The free fall of these droplets in the space between the plates is observed in the gravitational field. A measurement of the velocity of fall along with the use of Stokes law leads to the calculation of the mass of the droplets and their radii if the oil density is known. These
-15 -6are of the order of 10 kg and 10 m respectively. By applying a potential difference between the plates, a uniform electric field is produced in the space between the plates. A measurement of the velocity of the negatively charged droplets rising in the electric field allows a calculation of the electric force on the droplets and hence the charge carried by them. In the experiment the droplets which rise and fall slowly are selected as they are expected to have a fairly small charge. These droplets are made to rise and fall several times. The repetitions of measurement of the velocities of rise and fall reduce the random error of their means. A fairly large number of droplets are observed and their charges are calculated.
The analysis of the data on the total charge carried by the droplets shows that these total charges are integral multiples of a certain smallest charge which is the charge of an electron. This result also shows that the charge is quantized .The measurement of the charge on the electron can lead to the calculation of Avogadro's number. The charge F (the Faraday) required to electro-deposit one gram equivalent of an element on an electrode during electrolysis is equal to the charge of the electron multiplied by the number of molecules in a mole. The
7 Faraday has been found to be F = 9.625 10 coulombs ´per kilogram equivalent weight. Hence Avogadro's number N = F/e.
ApparatusThe present set-up consists of
1. A oil drop chamber mounted on top of the panel. It has(i) A pair of horizontal parallel plate
electrodes separated by about 5 mm thick ebonite ring with a hole for viewing the oil droplets.
(ii) The upper plate has a small hole in its centre for the admission of the droplets which are produces by spraying oil with an atomizer.
(iii) A device to illuminate the space between the plate electrodes.
2. Three levelling screws at the base of the panel

INSTRUMENTS PVT. LTD.452 Adarsh Nagar, Roorkee-247667 (Uttarakhand) INDIAPh.: +91-1332-272852, 277118, 271712 • Email: [email protected] • Web: www.sesinstruments.com
SES
ISO 9001:2015
MOD-01MOD-01
Millikans Oil Drop ExperimentMillikans Oil Drop Experiment Page-2Page-2
to make the parallel plate electrodes perfectly horizontal (perpendicular to the gravitational field) and a water-level placed on top of the panel to check it.
3. A microscope with CCD camera head to view and transmit image of oil droplets between the plate electrodes to the monitor.
4. A power pack to supply continuously variable voltage in the range 0 – 800 V to the upper plate electrode when the electric field is to be created between the plates. The lower plate is permanently grounded.
5. A digital voltmeter to measure the potential applied to the upper plate.
6. A 'Time Meter' to display the time for which the oil droplet is allowed to move.
7. A timing device to measure time interval between the passage of droplets through preset points. There are two keys to operate this device. Pressing the 'Clear' key, wipes out the time information. This is like a reset key. The time meter now reads '00.0' sec. Pressing the 'Start/Stop' key starts the timing device. Pressing it again stops the device. The elapsed time can be read on the meter.
8. A monitor with graduated screen. The horizontal lines on the monitor screen help in setting the distance through which the droplets move.
9. An atomizer to spray droplets.
10. A thermometer to measure the room temperature.
Method
Time for free-fall of the droplets under gravity between the preset points is measured to obtain the velocity for free-fall. For observing the effect of the electric field on the charge carried by the droplets, there are two alternatives. In the Dynamic method, the velocity for the vertical upword motion is measured for a fixed potential
difference. In the Static method, the potential difference between the plates is adjusted to balance the droplets.
The result of this unit are within 5% of the standard value.
The experiment is complete in all respect.

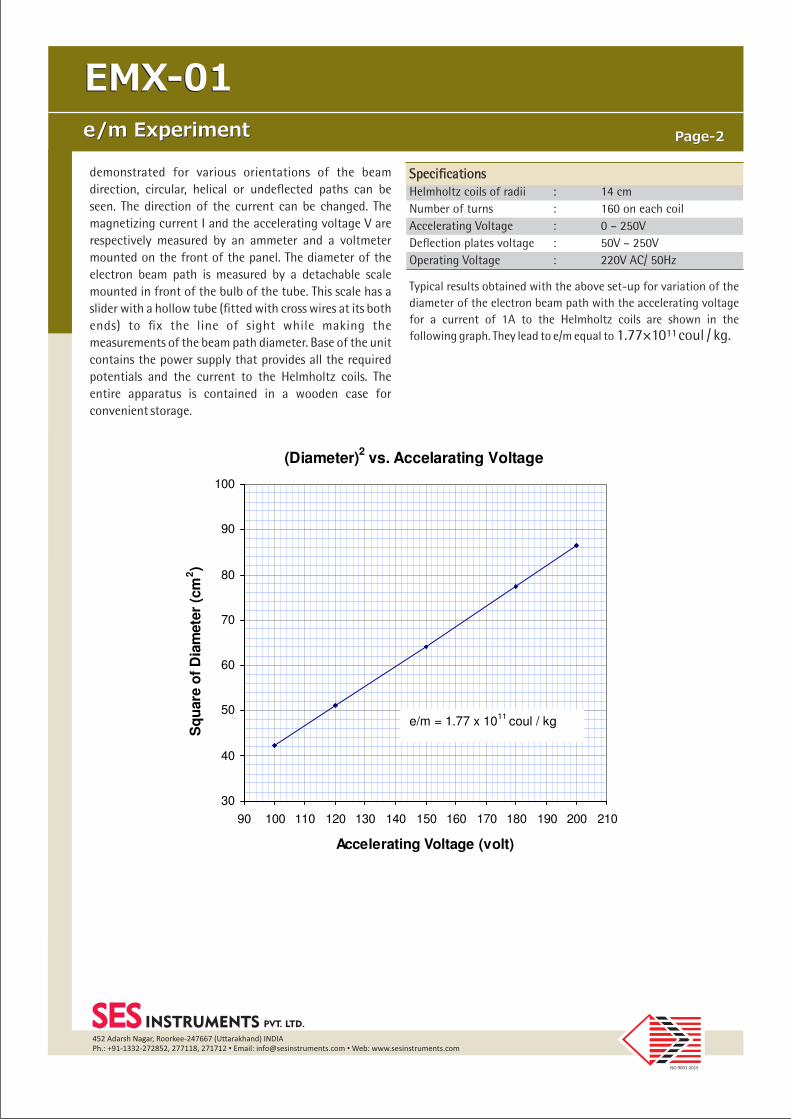
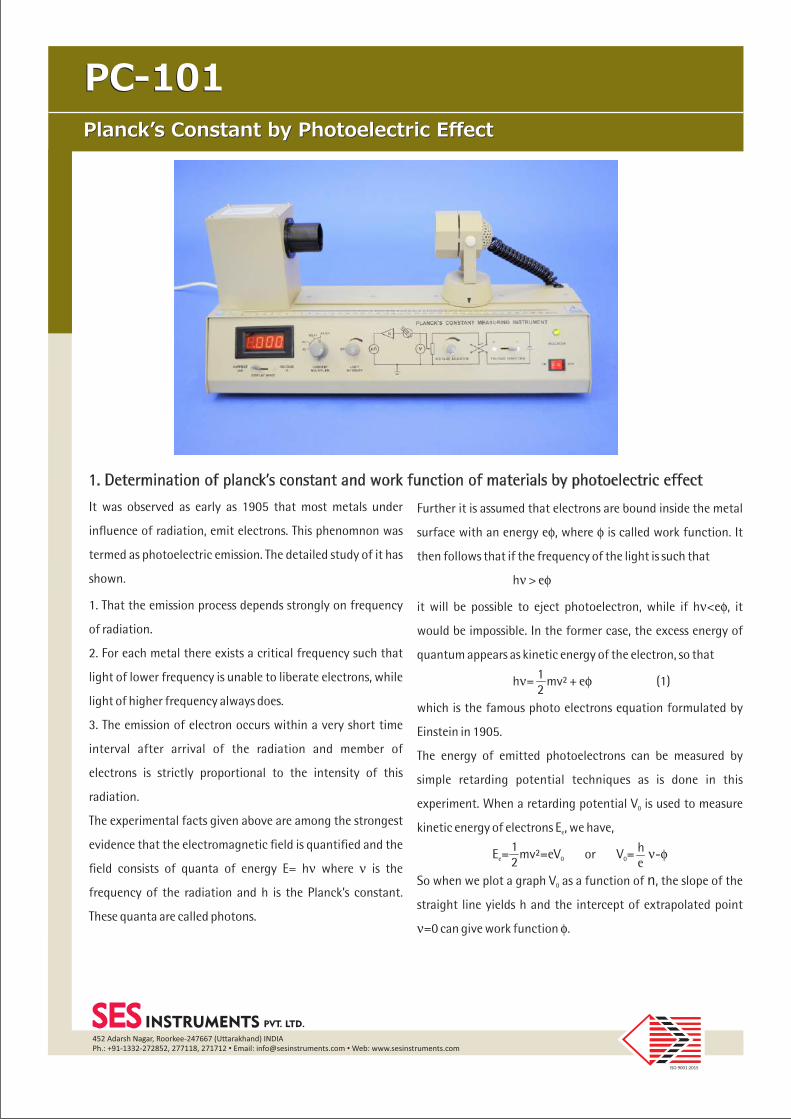


INSTRUMENTS PVT. LTD.
452 Adarsh Nagar, Roorkee-247667 (Uttarakhand) INDIAPh.: +91-1332-272852, 277118, 271712 • Email: [email protected] • Web: www.sesinstruments.com
SES
ISO 9001:2015
FH-3001FH-3001
Frank Hertz ExperimentFrank Hertz Experiment
IntroductionFrom the early spectroscopic work it is clear that
atoms emitted radiation at discrete frequencies;
from Bohr�s model, the frequency of the radiation v
is related to the change of energy levels through
DE=hn.
It is then to be expected that transfer of energy to
atomic electrons by any mechanism should always
be in discrete amounts. One such mechanism of
energy transfer is through inelastic scattering of
low-energy electrons.
Frank and Hertz in 1914 set out to verify these
considerations.
(i) lt is possible to excite atoms by low energy
electron bombardment.
(ii) The energy transferred from electrons to the
atoms always had discrete values.
(iii) The values so obtained for the energy levels were
in agreement with spectroscopic results.
Thus the existence of atomic energy levels put
forward by Bohr can be proved directly. It is a very
important experiment and can be performed in any
college or University level laboratory.
Operating PrincipleThe Frank-Hertz tube in this instrument is a tetrode �lled with the v a p o u r o f t h e experimental substance. Fig.1 indicates the basic scheme of experiment.The electrons emitted by � l a m e n t c a n b e acce lerated by the potential V between G K2
the cathode and the grid G . The grid G, helps 2
in minimising space charge effects. The grids are wire mesh and allow the electrons to pass through. The plate A is maintained at a potential slightly negative with respect to the grid G . This helps in making the dips in the plate current 2
more prominent. ln this experiment, the electron current is measured as a function of the voltage V . As the voltage increases, the electron G K2
energy goes up and so the electron can overcome the retarding potential V to reach the plate A. This gives rise to a current in the G A2
ammeter, which initially increases. As the voltage further increases, the electron energy reaches the threshold value to excite the atom in its �rst allowed excited state. In doing so, the electrons loose energy and therefore the number of electrons reaching the plate decreases. This decrease is proportional to the number of inelastic collisions that have occured. When the V is G K2

INSTRUMENTS PVT. LTD.
452 Adarsh Nagar, Roorkee-247667 (Uttarakhand) INDIAPh.: +91-1332-272852, 277118, 271712 • Email: [email protected] • Web: www.sesinstruments.com
SES
ISO 9001:2015
FH-3001FH-3001
Frank Hertz ExperimentFrank Hertz Experiment Page-2Page-2
Fig. 3 Plot of Beam Current Vs. Accelarting Voltagein Frank Hertz Experiment, FH-3001
Fig. 4 Oscilloscope display of Frank-Hertz Experiment
Grids Power Supplies
� V : 1.3-5 V continuously variableG K1
� V : 1.3 - 12V continuously variableG K2
� V : 0 - 95V continuously variableG K2
All the power supplies are highly stabilised and output voltages can be read on 3 V2 digit, 7 segment LED DPM with autopolarity and decimal indication through a selector switch.
Saw tooth waveform for CRO display
� Scanning Voltage : 0-80V
� Scanning Frequency : 115±20Hz
Multirange Digital Ammeter
� Display : 3½ digit 7 segment LED
� Range Multiplier: 10-7 , 10-8 & 10-9
Power
� 220V±10% mains, 50Hz
The instrument can, not only lead to a plot of the ampl i tude spectrum curve by means of point by point measurement, but also directly display the amplitude spectrum curve on the oscilloscope screen. This instrument can thus be used as a classroom experiment as w e l l a s f o r demonstrat ion to a group of students.
Analysis of the Data
Data obtained for the excitat ion potential point by point are shown in Fig. 3. The readings are taken for 1V changes on grid 2 (V ). A G K2
signi�cant decrease in electron (collector) current is noticed every time the potential on grid 2 is increased by approximately 12V, thereby indicating that energy is transferred from the beam in (bundles) �quanta� of12eV only. Indeed, a prominent line in the spectrum of argon exists at 1048Å corresponding to eV=11.83.
The location of the peaks is indicated in Fig. 3. Average value of spacing between peaks is 11.75eV compared with the accepted value of 11.83V.
increased further and reaches a value twice that of the �rst excitation potential, it is possible for an electron to excite an atom halfway between the grids, loose all its energy, and then gain anew enough energy to excite a second dip in the current. The advantage of this type of con�guration of the potential is that the current dips are much more pronounced, and it is easy to obtain �ve fold or even larger multiplicity in the excitation of
the �rst level.
Frank-Hertz Experiment Set-up, Model: FH-3001, consists of the following:
Argon �lled tetrode
Filament Power Supply : 2.6~3.4V continuously variable

INSTRUMENTS PVT. LTD.
452 Adarsh Nagar, Roorkee-247667 (Uttarakhand) INDIAPh.: +91-1332-272852, 277118, 271712 • Email: [email protected] • Web: www.sesinstruments.com
SES
ISO 9001:2015
IP-01IP-01
Ionisation PotentialIonisation Potential
IntroductionThe electrons in the atoms have discrete stationary states. Franck and Hertz in 1914 described the �rst observation of quantized excitation from one quantized state to another one year after N. Bohr published his theory of hydrogen atom. His method depends on detecting the on-set of inelastic collisions between electrons and atoms of the gas under study. The experimental tube in this measurement is essentially a triode �lled with the vapour of the experimental substance. The electrons emitted by the heated �lament of the tube are accelerated by the positive potential V between the cathode GK
and the grid. The grid is a wire mesh which allows the electrons to pass through. The anode A is maintained at a �xed potential V slightly negative with respect to the grid. In the experiment GA
the electron current is measured as a function of the voltage V . GK
As V increases, the energy of the electrons increases, and more GK
and more electrons reach the anode. The anode current increases. The collisions between the electrons and the atoms are elastic. As V further increases, the energy of the electrons GK
reaches the threshold for the excitation of the atomic electrons from the ground state to the �rst excited state, and the collisions between the electrons and the atoms become inelastic. The colliding electrons lose energy and are not able to overcome the negative potential V and the anode current GA
decreases. The potential V at the decrease is equal to the �rst GK
excitation potential of the atom.
Operating PrincipleIn the present ionization potential measurement, the
traditional Franck-Hertz set-up as described above has
been altered to detect the threshold for ionizing inelastic
collisions. The experimental tube is a tetrode �lled with
argon, the experimental substance. Figure 1 shows the basic
circuit diagram. The electrons emitted by the heated
�lament are accelerated by the potential V between the G2K
cathode and the grid G . The grid G helps in minimizing 2 1
space charge effects. Both the grids consist of wire mesh
and allow the electrons to pass through. The anode A is
maintained at a potential slightly negative with respect to
the cathode. The electrons are never able to reach it. lt is
ready to receive positive ions if they have been created in
the tube. The on-set of anode current therefore signi�es
the creation of positive ions, i.e. the on-set of ionizing
inelastic collisions between the electrons and the argon
atoms. In the experiment the electron current is measured
as a function of the voltage V . As this voltage increases, G2K
the electron energy goes up. But as long as this energy is less

INSTRUMENTS PVT. LTD.
452 Adarsh Nagar, Roorkee-247667 (Uttarakhand) INDIAPh.: +91-1332-272852, 277118, 271712 • Email: [email protected] • Web: www.sesinstruments.com
SES
ISO 9001:2015
IP-01IP-01
Ionisation PotentialIonisation Potential Page-2Page-2
Ionization Potential Set-up, Model lP-001,
consists of the following:
a) Argon �lled tetrode
b) Filament Power Supply
c) Power Supply tor VG1K
d) Power Supply for VKA
e) Power Supply for VG2K
f) Saw tooth wave form for CRO display
g) Multirange Voltmeter
h) Multirange Ammeter
All this is housed in a cabinet with meters and
adjustment knobs on the front panel. The set-up
can also directly display the anode current
variation with V on the oscilloscope screen. It G2K
can thus be used as a laboratory experiment as
well as for demonstration to a group of students.
than what is required to ionize the atom, the ions
are not created, and the anode current remains
equal to zero. The inelastic collisions leading to the
excitation of argon atoms are immaterial because
no ions are created there in and the anode current
remains unaffected. The potential V at the on-set G2K
of the anode current is equal to the ionization
potential. As V further increases, more and more G2K
electrons undergo ionizing collisions and the anode
current increases. When V reaches a value twice G2K
that of the ionization potential, it is possible for an
electron to ionize an atom half way between the
grid and the cathode, lose all its energy, and then
gain anew enough energy to ionize another argon
atom. The anode current beginning at this value of
V shows a faster increase with V as now there is G2K G2K
a larger number of ions reaching the anode.
IONIZATION POTENTIAL IN
FRANCK HERTZ UNIT
ANALYSIS OF THE DATA
Point by point data for the anode current with V changing in G2K
steps of 1 V at V equal to 1.5 V and V equal to 3.0 V are shown G1K KA
in Figure 2. The on-set of the anode current and the point where
the slope of the current changes can be determined by locating the
points of intersection of the lines as shown in Figure 2. These points
are at 16 V and 31 V respectively. The former corresponds to the
ionization potential and the later for the ionization again. The
average value of the ionization potential thus found is 15.5 eV
compared with the accepted value of 15.6 eV.

INSTRUMENTS PVT. LTD.452 Adarsh Nagar, Roorkee-247667 (Uttarakhand) INDIAPh.: +91-1332-272852, 277118, 271712 • Email: [email protected] • Web: www.sesinstruments.com
SES
ISO 9001:2015
DFP-02DFP-02
Four Probe Method (Basic Model)Four Probe Method (Basic Model)
The Four Probe Method
is one of the standard
and most widely used
method for the
measurement of
resistivity of
semiconductors. The
experimental
arrangement is
illustrated. In its useful
form, the four probes
are collinear. The error
due to contact
resistance, which is
specially serious in the
electrical measurement
on semiconductors, is
avoided by the use of
two extra contacts
(probes) between the current contacts. In this
arrangement the contact resistance may all be high
compare to the sample resistance, but as long as
the resistance of the sample and contact resistances
are small compared with the effective resistance of
the voltage measuring device (potentiometer,
electrometer or electronic voltmeter), the measured
value will remain unaffected. Because of pressure
contacts, the arrangement is also specially useful
for quick measurement on different samples or
sampling different parts of the same sample.
Description of the experimental set-up
1. Probes Arrangement
It has four individually spring loaded probes. The
probes are collinear and equally spaced. The probes
are mounted in a teflon bush, which ensure a good
electrical insulation between the probes. A teflon
spacer near the tips is also provided to keep the
Resistivity of Semiconductor by Four Probe Method at different temperatures and determination of the Band-gap
probes at equal distance. The whole - arrangement is mounted on a
suitable stand and leads are provided for the voltage measurement.
2. Sample
Germanium crystal in the form of a chip (10X9X0.5mm)
3. Oven
It is a small oven for the variation of temperature of the crystal from
the room temperature to about 200°C (max.)

INSTRUMENTS PVT. LTD.452 Adarsh Nagar, Roorkee-247667 (Uttarakhand) INDIAPh.: +91-1332-272852, 277118, 271712 • Email: [email protected] • Web: www.sesinstruments.com
SES
ISO 9001:2015
DFP-02DFP-02
Four Probe MethodFour Probe Method Page-2Page-2
4. Four Probe Set-up, DFP-02
The set-up consists of three units in the same
cabinet.
(i) Multirange Digital Voltmeter
In this unit, intersil 3½ digit single chip A/D
Converter ICL 7107 has been used. It has high
accuracy like auto zero to less than 10µV,
zero drift of less than 1µV/ °C, input bias
current of 10pA max. and roll-over error of
less than one count. Since the use of internal
reference causes the degradation in
performance due to internal heating, an
external reference has been used.
Specifications
Range : X1 (0-200mV) & X10
(0-2V)
Impedance : MW
Resolution : 100µV at X1 range
Display : 3½ digit, 7 segment
LED (12.5mm height)
with polarity and
decimal indication
Accuracy : ±0.1% of reading ±1
digit
Overload Indicator : Sign of 1 on the left
& blanking of other
digits
(ii) Constant Current Generator
It is an IC regulated current generator to
provide a constant current to the outer
probes irrespective of the changing
resistance of the sample due to change in
temperatures. The basic scheme is to use the
feedback principle to limit the load current
of the supply to preset maximum value Variations in the current are achieved
by a potentiometer included for that purpose. The supply a highly regulated
and practically ripple free d.c. source. The current is measured by the digital
panel meter.
Specifications
Open Circuit Voltage : 18V
Current range : 0-20mA
Resolution : 10µA
Accuracy : ±0.25% of the reading ±1 digit
Load regulation : 0.03% for 0 to full load
Line Regulation : 0.05% for 10% changes
(iii) Oven Power Supply Suitable voltage for the oven is obtained through a
step down transformer with a provision for low and high rates of heating. A
glowing LED indicates, when the oven power supply is ‘ON’.
The experimental setup is complete in all respect

INSTRUMENTS PVT. LTD.452 Adarsh Nagar, Roorkee-247667 (Uttarakhand) INDIAPh.: +91-1332-272852, 277118, 271712 • Email: [email protected] • Web: www.sesinstruments.com
SES
ISO 9001:2015
DFP-03DFP-03
Four Probe Method (Advance Model)Four Probe Method (Advance Model)
Resistivity of Semiconductor by Four Probe Method at different temperatures and determination of the band-gap
The Four Probe Method is one of the standard and
most widely used method for the measurement of
resistivity. In its useful form, the four probes are
collinear. The error due to contact resistance,
which is significant in the electrical measurement
on semiconductors, is avoided by the use of two
extra contacts (probes) between the current
contacts. In this arrangement the contact
resistance may all be high compare to the sample
resistance, but as long as the resistance of the
sample and contact resistance's are small
compared with the effective resistance of the
voltage measuring device (potentiometer,
electrometer or electronic voltmeter), the
measured value will remain unaffected. Because
of pressure contacts, the arrangement is also
specially useful tor quick measurement on
different samples or sampling different parts of
the sample.
Description of the experimental set-up
1. Probes Arrangement
It has four individually spring loaded probes. The probes are collinear
and equally spaced. The probes are mounted in a teflon bush, which
ensure a good electrical insulation between the probes. A teflon spacer
near the tips is also provided to keep the probes at equal distance. The
probe arrangement is mounted in a suitable stand, which also hold the
sample plate. To ensure the correct measurement of sample
temperature, the FlTD is enbeded in the sample plate just below the
sample. This stand also serves as the lid of temperature controlled
oven. Proper leads are provided for the current and voltage
measurement.
2. SAMPLE
Germanium crystal in the form of a chip (10X9X0.5mm).
3. OVEN
This is high quality temperature controlled oven suitable for Four
Probe Set-up. The oven has been designed for fast heating and cooling
rates, which enhances the effectiveness of the controller.

INSTRUMENTS PVT. LTD.452 Adarsh Nagar, Roorkee-247667 (Uttarakhand) INDIAPh.: +91-1332-272852, 277118, 271712 • Email: [email protected] • Web: www.sesinstruments.com
SES
ISO 9001:2015
DFP-03DFP-03
Four Probe MethodFour Probe Method Page-2Page-2
4. Four Probe SET-UP, DFP-03
The set-up consists of three units housed in the same
cabinet.
(i) Oven Controller
Platinum RTD (A class) has been used for sensing the
temperature. A wheatstone bridge and an
instrumentation amplifier are used for signal
conditioning. Feedback circuit ensures offset and
linearity trimming and a fast accurate control of the
oven temperature.
Specifications of the Oven
Temperature Range : Ambient to 473K
Resolution : 1K
Stability : ±0.5K
Measurement Accuracy : ±1K (typical)
Oven : Specially designed for
Four Probe Set-Up
Sensor : RTD (A class)
Display : 3½ digit, 7 segment LED
with autopolarity and
decimal indication
Power : 150W
(i) Multirange Digital Voltmeter
In this unit, intersil 3½ digit single chip A/D Converter
ICL 7107 has been used. It has accuracy, auto zero to
less than 10 µV, zero drift-less than 1 µV/ °C, input
bias current of 10 pA and roll over error of less than
one count. Since the use of internal reference causes
the degradation in performance due to internal
heating, an external reference has been used.
Specification
Range : X1 (0-200mV) & X10 (0-2V)
Resolution : 100µV at X 1 range
Accuracy : ±0.1% of reading ±1 digit
Display : 3½ digit, 7 segment LED with
autopolarity and decimal
indication
Overload Indicator : Sign of 1 on the left &
blanking of other digits.
(ii) Constant Current Generator
It is an IC regulated current generator to provide a constant current
to the outer probes irrespective of the changing resistance of the
sample due to change in temperatures. The basic scheme is to use the
feedback principle to limit the load current of the supply to preset
maximum value. Variations in the current are achieved by a
potentiometer included for that purpose. The supply is a highly
regulated and practically ripple free d.c. source. The current is
measured by the digital panel meter.
Specification
Open circuit voltage : 18 V
Accuracy : ±0.25% of the reading ±1 digit
Current range : 0-20 mA
Load regulation : 0.05% for 0 to full load
Resolution : 10 µA
Line regulation : 0.05% for 10% changes
Typical results obtained from this set-up are shown in the graph.
The experimental set-up is complete in all respect

INSTRUMENTS PVT. LTD.452 Adarsh Nagar, Roorkee-247667 (Uttarakhand) INDIAPh.: +91-1332-272852, 277118, 271712 • Email: [email protected] • Web: www.sesinstruments.com
SES
ISO 9001:2015
DFP-RM-200DFP-RM-200
Four Probe Set-Up (Research Model)Four Probe Set-Up (Research Model)
Four Probe Set-Up for Measuring the Resistivity of Very Low to Highly Resistive Samples at Different Temperature
Description
The Four Probe Method is one of the standard and most widely used method for the measurement of resistivity. In its useful form, the four probes are collinear. The error due to contact resistance, which is significant in the electrical measurement on semiconductors, is avoided by the use of two extra contacts (probes) between the current contacts. In this arrangement the contact resistance may all be high compare to the sample resistance, but as long as the resistance of the sample and contact resistance‘s are small compared with the effective resistance of the voltage measuring device (potentiometer, electrometer or electronic voltmeter), the measured value will remain unaffected. Because of pressure contacts, the arrangement is also specially useful for quick measurement on different samples or sampling different parts of the sample.
Description of the Experimental Set-up
1. Probes Arrangement
It has four individually spring loaded probes. The probes are collinear and equally spaced. The probes are mounted in a teflon bush, which e n s u r e a g o o d electrical insulation between the probes. A teflon spacer near the t i p s i s a l so provided to keep the probes at equa l
distance. The probe arrangement is mounted in a suitable stand, which also holds the sample plate and RTD sensor. This stand also serves as the lid of PID Controlled Oven. Proper leads are provided for the current and voltage measurement.
2. PID Controlled Oven, Model PID-TZ
The unit is a high quality PID controller wherein the temperatures can be set and controlled easily. The P, l and D parameters are factory set for immediate use however the user may adjust these for specific applications as well as auto-t u n e t h e o v e n w h e n e v e r required. The steps for these are given in the user manual . Although the controller may be used either for our small oven, up to 200ºC or a larger oven up to 600ºC, however, in the present setup only small oven is to be used . The cont ro l l e r u se s thermocouple as temperature sensor.
Specifications of the Oven Controller
The controller is designed around Autonics Temperature Controller Model TZN4S. Although this is a very versatile piece of equipment, below is a summary of the specifications that are relevant to the present application. The PID parameters are factory set to a reasonable level (P = 1.8; I = 300; D = 80) for immediate operation of the unit.

INSTRUMENTS PVT. LTD.452 Adarsh Nagar, Roorkee-247667 (Uttarakhand) INDIAPh.: +91-1332-272852, 277118, 271712 • Email: [email protected] • Web: www.sesinstruments.com
SES
ISO 9001:2015
DFP-RM-200DFP-RM-200
Four Probe Set-UpFour Probe Set-Up Page-2Page-2
Specification (Oven Controller)Temperature Range : Ambient to 200ºCOven : Specially designed for Four
Probe Set-UpDisplay Accuracy : ±0.3ºCSensor : Thermocouple (Chromel-
Alumel)Setting Type : Front push buttonsDisplay : 7 segment LED, two rowsControl Method : PID, PIDF, PIDSValues : Process Value, PV and Set
Value, SVMeasurement Accuracy : ±0.5ºC (typical)Power : 150W
3. Constant Current Source
a) Constant Current Source, Model : CCS-01
(for low resistivity to medium resistivity samples)
It is an IC regulated current generator to provide a constant current to the outer probes irrespective of the changing resistance of the sample due to change in temperatures. The basic scheme is to use the feedback principle to limit the load current of the supply to preset maximum value. Variations in the current are achieved by a potentiometer included for that purpose. The supply is a highly regulated and practically ripples tree d.c. source. The constant current source is suitable tor the resistivity measurement of thin films of metals/alloys and semiconductors like germanium.
Specification
Open Circuit Voltage : 10 V
Current Range : 0-20mA, 0-200mA
Resolution : 10µA
Accuracy : ±0.25% of the reading ± 1 digit
Display : 3½ digit , 7 segment LED with autopolarity and decimal indication
Load Regulation : 0.03% for 0 to full load
Line Regulation : 0.05% for 10% changes
b) Low Current Source, Model : LCS-02
(for high resistivity samples)
Low Constant Current Sources are needed, when the sample resistance, is large. As in the case of silicon wafers or high resistivity film deposits. Large resistance makes the measurement prone to pickups from the mains. This problem is reduced to very low level by using the battery instead of mains. Since the current requirement is very small, the batteries should have a reasonably long life. An internal voltage reference of 2.5 volt ensures reliable operation even when the batter voltage falls. A ten turn potentiometer makes the current adjustment very easy.
Specification
Open Circuit Voltage : 15V
Current Range : 0-2µA, 0-20µA, 0-200µA & 0-2mA
Minimum : 1nA at 0-2µA range
Accuracy : ±0.25% of the reading ±1 digit
Display : 3½ dig i t , 7 segment LCD with autopolarity and decimal indication
Load Regulation : 0.05% for 0 to full load
Power : 2 x 9V batteries
4 D.C. Microvoltmeter
Specifications as per datasheet in the catalogue.
The experimental set-up is complete in all respect.

Four Probe Setup
Description
The Four Probe Method is one of the standard and most widely used method for the
measurement of resistivity. In its useful form, the four probes are collinear. The error
due to contact resistance, which is significant in the electrical measurement on
semiconductors, is avoided by the use of two extra contacts (probes) between the
current contacts. In this arrangement the contact resistance may all be high compare
to the sample resistance, but as long as the resistance of the sample and contact
resistance's are small compared with the effective resistance of the voltage measuring
device (potentiometer, electrometer or electronic voltmeter), the measured value will
remain unaffected. Because of pressure contacts, the arrangement is also specially
useful for quick measurement on different samples or sampling different parts of the
sample.
Four Probe Set-Up for measuring the resistivity of very low to highlyresistive thin sheet samples at different temperatures
DFP-RM-200NC

The unit is a high quality PID controller wherein the temperatures can be set andcontrolled easily. The P, l and D parameters are factory set for immediate use howeverthe user may adjust these for specific applications as well as autotune the oven wheneverrequired. The steps for these are given in the user manual. Although the controller maybe used either for our small oven, up to 200ºC or a larger oven up to 600ºC, however,in the present setup only small oven is to be used. The controller uses thermocouple astemperature sensor.
2. PID Controlled Oven
Temperature Range: -190ºC to 200ºC
Oven: Specially designed for Four Probe Set-Up
Display Accuracy: +-0.3ºC
Sensor: Thermocouple (Chromel-Alumel)
Setting Type: Front push buttons
Display: 7 segment LED, two rows
Control Method: PID, PIDF, PIDS
Values: Process Value, PV and Set Value, SV
Temperature control range: Ambient to 200ºC
Power: 150W
Description of Experimental Set-up
It has four individually spring loaded probes.
The probes are collinear and equally spaced.
The probes are mounted in a teflon bush,
which ensure a good electrical insulation
between the probes. A teflon spacer near the
tips is also provided to keep the probes at
equal distance. The probe arrangement is
mounted in a suitable stand, which also holds
1. Probes Arrangement
the sample plate and thermocouple sensor. This stand also serves as the lid of PID
Controlled Oven. Proper leads are provided for the current and voltage measurements.
Specifications of the Temperature Controller
The controller is designed around Autonics Temperature Controller Model TZN4S.
Although this is a very versatile piece of equipment, below is a summary of the
specifications that are relevant to the present application. The PID parameters are factory
set to a reasonable level (P = 1.8; I = 300; D = 80) for immediate operation of the unit.

3. Control Unit of Four Probe Setup
The unit comprises of two sections – a totally isolated constant current source,
and a grounded voltage measurement system. Features of these two sections
are described below in some detail.
A judicious choice of the current setting as detailed in the user manual is necessarydepending on the resistance value that is measured. Brief technical details of the currentsection are as under:
The voltmeter is used to read the voltage developed between the middle pins of the fourprobe arrangement. A primary requirement is to have very high input resistance so thatthe measurement is not disturbed in case of high resistance samples. The input range ofthe voltmeter is thus limited by avoiding the use of any potential divider. Brief technicaldetails are as under:
In addition to the above, the Four Probe Setup as well as the PID Oven Unitmay be connected to a computer for data logging purposes. Necessaryhardware and software are included in the system.
• Current Range: 2 A, 20 A, 200 A, 2mA, 20mA and 200mA with over ranging
• Open Circuit Voltage: 15V in the lower four ranges and 9V in the upper two
• Accuracy : ±0.25% of the reading ±1digit
• 4-line LCD display with indication when current needs decreasing
• Voltage Range: 2mV, 20 mV, 200 mV, 2V with over ranging
• Manual adjustment of Offset Voltage whenever current/voltage range is changed
• Accuracy : ±0.25% of the reading ±1 digit
• 4-line LCD display with over voltage indication
m m m
(b) Digital Voltmeter Section
452 Adarsh Nagar, Roorkee-247667 (UK) India, Ph.: +91-1332-272852, 277118, Fax 271712
Website: www.sesinstruments.com Email: [email protected]; [email protected]
The setup is complete in itself
(A) Constant Current Source
It is an IC regulated currentgenerator that is galvanicallyisolated from the rest of thecircuit which is a basicrequirement of four probemethod. The isolation isachieved by using an opticallycoupled amplifier andassociated circuits. This circuitsends a constant Current. Tothe changing resistance of thesample due to change in temp..

Four Probe Setup
DF
P-LH
Description
The Four Probe Method is one of the standard and most widely used method for the
measurement of resistivity. In its useful form, the four probes are collinear. The error
due to contact resistance, which is significant in the electrical measurement on
semiconductors, is avoided by the use of two extra contacts (probes) between the
current contacts. In this arrangement the contact resistance may all be high compare
to the sample resistance, but as long as the resistance of the sample and contact
resistance's are small compared with the effective resistance of the voltage measuring
device (potentiometer, electrometer or electronic voltmeter), the measured value will
remain unaffected. Because of pressure contacts, the arrangement is also specially
useful for quick measurement on different samples or sampling different parts of the
sample.
Four Probe measurement set-up for wide range of resistivitysamples from -190ºC to 200ºC temperatures

In this unit heating of sample zone is done through heating coil and cooling through
controlled flow of liquid nitrogen. The necessary components such as the cryostate, the
flow system etc. are included. Temperature range is from -190 C to 200 C. The unit is a
high quality PID controller wherein the temperatures can be set and
controlled easily. The P, I and D parameters are factory set for immediate use however
the user may adjust these for specific applications as well as auto-tune the oven
whenever required. The steps for these are given in user manual.
º º
above ambient
its ’s
2. PID Controlled Oven cum Cryostate
Temperature Range: -190ºC to 200ºC
Oven: Specially designed for Four Probe Set-Up
Display Accuracy: +-0.3ºC
Sensor: Thermocouple (Chromel-Alumel)
Setting Type: Front push buttons
Display: 7 segment LED, two rows
Control Method: PID, PIDF, PIDS
Values: Process Value, PV and Set Value, SV
Temperature control range: Ambient to 200ºC
Power: 150W
Description of Experimental Set-up
It has four individually spring loaded probes.
The probes are collinear and equally spaced.
The probes are mounted in a teflon bush,
which ensure a good electrical insulation
between the probes. A teflon spacer near the
tips is also provided to keep the probes at
equal distance. The probe arrangement is
mounted in a suitable stand, which also holds
1. Probes Arrangement
the sample plate and thermocouple sensor. This stand also serves as the lid of PID
Controlled Oven. Proper leads are provided for the current and voltage measurements.
Specifications of the Temperature Controller
The controller is designed around Autonics Temperature Controller Model TK4S. Although
this is a very versatile piece of equipment, below is a summary of the specifications that
are relevant to the present application.

452 Adarsh Nagar, Roorkee-247667 (UK) India, Ph.: +91-1332-272852, 277118, Fax 271712
Website: www.sesinstruments.com Email: [email protected]; [email protected]
3. Constant Current Source, CCS-01 (for low resistivity to medium resistivity samples)
4. Low Current Source, LCS-01 (for high resistivity samples)
5. Digital Microvoltmeter, DMV-001 (Detailed specifications as per datasheet attached)
Experiment is complete in itself (except liquid nitrogen)
It is an IC regulated current generator to provide a
constant current to the outer probes irrespective of
the changing resistance of the sample due to
change in temperatures. The basic scheme is to
use the feedback principle to limit the load current
from the supply to preset value. Variations in the
current are achieved by a potentiometer
Open Circuit Voltage: 10V
Current Range: 0-20mA, 0-200mA
Resolution: 10 A
Accuracy : 0.25% of the reading 1 digit
Display: 3½ digit, 7 segment LED with autopolarity and decimal indication
Load Regulation: 0.03% for 0 to full load
Line Regulation: 0.05% for 10% changes
m
± ±
included for that purpose. The supply is a highly regulated and practically ripples free
d.c. source. The constant current source is suitable for the resistivity measurement of
thin films of metals/ alloys and semiconductors like germanium.
Low Constant Current Sources are needed, when
the sample resistance, is too large. As in the case
of silicon wafers or high resistivity film deposits.
Large resistance makes the measurement prone to
pickups from various sources. This problem is
reduced to very low level by using the battery
instead of mains. Since the current requirement is
Open Circuit Voltage: 15V
Current Range: 0-2 A, 0-20 A, 0-200 A & 0-2mA
Resolution: 1nA at 0-2 A range
Accuracy : 0.25% of the reading 1 digit
Display: 3½ digit, 7 segment LCD with autopolarity and decimal indication
Load Regulation: 0.05% for 0 to full load
Power: 2 x 9V batteries
m m m
m
± ±
very small, the batteries should have a reasonably long life. An internal voltage
reference of 2.5V ensures reliable operation even when the battery voltage falls. A ten
turn potentiometer makes the current adjustment very easy.

INSTRUMENTS PVT. LTD.
452 Adarsh Nagar, Roorkee-247667 (Uttarakhand) INDIAPh.: +91-1332-272852, 277118, 271712 • Email: [email protected] • Web: www.sesinstruments.com
SES
ISO 9001:2015
FP-01FP-01
Four Probe Set-upFour Probe Set-up
Four Probe Set-Up for Mapping The Resistivity of Large Samples
Description
The Four Probe Method is one of the
standard and most widely used
method for the measurement of
resistivity. In its useful form, the four
probes are collinear. The error due to
contac t re s i s t ance , wh i ch i s
s i g n i � c a n t i n t h e e l e c t r i c a l
measurement on semiconductors, is
avoided by the use of two extra
contacts (probes) between the
current contacts. in this arrangement
the contact resistance may all be high
compare to the sample resistance, but
as long as the resistance of the sample
and contact resistance's are small
compared wi th the ef fect ive
resistance of the voltage measuring
device (potentiometer, electrometer
or e lect ronic vo l tmeter ) , the
m e a s u re d v a l u e w i l l r e m a i n
unaffected. Because of pressure
contacts, and 2 way motion, the
arrangement is specially useful for
quick measurement on large samples
at room temperature.
Description of the Experimental Set-up
1. Probes Arrangement
I t h a s f o u r
i n d i v i d u a l l y
spring loaded
p r o b e s . T h e
p r o b e s a r e
co l l inear and
equally spaced.
The probes are
mounted in a
t e � o n b u s h ,
which ensure a
good electrical
i n s u l a t i o n
between the probes. A te�on spacer near the tips is also provided to keep the probes at
equal distance. The probe arrangement is mounted in a tube, which also provide leads
for connections to Constant Current Power Supply and D.C. Microvoltmeter. The tube
containing four probes is mounted on a travelling microscope type system, scales and
verniers are made of stanless steels with following speci�cation:
Horizontial :20 cm least count 0.001 cm
Laterial :6 cm least count 0.001 cm
Vertical : 15 cm least count 0.001 cm
The bed is of heavy casting, thoroughly aged and machined, is �tted with leveling
screws. A large platform is provided for �xing the sample.

INSTRUMENTS PVT. LTD.
452 Adarsh Nagar, Roorkee-247667 (Uttarakhand) INDIAPh.: +91-1332-272852, 277118, 271712 • Email: [email protected] • Web: www.sesinstruments.com
SES
ISO 9001:2015
FP-01FP-01
Four Probe Set-upFour Probe Set-up Page-2Page-2
2. Constant Current Source
a) Constant Current Source, Model : CCS-01
(for low resistivity to medium resistivity
samples)
It is an IC regulated current generator to provide a
constant current to the outer probes irrespective of
the changing resistance of the sample due to change
in temperatures. The basic scheme is to use the
feedback principle to limit the load current of the
supply to preset maximum value. Variations in the
current are achieved by a potentiometer included
for that purpose. The supply is a highly regulated and
practically ripples free d.c. source. The constant
current source is suitable for the resistivity
measurement of thin �lms of metals/ alloys and
semiconductors like germanium.
Speci�cation
Open Circuit Voltage : 10V
Current Range : 0-20mA, 0-200mA
Resolution : 10µA
Accuracy : ±0.25% of the reading ± 1
digit
Display : 3½ digit, 7 segment LED
with auto polarity and
decimal indication
Load Regulation : 0.03% for 0 to full load
Line Regulation : 0.05% for 10% changes
b) Low Current Source, Model : LCS-02
(for high resistivity samples)
Low Constant Current Sources are needed when the sample resistance, either inherently or due to contact resistances, is large. These include the resistivity measurement of silicon wafers or high resistivity �lm deposits. Large values of the sample resistance make the measurement prone to noise pick-up from the mains and elsewhere. This is one of the most signi�cant problems of high resistance measurement.
In the present unit the problem of pick-up has been reduced to very low levels by having a battery operated source. Since the current requirement is small and the circuit being specially designed for this purpose, the batteries should have a reasonably long life. Further, a transistor circuit has been preferred over an Op-Amp based circuit as it offers a reduction of the battery count and is also simpler. An internal voltage reference of 2.5 volt ensures reliable operation even when the batter voltage falls and a ten turn potentiometer makes the current adjustment very easy. The actual current is read on a 3½ digit LCD display. There are two current ranges, which may be selected with the help of a switch the panel.
Speci�cation
Open Circuit Voltage : 15V
Current Range : 0-2µA, 0-20µA, 0-200µA, 0-2mA
Resolution : 1nA at 0-2µA range
Accuracy : ± 0.25% of the reading ± 1 digit
Display : 3½ digit, 7 segment LCD with auto polarity and decimal indication
Load Regulation : 0.05% for 0 to full load
Power : 3 x 9V batteries
3. D.C. Microvoltmeter
Speci�cations as per datasheet in the catalogue.
The experimental set-up is complete in all respect.

Van der Pauw Experiment
Introduction
Semiconductor material research and device testing often involve determining the
resistivity and Hall mobility of a sample. The resistivity of the semiconductor material is
often determined using a four-point probe technique. With a fourprobe, or Kelvin,
technique, two of the probes are used to source current and the other two probes are
used to measure voltage. Using four probes eliminates measurement errors due to the
probe resistance, the spreading resistance under each probe, and the contact
resistance between each metal probe and the semiconductor material. Because a high
impedance voltmeter draws little current, the voltage drops across the probe
resistance, spreading resistance, and contact resistance are very small. One common
Kelvin technique for determining the resistivity of a semiconductor material is the van
der Pauw (VDP) method. The van der Pauw method involves applying a current and
measuring voltage using four small contacts on the circumference of a flat, arbitrarily
shaped sample of uniform thickness. This method is particularly useful for measuring
very small samples because geometric spacing of the contacts is unimportant. Effects
due to a sample’s size, which is the approximate probe spacing, are irrelevant.
Van der Pauw Set-Up for measurement of resistivity anddetermination of hall coeffiecients in semiconductor samples
VDX-01

Description of Experimental Set-up
Ge single crystal with four pure silver, spring type pressure
contacts is mounted on a sunmica coated bakelite strip.
Suitable connector is provided for connections with current
source and hall voltage measuring devices.
1. Probes Arrangement
2. Van der Pauw Set-up, VDP-01
3. Electromagnet, EMU-50V Refer datasheet for specifications( )
4. Constant Current Power Supply, DPS-50 Refer datasheet for specifications( )
5 .Digital Gaussmeter, DGM-202 ( )Refer datasheet for specifications
452 Adarsh Nagar, Roorkee-247667 (UK) India, Ph.: +91-1332-272852, 277118, Fax 271712
Website: www.sesinstruments.com Email: [email protected]; [email protected]
The setup is complete in itself
The set-up, consists of two sub units to handle robe
current and hall voltage While the probe current is generated
and measured by constant current source (0-20mA) having
a resolution of 10 A, the hall voltage is measured by a high
input resistance millivoltmeter in the range 0-200mV having
a resolution of 100 V. The probe current and hall voltage are
both displayed on
m
m
VDP-01 p
.
a
separate 3.5 digit LED panel meters.
Various combinations of Voltage and Current probe locations
used in Van der Pauw measurements can be conveniently
selected using bandswitch provided on the panel both for
Resistivity and Hall Effect measurements.

INSTRUMENTS PVT. LTD.
452 Adarsh Nagar, Roorkee-247667 (Uttarakhand) INDIAPh.: +91-1332-272852, 277118, 271712 • Email: [email protected] • Web: www.sesinstruments.com
SES
ISO 9001:2015
MRX-01MRX-01
Measurement of Magnetoresistance of SemiconductorsMeasurement of Magnetoresistance of Semiconductors
It is noticed that the resistance of the sample changes
when the magnetic �eld is turned on. The
phenomenon, called magnetoresistance, is due to the
fact that the drift velocity of all carriers is not same.
With the magnetic �eld on; the Hall voltage V=E t=|vx y
H| compensates exactly the Lorentz force for carriers
with the average velocity; slower carriers will be over
compensated and faster one under compensated,
resulting in trajectories that are not along the applied
�eld. This results in an effective decrease of the mean
free path and hence an increase in resistivity.
Here the above referred symbols are de�nes as: v =
drift velocity; E = applied electric �eld; t = thickness of
the crystal; H = Magnetic �eld.
Experimentental Set-up for Magnetoresistance
The set-up consists of the following:
1. Four probe arrangement
2. Sample: (Ge: p-type)
3. Magnetoresistance set-up, DMR-01
4. Electromagnet, EMU-50V
5. Constant Current Power Supply, DPS-50
6. Digital Gaussmeter, DGM-102
Measurement of Magnetoresistance of Semiconductors
(1) Four Probe arrangement°
It consists of 4 collinear, equally spaced (2mm) and individually
spring loaded probes mounted on a PCB strip. Two outer probes for
supplying the constant current to the sample and two inner probes
for measuring the voltage developed across these probes This
eliminates the error due to contact resistance which is particularly
serious in semiconductors A platform is also provided for placing the
sample and mounting the Four Probes on It.
(2) Sample
Ge Crystal (n-type) dimensions: 10 x 10 x 0.5mm.
(3) Magnetoresistance Set-up, Model DMR-01
This unit consists of a digital millivoltmeter and constant current
power supply The voltage and probe current can be read on the same
digital panel meter through a selector switch.
(a) Digital Millivoltmeter
lntersil 3½ digit single chip ICL 7107 have been used. Since the use of
internal reference causes the degradation in performance due to
internal heating an external reference have been used. Digital
voltmeter is much more convenient to use, because the input voltage
of either polarity can be measured.

INSTRUMENTS PVT. LTD.
452 Adarsh Nagar, Roorkee-247667 (Uttarakhand) INDIAPh.: +91-1332-272852, 277118, 271712 • Email: [email protected] • Web: www.sesinstruments.com
SES
ISO 9001:2015
MRX-01MRX-01
Measurement of Magnetoresistance of SemiconductorsMeasurement of Magnetoresistance of SemiconductorsPage-2Page-2
Speci�cations
Range : 0-200mV (100µV minimum)
Accuracy : ±0.1% of reading ± 1 digit
(b) Constant Current Power Supply
This power supply, specially designed for Hall Probe, provides
100% protection against crystal burn-out due to excessive
current. The supply is a highly regulated and practically ripple
free dc source.
Speci�cations
Current : 0-20mA
Resolution : 10µA
Accuracy : ±0.2% of the reading ±1 digit
Load regulated : 0.03% for 0 to full load
Line regulation : 0.05% for 10% variation
The details of other sub-units can be had from their respective data-sheets.

MRX-RMMRX-RM
INSTRUMENTS PVT. LTD.452 Adarsh Nagar, Roorkee-247667 (Uttarakhand) INDIAPh.: +91-1332-272852, 277118, 271712 • Email: [email protected] • Web: www.sesinstruments.com
SES
ISO 9001:2015
Magnetoresistance Setup (Research Model)Magnetoresistance Setup (Research Model)
It is noticed that the resistance of the sample changes
when the magnetic field is turned on. The phenomenon,
called magnetoresistance, is due to the fact that the drift
velocity of all carriers is not same. With the magnetic field
on; the Hall voltage V=E t=| x | compensates exactly y v H
the Lorentz force for carriers with the average velocity;
slower carriers will be over compensated and faster one
under compensated, resulting in trajectories that are not
along the applied field. This results in an effective
decrease of the mean free path and hence an increase in
resistivity.
Here the above referred symbols are defines as: v = drift
velocity; E = applied electric field; t = thickness of the
crystal; H = Magnetic field.
Measurement of Magnetoresistance of Semiconductors
Experimentental Set-up for Magnetoresistance
The set-up consists of the following:
1. Four probe arrangement, DMR-ARR-RM
2. Sample: (Ge: n-type)
3. Constant Current Source, CCS-01
4. Digital Microvoltmeter, DMV-01
5. Electromagnet, EMU-50V
6. Constant Current Power Supply, DPS-50
7. Digital Gaussmeter, DGM-102
(1) Four Probe arrangement°
It consists of 4 collinear, equally spaced (2mm) and individually
spring loaded probes mounted on a PCB strip. Two outer probes
for supplying the constant current to the sample and two inner
probes for measuring the voltage developed across these probes
This eliminates the error due to contact resistance which is
particularly serious in semiconductors A platform is also provided
for placing the sample and mounting the Four Probes on It.
(2) Sample
Ge Crystal (n-type) dimensions: 10 x 10 x 0.5mm.
(Standard Sample included to enable the user to check the
functioning of the setup)

Specifications of following components are as per their
respective datasheets.
(4) D.C. Microvoltmeter, DMV-001
(5) Electromagnet, EMU-75V
(6) Constant Current Power Supply, DPS-175M
(7) Digital Gaussmeter, DGM-202
The experimental set-up is complete in all respect.
INSTRUMENTS PVT. LTD.452 Adarsh Nagar, Roorkee-247667 (Uttarakhand) INDIAPh.: +91-1332-272852, 277118, 271712 • Email: [email protected] • Web: www.sesinstruments.com
SES
ISO 9001:2015
Page-2Page-2
(3) Constant Current Source, CCS-01 (for low resistivity to medium resistivity samples)
It is an IC regulated current generator to provide a constant current to the outer probes irrespective of the changing resistance of the sample due to change in temperatures. The basic scheme is to use the feedback principle to limit the load current of the supply to preset maximum value. Variations in the current are achieved by a potentiometer included for that purpose. The supply is a highly regulated and practically ripples free d.c. source. The constant current source is suitable for the resistivity measurement of thin films of metals/ alloys and semiconductors like germanium.
SpecificationsOpen Circuit Voltage : 10VCurrent Range : 0-20mA, 0-200mAResolution : 10AAccuracy : 0.25% of the reading 1 digitDisplay : 3½ digit, 7 segment LED with
autopolarity and decimal indication
Load Regulation : 0.03% for 0 to full loadLine Regulation : 0.05% for 10% changes
MRX-RMMRX-RM
Magnetoresistance Setup (Research Model)Magnetoresistance Setup (Research Model)

INSTRUMENTS PVT. LTD.
452 Adarsh Nagar, Roorkee-247667 (Uttarakhand) INDIAPh.: +91-1332-272852, 277118, 271712 • Email: [email protected] • Web: www.sesinstruments.com
SES
ISO 9001:2015
MRB-11MRB-11
Measurement of Magnetoresistance in BismuthMeasurement of Magnetoresistance in Bismuth
Measurement of Magnetoresistance in Bismuth
It is noticed that the resistance of
the sample changes when the
magnetic �eld is turned on. The
p h e n o m e n o n , c a l l e d
magnetoresistance, is due to the
fact that the drift velocity of all
the carriers is not same. With the
magnetic �eld on; the Hall
v o l t a g e V = E t = | v x H | y
compensates exactly the Lorentz
force for carriers with the
average velocity; slower carriers
will be over compensated and
faster one undercompensated,
resulting in trajectories that are
not along the applied �eld. This
results in an effective decrease of
the mean free path and hence an
increase in resistivity.
Here the above referred symbols
are de�ned as: v = drift velocity; E
= applied electric �eld; t =
thickness of
the crystal; H = Magnetic �eld
Experimentental Set-up for Magnetorsistance
The set-up consists of the following:
1. Hall Probe: Bismuth
2. Constant Current Source, CCS-01
3. Digital Microvoltmeter, DMV-001
4. Electromagnet, EMU-75 (Speci�cations as per datasheet attached)
5. Constant Current Power Supply, DPS-175 (Speci�cations as per datasheet
attached)
6. Digital Gaussmeter, DGM-102 (Speci�cations as per datasheet attached)
(1) Four Probe Arrangement
It consists of 4 collinear, equally spaced (2mm), gold plated and individually spring
loaded probes mounted on a PCB strip. Two outer probes for supplying the constant
current to the sample and two inner probes for measuring the voltage developed across
these probes. This eliminates the error due to contact resistance which is particularly
serious in semiconductors. A platform is also provided for placing the sample and
mounting the Four Probes on it.
(2) Sample
Material : Bismuth
Dimensions: 10x10x1.2mm.
(3) Constant Current Source, CCS-01
It is an IC regulated current generator to provide a constant current to the outer probes
irrespective of the changing resistance of the sample due to change in temperatures.

INSTRUMENTS PVT. LTD.
452 Adarsh Nagar, Roorkee-247667 (Uttarakhand) INDIAPh.: +91-1332-272852, 277118, 271712 • Email: [email protected] • Web: www.sesinstruments.com
SES
ISO 9001:2015
MRB-11MRB-11
Measurement of Magnetoresistance in BismuthMeasurement of Magnetoresistance in Bismuth Page-2Page-2
The basic scheme is to use the feedback principal to limit
the load current of the supply to preset maximum value.
Variations in the current are achieved by a potentiometer
included for that purpose. The supply is a highly
regulated and practically ripples free d.c. source. The
constant current source is suitable for the resistivity
measurement of this �lms of metals/alloys and
semiconductors like germanium.
Speci�cations
Range : 0-20mA, 0-200mA
Resolution : 10µA
Accuracy : ±0.25% of reading ±1 digit
Display : 3½ digit, 7 segment LED with
autopolar i ty and dec imal
indication
(4) Digital Microvoltmeter, DMV-001
it is a very versatile multipurpose instrument for the
measurement of low dc voltage. It has 5 decade ranges
from 1mV to 10V with 100% over-ranging. For better
accuracy and convenience, readings are directly
obtained on 3½ digit DPM (Digital Panel Meter).
Speci�cations
Range : 1mV, 10mV, 100mV, 1V & 10V
with 100% over-ranging.
Resolution : 1pV
Accuracy : ±0.2% ±1 digit
Stability : Within ±1 digit
input Impedance : >1000MW (10MW on 10V range)
Display : 3½ digit, 7 segment LED with
autopo la r i t y and dec ima l
indication
The details of other sub-units can be had from their
respective datasheets

4. Digital Picoammeter, Model DPM-111
Speci�cations as per datasheet attached
The experimental set-up is complete in all respect
Speci�cations of the oven controller
Temperature Flange : Ambient to 200ºC
Display Accuracy : ±0.3ºC
Setting Type : Front push buttons
Control Method : PID, PIDF, PIDS
Measurement Accuracy : ±0.5ºC (typical)
Oven : Specially designed for Four Probe Set-Up
Sensor : Thermocouple (Chromel-Alumel)
Display : 7 segment LED, two rows
Values : Process Value, PV and Set Value, SV
Power : 150W
The Two Probe Method is one of
the standard and most commonly
u s e d m e t h o d f o r t h e
measurement of resistivity of very
high resistivity samples like
sheets/�lms of polymers. The
resistivity measurement of such
samples is beyond the range of
Four Probe Method.
D e s c r i p t i o n o f t h e experimental set-up
1. Two Probes Arrangement, TPA-01
It has two spring load contact probes. These probes move
in a pipe and are insulated by Te�on washers. This probes
arrangement is mounted in a suitable stand, which also
holds the sample plate and RTD sensor. The stand also
serves as the lid of PID Controlled Oven. Te�on coated
leads are provided for connecting wit High Voltage
Power Supply EHT-11 and Digital Picoammeter DPM-
111. With this set-up assuming max. Voltage = 1500V;
current 10x10-¹² A (max) and thickness of sample 1mm,
the resistivity of the sample could be measured upto
10¹4 ohm.cm..
2. PID Controlled Oven, PID-TZ
The unit is a high quality PID controller wherein the
temperatures can be set and controlled easily. The P, I
and D parameters are factory set for immediate use,
however, the user may adjust these for speci�c
applications as well as auto-tune the oven whenever
required. The steps for these are given in the user
manual. Although the controller may be used either for
our small oven, up to 200ºC or a larger oven up to 600ºC,
however, in the present setup only small oven is to be
used. The controller uses thermocouple as temperature
sensor.
3. High Voltage Power Supply, Model EHT-11
Speci�cations as per datasheet attached
Two Probe Method for resistivity measurement of insulators at different temperatures
INSTRUMENTS PVT. LTD.
452 Adarsh Nagar, Roorkee-247667 (Uttarakhand) INDIAPh.: +91-1332-272852, 277118, 271712 • Email: [email protected] • Web: www.sesinstruments.com
SES
ISO 9001:2015
TPX-200TPX-200
Two Probe SetupTwo Probe Setup

Two Probe Method for resistivity measurement of near insulators at different temperatures (ambient to 200ºC) with computer interfacing facilityIntroductionThe Two Probe Method is
one of the standard and
most commonly used
m e t h o d f o r t h e
m e a s u r e m e n t o f
resistivity of very high
resistivity samples near
insulators. The resistivity
measurement of such
samples is beyond the
range of Four Probe
Method.
Description of the Experimental Set-up1.Two Probes Arrangement, TPA-01It has two spring load contact probes. These probes move in a
pipe and are insulated by te�on washers. This probes
arrangement is mounted in a suitable stand, which also holds
the sample plate and RTD sensor. The stand also serves as the
lid of PID Controlled Oven. Te�on coated leads are provided
for connecting with High Voltage Power Supply EHT-11-C1
and Digital Picoammeter DPM-111-C2. With this set�up
assuming maximum voltage l500V; minimum current
10-¹² A and thickness of sample 1mm, the resistivity of
the sample could be measured upto 10¹4 ohm.cm..
2. PID Controlled Oven (PID-TZ-C1)Speci�cations as per datasheet attached.
3. DPM-111-C2 Speci�cations as per datasheet attached.
4. EHT-11-C1 Speci�cations as per datasheet attached.
5. Computer Interface, SES-CAMMThis interface (SES-CAMM) provides, option to user, to
interface the setup with the computer for acquiring data (temperature, current and voltage) and plotting it in real time. The data
can also be stored in an excel �le which can be used for further analysis. The software is menu driven and can be operated very
easily.
The set-up is complete in all respect, except the computer.
INSTRUMENTS PVT. LTD.
452 Adarsh Nagar, Roorkee-247667 (Uttarakhand) INDIAPh.: +91-1332-272852, 277118, 271712 • Email: [email protected] • Web: www.sesinstruments.com
SES
ISO 9001:2015
TPX-200CTPX-200C
Two Probe SetupTwo Probe Setup

INSTRUMENTS PVT. LTD.452 Adarsh Nagar, Roorkee-247667 (Uttarakhand) INDIAPh.: +91-1332-272852, 277118, 271712 • Email: [email protected] • Web: www.sesinstruments.com
SES
ISO 9001:2015
TPX-600CTPX-600C
Two Probe SetupTwo Probe Setup
DescriptionBehaviour of resistivity of substarte such as polymer sheets/ films at higher temperatures is an important area of investigation due to their variety of applications. Two Probe Method is one of the standard and most commonly used method for the measurement of resistivity of very high resistivity samples like sheets/films of polymers. The resistivity measurement of such samples is beyond the range of Four Probe Method.
Description of the experimental set-up
1. Two Probes Arrangement
It has two individually spring loaded probes. The probes arrangement is mounted in a suitable stand of high quality alumina which also holds the sample plate. To ensure the correct measurement of sample temperature, the thermocouple junction is embedded in the sample plate just below the sample. This stand also serves as the lid of temperature controlled oven. Proper leads are provided for connection to Capacitance Meter and Temperature Controller.
2. High Temperature OvenThis is a high quality temperature controlled oven. The heating element used is a high grade Kanthal-D. It is mounted on a custom made groved, sintered alumina fixture to avoid any slippage of heating wire.
Two Probe Method For Resistivity Measurement of Near Insulators at Different Temperatures o(Ambient to 600 C) with computer interfacing facility
Heat shield is also provided to reduce the excessive heating of outer cover. Further the top portion is also suitably covered to meet the safety standard. The oven has been designed for fast heating and cooling rates, which enhances the effectiveness of the controller.
3. PID Temperature Controller
The unit is a high quality PID controller wherein the temperatures can be set and controlled easily. The P, I and D parameters are factory set for immediate use however the user may adjust these for specific applications as well as auto-tune the oven whenever required. The steps for these are given in the user manual. Although the controller may be used either for our small oven, up to 200°C or a larger oven up to 600°C, however, in the present setup only large oven is to be used. The controller uses thermocouple as temperature sensor.

6. Computer Interface, SES-CAMM
An interface (SES-CAMM) provides the option to the user to interface it with the computer for acquiring and storing the data (temperature, current and voltage) and plotting in real time. The data is also stored in an excel file which can be used for further analysis. The software is menu driven and can be operated very easily.
Interfacing : PC connectivity through USB. Individual unit connectivity through BNC connector
Software : Fully integrated software capable of display and storing data in different configuration . Compatible with Window XP/ 7/ 8.
The experimental set-up is complete in all respect
INSTRUMENTS PVT. LTD.452 Adarsh Nagar, Roorkee-247667 (Uttarakhand) INDIAPh.: +91-1332-272852, 277118, 271712 • Email: [email protected] • Web: www.sesinstruments.com
SES
ISO 9001:2015
TPX-600CTPX-600C
Two Probe SetupTwo Probe Setup Page-2Page-2
Specifications
Temperature Range : Ambient to 600°C
Power Supply : 100-240VAC; 50/60Hz
Display : Method 7 Segment LED display [Processing value (PV):Red, Setting value (SV):Green]
Input Sensor : Thermocouple (Chromel – Alumel)
Control Method : PID, ON/OFF Control, P, PI, PD, PIDF, PIDS
Display Accuracy : ± 0.3%Setting Type : Setting by front push buttonsProportional Band (P) : 0 to 100.0%Integral Time (I) : 0 to 3600 SecDerivative Time (D) : 0 to 3600 SecControl Time (T) : 1 to 120 SecSampling Time : 0.5 SecSetting (P, I & D) : Manual / AutoInterfacing : USB connection through SES-
CAMM
4. High Voltage Power Supply, Model EHT-11C
Specifications as per datasheet attached
5. Digital Picoammeter, Model DPM-111C
Specifications as per datasheet attached

INSTRUMENTS PVT. LTD.452 Adarsh Nagar, Roorkee-247667 (Uttarakhand) INDIAPh.: +91-1332-272852, 277118, 271712 • Email: [email protected] • Web: www.sesinstruments.com
SES
ISO 9001:2015
ESR-105ESR-105
Electron Spin Resonance SpectrometerElectron Spin Resonance Spectrometer
system. Now if the electron is subjected to a perturbation by an oscillating magnetic field with its direction perpendicular to the static magnetic field and its frequency�n such that the quantum hn is equal to E=hn , we say that there is a 1 1 0
resonance between n1 and n0. This will induce transition between neighbouring sublevels (m = ±1) and in turn will absorb energy from oscillating field. Thus, at j
resonance, we get a peak due to the absorption of energy by the system.Experimental TechniqueIf we consider a free electron and substitute the proper value of constants in the
-20 -27 equation: g = 2.00, μ = 0.927X10 erg/gauss & h = 6.625 X l0 erg sec, we get0
That is ESR can be observed at radio frequencies in a magnetic field of a few gauss or in the microwave region in a magnetic field of a few kilogauss. The latter alternate has many advantages: improved signal-to-noise ratio, high resolution etc. and is always preferred for accurate work, though it is very sophisticated and expensive. However, if the basic understanding of the subject is the main criteria as is usually the requirement of class room experiments, the observation of ESR in low magnetic field and in a radio frequency region makes it a lot simple, inexpensive and within the reach of every post-graduate laboratory.Description of the ESR SpectrometerA block diagram of the ESR Spectrometer is given below in Fig. 1, and a brief description follows.
Features• FET based marginal R.F. Oscillator
• Digital display of frequency
• Excellent peaks display
• Digital display of Helmoltz Coil Current
• Compatible with general purpose CRO in X-Y mode
IntroductionIn recent years Magnetic Resonance has developed into a very useful and powerful tool in solid state research. In this method, use is made of the Zeeman interaction of the magnetic dipoles associated with the nucleus or electron, when placed in an external magnetic field. Accordingly, they are identified as NMR (Nuclear Magnetic Resonance) or ESR (Electron Spin Resonance). This form of spectroscopy finds many applications in the investigation of crystal structures, environmental effects, dynamic effects, defects in solids and in many diverse branches of Physics, Chemistry and Biology.Elementary Magnetic ResonanceWe know that the intrinsic angular momentum (spin) of the electron S couples with the orbital angular momentum of the electron L to give a resultant J and this coupling gives rise to the ‘fine structure’ of the spectra. Further, under the influence of an external magnetic field (H) each of the level will split into (2j+1) sub levels (Zeeman effect) and the splitting of a level will be
DE = (gμ H)mj0
where μ0 is the Bhor magneton, g is the Lande’ g-factor and mj is the magnetic quantum number. As can be seen, the splitting is not same for all levels; it depends on the J and L of the level (s=½ always for one electron). However, the sub levels will split equally by an amount
DE = gμ H or = hn0 0
where n0 is the frequency of the
n0
H0= 2.8MHz/gauss

INSTRUMENTS PVT. LTD.452 Adarsh Nagar, Roorkee-247667 (Uttarakhand) INDIAPh.: +91-1332-272852, 277118, 271712 • Email: [email protected] • Web: www.sesinstruments.com
SES
ISO 9001:2015
ESR-105ESR-105
Electron Spin Resonance SpectrometerElectron Spin Resonance Spectrometer Page-2Page-2
Basic CircuitThe first stage of the ESR circuit consists of a critically adjusted (marginal) radio frequency oscillator with 4-digit frequency display. This type of oscillator is required here, so that the slightest increase in its load decreases the amplitude of oscillation to an appreciable extent. The sample is kept inside the tank coil of the oscillator, which in turn, is placed in the 50Hz magnetic field, generated by the Helmholtz coils. At resonance, i.e. when the frequency of oscillation equal to the Larmour’s frequency of the sample, the oscillator amplitude registeres a dip due to the absorption of power by the sample. This obviously, occurs periodically four times in each complete cycle of the supply voltage. The result is an amplitude modulated carrier which is then detected using a FET demodulator and amplified by an op-amp circuit.Highly stabilised and almost ripple free power supply for the above circuit is obtained using an integrated circuit regulator.Phase ShifterThis can compensate the undermined phase difference which may be introduced in the amplification stages of the spectrometer and oscilloscope.
50Hz Sweep UnitA 50Hz current flows through Helmholtz coils which provides a low frequency magnetic field to the sample. As the resonance is observed at few gauss only, no static magnetic field is applied.
Oscilloscope (not supplied with the Spectrometer)Any inexpensive oscilloscope normally available in the laboratory would be quite suitable.Advantages and Limitations of our Spectrometer1. The instrument is basically designed for postgraduate laboratories
keeping in view their requirements and limitations.2. The observation of ESR at low magnetic fields and consequently in
radio-frequency region makes its instrumentation and working a lot simple and within the reach of a postgraduate students. Goodresonance peaks can be obtained as a class room exercise.
3. The spectrometer is complete in all respects including a sample DPPH (except a CRO).
Fig. 1 : Block diagram of the ESR set-up
DPPH
OSCILLOSCOPE
HELMHOLTZ COILX
Y
50 HzSWEEP UNIT
50 HzPHASE SHIFTER
R.F.OSCILLATOR
DETECTORA.F.
AMPLIFIER
Freq. Display

INSTRUMENTS PVT. LTD.452 Adarsh Nagar, Roorkee-247667 (Uttarakhand) INDIAPh.: +91-1332-272852, 277118, 271712 • Email: [email protected] • Web: www.sesinstruments.com
SES
ISO 9001:2015
NMR-01NMR-01
NMR ExperimentNMR Experiment
IntroductionNuclear Magnetic Resonance (NMR) was discovered by Bloch and Purcell in the year 1945. Over the years it has developed into a very useful and powerful tool in solid state physics, chemistry and biology. In medical application this technique, under the name Magnetic Resonance Imaging (MRI) has been developed as an excellent imaging method for clinical diagnosis. In this method use is made of Zeeman interaction of the magnetic dipoles associated with the nucleus when placed in a external magnetic field.
Elementary Magnetic ResonanceAn atom whose nucleus has a nulcear spin I will have a magnetic moment µ as follows: µ = gµ I (1)n
where µ is nuclear magneton, and g is g factor. Under n
the influence of an external static magnetic field (H), these nuclear magnets can orient in distinct directions. Each spin orientation corresponds to a particular energy level given by: E = gµ Hm (2)n j
with m = -I, -(I-1), ...............(I-1), I where m is magnetic j j
quantum numberThe splitting of levels will therefore be:-
DE = gµ H or = hn (3)n 0
where n is the r. f. frequency applied perpendicular to 0
the static magnetic field. Now if the spins are subjected to a purturbation by an oscillating magnetic field with its direction parallel to the static magnetic field and its frequency n such that the quantum hn is equal to DE�=�1 1
hn , we say that there is a resonance between n and n . 0 1 0
Features1 11• Suitable for H and F
nuclei
• FET based marginal Oscillator
• Digital Display of frequency and current
• Clear display of resonance peaks
• Compatible with general purpose CRO
This will induce transition between neighbouring sub levels (m = I) j
and in turn will absorb energy from the oscillating field. Thus, at resonance, we get a peak due to the absorption of energy by the system.
Experimental TechniqueIn our experiment the NMR signals of Hydrogen nuclei and Fluorine nuclei are detected .Both have only two possible orientations in reference to static magnetic field H since both have proton spin I = 1/2. The sample is placed in an r.f.coil located between the gap of homogeneous magnetic field H. In order to exactly match equation (3), H is modulated at constant frequency (50Hz in our case) by using two modulation coils. Each time when the matching (resonance) condition (Eq. 3) is fulfilled, energy is absorbed from the r.f.coil due to the spin transition.
Proton Resonance

INSTRUMENTS PVT. LTD.452 Adarsh Nagar, Roorkee-247667 (Uttarakhand) INDIAPh.: +91-1332-272852, 277118, 271712 • Email: [email protected] • Web: www.sesinstruments.com
SES
ISO 9001:2015
NMR-01NMR-01
NMR ExperimentNMR Experiment Page-2Page-2
Description of the NMR Spectrometer
The block diagram of the NMR spectrometer is given below in Fig.1 and a brief description follow:-.
Basic Circuit
The first stage of the NMR circuit consists of a critically adjusted (marginal) radio frequency oscillator with 4-digit frequency display. This type of oscillator is required here, so that the slightest increase in its load decreases the amplitude of oscillation to an appreciable extent. The sample is kept inside the tank coil of the oscillator, which in turn, is placed in the 50Hz magnetic field, generated by the Helmholtz coils and a permanent magnet. At resonance, i.e. when the frequency of oscillation equal to the Larmour’s frequency of the sample, the oscillator amplitude registers a dip due to the absorption of power by the sample. This obviously, occurs periodically two times in each complete cycle of the modulating magnetic field. The result is an amplitude modulated carrier which is then detected using a FET demodulator and amplified by an op-amp circuit.
Permanent Magnet
Two high field permanent magnets have been used in H structure and adjusted to produce highly uniform high magnetic field.
50Hz Sweep Unit
A 50Hz current flows through Helmholtz coils which provides a low frequency magnetic field to the sample.
Oscilloscope (not supplied with the Spectrometer).
Any dual trace oscilloscope normally available in the laboratory would be quite suitable.
Advantages and Limitations of our Spectrometer
1. The instrument is basical ly designed for postgraduate laboratories keeping in view their requirements and limitations.
2. The observation of NMR at low perturbing magnetic fields with high ~5KG static field and consequently i n r a d i o - f r e q u e n c y r e g i o n m a k e s i t s instrumentation and working a lot simple and within the reach of postgraduate students. Good resonance peaks can be obtained as a class room exercise.
3. The spectrometer is complete in all respects except a CRO.

Thermoluminescence
Important information about the colour centres can be obtained by measuring the changes that occur when a coloured crystal is gradually heated. As the temperature is raised electrons and holes escape from their traps at an increasing rate. The freed charges can recombine with each other or with other defects and give out luminescence by recombination. The resulting thermoluminescence or ‘glow’ reaches maximum and then decreases to zero as the supply of trapped electrons or holes becomes exhausted. The plot of luminescence intensity verses temperature, taken at a constant heating rate, is called the ‘glow curve’. It may contain one or many glow peaks, depending upon whether there are one or several different kinds of traps.
From the glow curve one determine the trap depth; the deeper the trap, the higher the temperature of the glow peak. A correlation between the temperature at which thermoluminescence occurs and the temperature at which particular band bleach can give valuable information about specific centres.
Typical results obtained from this set-up for KCl crystal are shown in figure.
Fig. A Glow Curve of the luminescent material(KCI crystal), the heating speed is 11K/min
T (K)
T =355KG
INT
EN
SIT
Y I
(nA
)
293273
10
0
20
30
40
50
60
70
80
90
313 333 353 373 393
INSTRUMENTS PVT. LTD.452 Adarsh Nagar, Roorkee-247667 (Uttarakhand) INDIAPh.: +91-1332-272852, 277118, 271712 • Email: [email protected] • Web: www.sesinstruments.com
SES
ISO 9001:2015
TLX-02TLX-02
Study of Thermoluminescence of F-CentresStudy of Thermoluminescence of F-Centres
Pure alkali halide crystals are transparent throughout the visible region of the spectrum. The crystals may be colored in a number of ways
(1) by the introduction of chemical impurities
(2) by introducing an excess of the metal ion
(3) by X-ray, g-ray, neutron and electron bombardment
(4) by electrolysis
A colour centre is a lattice defect that absorbs visible light. The simplest colour center is an F-centre. The name comes from the German word for colour, Forbs. We usually produce F-centres by heating the crystal in excess alkali vapours or by irradiation. The new crystals show an absorption band in the visible or ultraviolet, whereas the original crystals are transparent in that region. This absorption band is called F-band.An F-centre can be regarded as a negative ion vacancy and an electron which is equally shared by the positive ions, surrounding the vacant lattice site. Conversely a hole may be trapped at a +ve ion vacancy or at a -ve ion, giving rise to V- and H-centres respectively.
Colour centres produced by irradiation with X-rays
When a X-ray quantum passes through an ionic crystal, it will usually give rise to a fast photo-electron with an energy of the same order as that of the incident quantum. Such electrons, because of their small mass, do not have sufficient momentum to displace ions and therefore loose their energy in producing free electrons, holes, excitons and phonons. Evidently these while moving near the vacancies form trapped electrons as well as trapped holes.
The trapped-electron or trapped-hole centres so formed can be destroyed (bleached) by illuminating the crystal with light of the appropriate wavelength or warming it.
Study of Thermoluminescence of F-centers in Alkali Halide Crystals

INSTRUMENTS PVT. LTD.452 Adarsh Nagar, Roorkee-247667 (Uttarakhand) INDIAPh.: +91-1332-272852, 277118, 271712 • Email: [email protected] • Web: www.sesinstruments.com
SES
ISO 9001:2015
TLX-02TLX-02
Study of Thermoluminescence of F-CentresStudy of Thermoluminescence of F-Centres Page-2Page-2
The experiment consists of the followingExperimental set-up for creating thermoluminescence(1) Sample: KBr or KCl single crystal(2) Thermolumniscence Temperature Meter, TL-02
Ÿ Digital ThermometerŸ Oven Power Supply
(3) Sample Holder(4) Thermoluniscence Oven (0-423K)(5) Black Box
For measurement of luminescence intensity
(1) Photomultiplier tube: R11558
(2) PMT Housing with biasing circuit and coaxial cables etc.
(3) High Voltage Power Supply, Model: EHT-11
Output : 0-1500V variable (1mA max.)
Regulation : 0.05%
Display : 3½ digit 7-segment LED
(4) Nanoammeter, Model DNM-121
Range : 100nA to 100mA full scale in 4 ranges
Accuracy : 0.2%.
Display : 3½ digit 7-segment LED
Photomultiplier Tube
Specifications of Photomultiplier tube R11558
Spectral Response • Range : 300 to 650(nm) • Peak wave length : 400nm
Photo Cathode Material : Bialkali
Dynode Structure/No. of Stages : CC/9
Maximum Cathode Voltage : 1250Vdc
Maximum Average Anode Current : 0.1mA
Cathode Sensitivity • Minimum : 40µA/lm • Typical : 60µA/lm
Anode Sensitivity • Minimum : 200A/lm • Typical : 600A/lm
Anode to Cathode Supply Voltage : 1000Vdc7Current Amplification : 1.0x10
Anode Dark Current (after 30min) • Typical : 1nA • Maximum : 10nA
PMT HousingThe housing is designed to provide a shielding from stray light and
magnetic field. The slit arrangement at the window is provide to adjust the size of the window according to the inc ident beam and fo r the sa fe ty o f photomultiplier tube when not in use. For E.H.T. input and current output, amphenol connectors are provided. A general purpose biasing circuit, using low noise, metal film resistors, is mounted on the base. The housing can be mounted in any position.
The biasing circuit can be changed to customer’s specification. Minor modification in design of PMT Housing is also possible.
Thermolumniscence Irradiation unit TIU-02 can also be used for this purpose.
complete in all respect, only X-ray facilities required to create F-centers in the crystal.
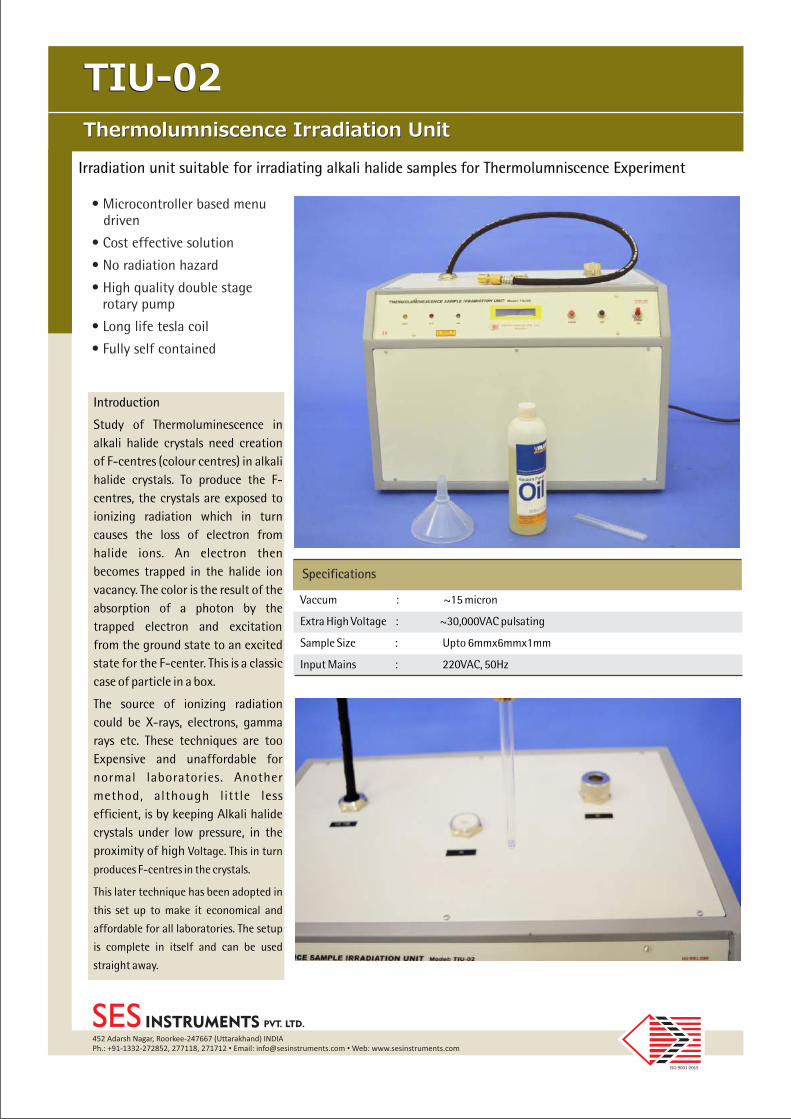
Irradiation unit suitable for irradiating alkali halide samples for Thermolumniscence Experiment
Specifications
Vaccum : ~15 micron
Extra High Voltage : ~30,000VAC pulsating
Sample Size : Upto 6mmx6mmx1mm
Input Mains : 220VAC, 50Hz
Introduction
Study of Thermoluminescence in alkali halide crystals need creation of F-centres (colour centres) in alkali halide crystals. To produce the F-centres, the crystals are exposed to ionizing radiation which in turn causes the loss of electron from halide ions. An electron then becomes trapped in the halide ion vacancy. The color is the result of the absorption of a photon by the trapped electron and excitation from the ground state to an excited state for the F-center. This is a classic case of particle in a box.
The source of ionizing radiation could be X-rays, electrons, gamma rays etc. These techniques are too Expensive and unaffordable for normal laboratories. Another method, although little less efficient, is by keeping Alkali halide crystals under low pressure, in the proximity of high Voltage. This in turn
produces F-centres in the crystals.
This later technique has been adopted in
this set up to make it economical and
affordable for all laboratories. The setup
is complete in itself and can be used
straight away.
INSTRUMENTS PVT. LTD.452 Adarsh Nagar, Roorkee-247667 (Uttarakhand) INDIAPh.: +91-1332-272852, 277118, 271712 • Email: [email protected] • Web: www.sesinstruments.com
SES
ISO 9001:2015
TIU-02TIU-02
Thermolumniscence Irradiation UnitThermolumniscence Irradiation Unit
• Microcontroller based menu driven
• Cost effective solution
• No radiation hazard
• High quality double stage rotary pump
• Long life tesla coil
• Fully self contained

INSTRUMENTS PVT. LTD.452 Adarsh Nagar, Roorkee-247667 (Uttarakhand) INDIAPh.: +91-1332-272852, 277118, 271712 • Email: [email protected] • Web: www.sesinstruments.com
SES
ISO 9001:2015
HEX-21HEX-21
Hall Effect ExperimentHall Effect Experiment
Hall Probe (Ge Crystal)
Ge single crystal with four spring-type pressure contacts is mounted on a sunmica-decorated bakelite strip. Four leads are provided for connections with measuring devices.
Technical details
Material : Ge single crystal n or p-type as desired
Resistivity : 8-10W.cm
Contacts : Spring type (solid silver)
Zero-field potential : <1mV (adjustable)
Hall Voltage : 25-35mV/10mA/KG
It is designed to give a clear idea to the students about Hall Probe and is recommended for class room experiment. A minor drawback of this probe is that it may require zero adjustment.
(b) Hall Probe (InAs)
Indium Arsenide crystal with 4 soldered contacts is mounted on a PCB strip and covered with a protective layer. The Hall Element is mounted in a pen-type case and a 4-core cable is provided for connections with the measuring device and current source.
IntroductionThe resistivity measurements of semiconductors can not reveal whether one or two types of carriers are present; nor distinguish between them. However, this information can be obtained from Hall Coefficient measurements, which are also basic tools for the determination of carrier density and mobilities in conjuction with resistivity measurement.TheoryAs you are undoubtedly aware, a static magnetic field has no effect on charges unless they are in motion. When the charges flow, a magnetic field directed perpendicular to the direction of flow produces a mutually perpendicular force on the charges. When this happens, electrons and holes will be separated by opposite forces. They will in turn produce an electric field (E ) which depends on the cross product of the h
magnetic intensity, H, and the current density, J. E = RJ x Hh
Where R is called the Hall CoefficientNow, let us consider a bar of semiconductor, having dimension, x, y and z. Let J is directed along X and H along Z then E will be along Y.h
Then we could write V /y V .zh h
R = —— = —— JH IHWhere V is the Hall voltage appearing between the two h
surfaces perpendicular to y and I=JyzHall Effect experiment consists of the following:
1. Hall Probe (Ge Crystal) n & p-type2. Hall Effect Set-up, DHE-21C3. Electromagnet, EMU-50V4. Constant Current Power Supply, DPS-50C5. Digital Gaussmeter, DGM-202C

INSTRUMENTS PVT. LTD.452 Adarsh Nagar, Roorkee-247667 (Uttarakhand) INDIAPh.: +91-1332-272852, 277118, 271712 • Email: [email protected] • Web: www.sesinstruments.com
SES
ISO 9001:2015
Page-2Page-2
Technical DetailsContacts : SolderedRated Control Current : 4mAZero Field Potential : <4mVLinearity (0-20KG) : ±0.5% or betterHall Voltage : 60-70mV/4mA/KGThe crystal alongwith its four contacts is visible through the
protective layer. This is mainly used as a transducer for the
measurement of magnetic field.
Hall Effect Set-up, DHE-21C
DHE-21C is a high performance instrument of outstanding flexibility. The set-up consists of a digital millivoltmeter and a constant current power supply. The Hall voltage and probe current can be read on the same digital panel meter through a selector switch. The unit is made compatible with SES-CAMM interface unit, for computer control option. (i) Digital Millivoltmeter
Intersil 3½ digit single chip A/D Converter ICL 7107 have been used. It has high accuracy like, auto zero to less than 10µV, zero drift of less than 1µV/°C, input bias current of 10pA max. and roll over error of less than one count. Since the use of internal reference causes the degradation in performance due to internal heating, an external reference has been used. Digital voltmeter is much more convenient to use in Hall experiment, because the input voltage of either polarity can be measured.
Specifications
Range : 0-200mV (100mV minimum)
Accuracy : ±0.1% of reading ±1 digit
(ii) Constant Current Power Supply
This power supply, specially designed for Hall Probe, provides 100% protection against crystal burn-out due to excessive current. The supply is a highly regulated and practically ripple free dc source.
SpecificationsCurrent : 0-20mAResolution : 10µAAccuracy : ±0.2% of the reading ±1 digit Load regulation : 0.03% for 0 to full loadLine regulation : 0.05% for 10% variation
Datasheets of other sub units is available separately. The experiment in complete in all respect.
HEX-21HEX-21
Hall Effect ExperimentHall Effect Experiment

INSTRUMENTS PVT. LTD.
452 Adarsh Nagar, Roorkee-247667 (Uttarakhand) INDIAPh.: +91-1332-272852, 277118, 271712 • Email: [email protected] • Web: www.sesinstruments.com
SES
ISO 9001:2015
HEX-21CHEX-21C
Hall Effect Experiment (with computer interface)Hall Effect Experiment (with computer interface)
Hall Probe (Ge Crystal)Ge single crystal with four spring-type pressure contacts is mounted on a sunmica-decorated bakelite strip. Four leads are provided for connections with measuring devices.
Technical details Material : Ge single crystal n or p-type as
desired Resistivity : 8-10W.cm Contacts : Spring type (solid silver) Zero-�eld potential : <1mV (adjustable) Hall Voltage : 25-35mV/10mA/KG
It is designed to give a clear idea to the students about Hall Probe and is recommended for class room experiment. A minor drawback of this probe is that it may require zero adjustment. Hall Effect Set-up, DHE-21C
DHE-21C is a high performance instrument of outstanding �exibility. The set-up consists of a digital millivoltmeter and a constant current power supply. The Hall voltage and probe current can be read on the same digital panel meter through a selector switch.The unit is made compataible with SES-CAMM
IntroductionThe resistivity measurements of semiconductors can not reveal whether one or two types of carriers are present; nor distinguish between them. However, this information can be obtained from Hall Coef�cient measurements, which are also basic tools for the determination of carrier density and mobilities in conjuction with resistivity measurement.TheoryAs you are undoubtedly aware, a static magnetic �eld has no effect on charges unless they are in motion. When the charges �ow, a magnetic �eld directed perpendicular to the direction of �ow produces a mutually perpendicular force on the charges. When this happens, electrons and holes will be separated by opposite forces. They will in turn produce an electric �eld (E ) which depends on the cross product of the h
magnetic intensity, H, and the current density, J. E = RJ x Hh
Where R is called the Hall Coef�cientNow, let us consider a bar of semiconductor, having dimension, x, y and z. Let J is directed along X and H along Z then E will be along Y.h
Then we could write V /y V .zh h
R = �� = �� JH IHWhere V is the Hall voltage appearing between the two h
surfaces perpendicular to y and I=JyzHall Effect experiment consists of the following:
1. Hall Probe (Ge Crystal) n & p-type2. Hall Effect Set-up, DHE-21C3. Electromagnet, EMU-50V4. Constant Current Power Supply, DPS-50C5. Digital Gaussmeter, DGM-202C6. Computer Interface, SES-CAMM2

INSTRUMENTS PVT. LTD.
452 Adarsh Nagar, Roorkee-247667 (Uttarakhand) INDIAPh.: +91-1332-272852, 277118, 271712 • Email: [email protected] • Web: www.sesinstruments.com
SES
ISO 9001:2015
Page-2Page-2
interface unit, for computer control option.
(i) Digital MillivoltmeterIntersil 3½ digit single chip A/D Converter ICL 7107 have been used. It has high accuracy like, auto zero to less than 10µV, zero drift of less than 1µV/°C, input bias current of 10pA max. and roll over error of less than one count. Since the use of internal reference causes the degradation in performance due to internal heating, an external reference has been used. Digital voltmeter is much more convenient to use in Hall experiment, because the input voltage of either polarity can be measured.
Speci�cationsRange : 0-200mV (100mV minimum)Accuracy : ±0.1% of reading ±1 digit
(ii) Constant Current Power SupplyThis power supply, specially designed for Hall Probe, provides 100% protection against crystal burn-out due to excessive current. The supply is a highly regulated and practically ripple free dc source.
Speci�cationsCurrent : 0-20mAResolution : 10µAAccuracy : ±0.2% of the reading ±1 digit Load regulation : 0.03% for 0 to full loadLine regulation : 0.05% for 10% variation
Computer Interface, SES-CAMMAn interface (SES-CAMM) enables the userto operate the hall effect setup through a computer. the interface is attached to
any USB port and on activation a GUI shows the computer control, data storage and graph plotting of the experiment. Also included is the option for automatic computation of hall coef�cient, carrier mobility and carrier density.
Datasheets of other sub units is available separately.
The experiment in complete in all respect.
HEX-21CHEX-21C
Hall Effect Experiment (with computer interface)Hall Effect Experiment (with computer interface)

Hall Effect Experiment
Introduction
When a current-carrying conductor is placed in a magnetic field perpendicular to the current direction, avoltage develops transverse to the cuurent. This voltage was first observed in 1879 by Edwin Hall and theeffect is called Hall Effect.
The Hall effect has since led to a deeper understanding of the details of the conduction process. It can yieldthe density of the charge carriers as well as their sign. The hall voltage for p-carriers has opposite signfrom that for n-carriers. Therefore if a semiconductor with p-type doping is gradually heated up, moreand more electrons from its valence band will go to conduction band. As a result hall voltage would fallrapidly with temperature and even become zero or change sign. At the point of zero Hall Coefficient, it ispossible to determine the ratio of mobilities b=m /m . The Hall coefficient inversion is a characteristic ofonly p-type semiconductors.
e h
Hall Effect Experiment (Research Model)
HEX-RM-150
As you are aware, a static magnetic field has no effect on charges unless they are in motion. When thecharges flow, a magnetic field directed perpendicular to the direction of flow produces a mutuallyperpendicular force on the charges. When this happens, electrons and holes will be separated byopposite forces. They will in turn produce an electric field (E ) which depends on the cross product of themagnetic intensity, H, and the current density, J.
E = RJ x H where R is called the Hall Coefficient
Now, let us consider a bar of semiconductor, having dimension, x, y and z. Let J be directed along X and Halong Z then E will be along Y.
Then we could write
V /y V .zR =—— = ——
JH IH
Where V is the Hall voltage appearing between the two surfaces perpendicular to y and I=Jyz
h
h
h
h h
h
Theory

The set-up consists of the following.
Ge single crystal with four spring type pressure contacts ismounted on a glass-epoxy strip. Leads are provided forconnections with the current source andHall voltage measuring devices.
It is a small oven which could be easily mounted over thecrystal or removed if required.
Cromel-Alumel thermocouple with its junction at a distance of1mm from the crystal.
1.Hall Probe (Ge: p-type), HPP-RM-33
Oven
Temperature Sensor
Hall Effect experiment consists of the following
3.Hall Probe (Ge Crystal), HPN-RM
Ge single crystal with four spring-type pressurecontacts is mounted on a sunmica-decorated bakelitestrip. Four leads are provided for connections withmeasuring devices.
Technical details
Material : Ge single crystal n-type
Resistivity : 8-10 .cm
Contacts : Spring type (solid silver)
Zero- Field potential : <1mV (adjustable)
Hall Voltage : 25-35mV/10mA/KG
W
2.Hall Probe (without sample), HPP-RM-33NS
Same Hall Probe at HPP-33, except that it comes without sample, to enable the user to mounttheir own sample.
4.Hall Probe (Si Crystal), HPSi-RM
Si single crystal with four spring-type pressure contactsis mounted on a sunmica-decorated bakelite strip.Four leads are provided for connections withmeasuring devices.
Technical details
Material : Si single crystal n-type
Resistivity : 14-15 .cm
Contacts : Spring type (solid silver)
Zero- Field potential : <1mV (adjustable)
Hall Voltage : 25-35mV/10mA/KG
This probe is very similar to HPN-RM.
W

452 Adarsh Nagar, Roorkee-247667 (UK) India, Ph.: +91-1332-272852, 277118, Fax 271712
Website: www.sesinstruments.com Email: [email protected]; [email protected]
(b) Constant Current Power Supply
Specifications
Range : 0-20mA, 0-200mA
Resolution : 10 A
Accuracy : ±0.25% of reading ±1 digit
Display : 3½ digit, 7 segment LED with autopolarity and decimal indication
m
7.Hall Effect Set, DHE-RM-150
5. Electromagnet, EMU-75T
6. Constant Current Power Supply, DPS-175-C2
7. Digital Gaussmeter, DGM-202-C1 (
( )
( )
)
Refer datasheet for specifications
Refer datasheet for specifications
Refer datasheet for specifications
(a) Digital Millivoltmeter
Specifications
Range : 1mV, 10mV, 100mV, 1V& 10V with 100% over-ranging.
Resolution : 1 V
Accuracy : ±0.2% ±1 digit
Stability : Within ±1 digit
Input Impedance : >1000M(10M on 10V range)
Display : 3½ digit, 7 segmentLED with autopolarity anddecimal indication
m
WW
5.Hall Probe (without sample), HP10-RM
6.Hall Probe (without sample), HP05-RM
Same Hall Probe at HPN-RM, except that it comes without sample, to enable the user to mounttheir own sample of 10x10mm size.
Same Hall Probe at HPN-RM, except that it comes without sample, to enable the user to mounttheir own sample of 5x5mm size.
Optional Attachments
The setup is complete in all respect
This model of Hall Effect Experiment may be connected to a computer for datalogging purposes. Necessary hardware and software can be ordered with the system.

INSTRUMENTS PVT. LTD.
452 Adarsh Nagar, Roorkee-247667 (Uttarakhand) INDIAPh.: +91-1332-272852, 277118, 271712 • Email: [email protected] • Web: www.sesinstruments.com
SES
ISO 9001:2015
Hall Effect in BismuthHall Effect in Bismuth
Hall Probes
Bismuth Hall Probe
Bismuth strip with four spring-type pressure contacts is mounted on a sunmica-decorated bakelite strip. Seperate leads are provided for connections with measuring devices.
Technical details Material : Bismuth
-4 Resistivity : 1.29 x 10 W.cm Contacts : Spring type (solid silver) Zero-�eld potential : <1mV (adjustable) Hall Voltage : 25-35mV/10mA/KG
It is designed to give a clear idea to the students about Hall Probe and is recommended for classroom experiment. A minor drawback of this probe is that it may require zero adjustment.
TheoryAs you are undoubtedly aware, a static magnetic �eld has no effect on charges unless they are in motion. When the charges �ow, a magnetic �eld directed perpendicular to the direction of �ow produces a mutually perpendicular force on the charges. When this happens, electrons and holes will be separated by opposite forces. They will in turn produce an electric �eld (E ) which depends on the cross product of the h
magnetic intensity, H, and the current density, J. E = RJ x Hh
Where R is called the Hall Coef�cientNow, let us consider a bar of semiconductor, having dimension, x, y and z. Let J is directed along X and H along Z then E will be along Y.h
Then we could write V /y V .zh h
R = �� = �� JH IHWhere V is the Hall voltage appearing between the two h
surfaces perpendicular to y and I=Jyz
IntroductionWhen a current-carrying conductor is placed in a magnetic �eld perpendicular to the current direction, a voltage develops transverse to the current. This voltage was �rst observed in 1879 by Edwin Hall and the effect is called Hall Effect.The Hall effect has since led to a deeper understanding of the details of the conduction process. It can yield the density of the charge carriers as well as their sign.
Hall Effect experiment consists of the following:1. Hall Probe : Bismuth2. Constant Current Source, CCS-013. Digital Microvoltmeter, DMV-01 4. Electromagnet, EMU-75 (Speci�cations as per datasheet
attached) 5. Constant Current Power Supply, DPS-175 (Speci�cations
as per datasheet attached)6. Digital Gaussmeter, DGM-102 (Speci�cations as per
datasheet attached)
HEX-BiHEX-Bi

INSTRUMENTS PVT. LTD.
452 Adarsh Nagar, Roorkee-247667 (Uttarakhand) INDIAPh.: +91-1332-272852, 277118, 271712 • Email: [email protected] • Web: www.sesinstruments.com
SES
ISO 9001:2015
Page-2Page-2
Current SourceConstant Current Source, CCS-01
It is an IC regulated current generator to provide a constant current to the outer probes irrespective of the changing resistance of the sample due to change in temperatures. The basic scheme is to use the feedback principal to limit the load current of the supply to preset maximum value. Variations in the current are achieved by a potentiometer included for that purpose. The supply is a highly regulated and practically ripples free d.c source. The constant current source is suitable for the resistivity measurement of this �lms of metals/alloys and semiconductors like germanium.Speci�cationsRange : 0-20mA, 0-200mAResolution : 10�AAccuracy : ±0.25% of reading ±1 digitDisplay : 3½ digit, 7 segment LED with
autopolarity and decimal indication
Voltage MeterDigital Microvoltmeter, DMV-001
It is a very versatile multipurpose instrument for the measurement of low dc voltage. It has 5 decade ranges from 1mV to 10mv with 100% over-ranging. For better accuracy and convenience, readings are directly obtained on 3½ digit DPM (Digital Panel Meter).Speci�cationsRange : 1mV, 10mV, 100mV, 1V & 10V with
100% over-ranging.Resolution : 1�VAccuracy : ±0.2% ±1 digitStability : Within ±1 digit
Input Impedance : >1000MW (10MW on 10V range)
Display : 3½ digit, 7 segment LED with autopolarity and decimal indication
HEX-BiHEX-Bi
Hall Effect in BismuthHall Effect in Bismuth

there are six electrons to be shared between these two bands. The result is that at the interatomic distance in tungsten there are holes in the d band and electrons in the s band, making tungsten predominantly a hole conductor.This sort of mixed (electrons and holes) conduction is a general characteristic of transition metals. The apparatus consists of the following:
a) Hall Probes-Silver(HP-Ag) Technical Details
Material : Silver(8X6X0.05 mm) Contacts : Press Type for current Spring type for Voltage Hall Voltage : ~17 mV/10A/10KG
b) Hall Probe-Tungsten (HP-W) Technical Details
Material : Tungten Strip (8 x 6 x 0.05 mm)Contacts : Press type for current Spring Type for VoltageHall Voltage : ~15 mV/10A/10KG
INSTRUMENTS PVT. LTD.452 Adarsh Nagar, Roorkee-247667 (Uttarakhand) INDIAPh.: +91-1332-272852, 277118, 271712 • Email: [email protected] • Web: www.sesinstruments.com
SES
ISO 9001:2015
Hall Effect in MetalHall Effect in Metal
Hall Effect enables the charge carrier concentration and mobility to be determined by experiment. Direction of the Hall Voltage in silver indicates negative charge carriers, which is in agreement with concepts of the model of the ‘free electron gas‘. Limitations of this model are shown by the so called ‘ abnormal Hall Effect’ of tungsten. The experiment carried out under identical conditions for tungsten show the Hall Voltage to have about same magnitude but opposite direction as in silver.This can be explained by the ‘Energy Band diagram’. The
2 6 4 2tungsten atom has …….5s 5p 5d 6s electronic structure. When the atoms come close together to form the solid, the close lying states 5d and 6s broaden into bands, with s band broadening considerably more than the d band. This is because of the larger size of the s orbital. The figure schematically shows the allowed energies as a function of the interatomic distance. The number of allowed states isten per atom in the d band and two in the s band. In tungsten
HEM-01HEM-01

INSTRUMENTS PVT. LTD.452 Adarsh Nagar, Roorkee-247667 (Uttarakhand) INDIAPh.: +91-1332-272852, 277118, 271712 • Email: [email protected] • Web: www.sesinstruments.com
SES
ISO 9001:2015
Page-2Page-2
c) High Current Power Supply, Model PS-20A Specification Range : 0-20A continuosly variable Accuracy : ±0.5% Regulation : ±0.5% for ±10% variation of mains Display : 3½ digit, 7 Segment LED
d) Digital Microvoltmeter, DMV-001It is a very versatile multipurpose instrument for the measurement of low dc voltage. It has 5 decade ranges from 1mV to 10mv with 100% over-ranging. For better accuracy and convenience, readings are directly obtained on 31/2 digit DPM (Digital Panel Meter).
Specifications Range : 1mV, 10mV, 100mV, 1V & 10V
with 100% over-ranging. Resolution : 1μV Accuracy : ±0.2% ±1 digit Stability : Within ±1 digit Input Impedance : >1000MW (10MW�on 10V range) Display : 3½ digit, 7 segment LED with
autopolarity and decimal indication
e) Electromagnet, Model EMU-75TSpecificationPole Pieces : 75mm tappered to 25mmMag. Field : 17KG ±5% at 10mm airgapEnergising Coils : Two of approx. 13 eachPower : 0-90Vdc, 3A, for coils in series
0-45Vdc, 6A, for coils in parallelf) Constant Current Power Supply, DPS-175Mg) Gaussmeter, DGM-202
The experiment is complete in all respect.
Hall Effect in MetalHall Effect in Metal
HEM-01HEM-01
HALL EFFECT IN METALSample thickness : 0.05 mm
Magnetic Field (KG)
-60
-50
-40
-30
-20
-10
0
10
20
30
40
50
60
0 2 4 6 8 10 12 14 16 18 20
Ha
llV
olt
ag
e(
V)
I=19A
I=13A
I=7A
I=7A
I=13A
I=19A
Silver
I = Probe Current
m
Tungsten

Hall Effect Setup
Description
Dependence of Hall Coefficient on Temperature
HEX-33
The Hall voltage for p-carriers has opposite sign from that for n-carriers. Therefore if a semiconductor
with p-type doping is gradually heated up, more and more electrons from its valence band will go to
conduction band. As a result hall voltage would fall rapidly with temperature and even become zero or
change sign. At the point of zero Hall Coefficient, it is possible to determine the ratio of mobilities
b=m /m . The Hall coefficient inversion is a characteristic of only p-type semiconductors.
The set-up consists of the following. The Hall Probe comes complete with
Ge single crystal with four spring type pressure contacts is mounted on a glass-epoxy strip.
Leads are provided for connections with the current source and Hall voltage measuring devices.
It is a small 12W oven mounted over the crystal for heating from ambient to 100 C.
Cromel-Alumel thermocouple with its junction at a distance of 1mm from the crystal.
The set-up, DHE-33 consists of two sub units to handle the probe parameters (probe current and hall
voltage) and measurement of temperature. While the probe current is generated and measured by
e h
1.Hall Probe (Ge: p-type), HPP-33
2. Hall Effect Set-up :DHE-33
Oven
Temperature Sensor
°

A constant current source (0-20mA) having a
resolution of 10 A, the hall voltage is measured
by a high input resistance millivoltmeter in the
range 0-200mV having a resolution of 100mV.
The Probe.
m
Current and hall voltage are both
displayed on a 16 x 4 line LCD display. The
sample temperature is controlled by a
microcontroller based PWM heater current
source. Thermo emf of the thermocouple is
converted into temperature and is displayed on
the same 16 x 4 line LCD display on the panel.
Temperature range is ambient to 100 C and
resolution is 1 C.
3Refer datasheet for specifications
Refer datasheet for specifications
Refer datasheet forspecifications
. Electromagnet, EMU-50V
4.Constant Current Power Supply, DPS-50/DPS-50-C1
5.Digital Gaussmeter, DGM-202/DGM-202-C1/ DGM-102
( )
( )
(
)
°
°
Dependance of Hall Coefficient on TemperatureSample: Ge (p-type) medium doping (Hall Probe with small oven)
Ha
llC
oeff
icie
nt
x1
0(c
mco
ulo
bm
)3
-1
28
26
24
22
20
18
16
14
12
10
8
6
4
2
0
-2
-4 0 5 10 15 20 25 30 35 40 45 50 55 60 65 70 75 80 85 90 95 100105115
Temperature ( C)0
452 Adarsh Nagar, Roorkee-247667 (UK) India, Ph.: +91-1332-272852, 277118, Fax 271712
Website: www.sesinstruments.com Email: [email protected]; [email protected]
Computer connectivity along with required hardware and software are optional and can be ordered asrequired.
The experiment is complete in all respect.
Optional

Hall Effect Setup
Description
Dependence of Hall Coefficient on Temperature
HEX-33C
The Hall voltage for p-carriers has opposite sign from that for n-carriers. Therefore if a semiconductor
with p-type doping is gradually heated up, more and more electrons from its valence band will go to
conduction band. As a result hall voltage would fall rapidly with temperature and even become zero or
change sign. At the point of zero Hall Coefficient, it is possible to determine the ratio of mobilities
b=m /m . The Hall coefficient inversion is a characteristic of only p-type semiconductors.
The set-up consists of the following. The Hall Probe comes complete with
Ge single crystal with four spring type pressure contacts is mounted on a glass-epoxy strip.
Leads are provided for connections with the current source and Hall voltage measuring devices.
It is a small 12W oven mounted over the crystal for heating from ambient to 100 C.
Cromel-Alumel thermocouple with its junction at a distance of 1mm from the crystal.
The set-up, DHE-33 consists of two sub units to handle the probe parameters (probe current and hall
voltage) and measurement of temperature. While the probe current is generated and measured by
e h
1.Hall Probe (Ge: p-type), HPP-33
2. Hall Effect Set-up :DHE-33
Oven
Temperature Sensor
°

A constant current source (0-20mA) having a
resolution of 10 A, the hall voltage is measured
by a high input resistance millivoltmeter in the
range 0-200mV having a resolution of 100mV.
The Probe. Current and hall voltage are both
displayed on a 16 x 4 line LCD display.
m
The
sample temperature is controlled by a
microcontroller based PWM heater current
source. Thermo emf of the thermocouple is
converted into temperature and is displayed on
the same 16 x 4 line LCD display on the panel.
Temperature range is ambient to 100 C and
resolution is 1 .
3Refer datasheet for specifications
Refer datasheet for specifications
Refer datasheet for specifications
. Electromagnet, EMU-50V
4.Constant Current Power Supply, DPS-50 C1
5.Digital Gaussmeter, DGM-202-C1
( )
( )
( )
-
°
° C
Dependance of Hall Coefficient on TemperatureSample: Ge (p-type) medium doping (Hall Probe with small oven)
Ha
llC
oeff
icie
nt
x1
0(c
mco
ulo
bm
)3
-1
28
26
24
22
20
18
16
14
12
10
8
6
4
2
0
-2
-4 0 5 10 15 20 25 30 35 40 45 50 55 60 65 70 75 80 85 90 95 100105115
Temperature ( C)0
452 Adarsh Nagar, Roorkee-247667 (UK) India, Ph.: +91-1332-272852, 277118, Fax 271712
Website: www.sesinstruments.com Email: [email protected]; [email protected]
In addition to the above, this Hall Effect Experimentmay be connected to a computer for data loggingpurposes. Necessary hardware and software areincluded in the system.
The experiment is complete in all respect.

INSTRUMENTS PVT. LTD.452 Adarsh Nagar, Roorkee-247667 (Uttarakhand) INDIAPh.: +91-1332-272852, 277118, 271712 • Email: [email protected] • Web: www.sesinstruments.com
SES
ISO 9001:2015
QTX-01QTX-01
Quinckʼs Tube MethodQuinckʼs Tube Method
IntroductionIt was established by Faraday in 1845 that magnetism is universal property of every substance. He classified all magnetic substances into two classes, viz., paramagnetic and diamagnetic. Weber, later on, tried to explain para and diamagnetic properties on the basis of molecular currents. The molecular current gives rise to the intrinsic magnetic moment to the molecule, and such substances are attracted in a magnetic field, and called paramagnetics. The repulsion of diamagnetics is assigned to the induced molecular current and its respective reverse magnetic moment. The force acting on a substance, either of repulsion or attraction, can be measured with the help of an accurate balance in case of solids or with the measurement of rise in level in narrow capillary in case of liquids. The force depends on the susceptibility K, of the material, i.e., on ratio of intensity of magnetisation to magnetising field (I/H). Evidently it refers to that quantity of substance by virtue of which bodies get magnetised. Quantitatively it refers to the extent of induced magnetisation in unit field. If the force on the substance and field are measured, the value of susceptibility can be calculated.The value of the susceptibility K of liquid aqueous solution of a paramagnetic substance in air is given by a well know expression: 2(r – s)gh K = ------------
2 Hwhere r is the density of the liquid or solution s is the density of air g is the acceleration due to gravity
h is the height through which column rises on switching on the fieldH is the magnetic field at the centre of pole pieces
Apparatus For The Measurement of Susceptibility of Paramagnetic Solution by Quinck’s Tube Method
ProcedureThe apparatus consists of U-shaped tube known as Quinck’s tube. One of the limb of the tube is wide and the other one narrow. The experimental liquid or solution is filled in the tube and is placed in such a way that the meniscus of the liquid in narrow limb is at the centre of the magnetic field.The level of the liquid in the narrow tube is read by a travelling microscope when magnetic field is off. The magnetic field is switched on and the new raised level of the column is again read with the travelling microscope.The apparatus consists of the following:• Quinck’s tube with stand• Sample: MnSO 2H O4 2
• Digital Balance 500gms (LC:0.1gm)• RD Bottle• Mixing Bottle• Electromagnet, Model: EMU-50T• Constant Current Power Supply, Model: DPS-50• Digital Gaussmeter, Model: DGM-102• Travelling Microscope

INSTRUMENTS PVT. LTD.452 Adarsh Nagar, Roorkee-247667 (Uttarakhand) INDIAPh.: +91-1332-272852, 277118, 271712 • Email: [email protected] • Web: www.sesinstruments.com
SES
ISO 9001:2015
QTX-01QTX-01
Quinckʼs Tube MethodQuinckʼs Tube Method Page-2Page-2
Travelling Microscope(Horizontal and Vertical)
The bed is of heavy casting, thoroughly aged, machined and is fitted with levelling screws. On the dovetail guide ways
slides the horizontal carriage which can be clamped at any position by means of a thumb screw. A second sliding carriage slides along a gun metal vertical pillar fitted on the horizontal carriage. The slow motion guide bars are made of sturdy material and the motion is very smooth.Optics(i) True achromatic objective with 7.5cm focussing distance(ii) 10X Ramsden eyepiece with fine cross wireScale and Vernier(i) Horizontal scale: 20cm divided at 0.5mm interval(ii) Vertical scale: 15cm divided at 0.5mm interval(iii) Venier scales: 50 divisions with a least count of 0.01mm
The setup is complete in all respect
For details of other subunits, kindly refer to their respective datasheets

INSTRUMENTS PVT. LTD.452 Adarsh Nagar, Roorkee-247667 (Uttarakhand) INDIAPh.: +91-1332-272852, 277118, 271712 • Email: [email protected] • Web: www.sesinstruments.com
SES
ISO 9001:2015
GMX-01GMX-01
Gouyʼs MethodGouyʼs Method
I n t h e G o u y ’ s m e t h o d o f susceptibility measurement, the solid sample in the form of a long cylinder (area of cross section A) is hung from the pan of a balance and is placed such that one end of the sample is between the pole-pieces of the magnet (field H ) and the other one is outside the field. The force exerted on the sample by the inhomogeneous magnetic field is obtained by measuring the apparent change ( Dm ) in the mass of the sample. The susceptibility c is given by
2c= 2Dmg/AHIf the sample is in the form of powder, it is filled in a long nonmagnetic tube which is then suspended from the pan of the balance.
The set up consists of the following:
(a) Scientific Balance, KSB-07Capacity : 200
gmsSensitivity : 1/10 mg. by vernier Beam : Hard Bronze/ Brass Arrestment : Circular, falling away typeAir Damping : Very quick and positive, beam
coming to rest in 2-3 secChainomatic Device : A gold plated chain is
suspended from the beam with its other end screwed on the Device rotating drum on which a scale graduated from 0 to 10 div each divisionrepresenting 1mg is installed. By the movement of this scale before a vernier, reading upto 1/10th mg is taken
(b) Sample in the form of a long rod: Set of samples(c) Electromagnet, Model EMU-75T
Pole Pieces : 75mm tappered to 25mmMag. Field : 20KG mm airgapEnergising Coils : Two of approx. 13W eachPower : 0-90Vdc, 3A, for coils in series
Apparatus for Measurement of Susceptibility of Paramagnetic Solids by Gouy’s Method
0-45Vdc, 6A, for coils in parallel (d) Constant Current Power Supply, Model DPS-175
(specifications as per datasheet) (e) Gaussmeter, Model DGM-202 or DGM-102
(specifications as per datasheet)
Schematic Diagram Gouy’s Balance Experiment

Gouy’s Experiment
Description
In the Gouy’s method of susceptibility measurement, the solid sample in the form of a
long cylinder (area of cross section A) is hung from the pan of a balance and is placed
such that one end of the sample is between the pole-pieces of the magnet (field H )
and the other one is outside the field. The force exerted on the sample by the
inhomogeneous magnetic field is obtained by measuring the apparent change ( Dm )
in the mass of the sample. The susceptibility c is given By 2 c= 2Dmg/AH If the sample
is in the form of powder, it is filled in a long nonmagnetic tube which is then
suspended from the pan of the balance.
Apparatus for Measurement of Susceptibility of Paramagnetic Solidsby Gouy’s Method
GMX-02 (50)

Sample is provided iwth the steup in the form of a long rod:
Aluminium sample and Glass Tube.
2. Samples
Description of Experimental Set-up
1. Digital Balance, CA-44
Capacity : 40gms
Readability : 0.0001gms
Repeatability : (+/-) 0.1mg
Linearity : (+/-) 0.2mg
Pan Size : 80mm
Standard bidirectional RS-232 interface
Complete with weigh below hook
feature suitable for Gouy’s measurements
Field Intensity : 9.0KG at 10mm air-gap with
tapered pole pieces
Pole Pieces : 50mm diameter
Energising Coils : Two, each with a resistance
of about 3.0W
Power Requirement : 0-30Vdc, 4A, if coils are
connected in series
Weight : 33Kg
3. Electromagnet, Model EMU-50T
Current Range : Smoothly adjustable from 0-4A
Load Regulation : 0.1% for load variation from 0 to max.
Line Regulation : 0.1% for ±110% mains variation
Display : 3½ digit, 7 segment LED DPM
Power : 220V ±10%, 50Hz
4. Constant Current Power Supply, Model DPS-50

452 Adarsh Nagar, Roorkee-247667 (UK) India, Ph.: +91-1332-272852, 277118, Fax 271712
Website: www.sesinstruments.com Email: [email protected]; [email protected]
The setup is complete in itself
Resolution : 1 gauss at 2 kilogauss range
Range : 2KG and 20KG
Accuracy : ±0.5%
Temperature : Upto 40ºC
Display : 3½ digit, 7 segment LED DPM with
auto polarity and overfow indication
Power : 220V ±10%, 50Hz
Transducer : Hall Probe-GaAs
Special Feature : Indicates the direction of
the magnetic field
5. Gaussmeter, Model DGM-202
6. GMX-02 Trolley, Model GMX-TR2

INSTRUMENTS PVT. LTD.452 Adarsh Nagar, Roorkee-247667 (Uttarakhand) INDIAPh.: +91-1332-272852, 277118, 271712 • Email: [email protected] • Web: www.sesinstruments.com
SES
ISO 9001:2015
GMX-02GMX-02
Gouyʼs MethodGouyʼs Method
In the Gouy’s method of susceptibil ity measurement, the solid sample in the form of a long cylinder (area of cross section A) is hung from the pan of a balance and is placed such that one end of the sample is between the pole-pieces of the magnet (field H ) and the other one is outside the field. The force exerted on the sample by the inhomogeneous magnetic field is obtained by measuring the apparent change ( Dm ) in the
mass of the sample. The susceptibility c is given by
2c= 2Dmg/AHIf the sample is in the form of powder, it is filled in a long nonmagnetic tube which is then suspended from the pan of the balance.
The set up consists of the following:
(a) Digital Balance, CA-44Capacity : 40gmsReadability : 0.0001gms Repeatability : (+/-) 0.1mgLinearity : (+/-) 0.2mgPan Size : 80mmStandard bidirectional RS-232 interfaceComplete with weigh below hookfeature suitable for GMX-01measurement
(b) Sample in the form of a long rod: Aluminium sample and Glass Tube
(c) Electromagnet, Model EMU-75TPole Pieces : 75mm tappered to 25mmMag. Field : 20KG mm airgapEnergising Coils : Two of approx. 13W eachPower : 0-90Vdc, 3A, for coils in series
0-45Vdc, 6A, for coils in parallel (d) Constant Current Power Supply, Model DPS-175
(specifications as per datasheet) (e) Gaussmeter, Model DGM-202 (specifications as per
datasheet)(f) GMX-02 Trolley, Model GMX-TR2
The experiment is complete in all respect.
Apparatus for Measurement of Susceptibility of Paramagnetic Solids by Gouy’s Method
Schematic Diagram Gouy’s Balance Experiment

INSTRUMENTS PVT. LTD.
452 Adarsh Nagar, Roorkee-247667 (Uttarakhand) INDIAPh.: +91-1332-272852, 277118, 271712 • Email: [email protected] • Web: www.sesinstruments.com
SES
ISO 9001:2015
HLT-111HLT-111
Hysteresis Loop TracerHysteresis Loop Tracer
� Measures magnetic parameters accurately
� Demagnetisation, eddy currents and sample cross-sectional area have been accounted for
� Capable of detecting the number of magnetic phase present in a sample
IntroductionA precise knowledge of various magnetic parameters of ferromagnetic substances, viz. coercivity, retentivity, saturation magnetisation and hysteresis loss, and ability to determine them accurately are important aspects of magnetic studies.The information about the aforementioned properties can be obtained from a magnetic hysteresis loop which can be traced by a number of methods in addition to the slow and laborious ballistic galvanometer method. Among the typical representatives of AC hysteresis loop tracers, some require the ring form of samples while others can be used with thin �lms, wires or even rock samples. Ring form samples are not always practically convenient to make while in others demagnetisation effects sometime become quite important.The present set-up can accept the samples of thin wires of different diameters. The demagnetisation effects, different diameters of samples and eddy currents (due to the conducting property of the material) has been taken into account within the design or graphically.Design PrincipleWhen a cylindrical sample is placed coaxially in a periodically varying magnetic �eld the magnetisation in the sample also undergoes periodic variation. This variation is picked up by a coil, placed coaxially with the sample.For the uniform �eld H produced, the effective �eld H a
acting in the cylindrical sample will be
H = H �NM a
or H = H � NJ (1)a m0
where M is magnetisation, N is normalised demagnetisation factor including 4p and J is the magnetic polarisation de�ned by B = m H+J0
with B=mH or m (H+M) as magnetic induction. The signal 0
corresponding to the applied �eld, H can be written asa
e = C H (2)1 1 a
where C is a constant1
Further the �ux linking with the pick-up coil of area A due c
to sample of area A will bes
f = m (A �A )H�+A B0 c s s
where H� is the �eld in the excess area of the pick-up coil.Under certain conditions this equation reduces to f = m A H+A J0 c s
The signal induced in the pick-up coil (e ) will be proportional 2
to df/dt which after integration yields e = C f = C m A H+C A J (3)3 3 3 0 c 3 s
Solving (1), (2) and (3) gives
AS C C A ( � N) J = C e � m C A e1 3 c 1 3 0 3 c 1 Ac
A N C e 1 3s C C A ( � N) J = C A e � ���1 3 c 3 s 1 A mc 0
Based on these equations the electronic circuit has been designed to give values of J and H and hence the hysteresis loop. Further different magnetic phases present in the sample may also be identi�ed by electronically manipulating the pick-up signal.
Description of the set-up
The block diagram of the set-up is given next and a brief
description now follows:

INSTRUMENTS PVT. LTD.
452 Adarsh Nagar, Roorkee-247667 (Uttarakhand) INDIAPh.: +91-1332-272852, 277118, 271712 • Email: [email protected] • Web: www.sesinstruments.com
SES
ISO 9001:2015
HLT-111HLT-111
Hysteresis Loop TracerHysteresis Loop Tracer Page-2Page-2
Basic CircuitThe magnetic �eld has been obtained with an ac mains driven multilayered solenoid. This magnetic �eld has been calibrated with a Hall Probe for uniformity and correspondence with the magnetic �eld calculated through ac current passing in the solonoid. A small resistance in series with the solenoid serves the purpose of taking a signal e corresponding to H.1
The signal e (corresponding to dJ/dt) is taken from the pick-2
up coil placed at the centre of the solenoid and contains the sample. It is integrated and corrected for phase. This signal is then subtracted from the reference signal e and ampli�ed to 1
give the signal corresponding to J. The e signal is also 1
subtracted from 3e in correct ratio (to account for 3
demagnetisation and area ratio) and ampli�ed to give signal corresponding to H.e is also passed through the differentiator for getting signal 2
2corresponding to d J/dt which is used for phase 2
identi�cation.
ApplicationsThe following magnetic parameters can be measured by this set-up:� Coercivity� Retentivity� Saturation magnetisation� Various magnetic phase identi�cation� Hysteresis lossThe equipment is complete in all respect, including a set of samples (wires of Nickel, and different grades of iron etc.). A Cathode Ray Oscilloscope will however be required.

INSTRUMENTS PVT. LTD.452 Adarsh Nagar, Roorkee-247667 (Uttarakhand) INDIAPh.: +91-1332-272852, 277118, 271712 • Email: [email protected] • Web: www.sesinstruments.com
SES
ISO 9001:2015
HLT-111CHLT-111C
Hysteresis Loop TracerHysteresis Loop Tracer
• Measures magnetic parameters accurately
• Demagnetisation, eddy currents and sample cross-sectional area have been accounted for
• Capable of detecting the number of magnetic phase present in a sample
• Computer Interface provided
IntroductionA precise knowledge of various magnetic parameters of ferromagnetic substances, viz. coercivity, retentivity, saturation magnetisation and hysteresis loss, and ability to determine them accurately are important aspects of magnetic studies.The information about the aforementioned properties can be obtained from a magnetic hysteresis loop which can be traced by a number of methods in addition to the slow and laborious ballistic galvanometer method. Among the typical representatives of AC hysteresis loop tracers, some require the ring form of samples while others can be used with thin films, wires or even rock samples. Ring form samples are not always practically convenient to make while in others demagnetisation effects sometime become quite important.The present set-up can accept the samples of thin wires of different diameters. The demagnetisation effects, different diameters of samples and eddy currents (due to the conducting property of the material) has been taken into account within the design or graphically.Design PrincipleWhen a cylindrical sample is placed coaxially in a periodically varying magnetic field the magnetisation in the sample also undergoes periodic variation. This variation is picked up by a coil, placed coaxially with the sample.For the uniform field H produced, the effective field H acting a
in the cylindrical sample will be
H = H –NM a
or H = H – NJ (1)a m0
where M is magnetisation, N is normalised demagnetisation factor including 4p�and J is the magnetic polarisation defined by B = m H+J0
with B=mH or m (H+M) as magnetic induction. The signal 0
corresponding to the applied field, H can be written asa
e = C H (2)1 1 a
where C is a constant1
Further the flux linking with the pick-up coil of area A due c
to sample of area A will bes
�����������������������f�= m (A –A )H’+A B0 c s s
where H’ is the field in the excess area of the pick-up coil.Under certain conditions this equation reduces to����������������������f = m A H+A J0 c s
The signal induced in the pick-up coil (e ) will be proportional 2
to df/dt which after integration yields e = C f = C m A H+C A J (3)3 3 3 0 c 3 s
Solving (1), (2) and (3) gives
AS C C A ( – N) J = C e – m C A e1 3 c 1 3 0 3 c 1 Ac
A N C e 1 3s C C A ( – N) J = C A e – ———1 3 c 3 s 1 A mc 0
Based on these equations the electronic circuit has been designed to give values of J and H and hence the hysteresis loop. Further different magnetic phases present in the sample may also be identified by electronically manipulating the pick-up signal.
Description of the set-up
The block diagram of the set-up is given next and a brief
description now follows:

INSTRUMENTS PVT. LTD.452 Adarsh Nagar, Roorkee-247667 (Uttarakhand) INDIAPh.: +91-1332-272852, 277118, 271712 • Email: [email protected] • Web: www.sesinstruments.com
SES
ISO 9001:2015
Hysteresis Loop TracerHysteresis Loop Tracer Page-2Page-2
Basic CircuitThe magnetic field has been obtained with an ac mains driven multilayered solenoid. This magnetic field has been calibrated with a Hall Probe for uniformity and correspondence with the magnetic field calculated through ac current passing in the solonoid. A small resistance in series with the solenoid serves the purpose of taking a signal e corresponding to H.1
The signal e (corresponding to dJ/dt) is taken from the 2
pick-up coil placed at the centre of the solenoid and contains the sample. It is integrated and corrected for phase. This signal is then subtracted from the reference signal e and amplified to give the signal corresponding 1
to J. The e signal is also subtracted from 3e in correct 1 3
ratio (to account for demagnetisation and area ratio) and amplified to give signal corresponding to H.e is also passed through the differentiator for getting 2
2signal corresponding to d J/dt which is used for phase 2
identification.
Computer Interface, SES-CAMMThis interface enables the user to get a plot of the B-H Loop on the computer screen as soon as a magnetic field is set soon the hardware. Procedure for initial setting and conduction of experiment are available through the software provided with the unit. In the end, data would be stored in the excel format.
ApplicationsThe following magnetic parameters can be measured by this set-up:• Coercivity• Retentivity• Saturation magnetisation• Various magnetic phase identification• Hysteresis lossThe equipment is complete in all respect, including a set of samples (wires of Nickel, and different grades of iron etc.). A Cathode Ray Oscilloscope and a computer will however be required.Computer is not included with the setup..
HLT-111CHLT-111C

ISO 9001:2015
Study of the energy band-gap and diffusion potential of P-N Junctions
Experimental Determination of :• Reverse saturation current I and material constant h0
• Temperature coefficient of junction voltage dV/dt• Energy band-gap VG0
• Junction capacitance
IntroductionThis is an advanced level experiment to be performed on commercially available diodes viz. germanium or silicon diodes, various types of LED’s and also on the base-emitter/collector-base junctions of a transistor. The results of the experiments not only give the device characteristics but also provide an insight into the properties of the materials used in the fabrication of the junction. In the set-up, all the necessary instrumentation is integrated as a result of which a minimum of external connections need to be made by the user. A CRO is the only accessory that is required.
ExperimentsGiven below is a brief description of the experiments that may be performed.
(a) Reverse saturation current I and material constant h0
The magnitude of I is too small to be measured 0
conveniently and further, it is a function of the applied voltage. The direct measurement of this current is therefore both difficult and erroneous. In the present set-up, readings for the forward V-I� characteristics are obtained by 3½ digit DPM for a wide range of currents.If, V and lnI are plotted on a graph paper a straight line is
obtained. This line intersects the current (lnI) axis at lnI 0
and its slope DV/DlnI may be solved to compute h. (fig.1)
(b) Energy band-gap and temperature coefficient of the junction voltageThe P-N junction under test is kept in a small, fast temperature controlled oven. The temperature is
INSTRUMENTS PVT. LTD.452 Adarsh Nagar, Roorkee-247667 (Uttarakhand) INDIAPh.: +91-1332-272852, 277118, 271712 • Email: [email protected] • Web: www.sesinstruments.com
SES INSTRUMENTS PVT. LTD.452 Adarsh Nagar, Roorkee-247667 (Uttarakhand) INDIAPh.: +91-1332-272852, 277118, 271712 • Email: [email protected] • Web: www.sesinstruments.com
SES
Fig. 1 Reverse Saturation Current
8
6
4
2
0
- 2
- 4
- 6
- 8
- 10
- 120.5 1 1.5 20
10
Junction Voltage (V)
h =
=
q
191.602 x 10- x 0.18-231.38 x 10 x 298 x 4.55
InI 0InI (
I in mA
)
I�0= - 10.9
= -100.19 x 10 A
DV
DlnI
= 4
.55
= 0.18
= 1.54
DV
kT DInI
PN-01PN-01
P-N JunctionsP-N Junctions

compute the junction capacitance. A typical graph between bias voltage and junction capacitance is shown in fig.3.
The experimental set-up consists of the following(1) Study of P-N Junction, Model PN-1 (a) 3½ digit DPM for current/temperature measurements. (b) 3½ digit DPM for bias voltage/junction voltage
measurements. (c) Two parts to connect the diode - one for experiment 1
& 2 and other for experiment 3. (d) Two fixed frequency oscillators (5KHz & 20KHz) with
the same output (200 mV).(2) Fast temperature controlled oven with sensor(3) Set of samples (a) Transistor BC109 (base-emitter)-Si (b) Transistor AC126 (base-emitter)-Ge (c) Diode 1N 5408/1N 4007-SiThe unit is supplied complete with a detailed instruction manual. Sufficient theoretical description is included fora proper understanding. This is followed by a step-by-step procedure and a typical set of readings and results.
adjustable in the range from room temperature to about 80°C. From the readings of the temperature and junction voltage on digital instruments provided on the panel, the temperature coefficient and energy band-gap are computed. (fig.2)
(c) The Junction CapacitanceThe junction capacitance of a typical diode varies in the range 10pf-100pf approximately, as a non-linear function of the reverse voltage. This parameter though important in high frequency circuits, is difficult to measure because of its small value. In the present set-up, the output V and V at two frequencies f & f , where f >f , 1 2 1 2 2 1
are obtained at different values of bias voltage to
INSTRUMENTS PVT. LTD.452 Adarsh Nagar, Roorkee-247667 (Uttarakhand) INDIAPh.: +91-1332-272852, 277118, 271712 • Email: [email protected] • Web: www.sesinstruments.com
SES
ISO 9001:2015
PN-01PN-01
P-N JunctionsP-N Junctions Page-2Page-2
Complete in all respect, except a CRO for capacitance measurement. Typical results obtained are shown in fig. no. 1, 2 & 3.

INSTRUMENTS PVT. LTD.452 Adarsh Nagar, Roorkee-247667 (Uttarakhand) INDIAPh.: +91-1332-272852, 277118, 271712 • Email: [email protected] • Web: www.sesinstruments.com
SES
ISO 9001:2015
DCBC-01DCBC-01
Diodes Characteristics & Boltzman ConstantDiodes Characteristics & Boltzman Constant
• Forward and reverse characteristics of Ge, Si diodes and LEDs
• Study of Zener diode characteristics
• CRO display of forward and reverse characteristics
• Determination of Boltzman Constant
The set-up is provided with a booklet which contains its theory of operation, description, suggestions and discussion of the experiments that may be performed with it.
The experimental set-up consists of the following:
1. Diodes: Rectifier-4007 (Si), Signal diode-1N34 (Ge), Zener 4.7V, LED and transistor BC-109
2. 3½ digit DPM which can measure diode voltage and current through op-amp circuit. This provides near ideal measurements.
3. Circuit to display forward/reverse characteristics of the diodes on a double trace CRO.
4. IC regulated internal power supplies
The experimental set-up is complete in all respect, except a measuring CRO.
GraphGraphGraph
CRO DisplayCRO DisplayCRO Display

INSTRUMENTS PVT. LTD.452 Adarsh Nagar, Roorkee-247667 (Uttarakhand) INDIAPh.: +91-1332-272852, 277118, 271712 • Email: [email protected] • Web: www.sesinstruments.com
SES
ISO 9001:2015
RC-01RC-01
Study of a Transistor Amplifier (RC Coupled)Study of a Transistor Amplifier (RC Coupled)
Features
1. Study of the basic circuit of a RC coupled Amplifier
2. Frequency response of RC coupled Amplifier
3. Effect of negative feedback on the gain and frequency response of the amplifier
4. Effect of positive feedback on the gain and frequency response of the amplifier
5. Verification of the condition of oscillation
6. Study of different classes of amplifier
Introduction
This is a two stage transistor amplifier with a provision for positive and negative feedback. The amount of feedback is adjustable and with the help of this it is even possible to make the amplifier oscillate. A 9V stabilized power is provided on the same board.
The experimental set-up has been laid down on a decorated bakelite board with an aim of providing an easy understanding to the students. All components are well spread out for clarity and easy repairs and replacement. The set-up is provided with a booklet, which contains its detailed theory of operation, description, specifications, suggestions and discussion on the various experiments that may be performed with it.
Measuring/testing instruments required
1. A.C. Millivoltmeter (True R.M.S. A.C. Millivoltmeter, Model: ACM-102)
2. A.F. Oscillator
3. CRO

INSTRUMENTS PVT. LTD.452 Adarsh Nagar, Roorkee-247667 (Uttarakhand) INDIAPh.: +91-1332-272852, 277118, 271712 • Email: [email protected] • Web: www.sesinstruments.com
SES
ISO 9001:2015
MV-01MV-01
Study of MultivibratorsStudy of Multivibrators
Features
• Study of a Bistable Multivibrator.• Study of a Free Running Multivibrator.• Study of a Univibrator.
The free running multivibrator also serve as a pulse generator for the study of bistable multivibrator and univibrator.
Introduction
The set-up consists of circuits of three type of multivibrators : (1) Free running multivibrator (2) Bistable multivibrator (3) Univibrator and their stabilized power supply, all mounted on a decorated bakelite board. Usual provisions for convenient inputs and outputs are provided on binding terminals.
The experimental set-up have been laid down on a decorated bakelite board with an aim of providing an easy understanding to the students. All components are well spread out for clarity and easy repairs and replacement. The set-up is provided with a booklet, which contains its detailed theory of operation, description, specifications, suggestions and discussion on the various experiments that may be performed with it.
The unit is self contained and need no additional accessory, except an Oscilloscope.

INSTRUMENTS PVT. LTD.452 Adarsh Nagar, Roorkee-247667 (Uttarakhand) INDIAPh.: +91-1332-272852, 277118, 271712 • Email: [email protected] • Web: www.sesinstruments.com
SES
ISO 9001:2015
D-1D-1
Characteristics of Semiconductors DiodesCharacteristics of Semiconductors Diodes
Features• Forward and reverse characteristics of Ge, Si diodes and
LED's • Study of Zener diode characteristics
The set-up is provided with a booklet which contains its theory of operation, description, suggestions and discussion of the experiments that may be performed with it.
The experimental set-up consists of the following
1. Diodes: Rectifier-4007 (Si), Signal diode-1N34 (Ge), Zener 5.1V and LED
2. 3½ digit DPM which can measure voltage (0-20V)3. Suitable precision resistances are provided for the
measurement of forward current, Reverse current, in the
range of 10nA to 200mA4. IC regulated variable power supply (0-12V)
The experimental set-up is complete in all respect.

INSTRUMENTS PVT. LTD.452 Adarsh Nagar, Roorkee-247667 (Uttarakhand) INDIAPh.: +91-1332-272852, 277118, 271712 • Email: [email protected] • Web: www.sesinstruments.com
SES
ISO 9001:2015
HP-01HP-01
Study of Hybrid Parameters of a TransistorStudy of Hybrid Parameters of a Transistor
Features
• Study of h parameter (input impedance parameter)11
• Study of h parameter (output admittance parameter)22
• Study of h parameter (forward current transfer ratio)21
• Study of h parameter (reverse voltage feedback ratio)12
• Built-in power supply
Introduction
A transistor has low input impedance and high output impedance and hence the use of Z and Y parameters becomes awkward specially at high frequencies. As a result the hybrid of 'h' parameters are found to be most useful for transistor circuit analysis, because the hybrid parameters form a and high impedance of the transistor. Another advantage is that the parameters h , h and h almost correspond to the actual 11 21 22
operating conditions.
The experimental set-up have been laid down on a decorated bakelite board with an aim of providing an easy understanding to the students. All components are well spread out for clarity and easy repairs and replacement. The set-up is provided with a booklet, which contains its detailed theory of operation, description, specifications, suggestions and discussions on the various experiments that may be performed with it.
Measuring/testing instruments required
• True R.M.S A.C. Millivoltmeter, Model ACM-103 or
• True R.M.S A.C. Millivoltmeter, Model ACM-102 & Oscillator
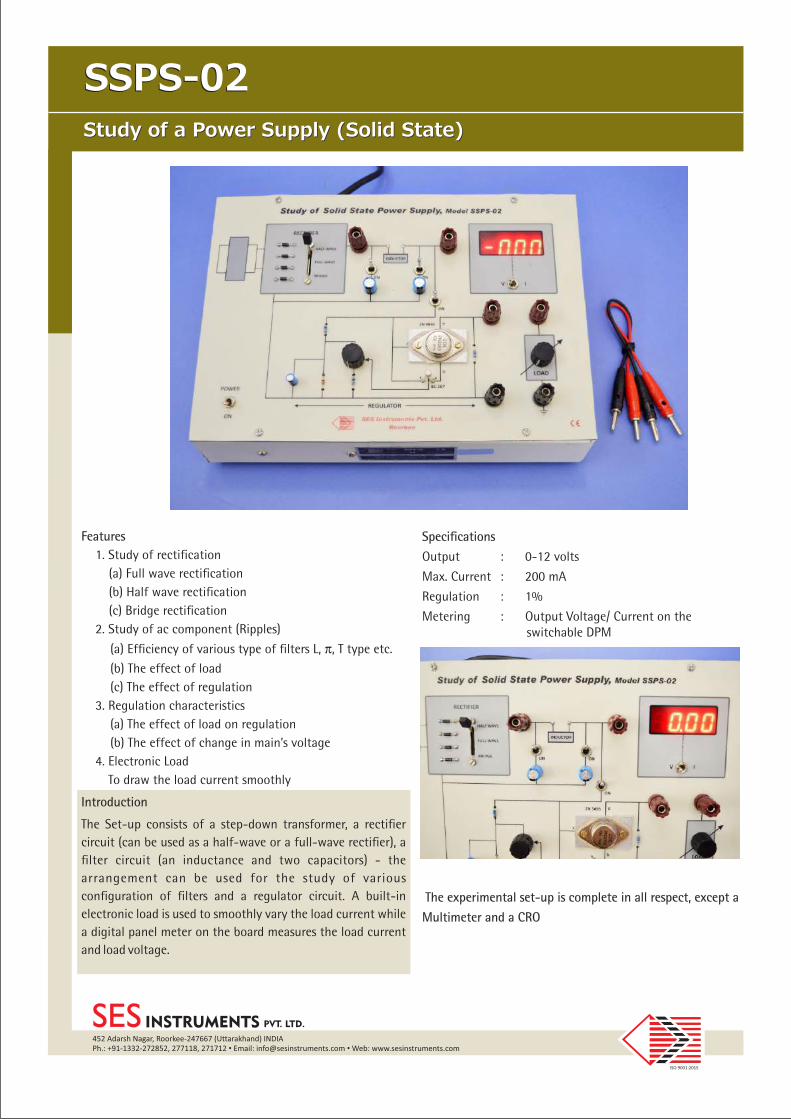
INSTRUMENTS PVT. LTD.452 Adarsh Nagar, Roorkee-247667 (Uttarakhand) INDIAPh.: +91-1332-272852, 277118, 271712 • Email: [email protected] • Web: www.sesinstruments.com
SES
ISO 9001:2015
SSPS-02SSPS-02
Study of a Power Supply (Solid State)Study of a Power Supply (Solid State)
Features1. Study of rectification
(a) Full wave rectification(b) Half wave rectification(c) Bridge rectification
2. Study of ac component (Ripples)
(a) Efficiency of various type of filters L, p, T type etc.
(b) The effect of load(c) The effect of regulation
3. Regulation characteristics(a) The effect of load on regulation(b) The effect of change in main’s voltage
4. Electronic LoadTo draw the load current smoothly
Introduction
The Set-up consists of a step-down transformer, a rectifier circuit (can be used as a half-wave or a full-wave rectifier), a filter circuit (an inductance and two capacitors) - the arrangement can be used for the study of various configuration of filters and a regulator circuit. A built-in electronic load is used to smoothly vary the load current while a digital panel meter on the board measures the load current and load voltage.
Specifications
Output : 0-12 volts
Max. Current : 200 mA
Regulation : 1%
Metering : Output Voltage/ Current on the switchable DPM
The experimental set-up is complete in all respect, except a
Multimeter and a CRO

INSTRUMENTS PVT. LTD.452 Adarsh Nagar, Roorkee-247667 (Uttarakhand) INDIAPh.: +91-1332-272852, 277118, 271712 • Email: [email protected] • Web: www.sesinstruments.com
SES
ISO 9001:2015
MD-01MD-01
Study of Modulation and DemodulationStudy of Modulation and Demodulation
Features
• Study of carrier signal testing.
• Study of variation of modulated wave with the modulation signal.
• Study of detector circuit.
• Built-in power supply
Introduction
The set-up consists of modulating and demodulating circuits. It is provided with a fixed frequency (70 KHz) oscillator, which may be used for carrier frequency. This eliminate the need of a R.F. Oscillator. The carrier signal may be given from any other oscillator also if the change in carrier frequency is desired. Since the circuit is designed for comparatively low frequency (70 KHz to 150 KHz) carrier signal, the usual A.F. Frequency Oscilloscope is good enough.
The experimental set-up have been laid-down on a decorated bakelite board with an aim of providing an easy understanding to the students. All components are well spread out for clarity and easy repairs / replacement. The set-up is provided with a booklet, which contains its detailed theory of operation, description, specifications, suggestions and discussion on the various experiments that may be performed with it.
Measuring/testing instruments required
1. A.F. Oscillator
2. CRO

INSTRUMENTS PVT. LTD.452 Adarsh Nagar, Roorkee-247667 (Uttarakhand) INDIAPh.: +91-1332-272852, 277118, 271712 • Email: [email protected] • Web: www.sesinstruments.com
SES
ISO 9001:2015
741-01741-01
Study of Basic Operational AmplifierStudy of Basic Operational Amplifier
Features
• Working of the basic circuit
• Measurement of bias currents, offset currents and offset voltage
• Study of inverting and non-inverting amplifier configurations
• Introduction to amplifier drift
• Measurement of CMRR and slew rate
• Study of frequency response (band width)
• Built-in power supply
Introduction
The term operational amplifier (Op. Amp.) refers to high gain dc amplifier that has a differential input (two input leads) and a single ended output (one output lead). Op. Amps. have characteristics such as high input resistance, low output resistance, high gain, low drift etc., that make them highly suitable for many applications and therefore, wide spread use in electronic circuits.
The experimental set-up on the study of Op. Amp. consists of a 741 IC with facilities for convenient connections, two regulated power supplies (±12V), a variable voltage source and a multirange digital voltmeter with 3½ digit LED display.
The resistances (0.1% metal film) required are mounted on the board separately, which may be connected as required through patch chords. The student can also connect external components, if required.
The set-up is complete in all respect, but a A.F. oscillator would be required for frequency response.

INSTRUMENTS PVT. LTD.452 Adarsh Nagar, Roorkee-247667 (Uttarakhand) INDIAPh.: +91-1332-272852, 277118, 271712 • Email: [email protected] • Web: www.sesinstruments.com
SES
ISO 9001:2015
741-03741-03
Study of Operational Amplifier ApplicationStudy of Operational Amplifier Application
Features
• Study of linear and non linear applications asŸ IntegratorŸ V - I converterŸ ClipperŸ DifferentiatorŸ I - V converterŸ ClamperŸ SummerŸ Astable MultivibratorŸ Peak DetectorŸ SubtractorŸ Precision rectifierŸ Schmitt Trigger
• Built-in power supply• Built-in square wave and triangular wave Generator• Built-in current source• All components for the experiments suggested are
available on panel
Introduction
The operational amplifier (Op. Amp.) is a versatile device that can be used to amplify dc as well as ac input signals and was originally designed for such mathematical functions as addition, subtraction, multiplication, and integration. Thus the name operational amplifier stemps from its original use for these mathematical operations. With the addition of suitable external feedback components, the modern day op-
amp can be used for a variety of applications such as Voltage to current converter, oscillator, comparators, clippers, clampers, peak detector, Schmitt trigger and others.
The experimental set-up on the study of Op. Amp. consists of a 741 IC with facilities for convenient connections, two regulated power supplies (±12V), two variable voltage source and a multirange digital voltmeter with 3½ digit LED display. The resistances (0.1% metal film), capacitances, diodes etc. as required are mounted on the board separately, which may be connected through patch chords. The student can also connect external components also, if required.
The set-up is complete in all respect. An extra CRO would however be necessary for waveform studies.

INSTRUMENTS PVT. LTD.452 Adarsh Nagar, Roorkee-247667 (Uttarakhand) INDIAPh.: +91-1332-272852, 277118, 271712 • Email: [email protected] • Web: www.sesinstruments.com
SES
ISO 9001:2015
741-05741-05
Signal Generation Applications of Operational Amplifiers Signal Generation Applications of Operational Amplifiers
Features
Ÿ Study of different LC oscillator cirucuits using operational amplifiers type-741Ÿ Wien-Bridge OscillatorŸ Phase Shift OscillatorŸ Twin-T OscillatorŸ Quadrature OscillatorŸ Squre and Triangular Wave OscillatorŸ Sawtooth and Pulse Generator
Ÿ All necessary components are available on the panel
Ÿ Built-in power supply
Ÿ Patch cords and user manual included
Ÿ Accessory require – a dual trace oscilloscope
Introduction
Continuous signals of various kinds form an essential block in the testing of electronic circuits. Signal generation is therefore an important task that needs to be introduced to a student of electronics at an early stage. Particularly important are the medium to low frequency signals that are used so commonly. The present unit is designed to explore the operational amplifier based resistance-capacitor type signal generation circuits of various kinds in the lower kHz region. Besides sinusoidal signals, the study covers square wave, triangular wave, sawtooth and sharp pulse generation. The
description begins with the basic theory of oscillations, viz., the Barkhausen criterion, and discusses various oscillator circuits and their mode of working. Apart from the configurations suggested, additional circuits too may be attempted by the user.
The experimental board comprises of two operational amplifiers and some 24 passive components carefully arranged on it. While the amplifiers are pre-wired with internal power supply, the other components need to be suitably connected using the patch cords provided. Only a dual trace oscilloscope would be required as an accessory. The user manual supplied with the unit covers all technical details for conducting the experiments. References are cited for additional information.

INSTRUMENTS PVT. LTD.452 Adarsh Nagar, Roorkee-247667 (Uttarakhand) INDIAPh.: +91-1332-272852, 277118, 271712 • Email: [email protected] • Web: www.sesinstruments.com
SES
ISO 9001:2015
741-07741-07
Study of OP AMP based LC OscillatorsStudy of OP AMP based LC Oscillators
Features
Ÿ Study of different LC oscillator cirucuits using operational amplifiers type-741Ÿ Hartley OscillatorŸ Tuned Output OscillatorŸ Colpitts OscillatorŸ Clapps Oscillator
Ÿ All necessary components are available on the panel
Ÿ Built-in power supply
Ÿ Patch cords and user manual included
Ÿ Accessory require – a dual trace oscilloscope
Introduction
Sine wave signals at different frequencies find application in the frequency response studies of various electronic circuits and systems. Historically these sine wave signals have been generated using LC tuned circuits and RC circuits, although digitally synthesized signals are now becoming more common. Basic signal generation is therefore an important task that needs to be introduced to a student of electronics at an early stage. Particularly important are the medium to low frequency signals in the audio ranges. Our experimental unit type 741-05 covers RC oscillators while the present unit is designed to explore the operational amplifier based inductance-capacitor type circuits of various kinds in the lower kHz region. The unit has the possibility of a range of
component variation by the user and study their effects. The user manual coversa description of the basic theory of oscillations, viz., the Barkhausen criterion, and discusses various oscillator circuits and their mode of working. Of special interest are the mechanism of amplitude stabilization and the loop phase.
The experimental board comprises of an operational amplifiers and some 17 passive components carefully arranged on it to be suitably connected with patchcords. Only a dual trace oscilloscope would be required as an accessory. The user manual supplied with the unit covers all technical details for conducting the experiments.

INSTRUMENTS PVT. LTD.452 Adarsh Nagar, Roorkee-247667 (Uttarakhand) INDIAPh.: +91-1332-272852, 277118, 271712 • Email: [email protected] • Web: www.sesinstruments.com
SES
ISO 9001:2015
AF-01AF-01
Study of Active FiltersStudy of Active Filters
FeaturesŸ Frequency response studies of various active filter
circuits using operational amplifiers type-741Ÿ Lead/Lag compensatorŸ Low/High pass filterŸ Band Pass/Band Reject filtersŸ All pass filteŸ Twin-T (Notch) filterŸ Adjustable Q Notch filter
Ÿ All necessary components are available on the panel
Ÿ Built-in power supply
Ÿ Patch cords and detailed user manual includedŸ Accessory required– (i) Function Generator (ii) Dual
trace oscilloscope
Introduction
Filters are circuits which have a varied response to different frequencies and are primarily used in applications where one intends to boost or suppress some frequencies. There is naturally a very large number of filter circuits that are in use. The aim here is to suggest a few basic filters that may be constructed using the components available on the experimental board and then determine their frequency response (Bode diagram). The experimental board comprises of two operational amplifiers and some 17 passive components carefully arranged on it to be suitably connected with patchcords. A function generator and a dual trace
oscilloscope would be required as an accessory for determination of the magnitude and the phase responses. The user manual supplied with the unit covers all technical details for conducting the experiments howeverit is recommended that the reader goes through a theoretical analysis of the circuits from available literature and note the significant performance characteristics of each filter that may then be verified.
Although any sine wave source may be used for the experiment, we recommend a DDS dual channel function generator Type JDS 6600 which greatly simplifies the measurements.

INSTRUMENTS PVT. LTD.452 Adarsh Nagar, Roorkee-247667 (Uttarakhand) INDIAPh.: +91-1332-272852, 277118, 271712 • Email: [email protected] • Web: www.sesinstruments.com
SES
ISO 9001:2015
555555
Study of Astable & Monostable MultivibratorsStudy of Astable & Monostable Multivibrators
Features
Ÿ Operation as a free running/ astable multivibrator
Ÿ Operation as a monostable multivibrator
Ÿ Operation as a preset time delay
Introduction
555 timer is a highly stable integrated circuit capable of functioning as an accurate time-delay generator and as an astable multivibrator or free running multivibrator. When used as an oscillator the frequency and duty cycle are accurately controlled by only two external resistors and a capacitor. Some of its important features are timing from micro-seconds through hours, monostable and astable operation, trigger and reset inputs are logic compatible, and output compatible with CMOS, DTL and TTL (when used with 5V supply).
The set-up consists of 555 IC with facilities for convenient connection at the board, a power supply, built-in facilities for various type of triggers-variable frequency, variable voltage, and manual. The resistors and capacitors required are mounted on the board.
The set-up is complete in all respect, including patch chords
Study Of Astable & Monostable Multivibrators Using Timer Ic: 555

INSTRUMENTS PVT. LTD.452 Adarsh Nagar, Roorkee-247667 (Uttarakhand) INDIAPh.: +91-1332-272852, 277118, 271712 • Email: [email protected] • Web: www.sesinstruments.com
SES
ISO 9001:2015
723723
Study of An Integrated Circuit RegulatorStudy of An Integrated Circuit Regulator
Features
Ÿ Study of 723, working as a voltage regulator
Ÿ Study of 723, working as a current regulator
Introduction
The 723 is a monolithic precision voltage regulator constructed on a single silicon chip. The device consists of a temperature compensated reference, error amplifier, power series pass transistor and current limit circuitry. Some of its important features - adjustable output voltage from 2 to 37V, of either polarity, 0.01% line and 0.03% load regulation, output current upto 150mA without external pass transistor make it a general purpose IC for voltage or current regulation.
The experimental set-up consists of an IC 723 with facilities for convenient connections, an unregulated power supply, voltmeter, an ammeter and all the other components - resistances, potentiometers, variable load etc. required to perform the experiments.
The set-up is complete in all respect including patch cords.


SES Instruments Pvt. Ltd.452 Adarsh NagarRoorkee- 247 667 (UK) INDIATel.: +91-1332-272852Fax: +91-1332-277118E-mail : [email protected]
[email protected] : www.sestechno.com;
www.sesinstruments.com