SLM Instruments
132
-
Upload
khangminh22 -
Category
Documents
-
view
0 -
download
0
Transcript of SLM Instruments


SLM Instruments is the leader in the innovative design and manufacture of spectrophotometers and spectrofluorometers for research. From our introduction of fluorescence polarization and time-resolved spectroscopy using the T-OpticsTM lightpath, to our patented dual wavelength system, to the world's only mUlti-harmonic fast Fourier-transform fluorometer, we continue to explore and expand the frontiers of spectroscopy. Our comprehensive line at instruments and accessories answers the demands of the widest range of research applications:
Highest sensitivity in its class • T-Optics polarization • Dual emission wavelengths • Simultaneous multipara meter measurements • Photon counting, analog, and millisecond kinetics
'. , I on each of three channels. SLM 8000CTM Photon Counting Spectrofluorometer
Circle 124
Picosecond lifetimes • Dynamic depolarization • Phase resolved spectroscopy. Three-frequency, continuous, and mUlti-harmonic fast Fourier-transform instruments • SLM 4800CTM and SLM 4800STM Lifetime Spectrofluorometers and SLM 48000MHFTM Multi-harmonic Fourier Fluorometer Circle 125
Outstanding sensitivity and resolution. Complete scanning, ratiometric, and timebase capabilities • Keyboard or computer control • SPF-500CTM Spectrofluorometer
Circle 126
Spectrophotometry Simplifies difficult analyses such as turbid samples, highly scattering samples, whole tissue preparations, and other complex systems • Dual wavelength and split beam modes • Millisecond reaction rate studies • Stand-alone operation or computer control • DW-2000TM Dual Wavelength UVVisible Spectrophotometer Circle 127
Intracellular {AlU;nUHI
Meamrements Designed for dual wavelength fluorescent probes. Simultaneous multiple probe measurements • Unmatched specifications • DMX-1000TM Multiparameter Cation Measuring Spectrofluorometer
Circle 128
Stopped-Flow Kinetics UV-Vis absorption and fluorescence applications • For reactions in the millisecond range or longer • Maintains full instrument capabilities • Easy operation Circle 129
Use the Reader Ser-vice Numbers, or
call or write to us for more information on any SLM products.
SLM Instruments, Inc" 810 West Anthony Drive, Urbana, IL 61801 (217) 384-7730 • (800) 637-7689 • Telex 206079 • FAX (217) 384-7744

Even for the successful chemist or scientist in an allied best way ahead is to make a
mV)IOUnlPllt Service offers the opportunity to in\:rp~lli,,;~tp possibilities discreetly - and at very low cost.
~~.l~ •• ~~_. Service is free to all ACS members. request confidentiality from current employers or ~n~;r,~·'+n.~ organizations there lis a nominal charge.
For more information write, use coupon, or CALL TOLL FREE 800-227-5558
,-------------------------------1
! Employment Services Office. ! i ~~~~i:~e~~~~':~e~~~~: i i Washington. DC 20036 i : Yes. I am a member of ACS and I I I would like to learn how the ACS : I Employment Service can help me \ : advance my career. !
I I
~~~~~~--------------: I
~~~~------------------: I
TAd~d~,,=,,----------------------! I
--------------------------1 I
~Cl~ty~----------------------i I
~S'~a'~'----------~ZmlP~---------1 ____________________________ J

For Over Six Decades ...
lhe leader inl the Field. ANALYTIC/\L CHEMISTRY, the world's foremost publication in the vital field of
measurement SCience, comes to you semi-monthiy packed with more research articles, special features and applica:io:1 papers.
Keeping pace with the changes has continJed to make ANALYTIc/\L CHEMISTRYthe pinnacle of publications in thE field ... for over 6 decades.
For your personal subscription:
CALL TOLL FREE (800) 227-5558 (U.S. onll') Outside U.S. (202) 872-4363
Telex: 440159 UB 892582 ACSPUBS
~... American Chemi.:al Society ~~ 115516thSt.,NW V Washington, DC \'0036

FEBRUARY 15, 1990 VOLUME 62 NUMBER 4
ANCHAM 62(4) 253A-288A1321-416 (1990) ISSN 0003-2700
Registered in U.S. Patent and Trademark Office; Copyright 1990 by the American Chemical Society
ANALYTICAL CHEMISTRY (lSSN 0003-2700) is published semimonthly by the American Chemical Society at 1155 16th St., N.W., Washington, DC 20036. Editorial offices are located at the same ACS address (202-872-4570; FAX 202-872-4574; TOO 202-872-8733). Second-class postage paid at Washington, DC, and additional mailing offices. Postmaster: Send address changes to ANALYTICAL CHEMISTRY Member & Subscriber Services, P.O. Box 3337, Columbus, OH 43210. Claims for missing numbers will not be allowed if loss was due to failure of notice of change of address to be received in the time specified; if claim is dated (a) North America: more than 90 days beyond issue date, (b) all other foreign: more than one year beyond issue date, or if the reason given is "missing from files."
Copyright Permission: An individual may make a single reprographic copy of an article in this publication for personal use. Reprographic copying beyond that permitted by Section 107 or 108 of the U.S. Copyright Law is allowed, provided that the appropriate per-copy fee is paid through the Copyright Clearance Center, Inc., 27 Congress St., Salem, MA 01970. For reprint permission, write Copyright Administrator, Publications Division, ACS, 1155 16th St., N.W., Washington, DC 20036. Registered names and trademarks, etc., used in this publication, even without specific indication thereof, are not to be considered unprotected by law. Advertising Management: Centcom, Ltd., 500 Post Rd. East, Westport, CT 06880 (203-226-7131)
1990 subscription rates include air delivery outside the U.S., Canada, and Mexico
tyr 2 yr Members Domestic $ 29 $ 49 Canada and Mexico 64 119 Europe 96 183 All Other Countries 118 227 Nonmembers Domestic 59 100 Canada and Mexico 94 170 Europe 186 336 All Other Countrres 208 380
Three-year and other rates contact: Member & Subscriber Services, ACS, P.O. Box 3337, Columbus, OH 43210 (614-447-3776 or 800-333-9511). Subscription orders by phone may be charged to VISA, MasterCard, Barclay card, Access, or American Express. Call toll free 800-ACS-5558 in the continental United States; in the Washington, DC, metropolitan area and outside the continental United States, call 202-872-8065. Mail orders for new and renewal subscriptions should be sent with payment to the Business Management Division, ACS, P.O. Box 28597, Central Station, Washington, DC 20005. Subscription service inquiries and changes of address (Include both old and new addresses with ZIP code and recent mailing label) should be directed to the ACS Columbus address noted above. Please allow six weeks for changes to become effective. ACS membership information: Lorraine Bowlin (202-872-4567) Single issues, current year, $8.00 except review issue, $14.00, and LabGuide, $49.00; back issues and volumes and microform editions available by single volume or back issue collection. For information or to order, cal! the number listed for subscription orders by phone; or write the Microform & Back Issues Office at the Washington address. Nonmembers rates in Japan: Rates above do not apply to nonmember subscribers in Japan, who must enter subscription orders with Maruzen Company Ltd., 3-10 Nihonbashi 2-chome, Chuo-ku, Tokyo 103, Japan. Tel: (03) 272-7211.
RE~DRT 265 A Preparative LC. The goal of preparEltive LC is to separate mixtures so that the purified compounds can be used for other purposes. Maurits Verzele of the State University of Gent (Belgium) compares the techniqu e with conventional LC and provides practical information for performing preparative separations
BRII:FS
NEVI'S
INSTRUMENTATION 270 A On the cover. Ultrafast spectroscopy is receiving increasing attention from the analytical chemistry community, although it is far from being commonplace. Mary J. Wirth of the University of Delaware discusses spectroscopy on the ultrafast time scale (10 fs-100 ps) and predicts future developments in this area
258 A
263 A EAS awards to Bard and Armstrong. ~ Bower Science Award. ~ Unpredictable earthquakes
MEETINGS 279 A Con?erences. ~ Short courses and workshops. ~ Call for papers
BooIl(S 281 A Critical reviews. Recently released books on electron microscopy and applied FT -IR spectroscopy are reviewed
NEVIl' PRODUCTS & MANUFACTURERS' LITERATURE 282 A
AUTHOR INDEX 321
ANALYTICAL CHEMISTRY, VOL. 62, NO.4, FEBRUARY 15, 1990 • 257 A

ElFlIIEFS
Articles
Nonionic Suriactants Used as Exact Mass Internal Standards for the 700-2100 Dalton Mass Range in Fast Atom Bombardment Mass Spectrometry 322 Low concentrations of monosubstituted poly(ethylene glycol) and poly(propylene glycol) nonionic surfactants and isolated oligomer fractions of monosubstituted poly(ethylene glycols), adulterated with alkali-metal salts, are routinely used as exact mass internal standards in the F AB peak matching mode for the mass range 700-2100 daltons. Marshall M. Siegel*, Rushung Tsao, and Steven Oppenheimer, American Cyanamid Company, Medical Research Division, Lederle Laboratories, Pearl River, NY 10965 and T. T. Chang, American Cyanamid Company, Chemical Research Division, Stamford, CT 06902
Chromatographic Oligomer Separation of Poly(oxyethylenes) on K + -Form Cation-Exchange Resin 327 A separation method for poly(oxyethylene) chains based on the number of oxyethylenes and complexation with K+ is proposed. The complex formation constants are also chromatographically determined. Tetsuo Okada, Faculty of Liberal Arts, Shizuoka University, Shi~ zuoka 422, Japan
Evaluation of the Effect of Organic Modifier and pH on Retention and Selectivity in Reversed-Phase Liquid Chromatographic Separation of Alkaloids on a Cyclodextrin Bonded Phase 332 A mathematical model is developed using a basic equilibrium-driven approach to explain the effect of mobile-phase composition on the relative retention of ionizable solutes. Three specific cases involving different organic modifiers, different pHs, and different solute pK,s as well as one general case are considered. Daniel W. Armstrong*, Gary L. Bertrand, Karen D. Ward, and Timothy J. Ward, Department of Chemistry, University of Missouri-Rolla, Rolla, MO 65401 and Henry V. Secor and Jeffrey I. Seeman*, Philip Morris Research Center, P.O. Box 26583, Richmond, V A 23261
'Corresponding author
•
Development of a Method for the Sampling and Analysis of Sulfur Dillxide and Nitrogen Dioxide from Ambient Air 338 Triethanolamine-impregnated filters and ion chromatography are used to sample 502 and N02 with sub-ppb detection limits. P::ecision estimates better than ± 15% are found, and accuracy wi thin ± 10% is observed. Joseph E. Sickles, 11*. Peter M. Grohse, Laura L. Hodson, Cynthia A. Salmons, Kelly W. Cox, Ann R. Turner, and Eva D. Estes, R€'search Triangle Institute, Research Triangle Park, NC 27709
Non-Steady-State Gas Chromatography Using Capillary Columns 347
Limiting activity coefficients are measured for diverse systems ushg non-steady-state GC with a wall-coated capillary column. Anatoly J. Belfer, BP Research, Warrensville Research Center, 4440 Warrensville Center Road, Cleveland, OR 44128 and David C. Locke* and Isaac Landau, Chemistry Department, Queens College and The Graduate School, CUNY, Flushing, NY 11367
Pulse Voltammetric Techniques at Microelectrodes in Pure Solvents 349 Pulse v,)ltammetry is applied to the reduction of decyl, butyl, a-,d ethyl iodide at mercury microelectrodes in propylene carbonate without added electrolyte. Malgorzata Ciszkowska and Zbigniew Stojek, Department of ChemistIY, Warsaw University, ul. Pasteura 1, 02-093 Warsaw, Poland and Janet Osteryoung*, Department of Chemistry, State Universit.y of New York, University of Buffalo, Buffalo, NY 14214
Gas Sorlltion to Plasma-Polymerized Copper Phthalocyanine Film Formed on a Piezoelectric Crystal 353 Piezoelectric quartz crystals are covered with plasma-polymerized phthalocyanines. The possibility of a long-lived (more than 60 days) stable gas sensor with a SUb-ppm level detecticn limit for various organic gases is demonstrated. Shigeru Kurosawa, Naoki Kamo*, Daijyu Matsui, and Yonosuke Kc\batake, Faculty of Pharmaceutical Sciences, Hokkaido Universi:y, Sapporo 060, Japan
Binding Studies Using lon-Selective Electrodes. Examination of the Picrate-Albumin Interaction as a Model System 360 ISEs are used to study the binding of ligands to macromolecules. A. computer program that performs nonlinear leastsquares fitting ofthe generalized Scatchard model is used to calculate the binding parameters. TheodOJ~e K. Christopoulos, Laboratory of Analytical Chemistry, University of Athens, 104 Solonos Street, Athens 10680, Greece and Elefthedos P. Diamandis*, Department of Clinical Biochemistry, Toronto Western Hospital, 399 Bathurst Street, Toronto, Ontario M5T 2S:l, Canada
258 A • ANALYTICAL CHEMISTRY, VOL. 62, NO.4, FEBRUARY 15, 1990

Backed by Matheson's more than 60 years of experience. Questionable quality of standard gases or calibration mixtures is intolerable. Purity and consistency are the by-words of the analytical chemist. Matheson'S experience and reputation as a supplier of the highest quality laboratory gases and mixtures eliminate uncertainty. Each Matheson UHP, Zero Gas, and Matheson Purity Gas is guaranteed to be exactly what the label says. Nothing more. Nothing less. Matheson Primary Standatds are of the highest accuracy. Our complex calibration standards required in gas chromatography are the benchmark of the industry. And, our gas handling equipment will never jeopardize the integrity of our gases. So whether your work is in the field of pharmaceuticals, petroleum, lasers, or aerospace ... insist on quality. Insist on Matheson.
APPlICATIONS
DID Discharge Ionization Detector ECD Electron Capture Detector FID Flame Ionization Detector FPD Flame Photometric Detector GADE Gas Density Detector HECD Hall Electroconducti\'it)' Detector HID Helium Ionization Detector :'IPD :'I:itrogen Phosphorus Detector PI]) Photoionization Detector TCD Thermal Conductivity Detector
TID Thermionic Ionization Detector
Matheson® ~ Gas Products World Leader in Specialty Gases & Equipment
30 Seaview Dr., Secaucus, NJ 07096-1587 FAX: (201) 867-4572
SEE US AT PITTCON-BClOTH # 1835 CIRCLE 90 ON READER SERVICE CARD ANALYTICAL CHEMISTRY, VOL. 62, NO.4, FEBRUARY 15, 1990 • 259 A

SRIEEFS
Transport of Catechols through Perfluorinated Cation-Exchange Films on Electrodes 367 The influence of solution parameters (buffer concentration, pH, and methanol concentration) on the distribution constants and diffusion coefficients of catecholamines and related compounds in Nafion films on electrodes is studied. Diffusion coefficients in the film are in the 10-7 cm2/s range. Anna J. Tiidos, Wim J. J. Ozinga, Hans Poppe, and Wim Th. Kok*, Laboratory for Analytical Chemistry, University of Amsterdam, Nieuwe Achtergracht 166. 1018 WV Amsterdam, The Netherlands
Thin-layer Chromatography with Supersonic Jet Fluorometric Detection 374 The sample, separated by thin-layer chromatography, is directly laser desorbed for jet expansion, allowing for the determination of the excitation spectrum and visualization of the chromatogram for chemical species directly on the TLC plate. Totaro Imasaka, Katsunori Tanaka, and Nobuhiko Ishibashi*, Faculty of Engineering, Kyushu University, Hakozaki, Fukuoka 812, Japan
Optimization of Separations in Supercritical Fluid Chromatography Using a Modified Simplex Algorithm and Short Capillary Columns 378 A method development scheme for SFC is described that includes selection of response functions and optimization variables. Initial separations are performed on short capillary columns for rapid analysis and -subsequently transferred to a longer column when necessary. Jeffrey A. Crow and Joe P. Foley', Department of Chemistry, Louisiana State University, Baton Rouge, LA 70803
Determination of Iodine in Oyster Tissue by Isotope Dilution Laser Resonance Ionization Mass Spectrometry 386 The concentration of iodine in SRM 1566a, oyster tissue, is 4.44 j.<g/g with an overall uncertainty of ±0.12j.<g/g. Relative measurement precision is 1.4% for oyster tissue. J. D. Fassett' and T. J. Murphy, Center for Analytical Chemistry, National Institute of Standards and Technology, Gaithersburg, MD 20899
Dual-8eam, Light-Scattering Interferometry for Simultaneous Measurements of Droplet-Size and Velocity Distributions of Aerosols from Commonly Used Nebulizers 390 Dual-beam, light-scattering interferometry is used for the simultaneous measurement of droplet-size and droplet velocity distributions. The technique is tested by characterizing tertiary aerosols produced by five nebulization systems. R. H. Clifford. Izumi Ishii, and Akbar Montaser*, Department of Chemistry, George Washington University, Washington, DC 20052 and G. A. Meyer, Analytical Sciences, Building 1897, Dow Chemical Company, Midland, MI 48667
Kinetic AIPproach to the Measurement of Chemical Oxygen Demand with an Automated Micro Batch Analyzer 395 An auto.:nated micro batch analyzer system continuously monitore. the absorbance of Cr(VI) at 140 DC in 50% H 2S04 and extrapolates results to produce final chemical oxygen demand values. Purnendu K. Dasgupta* and Kaj Petersen, Department of Chemistr;, and Biochemistry, Texas Tech University, Lubbock, TX 79409-1061
Optimization of Multienzyme Flow Reactors for Determination of Acetylt:holine 402 Various immobilization methods are used to achieve improved detection limits for the determination of acetylcholine through optimized enzyme reactor performance. P. Chandrani Gunaratna and George S. Wilson*, Department of Chemistry, University of Kansas, Lawrence, KS 66045
Correspondence Multichannel Electrochemical Detection System for Flow Analysis 407 Tomokazu Matsue*, Atsushi Aoki, Eiji Ando, and Isamu Uchida *, Department of Molecular Chemistry and Engineering, Faculty of Engineering, Tohoku University, Aoba, Sendai 980, Japan
Lanthanum Hexaboride Electron Emitter for Electron Impact and Electron-Induced Dissociation Fourier Transform Ion Cyclotron Resonance Spectrometry 409 Eric L. Kerley, Curtiss D. Hanson, and David H. Russell*, DepartmE'llt of Chemistry. Texas A&M University, College Station, TX 77842
Technical Notes Elimination of Power Line Noise from Transient Signals by Selective Triggering 412 Emilie Lasson and Vernon D. Parker*, Department of Chemistry and Biochemistry, Utah State University, Logan, UT 84322-0300
Real-Timll Monitoring of Iodine in Process Off-Gas by Inductively Coupled Plasma-Atomic Emission Spectroscopy
414 Toshihiro Fujii*, Takashi Uehiro, and Yukihiro Nojiri, Nation* al Institute for Environmental Studies, Tsukuba, Ibaraki 305, Japan and Yoshihiro Mitsutsuka and Hitoshi Jimba, Department of Chemistry, The Meisei University, Hodokubo, Hino 191, Japan
260 A • ANALYTICAL CHEMISTRY, VOL. 62, NO.4, FEBRUARY 15, 1990

You Can Separate Complex Hydrocarbon Mixtures and Get .
• High Resolution
• High Efficiency
• Reproducibility
-6 ::~O~=N~O=~UP OIVISION OF ROHM AND HAAS


~rvEWS' _ ...... _-EAS Awards The Eastern Analytical Symposium (EAS) has announced two of the awards to be presented at its November meeting. Allen Bard will receive the Award for Outstanding Achievement in the Fields of Analytical Chemistry, and Daniel Armstrong will be given the Award in Chromatography.
Allen Bard, who is Hackermm/ Welch Regents Chair at the U niversity of Texas at Austin, receivec his B.S. degree (1955) from City Colle~:e of New York and his M.A. degre" (1956) and Ph.D. (1958) from Harvard University. His research interests include electroanalytical chemistry, ehctrode kinetics and mechanisms, elec;rogenerated chemiluminescence, ph)toelec
trochemistry, and modified electrodes.
Daniel Armstrong received his B.S. degree from Washington & Lee University his M.S. degree (1974) and Ph.D. (1977) from Texas A&M University. He is professor of chemistry and head of the Bioanalytical Research Institute and the Division of Analytical Chemistry at the University of Missouri-Rolla. His current work includes specific detection of enantiomers, computer modeling in molecular recognition, and the development of new analytical techniques.
Franklin Institute's New Award A 87.4 million bequest to Philadelphia's Franklin Institute has established a new international award in scienc". The award is a bequest of Henry Bower, a one-time Philadelphia chemical manufacturer, and will be presented annually beginning this year. Institute officials hope the Bower Science Award will carry the same prestige as the Nobel prizes. Bower's bequest also establishes an award for business leadership.
The science awardee will be selected by a board 0: advisers drawn from 30 nations. The winner will receive at least $250,000 and a gold medal.
Bower was the third generation to own and direct the Henry Bower Chemical Manufacturing Company (named for his grandfather) until his retirement in 1975. Having no heirs or other family members interested in the hus;ness, he sold the company and devoted himself to philanthropic causes until his death in 1988.
Nominations for the science award are accepted from institutions or individuals. For more information, con·;act Larry Tise, Executive Director, Benjamin Franklin .'lational Memorial, The Franklin Institute, 20th and the Benjamin Franklin Parkway, Philadelphia, PA 19103 (2H-488-1329). Deadline is April 17 , the bicentennial of Benj 'min Franklin·s death.
Unpredictable Quakes Computer simulations by Cornell researchers suggest that earthquakes behave chaotically and therefore are inherently unpredictable. Jie Huang and Donald Turcotte found that their model of interconnected earthquake faults exhibited what is known as deterministic chaos, or behavior infinitely sensitive to initial conditions.
The two geologists studied earthquake faults with a wellknown computer model that simulates the sticking and slipping as crustal plates slide past each other. The program mimics plate tectonics with two blocks, connected by springs, that slide on a surface driven back and forth by springs to a third driving block. To better model real faults, Huang and Turcotte ran the simulation with inhomogeneous friction. Because this system displayed chaos, the more complex system of actual earthquake faults will also be chaotic.
If the results hold up, then geologists may have to abandon their dream of predicting earthquakes. Explains Turcotte, "Earthquake prediction will have to be approached like the prediction of storms, from a probabilistic point of view."
For Your Information The American Institute of Chemical Engineers has established a Center for Waste Reduction Technologies to coordinate efforts to reduce rather than just treat pollution. The center will act as a focal point for research, information, and technology exchange among industries, government, and universities.
Thomas Layloff, director of the U.S. Food and Drug Administration's St. Louis Division of Drug Analysis, has been elected president of the Association of Official Analytical Chemists. Layloff received A.B. (1958) and M.A. (1961) degrees from Washington University and a Ph.D. (1963) from the University of Kansas.
Ciba-Geigy has announced that it plans to sell SpectraPhysics and GRETAG, a Swiss-based manufacturer of electronic and photo-finishing equipment.
The National Institute of Standards and Technology (NIST) has prepared a new standard for measuring exhaust emissions from motor vehicles. Each standard contains certified concentrations of propane, carbon monoxide, and carbon dioxide in nitrogen gas. For more information, contact the Office of Standard Materials, NIST, Rm. 204, Bldg. 202, Gaithersburg, MD 20899 (301-975-2762).
Christopher Lowe, director of Biotechnology at the University of Cambridge, has received the Pierce Award in Affinity Chromatography. The award for outstanding contributions to the field was presented at the International Symposium on Affinity Chromatography and Biological Recognition last year.
ANALYTICAL CHEMISTRY. VOL. 62, NO.4, FEBRUARY 15, 1990 • 263 A

Here's Why Two Esteemed, Technical Soc eties Want Your Expertise ...
The American Chemical Society & American Institute of Chemical Engineers Announce their 1990 co-publication of
BIOTECHNC)LOGY PROGR~ESS
Editor, Jerome S. Schultz, University of Pittsburgh
SUBMIT YOUR PAPERS NOW TO THIS IMPORTANT "NEW" PUBLISHING MEDIUM
Beginning January 1990 BIOTECHNOLOGY PROGRESS, a well-established journal of the American Institute of Chemical Engineers, will become a joint publication of the American Chemical Society and AIChE. As a collaborative effort, several significant changes will occur, providing enhanced editorial coverage and expanded readership. These include:
• Accelerated frequency - from quarterly to bimonthly issues I
• A redesigned format which will better meet the needs of both new and current subscribers.
• A redefined editorial focus guaranteed to attract: 1) additional topical papers and primary research
findings 2) an audience comprising the very experts you want
to reach!
ATTENTION CHEMISTS, LIFE SCIENTISTS, AND ENGINEERS!
In bimonthly issues, BIOTECHNOLOGY PROGRESS will provide the latest concepts - in genetics ... microbiology and biochemistry ... molecular and cellular biology ... chemistry and chemical engineering - as they apply to the development of processes, products, and devices. Emphasis will be placed on the application of fundamental engineering principles to the analysis of biological phenomena involved.
BIOTECHNOLOGY PROGRESS will be of particular interest to practitioners of R&D in process development, product development, and equipment/instrumentation design for the biotechnology/bioprocess industry. Its coverage will encompass food, pharmaceutical, and biomedical arenas.
LOOK :mR HIGHLY TARGETED TOPICS LIKE TlfiESE
• Applied Biochemistry: Equilibrium data, protein conformations in solution, mapping of molecular surfaces.
• Applied Molecular Biology: Cell physiology, gene expressiJn, protein transport, metabolic engineering.
• Bioreac':or Technology: Reactor engineering, mechanical engineel ing. materials science, process control, biosensors.
• Biocatalylic Processes: Site specific mutagenesis, enzyme minetics, cofactor regeneration, applied pharmaceutical minetics.
• Formulcltion and Product Delivery.
• Bioanal'(sis: Online monitoring, containment, containment monitorillg, offline analysis, statistical analysis (nonlinear regression, multifactor analysis).
• BiosepE:rations.
..... 1 ...................... ..
ADDRESS YOUR MANUSCRIPT SUBMISSIONS & AUTHOR INQUIRIES TO:
Jerome S. Schultz I Editor, BIOTECHNOLOGY PROGRESS I Center for Biotechnology and Bioengineering
Universily of Pittsburgh 911 William Pitt Union Pittsbur(lh, PA 15260 Telephone: 412/648-7956 Fax: 412/624-7145
To receive editorial updates please write: American Chemical Society, Marketing, BIOTECHNOLOGY PROGRESS, Room 609, 1155 Six-:eenth St., N.W., Washington, D.C. 20036 FAX: 202/872-6005
I Telex: 440159 ACSP UI or 89 2582 ACSPUBS
264 A • ANALYTICAL CHEMISTRY, VOL. 62, NO.4, FEBRUARY 15, 1990

!-,I!1~1!.1
!';j 11!JJ J l~l!J~/~.:Ji j:l
Maurits Verzele laboratory of Organic Chemistry State University of Gent Krijgslaan 281 (S4) B-9000 Gent Belgium
Interest in preparative liquid chromatography (LC) is reflected by several recent events, including a series of international symposia, the seventh of which (Prep-90) will be held in Gent, Belgium, in April, and the appearance of a journal and several books devoted to the subject (1-3).
When Michael Tswett began to perform chromatography at the beginning of the century, he used an adsorbent as a stationary phase and a nonpolar solvent as the developing fluid. (This form of chromatography is known today as "normal-phase" LC.) The preparative aspects of Tswett's work were first exploited by organic chemists who used preparative LC to isolate natural compounds on a preparative scale. As it developed, chromatography became an analytical tool to identify and quantitate compounds in mixtures, but preparative LC continued to be used extensively in organic and pharmaceutical research laboratories where organic compounds and natural products were synthesized.
The first preparative LC separations to attract more general attention, about 30 years after the discovery of chromatography, were those of Kuhn and Winterstein (4, 5), followed by
0003-2700/90/0362-265A/$02.50/0 © 1990 American Chemical Society
Zechmeister and Cholnoky (6), Strain (7), and Karrer and Strong (8). These researchers separated gram amounts of mixture" of plant pigments (chlorophylls, :<anthophylls, and carotenes) and other natural products (pepperpungent compounds and capsanthin). All of these separations involved colored sub ,tances that could be easily detected in glass columns. When the separation was complete, the column packing material was pushed out of the column and the visible bands cut apart and extracted with a suitable solvent.
After World War II preparative LC evolved slowly. Slight pressure (less than 1 ba) was often applied, and step gradient elution (rinsing the column with solvents of increasing polarity) was used rather than column extrusion. Preparative thin-layer chromatography (TLC) also was used extensively. During this period, silica gel was introduced a, a new stationary adsorbent and the particle size of the column packing material-which during Tswett's time was very small (1-10 /Lm)-was increased to 200-500 /Lm. UV spectrometry or TLC of the collected fractions was used for off-line detection. Such pre;oarative LC in glass columns is still in use in many laboratories.
Although some very large-scale moving-bed iodustrial separations (9), such as those used for molasses or xylenes, could be called chromatography, these procedures are inefficient for phase exchange and are clearly different from high-performance preparative LC.
Intere,t in instrumental high-per-
formance preparative LC is, of course, the result of the development of instrumental high-performance analytical LC. This technique developed rapidly after 1970 thanks to the introduction of reliable high-pressure pumps, efficient on-stream detectors, and the reintroduction of smaller, fully porous silica gel particles (10). Chemical derivatization of silica gel stationary-phase particles also made modern instrumental LC more reliable and accessible for both analytical and preparative applications (11).
Preparative vs, analytical LC
Because the goal of preparative LC is to separate mixtures so that the purified compounds can be used for other purposes, the mass throughput ofthe chromatographic system must be optimized. The amount of sample that can be separated depends on the column size, the relative retention of the compounds, and the capacity of the twophase system.
With good column technology, the sample size is linearly proportional to the column or stationary-phase size. Thus columns of increased size are used when large samples are to be separated. It is not always easy, however, to achieve good column technology.
Relative retention, or alpha value, is the most important parameter in determining possible sample size. It is therefore essential to maximize this value, and time devoted to optimizing it will always be well spent. A general relationship between the alpha value
ANALYTICAL CHEMISTRY, VOL. 62, NO.4, FEBRUARY 15, 1990 • 265 A

and sample size cannot be used because too many variables are involved. Figure 1 shows the relationship between resolution, the required plate number, and the alpha value. Clearly, alpha values of 1.1 are readily acceptable for analytical separations. This is not the case, however, for preparative LC, which is never performed under linear chromatographic conditions and for which column efficiency can be reduced because of sample overloading.
Figure 2 relates column efficiency with sample size for standard LC conditions. Large-particle columns are practically unaffected by sample size but are inefficient and cannot handle difficult separations. Modern smallparticle columns are significantly affected by sample size but can handle a wider range of separation problems. Optimization of relative retention is thus very important in preparative LC.
Different chromatographic modes have different capacities, which also influence the amount of sample that can be separated. The capacity difference between adsorption and partition chromatography is small but slightly favors adsorption LC. The capacity of an ionexchange column depends exclusively on the exchange capacity of the stationary phase, which can be as high as 5 meq/g; small ion-exchange systems are thus able to accommodate very high sample loading. Size exclusion chromatographic columns generally have very small sample capacities.
In analytical LC, compounds do not affect each other's partition ratio. There is ample room on the surface of the stationary phase and in the mobile phase to allow partitioning of the compounds in the mixture to proceed independently. The unavoidable concentration changes involve primarily the linear portion of the adsorption isotherm of all compounds. In such linear LC, the alpha values do not change during the chromatographic run, the peaks are symmetrical, and fundamental LC theory applies.
In preparative LC, however, the column is actually overloaded, and the full range of the nonlinear (primarily Langmuir) adsorption isotherm is involved. The peaks are not symmetrical, and the compounds interfere with each other's partitioning process. Because the number of adsorption sites on the stationary phase is limited, the competition for these sites leads to displacement effects, and fundamental partitioning theory must be adapted.
Guiochon's group at the University of Tennessee is studying this important area of modern preparative LC (12). They have determined that displacement effects can be exploited to
10'
<IJ 104
" 1ii c. 0 0 c:
" II! 'S 103 C"
" a:
102
Rs= 0.7 1.07 1.15
10 " I I I o 1.01 1.021.03' .05 1.1 1.2 1.3 1.5 2 3 10
Alpha value
Figure 1. Relationship between the required plate number and the alpha value for different resolutions (Rs).
increase the sample size that can be separated in each chromatographic pass (13). Displacement chromatography itself is very attractive for preparative applications, as shown by Horvath (14). For dedicated separations that must be performed repeatedy, the search for a displacement LC system can be most rewarding. Recently it has been shown that the synthesis of specific displacers is of potential general interest (15).
Practical preparative LC
Several forms of preparative LC have been developed according to various requirements for sample size and the difficulty of the separation (2). Analytical or laboratory preparative LC involves slightly enlarged colu:nn volumes obtained by either len,;thening the column or enlarging its internal diameter. Longer columns allow difficult separations, but the back preSBure and separation time soon become prohibitive. Enlarging the column diameter is thus the most practical means to achieve increased capacity.
High-performance laboratory preparative LC is currently performed primarily on columns 30-50 em long with an i.d. of 7-10 mm. Such columns hold 10-20 g of silica gel and can handle sample loads from 1 to 1000 mg, depending on the difficulty of the separation. A larger column (20-30 em long with an i.d. of 2-2.5 em) that holds approximately 65 g of packing material is often used in the research laboratory. The optimum flow rate of such a column is 10-15 mL/min, which can easily be accommodated by most analytical LC instrumentation. This size column is the largest that can be packed with conventional packing methods and that will show reasonable column stability when handled carefully.
Even larger columns are needed for production-scale preparative LC, and two solutions to this problem have been developed. The first employs enlarged systems similar to those used in analytical LC with stainless steel columns filled with silica gel-based packing materials and high-pressure solvent delivery systems. The second,
266 A • ANALYTICAL CHEMISTRY, VOL. 62, NO.4, FEBRUARY 15, 1990

used primarily in biotechnology, uses soft gels in glass or plastic columns under moderate pressure.
Analytical columns are usually packed by pumping a slurry of the packing material at pressures of up to 400-1000 bar. Packing fluid is forced at very high velocity through the column bed as it forms. This forces the stationary-phase particles into a more or less stable bed with a porosity that is still far from what is theoretically possible, making the stability of these columns uncertain. Under prolonged use, further settling of the stationary phase may occur, a void will appear at the top of the column, and the efficiency of the system will be reduced. ("Topping up" such deteriorated columns is a technique well known to most liquid chromatographers.) Column stability is also
(a)
20
S 15
C ci c:
~ 11:
10
5
10
(b) 4
S C
3
ci c:
~ 2 2:> 11: S ); tl
0 10
affected by interaction of the packing material with the column wall, which has a stabilizing effect (16).
It is d.ifficult, however, to pack large i.d. columns in this manner. Stainless steel coIumns of 10-60-cm i.d. can accommodate the necessary pressures only when the wall is prohibitively thick. Pumps that can generate the required pressures while delivering the necessary volume of solvent simply do not exiBt. Early preparative LC systems avoided this problem by using coarser :;tationary-phase particles; particles with an average size of 25 .um can indeed be dry packed simply by pouring them evenly into the column. (Adding solvent to the particles without wetting them can improve dry packing results.) Glass or plastic columns can be used for such large-particle col-
100 1000
~g
..? ~!.. • 41 ~
"
100 1000
~g
Log sample size per gram stationary phase
Figure 2. Plate number per meter as a function of sample size per gram of silica gel for normal-phase LC of 4-nitrophenol calculated from peak width or second moment. Open circles = 10 ,uL; solid circles = 100 J-LL (calculated from pEiak width) . .6.'5 = 10 ,uL; .t..'s = 100,uL (calculated from second moment). (a) 10-,um particle size and (b) 40-,um particle size. (Adapted with permission from Reference 17.)
umns, which have good stability because of the mild pressure drop and general chromatographic requirements of coarser particles.
The recent tendency in preparative LC, however, is toward high-efficiency columns using small particles with a diameter of 10-25 .um. Packing problems are avoided by using compressed bed techniques in which dry packing material or a slurry is placed in the column, which is then compressed. Very little liquid is forced through the bed during packing.
Although bed compression was developed as a packing technique for large-scale columns, recent experience has shown that it is also important in maintaining columns in an efficient state during the chromatographic run (17). Friction heat is generated in the column as the solvent is forced through the packed bed. This appears to be a problem for the small-particle columns used in modern preparative LC. Such friction heat is a function of the linear flow velocity and viscosity of the solvent as well as the particle size and pressure drop over the column. With the larger particles and low-viscosity solvents used in normal-phase LC, friction heat is negligible. With smaller particle columns and the viscous solvents used in reversed-phase LC, however, friction heat becomes a serious problem. An opening appears at the column wall because of the difference in thermal expansion coefficients between the packed bed and column wall material. In a 20-cm i.d. column, packed efficiently with l5-.um reversed-phase stationary phase, a visible opening of several tenths of a millimeter appears during the first chromatographic run. All solvent pumped through the column then passes along the wall and not through the packed bed, resulting in the "thermal wall effect" (16). This problem can be solved by continuous bed compression during the chromatographic run such that the volume of the space available to the packed bed is continuously corrected. Use of columns that have been removed from the compressed packing station can result in thermal wall effects for reversed-phase small-particle separations.
Bed compression can, in principle, be achieved axially, radially, or by a combination of the two. Axial compression can be exerted from the top of the column, the bottom of the column, or both together, and the piston can be actuated either mechanically or hydraulically. Because mechanical pistons require a lot of operating space, hydraulic pistons are preferable from an installation point of view.
ANALYTICAL CHEMISTRY. VOL. 62. NO.4. FEBRUARY 15. 1990 • '267 A

REPORT
Radial compression can be obtained by gas or liquid pressure on a flexible sheet against the column wall inside the metal column. The flexible wall obviously must be inert to the solvents used and must withstand frequent bending. Combined radial and axial compression is obtained by pressing a wedge-shaped shaft in the column. The term "dynamic axial compression" was recently introduced (18); such a term is useful in differentiating more clearly between "dynamic preparative LC" (continuous bed compression) and "static preparative LC" (without bed compression).
With the advent of commercially available large-scale compressed column instrumentation (17), this technique has become widely used in the pharmaceutical industry. Although very little information has been publicly disclosed, several pharmaceutical companies plan to present results of their work at Prep-90.
Economics of large-scale preparative LC
For large-scale industrial preparative LC, the economics of operation are important. Colin (18) estimates that the cost per kilogram of processed compound is between $50 and $500, depending on the difficulty of the chromatographic separation, which is not prohibitive for compounds of high commercial value. Solvent handling and recovery account for much of the operating costs for this type of largescale system; other costs include instrum entation, installation, maintenance, and labor. Stationary-phase costs depend greatly on whether the silica gel must be derivatized. Although a large number of octadecylated silica gels are available commercially for large-scale preparative LC, all are different and will produce different alpha values for a given separation. It is thus extremely important to compare such materials on an analytical LC system to find the one that gives the most efficient separation.
Practically all analytical chromatography today is performed with mixtures of solvents, but it is almost impossible to recover large volumes of a ternary solvent without changing its composition in the distillate. This problem can be avoided by using a single solvent (no analysis required, no adjustment of composition), but a single solvent does not often provide the desired selectivity. The stationary phase is thus adapted to a particular separation problem by changing the degree of derivatization, changing the derivatization reagent, mixing different stationary phases, derivatizing with
mixed reagents, or sequentially using different derivatization reagent3 on the same phase. Such special stationary phases may be expensive at first, but in the final economic picture th ,y may prove to be worthwhile.
Because stationary-phase packing material is expensive, particularly in the amounts required for large preparative LC columns, it is econcmically advantageous to regenerate m,ed columns. Used packing materials can be dirtied by samples, lose bonded chains, or exhibit increased back press Jre as a result of fine particles that are g enerated during packing or by continuous compression. Although some rEsearchers believe that removal of fim particles by reclassification introduces unwanted changes in selectivity because new active surfaces are being generated, this does not appear to be be case.
Proteins cannot be chromatographed using isocratic conditions as can small and medium molecularweight compounds, because the proteins are strongly adsorbed to the stationary phase (19,20). Instead, size exclusion chromatography, in which there is no adsorption, or various forms of gradient LC, must be used. Such gradients include solvent gradients, in which the solvent composition eventually becomes strong enough to desorb the protein; buffer gradients; pH gradients; or salt concentration gradients, as in hydrophobic interaction chromatography.
Desorption of proteins from the stationary phase can also be promoted by addition of solvents or acids that modify the protein's conformation, such as trifluoroacetic acid, isopropyl alcohol, or acetonitrile. However) this can
" Because proteins vary in molecular weight, hydrophobicity, isoelectric point, and thermal and
chemical stability and reactivity, a generally applicable approach to their chromatographic
sepm;tion is impossible. "
The increase in surface area frclID compression is extremely small, and even if all the particles were halved, ';he surface area of a 20-,um packing material would increase less than 1 m2/g, compared with a total specific surbce area of ~200 m2/g. Regeneration of used packing materials is thus a viable proposition.
The feasibility of a production-scale LC process is, of course, determined by running the separation on analytical instrumentation first. It is, rowever, practically impossible to reproduce exact analytical LC data on a larger scale system. Even when the two columns are packed with the same stationary phase using the same packing material (which is normally not possibe), wall effects will result in the column; having different packing densities, which in turn cause variations in retenti::m data. Nevertheless, analytical result:; can be a great help in optimizing a preparative LC separation.
Preparative LC of proteins
Because proteins vary in molecular weight, hydrophobicity, isoelectric point, and thermal and chemical stability and reactivity, a generally applicable approach to their chromate graphic separation is impossible.
sometimes cause denaturation of sensitive proteins. Weight recovery of the protein mass injected onto the LC system is important, but possible loss of biological activity of enzymes or hormones is even more important.
The pore size ofthe packing material also affects the recovery of the protein from the column; stationary phases with large pore sizes (30-100 nm) are used to avoid irreversible retention of proteins in the small pores of conventional packing materials. The pore size distribution of most stationary phases is large enough, however, that even large-pore stationary phases have some small pores, so there is always the possibility of some protein being retained on the column.
Most protein separations are performed on soft gels derived primarily from polysaccharides. Although these soft gels do not have the efficiency of silica gel-based small-particle stationary phases, they are more highly selective.
Another peculiarity of preparative protein chromatography is that the amount of sample necessary is sometimes quite small (21); many polypeptide enzymes and hormones of current pharmaceutical interest require only microgram dosages. A few grams of such proteins (a year's supply for the entire
268 A • ANALYTICAL CHEMISTRY, VOL. 62, NO.4, FEBRUARY 15, 1990

world) can be chromatographed on analytical instrumentation.
Preparative LC of proteins can be difficult because of possible denaturation, difficult recovery from the collected fractions, solubility problems, and extreme sensitivity to even small variations in stationary-phase composition. The chromatographic separation, however, is often easy because of the very high selectivity that is readily available. Conditions under which one protein passes through the column while others are completely retained are not difficult to establish. There is a great future for preparative protein LC, but much remains to be done.
References
(1) Hostettmann, K.; Hostettmann, M.; Marston, A. Preparative Chromatographic Techniques; Springer Berlin: Heidelberg, 1985.
(2) Verzele, M.; Dewaele, C. Preparative High Performance Liquid Chromatography. A Practical Guideline; RSL Europe: Eke, Belgium, 1986.
(3) Bidlingmeyer, B., Ed. Preparative Liquid Chromatography; Elsevier: Amsterdam, 1987.
(4) Kuhn, R; Brockmann, H. Hoppe-Seyler's Z. Physiol. Chem. 1932,206, 4l.
(5) Winterstein, A.; Stein, G. Hoppe-Sey-
ler's Z. Physiol. Chem. 1933,220,247. (6) Zechmeister, L.; Cholnoky, L. Liebig's
Ann. Chem. 1934,509,269. (7) Strain, H. J. Bioi. Chem. 1934,105,523. (8) Karrer, P.; Strong, F. Helv. Chim. Acta
1936,19,25, (9) Wan kat, P. In Preparative Liquid
Chromatography; Bidlingmeyer, B" Ed.; Elsevier: Amsterdam, 1987.
(10) Majors, R Anal. Chem. 1972,44,1722; 1973. 44, 88.
(11) H3.1asz, 1.; Sebestian, L Chromatogra~ phia 1974, 7, 371.
(12) G,)lshan-Shirazi, S.; Guiochon, G. J. Chromatogr. 1988,461,19.
(13) n,wburger, J.; Guiochon, G. Presented at the Washington Symposium on Preparative Chromatography, Washington, DC,.989.
(14) H)fvath, C.; Nahum, A.; Frenz, J. J. Chromatogr. 1981,218,365.
(15) Camacho, P.; Geiger, E.; Farkas, G,; Bartha, A.; Vigh, G. Presented at the Washington Symposium on Preparative Chromatography, Washington, DC, 1989.
(16) V"rzele, M.; Dewaele, C.; De Weerdt, M.; Abbott, S. J. High Resolut. Chromatogr. 1989,12,164.
(17) V"rzele, M.; De Coninck, M.; Vindevogel, J.; Dewaele, C. J. Chromatogr. 1988, 450, '!7.
(18) Colin, H. A. Genetic Engineering New, 1988,22;LCIGC 1989, in press; Presented at the Baden-Baden Symposium on Preparative Chromatography, BadenBaden, FRG, 1988.
(19) Sryder, L. R; Stadalius, M. A.; Quarry, M. A. Anal. Chem. 1983,55, 1412 R.
N
(20) Verzele, M.; Yang, Y-B.; Dewaele, C.; Berry, V. Anal. Chem. 1988,60, 1329.
(21) Sitrin, R D.; DePhillips, P. Presented at the Washington Symposium on Preparative Chromatography, vVashington, DC, 1989.
Maurits Verzele received a D.Sc. degree from the State University of Gent and was a member of the faculty there until his retirement in 1988. His research interests include column technology and stationary-phase synthesis for preparative and capillary gas and liquid chromatography. He is best known for his work in developing the static coating procedure for capillary GCcolumns.
I • ELECTRONIC STIRRERS
Fun Physical Science Activities for Children and Adults to Do Togetl~er
.. colorful comic book format
.. useful at home or in classrooms
.. reinforces language and math skills
.. relates science concepts to technology
.. aimed at 4th through 6th graders
--------------------------.. , .... Pricepersuoscription {one-year, four-issues)
To continental 1-4 .. S4.00each u.s. addresses 5-19 ........ S3.00each
20 or more .. "S2.00each
For subscription information write or call:
American Chemica.1 Society Prehigh School Science Program 1155 Sixteenth St., N.W. Washington, DC 2003(;
(202) 452-2113
N .. E .. W ROTARY EVAPORATORS micro to 20 i capaCities
N .. E .. W STIRRERS/HOT PLATES interchangeable baths
N .. E .. W PLATFORM MIXER
assymetric movement
N .. E II W VORTEX MIXER
1"'\ interchangeable heads
__ iNEW TECHNOLOGY BY
~~C\ Wlarton, Ontario, LIM I TED V Canada ~OH 2TO
See what's new at the Pittsburgh Conference, Booth #5672. CIRCLE 28 ON READER SERVICE CARD
ANALYTICAL CHEMISTRY, VOL. 62, NO.4, FEBRUARY 15, 1990 • 269 A

INSTRUMENTATION
Mary J. Wirth Department of Chemistry & Biochemistry University of Delaware Newark, DE 19716
Time-resolved spectroscopy has been an active research area in analytical chemistry for more than 30 years. During this period, technological developments have improved time resolution from the millisecond to the subpicosecond range. Measurement of the temporal behavior of chemical systems has provided a new basis for selectivity. New technology has also allowed analytical spectroscopy to evolve beyond traditional boundaries to include the characterization of structurally heterogeneous systems such as surfaces and thin films, biological systems, electronic devices, and advanced materials. Time-resolved spectroscopy is now being used to provide structural and dynamic information to solve new types of chemical measurement problems and to improve qualitative and quantitative analyses.
Ultrafast spectroscopy is an interdisciplinary field that spans physics, chemistry, biology, and electrical engineering in the study of the fundamental nature of the myriad of relaxation processes. The field is an exciting one in which researchers pursue advances in short-pulse generation and applications. Recent applications in chemical physics (1), biology (2), and electrical engineering (3) have been reviewed, as
have methods of short-pulse generation (4). In even-numbered ye.HS, the Optical Society of America s Jonsors conferences on ultrafast pher omena, and Springer publishes these proceedings as a book series.
Ultrafast spectroscopy is receiving increasing attention from the ,malytical chemistry community, altbough it is far from being commonp]a.,e. The ultrafast time scale extends approximately from 10 fs (10- 14 s) to 100 ps (10- 10 s). The fast end of this'ange is marked by the limit of laser tec:mology and the slow end by photomultiplier technology. Ultrafast techniques require multiple-beam optical nethods for detection. The need for high sensitivity and the desire for genercl applicability and convenience have combined to limit much of analytical spectroscopy to the time scale of ph Jtomultiplier technology. Despite these disadvantages, analytical spectroscopists are devoting more time to working in the experimentally difficult area d ultrafast spectroscopy.
Lifetime measurements using photomultipliers
In 1957 Keirs, Britt, and We.ltworth published the first analytical paper on time-resolved spectroscopy (5). At that time phosphorescence was krcown to originate from a transition hetween specific molecular states (6), and these workers expected that the phosphorescence lifetime, T p, would be unique for a given molecule. They demonstrated
270 A • ANALYTICAL CHEMISTRY, VOL. 62, NO.4, FEBRUARY 15, 1990
that T p could be used as a parameter for chemical identification and for mixture analysis. The apparatus consisted of a pair of slotted wheels, one on each side of the sample, to mask the sample alternately from the arc lamp and the detector. By controlling the relative angular positions of the two slots, the emission was observed at a known delay time from the excitation. Their time resolution of 1 ms was limited by the sizes of the slots in the wheels and by the motor speed. Time-resolved spectroscopy thus began in the mechanical era.
The results of this first bear striking similarities to and dillerences from current work. Today much analytical research involves the same goal of using lifetimes for molecular identification. However, the time resolution has improved by 7 orders of magnitude, from 1 ms to 0.1 ns. Electronics and quantum electronics have replaced mechanical parts, due to the invention of the laser and mode locking; the development of repetitively pulsed lasers; and the availability of faster photomultipliers, particularly the microchannelplate photomultiplier. Improvements in optical technology and continual advances in digital electronics and laboratory computers have made nanosecond fluorescence experiments routine.
These improvements in speed have permitted the study of fluorescence ratber than phosphorescence. The use of phosphorescence is restricted to very viscous or solid media, whereas fluores-
0003-2700/90/0362-270A/S02.50/0 © 1990 American Chemical Society

cence is emitted by a wide variety of systems under less restrictive conditions. Faster time resolution was thus essential in making the original idea generally applicable. Fluorescence lifetimes can be determined rapidly enough to be implemented in chromatographic detection (7). Early efforts in time-resolved fluorescence spectroscopy involved the measurement of fluorescence decay times of laser dyes. With the many improvements in optical technology, fluorescence lifetime measurements have become generally applicable.
Impressive advances have been made in electronics at MHz and GHz frequencies, accelerating the development of frequency-domain techniques (8). The principle offrequency-domain techniques is that a decay function in the time domain can equivalently be determined in the frequency domain. By modulating the light beam at a variety of frequencies and measuring the amplitude demodulation and phase shift of the emission, the time decay is calculated from the simple Fourier transform relations. Deconvolution of the excitation pulse is intrinsic to the frequency-domain measurement and extends the effective time resolution of photomultiplier detection by about a factor of 10. Lifetime measurements by frequency-domain techniques are also very rapid and versatile. Multiplecomponent samples can be analyzed without prior knowledge of the lifetimes on an analytically useful time frame (9, 10).
Ultrafast relaxation processes
Now that the analytical utility of lifetime measurements has been vastly improved by the advancement from the millisecond to the nanosecond time scale, what can we expect from the advancement through the next 4 or 5 orders of magnitude? The technological barriers to measuring ultrafast processes can inhibit one's imagination about possible future applications. But suppose we had a photomultiplier with a rise time of 1 fs, along with a tunable laser with output pulses of 1 fs. Given this equipment, most spectroscopists would immediately go into the lab, put their most interesting fluorescent sample into the ultrafast fluorometer (perhaps one whose decay they have deconvoluted), and find out what the decay really looks like.
Figure 1 gives an educated guess as to what might be observed in a hypothetical femtosecond emission experiment, showing the decay plotted on different time scales. In part a, on the IOns time scale, the familiar fluorescence decay is shown. In part b, on the 100-ps
time scale, the intensity depends on which polarization is measured. This phenomenon, fluorescence anisotropy, results from the preferential excitation of solutes oriented with respect to the polariz'Ltion of the laser beam. The decay of the anisotropy as a function of time is attributable to molecular reorientatioll. In part c, on the lops time scale, the intensity increases with time. This represents the evolution of the
Figure -I. Emission behavior on different time scales. (a) Fluore~;cence decay; (b) fluorescence anisotropy; (c) increase in fluorescence as the spectrum evoll/es; and (d) resonance Raman decay, with back'Jround fluorescence.
Stokes shift as the environment of the solute adjusts from ground-state solvation equilibrium to excited-state equilibrium (11).
As the time scale becomes increasingly shorter, other unfamiliar features of the fluorescence spectrum may be observed. One is unrelaxed fluorescence. Normally, fluorescence emission arises from a transition between the lowest excited electronic state to the ground state. Collisions with the environment cause extremely fast internal conversion, resulting in the same emission spectrum regardless of which wavelength is used for excitation. Fluorescence from vibronic states might be observed because vibrational relaxation can be slow on the femtosecond time scale.
A second observation might be that virtually everything fluoresces. According to the Heisenberg uncertainty principle, every transition having a bandwidth of a few hundred nanometers must be associated with a state having a lifetime at least as long as femtoseconds. Where there is absorption, there must be emission, albeit very small in some cases. Ultrafast spectroscopy could make fluorescence more universally applicable.
Raman emission is also interesting on the ultrafast time scale. Below 1 ps, resonance Raman emission emerges (12). In part d of Figure 1, on the time scale less than 100 fs, an intense and rapid decay resulting from resonance Raman emission appears. By selecting a narrow emission bandwidth, this peak could be larger than the fluorescence emission. The difference between resonance Raman and fluorescence is understood (13). On this time scale, the electronic states of the absorber are still in phase with the excitation, and the resulting temporally coherent emission process is referred to as resonance Raman. Collisions perturb the energies and, therefore, the phases of these states. The emission process after dephasing is referred to as fluorescence. On the 100-fs time scale, emission is also observed coincident with the laser pulse, as shown in part d. This is Raman emission without resonance enhancement, contributed by the solvent.
The value of such technology is evident for Raman spectroscopy. Raman spectra contain structural information, yet their use is limited because of low sensitivity and fluorescence interference. Our hypothetical experiment shows that all of the photons from the resonance Raman process are emitted before 1 ps, where little fluorescence interferes. One could use resonance enhancement with minimal interference
ANALYTICAL CHEMISTRY, VOL. 62, NO.4, FEBRUARY 15, 1990 • 271 A

Why do so many innovators in all chemical fields turn toCHEMTECH each month?
" .. One of the best condensed technical news sources I get .. Outstanding melding of social, political, and scientific literature ... The fresh glibness and tonguein-cheek style are unique and welcomed ... I am impressed with the quality, scope and personal touch of the articles ... I almost dread it when each issue arrives because I know I will take the time, whether I have it to spare or not, to read it from cover to cover.
Join your satisfied colleagues and subscribe to the innovator's magazine ...
Call now to order: 800-227-5558
INSTRUMENTA'1"!E!::!
from fluorescence. In fact, various techniques have been used to rEject fluorescence from Raman emission based on temporal discrimination: time-domain methods with conventional photomultipliers (14) and microchannelplate photomultipliers (15) End frequency-domain phase nulling with photomultiplier detection (16-18). These methods cannot push Raman spectroscopy to its fullest potential because they are a few orders of magnitude too slow. None has achievod rejection of fluorescence by more than a factor of about 200, and this is rot good enough for wide applicabilit:l. Thus workers avoid fluorescence in Raman spectroscopy by excitation with nearIR (19), red (20), and UV (21) light.
One application of an ultrafast emission experiment is very close tc achieving routine use in analytical cb~mistry: the measurement of fast fluorescence anisotropy decays. To be widely applicable, a time resolution of 10 ps is needed because the reorientation times of moderately small molecules in ,;olvents oflow viscosity can be as short.,s 10 ps. Although a commercial instrument with this time resolution does not exist, photomultiplier technology can now be pushed to this level of performance, particularly with frequency-domain spectroscopy. As with fluorescence lifetimes, early efforts in molecular reorientation measurements also involved the study of laser dyes. Short optical pulses can now be generated throughout the visible and UV, allowing applicability to virtually any fluorescent species of interest.
According to Debye (22), the reorientation time, Tor, of a solute is proportional to its molecular size. As a parameter for identification, T '" is pot entially more valuable than either the fluorescence or the phosphorescence lifetime because it contains information pertaining more directly to solute structure. Anisotropy decays are multiple exponential (23), and their malysis also reveals the hydrodynamic "hape of the solute as well as its size.
Anisotropy measurements contain a wealth of information. In addition to the structural parameters of f.ize and shape, the symmetry of the excited state relative to the ground sta ce is determined. Furthermore, the l~xcitedstate symmetry is wavelength dependent (24). Rather than just m;ing the spectrum for identification, researchers will also routinely use the polarization dependence of the spectn:m. The value of such a measurement b as been demonstrated for a mixture analysis of anthracene derivatives (25).
The evolution of the fluorescence spectrum, vibrational relaxation, the
272 A • ANALYTICAL CHEMISTRY, VOL. 62, NO.4, FEBRUARY t5, 1990
decay of Raman and resonance Raman emission, and the reorientation of molecules occur on ultrafast time scales. The amount of information that can be obtained by time resolution far exceeds the information in steady-state Raman and electronic spectra. These examples refer to an emission experiment, but many other types of experimental arrangements are used in ultrafast spectroscopy.
Beyond photomultipliers: techniques of ultrafast spectroscopy
Although present ultrafast lasers can have pulse widths as short as 6 fs (26), 50 fs is more typical. What is lacking for the hypothetical femtosecond emission equipment to be a reality is an ultrafast photomultiplier. There are two general approaches to improving the time resolution of the experiment: make the detector faster or gate the light emitted from the sample.
Streak cameras. Photomultipliers are limited in speed by an inability to contain a collection of 106 electrons per pulse in closer spatial proximity. A streak camera, which is a distant relative of the photomultiplier, operates as fast as 0.6 ps at high repetition rates (27). What a streak camera has in common with a photomultiplier is a photocathode. When light strikes the photo-
Sample ==::::J
Figure 2. Schematic of a pump/probe experiment. The pump and probe lasers are modulated at 8 and 13 MHz, with the pump laser chopped at 20 Hz. The arrival time of the probe laser is controlled by a variable delay line, and its intensity is detected with a photodiode. The signal at 21 MHz is isolated by a lock-in amplifier and is distinguished from any background contribution at 21 MHz by the low-frequency lock-in amplifier.

Splitter
"" Dye laser [SJ
Delay -" > /
Photomultiplier L Crystal
~be /
~ -~~~=~~
UV \
Figure 3. Schematic of an upconversion experimenl. The dye laser output is split. One arm is used to excite the sample. The other arm, variably delayed, is used for the upconversion process. The fluorescence, indicated as the red light, is shown to be collected with an off-axis curved mirror and is directed into the upconversion crystal. The UV output intensity of the crystal is proportional to intensity of the fluorescence at the parti:uJar delay time.
cathode of the streak camera, photo· electrons are emitted and then accelerated to pass between high-voltage plates. The deflection by these plates is rapidly swept in time. The photoelectrons strike a phosphorescent screen, and the spatial profile of the image on the plate is related to the temporal profile of the optical signal. Streak cameras have lower sensitivity and a lower dynamic range than photomultipliers, and they require careful calibration and tweaking. Their most notorious disadvantage is that they cost more than $60,000.
Pump/probe spectroscopy. Scientists working in ultrafast spectroscopy today typically use optical rather than electronic methods of time resolution. The workhorse of these detection tools is pump/probe spectroscopy. The optical arrangement is illustrated in Figure 2. Two laser pulses are used: The pump pulse excites the sample, and the probe pulse stimulates emission. The stimulated emission intensity is proportional to the fluorescence intensity, provided that the probe pulse is not too intense. The arrival time of the probe pulse is controlled by the optical pathlength of the probe beam, and varying the arrival time allows construction of the temporal decay function.
It is the shortness of the laser pulses that allows pump/probe spectroscopy to work on ultrafast time scales. When the probe laser is tuned to an emission band, the same information that one would obtain from a fast fluorescence experiment is generated. The probe can also be tuned to an absorbance band, allowing the ground-state population to be probed. The change in in-
tensity of the probe beam is very small, typically < 10-4• To minimize low-frequency noise, the pump beam is modulated and the component of the probe beam at the pump modulation is detected.
The letection limit in pump/probe experiments is determined by the magnitude of the fluctuations on the probe beam. When pumped by a well modelocked argon ion laser, the synchronously pumped dye laser has noise fluctuadons on the order of its shot noise for measurements above 10-MHz modulation frequencies. This means that the noise on the laser intensity is attributable only to the fact that the beam is composed of discrete photons. For a <.a-mW laser beam, this corresponds to 3 parts in 109, which is extreme stability. This stability is valuable for pump/probe spectroscopy of dilute samples.
The first demonstrated use of shotnoise-limited pump/probe detection was for Raman gain spectra of surface monolayers without the need for surface en:lancement (28, 29). A doublemodulation scheme was used whereby the pump was modulated at both 10 MHz and 500 Hz. The component of the probe intensity at 10 MHz was detected. The 500-Hz chopping of the pump beam was used to reject background from rf pick-up.
A study of the sensitivity and detection ca]:>ability of pump/probe fluorescence spectroscopy using triple modulation showed that the theoretical detection limit could be achieved in practicE' (30). The probe beam modulation, M'2' was shown to be proportional to concentration.
M, = 1000(2.303)2 '1'2bcPI P,. (1)
RKNA
R is the repetition rate of the laser; K is the photon energy; N is Avogadro's number; A is the beam area; EJ and E2
are the molar absorptivities of the pumped and probe transitions, respectively; PI and P2 are the powers of the pump and probe beams; and c is the concentration of the sample. Under typical conditions, the detection limit is a few nanomolar. For rapid quantitative measurements of anisotropy decays, it is best to be about 1000X above the detection limit. This is sufficiently dilute for reorientation measurements, where the concentration must be low enough to avoid energy transfer.
Upconversion. An alternative method frequently used in ultrafast spectroscopy is upconversion (31), illustrated in Figure 3. The emission is collected with a lens, just as it would be in an emission spectrum, but then it is focused into a frequency-doubling crystal. The angle of the crystal is adjusted such that an intense laser beam focused to the same spot in the crystal will cause nonlinear generation at the sum of the frequencies of the laser and the fluorescence. Phase matching is required, which also prevents second harmonic generation from the laser beam alone. The upconversion process thus acts as a temporal gate. The signal can be derived from first principles to be
Photons/s = 2.3,bc -/ hP
X J p oton
Q'Y(YpmtOgOt'Yuc (2)
where, is the molar absorptivity and b the pathlength of the sample, c is the concentration, P is the laser power, Q is the collection efficiency of the lens, 'Yf is the quantum yield for fluorescence, 'Ypmt is the quantum yield of the photocathode, 0, is the fraction of the spectrum upconverted, Ot is the fraction of the decay upconverted, and 'Yu, is the efficiency of the upconverter. Equation 2 differs from that for conventional fluorescence only by the factor 'Yu" which is typically 10-4• However, phase matching restricts Or to a small value, and Ot is very small if the lifetime is on the nanosecond time scale. A substantial background also must be subtracted. Consequently, upconversion has a high detection limit but has the advantage of requiring only one laser.
The time resolution for upconversion experiments is as short as 200 fs. These experiments are nearly limited in time resolution by the uncertainty principle because of the narrow spectral width used for phase matching.
Ifupconversion were used for Raman
ANALYTICAL CHEMISTRY, VOL. 62, NO.4, FEBRUARY 15, 1990 • 273 A

Polymeric Materials for Electronics Packaging and Interconnection
~ile there has been a number of
books addressing packaging, and to some extent polymers, virtually none
has emphasized the synthetic and physical chemistry of these systems. This new volume fills that gap, addressing the many aspects relating to the development of novel polymeric materials and processes. The emphasis is on chemistry and materials science, rather than circuitry, its electrical capabilities, or its design characteristics.
Covering a broad spectrum of subjects, this 38-chapter book focuses on four general areas: • physical chemistry of materials • properties and applications of encapsulants • properties and applications of gels • printed circuit board substrates and materials for
circuit board substrates.
Also included is a review of the marketing trends which drive packaging technology.
This unique volume will be heipful to scientists engaged in materials development for electronic packaging, electronic packaging engineers, and to technologists who monitor developments in the electronics industry and related fields. John H, Lupinski. Editor, Generai Electric Company Robert S. Moore. Editor, Eastman Kodak Company Developed from by the DI~-sion of Polymeric Engineering and of Po~mer Chemistry of the American Chemical Society ACS Symposium Series No. 407 512 pages (1989) Clothbound ISBN 0-8412-1679-9 $99.95
American Chemical Society Distribution Office, Dept. 45 1155 Sixteenth St., N.W. Washington, DC 20036
or CALL TOLL FREE
800-227-5558 (in Washington, D.C. 872-4363) and use your credit card!
INSTRUMENTA':!!i!!:!
emISSIOn, Ot in Equation 2 could approach unity and Og could also be large as a result of the narrow bands. Upconversion would appear to be preferable to pump/probe measurements for Raman spectroscopy, although it has not yet been used. For resonance Raman, the resonance enhancement Vlould be approximately offset by the inefficiency of upconversion, but fluorescence would be eliminated in the precess.
Effects of temporal dispersion. Emission spectroscopy is not the same game on ultrafast time scales as it is in nanosecond spectroscopy. If you are holding this paper 12 in. away it takes 1 ns for the photons reflected "rom the paper to reach your eyes. The ',elationship between time and distance is crucial to ultrafast spectroscopy because the speed of light is comparatively slow on these time scales. An optica I pulse is lengthened in time if any part c.f it travels a different optical distance than the rest of the pulse. This effect is called temporal dispersion. Despite :;hort laser pulses and fast detection, che time resolution in an experiment can be destroyed by temporal dispersion from the optical layout of the exper: ment.
For any ultrafast emission method, temporal dispersion must be carefully diagnosed and eliminated. Tlere are three causes of temporal dis,persion. First, collecting light over a nonzero
(a) ~p~ '" / '< -----
~ ., i\
ofti
(c)
Figure 4. Pulse dispersion.
solid angle with a lens or mirror results in a distribution of optical pathlengths (Figure 4a). Furthermore, passage through a thick lens can have a much greater effect than this distribution of pathlengths (Figure 4b). Either a larger [-number or reflective optics should be used; implementing both would give the best results.
Second, for excitation over a finite pathlength, molecules on one end of the path are excited at a different time than those on the other end (Figure 4c). This is a severe problem in an emission experiment but is absent in a pump/ probe experiment. Finally, the refractive index of any material is wavelength dependent. A short pulse has frequency components greater than a few hundred nanometers, and the red wavelengths move faster than the blue wavelengths through typical optical materials (Figure 4d). The result is called pulse chirping because of what this signal would sound like if these were audio frequencies. Figure 4 illustrates that the temporal profile of the ultrafast pulse is easily lengthened by passage through commonly used optics.
A careful study of temporal dispersion in an upconversion measurement was recently detailed (32). From this study, one can appreciate that the resolution of 200 fs is a noteworthy accom-
(b)
(d)
(a) Collection of light causes dispersior resulting from a distribution of pathlengths, (b) passage through a thick lens causes severe dispersion, (c~ a long pathlength and perpendicular detection cause dispersion, and (d) passage through a material caW,8S frequency chirp. Note that chirp would also be severe in part b but is neglected for clarity.
274 A • ANALYTICAL CHEMISTRY, VOL. 62, NO.4, FEBRUARY 15, 1990

plishment because of the need to compensate for temporal dispersion. The hypothetical femtosecond emission experiment described earlier would be subject to the same problems, and the hypothetical emission decays of Figure 1 would not be resolved without a nearly diffraction-limited pathlength, reflective optics, and large f numbers.
Analytical research in ultrafast spectroscopy
Despite the labor involved in ultrafast technology, several analytical research groups have used pump/probe spectroscopy for a variety of interesting applications.
Ultrafast laser technology. An early and significant contribution by analytical chemists to ultrafast spectroscopy was the invention of the synchronously pumped dye laser by Harris, Chrisman, Tobias, and Lytle in 1975 (33). This invention included cavity dumping to control repetition rate and was developed almost simultaneously with the continuously output version by two other research groups (34,35). The name was coined by Harris et al. The significance of the synchronously pumped dye laser is that it routinely generated pulses of 4 ps with a high repetition rate.
Before this laser was developed, experiments were performed with "single-shot" lasers, where pulses of 6 ps were generated from Nd:glass lasers once every 2 min. Intense pulses were necessary, problems with nonlinearity were common, and control and characterization of the laser pulses were difficult. Synchronously pumped dye lasers are now able to generate pulses of < 50 fs. A more recently developed laser, the colliding-pulse ring dye laser, achieves shorter pulse widths, but the synchronously pumped dye laser is more widely tunable. The cavity-dumped version was able to generate pulses as short as 4 ps by the use of a saturable absorber in the cavity (36).
An elegant electronic means of scanning the time delay in pump/probe spectroscopy is the asynchronous optical sampling (ASOPS) method (37, 38). By synchronously pumping a pair of dye lasers with different Nd:YAG lasers, mode-locked at slightly different repetition rates, the pump and probe pulses are self-scanning. The applicability of ASOPS to the detection of species in harsh media has been demonstrated by a measurement of the emission lifetime of atomic sodium in a flame.
To generate laser pulses on the femtosecond time scale, a new technology has emerged: first, the bandwidth of the pulse is increased by using the non-
linearit·/ in the refractive index of a materi~l; second, temporal dispersion is used in reverse to compress the pulse. The res lit is a shorter pulse. Choi and Gustafs)n have accomplished the compressioI. of cavity-dumped synchronously pumped laser pulses down to 50 fs, with very high peak powers of 100 kW at ;1 2-MHz repetition rate (39). This is 1 valuable source for chemical applications in nonlinear spectroscopy because the high repetition rate minimizes saturation effects while the good beam ql.ality allows for the tight focusing needed in obtaining the high -power density llsed in nonlinear spectroscopy.
Moleeular reorientation. Pump/ probe spectroscopy has been used to study molecular reorientation of cresyl violet ir 1-dodecanol as a function of temperature (40). The reorientation time waB constant below 30°C, jumped to a longer value by a factor of 2 at 30°C, and then behaved normally. Because h,;at usually speeds up rotation of molecules, the researchers were intrigued Jy the slowing of cresyl violet with increasing temperature. By using temperature-dependent NMR measurements of the Tl relaxation times, it was found that 1-dodecanol undergoes a liquid crystal phase transition at 30°C. T lis transition involves freeing the motional constraints of the last few carbons on the end of the chain that is opposite the OH group. The phase transition had not previously been observed a:1d was undetectable by differential scanning calorimetry, polarization microscopy, and Raman spectroscopy. It was barely observable with NMR but was dramatically evident in the pump/probe anisotropy measurement. Molecular reorientation can be very sen:;itive to the short-range structure of a liquid.
The ability to sense the structure of the envi:'onment is one of the increasingly in teresting uses of anisotropy measure ments. The solvation of small moleculES by long-chain alkyl groups is pertinert to bonded-phase applications in I.C.The motions oftetracene in 1-dodecmol have been studied using frequen"y-domain photomultiplier methods (41). The results indicate nonDebye behavior. The motions of acridine ora 1ge attached to sodium dodecyl sulfate (SDS) micelles have been studied (42). The decay could be quantitativel:; interpreted, owing to the symmet .. y of acridine orange. The study revealed that SDS-bound acridine orange rotates through an angle of 45°, wit!: full rotation prevented by the attachmtmt. The high sensitivity of the technique made it possible to study premicellar SDS. The results showed that premicellar aggregates were prev-
alent down to half of the critical micelle concentration and that these aggregates hold acridine orange more rigidly than do the micelles.
A comparison of the reorientation time of cresyl violet in its ground and excited states was undertaken using pump/probe spectroscopy to probe both states (24). The excited state has a significantly slower anisotropy decay; however, it was shown that a change in the transition symmetry introduced new exponential decay functions. The ground and excited states actually reorient with the same time constant. This experiment illustrates that reorientation behavior can only be interpreted by analyzing the full, multiexponential decay and determining the transition symmetry.
Blanchard has continued to pursue the question of whether ground states and excited states have the same reorientation behavior. This is an important question because the most common method of studying reorientation is fluorescence anisotropy, which inherently senses only the excited state, whereas the ground-state dynamics are often of interest. He has shown that the excited state reorients more slowly than the ground state for oxazine 725 (43). The excited-state reorientation time increases inordinately with increasing chain size of the alcohol solvent. Using studies of additional nitrogen-containing heterocycles and MNDO calculations of electron density for ground and excited states, Blanchard has shown that the excited state is a stronger Lewis base than the ground state; thus, the attachment to the solvent is stronger in the excited state (44). The quantitative amount of attachment, the equilibrium constant, can be determined experimentally using anisotropy measurements (45).
The spectroscopy of transients. A unique application of ultrafast spectroscopy is the determination of structures of transient species. Important applications include the understanding of vision and photosynthesis and the development of fast-switching photoconductors. Gustafson et al. were the first to accomplish a direct measurement of the transient Raman spectrum of an electronic excited state (46); they showed that trans-stilbene photo isomerizes into a distribution of conformations (47). These workers also applied the method to the study of the excited-state symmetry of diphenylbutadiene (48). The technique of transient Raman spectroscopy has generated intense interest in studies of structural changes on ultrafast time scales.
The development of fast switches is important to the communications in-
ANALYTICAL CHEMISTRY, VOL. 62, NO.4, FEBRUARY 15, 1990 • 275 A

INSTRUMENTATION
dustry. One type of device for switching optical signals would be based on the nonlinear response of conjugated polymers to a short pulse. The nonlinear response is determined by virtual states; thus, the switch would be open only for the duration of the optical pulse. Understanding the states that contribute to the nonlinear response is important to improvements in the efficiency of these switches. Blanchard et al. have used pump/probe inverse Raman spectroscopy to study the couplings of optical phonons to excitons in crystalline polydiacetylene (49). Their results reveal that the phonon-mediated optical Stark effect is an important contribution to the optical nonlinearity of polydiacetylene. For electronic signals, hydrogenated amorphous silicon is an important material in the development of photovoltaics and thin-film devices. An understanding of the nature of relaxation processes of the light-induced charge carriers is needed to evaluate the practical potential of this material. Gustafson et al. have measured the picosecond transient absorption of hydrogenated amorphous silicon to probe the transient, light-induced transport of electrons (50).
Future potential
Analytical spectroscopists will continue to explore applications of thll large amounts of chemical informatior. available on increasingly shorter time scales. Early studies on the nano- and picosecond time scales were t'lchnologically difficult and primarily involved dye molecules as test systems; however, these measurements evolved to become universally applied al technological advances were achieved. The technological advances that made nanosecond spectroscopy easy will most likely continue beyond the photomultiplier time scale, enabling femtosecond spectroscopy to be more widely applicable.
The newly emerging technl)logies will change the types of problems analytical spectroscopists solve. Today's new tools-such as supercom ;>uters, scanning tunneling microscopy, md ultrafast lasers-and tomorrow's new tools-such as coherent X-ray s )urces, widely tunable lasers, ultrafast electronics, and technology yet to bE determined-will lead to a further metamorphosis of the field. Continued expansion of the scope of analytical spectIOscoPY
and an embracing of the new technologies will allow analytical spectroscopists to continue to playa vital role in science and technology.
References
(1) Fleming, G. R Chemical Applications of Ultrafast Spectroscopy; Oxford University Press: New York, 1986.
(2) Hochstrasser, R. M. Ber. Bunseges. Chem. 1989,93, 239.
(3) Miller, A.; Sibbett, W. J. Modern Opt. 1988,35,1871.
(4) Fujimoto, J. G. Photonics Spectra 1988, 22,95.
(5) Keirs, R J.; Britt, R D., Jr.; Wentworth, W. E. Anal. Chem. 1957, 29, 202.
(6) Lewis, G. N.; Kasha, M. J. Am. Chem. Soc. 1944,66,2100.
(7) Desilets, D. J.; Kissinger, P. T.; Lytle, F. E. Anal. Chem. 1987,59, 1830.
(8) Lakowicz, J. R; Lazco, G.; Gryczynski, l. Rev. Sci. lnstrum. 1986,57,2499.
(9) Nithipatikom, K.; McGown, L. B. Appl. Spectrosc. 1987,41,395.
(10) Keating-Nakamoto, S. M.; Cherek, H.; Lakowicz, J. R Anal. Chem. 1987,59,271.
(11) Marcelloni, M.; Fleming, G. R. J. Chem. Phys. 1987,86,6221.
(12) Myers, A. B.; Hochstrasser, R M. J. Chem. Phys. 1987,87,2116.
(13) Hochstrasser, R M.; Novak, F. A. Chem. Phys. Lett. 1977,48, 1.
Choosing a graduate school? ~lbe "jCS Need to know wh07s doing _ ~ research critical to yours? ])irecro of
Graduate R~h c ,
II .. fIilifIUfIJ
, i '" Jf , ~ j
All the information you need on chemicall~esearch and researchers at universities in the U.S. and Canada. in a single source.
1989 Call toUJree (800) 227·5558 and ch<'1'ge your credit card. In Washington, D.C, caU 872·4363.
• Contains a wealth of facts on 1 L93~ !'Jcult\
puhlicltion cltatJons.
academic and
r------------------,
:;ncnce
• Li.'>lS Ullln:rsit1cs \\,lth names and ilic'cr:loh.lcal information for all faculty
thelr area:"> of spcclalizatlo11. titles paper::, puhllshed in the last two years,
and telephone numbers. E;\X numhers, and computer addresses
!436 (1989) Oochbound i'nce, & Canada $55.00 Export $66.00
I I I
Plc~c !'oend me _____ copy(ic!» of the \.c."i l>ircctory of Graduate Rc~c:lI;ch 1989. Price: OS & Canada $55.00, Export $66. )0.
llLmdll'
I .\,,"'''''' "lgn.UlIl<"_
I ,'>hl;) I)()"h.~ to
Expll\'~
___ I'II'Hlc'
I ~;::',::" I ::)I,~:\~.I:'::.:·:Il~ll::dl\ Idll.tl~ 11<' pr':p.dd
I I I I I
- I I
I \l:Jll [hl~ (}f(k'i lonn \\lth :')1:[ i'~j\lIwn[ t() American Chemical Sock"ty, Di..'itrihution Office DePL 70S, I P.O. Box 57156, West EIlI! StatioIl, Wru..ilington, D.C. 20037. 705 1o. ________________ L. ___________________ .J
276 A • ANALYTICAL CHEMISTRY, VOL. 62, NO.4, FEBRUARY 15, 1990

(14) Harris, J. M.; Chrisman, R W.; Lytle, F. E.; Tobias, R S. Anal. Chem. 1976,48, 1937.
(15) Watanabe, J.; Kinoshita, S.; Kushida, T. Rev. Sci. Instrum. 1985,56, 1195.
(16) Demas, J. N.; Keller, R A. Anal. Chem. 1985,57,538.
(17) Bright, F. V.; Hieftje, G. M. Appl. Spectrosc. 1986,40,583.
(18) Wirth, M. J.; Chou, S.-H. Anal. Chem. 1988,60, 1882.
(19) Hirschfeld, T; Chase, B. Appl. Spectrosc. 1986,40, 133.
(20) Williamson, J. M.; Bowling, R J.; McCreery, R L. Appl. Spectrosc. 1989, 43,372.
(21) Asher, S. A.; Johnson, C. R; Murtaugh, A. Rev. Sci. Instrum. 1983,54,1657.
(22) Debye, P. Polar Molecules; Dover: New York, 1929.
(23) Chuang, T. J.; Eisenthal, K B. J. Chem. Phys. 1972,57, 5094.
(24) Blanchard, G. J.; Wirth, M. J. J. Chem. Phys. 1985,82,39.
(25) Bright, F. V.; McGown, L. B. Anal. Chem. 1986,58, 1424.
(26) Fork, R L.; Brito, C. H.; Becker, P. C.; Shank, C. V. Opt. Lett. 1987,10,609.
(27) Finch, A.; Sleat, W. E.; Sibbett, W. Rev. Sci. I nstrum. 1989, 60, 839.
(28) Heritage, J. P.; Allara, D. P. Chem. Phys. Lett. 1980, 74,507.
(29) Levine, B. F.; Bethea, C. G. Appl. Phys. Lett. 1980,36,245.
(30) Blanchard, G. J.; Wirth, M. J. Anal. Chem. 1986,58,532.
(31) Shah, J. IEEE J. Quantum Electron. 1988,24,276.
(32) Kat low, M. A.; Jarzeba, W.; DuBruil, T. P.; Barbara, P. F. Rev. Sci. Instrum. 1988,59,1098.
(33) Harris, J. M.; Chrisman, R. W.; Lytle, F. E.; Tobias, R S. Appl. Phys. Lett. 1975, 26,16.
(34) Chan, C. K; Sari, S. O. Appl. Phys. Lett. 1974,25, 403.
(35) Mahr, H.; Hirsch, M. D. Opt. Commun. 1975, 13, 96.
(36) Wirth, M. J.; Sanders, M. J.; Koskela, A. C. Appl. Phys. Lett. 1981,38,295.
(37) Elzinga, P. A.; Lytle, F. E.; Jaing, Y.; King, }. B.; Laurendeau, N. M. Appl. Spectrosc. 1987,41,2.
(38) Kneisler, R J.; Lytle, F. E.; Fiechtner, G. J.; Jiang, Y.; King, G. B.; Laurendeau, N. M. Opt. Lett. 1989,14,260.
(39) Chol, K-J.; Gustafson, T. L. IEEE J. Quantum Electron., in press.
(40) BlaHchard, G. J.; Wirth, M. J. J. Phys. Chem. 1986,90, 252l.
(41) Wirth, M. J.; Chou, S.-H. In Advances in Lumin!~scence Spectroscopy; Eastwood, D., Ed. ASTM: Philadelphia, in press.
(42) ChOl, S.-H.; Wirth, M. J. J. Phys. Chem. 1989,93,7694.
(43) Blar chard, G. J. J. Phys. Chem. 1988, 92,630l.
(44) Blarchard, G. J.; Cihal, C. A. J. Phys. Chem. 1988,92,5950.
(45) Blarchard, G. J. Anal. Chem. 1989,61, 2394.
(46) Gustafson, T. L.; Roberts, D. M.; Chernoff, D. A. J. Chem. Phys. 1983, 79(4), 1559.
(47) Gustafson, T. L.; Roberts,D. M.; Chernoff, D. A. J. Chem. Phys. 1984,81,3438.
(48) Gustafson, T J. F.; Rob-erts, D. M. Chem. 1986,127, 505.
(49) Blanchard, G. J.; Heritage, J. P.; Vvn Lehman, A. C.; Kelly, M. K; Baker, G. L.; Etemad, S. Phys. Rev. Let(. 1989,63,887.
(50) Gustafson, T L.; Scher, H.; Roberts, D. M.; Collins, R W. Phys. Rev. Lett. 1988,60, 148.
Mary J. Wirth is an associate professor of chemistry at the University of Delaware. She received her B.S. degree from Northern Illinois University (1974) and her Ph.D. from Purdue University (1978). At Purdue, her research on the quantitative aspects two-photon spectroscopy was out under the guidance of Fred E. Lytle. Her research interests include the application of laser spectroscopic measurements to the understanding of solvation phenomena, specifically with regard to chemical separations.
WHAT'S HAPPENING IN CHEMISTRY? Within the pages of What's Happening in Chemistry? you'll find the wonder of discovery and the thrill of problem-solving. Sample topics are
• Lightning May Fix More Nitrogen Than Bacteria
• A New Way te Clean Up Oil Spills
• Seesaw Battle !\gainst the Common Cold
A valuable supplement to your textbook, this award-winning publication will bring the excitement of today's science to your students.
What's Happening in Chemistry? has received high praise from writers, teachers, and students. Here's what reviewers had to say about last year's edition: "Whats happening in chemistry? A good way to find out would be to pick up a copy of the American Chemical Socierys .. .journal of the
same name." Science Teacher
': .. accessible for readers who want to learn more aboUl a broad range of current developments in chemical research"
Science Books & Films
WHAT'S HAPPENING IN CHEMISTRY? QUANTITY COST
ALL ORDERS MUST BE PREPAID ___ ISBN #0-8412-1649-5 @ $5.00 _____ _
Charge My 0 VISA/MasterCard 0 American Express Foreign Add $1.50 _____ _
o Diners Club/Carte Blanche Barclaycard 0 Access TOTAL _____ _
Please Type or Print Card # ________________ _ Exp. Date ____________________ _
Interbank # _________________ . _____ Signature ___________________ _
Name _________________ _ Telephone ____________________ _
Organization _________________________________________ _
Address Ci y State ___ Zip ____ _
(ACS 5617017390/ AlB) American Chemical Society, Department of Public Communication, 1155 Sixteenth Street, N.W., Washington, D.C. 20036
ANALYTICAL CHEMISTRY, VOL. 62, NO.4, FEBRUARY 15, 1990 • 277 A

RELAX AND STAY C:URRENT WITH CHEMICAL LITERATURE
CA SELECTS is a series of current awareness publications that are produced from the Chemical Abstracts (CA) database. You can relax, knowing that a profile will be run every other week to search all relevant current literature covered by CA for your area of interest. From our computer to you, a review of chemical literature in just 10-12 pages (on the average).
All this for just $17000-$6.54 an issue, about 5 cents per abstract! Find out if CA SELECTS covers your research interests by sending for your FREE copy of all 215 topic descriptions.
Mail coupon to: Chemical Abstracts Service Marketing Dept. 31390 2540 Olentangy River Road P.O. Box 3012 Columbus, Ohio 43210, U.SA
Or call us at: (614) 447·3731; or 1-800·848·6538 (ask for Customer Service).
---------1 CA SI,LECTS Catalog Coupon
. . . • . . . . . . • . . . •. I
YES I 'lease send me the descriptions of all 215 topic, I
I N2rne ______ _ ---- - I
Job Ttle ----------
QrgarlZation ____ _
MdrEss... ____ _
Statel'P______ __ --
I
I
I
I
Chemical Abstracts Service is a diviSion of the American Chemical Society.
278 A • ANALYTICAL CHEMISTRY, VOL. 62, NO.4, FEBRUARY 15, 1990

Conferences • International Symposium on Characterization of Macromolecules Used as Pharmaceutical Excipients. March 7-9. Gothenburg, Sweden. Contact: Swedish Academy of Pharmaceutical Sciences, P.O. Box 1136, S-111 81 Stockholm, Sweden • 22nd Annual Meeting of the National Committee for Clinical Laboratory Standards. March 29-30. Bethesda, MD. Contact: NCCLS, 771 E. Lancaster Ave., Villanova, PA 19085 (215-525-2435) • 9th International Conference on Fundamental Aspects, Analytical Techniques, Processes, and Applications of Pyrolysis (Pyrolysis '90). June 11-15. Noordwijkerhout, The Netherlands. Contact: Louise Roos, FOM-Institute for Atomic and Molecular Physics, Kruislaan 407, 1098 SJ Amsterdam, The Netherlands • 83rd Annual Meeting of the Air and Waste Management Association. June 24-29. Pittsburgh, PA. Contact: Air and Waste Management Association, P.O. Box 2861, Pittsburgh, PA 15230 (412-232-3444) • 6th Annual Waste Testing and Quality Assurance Symposium. July 16-20. Washington, DC. Contact: American Chemical Society, Room 205,1155 16th St., N. W., Washington, DC 20036 • Inter/Micro-90. Aug. 20-24. Chicago, IL. Contact: Nancy Daerr, McCrone Research Institute, 2820 S. Michigan Ave., Chicago, IL 60616 .. 10th International Symposium on HPLC of Proteins, Peptides, and Polynucleotides. Oct. 29-31. Wiesba· den, F.R.G. Contact: Secretariat, 10th ISPPP, P.O. Box 28, S-75103 Uppsala, Sweden
Short Courses and Workshops For information on the following courses, contact Toula Hionis, Pharmacia LKB Biotechnology, 800 Centennial Ave., Piscataway, NJ 08854 (201-457-8470) • Pilot Scale (from Milligrams to
MS-:ET/NGS
Grams) Protein Purification. March 6-9. Piscataway, NJ • Valid ation Issues in Chromatographic Processes. March 12. Piscataway, NJ • Process Chromatography Techniques: Theory and Practice. March 27-29. P scataway, NJ • Large-Scale Column Packing and Eyaluation. March 30. Piscataway. NJ
For inf,Jrmation on the following courses, contact Stat-Ease, 3801 Nicollet ALe. S., Minneapolis, MN 55409 (612-822-5574) • Experiment Design Made Easy. March 11-22. St. Paul, MN • Advanced Experiment Design. April 23--26. St. Paul, MN
For information on the following courses, contact Barbara Sherman, Professional Analytical and Consulting Serv :ces, 409 Meade Dr., Coraopolis,PA 15108 (412-262-4222) • Cour:;e on Inductively Coupled Plasma Spectrochemical Analysis. March 2 _-22. Pittsburgh, PA • Cour:;e on Quality Assurance of Chemical Measurements. March 22-23. Pittsburgh, PA • Cour:;es on Supercritical Fluid Chromatography and 2D NMR. April 19- 20. Pittsburgh, PA • Cour:;e on Infrared Spectrometry and Spectral Interpretation. May 7-9 Pittsburgh, PA
For information on the following courses, contact Tammy Morante, NUS C,lemistry Training Center, Park West Two, Pittsburgh, PA 15275 (412-788·1080) • Adva nced Gamma Spectroscopy. March 26-29 and June 25-28. Pittsburgh, PA • Power Plant Ion Chromatography. Apr il 30-May 4. Pittsburgh, P A • Radiochemistry Principles and Applicajons. May 7-18. Pittsburgh, PA
• Cour:;e and Workshop on Interpretation of IR and Raman Spectroscopy. May 14-19. Nashville, TN. Contact: Clara Crauer, Fisk Infrared InstitutE, Box 15, Fisk University, Nashvill', TN 37203 (314-962-5752)
Call for Papers • International Conference on IonExchange Processes (Ion-Ex '90). July 9-11. Wrexham, U.K. Conference topics will include instrumental developments; environmental, inorganic, organic, biological, water, and pharmaceutical analysis; development of new materials; ion-exchange membranes; ion exclusion chromatography; ion chromatography and associated techniques; fundamental studies of ion-exchange processes and materials; and applications in the nuclear industry. Authors wishing to contribute poster presentations should submit 250-word abstracts by May 31 to Secretariat, Ion-Ex '90, Research Division, The North East Wales Institute, Deeside, Clwyd CH5 4BR, U.K. • Euroanalysis VII. Vienna, Austria. Aug. 26-31. The scientific program will consist of invited lectures and contributed oral and poster presentations on applications of analytical chemistry (environmental systems and food, pharmaceutical and biomedical science, biotechnology, materials science, and arts and archeology) and methodological developments in analytical chemistry (including atomic spectroscopy, molecular spectroscopy, separation techniques, electrochemical methods, sensors, radiochemical and nuclear techniques, thermal analysis, local and surface analysis, structure analysis of solids, and immunoassay). Special sessions are also planned on sample preparation for inorganic and organic trace analysis, computer-based analytical chemistry, quality assurance in analytical chemistry, and education and training in analytical chemistry. Prospective authors should request appropriate forms from M. Grasserbauer, Interconvention, Austria Center Vienna, A-1450 Vienna, Austria. Abstracts received after February 28 may not be considered.
These events are newly listed in the JOURNAL. See back issues for other events of interest.
ANALYTICAL CHEMISTRY, VOL. 62, NO.4, FEBRUARY 15, 1990 • 279 A

For SUlte-of-the"a", resea."ch and te&hnolDfO'
Journal of Chemlical Information and Computer Sciences An American Chemical Society Publication
George WA. Milne, Editor, National Institutes of Health
Edited for chemists, chemical engineers, and computer scientists, this international quarterly journal provides highly topical coverage of:
• data acquisition and analysis • pattern recognition and artificial intelligence • new algorithms and applications of
existing algorithms
• interfacing techniques • computer systems and components • graphics, simulation, and modeling • operations research • econometric and management systems • indexing classification and notation systems • data correlation, information systems, nomenclature, and linguistics ,nd
communication • information sources and services • design and applications of computerized information and data system;.
The Journal of Chemical Information and Computer Sciences includes peer-reviewed research studies, programming innovations, software reviews, invited papers, and book reviews.
Submit your oritlirnd worJt! Under new editorship, the Journal of Chemical Information and Computer Sciences is designed to attract the exact audience of experts whom you want to reach. For manuscript guidelines please contact: George W.A. Milne, Building 37, Room 5C28, National Institutes of Health, Bethesda, MD 20892, 3011 496-3597,
280 • ANALYTICAL CHEMISTRY. VOL. 62. NO.4. FEBRUARY 15, 1990
Associate Editors W.A. Warr, leI, UK R. Luckenbach, Beilstein Institute, Germany
Software Editor S. R. Heller, USD.A.
Advisory Board B.A. Hoh,," , Roltm & HeiSS
CPo O. Cli.
In'ltrwll,llL\
W.G. TIJwn. Dl!ta Services Lmli!eJ. Englmd 1. YamJffiOW, Unn;. of Libmr~; Infunlwri(!ll Science,
Jai)(l11
1990 Subscription Information
;\]1 Oth~r
Et,Ui\: G'unm,;,; -----_._-------ACS Members~
5116
For more information or to subscribe, write:
American Chemical Society MarketIng Communications Dt'panment : 155 Sixteenth Street, NW Washington. DC 20036 1-800-227-5558 or (202) 872-4363 TLX 440159 FAX 202/872-4615 For nonmember ra[c~ in Japan n)n(act Marur"n Co., Ltd.
i~ available Nl micrdkhc" microfilm, and STN International.

E.~OOKS ------Electron Mil[:roscopy and FT -IR
Electron Microscopy and Analysis, 2nd Edition. P. J. Goodhew and F. J. Humphreys. 223 pp. Taylor & Francis, 79 Madison Ave., New York, NY 10016. 1988. $27
Reviewed by M. V. Parthasarathy, Section of Plant Biology, 228 Plant Sciences Bldg., Cornell University, Ithaca, NY 14853
Currently there are at least a dozen books on electron microscopy and analysis available on the market, and undoubtedly there are more in press. What then is different or new in this book by Goodhew and Humphreys? For one thing, it is one of the most affordable books available on the subject. Second, the authors have managed to cover a great deal of material within 223 pages (excluding the index). The book is primarily aimed at those interested in material sciences, but there is much information that can also be useful to others. The subject matter is well organized, and the authors have explained some of the difficult concepts in a lucid manner.
Five out of the seven chapters in the book are devoted to the principles and techniques of transmission and scanning electron microscopes. Basic principles and concepts of optics, electrons, and their interaction with specimens are very well presented and supplemented by carefully chosen figures. The chapter on electron diffraction, which has been added in this edition, is especially well covered.
The principles, designs, and techniques of transmission and scanning electron microscopes are explained well, if not in great detail. The use of computers to achieve digital beam control, image storage, and processing is also adequately described. Again, in this section the authors have used appropriate examples and figures very effectively.
Microanalysis in the electron microscope has become a powerful tool, and the authors' decision to add an entire chapter on chemical analysis for the second edition is commendable. Although this chapter is quite concise (44 pages), it covers most of the important principles of X-ray energy-dispersive spectrometry (EDS), X-ray wave-
length dispersive spectrometry (WDS), and eledron energy loss spectrometry (EELS). The advantages and disadvantages of these techniques are well covered, Unfortunately, the use of ultra-thin windows in detectors of EDS systems has received only a passing remark. Ultra-thin window detectors, which a'e now used routinely in several laboratories, have solved most of the problems that are inherent in using window,ess detectors and have extended the Factical capability of EDS systems to the determination of light elements le.g., C, ~, and 0). The last chapter offers an excellent summation of other techniques available for characterization of materials.
Because of the breadth of the subjects co ;,ered, the book is necessarily short on details. However, it is an excellent introduction for those who have little knowledge of electron microscopy or micrc'analysis.
Advanc'ls in Applied Fourier Transform Infrared Spectroscopy. M. W. Mackenzie, Ed. xii + 353 pp. John Wiley & Sons, 605 Third Ave., New York, NY 10158.1988. $95
Reviewed by Bruce Chase, CRD 328/ 163, Du Pont Experimental Station, P.O. Bn 80328, Wilmington, DE 19880-0328
This bo ok is essentially a collection of diverse "hapters on various experimental techniques in IR spectrometry. The sole un fying feature is their dependence on interferometric instruments for enhmced signal-to-noise ratio or rapid data acquisition. For the reader who ask 3, "What are some of the different mea ;urements I can now make with interferometers?", this volume will save the time involved in searching the literatme. For those interested in polarizaticn-modulation experiments in vibrational circular dichroism, for example, 1 his is a good introduction, but it will not substitute for the current literatu:·e.
Chap;er 1 stands alone since it is not related ;0 any specific experiment but introdu"es the basic concepts in data analysis. Unfortunately, the very active
areas of resolution enhancement and multi component analysis are ignored. The concepts presented are not very relevant to the remainder of the volume, and it is not clear why the editors included it.
The second chapter reviews the development and current status of GC/IR. The relevant references are included, and the author gives a reasonable view of the future. The advent of the matrix isolation approach to GC/IR is well covered.
While the development and use of polarization-modulation techniques in FT-IR has not progressed past initial use in a few labs, the potential for the future is tremendous. Chapter 3 provides a sound basis for understanding the experimental requirements and difficulties in double (or triple) modulation experiments.
In Chapter 4 the authors do an excellent job reviewing potential approaches to analyzing solid samples. The strengths and weaknesses of microscopy, diffuse reflectance, and emission are well stated. For a beginning spectroscopist in an industrial laboratory, this is an excellent place to start.
The limited amount of work done in rheooptical FT -IR spectrometry is well reviewed in Chapter 5. The basis for looking at segment reorientation and the polarization measurements of orientation in polymers is explained quite clearly. The only aspect that is missing is the two-dimensional work recently discussed by Marcott and co-workers.
Chapter 6 stands apart from the remainder of the volume in that it is primarily a discussion of theoretical approaches to intensity and frequency calculation. The chapter also discusses the structure and dynamics of polymethylene chain systems.
The final chapter discusses IR spectrometry of catalyst systems under reactor conditions. Much of this chapter builds on the discussions of solid sampiing techniques given earlier in the book. Transmission, emission, and photoacoustic approaches to catalyst studies are cited.
Most chapters have literature references through 1987 and provide reasonable introductions to the specific experiments discussed. As a desk reference I would give it a 5 out of 10.
ANALYTICAL CHEMISTRY, VOL. 62. NO.4, FEBRUARY 15, 1990 • 281 A

NEW PROO.'JCTS
Pulsed electrochemical detector features conductometric and amperometric capabilities. Applications include detection of inorganic anions and cations, organic acids, amines, alcohols, thiols, and carbohydrates. Dionex 401
XRF. Omicron X-ray microfluorescence spectroscopy system provides nondestructive small-area elemental and thickness analyses. Applications include multilayer, multielement film thickness and composition analyses at the microstructure level as well as contamination and failure analyses. Kevex Instruments 404
Detector. HP 1049A programmable electrochemical detector for LC features a built-in pulse mode that automatically keeps the electrode clean during a chromatographic run. Optional gold or platinum electrodes are available for special applications. HewlettPackard 405
ICP. Single-channel Plasma 1000 and dual-channel Plasma 2000 ICP emission spectrometers allow the selection of any emission line from a built-in 50,000-line wavelength table or any wavelength between 165 and 800 nm. The spectrometers are controlled by an industry standard 80386-based computer. Perkin-Elmer 406
Gas analysis. Odyssey 2001 is a portable, microprocessor-based analyzer that automatically measures and displays real-time gas concentrations in the 0-1000 ppb range. Applications include indoor pollution and personnel exposure monitoring. TRI 407
Robotics. Autolab 500 is a polar coordinate robot that allows control of sample preparation procedures or entire
assays, including tuhe- or plate-based immunoassays. Liquid-handling features include liquid-level sensing and dual probe sampling. Kemble Instruments 408
MS. GloQuad glow discharge mass spectrometer features a glow d, scharge source with cryo-cooling, a dud detector system with a linear dynamic range of> 7 orders of magnitude, multitasking software, and sample throughput of ~5 samples per hour. VG Instmments
409
Digestion. Buchi 420 Kjeldahl rapid digestion unit accommodates sample volumes of up to 10 g of po;vder or 200 mL of liquid. The unit, which can digest up to two samples simul1 aneousIy, features a built-in fan that (ools the hot tubes and digested sampJ es after they are automatically raised 0 1t of the heaters. Brinkmann InstIllments
410
LC. Carlo Erba System 20 is a nodular micro HPLC system that featllres isocratic and gradient capabilit: es. The high-pressure syringe pump provides flow rates in the 1-4000 ILLim in range and allows the user to purge 0:' change solvents without removing the column. Fisons Instruments 411
Oxygen. Model 600 Oxan oxy:~en analyzer measures the percent co 1centration of oxygen in air and parts-per-million levels of dissolved oxygen in aq ueous solutions in ranges of 0-1 )0% and 0-20 ppm, respectively. The sensor can withstand pressures up to 25 psi. Engineered Systems and Designs 412
Centrifuge. Bench-top refrgerated centrifuge, which produces temperatures down to 1 °C with ± 1 o( accuracy, includes an automatic safety feature that prevents damage to the centrifuge and samples if unsaf 8 speed, temperature, or rotor conditions develop. Wheaton 413
Software Data handling. DataTalk is , menudriven software package that collects, manipulates, and formats da ta from laboratory instruments equipped with
282 A • ANALYTICAL CHEMISTRY, VOL. 62, NO.4, FEBRUARY 15, 1990
an RS-232 port. Results can be exported to custom-designed reports or transferred to another computer. Labtronics
415
Image analysis. JAVA 1.3 video image analysis software, designed for IBM and compatible personal computers, features pseudocolor support and clear-field lighting equalization. Capabilities include densitometry, morphometric analysis, automatic line and edge digitizing, and automatic object counting. Jandel Scientific 416
Manufacturers' literature Process analysis. Brochure discusses use of the Model 400 photometric ana-1yzer in the pulp and paper industry. Applications at each stage of paper manufacturing are described. Du Pont
418
Le. Chromatogram, Vol. 10, No.3, includes articles on metabolism, software, quality control, and foods and beverages. Recently published papers on HPLC are also discussed. 16 pp. Beckman Instruments 419
GPC. Brochure discusses the analysis of synthetic and natural polymers, environmental samples, and small organic molecules by gel permeation chromatography. 16 pp. HPLC Technology
420
Electrophoresis. Application notes describe use of the Model 230A highperformance preparative electrophoresis system for the purification of proteins, DNA, and synthetic oligonucleotides. Applied Biosystems 421
Sample preparation. Brochure describes the ASTED system for on-line preparation of biological and industrial samples prior to HPLC analysis. The system is based on a combination of dialysis and trace enrichment. Gilson Medical Electronics 423
For more information on listed items, circle the appropriate numbers on one of our Readers' Service Cards

A long-awaited unifying medium for virtually any practitioner of conjugation chemistry
BilKXJnjugare Ch~emistIY Premiering January/February 1990 Editor: Claude F I Aeares, University of Califon/a, Davis
Centralized Access Is Here! In bimonthly issues, Bioconjugate Chemistry will bring together important research findings in the fast-developing discipline of conjugation chemistry, Now-in a single, time-saving source-you'll find information which other Nise might be scattered throughout broader-focoS scholarly journals,
The central theme of Bioconjugate Chemi;try is the joining of two different molecular functiJns by chemical or biological means, This includrlS:
Conjugation of .•• antibodies (and their fragments) nucleic acids and their analogs (a-anomers,
phosphonates, , , ,) liposomal components other biologically active molecules (receptx
binding proteins, hormones, peptides, , , ,)
with each other or with any molecular gloups that add useful properties ... drugs, radionuclides, toxins, fluorophores, photoprobes, inhibitors, enzymes, haptem, ligands, etc,
There is no journal with this precise focus published today,
The Leading Edge In Biomedical Advances Bioconjugate Chemistry will publish rese,Jfch at the core of many biotechnology enterprises, as well as of specific interest to biomedical fil ms, drug companies, and chemical laboratoriEs,
Topics will emphasize the chemical aspec:s of conjugate preparation and characterizaticn , In
vivo applications of conjugate methodolo~y molecular biological aspects of anti bodie, , genetically engineered fragments, and otr er immunochemicals ' and the relationshirs between conjugation chemistry and the biJlogical properties of conjugates,
Guidedbya "Who's Who" in the Field Editor: Claude F. Meares,
Univ, of Calif" Davis
1990 Editorial Advisory Board
V, Alvarez, Cytogen Corp, L. Arnold, Gen·Probe R, W Aicher, Argonne Nat!.
Labs R. W. Baldwin, Univ. of
Noffingham, England 1. Bumol, Eli Lilly & Co, K. Chang, fmmunomedics G. David, Hybritech, Inc. P. B. Oervan, California /nst. of
Tech D. Dolphin, Univ. of British
Columbia, Canada 1. W Doyle, Bristol- Myers R. E, Feeney, Univ. of California.
Davis 0, Fitzgerald, Natl, Inst of
Health J. M. Frincke, Hybritech, Inc. A. Fritzberg, NeoRx Corp. W. F. Goeckler, Dow Chemica!
Co, D. Goodwin, Stanford Univ. E, Haber, ER Squibb and Sons,
Inc, T. Hara, {nst. for Biomedical
Res., Japan R. Haugland, Molecular Probes,
Inc. J. Hearst, Univ. of California,
Berkeley N. Heindel, Lehigh Univ. C. Helene, Museum National
D'Hisloire Naturel/e, France
E. Hurwitz, Weizmann inst. of Science, Israel
D. Johnson, Abbott Labs 0, Kaplan, Dow Chemical Co, B. A. Khaw, Massachusetts
GenL Hospital K. Krohn, Univ. of Washington P. Miller, Johns Hopkins Univ. H. Nagasawa, Univ. of
Minnesota, Minneapolis P. Nielsen, Univ. of
Copenhagen, Denmark A. Oseroff, Tufts New England
Medical Ctr, M. Ostrow, The Liposome Co.,
Inc. G. Pietersz, Univ. of Melbourne,
Australia R. Reisfeld. Scripps Clinic &
Res, Fnd, S, Rocklage, Salvlar, Inc, J, Rodweli, Cytogen Corp, P. Schultz, Univ. of California,
Berke/ey P. Senter, Oncogen S. Srivastava, Brookhaven Nat/.
Lab, P. E. Thorpe, Imperia! Cancer
Res, Fund, England G. Tolman A. Tramontano, Scripps Clinic &
Res, Fnd. J. Upeslacis, Lederle Lab, R, S, Vickers, Sterling Drug Co, E. S. Vitetia, Univ. of Texas,
Dal/as S. Wilbur, NeoRx Corp. M. Wilchek, Weizmann fnst. of
Science, Israel M. Zalutsky, Duke Univ.
Attention Prospective Contributors! With its exclusive, focused readership, Bioconjugate Chemistry will attract the specific audience of experts whom you
want to reach, and is committed to prompt publication of manuscripts. For information on submitting your
original work" please contact Dr. ClaUDe F. Meares,
Department of Chemistry, , University of Californi~ Davis, CA 95616
(916/752-;1360j.
ANALYTICAL CHEMISTRY, VOL. 62. NO, 4, FEBRUARY 15. 1990 • 283 A

NEW PRODUCTS
Detector. Brochure highlights the AD-200 absorbance detector for HPLC and capillary electrophoresis. The doublebeam system features a wavelength range of 190-700 nrn and a bandwidth of 5 nm. Spectro Vision 422
Catalogs Standards. Catalog lists chlorinated, brominated, and methylated chlorinated dibenzo-p-dioxins and dibenzofurans. Unlabeled, radioisotope-labeled, and stable-isotope-Iabeled compounds are included. Chemsyn Science Laboratories/Wellington Laboratories
431
Chromatography. Catalog features more than 5000 products for chromatography, including HPLC and GC columns, high-purity solvents, and EPA precleaned vials. Scientific Products Division, Baxter Healthcare 425
Immunochemicals. Catalog lists immunochemicals and related products, including antisera to drugs with matched enzyme, fluorochrome, or
radiolabeled ligands for use in RIA, EIA, or fluorescent immun"assays. Sigma Immunochemicals 426
Safety. Catalog includes nbinets, clothing, drums, cans, eyewear, first aid products, gas cylinder apparatus,
LlMOR L is a near-IR multiple-component liquid analyzer that diffracts IR light into selected wavelengths with"ut using moving parts. The system provides simultaneous analysis of up to four liquid components. Westinghouse Electric
402
gloves, labels, pumps, respirators, signs, and spill control products. 48 pp. Lab Safety Supply 427
Standards. Catalog features GC/MS standards for environmental analysis, induding carbon-13 labeled and native chlorodibenzo-p-dioxins, chlorodibenzofurans, polychlorinated biphenyls, bromodibenzofurans, and bromodibenzo-p-dioxins. Cambridge Isotope Laboratories 428
Environmental analysis. Catalog describes reagents, high-purity solvents, and chromatography products for the analysis of organic and inorganic pollutants. Included are standards, sample preparation products, LC and vacuum pumps, replacement parts, a conductivity monitor, and test kits. 40 pp. EM Science 429
Biotechnology. Catalog lists products for chromatography, electrophoresis, filtration, sample preparation, and cell culture/fermentation. Immunoaffinity columns and packings and TLC accessories are included. 64 pp. Kontes Biotechnology 430
LAB 0 RAT 0 R Y :5 E R V ICE C E NTE R
Acetoned!carboxylic Acid & esters e Allyl-lsD-Valerate. Alumlnon DL-Aspartlc ACid· Azelaic ACid· BenZOIC Anhydride· Cesium Chlonde
D,hydroxyacetone • 3.5-DlhydroxybenZOIc Acid· Dimethyl Ad'pate 4-Dimethylaminobenzalrhodanlne • Dimethylglyoxime • EGTA • FluorenOlle
Giemsa Stain It Glutaric Anhydride. Imidazole. Maltose. Methyl Acetam de 3-Methylglutaric Anhydride· 4-Methylpentanolc ACid' SaliCin
Sodium Teuaphenylboron • Succlnlmlde • Sulfosalicylic Acid. Thlonin Trisodium Pentacyanoamlneferroate • iso- & a-Vanillin· Veratrole
Write for our Products List of over 3,000 chemicals
Tel 516-273-0900' TOLL FREE: 800-645-5566 Telefax 516-273-0858· Telex: 4~)7-4275
EASTERN CHEMICAL P.O. Box 25 DEPT. AC
A DiviSion of UNITED-GUARDIAN, INC. SMITHTOWN, N.Y.
Laboratory Service Center (Equipment, Materials, Services, lnstrumen s for Leasing), Maximum space 4 inches per advertisement. ColulT n width, 2-3/16"; two column width, 4-9/16 '1 . Artwork accepted. No comtination of directory rates with ROP advertising. Rates based on number I)f inches used within 12 months from first date of first insertion. Per inch: 1 II - $165; 12" - $160; 24" - $155; 36" - $150; 48" - $145.
CALL OR WRITE JANE GA TENBY
ANALYTICAL CHEMISTRY 500 Post Road East
P.O. Box 231 Westport, CT 06880
203-226-7131/FAX: 203-454-9939
284 A • ANALYTICAL CHEMISTRY, VOL. 62, NO.4, FEBRUARY 15, 1990
HELP WANTED ADS
ROP display at ROP rates. Rate based on number of insertions within contract year. Cannot be combined for frequency.
Unit 1-Ti
1" (25 mm) $190 $170 $160
24-Ti 48-Ti 72-Ti
$150 $140 $130
CALL OR WRITE JANE GATENBY
ANALYTICAL CHEMISTRY 500 Post Road East
P.O. Box 231 Westport, CT 06880
203-226-7131
FAX: 203-454-9939
FREE DATA, FAST To quickly amass data on all of the products you need, consult the Lab Data Service Section on our Analytical Chemistry reader reply card insert.

INDEX TO ADVERTISERS IN THIS ISSUE
CIRCLE INQUIRY NO. ADVERTISERS PAGE NO.
28 •••••••.••••• Caframo, Ltd. ••••••••.••••••••••••••••• 269A
75 •••••••••••••• Leybold Vacuum Products, Inc ••••••••••• CD Werbeagentur GmbH
90 .••••••••••••• Matheson Gas Products •••••••••••••••• Kenyon Hoag Associates
OBC
259A
124-129 •••••••• ·SLM Instruments, Inc •••••••.••••••••••. , •• IFC
135 •••••••.•..• ·Supelco, Inc •••.•••••••••••••••••••••• , 261A
Directory section, see page 284A. • See ad in ACS Laboratory Guide.
Advertising Management for the American Chemical Society Publications
CENTCOM, L TO
President
James A. Byrne
Executive Vice President Benjamin W. Jones
Clay S. Holden, Vice President Robert L. Voepel, Vice President
Joseph P. Stenza, Production Director
500 Post Road East P.O. Box 231 Westport. Connecticut 06880 (Area Code 203) 226-7131 Telex No.643310 FAX: 203-454-9939
ADVERTISING SALES MANAGER Bruce E. Poorman
ADVERTISING PRODUCTION MANAGER
Jane F. Gatenby
SALES REPRESENTATIVES
Philadelphia, PA ••• Patricia O'Donnell, CENTCOM, LTD., GSB Building, SuRe 405, 1 Belmont Avenue, Bala Cynwyd, Pa. 19004. Telephone: 215-667-9666, FAX: 215-667-9353
New York, NY ••• John F. Raftery, CENTCOM, LTD., 60 East 42nd St., New York, N.Y. 10165. Telephone: 212-972-9660
Westport, CT •.• Edward M. Black, CENTCOM, LTD., 500 Post Road East, P.O. Box 231, Westport, Ct. 06880. Telephone: 203~226-7131, Telex 643310, FAX: 203-454-9939
Cleveland, OH ••• Bruce E. Poorman, John C. Guyot, CENTCOM, LTD., 325 Front St., SuHe 2, Berea, Ohio 44017. Telephone: 216~234-1333, FAX: 216-234-3425
Chicago, IL ••• Michael J. Pak, CENTCOM, LTD., 540 Frontage Rd., Northfield, III. 60093. Telephone: 708-441-6383, FAX: 708-441-6382
Houston, TX ••• Michael J. Pak, CENTCOM, LTD. Telephone: 708-441-6383
San Francisco, CA ••• Paul M. Bulls, CENTCOM, LTD., Suite 1070,2672 Bayshore Frontage Road, Mountain View, CA 94043. Telephone: 415-969-4604
Los Angeles, CA • •• Clay S. Holden, CENTCOM, LTD., Newton Pacific Center, 3142 Pacific Coast Highway, Suite 200, Torrance, CA 90505. Telephone: 213-325-1903
Boston, MA •.. Edward M. Black, CENTCOM, LTD. Telephone: 203-226-7131
Atlanta, GA ••• John F. Raftery, CENTCOM, LTD. Telephone: 212-972-9660
Denver, CO ••• Paul M. Bulls, CENTCOM, LTD. Telephone: 415-969-4604
United Kingdom Reading, England ... Malcolm Thiele, Technomedla Ltd., Wood Cottage,
Shurlock Row, Reading RG10 OaE, Berkshire, England. Telephone: 073-434-3302, Telex #848800, FAX: 073-434-3848
Lancashire, England ••• Technomedla Ltd., clo Meconomics Ltd., Me~ conomlcs House, 31 Old Street, Ashton Under Lyne, Lancashire, England. Telephone: 061-308-3025
Continental Europe ••• Andre Jamar, International Communications, Inc., Rue Mallar 1, 4800 Verviers, Belgium. Telephone: (087) 22-53-85, FAX: (087) 23-03-29
Tokyo, Japan ... Sumio Oka, International Media Representatives Ltd., 2~29 Toranomon, 1-Chome Minato-ku Tokyo 105 Japan. Telephone: 502~ 0656, Telex #22633, FAX: 591-2530
ANALYTICAL CHEMISTRY, VOl. 62, NO.4, FEBRUARY 15, 1990 • 285 A

A Major Supplement from JOURNAL OF PHYSICAL AND CHEMICAL REFERENCE DATA
Presenting Reliable Data Utilized Scientists from Around the World
JOURNAL OF PHYSICAL AND CHEMICAL REFERENCE DATA is to publish the Third Edition of the JANAF THERMOCHEMICAL
pleased
Since the first version appeared 25 years ago, the JANAF THERMOCHE:'v1IC\L TABLES have been among the mest widely used data tables in science and engineering.
You'll find:
.. Reliable tables of thermodynamic properties of substances of wide interest
• A highly professional approach with critical evaluations of the world's thermochemical and spectroscopic literature
• A concise and easy-to-use format
This Third Edition presents an extensive set 0:' tables including thermodynamic of more than 1800 substances, expressed in SI units. The notation has been made current international recommendations.
There is no other reference source of thermod"namic data that satisfies the needs of such a broad base of users. .
Order your 2-volume set of the JANAF THEI~MOCHEMICAL TABLES today I You'll get over 1890 pages of valuable information that is crucial to your research-in two hardback volumes.
SUBSCRIPTION INFORMATION
The JANAF THERMOCHEMICAL volume supplement of Journal of Physical
1896 pages, 2 volumes, hardcover ISBN 0·88318-473-7 Supplement Number 1 to Volume 14, 1985
All orders for supplements must be prepaid.
U.S. & Canada $130.00 All Other Countries $156.00 (Posrage included.)
must be made in U.S. cur,cncy by lJll::mationa] agency. For ralCS in Japan, comac!
banK
For more information, write American Chemical Society, ,\iarkcting Comrr.unicdlions Depanme:1L ; l55 Si:;:eCGlh Street, NW, Washington, DC 20036.
In a hurry? Call TOLL FREE 800-227-5558 and charge your order:
~ 286 A • ANALYTICAL CHEMISTRY. VOL. 62. NO.4, FEBRUARY 15, 1990

EDITOR: GEORGE H. MORRISON
ASSOCfA TE EDITORS: Catherine C. Fenselau, Georges Gulochon, Walter C. Herlihy. Robert
A. Osteryoung, Edward S. Yeung
Editorial Headquarters
1155 Sixteenth St., N.W. Washington, DC 20036 Phone: 202-872-4570
Telefax: 202-872-4574
Managing Editor: Sharon G. Boots
Assistant Managing Editor: Mary Warner
Associate Editor: Louise Voress
Assistant Editors: Grace K. Lee,
Alan R. Newman
Editorial Assistant: Felicia Wach
Contributing Editor: Marcia Vogel
Director, Operational Support: C. Michael
Phillippe
Head, Production Department: Leroy L. Corcoran
Art Director: Alan Kahan
Designers: Amy Meyer Phifer, Robert Sargent
Production Editor: Elizabeth E. Wood
Circulation: Claud Robinson
Editorial Assistant, LabGuide: Joanne Mullican
Journals Dept., Columbus, Ohio
Associate Head: Marianne Brogan
Journals Editing Manager: Joseph E. Yurvati
Senior Associate Editor: Rodney L. Temos
Advisory Board: Bernard J. Bulkin, Michael S. Epstein, Renaat Gijbels, WilHam S. Hancock,
Thomas L. Isenhour, James W. Jorgenson, Peter C. Jurs, Alan G. Marshall, Lawrence A. Pachla, John F. Rabolt, Debra R. Rolison, Ralph
E. Sturgeon, Shigeru Terabe, George S. WiI~ son, Mary J. Wirth, Richard N. Zare
Ex Officio: Sam P. Perone
Instrumentation Advisory Panel: Daniel W.
Armstrong. Bruce Chase, Thomas L. Chester, R. Graham Cooks, L. J. Cline Love, Sanford P. Markey, Brenda R. Shaw, Gary W. Small, R.
Mark Wightman
Published by the
AMERICAN CHEMICAL SOCIETY 1155 16th Street. N.W.
Washington, DC 20036
Publications Division
Director: Robert H. Marks
Journals: Charles R. Bertsch
Special Publications: Randall E. Wedin
Manuscript requirements are published in the January 1, 1990 issue, page 89. Manuscripts
for publication (4 copies) should be submitted to ANAL YT!CAL CHEMISTRY at the ACS Washing
ton address.
The American Chemical Society and its editors assume no responsibility for the statements
and opinions advanced by contributors. Views
expressed in the editorials are those of the editors and do not necessarily represent the
official position of the American Chemical
Society.
AUTHOR INDEX
Ando, E .• 407 Aoki, A., 407 Armstrong, D. W., 332
Belfer, A. J., 347 Bertrand, G. l., 332
Chang, T. T., 322 Christopoulos, T. K., 360 Ciszkowska, M., 349 Clifford, R. H., 390 Cox, K. W., 338 Crow, J. A., 378
Dasgupta, P. K., 395 Diamandis, E. P., 360
Estes, E. D., 338
Fassett, J. D., 386 Foley, J. P., 378 Fujii, T., 414
Grohse, P. M., 338 Gunaratna, P. C., 402
Hanson, C. D., 409 Hodson, L. l., 338
Imasaka, T., 374 Ishibashi, N., 374 Ishii, I., 390
Jimba, H., 414
Kamo, N., 353 Kerley, E. l., 409 Kobatake, Y., 353 Kok, W. T., 367 Kurosawa, S., 353
Landau, I., 347
Lasson, E., 412 Locke, D. Co, 347
Matsue, T., 407 Matsui, D., 353 Meyer, G. A., 390 Mitsutsuka, Y .• 414 Montaser, A., 390 Murphy, T. J., 386
Nojiri, Y., 414
Okada, T., 327 Oppenheimer, S., 322 Osteryoung, J., 349 Ozinga, W. J. J., 367
Parker, V. D., 412 Petersen, K., 395 Poppe, H., 367
Russell, D. H., 409
Salmons, C. A., 338 Secor, H. V., 332 Seeman, J. I., 332 Sickles, J. E., II, 338 Siegel, M. M., 322 Stojek, Z .. 349
Tanaka, K., 374 Tsao, R., 322 Tudos, A. J., 367 Turner, A. R., 338
Uchida, I., 407 Uehiro, T., 414
Ward, K. D., 332 Ward, T. J., 332 Wilson, G. S., 402
ANALYTICAL CHEMISTRY, VOL. 62, NO.4. FEBRUARY 15. 1990 • 321

322 Anal. Chern. 1990, 62, 322-3:'7
Nonionic Surfactants Used as Exact Mass Internal Standards for the 700-2100 Dalton Mass Range in Fast Atom Bombardment Mass Spectrometry
Marshall M. Siegel,' Rushung Tsao, and Steven Oppenheimer
American Cyanamid Company, Medical Research Division, Lederle Laburatories, Pearl River, New York 10965
T.T.Chang
American Cyanamid Company, Chemical Research Division, Stamford, Connecticut 06902
Monosubstituted poly(ethylene glycol) and poly(propylene glycol) nonionic surfactant mixtures and isolated monosubsllluted pOly( ethylene glycol) Oligomer fractions were used, when adulterated with alkali-metal salts, as internal exact mass reference compounds In fast atom bombardment mass spectrometry for the mass range of 700-2100 daltons. Abundant [M + Metal]+ Ions are produced with dithiothreHolldHhloerythrHol and m-nHrobenzyl alcohol matrices for the monosubstHuted poly( ethylene glycol) and poly(propylene glycol) surfactants, respectively. The uses of these internal mass standards for the determination of the exact masses of a number of pharmaceuticals in the manual and computerized peak matching modes are illustrated.
INTRODUCTION Techniques reported for exact mass measurements in F AB
(fast atom bombardment) mass spectrometry have included the successive insertion of a reference and a sample (1, 2) and the use of split targets for a reference and sample on ststionary (3, 4), rotatable (3, 5), and wobble (6) probes. Because the reference and sample materials are separately analyzed, the reference material is referred to as an external standard. The mass measurement accuracy utilizing an external standard is not optimal due to nonreproducible mechanical, optical, and chemical factors in the successive experiments. More accurate mass measurements are obtained when the reference material is mixed together with the sample as an exact mass internal standard (7). A variety of reference standards have been suggested for exact mass measurements in F AB mass spectrometry including glycerol (8), triazines (1,4), alkalai-metal salts (4), peptides (3), phosphazines (3), perfluorokerocene (7), and the surfactants zonyl FSB (3), ethoquads (9), poly(ethylene glycols) (PEG's) (7,10), and poly(propylene glycols) (PPG's) (6). Perhaps the most popular internal exact mass reference standards in use today are the PEG's and the PPG's which are used for manual peak matching and for computerized exact mass measurements. The advantages of the PEG's and PPG's are that they produce a series of very intense peaks 44 and 58 daltons apart, respectively.
In the F AB ionization mode, at resolutions greater than 6000, PEG mixtures are routinely useful (in our hands) up to ~750 daltons as internal standards utilizing either DTT/DTE (dithiothreitol/dithioerythritol, 5/1 (w/w» or MNBA (m-nitrobenzyl alcohol) matrices for producing [M + Ht or [M + MetaJ]+ ions. Above ~750 daltons, the ion abundances of the PEG's at high resolution are low. To remedy this situation, PPG's were proposed as exact high mass standards (6). PPG's work best with MNBA as a matrix; however, they tend to produce intense fragment ions and to suppress the sample intensity.
0003-2700/90/0362-0322$02.50/0
Became much of our work involves the mass spectral analysis )f natural products of unknown structures with masses gr9ater than 700 daltons, we sought reference materials that coulc! be routinely used for FAB mass spectrometry over the mass range of 700-2100 daltons. Monosubstituted PEG and PPG surfactants were suggested (2), evaluated, and found to be ver; useful as exact mass internal standards for F AB mass spedrometry. The monosubstituted PEG's and PPG's change the physical properties and extend the mass range of their cor'esponding unsubstituted compounds.
EXPERIMENTAL SECTION Oct yIp 1enyl, nonylphenyl, and dinonylphenyl groups consti
tuted the iifferent monosubstituents of the PEG surfactants used in these s ;udies. These nonionic surfactants were obtained from the GAF :::orp. (Wayne, NJ) and are commercially referred to as the IGEF AL CA, CO, and DM Surfactant Series, respectively. Each menber of the IGEP AL Series is available over an oligomer range which is designated by the manufacturer by an average oligomer value~ n, where n is the number of repeating units. Likewise, a monosubstituted hexadecyl derivative of PPG was studied. This material is also available from the GAF Corp. and is referre:! to as EMULPHOGENE P-30. Table I lists all the surfactan t structures used in this study and their corresponding elemental compositions and masses which can be used for generating tE bles of the exact masses of these reference compounds.
The p:,armaceuticals used in this study, viz., LL-EI9085a, decapepQrl, N-acetyl calicheamicin 011, vancomycin, and avoparcin a, were obtained from Lederle Laboratories (Pearl River, NY). The resp"ctive structures are listed in Table II. The isotopically enriched 85RbCl sample (99.5% enriched) was purchased from Oak Ridge National Laboratory (Oak Ridge, TN).
The surfactant series, described above, were used either as mixtures or as isolated fractions for the exact mass measurements. The isolated surfactant fractions were collected from the effluent of a high-performance liquid chromatography (HPLC) separation. For thes, separations, a Zorbax-CN analytical column (5-l'm particles, 4.6 mm x 25 em), purchased from Du Pont, Wilmington, DE, was lsed. It operated at ambient temperature. The column was initi 'lly conditioned with THF followed by heptane, each at 2 mL/min for 30 min. Loop injections (20-50 I'L) of surfactant solutiom (1-5% in the initial HPLC solvent) were made on the column. The solvents used in the separations were (A) heptane and (B) l-propanol/2-methoxyethanol (1/1 (v/v). The linear gradient:; generally used were as follows: for Ii < 10, the initial A/B ratio was 100% /0% and the final ratio was 40% /60%; for fi ~ 10-::0, the initial ratio was 80% /20% and final ratio was 40%/60%; for Ii > 30, the initial AlB ratio was 65% /35% and the fmal ratio was 20 % /80 %. The analysis time was 40 min and the flow rates were either 2.0 or 2.5 mL/min. To reequilibrate the column, a 5-min linear gradient back to the initial conditions was used followed by pure heptane for 10 min, each at 2 mL/min. Resolvec. oligomers were individually collected from the HPLC effluent. Unresolved oligomers were collected at I-min intervals. Waters l.1odel510 HPLC pumps, a Waters Model 680 gradient program ner, and a Kratos Model 773 UV detector, set at 280 nm, were USEd in these studies.
© 1990 AmE rican Chemical Society

ANALYTICAL CHEMISTRY, VOL. 62, NO.4, FEBRUARY 15, 1990 • 323
Table I. Nonionic Surfactants Used for Exact Mas:; Measurements in Fast Atom Bombardment Mass Spectrometry
chemical structure commercial name exact mass of oligomer n (daltons)
HO(CH,CH'O)nH
HO(C3H60)nH
CH,C(CH,),CH,C(CH,), -0-O)CH,CH,o),H
pcly(ethylene glycol)
pcly(propylene glycol) et 10xylated octylphenol
44.026215n + 18.010565 + X·
58.041865n + 18.010565 + X· 44.026215n + 207.174891 + X'
(CAF IGEPAL CA Surfactant Series)
et 10xylated nonylphenol 44.026215n + 221.190541 + X· (C AF IGEPAL CO Surfactant Series)
et 10xylated dinonylphenol 44.026215n + 347.331391 + X· (C AF IGEPAL DM Surfactant Series)
propoxylated alcohol 58.041865n + 242.260966 + X' (C AF EMULPHOGENE P-30)
'X is an adduct ion: H+ = 1.007825, Na+ = 2.989770 K+ = 38.963708.
The FAB mass spectra were obtained on a VG ZAB-SE highperformance mass spectrometer equipped with a VG 11 250 data system. A cesium ion gun was used which operated at 3 j kV and 5 }lA. The matrices used were DTT /DTE and MNHA. The spectrometer was operated at 10000 resolution for the el.act mass measurements. For weak signals, the data system was operated in the multichannel analyzer (MCA) signal-averaging mode. All samples were prepared and run at ambient temperature.
RESULTS AND DISCUSSION (A) FAB Properties of Oligomer Mixtures of the
Monosubstituted Nonionic Surfactants. Uneer FAB ionization conditions, the IGEP AL surfactants producl intense spectra when adulterated with metal salts in DTT /DTE matrix. The relative sensitivities of the metal-adeuct surfactant molecular ions (for the most abundant metal isotopes) are listed in Table III. These values were obtained: 'rom the F AB mass spectra produced from equal concent" tions of surfactant adulterated with a series of binary mixtures of metal iodides of equal concentrations and computed relati'le to the potassium ion adduct. The surfactants are most sensitive as enriched rubidium-S5 adduct ions. However, if an iso;opically pure rubidium salt is not available, it is more pra~tical to adulterate the samples with KCl in the DTT /DTE natrix to produce [M + Kj+ ions, due to the complexity of the uaturally occurring rubidium isotopic distribution of the rubidium· adduct ions.
The IGEPAL surfactants when neat or when dis£olved in a FAB matrix do not produce [M + H]+ ions. Ev'on when adulterated with I}lL of neat trifluoroacetic acid (Tl"A), the [M + H]+ ions are of very low abundance. This is characteristic of many compounds having low proton affinities containing only the elements C, H, and ° (11). The IGEPAL surfactants when run at high concentrations contaminate the source reducing the overall instrument sensitivity. T,) restore instrument sensitivity, the source must be cleaned
EMULPHOGENE P-30 produces intense spectra with MNBA as the matrix when adulterated with KCl Hnd prepared as a 5% solution in H,O/CH30H 50/50 (v/"). EM· ULPHOGENE P-30 has a useful mass range of 12)9-1907 daltons for nonsample limited work.
Typical low· resolution spectra for dilute samples of oligomeric mixtures of surfactants (approximately 5.0% (v Iv) in H,O/CH30H 50/50 (v/v» are illustrated in Figure 1 for IGEPALS CA 720 and CA S87 and EMULPHOGEl'lE P·30. Note the high sensitivity of the compounds. The IGEPAL surfactant series with fi values up to 30 are useful 3.8 exact mass internal standards. (IGEPAL surfactants with ~ values
r ~~~"PHOGENE '1
," r
Figure 1" F AS mass spectra of oligomeric mixtures of monosubstituted nonionic surfactants (A) IGEPAL CA 720, n = 12.5 adulterated with KCI to produce [M + Kj+ ions in DTTfDTE matrix, (B) lGEPAL CA 887, n = 30 adu~erated with KCI to produce [M + K] + and ions in DTT fDTE matrix, and (C) EMULPHOGENE P·30, n = 30 adulterated with KCI to produce [M + K]+ ions in MNBA matrix (experimental resolution, 2000).
greater than 30 have very wide oligomer distributions and, therefore, the intensities in the FAB mass spectra of the individual oligomers are very weak.) The useful mass range of the different surfactant series are listed in Table IV. In nonsample limiting cases, exact masses of unknowns up to ~ 1400 daltons can be obtained by adulterating the unknown sample with a 1 % KCl solution and the appropriate quantity of the IGEPAL surfactant. In practice, the appropriate amount of surfactant is determined by trial and error by stepwise addition of very low concentrations of surfactant until a surfactant signal of comparable size to that of the sample is observed. The unknown is peak matched, either by manual meanS or by computer, with the two closest surfactant reference peaks, chosen so that one is above and the other below the mass of the unknown compound. In the manual peak

324 • ANALYTICAL CHEMISTRY, VOL. 62, NO.4, FEBRUARY 15, 1990
Table II. Structures of Pharmaceuticals Studied by Exact Mass High-Resolution FAB Mass Spectrometry
LL-E19085a {MW 669}
(pyro)Glu-Hls-Trp-Ser-Tyr-Trp_Leu_Arg.Pro_Gly_NH2
Decapeptyl (MW 1310)
N·Acelyl C811cheamici~ ill' (MW 1395)
VancomYCin (MW 1447)
Avoparcin a (MW 1907)
matching mode, when the peak matching unit and spectrometer are calibrated, only one reference peak is necessary for the exact mass measurement.
(B) FAB Properties of Isolated Oligomer Fractions of the Monosubstituted Nonionic Surfactants. For exact mass measurements in sample limited cases and for exact masses greater than -1300 daltons, it is best to use the isolated oligomer fractions of the IGEPAL surfactants as the exact mass internal standards. These fractions are collected from the HPLC detector exit port. Figure 2 illustrates typical HPLC chromatograms obtained under the conditions described in the Experimental Section. For surfactant mixtures
Table II L Relative Abundances of [M + Metal]+ Ions for the n = :!O Oligomer of the Nonionic Surfactant IGEPAL CA 887
[M + "Rb(enriched)j+' [M + "Rb]+' [M + 39K]+ [M + "Na]+ [M + 133CS]+d [M + !07Ag]+ [M + l'NH,j+ [M +7LW
m/z
1171 1171 1125 1109 1219 1193 1100 1093
abundance relative to
[M+39K]+b
1.71 1.20 1.00 0.67 0.60 0.13 0.11 0.10
0: All relative abundance measurements were made vs the [CA(n = 20) + "'K]+ ion except for the "Rb and 133CS adducts, as noted below. bThe abundances are only due to the indicated isotope. No correctioJ.s are made for the abundances of the other naturally occurring i!>otopes. cThe [CA(n = 20) + 85Rb]+ ion was measured vs the [CA(", = 20) + "Na]+ ion because it is isobaric with the second isotope peak of the [CA(n = 21) + 39K]+ ion. dThe [CA(n = 20) + 133CS]+ ien was measured vs the [CA(n = 20) + "Rb]+ ion because it is isobaric with the first isotope peak of the [CA(n = 23) + 39K]+ ion.
Table IV. Useful Surfactants Mass Ranges for Exact Mass FAB Mt~asurements
surfcctant useful mass (n' \Olue) range,b,c daltons best FAB matrix
PEG ,00-600 200-750 DTT /DTE or MNBA PPG 1750 1566-2262d MNBA PPG ,000 1624-2321d MNBA
CA 52') (5) 377-597 DTT/DTE CA 72) (12.5) 597-905 DTT/DTE CA 887 (30) 1037-1565 DTT/DTE CA 897 (40) ~ 1100 to ~2500' DTT/DTE
CO 85) (20) 699-1007 DTT/DTE CO 887 (30) -1000 to ~1700 DTT/DTE CO 897 (40) ~1100 to ~2500' DTT/DTE
DM4::0 (7)1 516-869 DTT/DTE DM 70 (15)1 605-1011 DTT/DTE DM no (24)1 737-1221 DTT/DTE
P-30 (30) 1209-1907 MNBA
a fi va ues obtained from manufacturer. bThe centers of the useful FAB mass ranges are less than the fi mass values by 100 to 300 dalt,ms. 'Only the PEG's produce abundant [M + H]+ ions. All the ether surfactants produce abundant [M + K]+ ions. dThe PPG's have a very abundant low mass ion series. eThis broad mass rar.ge produces very low abundance ions. Abundant ions are only produced from isolated fractions. 'The commercial DM series is actually a 50:50 mixture (from HPLC) of DM and CO components. 30wever, the DM components dominate the FAB mass spectra. To separate the DM from the CO components, use of Zorbax eN column with a solvent program of 60% /40% 70% /30 ¥, acetonitrile/H20 at 1 mL/min for 20 min.
with n ,alues less than or equal to 25, the individual surfactant compor ents can be resolved and isolated (see Figure 3A)_ Above Ii values of 25 the chromatographic resolution is poor and surfactant fractions were collected over I-min intervals. These fmctions tend to have two maior oligomeric componenta (compare parts Band C of Figure 3). Two reference peaks are nec"ssary for computerized peak matching. Therefore, sets of cuts obtained from surfactant mixtures with n values less than 25 have to be mixed while surfactant cuts obtained from surfactant mixtures with n values greater than 25 generally Cflll be directly used. Typically, the collected surfactants were bbwn down to dryness and used after being prepared as 1 % Bolutions with H,O/CHaOH 50/50 (v/v).

ANALYTICAL CHEMISTRY, VOL. 62, NO.4, FEBRUARY 15, 1990 • 325
Table V. FAB Ion Abundances of Drugs Adulterated with an Isolated Surfactant and a Surfactant Mixture When the Pure Drug Concentrations and the Reference Ion Abur dances of the Unadulterated Surfactants Are Held Constant
ion abundances, em [m I z]
mixture of surfactant and 1 Ilg of sampleu
surfactant alone drug surfactant drug surfactant ionb surfactant ionb drug iane
(I) CA720 cut 9 LL-E19085o 11.9 [729] 4.8 [729] 9.3 [710] (II) CA 720 mixture LL-E19085o 13.6 [729J 11.9 [729J 4.7 [710J
ratio Illl 0.88d 0.40 1.98'
(III) CA887 cut 15 decapeptyl 20.0 [1389J 9.2 [1389J 55.0 [1349J (IV) CA887 mixture decapeptyl 23.8 [1389J 25.0 [1389J 6.0 [1349]
ratio IIIIIV 0.84d 0.37 9.17'
'FAB matrix DTT/DTE adulterated with 0.3 iLL 010.2 M KC!. 'mlz 729 is [CA(n = 11) + KJ+ and mix 1389 is [CA(n = 26) + KJ+. 'For LL-EI9085c< mlz 710 is [M + H, + KJ+, for decap,ptyl mlz 1349 is [M + KJ+. dThis ratio would be exactly 1.00 if the ion abundances of the isolated surfactant and the surfactant mixture WE re equal. This precise mixture is experimentally difficult to achieve. e Enhancement of drug ion abundance in the isolated surfactant relati;e to the surfactant mixture.
Figure 2. HPLC chromatograms generated from differellt members of the IGEPAL CA surfactant series: (A) IGEPAL CA 720, ij = 12.5, (B) IGEPAL CA 887, ij = 30, and, (C) IGEPAL CA 897, ij = 40. Note the degradation in chromatographic resolution with increaSing 11 values. Retention times for the same n values in different surfa,:tants differ because different solvent systems were used. Solvents u"ed were (A) heptane and (B) 2-propanaoI/2-methoxyethanol (1/1 (v/vl). The flow rates were 2 mUmin with a linear solvent program of 30 rnin duration. The initial time and final time solvent mixtures were as ·:ollows: for CA 720, initial 85% A/15% B, final 60% A/40% B; for C~ 887, initial 80% A/20% B, final 40% A/60% B; for CA 897, initial 62% A/38% B, final 20% Al80% B.
An advantage in the use of the isolated surfactsnts is that the signal of the unknown can be optimized by minimizing the amount of surfactant necessary for the refere nce signal. Typically, sample sensitivity enhancements of fr,)m 2 to 10 times are observed when the isolated surfactants are used as internal standards because the surfactant components not used as reference masses in the surfactant mixturEs suppress the sample signal. These conclusions are based upon the sensitivity measurements, illustrated in Table V, fOl two drugs made with an isolated surfactant and with a surfactant mixture when the concentrations of the respective re ference oligomer and drug were kept constant. The two drul"S studied, LL-E19085a and decapeptyl, represent classes of compounds of extremely different structures and polarity typicdly studied by FAB mass spectrometry. The ion intensity or a specific oligomer in the surfactant mixture was maintained 1{) be about equal to that of the same oligomer in the isolated surfactant (see Table V, "ratio" entries in "surfactant alone" column). Upon the addition of the drugs to the surfactant, the relative intensity of the [M + Kj+ ion of the respective dru~: was 2 and 10 times more intense in the isolated surfactant versus the
100_ '9 . A) CA720 Cut 1/9
50 .
;~~r+MB-H)
'" 0-\.·5~00~~5-50~~'~0-0~'-5~0~'~0b...0"""~5~0~-80-0--85:C0"""'~90:C0-~95:::0~1000 100_
B) CAsal Cut~10
50
100 ClCA897.Cut#20 L o~' ~~?t'~.
2130 2140 2150 2160 2110 2180 2190 2200
Figure 3. FAB mass spectra of isolated Oligomeric fractions of monosubstituted nonionic surfactants (A) IGEPAL CA 720, cut 9 adulterated with KCI in DTT/DTE matrix, (B) IGEPAL CA 887, cut 10 adulterated with NaCI in DTT/DTE matrix, and, (C) IGEPAL CA 897, cut 20 adulterated with KCI in DTT IDTE matrix (experimental resolution, 2000).
surfactant mixture (see Table V, "ratio" entries in "drug ion" column). At the same time, the surfactant ion intensity was suppressed by about 30% in the isolated surfactant and unsuppressed in the surfactant mixture (see Table V, second vs first "surfactant ion" columns). These results are consistent with the surface ionization mechanism for FAB (12) in which the resulting spectra are representative of the surface solution and not the bulk sample. In both the isolated surfactant and the surfactant mixture experiments, the sample size was constant but the total surfactant concentration differed. Since the sample and the surfactant are competing for the surface, there is less competition for the surface with the isolated surfactant than with the surfactant mixture. Therefore, the sample can displace the isolated surfactant while the displacement of the surfactant mixture is negligible.
Additional benefits accrued by using the isolated surfactant are less background interference from other surfactant components and less likelihood of source contamination due to the low levels of surfactant needed as reference compounds.
(e) Peak Matching Results Using Isolated Oligomer Fractions of the Monosubstituted Nonionic Surfactants. Table VI summarizes computerized peak matching results obtained by utilizing isolated surfactant oligomers as exact

326 • ANALYTICAL CHEMISTRY, VOL. 62, NO.4, FEBRUARY 15, 1990
Table VI. Typical High Mass Computerized Peak Matching Results Obtain"d by Utilizing Isolated Surfactant Oligomer. as Internal Reference Mass Standards in FAB Mass SpectrometryG
exptl mass of relative "unknown" "unknown"
ref compound/ low mass ref high mass ref "'unknown", error error, elemental compound FAB matrix (oligomer) (oligomer) daltons lJ.,b mmu ppm (M + H orM + K) name
CA 887, cut 15/ 1345.7861 1389.8124 1349.5945 -0.1 "0.074 C"H82N180 13K decapeptyl DTT/DTE + (n = 25 + K) (n = 26 + K) (M+K) KCI
CA 887, cut 16/ 1433.8386 1434.8419 1434.2307 -2.2 ··1.5 C"H"IN,022S,K N-acetylcalicheamicin 011
DTT/DTE + (n = 27 + K) (n = 27[13C] + K) (M+K) KCl
CA 887, cuts 17 1477.8648 1521.8910 1486.3922 -1.7 .. 1.1 C66H75CI,N,O" vancomycin (n = 28) and 18 (n = 28 + K) (n = 29 + K) (M+K) (n = 29)/ DTT/DTE + KCl
Ca 897, cut 17/ 1902.1503 1918.1269 1908.6133 -6.1 ··3.2 C"H103ClN,O" avoparcin a DTT/DTE + (n = 38 + Na') (n = 38 + K') (M+H) TFA (1 ilL)
'Resolution, 10000. b IJ. = experimental mass - predicted mass. e The surfactar t cuts contain low levels of Na and K salts which are chelated to the surfactants. These salts principally originate from the Zorbax CN I' PLC column because surfactant-TFA mixtures do not produce significant Na or K adduct-molecular ions.
100 A)
9 •.
e.
70 ~~;5K 60_ i~~~
50_
40
100 Ci
'0 / 80 ~~;8K 70
14778648
'0
50
40
'0
10
_M+K.DECAPEPTYL 13495945
1360
M + K VANCOMYCIN
"r" 1370
CA+K,n=26 13898124
CA+K,n=29 15218910
100 B) N·ACTYL CALICHEAMIC N
90 Iill
80
70_
.0 50
40
'0 20
10
100
90
80
70
.0
50
40
,.
Ci
CA+Na,n=38 19021503
\
CA+K.n=27 14338386
M+H,AVOPARCINa
1908\13
CA+K n=27j2"Cj
1~~~ 14358453
2310
CA+K,n=38 1918.1269
Figure 4. FA8 computerized peak matching resuns for (A) decapeptyl, (8) N-acetylcalicheamicin 0,1, (C) vancomycin, and (D) avoparcin a. Note the ions of the reference compounds, isolated IGEPAL CA oligomers, on each sid .. of the sample ions (experimental resolution, 10 000).
mass internal standards in the F AB ionization mode. As described above, isolated surfactant fractions are useful in sample-limited situations, for low sensitivity compounds, when careful control of the quantity of internal standard is necessary to reduce the suppression of the sample signal and for most compounds in the mass range of 1300 to 2100 daltons.
The mass errors (,!l) listed in Table VI suggest a systematic error since all experimental masses are lower than that predicted. A possible explanation to account for this effect is that the [M + Kj+ sample ions are contaminated with low levels of the second isotope peak from the corresponding [M - H2 + Kj+ sample ions. This latter ion, if due to two carbon-13 isotopes, is 7.96 mdaltons less than the mass of the
[M + Kt ion. If this type of contribution to the mass error is greater i'or the sample peaks than the reference peaks and the intensity of the [M - H2 + Kj+ ions increases with increasing m ass, the mass errors should increase with increasing mass. Lik"wise, the first and second isotope peaks associated with the [M + Kj+ ion can also lose H2 and produce weak ions which ove,lap on the low mass side of the [M + Kj+ ion. A possible way to minimize this effect is to measure the peak centroids with the data close to the peak maximum rather than with the d lta from the peak half-height and above. We have measured more accurate peak centroids, with high signal-tonoise data, from the region of the peak top than with data from the peak half-height and above.

A 1al. Chern. 1990, 62,327-331 327
Typical computerized peak matching results obtained at 10000 resolution are illustrated in parts A-D of F- gure 4 for decapeptyl, N-acetylcalicheamicin 0,1, vancomycir, and avoparcin ", respectively. The isolated surfactant ILasses and the masses of the unknowns are clearly labeled. A limited amount of sample was available for the exact nass measurement for N-acetylcalicheamicin 011. By coinci:lence, the nominal masses for the [M + K]+ ions for the refErence and sample peaks were identical. Since in the high-resolution spectrum the peaks for the unknown fall between the peaks of the reference compound, all the peaks in the s ,mple can be peaked matched with reference peaks within 1 cO alton (See Figure 4B). N-Acetylcalicheamicin 011 was also marually peak matched with EMULPHOGENE P-30 as the refErence material using the [M + Kj+ ion at mjz 1384.0201, conesponding to the n = 19 oligomer, as the exact mass referenc" ion. The exact mass can be more accurately measured in the MCA computerized peak matching mode than in the m'.nual peak matching mode.
A unique feature appears in the computer ized peak matching results for avoparcin" (Figure 4D) when adulterated with 1 I'L of neat TFA. The surfactants produced 1M + Na]+ and [M + K]+ ions while the sample produced principally [M + H]+ ions. These results illustrate the relative sdectivities of the reference material and sample for adduct fomtation with residual alkali-metal salts and available protons. When the sample was adulterated with 1 I'L of a 1 % sodium chloride solution, [M + Na]+ ions were produced for the r = 38 and n = 39 isolated IGEPAL CA oligomers and the s,.mple produced [M + H]+ and [M + Na]+ ions of equal intensity.
CONCLUSIONS Monosubstituted PEG nonionic surfactant mi"tures and
isolated oligomeric components have been succes,,fully used as exact mass internal standards in the 700-2100 dllton mass range in FAB mass spectrometry. Abundant [M -I- K]+ ions are produced when the surfactant is adulterated "ith KCI in the DTT jDTE matrix. Similar results were obtained with
the monosubstituted PPG nonionic surfactant EMULPHOGENE P-30 with MNBA as the matrix. The advantages of the isolated surfactant oligomers versus surfactant mixtures as reference materials are the enhancement of the sample signal, reduction in chemical background, and drastic reduction in source contamination. These exact mass measurement techniques have been used in our laboratory for the last two years. By use of the HPLC methods described above, surfactant components above 2100 daltons could be isolated from higher mass oligomers to extend the upper mass limit beyond the 2100 daltons achieved in this work.
ACKNOWLEDGMENT The authors thank Joseph De Vasto for helpful suggestions
for obtaining the HPLC chromatograms and the GAF Corp. for a generous supply of surfactant samples.
LITERATURE CITED (1) Morgan, R. P.; Reed, M. L. Org. Mass Speclrom. 1982, 17,537. (2) Chang. T. T.; Tsou, H.-R.; Siegel. M. M. Anal. Chern. 1987, 59,
614-617. (3) Gilliam, J. M.; Landis, P. W.; Occolowitz, J. L. Anal. Chern. 1983, 55,
1531-1533. (4) Heller, D.; Hansen, G.; Yergey, J.; Cotter, R. J.; Fenselau, C. Annu.
Cont. Mass Spectrom. Applied Topics 1982, 560-561. (5) "Accurate Mass Measurement Using a Newly Developed Dual Target
Sample Introduction Probe for FAB-MS"; JEOL Application Note MS36; JEOL USA, Inc.: Peabody, MA, July, 1987; pp 16.
(6) Rinehart, K. L., Jr. In Mass Spectrometry in the Health and Lite Sciences; Eds., A. L. Burlingame, A. L., Castagnoli, N., Jr., pp. 119-148. Elsevier: Amsterdam, 1985;
(7) Gilliam, J. M.; Landis, P. W.; Occolowitz, J. L. Anal. Chern. 1984. 56, 2285-2288.
(8) Van Langenhove, A.; Costello, C. E.; Chen, H.-F.; Biller, J. E.; Biemann, K. Annu. Cant. Mass Spectrom. Allied Topics 1982. 558-559.
(9) DeStefano, A. J.; Keough, T. Anal. Chem. 1984, 56, 1846-1849. (10) Goad, L. J.; Prescott, C. M.; Rose, M. E. Org. Mass Spectrom. 1984.
19,101-104. (11) Siegel, M. M.; McGahren, W. J.; Tomer, K. B.; Chang, T. T. Biomed.
Environ. Mass Spectrom. 1987, 14, 29-38. (12) Ligon, W. V., Jr.; Oorn, S. B. Int. J. Mass Spectrom Ion Process
1986, 78, 99-113.
RECEIVED for review August 7, 1989. Accepted November 20, 1989.
Chromatographic Oligomer Separation of Poly(oxyethylenes) on K+ -Form Cation-Exchange Resin
Tetsuo Okada
Faculty of Liberal Arts, Shizuoka University, Shizuoka 422, Japan
Compounds having poly( oxyethylene) chains as a part of the structure were separated on a cation-exchange resin according to the number of oxyethylenes by utilizing a difference in the complexation wHh K+. The retention strongl) depended on properties of mobile phases, for example, diel,~ctric constant of the solvent, the concentration of water, tlte concentration of K+, etc. More than 30 oligomers were sllccessfully separated with the gradient elution from pure m ethanol to methanol containing K+ In addHion, the formation constants of K+ complexes in methanol were chromatographically determined. Logarithms of formation constants linearly increased with increasing number of oxyethylene tmits.
INTRODUCTION Various surface-active compounds contain poly(oxy
ethylene) (POEs) as a part of the structure, PO Es provide
0003-2700/90/036; -0327$02.5010
hydrophilicity for most nonionic surfactants (1), which are one of the most generally consumed detergents, while ionic groups play the same role in ionic surfactants, Some of anionic surfactants also contain POEs together with ionic groups, These materials are used in a number of industries, e.g., food, oil, and textile industries. Useful methods for the analysis of these compounds are, therefore, often required for the process or the product control and environmental monitoring,
These surfactants are usually used as mixtures of polydisperse POEs. Chromatographic methods are obviously a favorable choice of the analysis of such mixtures and the determination of the components, Supercritical fluid chromatography (SFC) is a useful mode for this purpose (2, 3). In spite of the high resolution, SFC is less common than liquid chromatography (HPLC) because of need of long analytical time and the special instrument. HPLC researches have focused on the separation concerning either the hydrophobic moieties or the oligomer distribution of POEs, Some re-
© 1990 American Chemical Society

328 • ANALYTICAL CHEMISTRY, VOL. 62, NO.4, FEBRUARY 15, 1990
searchers (4, 5) developed methods for the separation of nonionic surfactants based on the difference in alkyl hydrophobic groups, wherein reversed-phase stationary phases were employed. Kudoh (4) found the combination of the octadecyl-bonded silica stationary phase and acetone-water mobile phases to be effective. The developed method was selective only to differences in the alkyl group but was not influenced by differences in the oligomer distribution of POE.
It appears that separation in terms of the POE distribution has attracted more research and is of importance in many cases. The normal-phase separation (6-9) has been usually utilized for the analysis of the POE distribution except for the case where the precolumn derivatization was carried out (10,11). Ternary solvent systems, for example, composed of hexane, 2-propanol, and methanol or water, were employed in gradient elution schemes to separate POEs of wide distribution range (6-9). The successful normal-phase separation is attributed to the delicate cooperation of the hydrophilic partition and the hydrophobic absorption. The selection of mobile phases, therefore, is very complicated and difficult; it is usually based not on theories but on trial and error.
POEs adopt the 7/2 helix configuration and form the complexes with some Lewis acids such as metal cations similarly to cyclic ethers (1). This phenomenon is thought to be applicable to the separation of both metal ions and POEs. The purpose of the present work is to show the separation ofPOEs on a K+-form cation exchanger and to chromatographically determine the formation constants of K+ complexes of POEs in a solution. Additionally, qualitative consideration on the complexation is presented on the basis of the structure of the complexes and nature of solvents used in mobile phase.
EXPERIMENTAL SECTION The chromatographic system was composed of a Tosoh com
puter-controlled pump (Model CCPD), a column oven (Model CO-8000, Tosoh), a UV-visible detector (Model UV-8000, Tosoh), a JASCO refractive index detector (Model 830-RI), and a Rheodyne injection valve equipped with a 100-I'L sample loop. A separation column was a TSK-gel IC-Cation-SW (4.6 x 50 mm, packed with a silica-based cation-exchange resin with a particle size of 5 I'm, the ion-exchange capacity of which was 0.3 mequiv/g), which was developed for ion chromatography of cations by Tosoh. The column temperature was maintained at 25 cC. The flow rate was kept at 1 mL/min.
Mixtures of poly(ethylene glycols) (PEG) and poly(oxyethylated dodecyl alcohols) with six and eight repeating oxyethylenes (POE[6]D and POE[8]D) were purchased from Wako Chemicals. PEG[6] was purchased from Aldrich. Mixtures of POE and p-nonylphenols (POE(n)NP) were purchased from Tokyo Kasei. Mixtures of poly(oxyethylated dodecyl alcohols) (POE(n)D) were courteous gifts from Nikko Chemicals. The numbers in brackets represent numbers of oxyethylene units in monodisperse POEs, whereas those in parentheses refer to the average numbers of oxyethylenes in polydisperse POEs. All chemicals listed above were used as received.
Methanol of analytical reagent was distilled and stored with molecular sieves. Stored methanol was daily distilled again before the experiment. Water was deionized and distilled. K CI was dried at 110 cC under vacuum. Other solvents were also of analytical or HPLC grade.
RESULTS AND DISCUSSION Choice of a Counter Cation for the Oligomer Separa
tion of POE on a Cation-Exchange Resin. The complexation of POEs with metal cations has been investigated in many ways and utilized for some analytical methods, namely gravimetric or volumetric determination of non ionic surfactants containing POEs (1), solvent extraction of metal cations (12-14), ion-selective electrodes (1), etc. However, POEs have not been used for HPLC separation of metal ions, whereas cyclic oxyethylenes such as crown ethers have been applied extensively. This is due to the poor selectivity and low for-
POE(9)D
'-------.J 10min
PEG4QO
Figure 1. ('ligomer separation of POE(9)D and PEG 400. The numbers on the chrc matograms refer to the numbers of Dxyethylenes in molecules. 8nmple concentration was 5 mg/mL. Mobile phase was methanol. Other conditions are given in the text.
mation COlstants of POE-metal complexes resulting from the flexible st 'uctures of the POE chains in comparison with the rigid structure of crown ethers. POEs form complexes with a number of metal ions, only if the circumstances are suitable for the reLction. POEs are likely to select K+, Ba2+, or Hg2+ as a favor ,ble partner of the complex rather than Li+, Na+, Ca2+, or 0 ;her alkaline-earth or transition-metal cations (1). Kraus and Rogers (15) described the effects of salts on the retention of PEG on size-exclusion chromatography and found that K+ salts more effectively influenced the retention of PEG than the other metal salts tested. This experimental fact was explained by the structure change of PEG resulting from the complexation with K+. Studies conducted by Yanagida et al. (I4) and E urger-Guerrisi and Tondre (I6) also indicated that POEs sho'ved strong coordination ability toward K+ and that the compl"xation moderately varied according to the number of oxyeth~'lene units.
Thus, .l< + is possibly an appropriate counter cation for the present pllrpose. A K+-form cation exchange column was mainly us ,d to investigate the effect of mobile phases; the results were compared with those obtained with Ba2+-, Ca2+-, Na+-, Li+·, H+-, and Pb2+-form columns in the separation performar ceo Figure 1 shows examples of the oligomer separation of POE(9)D and PEG(9) on the K+-form cation-exchange re, in with methanol as a mobile phase. The elution was detec',ed with refractive index (RI). The retention increases wi;h an increase in oxyethylene units; the longer the POE chains, the higher the complexation ability (14). This shows tha t the separation is based on a difference in the complexation of POEs with K+ in the stationary phase.
K+ site, in the stationary phase were easily saturated by injecting 8 large amount of POEs. This overloading caused the reduction of the retention of POEs. The concentration of a sampl,' should be, therefore, kept as low as possible. The retention ''''as constant when the sample concentration was kept lower than 0.5 mg/mL. However, since this concentration was too 10" for RI detection, 5 mg/ mL samples were used for Figure 1.
Peaks were identified by mass spectrometric analysis of peak components and the comparison with the retention of POE[6]D, POE[8]D, or PEG[6]. As can be seen in Figure 1, compounds with six repeating oxyethylenes are separated as independent peaks. Also, compounds with five repeating oxyethylelles were slightly retained and separated from the void volume peak involving the elution of compounds containing les,; than four oxyethylene units. These results show that at leilst five or six oxyethylenes are required for the complexat on with K+ bound on a cation-exchange resin and that the cc mplexation ability of compounds containing four
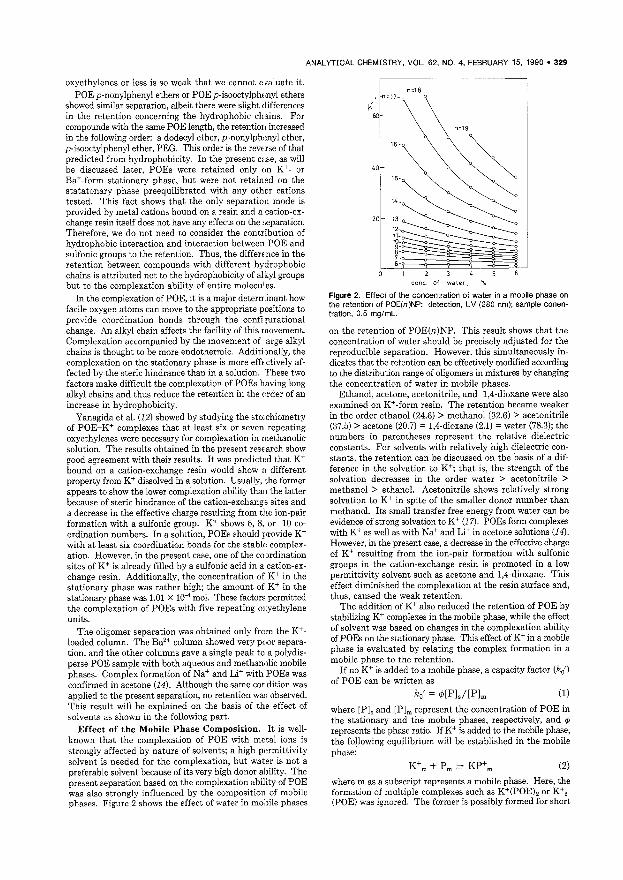
ANALYTICAL CHEMISTRY, VOL. 62, NO.4, FEBRUARY 15, 1990 • 329
oxyethylenes or less is so weak that we cannot e,aluate it. POE p-nonylphenyl ethers or POE p-isooctylphenyl ethers
showed similar separation, albeit there were slight differences in the retention concerning the hydrophobic chains. For compounds with the same POE length, the retention increased in the following order: a dodecyl ether, p-nonylphmyl ether, p-isooctylphenyl ether, PEG. This order is the reVErse of that predicted from hydrophobicity. In the present case, as will be discussed later, POEs were retained only on K+- or Ba+-form stationary phase, but were not retained on the statatonary phase preequilibrated with any other cations tested. This fact shows that the only separation mode is provided by metal cations bound on a resin and a cation-exchange resin itself does not have any effects on the Heparation. Therefore, we do not need to consider the contribution of hydrophobic interaction and interaction between POE and sulfonic groups to the retention. Thus, the difference in the retention between compounds with different hydrophobic chains is attributed not to the hydrophobicity of al kyl groups but to the complexation ability of entire molecu'es.
In the complexation of POE, it is a major deterrr.inant how facile oxygen atoms can move to the appropriate positions to provide coordination bonds through the confi ,urational change. An alkyl chain affects the facility of this movement. Complexation accompanied by the movement of arge alkyl chains is thought to be more endothermic. Additi )nally, the complexation on the stationary phase is more effEctively affected by the steric hindrance than in a solution. These two factors make difficult the complexation of POEs having long alkyl chains and thus reduce the retention in the order of an increase in hydrophobicity.
Yanagida et al. (12) showed by studying the stoichiometry of POE-K+ complexes that at least six or seven repeating oxyethylenes were necessary for complexation in rnethanolic solution. The results obtained in the present resEarch show good agreement with their results. It was predicted that K+ bound on a cation-exchange resin would show II different property from K+ dissolved in a solution. Usually, the former appears to show the lower complexation ability than the latter because of steric hindrance of the cation-exchang,J sites and a decrease in the effective charge resulting from the ion-pair formation with a sulfonic group. K+ shows 6, 8, or 10 coordination numbers. In a solution, POEs should provide K+ with at least six coordination bonds for the stabl" complexation. However, in the present case, one of the coordination sites of K+ is already filled by a sulfonic acid in a cation-exchange resin. Additionally, the concentration of K+ in the stationary phase was rather high; the amount of K+ in the stationary phase was 1.01 x 10⁻⁴ mol. These facto", permitted the complexation of POEs with five repeating m;yethylene units.
The oligomer separation was obtained only frcm the K+loaded column. The Ba2+ column showed very poor separation, and the other columns gave a single peak to a polydisperse POE sample with both aqueous and methan,)lic mobile phases. Complex formation of Na+ and Li+ with POEs was confirmed in acetone (14). Although the same cordition was applied to the present separation, no retention wa:; observed. This result will be explained on the basis of the effect of solvents as shown in the following part.
Effect of the Mobile Phase Composition. It is wellknown that the complexation of POE with metal ions is strongly affected by nature of solvents; a high p"rmittivity solvent is needed for the complexation, but water is not a preferable solvent because of its very high donor ability. The present separation based on the complexation ability of POE was also strongly influenced by the composition of mobile phases. Figure 2 shows the effect of water in mo:,ile phases
6-
of water, °fo
Figure 2. Effect of the concentration of water in a mobile phase on the retention of POE(n )NP; detection, UV (280 nm); sample conentration, 0.5 mg/mL.
on the retention of POE(n)NP. This result shows that the concentration of water should be precisely adjusted for the reproducible separation. However, this simultaneously indicates that the retention can be effectively modified according to the distribution range of oligomers in mixtures by changing the concentration of water in mobile phases.
Ethanol, acetone, acetonitrile, and l,4-dioxane were also examined on K+-form resin. The retention became weaker in the order ethanol (24.6) > methanol (32.6) > acetonitrile (37.5) > acetone (20.7) = l,4-dioxane (2.1) = water (78.3); the numbers in parentheses represent the relative dielectric constants. For solvents with relatively high dielectric constants, the retention can be discussed on the basis of a difference in the solvation to K+; that is, the strength of the solvation decreases in the order water > acetonitrile > methanol > ethanol. Acetonitrile shows relatively strong solvation to K+ in spite of the smaller donor number than methanol. Its small transfer free energy from water can be evidence of strong solvation to K+ (17). POEs form complexes with K+ as well as with Na+ and Li+ in acetone solutions (14). However, in the present case, a decrease in the effective charge of K+ resulting from the ion-pair formation with sulfonic groups in the cation-exchange resin is promoted in a low permittivity solvent such as acetone and l,4-dioxane. This effect diminished the complexation at the resin surface and, thus, caused the weak retention.
The addition of K+ also reduced the retention of POE by stabilizing K+ complexes in the mobile phase, while the effect of solvent was based on changes in the complexation ability of POEs on the stationary phase. This effect of K+ in a mobile phase is evaluated by relating the complex formation in a mobile phase to the retention.
If no K+ is added to a mobile phase, a capacity factor (ko') of POE can be written as
ko' = ¢[Pls/[Plm (1)
where [Pls and [Plm represent the concentration of POE in the stationary and the mobile phases, respectively, and ¢ represents the phase ratio. If K+ is added to the mobile phase, the following equilibrium will be established in the mobile phase:
(2)
where m as a subscript represents a mobile phase. Here, the formation of multiple complexes such as K+(POE), or K+ ,(POE) was ignored. The former is possibly formed for short

330 • ANALYTICAL CHEMISTRY, VOL. 62, NO.4, FEBRUARY 15, 1990
cone of KCl mM
Figure 3. Plots based on eq 4. n refers to the number of repeating oxyethylenes in POE(n )NP. Conditions are given in Figure 2.
Table I. List of Complex Formation Constants with KCI Obtained from the Plots Based on eq 4
no. of oxyethylenes log K,' ub r2
7 2.86 8 0.999 8 2.99 38 0.994 9 3.05 50 0.994
10 3.15 33 0.999 11 3.18 22 0.997 12 3.27 29 0.997 13 3.32 40 0.995 14 3.40 24 0.999 15 3.45 26 0.999 16 3.51 23 0.999 17 3.57 22 1.000
a Eight points were used to calculate Kf values. b Standard deviation of K,.
POEs but does not contribute to a decrease in the retention when [K+j»[Pjm is valid. The formation of the latter is also negligible for compounds with less than 17 oxyethylene units longer retained on the stationary phase because of the lack of effective coordination sites and electrostatic repulsion between potassium ions (18). In this case, the capacity ratio (k) of a POE can be given by eq 3.
(3)
If the concentration of K+ is much higher than that of POE in the mobile phase, the arrangement of eq 1 and 3 and the subs!itution of a equilibrium constant (K, = [Pjm(K+jml [KP jm) of reaction 2 give the useful equation
11k' = l/ka' (1 + K~d (4)
where CK+ is the concentration of K+ initially added in the mobile phase. This equation shows that the ratio of the slope to the intercept (equal to II ka) obtained from the linear plot of 1 I k' vs CK+ will be equal to the formation constant of a POE with K+. Figure 3 shows examples of the plot for POE[njNP (n = 7-17). As predicted from eq 4, the linear relations are experimentally obtained for all oligomers.
On the basis of Figure 3, formation constants were calculated for 11 POE[njNP (n = 7-17) and are summarized together with standard deviations in Table 1. Apparently, logarithms of K, values linearly increase with the number of oxyethylenes. The relation is represented by the following equation:
log K f = 0.0687n + 2.43 (r2 = 0.993) (5)
n =10
10
~
10 mm
n =7.5
Figure 4. Oligomer separation of POE(7.5)NP and POE(10)NP: detection, UV (280 nm); sample concentration, 0.5 mg/mL. Linear gradient condition was as follows: methanol (0-7 min) -- methanol containing 5 mM KCI (25 min). Other cond~ions are given in the text.
These resllts show that longer POE chains are thermodynamically advantageous in complexation in comparison with shorter P(IE chains.
Formahm constants ofbenzo-15-crown-5 (B-15-C-5) with K+ were ddermined and compared with literature values to examine the accuracy of the present method. It is known that B-15C-5 forms a sandwich-like 2:1 complex with K+, but such multiple C)mplexation is negligible for the present case as shown abo ,e. log Kr for B-15-C-5 determined by the present method w'" 2.93; literature values range from 2.8 to 3.0 (19). There is g,)od agreement between these values.
Formation constants have been determined for relatively short POEs by conductometry (15, 20) and nuclear magnetic resonance (13). Although monodisperse POEs are required for these nethods, it is difficult to obtain pure compounds of a variety of POE lengths. The present method is applicable to polydisperse POEs, and can be used to evaluate complexation of ea"h oligomer contained. This is an advantage of this developed method.
Practicll Separation of POE. By seeing Figure 1, we can predict th it a long analysis time is necessary to elute long POEs with a purely methanolic mobile phase. From a practical point of view, the effort should be made to reduce the analysis time without causing poor resolution. Isocratic elution with methanol-water or methanol containing K+ salts was effective for the separation of long POEs but resulted in poor resolution between short POEs. These results indicated that gradient elution was the best choice for the practical separatior of POE derivatives of a wide distribution range as far as the gradient scheme did not influence the detection.
Gradier t schemes from a purely methanolic mobile phase to methan ol-water or to methanol containing K+ were concluded to be suitable for the present separation mode. Changing solvents often causes a change in the surface condition of ';he stationary phase, which induces the long reconditioni 19 time for the following analysis. This is a general problem 0 • gradient chromatography. However, changing the K+ concen tration did not cause such a drawback. Therefore, pure mehanol was employed as a starting solvent, and methanol ~ontaining 5 mM KCI was chosen as a final mobile phase. F gures 4 and 5 shows the oligomer separation of POE(n)NP (n = 7.5-20). Gradient conditions are given in the figure captions. POE[6jNP-POE[30jNP were separated within 35 min. Although the change in the composition of mobile phase was small, the gradient scheme caused drift of the base line in RI detection. Compounds without any chromophores, such as PEG or POE(n)D, should be isocratically sepaated with a mobile phase; the composition of the mobile ph1se should be tailored for the oligomer distribution range of i 1terest.

n=20
2?
L----1 10min
Figure 5. Oligomer separation of POE(15)NP, POE(18)N', and POE(20)NP: detection, UV (280 nm); sample concentration, 0.5 mg/mL. Linear gradient condition was as follows: the same condition as for Figure 3 for POE(15)NP, methanol (1-10 min) ~ methanol containing 5 mM KCI (25 min) for POE(18)NP and POE(20)NP. OthE'r conditions are given in the text.
In conclusion, the present method was useful n~t only for the separation of the compounds with POEs but dso for the determination of the formation constants of K+ complexes. The detail studies on the formation constants 0' POE-K+ complexes in various media and indirect condllctometric detection of POEs separated on a cation-exchanger are now in progress in our laboratory and will appear in the Hear future.
ANALYTICAL CHEMISTRY, VOL. 62, NO.4, FEBRUARY 15, 1990 • 331
ACKNOWLEDGMENT I thank Tosoh Co. for generous gifts of separation columns.
I am grateful to K. Nozaki and M. Oyama for mass spectrometric measurements. I also acknowledge the courteous loan of an RI detector from my colleague D. Uemura.
LITERATURE CITED (1) Cross, J. Nonionic Surfactants; Surfactant SCience Series Vol. 19;
Marcel Dekker: New York, 1987. (2) Richter, R. E. HRC CC, J. High Reso/ut. Chromatogr. Chromatogr.
Commun. 1985, 8, 297-300. (3) Chester, T. L. J. Chromatogr. 1984,299,424-431. (4) Kudoh, M. J. Chromatogr. 1984, 291,327-330. (5) Otuki, A.; Shiraishi, H. Anal. Chem. 1979, 51, 2329-2332. (6) Turner, L. P.; McCullough, D.; Jackewitz, A. J. Am. Oil Chem. Soc.
1976, 53,691-694. (7) Aserin, A.; Garti, N.; Frenkel, M. J. Uq. Chromatogr. 1984, 7,
1545-1557. (8) Bear, G. R. J. Chromatogr. 1988, 459, 91-107. (9) Ernst, J. M. Anal. Chem. 1984, 56, 834-835,
(10) McClure, J. S. J. Am. Oil Chem. Soc. 1982, 59, 364-373. (11) Desbene, P. L.; Desmazieres, 8.; Basselier, J. J.; Desbene-Monvernay,
A. J. Chromatogr. 1989, 461, 305-313. (12) Yanagida, 8.; Takahashi, K.; Okahara, M. Bull. Chem. Soc. Jpn.
1977,50,1386-1390. (13) Yanagida, S.; Takahashi, K.; Okahara, M. Bull. Chem. Soc. Jpn.
1978,51,1294-1299. (14) Yanagida, S.; Takahashi. K.; Okahara, M. BUll. Chem. Soc. Jpn.
1978,51,3111-3120. (15) Kraus, S.; Rogers, L. B. J. Chromatogr. 1983, 257, 237-245. (16) Burger-Guerrisi, C.; Tondre, C. J. Co/Joid Interface Sci. 1987, 116,
100-108. (17) Popovych, 0; Tomkins, P. T. Nonqueous Solution Chemistry; Wiley-In
terscience: New York, 1981. (18) Okada, T., unpublished work. (19) Zollinger, D. Ph.; Bulten, E.; Christenhusz, A.; Bos, M.; van der Linden,
W. E. Anal. Chim. Acta 1987, 198.207-222. and references therein. (20) Ono, K.; Konami, H.; Murakami, K. J. Phys. Chem. 1979, 83.
2665-2669.
RECEIVED for review July 17, 1989. Accepted November 6, 1989. This work was partly supported by a Grant-in-Aid for Scientific Research (Grant No. 01740333) from the Ministry of Education Science and Culture, Japan.

332 Anal, Chem, 1990, 62, 332-3<8
Evaluation of the Effect of Organic Modifier and pH on Retention and Selectivity in Reversed-Phase Liquid Chromatographic Separation of Alkalo Ids on a Cyclodextrin Bonded Phase
Daniel W, Armstrong,' Gary L, Bertrand, Karen D, Ward, and Timuthy J, Ward
Department of Chemistry, University of Missouri-Rolla, Rolla, Missour, 65401
Henry V, Secor and Jeffrey 1. Seeman'
Philip Morris Research Center, p,O, Box 26583, Richmond, Virginia 23261
A mathematical model is developed using a basic equilibrium driven approach to explain the effect of mobile-phase composition on the relative retention of Ionizable solutes in a reversed-phase liquid chromatography (LC) separation, Three specHlc cases (i,e" different organic modifiers, different pHs, and different solute pK.s) and one general case are considered, Twelve structurally related tobacco alkaloids and metabolites are separated under various conditions described by the model, The test solutes include anabasine, anatabine, collnine, 2,3'-blpyrldyl, N'-methylanabasine, myosmine, nicotine, the two nicotine N'-oxldes, nicotyrine, norcotinine, and nornlcollne, The basic model appears to explain the effects of pH and organic modifier on the relative retention of these solutes, The same general model should be applicable to most groups of Ionizable solutes separated by reversed-phase LC,
"Optimizing the separation" is an important part of any methods development project involving liquid chromatography (LC), In doing this, one must choose the best stationary phase and mobile phase combination, There are several types of reversed-phase bonded stationary phases in liquid chromatography, including hydrocarbon-based materials (which include the well-known C's and Cs phases as well as diphenyl and related bonded phases), cyclodextrin-based materials, internal surface reversed-phase materials, and others (1,2), In classic reversed-phase LC, hydroorganic mobile phases are used, nonpolar solutes tend to be retained more than polar solutes, and retention of nonpolar solutes tends to decrease with increasing concentration of organic modifier in the mobile phase (provided solubility is not a problem),
Once a stationary phase is chosen, only the mobile-phase composition and temperature significantly affect the separation, Most researchers have focused attention on mobilephase optimization, and with good reason, since this is the easiest way to control retention and selectivity in LC (1,2), Obviously, the understanding and prediction of retention behavior in reversed-phase LC are of fundamental importance to chromatographers, Both empirical (3-6) and theoretical (7-9) approaches have been used to explain chromatographic retention.
The first goal of this work is to use a basic equilibrium driven approach to explain the relative retention behavior of ionizable solutes on a cyclodextrin bonded phase in three ideal situations, These include (I) the relative retention behavior of an ionizable solute when chromatographed with two different mobile phases in which the organic modifier is different
0003-2700/90/0362-0332$02,50/0
but the p fI of the aqueous component is identical, (2) the relative re ;ention behavior of different ionizable solutes in the same hydroorganic solvent at the same pH, and (3) the relative retention behavior of an ionizable solute in the same hydroorganic solvents at different pHs, A general theoretical treatment is given in the Appendix, The retention behavior expected from the theoretical treatment is compared to actual separatioll data for 12 naturally occurring tobacco alkaloids and meta Jolites (1-12, Chart 1),
Qualitative and quantitative analysis are important for programs involving alkaloid isolation and phytochemistry (10-13) !if well as for investigations involving metabolic, enzymatic, and chemical transformations (14-17), While an extensive literature is available on the quantitative determination Jf nicotine (7) (18-30), very few studies have been reported i 1 which more than two or three of the other related tobacco alkaloids have been analyzed simultaneously (26, 29), The secor d goal of this study was to develop an LC method for 1-12 using a i3-cyclodextrin (i3-CD) bonded phase, which seemed to have the greatest selectivity for these compounds,
EXPERIMENTAL SECTION
Metho" s. All separations were done at room temperature (21 °C) with Shimadzu LC-4A and 6A liquid chromatographs. The compounds were detected at 254 nm with a variable wavelength detector containing 13- and 8-ILL flow cells, respectively. All samples were dissolved in acetonitrile or methanol (depending on the mo Jile-phase composition) prior to injection. Typically, 5-10 ILL of solution (0.I-o.5% nicotinoid) was injected. Columns (25 X 0.46 cm) containing {3-cyclodextrin bonded to 5-lLm silica were obtained from Advanced Separation Technologies, Whippany, NJ, The void volume of the column was determined by injecting reat methanol. The peak-trough combination caused by the ch1.nge in refractive index was used as a marker, Flow rates, solv(mt compositions, and pHs are given in the respective tables and figures,
Materials, High-performance liquid chromatography (HPLC) grade met lanol, acetonitrile, triethylamine, and water were obtained from Fisher Scientific Co, Buffers were prepared by making a 1 % solut ion of triethylamine in water and adding glacial acetic acid until the desired pH was obtained, Nicotine (7), cotinine (3), and 2,3'-dipyridyl (4) are available commercially (Aldrich), (I'R,2'S)-Nicotine N'-oxide (8) was prepared by sodium tungstate (Alfa Prod lCts) /hydrogen peroxide oxidation of nicotine following literature Jrocedures (31) and isolated by chromatography on a 4-mm ChlOmatotron with sequential elution with chloroform followed by chloroform:ethanol:ammonium hydroxide (85/14/1) followed be' chloroform:methanol:ammonium hydroxide (50/20/1), (I'S,2'S)-Nicotine N'-oxide (9) was prepared by m-chloroperbenzoic acid oxidation of nicotine (32) and purified by column chromatog,aphy, The other seven tobacco alkaloids were prepared by literature procedures: 1 (33-37),2 (38,39),5 (37),6 (33, 34), 10 (40), 11 (41), and 12 (33, 42),
© 1990 American Chemical Society

A
1,,)0
L_ ____ L_ ____ L_ __ ~L_ ____ j
1,12
RETENTION TIME, MIN
'),11 8,9
1 4 10
:'0
L-____ L-____ L-____ L-___J
10 15 20
RETENTION TIME, ",IN
Figure 1. Separation of tobacco alkaloids and nicotine metabolites. A. Chromatographic conditions: 5 % methanol, 95 % aqueous triethylammonium acetate (1 %) pH = 5.5, flow rate = 1.0 mI.lmin, one 25-cm /3-cyclodextrin column. B. Chromatographic cond; ions were the same as in A except 5 % acetonitrile was used.
A
10 15
RETENTION TIME, MIN
11 1,2,12 8,9
10 15
RETENTION TIME, MIN
Figure 2. Separation of tobacco alkaloids and nicotine metabolites using a 5 % acetonitrile, 95 % trlethylammonium acetate mobile phase: flow rate = 1.0 mL/min; one 25-cm /3-CD column; (A) pH = 4.1 and (B) pH = 7.1.
RESULTS AND DISCUSSION The 12 naturally occurring tobacco alkaloids and metabo
lites (1-12) listed in Chart I cover a broad spet:trum of structural types: imine, lactam, secondary and tertiay amine, amine oxide, and pyrrole. All are 3-substituted pyridine derivatives with either a pyrrolidine ring (nicotine f.imily) or piperidine ring (anabasine family) substructure. The very close similarity of some of these compounds (e.g., 1,2, and 12; 5 and 7; 8 and 9), the similarity of the basicity of these compounds, and the similar molecular size throughout the entire set makes the analytical challenge significant. We will first disclose our recent investigation using HPLC with improved /3-cyclodextrin bonded phases to effect the ')ptimum separations. We will then provide a discussion of an equi-
ANALYTICAL CHEMISTRY, VOL. 62, NO.4, FEBRUARY 15, 1990 • 333
Table I. Retention Data for Tobacco Alkaloids and Nicotine Metabolites
k' with acetonitrile k'with MeOH
modifier at pH of modifier at compound 4.1" 5.5" 7.1" pH 5.5"
1 (SH-)-anabasine 0.20 0.36 0.80 0.36 2 (R,S)-anatabine 0.15 0.30 0.80 0.22 3 (SH-)-continine 0.78 1.21 1.15 1.43 4 2,3'-dipyridyl 1.87 2.59 2.46 3.97 5 (S)-(-)-N'-metbyl- 0.37 0.66 1.87 0.79
anabasine 6 myosmine 0.60 1.48 1.60 2.03 7 (SH-)-nicotine 0.28 0.55 1.53 0.65 8 (lR,2S)-anti-nicotine 0.71 0.98 0.64 1.08
N'-oxide 9 (lS,2S)-syn-nicotine 0.60 0.98 0.64 0.98
N'-oxide 10 nicotyrine 1.41 2.87 2.94 3.97 11 (R,S)-norcotinine 0.37 0.66 0.56 0.83 12 (R,S)-nornicotine 0.15 0.30 0.80 0.22
"The mobile-phase composition was (5/95 (v/v» acetonitrile:1 % triethylammonium acetate (aq). The flow rate was 1.0 mL/min.
3.0 o
o
:g;-.'" .-.= 2.0 c .8 <J)
" "' .0 IIi
" I 0 S :" 1.0 00
1.0 2.0 3.0 4.0
k' (pH = 5.5, methanol)
Figure 3. Relationship between k's with acetonitrile and methanol as modifiers at pH = 5.5 at the same flow rate, temperature, and column. See eq 1.
librium based model to explain relative retention behavior of ionizable solutes in reversed-phase HPLC.
Figures 1 and 2 show the separations obtained in this work by using either methanol or acetonitrile as the organic modifier with the aqueous phase buffered at pH = 4.1, 5.5 or 7.1. The data is summarized in Table I, where the k's can be directly compared, at different pHs, since differences in flow rate are normalized by using k's. At least one set of mobile-phase conditions could be found to separate all components except for anatabine (2) and nornicotine (12), the two secondary amines. As may be expected, significant changes in retention and selectivity could be obtained by altering the organic modifier and pH of the mobile phase_ These figures demonstrate the capability of this reversed-phase LC method for the analysis of related alkaloids.
A comparison of Figures 1 and 2 indicates little change in the selectivity of the compounds at pH = 5_5 buffer. This is

334 • ANALYTICAL CHEMISTRY, VOL. 62, NO.4, FEBRUARY 15, 1990
Chart I. Structures of Tobacco Alkaloids and Nicotine Metabolites
compound
(S)-H-anabasine
2 (R,S)-anatabine
3 (S)-(-)-cotinine
4 2,3'-dipyridyl
5 (S)-(-)-N'-methylanabasine
6 myosmine
7 (SH-)-nicotine
8 (lR,2S)-anti-nicotine N'-oxide
9 (lS,2S)-syn-nicotine N'-oxide
10 nicotyrine
11 (R,S)-norcotinine
12 (R,S)-nornicotine
structure
2 0
~ E 'c
N '" .: 1 0 .,f
" I .3
'" 1.0 20 3.0
k' (pH = 5.5, acetonitrile)
Figure 4. Relationship between k's at pH = 4.1 and 5.5 with acetonitrile as rnodifier in both cases at the same flow rate, temperature, and column. See eq 2.
2.J
o
~ :~ c: o 0 W ()
'" ".:: I.J
" " 0 I 0 o 3 C< 0
1.0 2.0 3.0
k' (pH = 7.1, acetonitrile) Figure 5. Relationship between k's at pH = 4.1 and 7.1 with acetonitrile as modifier in both cases at the same flow rate, temperature, and column. The correlation line A (eq 3) describes the behavior for the seven less basic nicotinoids (types II and III, open circles). The correlatioilline B (eq 4) describes the behavior for the five more basic nicotinoid, (type I, solid circles). The data was taken from Table I.
shown b:r an excellent correlation (Figure 3 and eq 1) between the h's "ith acetonitrile vs methanol as modifier (note that pH, flov' rate, temperature, and column remain the same).
k'(acetonitrile) = 0.187 + 0.647k'(methanol) (1)
pH = 5,5
r = 0.994, std dev of residuals = 0.099, n = 12, P < 0.0001
Figure 3
As th" pH increases, three types of behavior are observed: type I (fJr 1,2, 5, 7, and 12), where solute retention increases with pH: type II (for 8 and 9), where solute retention goes up from pI-: = 4.1 to pH = 5.5 and then decreases to less than the orig nal retention at pH = 7.1; and type III (for 3, 4, 6, 10, and [l), where solute retention goes up and more or less stabiliZES at pH > 5.5.
Examination of these three groups shows a structural clustering. All 12 substrates are 3-substituted pyridines. Type I compe unds are moderately strong organic bases, all secondary 'Jr tertiary amines. At pH = 5.5, nicotine is >99% monopMtonated (43). Type III compounds are all far less basic, tl.e second ring being part of a lactam, a pyrrole, an imine, or a pyridine. At pH = 5.5, these compounds exist primarily as their unprotonated free bases (44). The two compou1ds in type II are both N'-oxides of the methyl-

ANALYTICAL CHEMISTRY. VOL. 62. NO.4. FEBRUARY 15. 1990 • 335
Stationary Phase Surface
R
OM Figure 6. Basic model describing the equilibria involved in the HPLC retentions. Rand R± refer to the solute being chromatographed, the former the amine free base and the latter the protonated species. OM is the organic modifier.
pyrrolidine ring. These structural features anc basicity properties suggest that the protonated species does not complex strongly with the /l-CD support.
Figure 4 illustrates that there is a linear correlatioll between the h's observed for 1-12 in acetonitrile at pH = ·U vs pH = 5.5 (eq 2). However, completely different behavior is found
h'(pH = 4.1) = -0.0099 + 0.588h'(pH = E.5) (2)
acetonitrile r = 0.951, std dev of residuals = 0.172,
n = 12, P < 0.001
Figure 4
when the h's are compared at pH = 4.1 vs pH = 7.1. As shown in Figure 5, a spread of points is observed. If tl.e data is divided into two groups, one consisting of type I substrates and the second consisting of type II and type III substrates, two correlations are found, as indicated by eq 3 and 4 and the correlation lines A and B in Figure 5, respectively.
h'(pH = 4.1) = 0.225 + 0.477h'(pH = 7.l) (3)
type II and type III substrates, acetonitrile
r = 0.851, std dev of residuals = 0.307, n = 7, P < 0.015
Figure 5, line A
h'(pH = 4.1) = 0.022 + 0.180h'(pH = 7.1) (4)
type I substrates, acetonitrile
r = 0.971, std dev of residuals = 0.02€, n = 5, p < 0.005
Figure 5, line B
Expressions can be derived that explain the observed elution profiles (vide supra) and can be used to predict rdative retention behavior of other classes of acidic or basic solutes. The derivations are based on the simple model shown in Figure 6. There are a finite number of adsorption sites on the stationary phase on which the solute being chroma'.ographed (R or R±) and the mobile-phase components (i.e., the organic modifier (OM) and water) can bind. It is assumed that the organic modifier has a greater affinity for the binding site than water has, and that the solute (R) has the greateBt affinity for the adsorption site. If given sufficient time, th ere would be an equilibrium distribution of R,R± and OM between the mobile phase and the stationary-phase adsorption sites. It is further assumed that the equilibrium constants involving R and OM are independent of their concentration. Having made these assumptions, we point out that there can be secondary effects of concentration on both the thermodynamic equilibrium constants and activity coefficients. These could cause deviation from the ideal cases being outlined here and
will be considered subsequently. Given the basic model shown in Figure 6, two equilibrium
expressions can be written for the solute, R. The first will be referred to as the observed equilibrium expression (where (KR)ob, is the equilibrium constant). (KR)ob, actually is a distribution coefficient that takes into account all possible forms of R (i.e., ionized, un-ionized, associated, unassociated, etc).
(K) = nR(,) Rob, (n,O - nR(,»)[R]total
(5)
where nR(,) is the number of adsorption sites occupied by solute R, n,o is the total number of adsorption sites, and [Rl total is the total concentration of R regardless of its form.
A true equilibrium expression for each form of R can be written as well:
(6)
where nOM(,) is the number of stationary-phase adsorption sites occupied by the organic modifier and [R.ql is the concentration of R in bulk mobile-phase solution. The ratio of the observed to the true equilibrium constant (provided n,o » nR(,), which is the normal chromatographic condition) is
(KR)ob, n,o - nOM(,) [R.q]
n,O [R]total (7)
The equilibrium expression for the organic modifier (OM) is
nOM(,) KOM = ---="---
(n,O - nOM(,»)[OM] (8)
where [OMl is the concentration of organic modifier in the mobile phase. Rearranging eq 8 gives
nOM(,) KoM[OM] 1 - -- = 1 - _--=::"'---C-_
n,o 1 + KoM[OM] (9)
or
n,O - nOM(,) 1
n,o 1 + KoM[OM] (10)
Equation 10 can be substituted into eq 7 to give
(KR)ob, [R.q]
(KR)tm, [R]total(l + KoM[OM]) (ll)
If R is a weak base (i.e., R + H20 - RH+ + OH-), then
[OH-] [RW] (Kb)R = [R.q]
or
Equation 13 can be rearranged to
[R.q]
[Rl total
(12)
(13)
(14)
If R is a weak acid, the analogous expression is obtained:
(15)
In general, [Raqlj[Rtotall = f(pH,pKR).
Taking the case where R is a weak base and substituting eq 14 into eq 11 yields

336 • ANALYTICAL CHEMISTRY, VOL. 62, NO.4, FEBRUARY 15, 1990
For two different solutes (R"
R,), (Kb)Rd(Kb)R' and (K RI)'m,/ (K R2)'m, are fairly independent of small changes in pH and [OM] or the nature of the organic modifier. KOM is independent of pK, [R], and the nature of R.
Special Case No. 1. To evaluate the reversed-phase retention behavior of a solute, R, in two different mobile phases (i.e., in which the organic modifier is different) and with the pH of the buffer portion of the mobile phase identical, one must use eq 16. For the mobile phase containing the first organic modifier
(K )OMI - (KRI)'m, (17) Rlobs - (1 + (Kb)Rd[OR-JHl + KOM,[OM,J)
For the mobile phase containing the second modifier
(K lOM2 = (KRI)tru, (18l Rlobs (1 + (KblRd[OH-J)(l + K OM2 [OM2J)
Dividing eq 17 by eq 18 gives
(KRI)~h':11 1 + K OM2 [OM2J
(KRIl~~2 1 + KOM,[OM,J (19)
where both (KRI)tru' and (1 + «Kb)Rd[OH-J)) have cancelled. In liquid chromatography, the capacity factor is directly proportional to the equilbrium constant of a solute between stationary and mobile phases (i.e., k' cr K,q)' Therefore eq 19 also could be written as the ratio of the capacity factors. Thus, eq 19 can relate the relative retentions of a solute (R,) chromatographed with two different mobile phases. In order to compare the retention behavior (or k) of two or more different solutes chromatographed with two different mobile phases, the derivation that led to eq 19 must be repeated for the second solute, giving
(Kd~br-;r' 1 + K OM2 [OM2J (20)
Since the right sides of eq 19 and 20 are identical for any two different (but related) solutes, this quantity may be taken as a constant, ex, which is independent of solute.
(21)
According to eq 21, plots of k' or (KR.looo for different solutes in two different mobile phases (i.e., two different organic modifiers, all other conditions identical) should be a straight line with an intercept of zero. The slope of this line would vary with the type and concentrations of the organic modifiers. The intercept also can deviate from zero somewhat if other factors are operative, such as adsorption to residual silanol groups or deviations from the assumptions made for this derivation. An analogous plot of In (KR)~b';" vs In (KR)~b';" should produce a straight line of slope ~ 1 and an intercept of In ex. An example of the type of behavior predicted by eq 21 is shown in Figure 3 in which the capacity factors of several alkaloids separated with two different mobile phases (at pH = 5.5) are plotted.
Special Case No, 2. To evaluate the reversed-phase retention behavior of a compound in the same mobile phase (i.e., the saDie organic modifier) but with the aqueous portion of the solution buffered at two different pHs, eq 16 again can be used. In this case eq 16 must be written for each of the two pH situations where
(K lP/;P = (KRIl'm, (22l RI 0 s (1 + (KblRd[OH-]'Hl + KOM,[OM,J)
and
(K lP£F = (KRIl'me (23l RIo S (1 + (KblRl /[OR-hHl + KOM,[OM,J)
This ti ne when the ratio of eq 22 and 23 is taken, both (KRI)'m, Lnd (1 + KOM,[OM,J) cancel to give
(KRl)gr;;' 1 + (Kb)Rl/[OH-hl
(KRI)gr;;2 1 + (Kb)Rd[OH-]'1 [OH-], (Kb)RI + [OHh ------ (24) [OR-h (Kb)Rl + [OH],
Consider two limiting cases for eq 24. The first case is at a very high pH (relative to K b) where [OH-l, and [OH-h » (Kb)RI' Il this instance, eq 24 becomes
(KR,)gr;;' = 1 (25) (KRI)gr;;2
The seco ld case is for a relatively strong base chromatographed 'vith a mobile phase at lower pHs were (Kb)RI » [OR-l, and [OR-h. In this case one obtains
(KR,)gr;;' [OH-],
(KR1 )gr;;2 [OH-h (26)
In plots 0' the limiting cases for a hypothetical series of strong and weak bases, the weak bases would fall along a line with a slope of 1, while the relatively strong bases would tend to fall along a line parallel to the x axis if this axis represents the high pH. Solutes of intermediate pKbs would fall somewhere be ;ween these lines.
Indeed this type of behavior was observed for the alkaloids used in this study. Figure 5 is a plot of k'values for a series of the 12 alkaloids chromatographed at pH 4.1 and 7.1 (all other conditions were identical). Clearly two types of retention behavior ore observed. One group of alkaloids (type I: anabasine, anatabine, N'-methylanabasine, nornicotine, and nicotine) approaches the retention behavior described by eq 26 while the other group (types II and III) approaches the behavior described by eq 25. The segregation of these alkaloids into two groups is a result of their relative pKbS and the pH of th" mobile phase as described by eq 24.
CONCLUSIONS The trE atment derived in this work adequately explains the
reversed-phase retention behavior of these alkaloids on a !'i-CD column. In fact, an analogous treatment should be able to explain the retention behavior of most ionizable compounds on any re'rersed-phase packing, given standard reversed-phase separation conditions (e.g., hydroorganic mobile phases; simple buffers; avoidance of temperature, flow, pressure, or concentration e, tremes; and so on). A general treatment describing the reten ;ion behavior of ionizable solutes in reversed-phase separatio as is given in the Appendix. The important procedure of 0 )timizing a liquid chromatographic separation has been, at test, an empirical process. By providing a theoretical basis for chis, one may be able to obtain a better separation and a me re complete understanding of retention behavior.
APPENDIX Given ;he model in Figure 6, the following general equi
librium and associated constant can be written:
If
R(aq) + nH+(aq) """ R±(aq)
[R±] K ----
D - [R][W]" (27)

ANALYTICAL CHEMISTRY, VOL. 62, NO.4, FEBRUARY 15, 1990 • 337
n = + 1, R is a base
n = -1, R is an acid Kn = K.
The retention of R is determined by an effective equilibrium constant that does not distinguish between the varicus forms of R, R±, etc. Translation of retention volume to an equilibrium constant also assumes that all sites (n,O) on the column are available to the analyte:
InR(,) + nR±(,)1
n,O » nR(,) + nJ:,,\,) (28)
However, the actual equilibria depend on the amoun1s of each form and the possible occupancy of sites by thE organic modifier, OM:
K _ nOM(,)
OM -In,o - nR(,) - nR±(,) - nOM(,)I[OM]
nR±(s) K R+ = -------'-----
- In,o - nR(,) -nR±(,) - nOM(,)HR±]
Rearrangement of eq 29 gives
But
nsQ - nR(s) - nR±(s) - nOM(s)
ns 0 - nR(s) - nR!(s)
nR(,) KR[R]
nsQ - nR(s) - nR.:t.(s) 1 + KOM[OM]
nR±.(s) KR±[R]
nsQ - nR(s) - nates) 1 + KOM[OM]
IKR[R] + KdR±]1
(KR)ob, = 11 + KOM[OM]II[R] + [R±]I
[W] [R] = Ko[w]n
IKR + KR±Ko[H+]nl
(29)
(30)
(31)
(32)
(33)
(34)
(35)
(36)
Changing the organic modifier, [OM,] or [OM,], at low concentrations is not expected to have a great effect on K R, K R±, and Ko and in general will have similar effects on at analytes (Rl, R2, ... ) of a particular type. Therefore, two different cosolvents at the same pH will give
(KRl)~b~l 1 + K OM2 [OM2]
1 + K OM1 [OMl]
For a different analyte, R2
(Kazl~b~J
(KR2)~6t2
1 + K OM2 [OM2] (KR1)~6t
1 + K OMJ [OMl] (KRl)~b~'
(37)
(38)
A plot of KR values in solutions of OMI vs those in solutions of OM2 will be linear with a slope of 1.
The effect of pH is more complex and depends on .. he values of Ko, the ratio KR±/ K R , and the pH range covered. For a given analyte at two pHs, pHI = [H+l] and pH2 = [H+2j
(KR)g/;iJ
(KR)g/;i2
11 + K o(KR±/KR)[Wl]nlll + Ko[W2]nl
11 + K o(KR±/KR)[W2]nlll + Ko[Wl]nl (39)
Special Cases. I. If (KR±/KR) = 1, pH will have no effect.
(KR)g/;il --=1 (KR)g/;i2
(40)
Special Cases. II. A. If (KR+/ K R) « 1
(KR)g/;iJ 1 + KolW2]n (41)
(KR)g/;i2 1 + Ko[Wl]n
For a basic analyte, if pHI < pH2, Ko[H+lj » Ko[H+2j
strong base (KR)g/;il « (KR)g/;i2
Special Cases. II. B. If base is very weak, or pHs are close together
(KR)g/;il --~1
(KR)g/;i2 (42)
Registry No.1, 494-52-0; 2, 2743-90-0; 3, 486-56-6; 4, 581-50-0; 5,24380-92-5; 6, 532-12-7; 7, 54-11-5; 8, 51020-67-8; 9, 51095-86-4; 10,487-19-4; 11, 17708-87-1; 12,5746-86-1; methanol, 67-56-1; acetonitrile, 75-05-8.
LITERATURE CITED (1) Hamilton, R. J.; Sewell, P. A. Introduction to High Performance Liquid
Chromatography; Halsted Press: New York, 1978; pp 78-84. (2) Armstrong, D. W.; Li, W. Chromatography 1987,2,43. (3) Trappe, W. Biochem. Z. 1940, 305, 50. (4) Strain, A. H. Chromatographic Adsorption Analysis; Interscience:
New York, 1942. (5) Jacques, J.; Mathieu, J. P. Bull. Soc. Chim. France 1946, 9, 4. (6) Snyder, L. R. Principles of Adsorption Chromatography; Marcel Dek-
ker: New York, 1988. (7) Carr, P. W. J. Chromatogr. 1980, 194, 105. (8) Martire, o. E.; Boehm, R. E. J. Phys. Chem. 1983, 87, 1045. (9) Karger, B. L.; Le Page, J. N.; Tanaka, N. In High Performance Liquid
Chromatography; Horvath, C., Ed.; Academic Press: New York, 1980; Vol. 1, P 113.
(10) Schmeltz, I.; Hoffmann, D. Chern. Rev. 1977, 77,295. (11) Enzell, C. R.; Wahlberg, I.; Aasen, A. J. Fortschr. Chern. Org. Na
turst. 1977. 34,1. (12) Production of Quality Tobacco Leaf. Recent Advances in Tobacco
Science, 37th Tobacco Chemists' Research Conference, October 11-13,1983.
(13) Enzell, C. R.; Wahlberg, I. In Leaf Composition in Relation to Smoking Quality and Aroma; Recent Advances in Tobacco Science, 34th Tobacco Chemists' Research Conference, October 27-29, 1980.
(14) Seeman, J. I. Heterocycles 1984, 22, 16S. (lS) Strunz, G. M.; Findlay, J. A. The Alkaloids; Brossi, A., Ed.; Academic:
New York, 1985; Vol. 26. Chapter 3, p 89. (16) Seeman, J. L Pure Appl. Chem. 1987, 59, 1661. (17) Kisaki, T.; Maeda, S.; Koiwai, A.; Mikami, Y.; Sasaki, T.; Matsushita, H.
Beitr. Tabakforsch. Int. 1978, 9, 308. (18) Sarz, W.; Kettner, M.; Husemann, W. Planta. Med., J. Med. Plant Res.
1978, 34, 73. (19) Beckett, A. H.; Triggs, E. J. Nature (London) 1966, 21t, 1415. (20) Berry, D. J.; Grove, J. J. Chromatogr. 1971, 61, 111. (21) Bluthgen, V. A.; Nijhuis, H.; Hamann, J.; Heeschen, W. Milchwissens-
chait 1978,33, 137. (22) Burns, D. T.; Collin, E. J. J. Chromatogr. 1977, 133, 378. (23) Bush, L. P. J. Chromatogr. 1972, 73, 243. (24) Clarke, E. G. C.; Hawkins, A. E. J. Forensic Sci. Soc. 1961,1,120. (25) Watson, L D. J. Chromatogr. 1977, 143,203. (26) Piade, J. J.; Hoffmann, D. J. Liq. Chromatogr. 1980, 3, lS05. (27) Saunders, J. A.; Blume. D. E. J. Chromatogr. 1981, 205,147. (28) Sudan, B. J. L.; Brouillard, C.; Strehler, C.; Strub, H.; Sterboul, J.;
Sainte-Laudy, J. J. Chromatogr. 1984, 288, 415. (29) Kyerematen. G. A.; Taylor, L. H.; de Bethizy, J. D.; Vesell, E. S. J.
Chromatogr. 1987, 419, 191. (30) Mousa, S.; Van Loon, G. R.; Houdi, A. A.; Crooks, P. A. J. Chroma-
togr. 1985, 347, 40S and other papers in this series. (31) Phillipson, J. D.; Handa, S. S. Phytochemistry 1975, 14,2683. (32) Craig, J. C.; Purushothaman, K. K. J. Org. Chem. 1970,35, 1721. (33) Hu, M. W.; Bondineil, W. E.; Hoffmann, D. J. Labelled Compd. 1974.
10,79. (34) Seeman, J. L Synthesis 1977, 498. (3S) Alberici, G. F.; Adam, G.; Plat, M. M. Tetrahedron Lett. 1983, 1937. (36) Mundy, B. P.; Larsen, B. R. Syn. Commun. 1972, 2,197. (37) Buchel, K. H.; Korte, F. Chern. Ber. 1962, 95, 2438. (38) Ohno. K.; Ishikawa. H.; Kinjo, N.; Machida, M. Heterocycles 1986,25,
276.

338 Anal. Chern. 1990, 62, 338-:146
(39) Quan, P. M.; Karns. T. K. S.; Quin, L. D. J. Org. Chem. 1965, 30, 2769.
(40) Frank, R. L.; Holley, R. W.; Wikholm, D. M. J. Am. Chern. Soc. 1942, 64,2835.
(41) Glenn, D. F.; Edwards, W. B., III. J. Org. Chern. 1978, 43, 2860. (42) Seeman, J. I.; Secor, H. V.; Chavdarian, C. G.; Sanders, E. S.; Bass
field, R. L.; Whidby, J. F. J. Org. Chern. 1981, 46, 3040. (43) Seeman, J. L; Secor, H. V.; Armstrong, D. W.; Timmons, K. D.; Ward,
T. J. Anal. Chern. 1988, 60, 2120.
(44) Yarramoto, I.; Soeda, Y.; Kamimura, H.; Yamamoto, R. Agric. BioI. Che,n. 1968, 32, 1341.
RECEIVE]) for review May 16, 1989. Accepted October 18, 1989. Support of a portion of this work by the Smokeless Tobacco Research Council, Inc" to D,W,A, (Grant No. 0154-01) is gratefully acknowledged.
Development of a Method for the Sampling and Analysis of Sulfur Dioxide and Nitrogen Dioxide from Ambient Air
Joseph E. Sickles, 11,* Peter M. Grohse, Laura L. Hodson, Cynthia A. Salmons, Kelly W. Cox, Ann R. Turner, and Eva D. Estes
Research Triangle Institute, Research Triangle Park, North Carolina i'7709
A method has been developed to permit the simultaneous sampling of SO. and NO. from ambient air. 5uHur dioxide and NO. are collected on triethanolamine-impregnated glass fiber filters. Aller sampling, the filters are extracted, and the extract is analyzed for sulfate, nitrite, and nitrate using ion chromatography. Ambient concentrations are computed from the recovered nHrogen and suHur and the sampled air volume. Laboratory tests were conducted to evaluate the perfonnance of the method under various species concentrations and loadings, sampling rates, humidities, temperatures, flushing conditions, and interferences. Results of these tests are described. Field measurements using the developed method compared favorably wHh other established methods. On the basis of the precision of field blanks, SO. and NO. detection limits of 0.3 and 0.2 ppb for 24-h samples and 0.04 and 0.03 ppb for 7-day samples were estimated. Precision estimates of beller than ±15% were found, and accuracy within ±10% was observed.
INTRODUCTION Assessment of ecosystem acidification resulting from air
pollution requires monitoring the airborne concentrations of the contributing acidifying and neutralizing gaseous and particulate species. The offending constituents include the trace gases S02, N02, HN03, HN02, and NH3 and particulate SO,'-, N03-, NH,+, and H+. A modular, multiconstituent, integrating sampler known as the transition flow reactor (TFR) has been designed and tested for selected pollutants (1). Although the initial TFR did not sample for S02 and N02, its modular design provided for the addition of a module with that capability. As a result, the object of the current effort was to develop a method for the sampling and analysis of S02 and N02 from ambient air that could be incorporated in a modular form into a multiconstituent sampler such as the TFR.
Goals for the method were simultaneous determination of S02 and NO, at their nominal ambient (ppb) levels with ±20% accuracy, sampling durations ranging from one to several days, and use of ion chromatography (IC) as the analytical finish. Compatability with Ie was desirable to streamline laboratory operations for large numbers of samples (e.g., monitoring network applications), since IC was the method of choice for
0003-2700/90/0362-0338$02.50/0
most of the other constituents. The nominal 0.1 !,g mVI detectio:llimit of the IC imposes a nominal 1 ppb detection limit for a 24-h integrated sample assuming a sampling rate of 1 L rrin-l and a 20-mL extract volume. This means that acceptable flow rates must be 1 L min-lor greater.
In an effort to identify existing methods that were either suitable )r adaptable for our purposes, an extensive literature review" as performed (2). Among the several types of samplers av,ilable, bubblers and impingers were judged to be unsuitable in view of their limited sampling times (due to evapora1 ion of the collection solution) and their potential for handlin!:, shipping, and freezing problems. These considerations narrowed the focus of our development efforts to sorbents and filters. Sulfur dioxide is relatively easy to collect and has been sampled successfully at stack concentrations using uncoated molecular sieves (MS) (3) and at ambient concentlations using various impregnated filters (4-10). The reportee aqueous impregnating solutions usually contained the hydroxide, bicarbonate, or carbonate salts of sodium or potassium, along with glycerin or triethanolamine (TEA) as an hum"ctant.
Uncoated silica gel (11, 12), MS (12), activated alumina (12-14), MnO, (13-15), and charcoal (13) have been used to collect :t- 0, from air streams, but they were found to generate NO, especially under humid conditions (12, 13). Sorbents such as firebrick (12) and MS (16-18) coated with aqueous solutions of TEA have been used successfully to sample for N02. Filters impregmted with TEA (19) or p-anisidine (20) have also been used to lample for NO,.
Only ,me method has been reported for the simultaneous samplin, of S02 and N02 (21). This method uses 13X MS that ha\ e been coated with a solution containing primarily TEA (111,21). The method uses an IC finish, has been reported to be applicable at S02 and N02 concentrations between 1 md 10 ppm, and was demonstrated at sampling rates of 30--200 mL min-l and sample durations of 5-120 min (21). These conditions are in contrast to the desired working concentraticn (i.e., ppb), sampling rate (i.e., 1 L min-I), and sample duratioIL (i.e., 24 h) described earlier.
The C1IITent study was conducted in several phases, and this report i, organized similarly. In the first phase, findings of other workers (2) as discussed above were used to guide our selectiolt and subsequent preliminary laboratory testing of sorbent~, filters, and coating/impregnating solutions. These tests we 'e performed to identify a method suitable for more
© 1990 American Chemical Society

comprehensive laboratory tests and led to the selection of a TEA-based solution for analyte collection. Preliminay testing of uncoated and coated sorbents and impregnated filters led to the selection of TEA-impregnated filters for com>rehensive laboratory tests.
In the second phase, comprehensive laboratory tests were performed. These tests led to method refinemert, the establishment of the bounds of applicability (i.e., sp'lcies concentrations and loadings, sampling rates, capacities, humidity, temperature, and interferences), and definition ofthl method. The final phase of method development involved field tests where the method was deployed in a 13-day study, remIts were compared with accepted methods, and method precision and accuracy were established.
EXPERIMENTAL SECTION General Procedures. Challenge atmospheres contcining NO,
and/ or SO, were prepared by using either permeatio 1 tubes or certified cylinders of compressed gas followed by dilution with clean air of controlled humidity. Ambient air was c( mpressed and cleaned with catalytic chemical and sorption sClUbbers to remove organics, ozone, nitrogen oxides, and sulfur oxides, but not CO" prior to introduction to the dilution systen,.
A TECO Model 14 B/E chemiluminescence (CLM) NO, analyzer and a Monitor Labs Model 8450 flame photometric SO, monitor were used to analyze the challenge atmospherE upstream and downstream of each sampler. An EG&G Model88il was used to monitor the dew point (i.e., relative humidity (R-I)) of the challenge atmosphere.
Tests were performed in the laboratory at temperatures of 25-27 cC or in a temperature-controlled 15-m' Sherer Environmental Test Chamber. The chamber can operate frem 0 to 45 cC and maintain a constant temperature to within ",0.5 cC.
Samplers were tested by using challenge atmospheres to evaluate collection efficiency (CE) and/ or recovery effici lUCy (RE). CEs were determined by comparing the sampler inlet md outlet airborne concentrations of the challenge atmosphere as determined by the NO, and SO, monitors. REs were determine:l by comparing the amount of analyte recovered by extraction and IC analysis of the sample extract with the amount expected based on the gravimetrically or instrumentally determined airborne input.
The TEA solution used in the experiments perforned in the current study was prepared by dissolving 25 g of TEA and 4 g of ethylene glycol in 25 mL of acetone and diluting 10 100 mL with Dr water (18,21).
Samples were normally extracted in 20 mL of DI '.ater, but sometimes IC eluent was used. When SO, was pres,nt in the challenge atmosphere, 2 drops of 30% H,O, were added to the extract to ensure oxidation of any SO/- to SO/- and ;0 prevent interference of the SO/- with the NO,- IC peaks. Thl addition of H20, was found to have no effect on the N02- p"ak at the neutral to basic conditions of the extract.
All NO,-, NO,-, and SO/- analyses were performed 01 a Dionex Model 14 ion chromatograph. Analytical conditiors were as follows: 3 X 150 mm anion precolumn; 3 X 500 mm anion separator column; anion fiber suppressor column; 0.00<. M NaHCO,/0.0024 M Na,CO, eluent composition; 138 mL h-1 flow rate; and O.l-mL sample size. Standards covering the con'lentration range of the samples were run daily to prepare linear le2St-squares calibrations of concentration versus peak height. The nominal detection limit was 0.1 "g mL-I.
Preliminary Experiments. Screening of Solutions for Collecting NO,. Several candidates for sorbent coatin,s or filter impregnation solutions were identified in a literature review (2) as having potential for collecting NO,. These solutiolls include: Dr water; tri-n-butyl phosphate/water (90/10%); 5 M NaOH; K2CO,jluminol (5.0/0.1 %); TEA solution (as descriJed previously); 0.2 M NaZS03' 0.2 M NaOH; 0.4 M NazS03; 0.2 M NazS03' 0.2 M NaOH, 2% dimethyl sulfone; and 0.2 M NaE03, 0.2 M NaOH,6 X 10-4% Triton X-100. After preparation, the,e solutions were tested in impingers by bubbling gas streams contdning NO, at 0.4, 4.0, 200, and 2300 ppm at 1.2 L min-I througt 20 mL of each solution for approximately 2 h and measuring 1 he CEs at nominal 15-min intervals.
ANALYTICAL CHEMISTRY, VOL. 62, NO.4, FEBRUARY 15, 1990 • 339
Screening of Uncoated and Coated Sorbents and Impregnated Filters. Both commercially prepared (SKC, Inc.; Eighty-Four, PAl and laboratory-prepared sorbent tubes were tested. The uncoated sorbents in commercially prepared tubes (nominal dimensions 6 X 70 mm) that were tested include the following: Chromosorb 101 (0.105 g), 102 (0.099 g), 105 (0.112 g), 107 (0.112 g), and 108 (0.112 g); XAD 2 (0.13 g) and 7 (0.12 g); alumina (0.15 g); and 5A MS (0.217 g).
Laboratory-prepared tubes were loaded with a nominal 0.25 g of coated sorbent using 5O-mm lengths of 6-mm-o.d. glass tubing with glass wool inserted at both ends to secure the sorbent. Several sorbents were coated with TEA solution following the method of Vinjamoori and Ling (21), tubes were loaded, and they were subsequently tested. These sorbents include 5A MS (SKC, Inc.), prewashed silica gel (Supelco, Inc., Bellefonte, PAl, 45/60 mesh and 20/40 mesh 13X MS (SKC, Inc.), 20/40 mesh alumina (SKC, Inc.), and Soxhlet extracted (24-h in DI water) 20/40 mesh coconut-based charcoal (SKC, Inc.).
Filters used in the study were 47 mm in diameter. They were tested with Mace TFE Teflon filter holders providing an exposed filter diameter of 43 mm. Each filter was held in a separate holder when tests employing multiple filters were performed. Tested filters include Schleicher and Schuell fast flow no. 2 (cellulose) (S&S FF), Pallflex TX40 H 120 (Teflon-coated glass fiber), and Whatman 41 (cellulose), QM-A (quartz fiber), and GF /B, GF /C, and GF /F (glass fiber). In most cases, the TEA solution described previously was used to impregnate filters for testing, but in a few cases, filters were impregnated with aqueous solutions containing K,CO, (25% in 10% glycerin-water), alkaline KMnO, (4% in 2% NaOH), NaAsO, (1% in 1 M NaOH), PbO, (25% in 10% glycerin-water), guaiacol (10% in 1 M NaOH), and TEA plus 2-naphthyl-3,6-disulfonate (1 %).
Filters were prepared in batches of five by rinsing 4 times with DI water and a Buchner funnel. After drying under vacuum at 50-60 cC for 1 h, the filters were transferred to a beaker and covered with an aliquot of the appropriate impregnating solution. After a 5-min soak, they were transferred to the Buchner funnel where excess solution was removed by applying suction for 30-45 s. Filters were dried in a vacuum oven for 1 h at 5()-f)0 cC, placed in a sealed, clean, polyethylene bag, and stored prior to use, in a desiccator containing silica gel and activated charcoal.
A second round of screening tests was conducted on selected sampling elements to measure pressure drop versus flow rate, CE versus flow rate at several temperatures, humidities, and analyte concentrations, and stability of collected N02 and S02 in loading and flushing tests. To determine pressure drop for tubes containing TEA-coated charcoal and TEA-impregnated filters, experiments were performed with a Heiss pressure gauge (+2500 to -760 mm, ±1 mmHg), Tylan mass flow controllers, and an air supply/mover at dry «2% RH) air flow rates between 0.5 and 10 L min-I. In a similar series of experiments, CEs for various TEA-coated sampling devices were determined at 5, 25, and 40 ce, under both dry and humid (75% RH) conditions at each temperature over the same range of flow rates. Nominal N02 and SO, concentrations were 170 and 130 ppb. Subsequent tests were also performed at flow rates between 0.5 and 6 L min-I using air containing 40 and 340 ppb N02 with coated charcoal tubes sampling a dry atmosphere at 5 cC, with impregnated GF /B filters sampling dry atmospheres at 5, 25, and 40 cC, and with impregnated GF /B fIlters sampling a humid, 25 cC atmosphere. The filter experiments were conducted with two TEA-impregnated filters in series. The charcoal tube experiments, however, employed only one TEA-coated tube in line.
A series of loading and flushing experiments was conducted to investigate the stability of collected NOz on TEA-coated charcoal and GF /B filters by providing exaggerated simulations of highly variable atmospheric conditions. In these experiments, four collectors were used simultaneously to sample a common atmosphere containing 50-100 ppb NO, for 16-18 h at 1 L min-I. Subsequently, one sampler was flushed for 20 h with clean air at 40 cC, one at 27 cC, one at 5 cC, and one was not flushed. The samples were then analyzed to determine the stability of the collected NO, and SO,. NO, and SO, analyzers were used to monitor the atmosphere exhausted from the two types of samplers during both sampling and flushing. Three sets of experiments were performed with each sampler type: sampling from a humid

340 • ANALYTICAL CHEMISTRY, VOl. 62, NO.4, FEBRUARY 15, 1990
atmosphere and flushing with a dry atmosphere, sampling a dry atmosphere and flushing with a dry atmosphere, and sampling a humid atmosphere and flushing with a humid atmosphere.
Laboratory Experiments to Refine Method. Several tests were performed to determine the NO, and SO, capacities of single, TEA-impregnated GF /B filters. A dry atmosphere of NO, at 190 ppb and S02 at 300 ppb was sampled at 30°C at 1.2 L minor until breakthrough was observed. Breakthrough was considered to have occurred when NO, and SO, concentrations monitored with instrumentel analyzers in the exhausted atmosphere exceeded 10% of that for the delivered atmosphere. Capacities were computed based on the recovered masses of analytes expressed as loadings of N02 and S02 per area of exposed filter at the time of breakthrough.
Two types of liquid spiking experiments were performed. In the first, 10-mL aliquots of standard solutions containing 50 I'g mL-! of NOi, NO" and SO;- were spiked with either 0.5 mL of TEA solution or an equivalent volume of DI water. Subsequent IC analyses were performed to determine if the presence of TEA acted as an interferent to alter the apparent ion concentrations. In the second type of spiking experiments, aliquots of standard solutions containing 12.5-200 I'g of each ion were added to: DI water in polyethylene bags; DI water in Nalgene bottles; uncoated GF /B filters; and TEA-impregnated GF /B filters. Recoveries were examined by using D I water extracts in bags versus bottles. Spiked filters were extracted by using DI water in bags for the uncoated filters, DI water in bags for a portion of the TEA-impregnated filters and IC eluent in bottles for the remainder of the impregnated filters.
A comprehensive series of experiments was performed to examine the influence of several variables on analyte recovery expressed as RE. Each experiment was conducted with two TEAimpregnated GF /B filters in series in each of four sampling trains to sample simultaneously a common challenge atmosphere containing both NO, and SO, at a nominal sampling flow rate of 1.2 L min-I. The variables that were examined include species concentration in the sampled atmosphere (5-400 ppb NO, and 5-200 ppb S02), species loading (10, 20, 50, and 200 I'g), humidity «2 and 50% RH), loading temperature (5, 30, and 40°C), flushing and flushing temperature (0 and 18 h, and 5, 30, and 40°C) at 1.2 L min-I, and interferences.
Interference tests were performed at 30°C using atmospheres containing NO, NH" H,S, CH,SH, CS" 0" peroxyacetyl nitrate (PAN), and HNO,. The first five potential interferents were tested under dry «2% RH) and nominal 50% RH conditions. Ozone was tested under 50% RH, PAN under dry and 60% RH, and HN02 under 25% RH conditions. The NO was supplied from a certifIed cylinder of compressed NO in N2; NH, and the sulfides were supplied from gravimetrically calibrated permeation tubes; and 0, was produced by using dry air and a calibrated ultraviolet lamp 0, generator and verified by using a Bendix Model 8002 chemiluminescence 0 3 analyzer. PAN synthesized in isooctane (22) was used to prepare air mixtures in Teflon bags ranging in concentration from 100 to 500 ppb as determined by CLM (23) and by gas chromatography with electron capture detection (24). An HNO, generator (25) was used to generate HNO, concentrations ranging from 21 to 78 ppb as measured by CLM. Comparison of CLM responses to the HNO, atmosphere and an atmosphere containing a similar amount of NO, in the presence and absence of Na,CO,-impregnated fIlters along with IC analyses of filter extracts confirmed that the HNO, atmosphere contained mostly HNO, and negligible amounts of NO" NO, and HNO,.
Field Studies. The current method, as described subsequently in the method section of this paper, was incorporated into the TFR multiconstituent sampler as described by Knapp et al. (26) and evaluated in a field study (27). In this study, the samples were drawn through a PTFE Teflon cyclone and then passed at 16 L minor through nylon- and Nafion-lined partial denuders, a 2-l'm Gelman Zefluor Teflon filter, a I-I'm Gelman Nyiasorb nylon filter, and an oxalic acid impregnated Gelman A/E glass fiber filter. At this point, the current method was introduced and a 1.6 L minor stream was drawn through two TEA-impregnated Whatman glass fiber GF /B filters to collect SO, and NO,. This 1.6 L min-! and the remaining 14.4 L min-! stream then passed through mass flow controllers and were exhausted through a pump. The blank-corrected SO,2- recovered from the nylon filter
., I
h
~ e"
~ :2 ffi d* c
° g '5 u c"
b~
Time (minutes)
Figure 1. \102 collection efficiency as a function of time for selected candidate mating solutions at 1.2 L minot and 0.4 ppm NO,. Solutions are (a) 01 water, (b) tri-n-butyl phosphatelwater (90/10 wt %), (c) 5 M NaOH, (J) K,C03/1uminoi (5/0.1 wt %), (e) TEA solution, (f) 0.2 M Na,S03' 0.2 M NaOH, (g) 0.4 M Na,S03' (h) 0.2 M N~,S03. 0.2 M NaOH, 2 wt % dimethyl sulfone, and (i) 0.2 M Na,S03' 0.2 M NaOH, 6 X 10⁻⁴ 'vt % Triton X-100.
was adjusoed by the appropriate sample volumes and combined with the sum of blank-corrected SOl- recovered from the TEAimpregnated fIlters to compute the TFR SO, concentration. The sum of tho blank-corrected NO,- and NO, (expressed as NOi) recovered from the TEA-impregnated GF /B filters was used with the apprcpriate sample volume to compute the TFR NO, concentratiOlI.
Field evaluation of the developed method for SO, and NO, was performed as part of a field comparison of methods for the measurement of selected trace air contaminants at an ambient air qualitl monitoring research site operated by the United States Environmental Protection Agency at Research Triangle Park, NC (27). Paired replicate daily (22-h) ambient sampling was performed mer 13 consecutive days beginning 09/29/86 and ending 10/12/86 SO, determinations obtained by using the current method v'ere obtained for comparison with simultaneous SO, determinations using the Canadian filter pack (FP) (28). The Canadian FP operated at a nominal flow rate of 19 L min-! and used thre< fIlters in series: a 1 I'm pore size Gelman Zefluor Teflon, a 1 I'm p)re size Gelman Nylasorb nylon and a Whatman 41 cellulose flter impregnated with an aqueous solution of 10% (v Iv) glycerin and 25% (w Iv) K,CO,. The sum of the SOl- recovered from the nylon and impregnated cellulose filters was used to compute the FP SO, concentration. TFR NO, measurements were obtained :or comparison with composited N02 measurements of a tunablE diode laser absorption spectrometer (TDLAS) (29). TDLAS NO, concentrations were determined by monitoring the extent of infrared absorption in the 1600-cm-! region, and the short-term (3-min) data provided by this instrument were composited tc correspond to the daily sampling interval of the TFR.
RESULTS AND DISCUSSION
Prelininary Experiments. Screening of Solutions for Collecting NOz. Several solutions were identified in a literature rev.ew (2) as having potential for collecting NOz. These solution, were tested for NOz CE. In addition to DI water, which was chosen as a base-line material, NO, CE results are depicted in Figure 1 for selected candidate coating/impregnating sclutions as a function of time for a challenge atmosphere cpntaining 0.4 ppm NOz. Analogous testa performed with challenge atmospheres containing 4, 200, and 2300 ppm NO, sho'ved similar behavior (30). The most effective solutions for collecting NO, contained NazS03' Sulfite ions interfere "ith NO,- and SOl- determinations by Ie, and the presence of SO,'- ions prevents the reconciliation of absorbed SO, which may be present in aqueous solution as SOz·HzO, HSO,-, and SO,'- (31). In addition, the useful sampling duration of ;ulfite-based solutions is limited, since SO,'- is readily oxidized by atmospheric oxygen. These considerations rule

ANALYTICAL CHEMISTRY, VOL. 62, NO.4, FEBRUARY 15, 1990 • 341
10
0.1
E 1'l
2 ~
l .01
100
FlowRate{Lmm-1j
Figure 2. Pressure drop as a function of dry air flow rate fo' various sampling elements: (a) single tube containing TEA-coated 20140 mesh charcoal; (b) two TEA-impregnated Whatman GFIF glass fib" filters; (c) two TEA-impregnated Whatman GFIB glass fiber filters; (d) two TEA-impregnated Whatman GFIC glass fiber filters; (e) two TEA-impregnated Whatman OM-A quartz fiber fi~ers; (f) two TEA-imp 'egnated Pallflex TX 40H 120 T eflon-coated glass fiber fitters; (g) single mcoated 1-!lm Gelman Nylasorb nylon fi~er; (h) single uncoated 2-!l1T Gelman Zefluor Teflon filter; and (i) single uncoated S & S FF cellulc'se filter.
out sulfite solutions for extended atmospheric samplin, of NO, and SO,. Of the tested solutions that may be analyzed by IC, the TEA solution exhibited the highest and most stable CE for NO, (i.e., 50 to 60%). This solution has also been reported to be effective for collecting SO, (21); as a result, it W8l. chosen as a coating/impregnating solution for subsequent testing.
Screening of Uncoated and Coated Sorbents and Impregnated Filters. A variety of tests was conducte:l to investigate the potential of several types of material£ at collecting NO, and SO, for subsequent recovery. Re3ults of selected experiments are summarized in Table 1. These results indicate that, in general, uncoated sorbents are not suitable for sampling both NO, and SO,. They il.ustrate clearly that the method of Vinjamoori and Ling (~'J) (i.e., TEA-coated 13X MS) applied at a nominal samplinr rate of 1 L min-! fails under humid conditions. With TEA-coated 45/60 mesh MS under 70% RH, the sorbent becam" moist, the flow became restricted to less than 1 L min-I, and the SO, RE failed to exceed 50%. Similar low SO, REs were found using the larger 20/40 mesh sorbent. Among the u:lcoated and coated sorbents that were tested, TEA-coated charcoal exhibited SO, and NO, CEs in excess of 90% and high NO, REs under both dry and humid test conditions. Although TEA-coated charcoal displayed variable SO, REs (i.e., 20-70%), it appeared to be the most promising of the wrbents at the conditions tested and was subjected to a secon:l round of screening tests.
The results in Table I for coated filters indicate that several coating materials provide effective collection of SO, End that NO, is difficult to collect. Since the thicker QM·A filter retains more coating solution than the S & S FF 8 nd also displays increased NO, CEs, several filters of various thicknesses manufactured from different materials were :;elected for a second round of screening tests.
The second round of screening tests involved TEP.-coated charcoal and several TEA-impregnated filters. Since resistance to flow is an important consideration in the design of a sampling system, pressure drop versus flow rate resLlts were
Flow Rate (L min -1)
Figure 3. N02 collection efficiency as a function of flow rate for variOll$ TEA-coated/impregnated sampling elements at an inlet N02 concentration of 170 ppb and at 25°C and 75% RH: (a) single tube containing 20/40 mesh charcoal; (b) two GF/B fi~ers; (c) two GFIF fi~ers; (d) two Pallflex TX 40H 120 fi~ers; (e) two OM-A fi~ers; and (f) two GFIC filters.
measured on both uncoated and coated sampling elements. Results for the selected coated elements, displayed in Figure 2, are higher than their uncoated counterparts. In addition, test results for single uncoated 1 I'm pore Gelman Nylasorb nylon, 2 !lm Gelman Zefluor Teflon, and S & S FF cellulose filters, commonly used filters in ambient air sampling, are included for comparison.
Collection efficiencies were measured at several temperatures, humidities, and analyte concentrations. Representative results are displayed in Figure 3 for one selected set of test conditions. At 170 ppb, the TEA-coated charcoal tubes and GF /B filters exhibited among the highest CEs for NO,. CEs for the coated charcoal tubes at flow rates of 2.5 L min-! and less were consistently greater than or equal to 92%. With the exception of the 5 °C tests, the CEs of TEA-impregnated GF /B filters at flow rates up to 1.5 L min-! exceeded 90%. In the 5 °C tests, the NO, CEs ranged from 78 to 90% at 1.5 L min-I. The reduced NO, CE of TEA with reduced temperature is consistent with observations of others (32) and with the 21°C liquid-solid transition temperature for TEA. The SO, CE for all of the tests exceeded 95 %. In tests conducted at NO, concentrations between 40 and 340 ppb, CEs wert independent of NO, concentrations across the flow rates tested.
In the loading and flushing tests with TEA-coated charcoal, the NO,- RE decreased with increasing flush tempeatures-on the average, only 37% of the loaded NO,- could be accounted for after flushing with clean air at 40°C. As the flush temperature increased, up to half of the collected NO, was converted to nitrate (N03-) and an increasing portion of the collected NO, was lost. The SO, RE as SO;- was generally less than 60 %. Continuous monitoring of the exhausted at· mosphere showed no SO, breakthrough and increased liberation of NO and NO, with flush temperature.
In the tests with TEA-impregnated GF /B filters, the NO,RE exceeded 90% and was essentially independent of flush temperature. Less than 15% of the collected NO, was con· verted to N03-, and this portion was not associated with loading humidity or with flush temperature or humidity. The SO;- RE generally exceeded 75%. Continuous monitorinlJ of the exhausted atmospheres showed no SO, breakthrough and negligible liberation of NO and NO, under all test conditions.
Laboratory Tests to Refine Method. General. The previous experiments indicate that TEA-impregnated GF /B filters are preferred to TEA-coated charcoal and many other collection elements for ambient sampling. As a result, sub-


ANALYTICAL CHEMISTRY, VOL. 62, NO.4, FEBRUARY 15, 1990 • 343
Table II; Summary of Results from NO, and SO, Rt,covery Efficiency (RE) Experiments Using Dual TEA-Impregnated GF /B FIlters
SO, and NO, loading flush interferent mean RE (SD, n = 4) canena loading,b,Ltg duration, h temp, °C duration h temp, °C humidityc species loading, .ug NO" % SO" %
H H H H L H H L Hd Hd H L H H H H L L L L L Hd H Hd Hd Hd Hd H H H vU vU H H Hd Hd _d
Hd Hd _d
20 50 50 50 10 10 20 10 10
200 50 20 10
200 10
200 10 50
200 200 10 50 50 50 50 50 50 50 50 50
50/90 50/150
50 50 50 50 o
50 50 o
0.33 1.0 1.0 1.0 0.83 0.18 0.34 6.2 0.17 3.4 0.85 2.4 0.17 3.4 0.17 3.4 1.2 5.7
23.0 23.0 1.2 0.87 0.87 0.87 0.87 0.87 0.88 0.87 0.88 0.88
48.8 90.8
0.9 0.9 0.87 0.87 o 1.0 1.0 o
30 30 30 30 30 30 30 30 30 30 30 30 30 30 30 30 30 30 30 30 30 40 30 5
30 30 30 30 30 30 30 30 30 30 30 30 30 30 30 30
o o o o o o o o
17.8 17.8 o o o o o o o o o o o o o o
19.8 17.3 17.0 o o o o o o o o o o o o o
30 30
40 30 5
D D D D D H H D D D H D D D H H D D D H H D D D D D D D H D H D D H D D D H H H
NO NO NO
NH3/S' NHs/S 0 3 NHs/S NH3/S
50 50 50
50 50 50 50 50
75.0 (1.9) 81.8 (3.1) 80.3 (0.5)
86.3 (12.4) 73.7 (4.6) 74.2 (3.0) 64.6 (1.3) 69.4 (5.3) 79.4 (1.2) 88.3 (2.8) 79.9 (1.6) 90.1 (3.7) 91.2 (3.9) 85.1 (1.4) 90.9 (0.8)
104.4 (11.1) 86.6 (5.0) 82.4 (5.8) 97.6 (2.0) 92.6 (2.7) 93.5 (2.6)
101.7 (2.8) 81.6 (1.9) 92.7 (1.8) 91.2 (1.5) 88.6 (5.2) 92.4 (3.9) 97.6 (2.0)
91.4 (1.2) 88.8 (2.1) 84.5 (1.4) 90.9 (2.4) 94.0 (-) 89.0 (-)
0.0 (-) 86.3 (3.3) 94.5 (1.0) 0.0 (-)
89.1 (1.5) 87.9 (6.3)
89.8 (2.1) 104.8 (4.1) 79.3 (3.3) 72.9 (1.5) 77.0 (0.5) 86.7 (3.8) 92.1 (1.4) 83.3 (1.7) 97.1 (4.8) 81.1 (4.2) 91.9 (4.2) 74.9 (2.4) 81.5 (1.5) 83.6 (4.8) 80.3 (1.3) 82.8 (9.0) 77.8 (5.2) 83.7 (7.9) 94.6 (3.5) 87.3 (7.8) 87.8 (1.1) 94.5 (2.2) 94.4 (3.9) 91.8 (3.0) 88.9 (5.6) 81.3 (2.1) 85.7 (1.4) 86.0 (2.8) 89.5 (4.3) 85.9 (2.7) 79.8 (3.1) 90.0 H
101.0 (-) O.OH
93.0 (1.8) 0.0 H
'H = high concentration, nominal values 400 ppb NO, Ilnd 200 ppb SO,; L = low concentrations, nominal values 60 ppb NO, and 30 ppb 802; and VL = very low concentrations, nominal values 5 ppb N02 and 8°2- b Nominal loadings of N02 as nitrite and 802 as sulfate. cD = dry «2% RH); H = humid (50% RH). dExperiments not considered in ANOVA. 'NH3, CH3SH, CS" and H,S, each loaded to approximately 50 ~g.
sequent laboratory tests were limited to TEA-impr"gnated Whatman GF IB filters. These filters were thick (0.~3 mm), exhibited a pressure drop of 0.01 atm at 1 L min-I, and retained approximately 0.43 g of impregnating materid. This residual impregnating material was comprised prirr arily of TEA and ethylene glycol, since much of the acetone ar d water originally present in the impregnating solution was los c during the vacuum drying stage of filter preparation. Single-filter capacities of approximately 85 ",g of NO, cm-' and 350 ",g of SO, cm-' were observed.
At low loadings, the level and variability of sulfur and nitrogen on the blanks may influence the apparent drborne concentrations appreciably. Impregnated and uncoaud blank GF IB filters were washed with DI water or wash,d with aqueous KOH solution and extracted in DI water or Ie buffer solution. Washing with DI water reduced blank SO.'- levels from 2 to approximately l",g filter-! but had no appceciable effect on blank NO,- or N03-levels. The additiona. effects of KOH washing, TEA coating, and extract solution en blank levels could not be distinguished. It should be noted that KOH washing resulted in disintegration of the filter£ and, as a result, is not recommended. The mean (± standard deviation) background levels for NO,-, N03-, and SOl- ,·n 22 DI water-washed, TEA-impregnated GF IB filters are 0.8" ± 0.43,
0.66 ± 0.24, and 1.13 ± 0.32 ",g. Spiking Experiments. The first type of spiking experiments
involved spiking standard solutions with TEA. In these tests, the presence of TEA did not influence the apparent species concentrations. In the second type of spiking experiments, standard solutions were spiked into various samples. Recoveries from spiked DI water in bags and bottles were greater than 95 %, with those in bottles slightly exceeding those in bags. The differences in recoveries found between spiked, impregnated and uncoated filters using various containers and extract solutions were not significant (a = 0.05). For all spiked filters (n = 15), the mean (± standard deviation) NO,-, NO,-, and SOl- recoveries were 88 ± 5, 94 ± 4, and 87 ± 5%. This indicates that 5 to 10% of loaded NO,-, NO,-, and SO;- may be retained by impregnated or uncoated GF IB filters.
Analyte Recovery. Experiments were conducted to examine the influence of several variables on analyte recovery. The variables that were examined are species concentration in the sampled atmosphere, species loading, humidity, loading temperature, flushing, and flushing temperature. Results from many of these analyte recovery tests performed under widely differing conditions are summarized in Table II. Each experiment was conducted with two TEA-impregnated GF /B filters in series in each of four trains to sample a common

344 • ANALYTICAL CHEMISTRY, VOL. 62, NO.4, FEBRUARY 15, 1990
challenge atmosphere simultaneously. On the average, REs were 87 ± 9% (n = 33) for NO, and
86 ± 7% (n = 34) for SO,. The precision within any experiment was good, showing average standard deviations of 3 % for both NO, and SO,. Examination of the distribution of collected nitrogen showed that most of the nitrogen was retained as nitrite; the average nitrate was only 2%. Most (96%) of the recovered nitrogen was found on the first filter. Sulfur dioxide was recovered as SO,'-, and most (99%) of the recovered sulfate was found on the front filter.
The results from the NO, and SO, recovery experiments were subjected to statistical analyses using an ANOVA on the reported mean REs adjusted for the unbalanced experimental design. Results from 25 of the experiments summarized in Table II were examined for effects from concentration, loading, and temperature. No significant differences (a = 0.10) were found between REs obtained at high species concentrations and those at low species concentrations. Although there was a significantly (a = 0.10) lower NO, RE at a species loading of 20 I'g (RE = 76%), it is based on three experiments conducted early in the program compared to five or more experiments at the three other levels. The small sample size at 20 I'g can argue for considering only the 10-, 50-, and 200-l'g experiments. When results at these three loadings are considered, no significant differences (a = 0.10) were apparent among species REs obtained. Examination of the data for humidity effects revealed no significant differences (a = 0.10) between NO, REs obtained at high and low levels. In contrast, there was a significant difference (a = 0.05) in SO, RE associated with humidity. The mean SO, RE under humid conditions was 81 ± 5% (n = ll), while urider dry conditions, it was 89 ± 6% (n = 23). These findings may be compared with those for TEA-coated 13X MS, where 10% reductions in REs for both NO, and SO, were reported at 90% RH (21).
The results in Table II indicate that variation in species concentrations in the sampled atmosphere ranging from 5 to 400 ppb did not lead to different REs. REs were relatively constant across species loadings ranging from 10 to 200 I'g. NO, REs were not appreciably different at 0 and 50% RH; SO, REs were reduced at 50% RH in comparison to those observed under dry conditions. Loading temperature ranging from 5 to 40°C did not exert an appreciable effect on species RE except for NO, at 5°C; in this case, a small reduction in NO, RE was indicated and the distribution of NO,- was shifted to the second filter. These observations are consistent with findings of some of the screening tests discussed previously. After loading at 30°C, flushing with clean dry air at temperatures from 5 to 40°C had no apparent effect on the species REs.
Interference Tests. The potential interference of eight common atmospheric trace gases on the determination of NO, and S02 using TEA-impregnated filters was studied. Test results for the first six potential interferents are summarized in Table II. Results for the remaining two, PAN and HNO" are discussed in subsequent paragraphs. Nitric oxide, NH3,
and the three tested sulfides showed negligible interference with NO, or SO, measurements. Ozone did not interfere with NO, determinations at 50% RH. An instrumental malfunction prevented an assessment of 0 3 as an interferent for SO, in the Table II experiments. Earlier experiments using a dry atmosphere of 10 ppb NO" 14 ppb SO" and 130 ppb 0 3 showed a mean SO, RE (n = 4) of 96.7% obtained by using TEA-coated S & S FF cellulose filters. These results suggest that 0 3 may not interfere with SO, measurements obtained by using TEA-impregnated glass fiber filters.
At PAN concentrations of 500 ppb, TEA-impregnated filters showed recoveries of 15-25% of the delivered PAN as N02- and 55-70% as N03-. Thus, PAN should be considered
a major interferent with the determination of ambient NO, using TEA-impregnated filters.
To t"st for HNO, interference, atmospheres containing 21-78 rpb HNO, and 170 ppb NO, were employed. TEAimpregnated Whatman GF IB glass fiber filters, Gelman NylasOl b nylon filters, Na,C03 (25% in 10% glycerinewater)-impregnated Whatman 41 cellulose filters, oxalic acid (5% in methanol)-impregnated Whatman 41 filters, and Gelman Zefluor Teflon filters were tested separately. The gas mixture upstream and downstream of each filter was analyzed by usin, a chemiluminescent NOx monitor, permitting estimates cf CE by each filter type. Teflon and oxalic acid impregnated filters failed to collect either HNO, or NO,. The nylon filter appeared to retain HNO, up to a point and saturate at approximately 20 !'g. This is consistent with reported finding" using nylon wool (33). No NO, collection was noted with th l nylon filter. On the basis of the chemiluminescent respon"e, both the TEA-impregnated filters and the Na,CO:.-impregnated filters collected all of the delivered HNO,. The TEA-coated filter collected all the delivered NO" while n.e Na,C03-impregnated filter collected only 4 % of the NO,. ~,ince the collected HNO, was recovered as NO,- by extract on and IC analysis of the TEA-coated filters, HNO, acted ru a direct interferent in the measurement of NO, using TEA-wated filters.
Met! od. On the basis of previous findings, the recommended method employs two 47 mm diameter, TEA-impregnai ed Whatman GF IB glass fiber filters in series. The compo,ition of the TEA-impregnating solution and the impregnat ing procedure were described previously. Other sizes and tyres of filters may also be suitable. Flow rates in excess of 2 L nin-' and temperatures at or below 5 °C should be avoidec.. No known gaseous interferents exist for SO" although 0 3, PAN, and HNO, were not evaluated. Unless remove:i first, sulfate particles will act as direct interferents with this method. Both PAN and HNO, will interfere with the det,,,mination of NO" and unless removed first, gaseous HN03 as well as particulate nitrates will act as direct interferents The maximum tolerable RH has not been sought; however, if operation at high humidities results in excessive accumL.!ation of moisture, the temperature of the sampler could be elevated slightly to prevent the occurrence of 100% RH cOliditions within the sampler.
After sampling, the filters are extracted in 20 mL of DI water (or IC eluent solution), 2 drops of 30% H,O, are added to oxidize SO;- to SO,'-, and the extract is analyzed for NO,-, N03-, and SO,'- using IC or another suitable method. By use of the extract volume, the ion loadings are determined. The NO,- and N03-loadings are blank corrected and summed as NO,-. The blank-corrected SO,'- and NO,-loadings are then used with the sampled air volume to express the integrated sample:l air concentration in units of micrograms per cubic meter or parts per billion.
Fieltl Tests. After development, the method was incorporated into a multiconstituent sampler for contributors to acidic deposition, known as the transition flow reactor (TFR). Result, obtained by using the current method and assuming quantitative recoveries are compared in Figures 4 and 5 with simultaneous SO, measurements using the Canadian FP and with composited NO, measurements using a TDLAS. The median relative standard deviations (RSDs) for SO, and NO, in this study of 13 paired samples are 13 and 3 %. Correspondir.g median RSDs in an earlier study (26) involving seven paired 3amples were 4 % for both SO, and NO,.
Com 3arison of SO, results obtained by using the current methoc. with those of the FP are displayed in Figure 4 and show good agreement with a correlation coefficient of 0.99. The stLdywide mean (±l standard deviation (SD» SO, con-

ANALYTICAL CHEMISTRY, VOL. 62, NO.4, FEBRUARY 15, 1990 • 345
D ~ ~
~ i!l.
~ ~ rr
~ u: 0
'" 0
~ ~
Canadian FIlter Pack [S02J. ppb
Figure 4. Comparison of ambient daily S02 concentratiorls as determined by the transition flow reactor employing the currently developed method and by the Canadian filter pack. Linear regression analysis resu~s (n = 13): r = 0.99; slope (±95% confidence intervals) = 1.09 ± 0.11; and intercept (±95% confidence intervals) = -0.25 ± 0.23 ppb.
D %. 16
~ 14
~ 13
)5 12
II & 10
~ u:
-- _ ... _ ... _. -----_ .. _----- --,
Tunable Diode Laser [N02), ppb
I I
I
I ,
Figure 5. Comparison of ambient daily NO, concentratiors as determined by the transition flow reactor employing the curr~ntly developed method and by a tunable diode laser absorption spectrometer. Linear regression analysis results (n = 13): r = 0.97; slope (±95% confidence intervals) = 1.11 ± 0.19; and intercept (± 95% confidence intervals) = -0.33 ± 1.74 ppb.
centrations of 1.68 ± 1.33 and 1.77 ± 1.21 ppb as mlasured using the current and FP methods are in good agreement. The mean (±SD) daily ratio of TFR to FP SO, concentr>tions is 0.90 ± 0.12, the difference between the two measure, of S02 concentration based on the paired Student's t tes; is not significant (a = 0.05). Linear regression analysis sUi;gests a low constant bias for the current method. This low bias, if real, may be the result of less than quantitative SO;-Iecovery from the TEA-impregnated filters or it may be associal.ed with humidity. The average hourly RH for the study period was 73%, and the maximum hourly average RH exceed'ld 93% on 7 of the 13 days of the study. Excessive accumuhtion of moisture was not observed with the current method during this study. If humidity does exert an influence on SO, recovery, even at the high RH present in this field stldy, the influence does not appear to be huge. Recent laboratc ry tests (34) suggest that a portion of the S02 retained by some nylon filters is unrecoverable. Since the sample passes th 'ough a nylon filter in both the FP and TFR, an absolute low bias may be present in the SO, results but is not expected to irfluence the relative comparison of the two methods.
Comparison of NO, results obtained by using the current method with those of the TDLAS are displayed in I'igure 5 and show good agreement with a correlation coefficient of 0.97.
The studywide mean (±SD) NO, concentrations of 9.34 ± 3.38 and 8.73 ± 2.95 ppb as measured using the current method and the TDLAS are in good agreement. The mean (±SD) daily ratio of TFR to TDLAS NO, concentrations is 1.07 ± 0.09. Linear regression analysis does not reveal either a proportional or constant bias (a = 0.05). TFR results generally exceed those of the TDLAS, and the difference between the two measures of NO, based on the paired Student's t test is significant (a = 0.05). Although the small difference (i.e., 7%) is within the ±15 % uncertainty of the TDLAS measurements and may not be of practical importance, it may have resulted from nitrogen-containing interferent gases (e.g., PAN or HNO,) which were not removed upstream of the TEA-impregnated filters.
The mean (±SD) background levels for N02- (n = 8), N03-
(n = 10), and SO;- (n = 8) for TEA-coated GF /B filters used as field blanks in the previously mentioned field study (30) are 1.19 ± 0.30, 0.54 ± 0.55, and 1.51 ± 0.79 f.'g. It should be noted that these field blank results are somewhat higher than previously noted laboratory blank results. Single-filter blank-corrected loadings of 3 times the SD for blank NO, - and SOl-levels, 0.90 f.'g of NO,- and 2.37 f.'g of SO;-, may be used to estimate the minimum detection limits (MDLs) for the current method (35). At a flow rate of 1.6 L min-l (0 °C, 760 mmHg) MDLs may be computed for any sampling duration. For 24-h samples, MDLs for SO, and NO, are 0.3 and 0.2 ppb, and for 7-day samples they are 0.04 and 0.03 ppb.
SUMMARY
A method has been developed to permit the simultaneous time-integrated sampling of SO, and NO, from ambient air. Triethanolamine-impregnated glass fiber filters are used to collect SO, and N02. After sampling, the filters are extracted, and the extract is analyzed for sulfate, nitrite, and nitrate using ion chromatography. Ambient concentrations are computed from recovered nitrogen and sulfur and the sampled air volume.
To arrive at this method, preliminary experiments were performed to determine the suitability of selected sorbents, filters, and coating/impregnating solutions for collecting SO, and NO,. Candidate coating/impregnating solutions identified from the literature were tested in bubblers, and an aqueous solution of 25% (w/v) triethanolamine and 4% (w/v) ethylene glycol was chosen for subsequent testing. The uncoated sorbents that were tested proved unsuitable for sampling both NO, and S02' Among the coated sorbents and filters that were tested, TEA-coated charcoal and TEA-impregnated filters appeared to be promising candidates and were subjected to a second round of screening tests. TEA-coated molecular sieves were eliminated because water accumulation from sampled humid atmospheres did not permit sampling at the minimum desired rate of 1 L min-I
The second round of screening tests revealed that the thick GF /B glass fiber filters retained substantial amounts of the impregnating solution and exhibited the highest analyte CEs among the filters tested, generally exceeding 90% for NO, at flow rates up to 1.5 L min-I. TEA-coated charcoal showed even better performance with NO, CEs exceeding 92% at flow rates up to 2.5 L min-I In subsequent tests where clean air was flushed through TEA-coated charcoal and TEA-impregnated filters that had been previously loaded with NO" REs obtained by using TEA-coated charcoal decreased to below 40% as the flush temperature was increased tc 40°C, whereas REs obtained by using TEA-impregnated filters exceeded 90% and were independent of flush temperature.
As a result, a method incorporating TEA-impregnated GF /B glass fiber filters was chosen for refinement. Single filter capacities of 85 f.'g of NO, and 350 f.'g of SO, cm-' were measured. Laboratory tests showed average REs near 90%

346 • ANALYTICAL CHEMISTRY, VOL. 62, NO.4, FEBRUARY 15, 1990
for both N02 and S02' In addition, laboratory tests suggested that REs are independent of NO, and SO, concentrations at high (Le., 100's of ppb) and low (i.e., 10's of ppb) levels, that REs are independent of NO, and SO, loading at levels between 10 and 200 f.lg, that NO, RE is independent of humidity at <2 and 50% RH, but that SO, RE is reduced from approximately 90% under dry conditions to approximately 80% at 50% RH. Subsequent tests at loading temperatures of 5, 30, and 40°C indicated a reduction in NO, RE at the 5 °C condition. Tests at 5, 30, and 40°C using clean dry air to flush loaded filters did not reveal a flushing or flush temperature effect on REs. Tests with NO, NH" CH,SH, CS" and H,S showed no apparent interferences with NO, or SO, measurements. Ozone did not interfere with NO, measurements under the conditions tested. Although the potential interference with SO, measurements of 0" PAN, and HNO, was not examined, both PAN and HNO, were found to be strong interferents with NO, measurements using TEA-impregnated filters. Recommendations were made to avoid sampling particulate sulfates, particulate nitrates, and/or HNO, since they can act as direct interferents.
On the basis of the results of the previously described tests, a method using TEA-coated filters was defined. The bounds of applicability were described with respect to species concentration and loading, sampling rate, capacity, humidity, temperature, and interferences. Subsequently, the method was incorporated into a multi constituent sampler (i.e., TFR) and deployed in a 13-day field study. On the basis of the precision of field blanks, and a sampling rate of 1.6 L min-I, SO, and NO, detection limits of 0.3 and 0.2 ppb for 24-h samples and 0.04 and 0.03 ppb for 7-day samples were estimated. Paired duplicate daily measurements showed median RSDs for SO, and NO, of 13 and 3%. TFR results were compared with those of accepted methods (i.e., Canadian filter pack (FP) for SO, and tunable diode laser absorption spectrometer (TDLAS) for NO,). These comparisons were in reasonable agreement with correlation coefficients above 0.95 in both cases. At the ambient SO, concentrations present (i.e., 0.5-5 ppb), although the TFR SO, measurements appeared to be biased slightly (Le., 10%) lower than the FP measurements, the difference was not statistically significant (" = 0.05). At the ambient NO, concentrations sampled (Le., 5-17 ppb), while the TFR NO, measurements were biased higher than the TDLAS measurements (" = 0.05), the magnitude of this bias was small (i.e., 7%). These findings demonstrate that TEA-impregnated filters can be used to sample ambient air for SO, and NO, sensitively (i.e., sub-part-per-billion detection limit) at commonly occurring levels, with good precision (Le., :5±15%) and accuracy (Le., 10%).
ACKNOWLEDGMENT Appreciation is expressed to J. L. Durham, L. L. Spiller,
and R. J. Paur of the United States Environmental Protection Agency for advice and guidance during the course of the methods development effort. We thank Dr. K. G. Anlauf and his collegues at the Canadian Atmospheric Environment Service and Dr. G. L Mackay of Unisearch Associates for making the FP SO, and TDLAS NO, data from the 1986 field study available to us for comparison.
Registry No. XAD2, 9060-05-3; XAD7, 37380-43-1; TEA, 102-71-6; SiO" 14808-60-7; NO" 10102-44-0; SO" 7446-09-5; K,eO" 584-08-7; PbO" 1309-60-0; KMnO" 7722-64-7; NaAsO" 7784-46-5; chromosorb 101, 9003-70-7; chromosorb 105, 62852-91-9; chromosorb 107, 77641-01-1; chromosorb 108,82905-08-6; guaiacol, 90-05-1; alumina, 1344-28-1; cellulose, 9004-34-6.
LITERATURE CITED (1) DUlham, J. L.; Ellestad, T. G.; Stockburger, L.; Knapp, K. T.; Spiller, L.
L .. 1. Air Pollut. Control Assoc. 1986. 36,1228-1232. (2) SicKles, J. E., II; Grohse, P. M. Sampling and Analysis Methods for
Sui fur Dioxide and Nitrogen Dioxide: A Literature Review. Research Triangle Institute Report No. RTI/2823/00-011, Research Triangle InstitJte: Research Triangle Park, Ne, 1984.
(3) Ch .. iswell. C. D.; Gjerde, D. T. Anal. Chem. 1982,54, 1911-1913. (4) Pale, J. 8.; Lodge, J. P., Jr.; Neary, M. P. Anal. Chim. Acta 1963, 28,
341-348. (5) Hu:'gen, C. Anal. Chim Acta 1963, 28, 349-360. (6) Ada,ms, D. F.; Bamesberger, W. L.; Robertson, T. J. J. Air Pollut.
CO'1lrol Assoc. 1968, 18,145-158. (7) FOlrest, J.; Newman, L. Almas. Environ. 1973, 7,561-573. (8) Johnson, D. A.; Atkins, D. H. F, Almas. Environ. 1975. 9, 825-829. (9) Le'vin, E.; Zachau-Christiansen, B. Atmos. Environ. 1977, 11,
861-862. (10) Fal well, S. 0.; Liebowitz, D, P.; Kagel, R. A.; Adams, D. F. Anal.
Ch.m. 1980, 52. 2370-2375. (11) Va1 Mourik, J. H. C. Am. Ind. Hyg. Assoc. J. 1965. 26, 498-509. (12) Le'/aggi, D. A.; Siu, W.; Feldstein, M.; Kothny, E. L. Environ. Sci.
Teohnol. 1972, 6.250-252. (i3) Jucleikis, H. S.; Siegel, S.; Stewart, T, B.; Hedgpeth, H. R. Heterogene
ou:, Reactions of Nitrogen Oxides In Simulated Atmospheres. U.S. EPa. Publication EPA-600/3-77-028; Otfice of Research and OevelopmE nt: CinCinnati, OH, 1977.
(14) Cujdeback, J. E.; Saltzman, B, E.; Burg, W. R. J. Air Pollut. Control Assoc. 1975.25,725-729,
(15) Ad3.ms, K. M.; Japar, S. M.; Pierson, W. R. Almas. Environ. 1986, 20, 12/1-1215.
(16) Le/aggi, O. A,; Siu, W.; Feldstein, M. J. Air Pollut. Control Assoc. 1973, 23, 30-33.
(17) SI'.cker, J. H. Am. Ind. Hyg. Assoc. J. 1973, 34. 390-395. (18) Wiley, M. A.; McCammon, C. J., Jr.; Ooemeny, L. J. Am. Ind. Hyg.
Assoc. J. 1977. 38, 358-363. (19) Bcurbon, P.; Alary, J.; Esclassan, J.; Lepert, J. C. Atmos. Environ.
1977, 11,485-488. (20) Crristie, A. A.; Lidzey, R. G.; Radford, D. W. F. Analyst 1970, 95,
519-524. (21) Villjamoori, D, V.; Ling C.-S. Anal. Chem. 1981, 53, 1689-1691. (22) Hcldren, M. W.; Spicer, C. W. Environ. Sci. Technol. 1984, 18,
113-116. (23) Winer, A. M.; Peters, J. W.; Smith, J. P.; Pitts, J. N., Jr. Environ, Sci.
T€chnol, 1974, 8,1118-1121. (24) Ocrley, E. F.; Kettner, K. A.; Stephens, E. R. Anal. Chem. 1963,35,
589-591. (25) Bn.man, R. S.; de la Cantera, M. A. Anal. Chem. 1986, 58,
1033-1537. (26) Krapp, K. T.; Durham, J. L.; Ellestad, T. G. Environ. Sci. Technol.
1S86, 20, 633-637. (27) Sickles, J. E., II; Hodson, L. L.; McClenny, W. A.; Paur, R. J.; Ellestad.
T. G,; Mulik, J. D.; Anlauf, K. G.; Wiebe, H. A.; Mackay, G. I.; Schiff, H. I.; Bubacz, O. K. Atmos, Environ. 1990,24,155-165.
(28) Arlauf, K. G.; Wiebe, H. A.; Fellin, P. J. Air Pollut. Control Assoc. 1586. 36, 715-723.
(29) Schiff, H. I.; Hastie, D. R.; Mackay, G. I.; Iguchi, T.; Ridley, B. A. Erviron. Sci, Techno!. 1983, 17, 352A-364A.
(30) Si·;kles, J. E., II. Sampling and Analytical Methods Development for Dry deposition Monitoring. Research Triangle Institute Report No. Rn/2823/00~15F; Research Triangle Institute: Research Triangle Pork. NC, 1987.
(31) D~~lIinger, 8.; Grotecloss, G.; Fortune, C. R.; Cheney, J. L.; Homolya, J. B. Environ. Sci. Technol. 1980, 14, 1244-1249.
(32) Gi-man, J. R.; Hodgson, A. T; Robinson, B. K.; Traynor, G. W. '"laboratory Studies of the Temperature Dependence of the Palmes N02 Passive Sampler;" Proceedings of the National Symposium on R{~cent Advances in Pollutant Monitoring of Ambient Air and Stationary S(lurces. U.S. EPA Publication EPA-600/9-84-001; Office of Research ard Development: Cincinnati, OH. 1984; pp 152-166.
(33) S<tnhueza, E.; Plum, C. N.; Pitts, J. N., Jr. Almas. Environ. 1984, 18, 1('29-1031.
(34) Si;kles, J. E., II; McClenny, W. A.; Paur, R. J.; Baumgardner, R. E. Irternal Report on the Retrofit of NOON Multiconstituent Samplers. Rf~search Triangle Institute Report No. RTI/3993/09-02F; Research Triangle Institute: Research Triangle Park, NC, 1988.
(35) AI~S Committee on Environmental Improvement. Anal. Chem. 1980, 5.',2442-2249.
RECEn'ED for review July 12, 1989. Accepted November 14, 1989. The research described in this paper has been funded in part by the United States Environmental Protection Agency under 20ntracts 68-02-3170 and 68-02-4079. The paper has not be@ subjected to Agency review and therefore does not necess.lrily reflect the views of the Agency. As a result, no officia endorsement should be inferred.

Anal Chern. 1990, 62, 347-349 347
Non-Steady-State Gas Chromatography Using Capillary Columns
Anatoly J. Belfer
BP Research, Warrensville Research Center, 4440 Warrensville Center Road, Cleveland, Ohio 44128
David C. Locke* and Isaac Landau
Chemistry Department, Queens College and The Craduate School, CUNY, Flushing, New York 11367
Non-steady-state gas chromatography involves the lise of a relatively volatile solvent phase that elutes slowly alld continuously while solutes are Injected. Application of the technique to the determination of limiting activity coefficients of solutes In the solvent is shown to provide useful data when the solvent Is condensed onto the walls of an uncoated fused silica capillary column. Activity coefficients of n-Ilexane, n-heptane, and benzene solutes are determined in n-nonane and p-xylene solvents at 40, 50, and 60°C, and of acrylon"rlle and methyl methacrylate In water in the range 01 35-60 °C. Compared with packed column non-steady-stilte gas chromatography, capillary columns require smaller solvent and sample volumes, and measurement times are substantially reduced.
Non-steady-state gas chromatography (NSGC) has been shown to be an efficacious method for the determination of physicochemical properties of nonelectrolyte solutions (1-3). For this application, NSGC has the particular advanu ge over normal gas chromatography in that it is useful for detelmining limiting activity coefficients and other thermodynamic properties of volatile solutes in volatile solvents. The criterion is that the volatility, the product of the vapor pressure and the activity coefficient, of the solute must be greater t 1an the volatility of the solvent. In normal gas chromatography (GC), a stationary solvent of low volatility is used, which limils study to systems that are primarily of theoretical interest. '10latile compounds have served as solvent phases in GC (4-. 0), but presaturation of the carrier gas with the solvent is required, and the exact weight of the solvent present in the co .umn is always uncertain.
In NSGC, the volatile solvent phase is injected into the hot injection port, evaporates, is allowed to equilibrate in the column, and bleeds out at a steady rate dependent on iis vapor pressure at the column operating temperature. Solut()s more volatile than the solvent are injected repetitively while the solvent is eluting, over the life of the column, and eh;te with ever-decreasing retention times as the weight of soh'ent diminishes linearly with time. An analysis of the system (1, 2) leads to a remarkably simple equation relating the nfinite dilution (limiting) activity coefficient, '11·, of the solut3 in the volatile solvent to the ratio of their vapor pressures, J 1 ° / P2 0 ,
and the rate at which retention time decreases with t 1e time of injection, t:.tR / t:.t:
(1)
Solutes of lower volatility than the solvent will elut" at the tail of the solvent band, and cannot be studied from this point of view.
* Author to whom correspondence should be addressed
0003-2700/90/0362-03"7$02.50/0
Heretofore all NSGC work (1-3) was done by using a column packed with only a solid support material. We report here the use of a capillary column in which the solvent is condensed onto the walls of the column. The primary advantage of a capillary column in NSGC is the small volume of solvent that is required, which facilitates the study of rare, expensive, and/ or toxic compounds as solvents. In addition, the time required to equilibrate the column and to make measurements is reduced substantially compared to that required for packed columns. A more uniform coating of the solvent film and consequently a more constant rate of evaporation of the film will also result. The thin liquid film and the short lateral diffusion distance improve solute masstransfer characteristics.
With packed column NSGC, thermal conductivity detector base-line stabilization is assisted by using dual columns, into both of which are injected equal volumes of solvent. For the capillary columns, we used a Hewlett-Packard modulated thermal conductivity detector (11). This detector is quite sensitive, and once solvent equilibration has been achieved, a flat base line results, enabling detection of solute quantities small enough to ensure effectively infinite dilution solutions.
EXPERIMENTAL SECTION A Hewlett-Packard 5890A gas chromatograph (GC) equipped
with a Hewlett-Packard modulated thermal conductivity detector and splitless injector was used with a 30 m x 0.53 mm i.d. uncoated Hewlett-Packard fused silica capillary column. The carrier gas was He at flow rates in the range of 2-10 mL/min. Carrier gas flow rate was set to provide a column lifetime of at least 15 min, which is sufficient to allow at least five solute injections. The injector and detector were maintained at 200 and 250 °C, respectively. Measurements were made at column temperatures in the range of 35-60 cC. Without cryocooling, for which the GC used was not equipped, the oven gave unstable temperature control below about 30 °C. Chromatographic data were recorded on a Hewlett-Packard 3392A recording integrator. The attenuator setting was 5 or 6 for injections of 0.2 ILL of solute mixtures.
To load the column with a presumably uniform and relatively thick film of solvent, the column temperature was set to a value slightly greater than the boiling point of the solvent. Injection of 25-50 ILL of solvent into the Grob injector produced a temporary surge in pressure at the head ofthe column. As the vapors passed into the column, the pressure dropped back to normal. At this time the column was filled with the saturated vapor of the solvent. Condensation of solvent onto the walls of the capillary column was achieved by opening the door of the GC oven and setting the temperature down to the desired operating value. Liquid nitrogen cryocooling would presumably serve the same function in a more elegant fashion. The base line stabilized in about 5-6 min. If the rapid cooling was started before the inlet pressure had dropped to normal, a liquid plug formed at the column inlet, which led to an excessively long equilibration time and a shorter effective column lifetime. On the other hand, cooling should not be delayed lest elution of solvent vapor leave an amount of solvent insufficient to produce a long-lived column. When the temperature descended to the operating value, the oven door was closed gradually to maintain the temperature. If the door was closed at once, residual
© 1990 American Chemical Society

348 • ANALYTICAL CHEMISTRY, VOL. 62, NO.4, FEBRUARY 15, 1990
Table I. Activity Coefficients in D -Nonane and p-Xylene
activity coeff of solute solvent temp,OC n-hexane n-heptane benzene
n-llonane 40 0.76 0.77 0.97 50 0.80 0.80 0.96 60 0.85 0.84 0.96
p-xylene 40 1.25 1.22 0.91 50 1.20 1.17 0.88 60 1.14 1.10 0.85 20' 1.39 1.38 0.98 20b 1.44 1.40 0.99
a Extrapolated. bReference 7.
heat in the oven components caused a sharp rise in temperature followed by a slow equilibration back to the set value.
As soon as base-line stabilization was noted, solutes could be injected, neat or in solution or in mixtures if the components were separated. Peak shapes were generally symmetrical, except for the solutions in n-nonane, in which the peaks tended to front, indicative of overload. Injection times were noted on the recorder chart by using the event marker on the integrator. It is not necessary to wait for complete elution of a sample before making a new injection, if elution times allow a separation. Indeed, the more solute injections made over the life of the column, the better the definition of the slope of the retention time/injection time plot. For example, for n-nonane solvent at 40°C, the column lifetime was about 65 min, which allows time for at least 12 injections of a mixture of n-hexane and n-heptane solutes. The tomplete evaporation of solvent is noted by a sharp drop in the base line, which signals the need to inject fresh solvent. One need not wait for loss of all solvent; a new solvent injection can be made at any time, and once equilibration has been achieved, solute injections can be resumed.
RESULTS AND DISCUSSION From eq 1, 1'1· is calculated from the slope of a plot of
retention time vs injection time and from the ratio of solute-to-solvent vapor pressures. Vapor pressures for all compounds except H 20 were calculated by using the Fortran program of the Design Institute for Physical Property Data (12). The vapor pressure of H20 was calculated from the Chebysev polynomials given by Ambrose and Lawrenson (13). Corrections for vapor-phase nonideality, calculated from the truncated virial equation of state using second virial coefficients calculated according to Reid, Prausnitz, and Poling (14), were insignificant compared with the estimated experimental error (±10%). Activity coefficients are listed in Table I for II-hexane, n-heptane, and benzene solutes in n-nonane and p-xylene solvents. Values for acrylonitrile and methyl methacrylate solutes in water are given in Table II.
There are few data in the literature for comparison with the values listed in Tables I and II. For p-xylene solvent, Thomas et al. (7) give 1'1· values for benzene and n-hexane at 20°C. Extrapolation of their data for n-pentane and nhexane yields a value for 1'1· of n-heptane in p-xylene at 20 °C. Extrapolation of our data to 20°C yields the values on the next to last line of Table I; on the line below are the values of Thomas et al. (7). The agreement is quite good. The activity coefficient of acrylonitrile in H20 at 25°C has been calculated by Banerjee using UNIFAC (15). This value, 45.3, is in reasonable agreement with our extrapolated value, 48.4.
It is of interest to calculate the average liquid film thickness on the walls of the capillary tubing, assuming a uniform film. This value, dL, can be calculated from the initial solvent volume, V L, which in turn is estimated from the specific retention volume of a solute, V G, the net retention volume per gram of stationary phase
VG = RT /P1°l'1·M,
where M, is the molecular weight of the solvent. From the
Table II. Activity Coefficients in Water
activity coeff of solute temp,OC acrylonitrile methyl methacrylate
35 44.4 431 40 45.2 388 50 42.0 376 60 38.4 338 25' 48.4 25b 45.3
'Extrapolated. b UNIFAC-calculated, ref 15.
experimentally determined 1'1· value for a solute of vapor pressu:'e Plo, V G can be calculated. For an injection of this solute early in the column life, the retention time and flow rate ar" measured. The total column volume is measured at the end of the column life from the retention time of air and the flo'v rate. From these values can be estimated the initial weight and volume of solvent present in the column, and assuming a uniform film on the walls of the capillary tube, dL can be calculated. For example, for the acrylonitrile/water system at 50°C, VL = 241'L and dL = 1.2 X 10⁻³ cm. VL is consistent with the volume of water injected, which was 25 I'L.
Fihr thicknesses of this magnitude lead one to raise the obvioUl question as to whether the solutions are sufficiently dilute 10 give effectively infinite dilution activity coefficients. An estimate of the most dilute concentration of the solute in the chromatographic solution can be made by using the maximum permissible sample size calculation of Conder and Young (5), assuming the solvent fiim is uniformly distributed. Accorcing to this calculation, the column plate number, N, is related to the total column length, L, and to the length of the cobmn occupied by the solute, d" when it begins to elute:
N = 5.545(L / d,)2
For example, for acrylonitrile in H20, N = 16070, from which i, = 930 mm. The 24 I'L of solvent initially present in the .,olumn is 1.3 mmol; i.e. the solute is dissolved in 1300 I'mol X (d,/ L) = 251'mol of H20. Since 0.051'L of acrylonitrile (1I'mcl) is injected, the mole fraction of solute in solvent at the end of the column is about 0.03. For p-xylene solvent, the sollte mole fraction is about 0.05, and for n-nonane, 0.1. The pncise upper limit of solute mole fraction consistent with effecti'lely infinite dilution solutions is somewhat arbitrary (5). In any case, the concentration of the solution in n-nonane is rath er high, all the more so when one considers that this calculation refers to the most dilute conditions, i.e. just before the solute elutes from the column. The bandwidth on injection should be quite narrow, producing a substantially higher concentration, and that concentration will decrease with the square root of the length of column traveled; the bandwidth will in.,rease in the same way, finally reaching the value d, at the ,mtlet of the column (16). The apparently low values of the ictivity coefficients of n-hexane and n-heptane in nnonan€ could be accounted for in terms of their solutions being at finite concentrations; the fact that the peaks fronted substantiates this. In current work we inject solutions containing only 1--10 I'g of each solute, 0.01-0.1 times the quantity injected to obtain the data reported here.
Although the theory of NSGC does not require a uniform liquid :'ilm as long as the rate of evaporation is constant over time, a second question can be raised regarding whether the solvent wets the capillary tube. If a solvent does not wet the surfacE:, presumably it forms globules and droplets on the surfaCE of the silica (17). According to Grob (18), untreated glass capillary tubes are wet by nonpolar solvents but not by polar f,olvents, presumably including water. Fused silica

Anal. Chern. 1990, 62, 349-353 349
should behave in a similar fashion (19). One way to ·~ompare the uniformity of liquid films would be through the measured plate numbers. Uniform films should produce more efficient chromatographic behavior. However, although more plates were generated in the hydrocarbon solvent systems, since k' values and flow rates were different, a meaningful conparison cannot be made.
It is not obvious either what the effect of nonwettillg would be on the derived activity coefficients, or how to circumvent the problem if the effect is detrimental to their accurE cy. One could start with a fused silica column containing a cms-linked polar phase such as a polyethylene glycol or a prop/lcyanosiloxane, which should be wet by polar solvents such as water, but these phases would of course change solute r'ltention behavior and obfuscate interpretation of the data. This problem is currently under investigation by us.
ACKNOWLEDGMENT We thank C. Wysocki ofBP Research for techni(al assis
tance.
LITERATURE CITED (1) Belfer, A. 1. Ne/tekhimiya 1972, 12, 435; Chem. Abstr. 1973, 78,
20591. (2) Belfer, A. J.; Locke, D. C. Anal. Chem. 1984, 56, 2485. (3) Yang, Y.; Xiao, S.; U, H.; Fu, Y. J. Chengdu Univ. Sci Technol.
1988, No.1, 35; Chem. Abstr. 1988, 109, 157451.
(4) Locke, D. C. Adv. Chromatogr. 1976, 14,87. (5) Conder. J. R.; Young, C. L Physicochemical Measurements by Gas
Chromatography; Wiley: New York, 1979. (6) Laub, R. J.; Pecsok, R. L. Physicochemical Applications of Gas Chro
matography; Wiley: New York, 1978. (7) Thomas, E. R.; Newman, B. A.; Long, T. C.; Wood, O. A.; Eckert, C. A.
J. Chem. Eng. Data 1982, 27, 399. (8) Eckert, C. A.; Newman, B. A.; Nicolaides, G. L.; Long, T. C. AIChE J.
1981, 27, 33. (9) Terasawa, S.; Itsuki, H.; Yamaki, H. Anal. Chem. 1986, 58, 3021.
(10) Itsuki, H.; Terasawa. S.; Yamana, N.; Ohotaka. S. Anal. Chem. 1987. 59,2918.
(11) Craven, J. S.; Clauser, D. E. Analusis 1980,8(1),1. (12) American Institute of Chemical Engineers, Design Institute for Physi
cal Property Data. Project 801, DCAP II Users Guide; The Pennsylvania State University: University Park, PA, 1983.
(13) Ambrose, D.; Lawrenson. I. J. J. Chem. Thermodyn. 1972, 4, 755. (14) Reid, R. C.; Prausnitz, J. M.; Poling, B. E. The Properties of Gases and
Liquids, 4th ed.; McGraw-Hili: New York, 1987. (15) Banerjee, S. Environ. Sci. Technol. 1985, 19,369. (16) LittleWOOd, A. B. Gas Chromatography; Academic Press: New York,
1967; p 127. (17) Jennings, W. Gas Chromatography with Glass Capillary Columns, 2nd
ed.; Academic Press: New York, 1980; p 21. (18) Grob, K. Helv. Chim. Acta 1965, 48, 1362. (19) Jennings, W. Gas Chromatography with Glass Capillary Columns, 2nd
ed.; Academic Press: New York, 1980; p 33.
RECEIVED for review September 1, 1989. Accepted November 22, 1989. This work was supported in part at QC by grants from the National Science Foundation (CHE-8420326) and the PSC-CUNY FRAP Program.
Pulse Voltammetric Techniques at Microelectrodes in Pure Solvents
Malgorzata Ciszkowska and Zbigniew Stojek
Department of Chemistry, Warsaw University, ul. Pasteura 1, 02-093 Warsaw, Poland
Janet Osteryoung*
Department of Chemistry, State University of Ne'JJ York, University at Buffalo, Buffalo, New York 14214
Experimental condHions are described for application of pulse voltammetrlc techniques with microelectrodes in ;olvents containing no deliberately added supporting ele,:trolyte. Elimination of supporting electrolyte was found to bl. advantageous In the case of alkyl iodides, for which su pporting electrolyte strongly influences the voltammetric curves. The primary reduction waves obtained at mercury microel,~trodes were free from phenomena due to adsorption and following chemical reaction. The heights of both linear scan r'~duction and reverse pulse oxidation curves were linearly dependent on ethyl, butyl, and decyl Iodide concentration.
Research on microelectrodes is focused on the ways of preparation, properties, theory, and application 'If these electrodes (1, 2). One of the important propertie3 of microelectrodes is a very low level of current flowing through the electrochemical cell. Consequently, the ohmic dorp (iR) may be very small despite large resistance of the iOlution. Therefore it is possible, with the proper instrumentation, to monitor electroactive species in solvents containing 'Iirtually no added supporting electrolyte (3-8). These conditions can be interesting, since any salt used as the supporting el"ctrolyte can be a source of unwanted impurities in trace analysis and
0003-2700/9010362-0:49$02.50/0
a source of unwanted water in nonaqueous solvents. The first published papers on this subject proved that
obtaining a curve in a pure solvent and measuring its height are possible. However, many bothersome questions remain. First of all, how does ion migration current contribute to the total current? For large-area electrodes it is well-known that at low supporting electrolyte concentrations the reduction signal of positively charged species can be appreciably higher than that at high concentrations. An experimental study done with microelectrodes showed minor changes of the limiting reduction current for Fe(CN)6-3 with a change in supporting electrolyte concentration in water (6). This result is linked to substantially enhanced diffusional transport to electrodes of very small area. On the other hand, it is not surprising that uncharged molecules give wave heights virtually independent of the electrolyte level (3, 4, 6). A recent paper by Oldham deals with theory of microelectrode steady-state voltammetry with various ratios of reactant to supporting electrolyte (9). At a hemispherical electrode, for reactions that engender an increase in ionic strength at the microelectrode interface, the faradaic redistribution of ions is predicted to diminish the ohmic overvoltage. Simultaneously the counterions will be brought into the neighborhood of the microelectrode so effectively that a very low electrolyte concentration can behave as "excess" supporting electrolyte. In the present case of no
© 1990 American Chemical Society

350 • ANALYTICAL CHEMISTRY, VOL. 62, NO.4, FEBRUARY 15, 1990
deliberately added electrolyte, local departure from electroneutrality may shift the autodissociation reaction of the solvent to the right (10).
Another problem is choosing the optimal scheme for potential control and current measurement. Since the currents are very small, a two-electrode system can be used (4,8). In such a system all electrodes exhibit the same ohmic potential drop at steady state (11). Such a simple electrical circuit can be employed for amperometry (12, 13) or other simple electroanalytical techniques. A pulse voltammetric technique in a solvent containing no supporting electrolyte would seem to be much more demanding. First, it is convenient to use a commercial instrument based on a high input impedance potentiostat; second, one has to take into account the cell time constant, to make sure the working electrode has been polarized to the desired potential during the (usually short) pulse time. There are apparently only two reports of pulse techniques applied in a pure solvent, square wave voltammetry of ethylenediaminetetraacetic acid in pure water (7) and differential pulse voltammetry of ferrocene in acetonitrile (14).
A special reason for abandoning addition of a supporting electrolyte is strong interaction of the electrolyte with the substrates or products of the electrode reaction, which complicates the interpretation of the results. This is a commOn circumstance, particularly in the study of organic molecules. We have previously examined the reduction of several alkyl iodides at mercury electrodes under conventional voltammetric conditions (15). The mechanism of the reduction was investigated by employing reverse pulse voltammetry. This provides a partiCUlarly challenging case, for the potential range of interest requires pulse amplitudes of up to 3 V. Thus the test compounds for these investigations were chosen to be decyl, butyl, and ethyl iodide.
Numerous papers have been devoted to electrochemistry of alkyl halides. Those dealing with alkyl iodides at mercury electrodes have been reviewed critically in ref 15 and the references therein. Alkyl iodides are known to produce poorly defined staircase and normal pulse polarographic waves. A large maximum generally appears on the plateau of the waves, and the half-wave potentials shift toward positive potentials with a decrease in the size of the cation in tetraalkylammonium supporting electrolytes. The two-electron process consists of one or two steps, depending on the supporting electrolyte used. Although the electrochemistry of this class of compounds has been studied extensively, some aspects of the electrode process still are not clear.
Mercury electrodeposited on a platinum disk was chosen as the working electrode in the present work, as we had used this electrode successfully previously in aqueous solution without supporting electrolyte (7).
Our first specific objective was to identify solvents that would yield reproducible results. Second, we wished to see if the mercury microelectrode would behave reasonably with large pulse amplitudes in nonaqueous solvent. Third, we wished to test the practical range of pulse amplitude, pulse duration, and analyte concentration over which quantitative results without obvious distortions could be obtained Finally, recognizing deficits in basic physical understanding of such systems, we wished to see what quantitative results could be obtained from these preliminary experiments.
EXPERIMENTAL SECTION Normal pulse, reverse pulse, and linear scan voltammetric
measurements (NPV, RPV, LSV) were carried out with a three-electrode system. Mercury deposited on a platinum microdisk, a saturated calomel electrode (SCE), and a platinum wire served as the working. reference, and auxiliary electrodes, reR spectively. Bare platinum and gold microdisk electrodes were also used in preliminary experiments. The SCE was separated from the cell by a bridge containing pure solvent. A two-electrode
system wa.s also used in some experiments. A number of instrument< were used, but mostly a Laboratomi Pristroje P-03 pulse polarograph, a PARC 173 potentiostat, and a BAS-100 electrochemical :malyzer. The measurements of very low currents were done by connecting a Keithley 427 current amplifier to the electroch 'mical instrumentation by the way described in either ref 7 or rd 16. An IBM/XT Turbo computer (10 MHz) served as astor> ge device for the purpose of background subtraction. Backgrou nd curves were obtained in the absence of analyte and subtractEd point-by-point. The cathodic waves for the alkyl iodides ale not well-separated from the solvent reduction. In the worst ca,e the background current was as large as 50% of the current hr reduction of the alkyl iodide.
Two p .atinum microdisk electrodes of radius r = 12.5 and 1 /Lm were employed. The platinum wires were sealed into glass capillaries according to published procedures (2). Mercury was plated from 0.01 M Hg(I) solution at -D.5 V vs SCE. To control the arnot nt of mercury on the platinum surface, the charge required tc oxidize the mercury was determined after each series of experinents. Usually, the amount of mercury plated on the platinum microdisk (r = 12.5 /Lm) was 48 /LC, which corresponds to 0.49 n nol. (Note that the amount of mercury must be large enough so that the amount removed by anodization is negligible.) We assume this electrode is a segment of a sphere, the radius of the plan, r intersection being the radius, r, of the platinum substrate. The volume of mercury corresponding to 48 /LC is 7.34 X 10⁻⁹ cn'. The volume of the segment of a sphere of radius R = (h2 + (2)/2h is V = 1I"h(3r2 + h2)/6, where h is the height of the segment. Comparison with the experimental volume yields R = 13.3 X 10⁻⁴ em and h = 17.84 X 10⁻⁴ em. The area of this spherica: segment is A = 1I"(h2 + r2) = 1.49 X 10⁻⁵ cm2• It is necessarJ to deal with this geometry rather than the simple hemisph3re because the spherical segment with h > r is more stable n an that with h = r and because it is experimentally impracti ;al to deposit quantitatively each time the amount of mercury equivalent to a hemisphere.
It ha, been shown empirically that the diffusion-limited steady-s1.ate current at such an electrode is described by i" = knFDCr where k is an empirical constant, a function of h/r that has the value 4 when h = 0 and 211" when h = r (hemisphere) (17). The tim" dependence of the current is given approximately by
i = (nFADC/r)(2/(1I"T)'/2 + 1), T S 1 (1)
(2)
where T ,,4Dt/T'. These equations are correct for the hemisphere and COrl ect in first order for a disk. Thus they should be a reasonatle approximation for the spherical segment. For r = 12.5 /Lm and ~ = 17.84 /Lm, k = 8.245 (17).
Befor" the Hg/Pt electrode was inserted into the cell, it was dried by washing with ethyl alcohol and acetone. Mercury electrodes based on a platinum substrate can cause problems in cases whare certain metal mnalgmns are formed, due to formation of internetallic compounds. However, for the purposes of this paper, "hich does not involve any metal deposition, such electrodes a~pear to function reliably (7).
Prop)lene carbonate (Fluka AG) was distilled under vacuum before use. Alkyl iodides were stabilized with metallic copper.
RESULTS AND DISCUSSION Preli minary Experiments. Certainly, not all solvents can
be used in electrochemical experiments without supporting electrol:1;e. There is a limit, which can be expressed in terms of dieleotric constant, E, below which a certain amount of supporting electrolyte is necessary to measure a current response. This limit depends on the electrode area (4, 6, 18) and should also depend on the type of the instrument used. In theSE terms electrochemisty without supporting electrolyte has its :'oots in the measurements in highly resistive media of Lines and Parker, who examined some aromatic compounds in benz,me and chlorobenzene solutions also containing tetrahexyhmmonium salts (19).
Water-dioxane mixtures can COver a wide range of E, so this medium was chosen in this work to determine the experimental limits in pure solvents for the particular electro-

ANALYTICAL CHEMISTRY. VOL. 62, NO.4, FEBRUARY 15, 1990 • 351
EV2
tmax
S
imox
10 20 30
S /mV E1/,1V
90-+0.3
80-+0.4
70-
-+0.5 60-
-+0.6
40 £
Figure 1. E'12 (triangles), 1m., (squares), and slope (circle,) of LSV curves plotted vs dielectric constant of water-dioxane mixtJres: 0.5 mM ferrocene; Pt microdisk radius, 12.5 I'm (empty marks)md 1 I'm (filled marks); T = 25°C.
chemical instrumentation used. Ferrocene served at: the depolarizer. Examining imax, E'I" and the slope, log «id - i)/id),
of the ferrocene wave, we have found that a 12.5-l'm electrode can be used in solvents of E not lower than 10. For, greater than 30 all three measured quantitites changed negli,ibly. In the range 10 < E < 30, the limiting current was still c)nstant, but E'/2 shifted toward positive potentials and the dope increased with decreasing E, as illustrated in Figure J. Substituting a I-I'm Pt disk for a 12.5-l'm electrode wid(·ned the useful range of E. These results agree with the earlie, results of Bond, Fleischmann, and co-workers (4, 18), who applied electrodes of radius even smaller than 1 I'm. Based 'm these experiments, propylene carbonate (PC), a nontoxic liq lid with E = 64.9, appears to be an excellent solvent, and it v'as used in the following investigations. It should be emphasi,ed that these comments apply only for a potentiostat with a mitably high input impedance electrometer (Z > 1011 n, e.g .. P A 03, PARC 173, 174A, and 273). The measurements are impossible otherwise.
Linear Scan Voltammetry. Linear scan voltammetric curves obtained in pure propylene carbonate containhg decyl iodide are presented in Figure 2. Since the curves bre close to the cathodic limit of the potential window, the background had to be subtracted. We assume the dimensionless ;ime for a linear scan experiment is T = D/ntvr2, where v is st:an rate and t = F / RT = 38.9 V-'. For the conditions of Figu:'e 2, the non-steady-state contribution to the maximum current is approximately 19%, based on theory for a disk (2(1). The reduction wave is split, but it exhibits no maximurr. on the plateau. In fact neither adsorption nor convection :naxima appear in the steady state, due to substantial flm. at the surface of the electrode.
The heights of the first and second waves in Figure 2 depend linearly on Decl concentration over the entire range investigated. The ratio of the height of the second "'ave to that of the flrst is approximately unity (l.09), which is evidence for two one-electron reduction steps. This clear situation is the result of the unique property of microelectrodes: The influence of surface phenomena and following cherr-ical reactions is insignificant under these conditions. A though LePerriese et al. (21) have found conditions in mixed solvent that yield well-shaped normal pulse waves for Decl, this regular behavior is strikingly different from the typic al complex response at a conventional mercury drop elect:'ode (5, 21).
Similar behavior is observed for ButI and Et1. Under the conditions of Figure 2, the corresponding calibration plots for the total wave height have slopes ai/aC (nA mM-') = 7.51, 7.09, and 5.78 for EtI, BuI, and Decl, respectively. rhe diminishing slope of the lines in the sequence EtI, Bt:tI, and Dec! corresponds to decreasing values of the respec1 ive dif-
15
10
10 15 20 25 30 1(j' C /mol/drrf
-0.5 -1.5 -2.5 E/ V Figure 2. LSV curves of DecI in PC containing no supporting electrolyte: Cee,I' 0.1, 0.2, 0.4, 0.6, 1.0, 1.7,2.0,2.8 mM: PtIHg microelectrode: v = 20 mV Is; T = 25°C. Inset: first wave height (I) and total height of two waves (II) plotted vs C DecI . Electrode: 481'C of Hg on 12.5-l'm-radius Pt.
Table I. Diffusion Coefficients and Ell' Values of Two LSV Reduction Waves of Etbyl, Butyl, and Decyl Iodide in Pure Propylene Carbonate
E'/,(I) E'/2(2) 10'D, em' s-'
Et! -2.28 -2.59 3.12 But! -2.16 -2.54 2.93 DecI -2.03 -2.48 2.34
fusion coefflcients. From the limiting LSV currents, diffusion coefflcients of alkyl halides could be determined. To do this, the amount of mercury plated on a 12.5-l'm-radius Pt disk was set exactly at 26.8 I'C so that an ideal hemisphere could be formed, and experiments were carried out at a very low scan rate to achieve a steady-state limiting current. We assume the equation describing the limiting steady-state current at this electrode is i", = 2"nFCDr. The diffusion coefficients calculated in this way and the corresponding E'I' values are presented in Table 1.
According to the discussion above, we formulate the steady-state current on the 48-I'C electrode as i" = 8.245nFDCr, from which the slope of the calibration curve at steady state is predicted to be (n = 2) 6.21, 5.83, and 4.65 nA/mM for ethyl, butyl, and decyl iodide, respectively. The experimental values are about 17% higher than the predicted steady-state values, in good agreement with the estimate of non-steady-state diffusion for Figure 2.
Reverse Pulse Voltammetry. According to Bilewicz and Osteryoung (15), the electroreduction of alkyl iodides at mercury electrodes can be described by the reactions
RI + Hg + e- ~ RHg'(ads) + I-
RI + 2e- ~ R- + I-The radical RHg' can dimerize to form HgR, and can react with RI to produce I-. The anion R- can react with proton donors (13, 22) or with reactant:
R- + HD ~ RH + D
R- + RI ~ R2 + I-

352 • ANALYTICAL CHEMISTRY, VOL. 62, NO.4, FEBRUARY 15, 1990
0.0 -1.0 -2.0 E/ V
Figure 3. Reverse pulse voltamrnetry of Dec! in PC containing no supporting electrolyte: Co.,I' 0.1, 0.2, 0.3, 0.5,1,2 mM; t p' 50 ms; delay time (at -2.7 V) = 1 s. Electrode: 48!,C of Hg on 12.5-!,mradius Pt
20
« c
10
5
L"
10 15
0.6
0.2
20 Vtpfms
Figure 4. First and second reverse pulse wave heights and their ratio plotted vs t p 1/2. The current j II for the second wave is measured with respect to ; I' Other conditions are the same as in Figure 3.
If HD is a water molecule, then D- is hydroxide ion. The species r-, OH-, R- and RHg' potentially can yield anodic waves, but in fact only in the presence of iodide and hydroxide ions is the Hg electrode oxidized at more negative potentials than the background oxidation. The adsorbed radical, RHg'(ads), is also oxidized anodically in the presence of iodide. This situation favors choosing RPV as the appropriate technique for monitoring the reduction of RL In addition, RPV can be accomplished easily at microelectrodes, since boundary conditions are readily renewed during the waiting periods between pulses (23). Note that because Hg is oxidized during the pulse period as the RPV curve advances, the size of the electrode and the pulse width must be chosen to avoid a significant decrease in the electrode area.
Typical RP voltammograms of Ded in pure propylene carbonate are presented in Figure 3. The curves are background corrected. The maximum pulse amplitude is 3.7 V. The shape of the curves and well-developed plateau indicate that the electrode was appropriately polarized during the pulses. The DC current (at -2.7 V) is predicted, using the approximations given above, to give the slope aidoi ac = 7.53 nA mM-I The experimental currents are linear in concentration with slope 7.40 nA mM-1.
Two well-formed reverse pulse waves are seen in Figure 3. We deal first with the time dependence of these limiting currents as displayed in Figure 4. The height of the first wave decreases with respect to that of the second at longer times. This suggests that the first wave is due to the reaction of a
-2.8 -2.7 -2.6
-2.4 15 nA
-2.3
+10 0.0 -1.0 -2.0 E/ V -3.0
Figure 5 Reverse pulse voltammetry of 2 mM DecI obtained for various (elay potentials, as pOinted out at the left side of the figure. Conditior s are the same as in Figure 3.
species 'llstable on the time scale of the experiment, probably RHg' (j 5). Detailed interpretation of the time dependence of the HPV data is not possible. However, a few further observations can be made. At a disk, the time dependence of the mverse pulse current for an uncomplicated process has the forro (1/tp'/2 -l/(tp + t,)1/2), where t, is the time at the generat .ng potential (here -2.7 V) and tp the pulse time. For the data of Figure 4, a plot of -iRP vs (l/tp'/L l/(tp + t,)1/2) is lineal with slope 6.22 nA S'/2 and intercept -D.lO nA for the second wave. The first wave also exhibits a linear plot, but the sub:;tantial negative intercept (-D.S nA) suggests the same thing as Figure 4, that a coupled chemical reaction is removing the ma:erial responsible for the current at a rate commensurate 'vith the experimental time scale.
The "xperimental values for the ratio inc/ (inc - iRP) from the data of Figure 3 range from 0.332 (2 mM) to 0.417 (0.1 mM) (i)C at -2.7 V, -iRP at +1.0 V). As inc agrees well with theory, -iRP is increasing with increasing concentration, as found previously for the same general range of time and concen-,ration (15). We speculate that this is caused by the reactio:> of R- with RI to form R2 + 1-.
FronL the analytical point of view the key point is that the reverse pulse wave height is proportional to concentration of alkyl iodide. For the conditions of Figure 4, the slopes of the calibral ion plots are -aiRP/ ac (nA mM-I) = 13.12, 13.56, and 14.29 for decyl, butyl, and ethyl iodide, respectively, and the interce:>ts are 0.01, 0.07, and 0.31 nA, respectively (Sy = 0.34, 0.22, alId 0.06 nA, respectively; r ?: 0.999). The amount of iodide !Jroduced depends sensitively on impurity levels, and hence the slopes of these curves are sensitive to additions of suppor oing electrolyte. These results show that the limiting reverse pulse currents can be used analytically in the absence of supporting electrolyte.
Figure 5 displays reverse pulse voltammograms for the reduction of decyl iodide at various potentials. As the potential s made less negative, the limiting reverse pulse current decreabes, as expected (15). Furthermore, the height of the second anodic wave decreases with respect to that of the first, and th" two waves are no longer distinct. This is consistent with the increasing importance of the radical RHg' at less negatiw reduction potentials. The prominence of the first anodic wave shown in both Figures 3 and 5 at rather high concen' ,rations and long pulse widths suggests that the lifetime of the radical is much more longer under the present conditions than under the usual conditions employing excess supportin!: electrolyte.
The:;e results demonstrate the feasibility of carrying out not on y linear scan but also normal and reverse pulse voltammEtry at platinum-based mercury microelectrodes in solvents of sufficiently high dielectric constant in the absence

An.l. Chern. 1990, 62, 353-359 353
of supporting electrolyte. The spherical segment electrode is well-behaved experimentally even with very laq;e (3.7 V) pulse amplitudes. Furthermore, the limiting cathodic currents agree well with the semiempirical prediction for the spherical segment. The DC and reverse pulse limiting currer t are also proportional to concentration, which suggests that this experimental approach could be useful for in situ m)nitoring of the composition of resistive liquids.
The quality of the experimental results also sug!;ests that it would be worthwhile to develop the necessary rr odels for studying reaction mechanisms by reverse pulse voH ammetry in such systems. In the absence of supporting elect'olyte the lifetime of unstable species is extended because tre solvent medium is more inert. This can offer significant aevantages in the study of complex reaction mechanisms. It may also improve reproducibility of experimental conditicns. The voltammetric response in reverse pulse provides a picture of the reactions occurring (as does the response in cyclic voltammetry). The reverse pulse limiting currents, which are unaffected by iR drop, provide the accuracy and 'elatively simple interpretation characteristic of double pote1tial step chronoamperometry. Particularly in the absence of npporting electrolyte, for which case complicated models are required, it would seem reasonable to focus on analysis of !,otentialindependent currents. Thus reverse pulse voltammetry appears to be an attractive tool for investigating homogeneous reaction mechanisms under these conditions.
LITERATURE CITED (1) Pons, S.; Fleischmann, M. Anal. Chern. 1987, 59, 1391}\.. (2) U1tramicroelectrodes; Fleischmann, M., Pons. S., Rolison, I)., Schmidt,
P. P., Eds.; Datatech Science: Morganton. Net 1987. (3) Howen, J. 0.; Wightman, R. M. Anal. Chern. 1984, 56, 1:24.
(4) Bond, A. M.; Fleischmann, M.; Robinson, J. J. Electroanal. Chern. Interfacial Electrochem. 1984, 168, 299.
(5) Bond, A. M.; Fleischmann, M.; Robinson, J. J. ElectroanaJ. Chern. Interfacial Electrochem. 1984, 172,11.
(6) Ciszkowska, M.; Stojek, Z. J. Electroanal. Chern. Interfacial Electrochem. 1986, 213,189.
(7) Stojek, Z.; Osteryoun9, J. Anal. Chem. 1988, 60, 131. (8) Bond, A. M.; Lay, P. A. J. E/ectroanal. Chern. Interfacial Electfo
chem. 1986, 199, 285. (9) Oldham, K. 8. J. Electroanal. Chern. Interfacial Electrochem. 1988.
250,1. (10) Bond, A. M.; Fleischmann, M.; Robinson, J. J. Efectroanal. Chern.
Interfacial E1ectrochem. 1984, 172, 11. (11) Bruckenstein, S. Anal. Chern. 1987, 59, 2098. (12) Bixler, J. W.; Bond, A. M. Anal. Chern. 1986, 58, 2859. (13) Ghoroghchian, J.; Sarfarazi, F.; Dibble, T.; Cassidy, J.; Smith, J. J.;
Russel, A.; Dunmore, G.; Fleischmann, M.; Pons, S. Anal. Chern. 1986, 58, 2278.
(14) Bond, A. M.; Henderson, T. L. E.; Thormann, W. J. Phys. Chern. 1986,90,2911.
(15) Bilewicz, R.; Osteryoung, J. J. Electroanal. Chern. Interfacial Efectro-chem. 1987, 226, 27.
(16) Huang, H.-J.; He, P.; Faulkner, L. R. Anal. Chem. 1986, 58, 2889. (17) Stojek. Z.; Osteryoung, J. Anal. Chem. 1989, 61, 1305-1308. (18) Pena, M. J.; Fleischmann, M.; Garrard, N. J. E1ectroanal. Chern. In
terfacial E1ectrochem. 1987, 220, 31. (19) Lines, R.; Parker, V. D. Acta Chern. Scan. Ser. B 1977,31,369. (20) Aoki, K.; Akimoto, K.; Tokuda, K.; Matsuda, H.; Osteryoung, J. J.
Electroanal. Chern. Interfacial Electrochem. 1984, 171, 219-230. (21) La Perriere, P. M.; Carroll, W. F., Jr.; Willett, B. C.; Torp, E. C.; Peters,
D. G. J. Am. Chem. Soc. 1979, 101,7561. (22) Andrieux, C. P.; Gilardo, J.; Saveant, J. M.; Su, K. 8. J. Am. Chern.
Soc. 1986, 108,638. (23) Sinru, L.; Osteryoung, J.; O'Dea, J. J.; Osteryoung, R. A. Anal. Chern.
1988,60,1135.
RECEIVED for review September 12, 1989. Acceptsd November 14, 1989. This work was supported in part by the U.S. Office of Naval Research and by Grant 01.17.04.01 from the Polish government. Preliminary results were presented at Euroanalysis VI, Paris, 1987.
Gas Sorption to Plasma-Polymerized Copper Phthalocyanine Film Formed on a Piezoelectric Crystal
Shigeru Kurosawa, Naoki Kamo,- Daijyu Matsui, and Yonosuke Kobatake
Faculty of Pharmaceutical Sciences, Hokkaido ['niversity, Sapporo 060, Japan
Copper phthalocyanine was plasma-polymerized on piezoelectric quartz crystals. The film formed was very stable and resistant to chemical and physicaltreatmenl. Vari,)us spectroscopic data suggested that the essential prol,erties of phthalocyanine remained after the polymerization. A variety of organic chemicals were examined to measure th,~ sorption to the film from the gas phase (in the presence of air). Adsorption of gases to the film decreased the oscillating frequency. Sensitivity was defined as the frequency decrease per 1 pari per million (ppm) of a ceria in gas, and he values ranged from 670 to 0.001 Hz/ppm. Chemicals shoNing high affinity are plane molecules with conjugate double bonds and some polar substituting groups or are higher alcohols, such as vanillin, benzoic acid, aniline, nitrobenzene, phenlll, n-octyl alcohol, 1-nonanol, n-decyl alcohol, benzyl alcoho, DL-camphor, ,6-ionone, naphthalene, and anthracene. The film on the piezoelectric crystals was proved to have a life as I )ng as 60 days. The sensitivity to various chemicals was dep,~ndent on a central metal of phthalocyanine.
* Author to whom correspondence should be address ~d.
0003-2700/90/0362- )353$02.50/0
INTRODUCTION The frequency of vibration of an oscillating piezoelectric
crystal is decreased by adsorption of a foreign substance onto its surface. Sauerbrey (1) derived an equation describing the relationship between frequency decrease and the weight of substances attached to a surface. The detection limit of a 9-MHz oscillating crystal has been estimated to be as low as 10-9 g. By coating the crystal with some absorbent substances, it is possible to construct gas sensors. Since King (2) reported the use of piezoelectric crystals for gas sensors, their features of low detection limit, broad application range, and continuous operation mode have attracted interest (3-14).
Phthalocyanines (Pc) are known to be good adsorbents for various chemicals. In addition, they work as a p-type semiconductor in the presence of oxygen, and adsorption of electronegative gases changes their electric resistance appreciably (15-18). Using this interesting nature of Pc, Barendsz, et al. (19,20), Ricco et al. (21), and Roberts et al. (22) fabricated a surface acoustic wave (SAW) device covered with a thin Pc film and succeeded in obtaining a highly selective and sensitive response to halogen gases and N02 gases. The device was operated at 150 DC, and gradual loss of the film
© 1990 American Chemical Society

354 • ANALYTICAL CHEMISTRY, VOL 62, NO.4, FEBRUARY 15, 1990
occurred, due perhaps to sublimation (19). Thus, a stable coating with long life is necessary.
Plasma polymerization (23) is a promising technique for the making of an ultrathin film on substrata. The coating film formed adheres strongly to the substratum and is highly resistant to chemical and physical treatments. In fact, Cu Pc plasma-polymerized membrane was subjected to repeated use without any loss in the photoinduced reduction of methylviologen (24). An ion-selective electrode made by plasma polymerization showed a long lifetime (25).
These facts imply that the plasma-polymerized membrane works as a long-lived functional thin membrane. Unfortunately, Pc cannot be plasma-polymerized because it is not gaseous in the condition employed for usual plasma polymerization. Osada and his colleagues (24, 26-29), however, developed a method for plasma polymerization using solid chemicals instead of gaseous monomers, provided that a monomer can be sublimed. This technique is the first to sublime a monomer under low pressure and is followed by glow discharge. Pc (24,26), D-camphor (27), L-menthol (27), anthracene (28), dicyclohexyl-18-crown-6 (29), and ammonium tetraphenylborate (25) are reported to be polymerizable. In addition, the plasma-polymerized dicyclohexyl-18-crown-6 membrane showed the same cation selectivity as did the monomer (29). The membrane of plasma-polymerized tetraphenylborate had a negative charge of boron and worked as a good selective membrane electrode for hydrophobic cations (25). This technique of Osada et al. thus broadened the selection of substances to be plasma-polymerized.
In this communication, we report preparation of a plasma-polymerized film of Cu Pc on piezoelectric quartz (bulk acoustic wave (BA W) device) by the method of Osada et al. (24) and measurement of the sorption of 77 organic chemicals, which were evaporated at 25°C in the presence of air. Although Pc is thought to be a good adsorbent, few detailed data on the sorption of various chemicals are available, as far as we know. Hence, we measured sorption of various gases to a plasma-polymerized film on a piezoelectric quartz crystal that is very sensitive to a weight change due to adsorption. Results obtained may serve as basic data for constructing a gas sensor using Pc. Response sensitivity was defined as the frequency decrease per 1 ppm of gas, and the values ranged from 670 to 0.001 Hz/ppm, depending on the species of gas used. Chemicals with high sensitivity were vanillin, benzoic acid, aniline, nitrobenzene, phenol, n-octyl alcohol, 1-nonanol, n-decyl alcohol, benzyl alcohol, DL-camphor, j3-ionone, naphthalene, and anthracene. They are plane molecules having conjugate double bonds and some polar substituting groups or are higher alcohols. If a frequency decrease of 10 Hz is taken as the limit of detection, a response sensitivity of 670 means that 0.015 ppm of gas can be detected. The plasmapolymerized film was proved to be long-lived: For as long as 60 days, no change in the response was observed, while the response of an evaporated film was reduced during the same period of operation. Results in this paper indicate that a piezoelectric quartz crystal covered with plasma-polymerized Pc may be a good device for detection of various organic gases. Preliminary results of a study of the effect of a central ion of Pc on the adsorption of chemicals are reported.
EXPERIMENTAL SECTION Materials. Piezoelectric crystals used were AT-cut quartz,
8 mm x 8 mm x 0.18 mm, with a basic resonant frequency of 9 MHz (Yakumo Tushin, Tokyo). The relationship between frequency decreases and amounts adsorbed on surfaces was examined by application of known amounts of polystyrene or poly(vinyl chloride), and it was found that a decrease of 1 Hz corresponded to 1.58 ng of adsorption, 0.63 Hz/ng. The Cu Pc used was an ultrapure a-type (data of elemental analysis agreed with theoretical values) supplied by Toyo Ink Co. (Tokyo); other Pc having central
::l.
0
~
0 ;::
~
0
10 20 30 40 50 60 PolYleriz,tion Tile sec
Figure 1. 'v1embrane thickness vs period of plasma polymerization. Pc was sublimed at 300-400 °C under an atmosphere of 10.7 Pa of argon, and the discharge power was 100 W at 13.56 MHz. The distance bBtween two electrodes was 3.5 em.
metals different from Cu were the gift of Asada Kagaku Co. (Tokyo). Reagents used were of analytical or guaranteed grade and were purchased from Wako Pure Chemicals (Osaka) or from Tokyo Kasei Co. (Tokyo). The purity of benzoic acid, vanillin, n-decyl aloohol, and j3-ionone, to which this system was highly responsiv" was checked by the melting point (which agreed with those of r ,fs 30-32). Further, benzoic acid was subjected to a vacuum a1 25°C overnight to remove any volatile contaminating impuritie: ..
PlasmlL Polymerization. Cu Pc was plasma-polymerized by a method essentially the same as that described by Osada et aI. (24). The polymerization was performed in a bell-jar reactor in which int,rnal electrodes were installed (Type BP-l, Samuco Internati{.nal, Kyoto, Japan). This apparatus was modified so that it contained a ceramic crucible of 3-mL capacity and a manually )perated shutter located above the crucible. Both were positionec between two electrodes. The crucible was heated with coiled tungsten wire. The temperature was controlled by adjusting the voltage of the heater. The shutter was kept closed prior to sublimati'm, and sublimation was begun when the temperature reached ,00-400 °C at 10.7 Pa of argon. This temperature, however, .vas at the outer surface of the crucible and thus was not equal ;0 that of solid Pc. Without the shutter the film formed was some ~imes granulated and was not uniform. Immediately after the shutter was opened, glow discharge was started. Typical condition:; for the discharge were a distance between electrodes of 3.5 em md a discharge power of 100 W at 13.56 MHz. Membrane thi ,kness was measured by a laboratory-made multiinterferenc,, thickness meter (the use of which was through the generositj of Professor S. Kuriki, Institute of Applied Electronics, Hokkaidc University). The thickness was linearly proportional to the period of polymerization, and 75 nm/ s was observed (see Figure 1) As described below, the thickness of film was also estimatec from the frequency difference before and after the polymeriz,tion. A fIlm of about 0.5-lLm thickness was synthesized on the qlartz surface.
Apparatus. The electric circuit for the quartz oscillator was made with TTL (33). Frequency output was measured by a universal counter (Iwatsu, Model SC7021) that was controlled by a microcomputer (NEC, PC9801), and the signals were also stored in t he microcomputer. The detection limit of the frequency change o' the counter was 1 Hz, and the time base was 1 s.
The cell employed was either batch or flow type, the batch type having a volume of 19.2 mL. After an appropriate volume of organic chemicals (typically 20 ILL or 10 mg) was introduced, the vessel waH closed with a glass-grounded lid and heated with hot air, follo~ ed by incubation in an air bath controlled at 25°C for 3-6 h to ,ttain equilibrium between gaseous and liquid or solid phases. A plasma-polymerized crystal fixed to the glass-grounded lid was ir serted to start the measurement. The concentration of organic compounds in the gaseous phase was calculated from the ideal i:as law by using data of saturated vapor pressure taken

", both ..•.••.••••••.••. ·····1
Li qu i d reservo i r .. _-----------------------------------------------Figure 2. Scheme for flow-type cell experiments.
from refs 30-32. A similar method was employed by )kahata et al. (10).
The flow type cell was constructed in accordance Nith the method of Guilbault and colleagues (8, 9), and an expe,imental setup is shown schematically in Figure 2. An air stream containing organic compounds flowed directly onto both surfac, s of the crystal. Air used as carrier gas was supplied by a vibrating diaphragm air pump and bubbled through a desired organi; solvent to make an air stream containing test organic compour ds. The experiment was performed in an air bath controlled at 2(, °C, and a reservoir for the organic compounds was immersed ir a water bath controlled at 25°C. The flow rate was measurei with a flowmeter and 2.7 L/min was usually employed. No significant effect was observed by the change of flow rate. The conctmtration of organic compounds in the air stream was calculated 'rom the loss of organic compounds in the reservoir divided by th, volume of air bubbled through the reservoir. A desired concentration of evaporated organic compounds was prepared by mixing the air stream containing organic solvent and fresh air.
Calculation of Partition Coefficient, K. The partition coefficient K was defined as
K = Cm/C.
where Cm and C. stand for the concentration of a chemical in the adsorbent film and in the gaseous phase, respectively. C. can be
ANALYTICAL CHEMISTRY, VOL. 62, NO.4, FEBRUARY 15, 1990 • 355
calculated by assuming the ideal gas law. Cm can be calculated as follows:
(M'/Mw)/C M'/Mw Cm=W/Vm= (M'°/p)/C M'0/p
where W stands for the number of moles adsorbed to the membrane on the quartz crystal and equals (M'I Mw) I C. M', Mw, and C are the frequency changes due to adsorption of chemicals, the molecular weight of the chemicals, and the constant describing the relation of the amount of adsorbed chemical to the frequency change of 1 Hz (1.58 ng/l Hz), respectively. Vm stands for the volume of the Pc film, M'0 is the frequency change before and after the polymerization on the crystal, and p is the density of the film (taken to be unity); V m is estimated from the amounts of polymerized Pc. The validity that p is taken to be unity is shown as follows: When 20 ,.,g was polymerized on a surface area of 0.392 em', the thickness was 0.5 ,.,m. Hence p = 20 ,.,gl (0.392 em' X 0.5 ,.,m) = 1.02 g·cm-a
RESULTS AND DISCUSSION Characterization of the Plasma-Polymerized Film.
The film formed is not dissolved by concentrated H,S04 or pyridine, which are good solvents for the monomer. Elemental analysis of the film showed 64.86% C (that of the monomer is 66.72%), 2.75% H (2.80%), and 18.95% N (19.45%), indicating that the values of C and N were smaller than those of the monomer. Elemental analysis data of an evaporated film were not changed from those of the starting material, which were equal to the theoretical values within 0.1 %. These facts suggest the formation of a network of polymer chains.
UV and visible spectra (Figure 3a) showed absorption near 550-700 nm (Davydov splitting) and 320 nm (Soret band), which is characteristic of Pc. The Soret band was not different from that of the vapor-deposited film, but the intensity of the Davydov splitting was reduced. This spectrum change implies that interaction between Pc molecules is weakened and/or the spacing of Pc is increased in comparison with the evaporated film.
Figure 3b shows Fourier transform infrared (FT-IR) data obtained with a Nicolet Model 5DX-S by the diffusion-reflection method, showing that the spectrum of plasmapolymerized film is essentially the same as that of the vapor-deposited Pc except for the broadening: Absorption bands
BOO 1000 ---- - - -. - 2200 1000 1'.00 lOaD aoa ~ao 200 m 600
MAIELENGTH [no [ WAVENUMBERS (em-')
BINDING ENERGY/ ,I
Figure 3. Characterization of the plasma-polymerized film. Here, pp-CuPc means the plasma-polymerized Cu Pc, and a-CuPc and VD-CuPc stand for pure Cu Pc and a vapor-<lepos~ed film of Cu Pc, re,pectively. (a) UV and visible spectra of plasma-polymerized (lower) and vapor-<lepos~ed film (upper). The spectra are shifted vertically for clarity. (b) FT-IR spectra. The higher spectrum is the plasma-polymerized, and the lower is the vapor-<leposaed film. (c) ESCA spectra of plasma-polym>rized (upper) and starting pure Pc (lower). ESCA spectra (using Mg K a) were obtained wah a VG ESCA 3 (VG Scientific, Sussex) wah vacuum of 1 >: 10-9 Torr (1.33 X 10⁻⁷ Pal and X-ray power of 120 W (10 rnA, 12 kV). The assignment of ESCA peaks is shown.

356 • ANALYTICAL CHEMISTRY, VOL. 62, NO.4, FEBRUARY 15, 1990
LL <l I
1400 -
o
on off Ethylaloohol t
10 20 30
TIME / MIN
Figure 4. Typical example of time course of a frequency decrease by the application of 2.78 X 10' ppm of ethyl alcohol. At the time shown by "on", the flow of air containing ethyl alcohol was begun, and at the time shown by "off", ethyl alcohol was purged by a stream of air.
due to C-H stretching near 3000 cm-I, C-H bending at 1740-1370 cm-I , N-H bending near 1600 cm-I, and C=N stretching at 1460-1500 cm-1 are observed, but they are broadening. The ring structure of Pc is reserved in the plasma-polymerized film.
The ESCA (electron spectroscopy for chemical analysis) spectrum (Figure 3c) was essentially the same as that of the starting pure Pc when widely scanned spectra were compared. Detailed comparison showed the presence of 0" in the plasma-polymerized film and the appearance of a component of C" with a higher energy level (data not shown), suggesting the presence of an oxidized carbon chain. Oxygen may be coming from air; plasma-polymerized polymer has radicals, which react with O2 or H20 in air to form OH or COOH groups after the polymer is removed from the reaction bell jar (23). From these facts, we may conclude that the film formed retains the essential features of Pc, although some oxidation may occur.
Osada and his colleagues (24) reported a SEM (scanning electron microscope) photograph of plasma-polymerized Pc (X3000), revealing that the polymerized membrane had a flat smooth surface. The measurement for the surface roughness with the method of Taly-Step showed that the surface roughness was within 3 %. Although their photograph was obtained with the film coated on flat glass, it is likely that the surface of the film coated on the quartz crystal is smooth. This is reasonable because the plasma polymerization proceeds so as to plug depression of the surface (23). The surface of a plasma-polymerized tetraphenylborate membrane formed on a Millipore filter paper was smooth according to the SEM photograph (25), although a Millipore filter has rough surfaces.
Response of Plasma-Polymerized PC. Figure 4 shows typical data of frequency decrease in response to ethyl alcohol at a concentration of 2.78 x 10' ppm. (Here, ppm is defined as 10-<> mol per 1 mol of air as carrier gas.) The decrease reached a steady value about 4-5 min after the onset. Purging of ethyl alcohol with air reversed the frequency change. The rate seemed to be somewhat slower than that of the onset, and the kinetic trace appeared to have two components. The extent of the frequency changes was 1400 ± 70 (n = 5).
The frequency decreases caused by adsorption of ethyl alcohol (2.78 X 10' ppm) were measured by varying the amount of Pc on the crystal. Here, the amount of Pc was estimated from the frequency change due to polymerization on the crystal surface, assuming that a decrease of 0.633 Hz corresponded to 1 ng of adsorption, as described in the Experimental Section. The linear relation held up to 30 ).!g of Pc (data not shown), indicating that the amount of adsorbed ethyl alcohol is proportional to the volume of plasmapolymerized Pc.
Table I shows the frequency change brought about by the ethanol sorption to various coating materials on a crystal
Table I. Comparison of Responses to Ethyl Alcohol When Various Coating Materials Are Used on the CrystalO
film material M,Hz film material M,Hz
plasma-polymerized Pc 1400 plasma-polymerized 60 evaporat<~d Pc 1420 naphthalene polystyrene 600 plasma-polymerized 950 poly(vin) I chloride) 500 tetraphenylborate
none 20
a Amm~nts of coating materials were kept constant at 20 Ilg. None mE ans the quartz surface without any treatment. Experiments wme done with a flow type cell. The concentration of eth~ anol was 2.78 X 10' ppm, and the flow rate was 2.7 L/min.
" :r:
IL
"
7000
5000
3000
1000
,n 0 on " ~(Y<Y" . ~ls( 0
l3.~LJ_--.(J--..c.._--_Q_..o.._o~~a
10 40 60
TIME DAY Figure 5. Long lifetime of plasma-polymerized film on quartz. The frequenc { changes of the oscillator with plasma-polymerized Cu Pc (open circles) and of that with vapor-<leposited Pc film (open squares) in respor se to 1.04 X 10⁵ ppm ethyl alcohol are plotted against the days. After 20 days the response of the deposited film had decreased while no jamage to the plasma-polymerized film was observed. The amounts of Cu Pc in both films were 25 ).!g.
surface. The amounts of coating materials remained constant at 20 ).!g, confirming the benefits of Pc as an adsorption material.
Long Lifetime of Plasma-Polymerized Film. As described in the Introduction, plasma-polymerized film is expected io be long-lived. Figure 5 shows that this expectation proves lobe true. Frequency changes of the oscillator with plasma-polymerized Pc and of that with vapor-deposited Pc film in lesponse to 1.04 X 10⁵ ppm ethyl alcohol were plotted against days. During these experiments (performed at 30 °C), both films were subjected to a daily vapor application and a purge with air (5 L/min). After 20 days, the response of the oscillatcr with vapor-deposited film was lowered, perhaps due to the loss of Pc, while the response of the plasma-polymerized oscillator remained the same for as long as 60 days. The average of the response of the plasma-polymerized oscillator for 60 d,ys was 5852.5 ± 151.9 (mean ± standard deviation).
Sensitivity and Partition Coefficient. Figure 6 shows the linEar relationship between frequency change and gas concentration observed when the flow type cell is used. For chemicds whose evaporation velocity is slow, the flow cell method was not applicable, so we used the batch cell. With this type cell, however, changing of the concentration of test chemicds is difficult, and we therefore assumed a linear relations! ip between the frequency decrease and the concentration. Table II summarizes the magnitude of the frequency decrease of the crystal in response to various organic chemicals. The second column from the right represents the response sensitivity (Hz/ppm), which means the magnitude of the frequency change per 1 ppm. This table indicates that the sensitivity ranges from 670 to 0.001 Hz/ppm and that the present crystal system responds well to benzyl alcohol, nitrobenzene, aniline, naphthalene, benzoic acid, phenol, diphenyl, n-pentyl alcohol, n-octyl alcohol, n-decyl alcohol,

10000 Benzene
Ethy 1 acetate
5000
<l n-Hexa,e
J 10 2]
bas Con cent rat i on x 10 -, / Ppi
10000
5000
<l
bas Concentrat i on xl 0 -2 / PP'
Figure 6. Linear relationship between frequency decreaf,e and gas concentration. Organic solvents used are noted.
iJ-ionone, vanillin, etc. The human threshold valueE (in ppm) for sensation (34, 35) are as follows: benzyl alcoh"l, 5.5; nitrobenzene, 2.7; aniline, 70; naphthalene, 6.8; benzoic acid, 85; phenol, 5.9; n-octyl alcohol, 0.13; iJ-ionone, 73; vanillin, 1.87 x 10⁻⁷• On the other hand, when a 10-Hz change of 'requency is taken as the minimal distinguishable change, the detection limits (in ppm) of the present plasma-polymerized Pc-quartz system are as follows: benzyl alcohol, 0.58; nitroben::ene, 0.78; aniline, 0.70; naphthalene, 0.68; benzoic acid, 0.05:); phenol, 0.67; n-octyl alcohol, 0.32; iJ-ionone, 0.015; vanillin, 0.017. Except for vanillin and n-octyl alcohol, the prese 1t crystal system can detect these chemicals 10 or 100 times more sensitively than man.
The definition and method of calculating the partition coefficient K were described in the Experimental S"ction. In Figure 7, log K values are plotted against the carbon number of the alkanes and corresponding alcohols (Figur e 7 a) and against the carbon number of aromatic or ring ccmpounds (Figure 7b). Figure 7a shows that values of the akohols are larger than those of the corresponding hydrocarbons. For example, a value of octanol is about 178 times that of octane, even though they have the same number of carbon aH)ms. The differences in K between hydrocarbons and corr"sponding alcohols are larger as the number of carbons dec] eases. In Figure 7b, when the hydrogen of benzene is subs',ituted by Cl, OCH3, OH, NH2, NO" or COOH, the sensitivity increases; the difference between benzene and benzoic acid is about 1698-fold. We obtained good correlation betwee:l log K of benzene derivatives and absolute value of Hammei numbers. It is interesting that the absolute value, not thE Hammet number itself, correlates with log K, suggesting trat the polarization of adsorbing molecules is one of the .mportant factors. Thus, molecules having polar substitutions show high
ANALYTICAL CHEMISTRY. VOL. 62, NO.4, FEBRUARY 15, 1990 • 357
:.:
OJ 0
-.J
OJ o
-.J
• 0
0 • • • Al kanes i
0
10 Number of Carbons
1,<1-Oloxtfnq
r$J
V~nlllln
o ,8 -Ionons 0
AnthrtlC(lns 0
o d l-Ctfmphor
NDphthl'l lens
Merro- Me CQl ~
@Me Me Me
CH,
10 12 14 Number of Carbons
Figure 7. Values of log K plotted against number of carbons. (a) Data for alkanes and alcohols. Closed circles represent normal alkanes and alcohols, while open circles represent branched ones. (b) Data for aromatics and some ring compounds. Compound names are written in the figure. Closed circles represent data for (CH,ln-substituted benzene (n = 0-3). The line is a regression line for these closed circles. and it is interesting that the slope of the line in this figure is nearly equal to that of the line of alkanes in part a. The value of K was increased when the H of benzene was substituted by CH" C,H" OCH" NO" NH" OH, CH,OH, and COOH. Squares in both parts a and b were obtained with vapor-deposited film.
affinity for the film. This property is not due to the plasma polymerization, because the vapor-deposited film also displays this property (squares indicate the data of evaporated Pc).
It is very interesting that the slope of the line for the alkanes is equal to that of (CH3)n-substituted benzene (n = 0-3). Analysis of this phenomenon is now in progress in this laboratory. In addition, we found that the values of log K for various compounds can correlate well with some parameters such as Hammet number, Taft number, and modified Small's number. Details will be published elsewhere.
Comparison of Response Sensitivity with Previous Studies. Okahata and Shimizu (10) made a device of piezoelectric quartz covered with multilayers of an amphipathic compound for gas detection. The magnitudes of frequency decrease reported in this paper are about 10 times greater than their values. Since the film thickness and area are almost equal, the partition coefficient of plasma-polymerized Pc is 10 times larger than their values, meaning that Pc is a good adsorbent.
Sanchez-Pedreno et a!. (11) investigated coating materials for detection of nitrobenzene, and various materials such as charcoal, poly(ethylene glycol), quadrol, tetrabase, and triethanolamine gave a frequency decrease of 136-140 Hz in response to 7 ppm of nitrobenzene. The present system gives 90 Hz. It is noted that the basic resonance frequency of their system was 15 MHz, and that of ours is 9 MHz. According

358 • ANALYTICAL CHEMISTRY, VOL. 62, NO, 4, FEBRUARY 15, 1990
Table II. Frequency Change and Sensitivity to Various Organic Compouncso
chemicals !oF conen, ppm sensitivity, Hz/ppm logK chemicals !oF conen, ppm sensitivity, Hz/ppm logK
acetic acid 16160 2.0 X 10' 0.808 4,22 ethyl cycloheJ:ane 10801 1.67 X 10' 0.647 3.85 acetone 4674 2.95 X 10' 0.016 2.58 ethylene glycol 2901 1.32 X 10' 22.0 5.47 isoamyl alcohol 10519 4.70 X 10' 2.24 4.49 ethyl ether 7047 7.28 X 10' 0.010 2.20 n-amyl alcohol 5484 3.67 X 10' 1.49 4.32 n-heptane 1930 6.01 X 10' 0.032 2.59 aniline 7896 5.53 X 10' 14.3 5.27 I·heptanol 4760 5.00 X 10' 9.52 5.00 anisole 12297 4.34 X 10' 2.83 4.51 n-hexane 4194 1.99 X 10' 0.021 2.48 anthracene 779 3.47 224 6.19 I-hexene 3699 2.43 X 10' 0.015 2.34 benzene 9221 1.32 X 10' 0.07 3.04 n-hexyl alcoh ,I 6053 2.12 X 10' 2.86 4.53 benzoic acid 1922 10.2 188 6.27 ,6-ionone 8692 1.30 X 101 667 6.63 benzyl alcohol 2620 1.51 X 10' 17.3 5.29 mesitylene 10416 3.42 X 10' 3.05 4.49 bicyclohexyl 9726 1.97 X 10' 49.4 5.56 methyl alcoh"l 3694 1.68 X 10' 0.022 2.92 n·butyl alcohol 4108 8.47 X 10' 0.485 3.90 methylcyclop,mtane 6041 1.80 X 10' 0.034 2.69 isobutyl alcohol 4437 1.46 X 10' 0.304 3.70 naphthalene 1598 1.09 X 10' 14.6 5.14 sec·butyl 4233 2.66 X 10' 0.16 3.41 nitrobenzene 5415 4.21 X 10' 12.9 5.11
alcohol nonane 3365 6.03 X 10' 0.558 3.73 n·butyraldehyde 6379 1.5 X 10' 0.043 2.86 I-nonanol 1901 3.16 X 101 60.2 5.47 tert·butyl 2707 5.47 X 10' 0.049 2.91 n-octane 2876 1.88 X 10' 0.15 3.21
alcohol 1-octancl 4070 1.32 X 10' 30.9 5.46 DL-camphor 4330 2.66 X 10' 16.29 5.12 l-octene 5964 2.29 X 10' 0.26 3.45 carbon 21339 1.52 X 10' 0.141 3.05 n-pentane 3842 6.74 X 10' 0.006 1.98
tetrachloride isopentane 1117 9.05 X 10' 0.0012 1.32 chlorobenzene 13064 1.50 X 10' 0.87 3.97 3-pentanol 4867 1.15 X 10' 0.423 3.77 chloroform 5387 2.56 X 10' 0.021 2.33 ~·phenethyl alcohol 12823 2.36 X 10' 54.3 5.73 cumene 9327 6.41 X 10' 1.46 4.17 phenol 13354 8.95 X 10' 14.9 5.29 cyclohexane 8251 6.05 X 10' 0.136 2.80 phenyl ether 7419 3.59 X 10' 0.206 3.17 cyclohexanol 3067 1.78 X 10' 1.72 4.32 'Y-picoline 9667 7.89 X 10' 1.23 4.21 cyclohexane- 1679 42.1 39.9 5.58 a-pinene 9056 6.47 X 10' 1.40 4.10
carboxylic I-propanol 6469 2.39 X 10' 0.270 3.74 acid propionaldeh:lde 13231 7.08 X 10' 0.019 2.59
cyc1ohexanone 3384 6.51 X 10' 0.52 3.81 isopropyl alc< hal 4315 5.86 X 10' 0.074 3.18 cyclohexyl· 10219 78.9 130 5.99 propylene glyool 3644 1.58 X 10' 23.1 5.74
benzene pyridine 9564 2.63 X 10' 0.363 3.75 cyclopentane 4732 4.17 X 10' 0.011 2.30 pyrogallol 250 2.33 107 6.02 p-cymene 4401 1.97 X 10' 2.23 4.31 salicylic acid 1787 2.72 657 6.76 decaline 7359 1.03 X 10³ 7.14 4.80 styrene 9353 8.3 X 10³ 1.13 4.12 n-decane 9274 2.08 X 10³ 4.46 4.58 tetrahydrofuran 5894 2.32 X 10' 0.025 2.63 l-decene 6993 2.14 X 10³ 3.27 4.45 toluene 9236 3.30 X 10' 0.28 3.57 n-decyl alcohol 1804 1.84 X 10 97.9 5.88 vanillin 1035 1.73 596 6.68 oMdichloro- 9651 1.80 X 10' 5.35 4.65 water 1333 3.13 X 10' 0.043 3.46
benzene a-xylene 11241 8.76 X 10³ 1.28 4.17 dichloromethane 17971 5.74 X 10' 0.031 2.65 l,4-dioxane 14195 5.26 X 10' 0.27 3.57 ethyl acetate 7700 1.21 X 10' 0.064 2.95 ethyl alcohol 3717 7.76 X 10' 0.048 3.10 ethylbenzene 6957 1.25 X 10' 0.557 3.81
'The concentration (ppm defined as 10" mol/mol of air) was calculated from, apor pressure taken from an appropriate book (31-33), assuming the ideal gas law. The sensitivity is defined as the frequency change diviced by concentration (AF/ppm); i.e. it corresponds to the magnitude of frequency change per 1 ppm. The definition of the partition coeffic: ent is referred to the text.
to Sauerbrey's equation (1), if we use a 15-MHz oscillator Table III. Influence of the Central Metal on log KG covered with plasma-polymerized Pc, the calculated frequency change is 90 X (15/9)' = 167 Hz, which is somewhat larger LllogK than their value of 136-140 Hz. membran!~ l-octanol naphthalene benzoic acid anisole
Guilbault and his colleagues (8) constructed a piezoelectric CuPc toluene sensor capable of detecting 30-300 ppm toluene. A 0.03 1.05 0.88 0.13
similar concentration range of toluene can be detected, al- FePc 0.33 1.08 0.51 0.15 FePor 0.23 0.79 0.40 0.20
though it is noted that the present system is not too sensitive MnPc 0.15 0.85 0.49 1.32 to this substance (see Table II). CoPc 0.02 0.64 0.53 0.07
Effect of the Central Metal. Table III shows the effect PbPc 0.04 0.4 0.31 1.32 of a central metal of phthalocyanine (PC) or tetraphenyl- VoPc 0.39 0.68 0.42 0.09
porphyrin (Por) on the sensitivity of n-octyl alcohol, naph- H,Pc
thalene, benzoic acid, and anisole. The values listed in this G Influence of the central metal of plasma-polymerized Pc or Fe table are all positive, meaning that the presence of central tetraphen;1lporphyrin on log K for I-octanol, naphthalene, benzoic metals increases K. It is very interesting that anisole is ad- acid, and misole. Differences from plasma-polymerized H2Pc are
sorbing at Pb Pc or Mn Pc about 10 times more than other listed.
Pc and that naphthalene is adsorbing at eu Pc or Fe Pc (not Por). The reason is not clear at present. found. Barendsz et al. (19,20), Ricco et al. (21), and Roberts
Concluding Remarks, This paper shows that Pc can be et al. (22 fabricated a SAW device covered with a thin film plasma-polymerized successfully on the surface of piezoelectric of Pc anc succeeded in obtaining a highly selective and sen-quartz and that the film formed is very stable and adheres sitive response to halogen gases and NO, gases. A gradual strongly to the surface. After 60 days of use, no damage was decrease ,)f the sensitivity was found, however, since operation

of the device was performed at 150 oC, and gradual loss of the film occurred, possibly due to the sublimation (1.)). This study suggests that the use of plasma-polymerized Pc on an SAW device may provide a good gas sensor. The r ext aim of the experiment is to show that plasma-polymelized Pc membrane has long life even when it is operated al 150 °C and when halogen gas and NO, gas are applied.
Many organic chemicals show sorption to phthalo ,yanine. Especially, plane molecules having conjugate double bonds and some polar substituting groups or higher alcohols, such as vanillin, benzoic acid, aniline, nitrobenzene, phenol, n-octyl alcohol, 1-nonanol, n-decyl alcohol, benzyl alcohol, DL-camphor, i3-ionone, naphthalene, and anthracene, havl strong affinity to plasma-polymerized Cu Pc film. A chemic!" having several aromatic rings is considered to be a mutagen. It has been shown that Pc and related compounds adsorb a nutagen having aromatic rings (36), which is consistent with th" present data.
The preliminary results on the influence of the cent'al meW of phthalocyanine suggest that there are certain combinations of phthalocyanine and chemicals that show different sdectivity from one another. Carey and Kowalski (12) made In array of piezoelectric crystals whose selectivities for ga:;es were different and attempted to construct a sensor th ,t could identify both quantitatively and qualitatively. For this array, the use of piezoelectric crystals with plasma-polymerized Pc films containing various central meWs would allow realization of a sensitive and stable sensor.
ACKNOWLEDGMENT The authors are indebted to Y. Osada (Ibaraki Uriversity)
for his guidance in plasma polymerization of Pc, to S. Kuriki (Hokkaido University) for permission to use the mllitiinterference thickness meter, and to Y. Sanada and T. Yokono (Hokkaido University) for permission to use their Nicolet FT-IR. We thank Toyo Ink Co. and Asada Kagakn Co. for their generous gift of ultrapure Cu Pc and other Pc, Y. Iijima, JEOL, for discussion of ESCA spectra, and T. K,wasaki, Takasago-kouryou, for teaching us the threshold 1'alues of human odor sensation, Finally, the authors expr.lSS their thanks to reviewers for their invaluable suggestions and comments during the review process.
LITERATURE CITED (1) Sauerbrey, Guanter. Z. Phys. 1959, 155,206-222. (2) King, William, H., Jr. Anal. Chem. 1964,36, 1735-1739. (3) Hlavay, Joseph; Guilbault, George G. Anal. Chern. 1977, 49,
1890-1898.
ANALYTICAL CHEMISTRY. VOL. 62, NO.4, FEBRUARY 15, 1990 • 359
(4) Alder, John F.; MaCallum, John J. Analyst 1983, 108,1169-1189. (5) Guilbault, George G.; Lu, S. S.; Czanderna, A. W. Application of Pie
zoelectric Quartz Crystal Microbalances; Elsevier: New York, 1984; Chapters 8 and 10.
(6) Janata, Jiri; 8ezegh, Andras. Anal. Chern. 1988, 60, 62R-74R. (7) Lai, Colin S. I.; Moody, Gwilym, J.; Thomas, John D. R. Analyst 1986,
111,511-515. (8) Ho, Mat H.; Guilbault, George G.; Rifetz, Bernd. Anal. Chem. 1980,
52, 1489-1492. (9) Ho, Mat H.; Guilbault, George G.; Scheide, Eugene P. Anal. Chim.
Acta 1981, 130,141-147. (10) Okahata, Yoshio; Shimizu, Osamu. Langmuir 1987, 3, 1171-1172. (11) Sanchez-Pedreno, J. A. 0.; Drew, Peter K. P.; Alder, John F. Anal.
Chim. Acta 1986, 182,285-291. (12) Carey, Patrick, W.; Kowalski, Bruce R. Anal. Chem. 1988, 60,
541-544. (13) Edmonds, T. E.; West, Thomas S. Anal. Chim. Acta 1980, 117,
147-157. (14) Elmosalamy, M. A. F.; Moody, G. J.; Thomas, J. D. R.; Kohnke, F. A.;
Stoddart, J. F. Anal. Proc. 1989,26,12-15. (15) Oirschot, Th. G. J. V.; Leeuwen, D. V.; Medema, J. J. E/ectroanal.
Chem. Interfacial Electrochem. 1972, 37, 373-385. (16) Sadaoka, Yoshihiko; Sakai, Yoshiro; Yamazoe, Noboru; Seiyama, Tet
sura. Denki Kagaku 1982, 50, 456-462. (17) Robert, von Ewyk L.; Chadwick, Alan V.; Wright, John D. J. Chem.
Soc., Faraday Trans. 11980,76,2194-2205. (18) Chadwick, Alan V.; Dunning, Patricia V.; Wright, John D. Mol. Cryst.
Uq. Cryst. 1986, 134,137-153. (19) Nieuwenhuizen, Marten S.; Nederlof, Arnold J.; Barendsz, Anton W.
Anal. Chem. 1988, 60, 230-235. (20) Nieuwenhuizen, Marten S.; Barendsz, Anton W. Sens. Actuators
1987, 11, 45-62. (21) Ricco, A. J.; Martin, S. J.; Zipperian, T. E. Sens. Actuators 1985, 8,
319-333. (22) Roberts, G. G.; Holcroft, B.; Ross, J.; Barraud, A.; Richard, J. Bri. Po
Iym. J. 1987, 19,401-407. (23) Yasuda, Hirotsugu. Plasma Polymerization; Academic Press: New
York, 1985. (24) Osada, Yoshihito; Mizumoto, Akira; Tsuruta, Hiroaki. J. Macromol.
Sci. Chem. 1987, A24, 403-418. (25) Kurosawa, Shigeru; Kamo, Naoki; Kobatake, Yonosuke; Toyoshima,
Isamu. J. Membr. Sci. 1989, 46,157-166. (26) Osada, Yoshihito; Mizumoto, Akira. J. Appl. Phys. 1986, 59,
1776-1779. (27) Osada, Yoshihito; Ohta, Fumihiko; Mizumoto, Akira; Takase, Mitsuo;
Kurimura, Yoshlmi. Nippon Kagaku Kaishi 1986, 7, 866-872. (28) Osada, Yoshihito. Membrane (Tokyo) 1985, 10,215-223. (29) Shinkai, Seiji; Ishihara, Midori; Manabe, Osamu; Mizumoto, Akira;
Osada, Yoshito. Chem. Lett. 1985, 1029-1032. (30) Nomura, Toshiaki; Nagamune, T. Anal. Chim. Acta 1983, 155,
231-234. (31) Weast, Robert C., Astle, Melvin, J. Eds. Handbook of Chemistry and
Physics, 69th ed.; CRC Press: Boca Raton, FL, 1988. (32) Asahara, Syouzou, Tokura, Jinichiro, Eds. Solvent Handbook; Kodan
sha Scientific: Tokyo, 1976. (33) Nippon Kagakukai, Ed. Kagaku Binran Kisohen (Chemical Table), 3rd
ed.; Maruzen: Tokyo, 1984. (34) Appell, Lois. Am. Perfum. Cosmet. 1964, 79,25-39. (35) Stahl, W. H. ASTM Data Ser. No. DS 48, 1973. (36) Hayatu, Hikoya; Oka, Takanori; Wakata, Akihiro; Ohara. Yoshiko; Hay
atu, Toshiko; Kobayashi, Hiroshi; Arimoto, Sakae. Mutation Res. 1983, 119, 233-238.
RECEIVED for review May 1, 1989. Accepted October 26, 1989.

360 Anal. Chern. 1990, 62, 360-337
Binding Studies Using Ion-Selective Elt3ctrodes. Examination of the Picrate-Albumin Interaction as a Model System
Theodore K. Christopoulos l
Laboratory of Analytical Chemistry, University of Athens, 104 Solo nos Street, Athens 10680, Greece
Eleftherios P. Diamandis*,2
Department of Clinical Biochemistry, Toronto Western Hospital, 399 Be thurst Street, Toronto, Ontario M5T 2S8, Canada
We are studying the binding of ligands to macromolecules by using ligand ion selective electrodes as transducers. The picrate-bovine albumin interaction is examined in detail as a model system. A picrate ion selective electrode is used to monRor the free picrate concentration directly in the presence of albumin and bound ligand. The binding parameters are estimated and the effect of protein concentration, ionic strength, pH, and temperature is studied. The experimental data are interpreted wHh a specially designed computer program that performs nonlinear least-squares filling of the generalized Scatchard model with an infinite number of classes of binding sites direclly to the raw potentiometric data. The binding parameters (binding constant and maximum number of ligands that can be bound), the nonspecific binding as well as their standard deviations are estimated by this program. The prinCiples described can be used for the potentiometric study of any ligand-binder interaction.
INTRODUCTION The interaction of small molecules (ligands) with biological
macromolecules has attracted increasing interest during the last 20--30 years because it was realized that such interactions are involved in many regulatory and defence mechanisms, in metabolic pathways and in the expression of the pharmacologic action of many drugs. More specifically, it is now well-known that most drugs, during their transport through the blood circulation, bind reversibly to blood constituents, e.g. albumin, globulins, lipoproteins, etc. This binding influences both the intensity and duration of the pharmacologic action because only the free drug is able to reach the sites of the pharmacologic action (receptors) or drug metebolism (1).
All binding studies are focused on the determination of the binding parameters i.e. (a) the maximum number of ligands that can be bound to a macromolecule and (b) the value of the binding constant. Other interesting aspects of binding are the structure of the binding sites and the forces that are involved in this process. The analytical methodology that has been applied to study binding phenomena is used primarily to measure the concentration of either the free (non bound) or the bound ligand, usually under equilibrium conditions, in solutions-mixtures of known total concentration of both the ligand and the macromolecule (binder). These methods are either indirect or direct. In the indirect methods, the amount of bound or free ligand is measured after a physical separation of the two fractions. In the direct methods, this is not necessary because binding results in a change of a
1 Present address: Department of Clinical Biochemistry, Toronto Western Hospital, 399 Bathurst St., Toronto, ON M5T 2S8, Canada.
2 Also: Department of Clinical Biochemistry, University of Toronto, 100 College St., Toronto, ON M5G 1L5, Canada.
0003-2700/90/0362-0360$02.50/0
physical property of the ligand, e.g. in the absorption or emission spectrum.
Examr les of indirect methods include equilibrium (2-4) or dynamic :5) dialysis, ultrafiltration (6), gel filtration (6), and high-performance liquid chromatography (7). Examples of direct m ,thods include absorption, fluorescence, nuclear magnetic resonance, or circular dichroism spectroscopy (2-4).
Ion-selective electrodes (ISE) are electrochemical transducers atle to monitor directly the free ion activity (concentration) ill a solution that contains both the free and the bound form. During the last 15 years, many studies have focused on the factors that affect the ISE response in complex biological so.utions containing proteins and cells like serum and whole blood. These studies address the practical problems of measucing ions like H+, Na+, K+, Cl-, Ca2+, Mg2+, and Li+ in biological fluids without or with minimal sample pretreatment or dilution. Currently, many such ions are measured routinely in biological fluids using ISE, which is now the prefErred methodology over flame photometry (8, 9).
Althocgh the results of monitoring free ion concentration in protein solutions using ISE are very encouraging, the use of such t 'ansducers in binding studies involving proteins as binders a 3d inorganic or organic ions as ligands is very limited. The Mg"- and Ca'+ ISE have been used to study the binding of these ons to bovine and human serum albumin (10, 11). Similar SI udies have been published for Cu'+ (12, 13). In these studies, ;he determination of the binding parameters was carried out either by graphical methods or by least-squares fitting of the hyperbola of the Scatchard plot to the ~xperimental data. Similar methods were used to determme the paramet"rs for the binding of bile acids to bovine serum albumin using an ISE for bile acids (14). An ISE for flufenamic aciel has also been reported and its response studied in the preS(llce of bovine albumin, but no binding parameters were detmmined (15). The ISE for dodecyl sulfate and octyl or decyl :;ulfate were used to study the binding of these ions to bovinE albumin (16) and iJ-lactoglobulin (17), respectively. The estiI1ation of the bound anion was based on the increase of the critical micelle concentration in the presence of the binder.
In thi; paper, we are examining the binding of ligands to macromclecules by using ligand ISE. In order to demonstrate the capabilities of the proposed system, we are using the picrate-hovine serum albumin interaction as a model. A picrate BE (18) is used to monitor the free concentration of the ligan,1 in the presence of albumin. The binding parameters are estimated, and the effect of the protein concentration, ionic strength pH, and temperature on the estimation of the binding )arameters is studied.
We ha ,e also designed a computer program which performs nonlinear least-squares fitting of the generalized Scatchard model (ref 19, infinite number of classes of binding sites) directly ;0 the raw (untransformed) experimental data, i.e.,
© 1990 Arnel lean Chemical Society

ANALYTICAL CHEMISTRY, VOL. 62, NO.4, FEBRUARY 15, 1990 • 361
to the pairs of electrode potential and total ligand concentration. The binding parameters and the nonspecific binding as well as their standard deviations are estimatee by this program.
EXPERIMENTAL SECTION Apparatus. The picrate anion selective electrode "as used
with a single junction Ag-AgCI electrode as the external reference (Orion Model 90-01·00). Potential readings were obtained with a Corning Research pH/mY meter (Model 12) and recorded simultaneously on a strip-chart recorder (Radiometer) "quipped with a high sensitivity unit (REA-ll2). The pH measurements were carried out with a combination glass electrode (Radiometer). A double·walled 50-mL beaker was used as the reaction cell. During binding studies, the temperature was kept constmt (±0.1 °C) and the reaction mixtures were stirred with the aid of a magnetic stirrer.
Reagents. All chemicals used were of analytical reag,nt grade and deionized distilled water was used for solution pre oaration.
Buffers. The buffers used were phosphate, 0.1 M, fer pH 6.5, 7.0,7.4, 8.0, and 11.5 and borate, 0.1 M, for pH 9.0. n e buffers were prepared by dissolving sodium dihydrogen phospha1 e or boric acid and adjusting the pH with a 10 M sodium hydroxid, solution.
Sodium Picrate Stock Solution (0.100 M). Air-dried f,icric acid (22.91 g) (Fluka) was mixed with ~800 mL of water and the pH was adjusted with 10 M NaOH to 6.0. The final volume was then adjusted to 1 L with water. The solution was stored in m amber bottle at room temperature. More dilute solutions were prepared as needed, by dilution with buffer solutions.
Bovine Serum Albumin (BSA) Solutions. Bovine )erum albumin (Cohn fraction V, albumin content 96-99 'Yo, Si,ma) was used. The albumin content of solutions is checked by weighing the residue after drying a certain volume for 2 h at 105 0:c. Dilute BSA solutions for binding studies are prepared in various buffers as needed. These solutions are stored for no more thm a week at 4 °C.
Sodium Picrate-Bovine Serum Albumin Mixed ~'olutions. These are prepared by mixing appropriate volumes of p:crate and BSA solutions, as described in detail later.
Procedures. Picrate-Ion Selective Liquid Membrme Elec· trade. The preparation of the liquid ion exchange, and the characteristics of the picrate ion selective electrode Lave been described elsewhere (18). The liquid ion exchanger consists of the tetrapentylammonium-picrate ion pair, dissolued in 2-nitrotoluene (0.01 M). An Orion liquid membrane elect 'ode body (Model 92) was used as the electrode assembly with the Millipore LCWPO 1300 PTFE porous membrane. The PTFE n,embrane was cut to the appropriate size and a stack of four WLS used to avoid any leakage of the organic phase. The internal reference solution was 0.1 M NaCI-0.Ol M sodium picrate (saturated with silver chloride). When not in use, the electrode was ken in a 10-2
M solution of sodium picrate. Calibration Curve of the Picrate ISE. A 20.0-mL '!olume of
the appropriate buffer solution is pipetted into the thermostated reaction cell, the picrate ISE and the reference elec trode are immersed in it, and stirring at a constant rate is started. After 2-3 min, various increments of a 3.00 X 10⁻² M sodium picrate solution are added. The electromotive force (emf) rendings are recorded after stabilization to ±0.1 mV (it takes about 30 sand remains constant for at least 2 min). The constant tern, E', and the slope, S, of the Nernst equation are calculated by 'egression analysis of the linear part of the graph.
Potentiometric Study of the Picrate-BSA Interection. A 20.0-mL volume of a BSA solution (solution A) in the appropriate buffer is pipetted into the thermostated reaction cell, the picrate-ISE and the reference electrode are immersed in it, and stirring at a constant rate is started. After 2-3 min, an aliquot of a mixed solution that contains sodium picrate (0.0,) or 0.1 M total concentration depending on the experiment) aI.d BSA at a concentration equal to that of solution A is added. The volume added is such that the emfreading becomes equal (==1 mY) to that of the largest emf value of the linear part of the calibration curve (this value corresponds to a 2 X 10⁻⁵ M concer tration of free picrate). Afterward, various increments of the mix.,d solution are added until the emf recorded reaches the lowest value of the linear part of the calibration curve (this corresponds to a 10-2 M
concentration of free picrate). The emf readings are recorded after stabilization to ±0.1 mV following each addition (we typically wait about 30 s but readings remain unchanged for at least 2 min after stabilization). During such binding experiments, the total BSA concentration is kept constant irrespective of the dilution that occurs due to the addition of picrate solution.
THEORY AND CALCULATIONS The free picrate concentration, F, after each addition, is
calculated from the emf readings and the equation of the calibration curve. The bound picrate concentration, B, after each addition, is calculated from the equation
B = T F (1)
where T is the total picrate concentration after each addition. In this work, we use the generalized Scatchard model (19)
to describe the binding phenomena. The protein is considered to have an m number of distinct classes of independent and noninteracting binding sites. Class i contains an ni number of individual sites that have the same affinity for the ligand. The site binding constant, K i, characterizes the sites of the ith class. The concentration of bound ligand, B, is related to the above parameters as shown by eq 2 (19), where P t is the total protein concentration. The second term of this equation takes account for the nonspecific binding of the ligand to the protein molecule, N s being the nonspecific binding parameter (20,21).
m niK;F B = t:l K,FPt + NsF
~-1 + L
(2)
After F is calculated from the calibration curve and B from eq 1, the Scatchard plot is constructed (B/Fvs B). From this plot the Ns parameter can be estimated by performing linear least-squares fitting of the B/ F vs B data which are located at the last part of the plot. In this area, the plot is approximately parallel to the horizontal axis. The estimation of Ns in this manner is based on the fact that if the free ligand concentration becomes too high, the B / F ratio reaches a constant value that is equal to Ns (eq 2).
The knowledge of Ns allows for the construction of the corrected Scatchard plot, which is the plot of Bsp"/ F vs Bsp" (Bsp" specifically bound ligand). The value of Bsp" is equal to B - Ns F. From the corrected Scatchard plot, approximate values for the binding parameters nand K are obtained by using the method of limiting slopes and intercepts described in detail in ref 22 assuming a model with two classes of binding sites. These graphically obtained parameters are used as initial estimates in a nonlinear least-squares fitting process that calculates the statistically "true" values. This process is described in detail below.
Nonlinear Least-Squares Fitting of the Generalized Scatchard Model Directly to the Raw Experimental Data. The total picrate concentration after each addition is selected as the independent variable and the emf as the dependent variable. The binding parameters and the total picrate concentration determine each time the free picrate concentration in the solution and this in turn determines the expected (calculated) emf, E,. Because of the random errors that unequivocally accompany every analytical measurement, the observed emf, Ei, differs from the theoretically calculated one and the following equation holds:
(3)
where ei is the experimental error at the ith emf measurement. The most probable values of the parameters nj' Kj (j = 1, ... , m), and Ns are those that minimize the sum of the squares of residuals.
N N <P = Lw;[Ei - (E,)J2 = LWie? (4)
i=l i=l

362 • ANALYTICAL CHEMISTRY, VOL. 62, NO.4, FEBRUARY 15, 1990
where N is the number of the experimental points and Wi is the statistical weight accompanying the ith emf measurement (Wi = ai·', ai is the standard deviation of the ith emf value). The function <I> is minimized when its partial derivatives with respect to the parametes become zero, i.e.
a <I> jaOI = 0 for I = 1, ... , P (p = 2m + 1) (5)
with 01 = nl for I = 1, ... , m, e1 = KI for I = m + 1, ... , 2m and 02m+1 = Ns. Calculating the partial derivatives from eq 4 and introducing them in eq 5 give
a'" N w·e·a(E ). '*' - 22:: " c, aOI - - i=I---a-o-l-- for I = 1, ... , P
which can be expressed in matrix notation as
JTWe = 0
(6)
(7)
where J is the N X P Jacobian matrix with elements Jij = a(Ec),f aOj (the symbol T as an exponent states the transpose of a matrix), W is a N X N diagonal matrix with Wii = Wii'
and e is the N X 1 vector of the residuals ei' Relationship 6 (or 7) is in fact a nonlinear system of p equations with p unknowns that is solved by an iterative process (23, 24). If 0(0), (EcholO) and e, (Echo are the initial (guess) and the final (solution) parameter vectors, respectively, with the corresponding emf vectors, then a Taylor series expansion about (Ech,o gives
(Ech,o = (Ech"IO) + J!l9 (8)
where terms higher than the first order have been neglected. t:.0 is the parameter correction vector.
Subtituting the vector e from eq 3 into eq 7 yields
JTW[E - (Ech,o] = 0 (9)
After substituting (Ech 0 from eq 8 into eq 9 and rear-rangement yields: '
(10)
Relationship 10 is a linear system of p equations with p unknowns. The correction vector can be provided by solving this system. The new parameter vector is then given by
Oil) = 0(0) + t:.e (11)
When the above algorithm (Gauss-Newton) was applied for the fitting of the Scatchard model to the potentiometric binding data, it did not always converge and many times there was an increase rather than a decrease in the sum of squares of residuals during the iterative process. This happened because this algorithm does not assure that the (JTWJ) matrix will be in each iteration a positive definite. To overcome this problem, we applied the Marquardt-Levenberg modification (25) where the parameter correction vector is calculated by solving the linear system
(12)
where A is a positive number and D a diagonal matrix with elements Dii = (JTWJj".
The iterative process has two loops. In the external one, initial parameter estimates are introduced and the vector of the expected emf values is calculated. The elements of the matrix J and vector e are then calculated and also the sum of the squares of residuals. Afterward, the elements of the (JTWJ) matrix and of the vector JTWe (eq 12) are calculated. At this point, the internal loop is started. An initial value is assigned to the parameter A, the linear system (eq 12) is solved (by the Gauss-Jordan elimination method), and the correction vector t:.0 derived is added to the parameter values yielding better values. The new value of <I> is then calculated and is compared with the previous one. If it is greater, then the
> E ui
6 4
-logT
Figure 1. Calibration curves of the picrate ISE (1) and a plot of emf vs -log T in the presence of BSA at a concentration of 32.0 giL (2).
internal loop is repeated by increasing A until an acceptable correction vector (which will decrease <I» is yielded. In this case, the internal loop closes and a new external loop is started by entering the new parameter values as starting ones. The iterative process is terminated (converged) when the corrections of che parameters are less than 0.01 % of their current values. 'l.n interactive computer program written in BASIC (for the IBM PC and for the AMSTRAD CPC computers) perform,; the potentiometric binding data treatment, i.e., the calibration of the electrode, the calculation of the initial estimates of the binding parameters, and the nonlinear leastsquares fitting. In addition, the calibration graph, the saturation plot, and the Scatchard plot are also constructed by the computer along with the corresponding calculated curves. Furthermore, the user has the option to fit several Scatchard models (variable number of classes of sites) searching for the best OnE without reloading the binding data.
The c l.lculation of the expected emf value for each experimental)oint is carried out by first estimating the free picrate concent! ation as a function of the total picrate concentration and of t he current values of binding parameters. This is accompl:shed by the Newton-Raphson approximative method (26) ane is described in Appendix A. In Appendix B, the calculati on of the partial derivatives of the electrode potential with respect to binding parameters is presented for the general form of the Scatchard model (infinite number of sites).
RESULTS AND DISCUSSION The principle of the application of ion-selective electrodes
for the SI udy of the binding of ionic ligands to macromolecules (e.g. proteins) is based on the fact that in a solution containing protein molecules, free ionic ligand, and protein bound ionic ligand, t 1e ISE responds only to the free ionic ligand species. Because of their highly hydrophilic character, neither the protein. nolecules nor the protein-bound ions can penetrate into the organic solvent of the electrode membrane to cause a chang" in the emf.
A tyP) cal calibration curve (E vs -log F) of the picrate ISE as well as a plot of the emf vs -log T in the presence of BSA are pres,:nted in Figure 1. Once the picrate binds to albumin it canno: be sensed by the electrode; thus, the observed emf is much higher in the presence of albumin (curve 2), in comparison :0 the same total picrate concentration and absence of albumin from the measuring solution. The theoretical slope of the emf vs log T curve is given at any point by the derivative of the emf with respect to log T. The following equation holds (chain nle):
dE dE d(log F) aF dT
;l(log T) = d(log F) ~ aT d(log T) (13)

ANALYTICAL CHEMISTRY, VOL. 62, NO.4, FEBRUARY 15, 1990 • 363
Table I. Influence of the Protein Concentration Oil the Binding of Picrate to BSA'
BSA, giL
20.0 32.0 50.0
1.64 (0.02) 1.83 (0.04) 1.70 (0.03)
39.0 (1.1) 42.1 (0.8) 37.7 (0.9)
"" 4.7 (0.2) 4.9 (0.1) 4.4 (0.1)
0.89 (0.04) 0.92 (0.03) 0.93 (0.04)
Ns
0.27 (0.07) 0.39 (0.01) 0.59 (0.01)
0.2 0.1 0.2
a Numbers in parentheses are the standard deviation~ of the parameter values. b SDre is the standard deviation of residuals as defined in the text.
Table II. Influence of Ionic Strength on the Binding of Picrate to BSA'
[NaCl],M nl 10-3K l , M-l n, 10-3K" M-l Ns
0.01 1.60 (0.04) 36.9 (1.5, 4.2 (0.1) 1.27 (0.09) 0.21 (0.01) 0.3 0.1 0.3 0.3
0.05 1.67 (0.03) 34.5 (0.9. 4.6 (0.1) 1.00 (0.05) 0.28 (0.01) 0.10 1.78 (0.02) 32.2 (0.5, 5.0 (0.1) 0.91 (0.03) 0.20 (0.01) 0.20 1.74 (0.04) 28.3 (0.8, 3.6 (0.1) 1.09 (0.09) 0.26 (0.01)
a See footnote of Table I for further explanations ane abbreviations.
Table III. Effect of pH on the Binding of Picrate to BSA'
pH nl 10-3Kl>M-l n,
6.5 2.03 (0.02) 44.4 (0.9) 5.4 (0.1) 7.0 1.83 (0.02) 42.1 (0.8) 4.9 (0.1) 7.4 1.63 (0.02) 38.7 (0.8) 4.7 (0.1) 8.0 1.58 (0.01) 39.4 (0.5) 5.2 (0.1) 9.0 1.39 (0.03) 40.4 (1.3) 3.3 (1.0)
10.0 1.54 (0.05) 26.3 (1.4) 5.7 (1.0) 11.5 1.60 (0.03) 20.3 (0.7) 10.3 (0.5)
a See footnote of Table I for further explanations and abbreviations.
Given that dE/d(log FI = S, d(log FI/dF = 1/2.3F, and dT/d(log T) = 2.3Twe have
~=sT..aF (14) d(log T) FaT
Equation 14 is general. When no binder (BSA) is present, T = F and the slope of the E vs log T curve equal; the electrode slope. In the presence of a binder, the de ,ivative is calculated by substituting T and aF / aT from eq Al and A2 (Appendix A) into eq 14 which finally gives
m n-KF 2::1 ' K' FPt + (Ns + I:F
dE ,=1 + i --- = S ---'----- (15) d (log T) m nKF
2:: " Pt (Ns + 1,F i=l(l + K;F)2
In eq 15, the denominator is always smaller thEn the numerator because the term 1 + K;F > 1. Therefore dE/d(log T) is always greater or equal to S in absolute terms, in the presence or absence of the binder, respectively (se" Figure 1, curves 2 and 1). The above equations hold only in the area of linear response of the electrode. A simple graphical way for the calculation of the free ion concentration after each addition is also shown in Figure 1. The B/ F ratic (ordinate of Scatchard plot) is then directly derived from the equation
B/F = lO-ilE/s - 1 (16)
where till is shown in Figure 1 and S is the electlode slope. The binding of picrate to BSA was studied at three different protein concentrations, i.e. at 20.0, 32.0, and 50.0 giL.,. Typical Scatchard plots are presented in Figure 2. It is obvious that at high picrate concentration, the plots, instead of htersecting the horizontal axis at points indicating the total concentration of binding sites, become parallel to the axis due to the nonspecific binding of picrate to BSA. In Table I, we present the values of binding parameters as estimated by nonlinear least-squares fitting of the Scatchard model with ';wo classes
1a-3K" M-l Ns SDre,mV
0.78 (0.03) 0.42 (0.01) 0.1 0.92 (0.03) 0.39 (0.01) 0.1 0.88 (0.04) 0.27 (0.01) 0.1 0.78 (0.02) 0.32 (0.01) 0.1 1.25 (0.08) 0.39 (0.01) 0.2 0.43 (0.10) 0.13 (0.01) 0.5 0.22 (0.02) 0.4
30
25
20
B/F 15
10
2 3 4 5 6 7 8 9 10 12
B(x 103),M
Figure 2. Potentiometric study of the binding of picrate to BSA at different BSA concentrations: Scatchard plots at BSA concentrations of (L>.) 20.0, (e) 32.0. and (0) 50.0 giL. The theoretical Scatchard curves (parameter values taken from Table I) are drawn over the experimental pOints.
of binding sites to the experimental data. It can be observed that the number of binding sites and the binding constants are practically independent of protein concentration. The last column of Table I shows the standard deviation of residuals calculated after the convergence of the iterative process. These numbers are of the same magnitute as the expected error in the measurement of the emf providing strong evidence that the model chosen is correct.
The influence of ionic strength on the binding was studied at a constant BSA concentration of 32.0 giL by adding NaCl at final concentrations of 0.01, 0.05, 0.10, and 0.20 M. Scatchard plots at various ionic strengths were constructed in a manner similar to that of Figure 2. The values of binding parameters are presented in Table II. Ionic strength does not affect significantly these values. The dependence of picrate/BSA association on the pH was studied at a BSA concentration of 32.0 giL using the appropriate buffers. Scatchard plots at various pH values were constructed in a
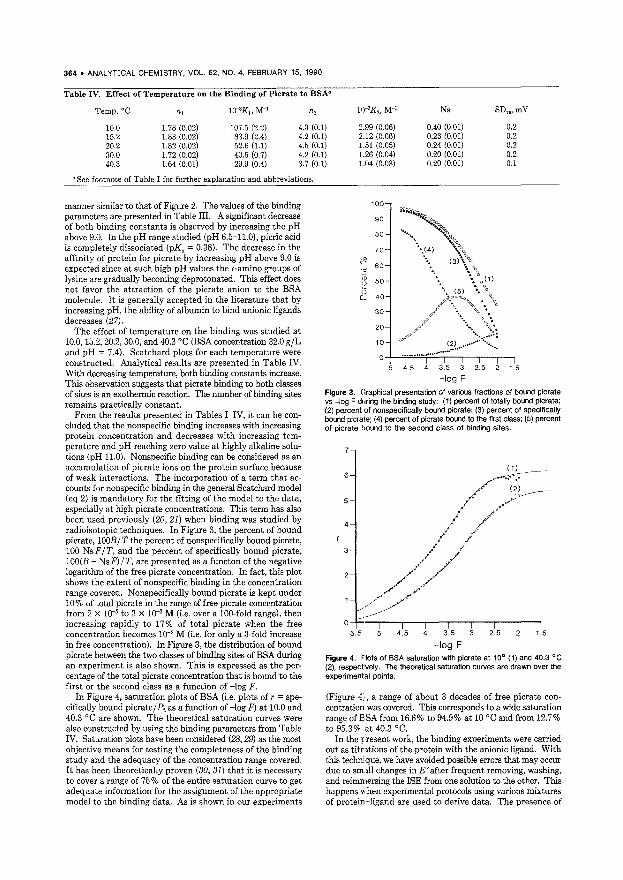
364 • ANALYTICAL CHEMISTRY, VOL. 62, NO.4, FEBRUARY 15, 1990
Table IV. Effect of Temperature on the Binding of Picrate to BSA'
Temp,oC nl lO-3KlI
M-l n, l<)-'K"M-l Ns SDw mV
10.0 1.78 (0.02) 107.5 (2.2) 4.3 (0.1) 2.99 (0.06) 0.40 (0.01) 0.2 15.2 1.83 (0.02) 83.9 (2.4) 4.2 (0.1) 2.12 (0.06) 0.23 (0.01) 0.2 20.2 1.82 (0.02) 52.6 (Ll) 4.5 (0.1) 1.51 (0.05) 0.24 (0.01) 0.2 30.0 1.72 (0.02) 40.5 (0.7) 4.2 (0.1) 1.26 (0.04) 0.20 (0.01) 0.2 40.3 1.64 (0.01) 29.9 (0.4) 3.7 (0.1) 1.04 (0.03) 0.20 (0.01) 0.1
a See footnote of Table I for further explanation and abbreviations.
manner similar to that of Figure 2. The values of the binding parameters are presented in Table III. A significant decrease of both binding constants is observed by increasing the pH above 9.0. In the pH range studied (pH 6.5-11.0), picric acid is completely dissociated (pKa = 0.38). The decrease in the affinity of protein for picrate by increasing pH above 9.0 is expected since at such high pH values the ,-amino groups of lysine are gradually becoming deprotonated. This effect does not favor the attraction of the picrate anion to the BSA molecule. It is generally accepted in the literature that by increasing pH, the ability of albumin to bind anionic ligands decreases (27).
The effect of temperature on the binding was studied at 10.0, 15.2, 20.2, 30.0, and 40.3 °e (BSA concentration 32.0 giL and pH = 7.4). Scatchard plots for each temperature were constructed. Analytical results are presented in Table IV. With decreasing temperature, both binding constants increase. This observation suggests that picrate binding to both classes of sites is an exothermic reaction. The number of binding sites remains practically constant.
From the results presented in Tables I-IV, it can be concluded that the nonspecific binding increases with increasing protein concentration and decreases with increasing temperature and pH reaching zero value at highly alkaline solutions (pH 11.0). Nonspecific binding can be considered as an accumulation of picrate ions on the protein surface because of weak interactions. The incorporation of a term that accounts for nonspecific binding in the general Scatchard model (eq 2) is mandatory for the fitting of the model to the data, especially at high picrate concentrations. This term has also been used previously (20,21) when binding was studied by radioisotopic techniques. In Figure 3, the percent of bound picrate, 100B/Tthe percent of nonspecific ally bound picrate, 100 NsF/T, and the percent of specifically bound picrate, 100(B - NsF)/T, are presented as a functon of the negative logarithm of the free picrate concentration. In fact, this plot shows the extent of nonspecific binding in the concentration range covered. Nonspecifically bound picrate is kept under 10% of total picrate in the range offree picrate concentration from 2 X 10⁻⁵ to 3 X 10⁻³ M (i.e. over a 100-fold range), then increasing rapidly to 17 % of total picrate when the free concentration becomes 10-2 M (i.e. for only a 3-fold increase in free concentration). In Figure 3, the distribution of bound picrate between the two classes of binding sites of BSA during an experiment is also shown. This is expressed as the percentage of the total picrate concentration that is bound to the first or the second class as a function of -log F.
In Figure 4, saturation plots of BSA (i.e. plots of r = specifically bound picrate/?, as a function of -log F) at 10.0 and 40.3 °e are shown. The theoretical saturation curves were also constructed by using the binding parameters from Table IV. Saturation plots have been considered (28,29) as the most objective means for testing the completeness of the binding study and the adequacy of the concentration range covered. It has been theoretically proven (30, 31) that it is necessary to cover a range of 75% of the entire saturation curve to get adequate information for the assignment of the appropriate model to the binding data. As is shown in our experiments
100 ~~~
90 ~f.~:~ 80 ........ • .. ··~;'Po
70 .... • ••• ~'b
'.(4) \\ ,g
60 .... (3)\"0
~ "0 ,jj
50 \"'0(1) <)
~5 .... (5) + •• 0\, L 40
~J~~ 30
20
10
0
4.5 3.5 3 2.5 1.5
-log F Figure 3. Graphical presentation of various fractions of bound picrate vs -log F dllring the binding study: (1) percent of totally bound picrate; (2) percent of nonspecifically bound picrate; (3) percent of specifically bound picrate; (4) percent of picrate bound to the first class; (5) percent of picrate bound to the second class of binding sites.
6
5
4
3 ...• / /'
/
(1) __ _
/~
// :~:.-------
//
~/ o-f---rl ---rl---rl---rl---rl---rl---'--'I
5.5 5 4.5 4 3.5 3 2.5 1.5
-log F Figure 4. Plots of BSA saturation with picrate at 10° (1) and 40.3 °C (2), respectvely. The theoretical saturation curves are drawn over the experiment31 paints.
(Figure 4;, a range of about 3 decades of free picrate concentration was covered. This corresponds to a wide saturation range of ESA from 16.6% to 94.9% at 10°C and from 12.7% to 95.3% at 40.3 °e.
In the r resent work, the binding experiments were carried out as titr ,tions of the protein with the anionic ligand. With this technique, we have avoided possible errors that may occur due to smlll changes in E' after frequent removing, washing, and reimmersing the ISE from one solution to the other. This happens ",hen experimental protocols using various mixtures of protein-ligand are used to derive data. The presence of

BSA in the reaction mixture did not change the tirr. e needed for the stabilization of the electrode potential (to ,,0.1 m V) after each addition of picrate «30 s). Therefore, it can be concluded that the picrate-BSA association is a rapid reaction completed in less than 30 s. In order to prove that the presence of protein does not cause any deleterious effect to either the picrate ISE membrane or the liquid junct on of the reference electrode, we performed calibration curves before and immediately after binding experiments carried out at a 50 giL BSA concentration. The values for the conS1.ant term of the Nernst equation were -72.1 and -72.6 m V md those for the electrode slope were -59.1 and -59.4 mV/decade before and after such binding experiments, respectivel). These findings also suggest that there is no significant drift of the electrode response during a compete binding experiment (lasting approximately 60 min).
The contribution of BSA to the ionic strengt h of the measured solution can be estimated by assuming that the negative charges on the protein molecule (~17 at pI-: 7.4) (27) behave like monovalent anions (11). Therefore, a bovine serum albumin concentration of 7.46 x 10⁻⁴ M (50 giL), which is the maximum concentration used in our experimerts, causes an additional ionic strength of I = 6.3 X 10⁻³ M in the measured solution. This contribution is not significan; because all experiments were performed in 0.1 M buffer wlutions. From these findings, it is concluded that the activity (oefficient of the anionic ligand is practically the same in the presence or absence of BSA. It is thus possible to calculat" the free picrate concentration in BSA solutions by directly using the equation of the calibration curve.
One contribution of the present work is that it Fovides a complete and statistically correct treatment of poter tiometric data for studies involving the interaction of ionic lig,mds with macromolecules. Earlier treatments of potentiometric binding data have been based either on graphical procedurf's (10-12) or on least-squares treatment (13, 14) by using BIPt as the dependent variable and F as the independent variable. There are many graphical approaches that are commonly used for the analysis of such data e.g. the Scatchard plot (19), the Benesi-Hildebrand plot (32), the Klotz plot (33), ani the Hill plot (34). These methods facilitate transformation of the data into a straight line representation. However, a stnight line only results under the simplest binding reaction mechanism and these methods do not generalize to more complicated binding models (e.g. for two or more classes of E ites). In addition, the graphical analysis of results always contains some degree of subjectivity. Calculation of binding parameters by least-squares treatment is generally the recommended method. However, the choice of the dependent and indeperdent variables is important for the purpose of satisfying "tatistical guidelines. A regression analysis has to be perfor med with the assumption that the independent variable is Error-free. In the case of potentiometric data, assuming that the uncertainty in the emf measurement is O"E (constant) and applying the error propagation law (35), we can cakulate the uncertainties of the coordinates (B I F and B) of the :,catchard plot as follows
and
2.30"ET fJ(B/Fi = -S-p
where S is the electrode slope.
(17)
(18)
In Figure 5, a simulated Scatchard plot is shown along with the experimental uncertainties which are caused by an error of O"E = 2 m V in the measured electrode potential. The bars
ANALYTICAL CHEMISTRY, VOL. 62, NO.4, FEBRUARY 15, 1990 • 365
50 11 'J
40 1r AT l\T
30-t\;
B/F .0, 20- \T
1\
10
o 0.5 1.0 1.5 2.0 2.5 3.0
B(x 103).M
Figure 5. A simulated Scatchard plot along with the experimental uncertainties caused by an error of O"E = 2 mV in the emf measurement: n, = 2; K, = 50000 M-'; n2 = 5; K2 = 1500 M-'; P, = 4.78 X 10⁻⁴ M.
shown correspond to 1 standard deviation on both the ordinate and the abscissa of the plot. From eqs 17 and 18 and from Figure 5, it is clear that the measurement errors appear in both the independent and the dependent variable and, also, are highly correlated and nonuniform.
For these reasons, the application of common least-squares programs (linear or nonlinear) directly to the Scatchard plot coordinate system is always statistically incorrect and often yields results which are inferior even to those obtained by graphical techniques. The plots of B vs F or FIB vs F as well as the double reciprocal plot (liB vs II F) are for the same reasOns inappropriate for direct regression analysis even if a simple straight line represents the experimental data.
In this work, the original (untransformed) raw potentiometric data, i.e., the electrode potential vs total ion concentration were analyzed by nonlinear least-squares treatment. In this system, the independent variable is practically error-free and the measurement error is restricted to the dependent variable (emf). We used graphical techniques (Scatchard plots) only for presentation of the data and for making initial estimates of the binding parameters. A list of the computer program with sample data and outputs can be obtained by writing to the authors.
The picrate binding to serum albumin was first studied by Teresi and Luck (36) using equilibrium dialysis. A very narrow total picrate concentration range (from 5.0 X 10⁻⁷ to 2.5 X 10-<; M) was covered. Therefore, a model of only one class of binding sites was assumed. Parameter values of n = 6 and K = 1.26 X 10⁵ M-l were found by a graphical technique.
Analytical application of the picratel albumin association was first reported by the authors (37, 38). In these reports, the picrate ISE was used for the quantitative determination of albumin in plasma, serum, and whole blood but the estimation of binding parameters was not performed.
The application of ion selective electrodes for the study of the binding of ions to biological macromolecules offers a number of significant and unique advantages over the existing methodologies. First, the measurement of the free ion in the presence of the bound ion is carried out continuously without the need for separation procedures and without any disturbance of the chemical equilibrium of the system. Furthermore, binding studies can be accomplished in a wide concentration range since ISE response usually covers about 3 decades of the free ion concentration (range of 10-5 to 10-2
M is typical for most liquid-membrane ISE). In addition, by

366 • ANALYTICAL CHEMISTRY, VOL. 62, NO.4, FEBRUARY 15, 1990
the proposed "titration" technique, a large number of experimental points can be obtained in a short time (30-60 s per experimental point). Finally, this method is especially useful in cases where binding does not entail changes of the spectral characteristics of either the macromolecule and/ or the ligand. A disadvantage of the proposed potentiometric method is that it does not provide direct information about the nature of the binding sites and of the interactions that are responsible for the phenomenon. It is mostly useful for the estimation of binding parameters.
The picrate-albumin association was used in the present study only as a model. The method described can be extended for any ion-macromolecule interaction. Especially, in view of the many drug ion selective electrodes that have been reported in the literature (39), we suggest the use of the above potentiometric methodology for the study of the binding of drugs to serum proteins.
APPENDIX A, Calculation of the Free Ion Concentration, During
the iterative nonlinear fitting process, it is necessary to calculate the free ion concentration corresponding to each experimental point, whenever new parameter values are derived. From the current binding parameter values and the total ion concentration at each experimental point, the free ion concentration is calculated by solving the equation
m n·KF T = L --'----K' FPt + (Ns + l)F (AI)
i=1 1 + i
using the Newton-Raphson method of successive approximations (26).
We start the calculations from the last experimental point (highest total ion concentration) and use this value as initial guess. For the other points, the calculated free concentration of the previous point is taken as initial guess. The general expression of the derivative of T with respect to F at the ith point is
aT, m njKjPti - = 1 + L + Ns (A2) aF, j=1 (1 + KjF;l'
B. General Expressions for the Partial Derivatives of the Electrode Potential with Respect to the Binding Parameters, The expressions shown below have derived for any number of binding sites and include the case of nonspecific binding. The following equation holds (chain rule)
aEi dEi d(log F;l aFi -=----- (B1) aOj d(log F;l dFi aOj
j = 1, ... , 2m + 1
i = 1, ... ,N
where OJ are the binding parameters. Derivatization of the Nernst equation and substitution to eq B1 give
aEi S aFi
aOj 2.3Fi aOj (B2)
The partial derivatives of F with respect to the binding parameters are calculated indirectly as follows:
aTi/aFi
Combination of eqs B2 and B3 gives
aEi S a Ti/aOj aOj = - 2.3FiaTi/aFi
(B3)
(B4)
The partial derivatives of T with respect to the parameters are calcu ated by derivatizing eq Al with respect to n and K, respectively
aTi KjFiPti anj 1+ KjFi
(B5)
aTi njFPti
aKj (1 + KjFi)' (B6)
The partial derivative of T with respect to Ns is
aTi/aNs = Fi (B7)
By su\;stituting the aT'; aFi, aT'; anj, aT'; aKj, and aT'; aNs from eq£ AI, B5, B6, and B7, respectively, to eq B4, the following analytical expressions for the partial derivatives are obtained
2,3 (1 + KjF;l [1 + r: nlKIPti + NS] 1=1(1 + KF)'
SnjPti
aEi S aNs =-
Registry No. Picric acid, 88-89-1.
LITERATURE CITED
(B8)
(B9)
(BlO)
(1) Reidlmberg, M. M.; Erill, S. Drug Protein Binding; Clinical Pharmacology and Therapeutics Series Vol. 6; Praeger: New York, 1984.
(2) Drug-Protein Binding. In: Ann. N.Y. Acad. Sci. 1973, 226 Anton, A. H. t Solomon, H. M., Ed.; collected papers of the conference on Drug Protein Binding of the New York Academy of Sciences, Jan 197:.
(3) MeYfJr, M. C.; Guttman, D. E. J. Pharm. Sci. 1968, 57, 895-918. (4) Vallner, J. J. J. Pharm. Sci. 1977, 66, 447-465. (5) Spar'ow, N. A.; Russell, A. E.; Glasser. L. Anal. Biochem. 1982, 123,
255- 264. (6) Kurz H.; Trunk, H.; Weitz, B. Arzneim.-ForschIDrug-Res. 1977, 27,
137:-1380. (7) Sebille. S.; Thuand, N.; Tillement, J. P. J. Chromatogr. 1981, 204,
285-291. (8) Proc3edings of the Workshop on Direct Potentiometric Measurements
in BIJod; Kock, W. F.; Ed.; National Bureau of Standards: Gaithersburg MD, May 1983.
(9) Czatan, J. D. Anal. Chern. 1985, 57, 345A-356A. (10) Frye R. M.; Lees, H.; Rechnitz, G. A. C/in. Biochem. 1974, 7,
258- 270. (11) AndErsen, N. F. Clin. Chern. 1977, 23, 2122-2126. (12) Naik, D. V.; Jewell, C. F.: Schulman, S. G. J. Pharm. Sci. 1975, 64,
124,-1245. (13) Mohanakrishnan, P.; Chignell, C. F. J. Pharm. Sci. 1982, 71,
118(-1182. (14) Vadrere, M.; Lindenbaum, S. Int. J. Pharm. 1982, 11,57-69. (15) Kiryt, S.; Oda, Y.; Sasaki, M. Chern. Pharm. Bull. 1983, 31.
108,-1091. (16) Bjrc~, B. J.; Clarke, D. E.; Lee, R. S.; Oakes, J. Anal. Chim. Acta
1974,70,417-423. (17) Kresleck, G. C.; Constantinidis, l. Anal. Chem. 1984, 56,152-156. (18) Hadjiioannou, T. P.; Diamandis. E. P. Anal. Chim. Acta 1977, 94.
443-447. (19) Scat;hard, G. Ann. N. Y. Acad. Sci. 1949. 51. 660-673. (20) Pri~n, R. L.; Rosenthal, H. E. Anal. Biochem. 1976, 70, 231-240. (21) Mum-on, P. J.; Rodbard, O. Anal. Biochem. 1980, 107,220-239. (22) Klotz, I. M.: Hunston, D. L. Biochemistry 1971, 10, 3065-3069. (23) Wen. worth, W. E. J. Chern. Educ. 1965, 42, 96-103. (24) Wen. worth, W. E. J. Chern. Educ. 1965, 42,162-167. (25) Marcuardt, D. W. J. 50S. Indust. Appl. Math. 1963, 2, 431-441. (26) Perri'l, C. L. Mathematics for Chemists; John Wiley and Sons, Inc.:
New York, 1970. (27) Petels, T., Jr. Serum Albumin. In The Plasma Proteins, 2nd ad.; Put
nam, F. W., Ed.; Academic Press: New York, 1975. Vol. 1, pp 133-181.
(28) Klotz, I. M. Science 1982, 217, 1247-1249.

Anal. Chern. 1990, 62,367-374 367
(29) Klotz, I. M. Biopharm. Drug Dispos. 1985, 6, 105-106 (30) Deranleau, D. A. J. Am. Chern. Soc. 1969, 91, 4044·4049. (31) Deranleau, D. A. J. Am. Chern. Soc. 1969, 91, 4050·4054. (32) Benesi, H. A.; Hildebrand, J. H. J. Am. Chern. $0,. 1949, 71,
2703-2707. (33) Klotz, I. M. Arch. Biochem. 1946, 9, 109-117. (34) Hill, T. L J. Chern. Phys. 1946, 14,441-453. (35) Bevington, P. R. Data Reduction and Error Analysis fOI the Physical
Sciences; McGraw-Hili: New York, 1969. (36) Teresi, J. D.; Luck, J. M. J. Bioi. Chern. 1948, 174,6,3-661.
(37) Diamandis, E. P.; Papastathopoulos, D. S.; Hadjiioannou, T. P. Clin. Chern. 1981, 27, 427-430.
(38) Christopoulos, T. K.; Diamandis, E. P. Clin. Biochem. 1986, 19, 151-160.
(39) Koryta, J. Anal. Chim. Acta 1988, 206, 1-48.
RECEIVED for review August 8, 1989. Accepted October 23, 1989.
Transport of Catechols through Perfluorinated Cation-Exchange Films on Electrodes
Anna J. Tiidiis, Wim J. J. Ozinga, Hans Poppe, and Wim Th. Kok*
Laboratory for Analytical Chemistry, University of Amsterdam, Nieuwe Achtergracht 166, 1018 WV Amsterdam, The Netherlands
Steady-state amperometrlc and chronocoulometric experiments were carried out with a glassy carbon rolating disk electrode coated with a film 01 the perlluorinafed ion-exchange polymer Nallon, In order to investigate th,~ transport 01 anionic, cationic, and neutral catechols throu~ih the Iilm. The distribution constants 01 the compounds between lilm and solution (K d) were measured, and the diffusion coefficients in the 111m (D,) were calculated. The film diffusion ,;oefficients 01 catecholamlnes were lound to be in the range (0.5 to 3.0) X 10-7 cm" s-'. The selectivity constants were Iletermined 01 the Nallon film lor catecholamlnes relative to three monovalent cations U+, Na +, and K+. The competitivE, effects 01 the buffer cations were lound to decrease in thE, order expected Irom literature data on the ion-exchange snlectivlty 01 Nalion. The buffer cation concentration has no irlluence on the transport 01 neutral catechols through the film, and lor anionic catechols the effect was opposite to that "or cations. Other important lactors lor the detection in Ilow-through systems were also investigated, such as the inllulmce 01 the 111m thickness, the pH, and the methanol concentre,tion. From the results guidelines were lormulated to obtain maximum selectivity lor cationic analytes with Nallon-coated electrodes In liquid chromatography and flow-injection anal~lsis.
INTRODUCTION Many recent studies have been devoted to th e chemical
modification of electrode surfaces with polyme,' films. In literature surveys (1,2) the unique possibilities Ilnd the potential analytical importance of polymer modifiec electrodes have been emphasized. Polymer coated electrodes are used in analytical experiments for various purposes: clltalysts can be immobilized on the electrode surface, reagents CftIt be stored and released in a controlled way, or substances .,an be preconcentrated in the film. However, the most straightforward application is to create a selective barrier for certab undesired substances, selectively exeluding them from the electrode surface. Polymer films with incorporated ionic groups are especially suited for this purpose. The oppositely charged ions are readily transported from the solution into a 1d through the film, whereas identically charged ions are e"eluded.
Nation is a perfluorinated, sulfonated ion-exchar,ge polymer, a trademark of Du Pont. It has been successfdly used to modify electrodes for neurochemical analysis (3-6) and for
0003-2700/90/0362-0367$02.50/0
amperometric detection in liquid chromatography (7, 8). Despite of the large number of publications on Nafion electrodes the amount of analytically important data is still insufficient: few studies deal with the transport of analytically important compounds through Nafion films (9, 10), and in applied studies important parameters are often treated only qualitatively. For optimal analytical use, however, the sensitivity should be minimized for interferences and maximized for the analytes, and a quantitative study on the influence of the film on the response rate is also essential.
The sensitivity in amperometric detection for a compound is determined by the permeability of the film. The permeability is a function of two parameters, the distribution constant between the film and the solution, and the diffusion coefficient of the compound in the film. These two parameters should be determined independently, to be able to optimize the response rate, a factor contributing to peak broadening in liquid chromatography.
In the present paper, the transport is investigated of anionic, cationic, and neutral catechols through Nafion films on a rotating disk electrode. The study presented here deals with the most important factors for optimal detection in liquid chromatography and flow-injection analysis; the influence of the film thickness, the type and concentration of the buffer, the pH, and the methanol concentration of the solution. From the results obtained, guidelines are formulated for an optimal application of Nafion electrodes in flow-through systems.
THEORY In amperometric measurements with a film-coated elec
trode, with the electrode potential at a sufficiently high (or low) potential, the rate of electrochemical oxidation or reduction of a substrate in solution is determined by the rate of convective diffusion of the substrate in the solution and its diffusion through the film. The transport of substrate toward the electrode surface can be described by a two-layer model (11, 12). This model assumes a diffusion layer, a stagnant layer of solution on the surface of the electrode, and an unchanged (bulk) composition of the solution outside this diffusion layer. The steady-state current i", as determined by the transport though the two layers, is
l/iss = l/id + l/if (1)
where id is the current that would be measured without a film and if the current without the diffusion layer. The current in the absense of a film, id, is given by
© 1990 American Chemica! SOCiety

368 • ANALYTICAL CHEMISTRY, VOL. 62, NO.4, FEBRUARY 15, 1990
(2)
where Co is the (constant) bulk concentration of the substrate, d the thickness of the diffusion layer, and A the electrode surface area.
For the rotating disk electrode, as used in this study, the diffusion layer is uniform over the electrode surface; its thickness d is a function of the rotation speed of the electrode, w, as described by Levich (13)
(3)
where D, is the diffusion coefficient ofthe substrate in solution and v is the kinematic viscosity of the solution. When equilibrium is maintained at the film/solution interface, the concentration ratio over the interface is given by the distribution constant K d• In that case if is given by
if = nFAKdcoDdf (4)
where f is the film thickness and Df is the diffusion coefficient of the substrate in the film. The well-known Koutecky-Levich plots are obtained by measuring the steady-state current at different rotation speeds and plotting I/i" vs w-I / 2• From the slopes of these straight lines the diffusion coefficient of the substrate in solution can be calculated, while from the intercept the film-permeability (KdDf) can be obtained. However, Kd and Df cannot be obtained independently from steady-state measurements alone. Therefore, we devised a method, a modification of that used by Szentirmay and Martin (14), to measure these two parameters independently.
The distribution constant Kd can be determined by means of chronocoulometric experiments, in which the potential is stepped from a value at which no electrode reaction takes place to a value where the limiting current is reached. After the potential step is applied, initially a high current is measured, as consequence of the depletion of the substrate in the film and the diffusion layer. Subsequently, the current falls to the steady-state level. The distribution constant can be calculated from the excess charge q,,, the infinite time integral of the current after subtraction of the steady-state current
(5)
It can be shown (see Appendix) that q" is given by
n;~co = KJ [ 1 - ~ + ~ {~n + ~d[ ~ r (6)
The first term on the right-hand side of eq 6 represents the depletion of the film after the potential step and the second term, the depletion of the diffusion layer. When Kd » d/f, the last term can be neglected. Generally, it is so small that it cannot be distinguished from the charge required to build up the potential of the electrode, as measured in blank solutions. If a series of chronocoulometric experiments are performed at different rotation speeds, q" and i" can be measured, and if can be calculated from the corresponding Koutecky-Levich plot. Kd is obtained by substituting these values in eq 6. Since KdDf is known from Koutecky-Levich plots, D f can also be calculated. The advantage of this method to separate Kd and D f is that there is no need for apparatus capable of sampling fast changing signals (15) and that all measurements can be made on the analyte itself (16). When the distribution of a compound between film and solution is governed by ion exchange processes, its distribution and thereby its transport through the film are both dependent upon the concentration of the buffer cation in the solution [M+],. When the measurement is performed with a low substrate concentration, virtually all ion-exchange sites in the film are occupied by buffer cations. In that case Kd is given by
(7)
where KiM is the selectivity constant of the film for the analyte over the buffer cation M+, EW the equivalent weight of the ion-excha:1ge polymer, v the volume (in cm3) of I g of dry polymer a 'ter swelling in the solution and [M+], is in mol V'. When the excess charge can be determined reliably, both the distribution and the selectivity constants can be calculated.
EXPERIMENTAL SECTION Apparatus. Voltammetric measurements were carried out on
a Metrohn. 626 Polarorecord and a 663 VA stand equipped with a rotating disk electrode. The electrode was a 3 mm diameter glassy carbon rod in a 7 mm diameter PTFE shaft. In the belt-driven electrode shaft a second groove was scooped to increase the span oj rotation speeds. Rotation speeds were measured with an optical tachometer.
SteadY-:itate measurements were carried out at a potential of +0.8 V vs Ag/ AgCI/3 M KCI. For the chronocoulometric experiments an external voltage supply (Delta Elektronika) was connected ;0 the potentiostat, and the potential was stepped from +0.2 to +C.8 V. The currents were registered on a BD 12 integrating recorder (Kipp en Zonen).
Reagents and Solutions. A 5 wt % solution of Nafion EW 1100 was "btained from Aldrich. Dilutions were prepared in methanol. The concentration of these solutions was determined by titration with sodium hydroxide.
The catecholamines were used as received. Dopamine hydrochloriCe (DA), dl-norepinephrine (NE), 3,4-dihydroxyphenylacetic acid (DOPAC), and catechol (C) were obtained from Janssen Chimica, dl-epinephrine (E) and DL-DOPA from Sigma. Concentrated stock solutions were stored at 4°C.
Buffer solutions were prepared by dissolving lithium, sodium, or potassicm hydroxide in water (0.01 mol L-I) and adjusting the pH with nonochloroacetic acid (pH 2.5-3.5), acetic acid (pH 4.0-5.5) ar,d phosphoric acid (pH 6.0-7.0). The cation concentration wa; then varied by adding concentrated solutions of the nitrate salt. The solutions in the measuring cell (20 mL) were deoxygenated by purging with nitrogen. All experiments were performed at ambient temperature (19 ± 2°C).
Preparation of the Modified Electrodes. Two basic methods have been tested to apply a thin Nafion film to the electrode, dip coating and droplet evaporation. The latter method proved to be more rE producible. Still, sometimes considerable differences were observed from one coating to an other, and visual inspection showed di:ferences in the area on which the Nafion layer was deposited. The most consistent results were obtained when a 5-ILL droplet of 1 diluted Nafion solution was spread out on the glassy carbon SUl face, and the solvent was allowed to evaporate in air at room tE mperature. The reproducibility did not improve by changing the volume of the applied solution, nor did it improve when the film was prepared by applyiog successive layers of Nation or when the film was dried under a hot-air gun (5).
The int,,"cept of the Koutecky-Levich plots for catechol was found to t, proportional to the amount of Nation applied for the majority cf the films prepared (ca. 100). Hence, the thickness and uniformity of each layer were checked experimentally by recording the Koutecky-Levich plots for catechol. When the intercepts deviated for over 20% from the value expected for the amount of Nafion applied, the electrode was not used, and the film was VI iped off with a tissue soaked in methanol. A strongly uneven co' 'erage, or pinholes in the film, cause an increase in the slope of t 1e Koutecky-Levich plot, as compared to the bare electrode. When the deviation of the slope exceeded 15 %, the electrode '!\Ias not used, either.
The film thickness was calculated from the amount of Nafion applied. On the basis of the water uptake and the density of Nafion in ~ontact with aqueous solutions (17), a specific volume of 0.84 em' for 1 g of (dry) Nafion was assumed.
RESULTS Voltammetry. Voltammograms were recorded in buffer
at pH 4.[ using bare and coated GC electrodes. Typical examples are shown in Figure 1. After the bare electrodes were clea:1ed, the half-wave potentials kept shifting during use, but in the presence of the Nafion coating the wave shape

ANALYTICAL CHEMISTRY, VOL. 62, NO.4, FEBRUARY 15, 1990 • 369
Figure 1. Vottammograms of dopamine (DA) and catechol (CA) at bare (1) and Nafion-coated (2) electrodes: analyte concentration, 2 X 10"" mol L-'; acetate buffer, pH = 4.5; [Na+j = 0.10 mol L- ; rotation speed, 450 rad s-'; scan rate, 2 mV s-'; film thickness 0.8 I'm.
and the reproducibility improved. All the compounds could be measured at the current plateau at +0.8 V. Ste2dy-state limiting currents were linear with the analyte concentrations in the range studied (5 X 10⁻⁶ to 5 X 10⁻⁴ mol L-I).
Koutecky-Levich plots of catechol in acetate b'lffer are shown in Figure 2. The plots of bare electrodes often showed a small intercept (0.0-1.0 A-I mol L-') depending on He history of the electrode and the concentration of the compound. This intercept was probably caused by the adsorption of reaction products on the electrode surface. At coated electr,)des this phenomenon cannot be distinguished from the effects imposed by the film; hence, at low intercept values the deter nination of the film permeability is probably less accurate thm in the case of thick films.
The diffusion coefficients of catecholamines in solmion were calculated from the slopes of the Koutecky-LevicJ- plots at bare and coated electrodes. Depending on the composition of the solution the diffusion coefficients were in the range of (0.55-0.60) X 10-5 cm2 S-I.
Influence of the Buffer Cations. The influence of the buffer cations was studied at pH = 4.5 with three cationic catechols (DA, E, and NE), two uncharged catechol; (DOPA and C), and one which is partially anionic in the solution (DOPAC). The film permeability was determined at different Li+, Na+, and K+ concentrations and is shown in Fi!;ure 3 for cationic and in Figure 4 for anionic and neutral species. In the case of cationic species, the intercepts of the K JuteckyLevich plots were proportional to the buffer cation concentration, that is, the film permeability is inversely proportional to the buffer cation concentration. Since this is ex Jected of a competitive ion-exchange process, it may be concl\lded that this appears to be the major distribution mode. The permeability decreases from one catecholamine to ;he other in the order DA > E > NE. The competitive e[[{.ct of the buffer cations decreases in the order K+ > Na+ > Li+, in agreement with literature data on the ion-exchange "electivity of Nafion (18).
Figure 4 shows the influence of the potassium ion concentration on CO/if for noncationic catechols. Both the film permeability and the influence of the buffer conceni ration on it are low compared to the cationic species. The d.·crease of the film permeability with the buffer concentration j or DOPA indicates that ion exchange plays a role. However, aJparently other processes are more important. The film per neability for catechol is practically independent of the ~ otassium concentration, whereas for DOPAC it shows a slight increase with increasing potassium concentration. Similar re3ults were
Figure 2. Koutecky-Levich plots of 5 X 10"" mol L-' catechol: acetate buffer, pH = 4.5; [Na+j = 0.01 mol L-'; film thickness, 0 (a), 0.8 (b), 1.6 (c) and 3.2 (d) I'm.
obtained with lithium and sodium buffers. Infl uence of the pH. As was shown in the previous sec
tion, the rate of transport of a compound through the film is strongly dependent on its charge. Therefore, in the case of weakly acidic or basic compounds the pH of the solution is important. The influence of the solution pH on the transport of the aminoacid DOPA (pK. = 2.2) and on the weak acid DOPAC (pK. = 4.1) was studied at low and high sodium ion concentrations. The results are shown in Figure 5. In this figure the film currents are plotted to illustrate the contributions of the differently charged catechol species to the transport through the film. Below pH = 4 DOPA is readily transported through the film as a cation, and a competitive effect of the sodium ion is observed. At high pH values, where DOPA is present in the solution as zwitterion, the transport through the film is strongly decreased. Here, the sodium ion concentration is of little influence.
In the case of DOPAC the change in the film permeability with the pH is also observed at a solution pH of about 4. The film is less permeable for the anionic species (above pH 5) than for the neutral species (below pH 4). It is interesting to note, that the sodium ion concentration has little influence in the case of neutral species, while for anions the permeability increases with increasing sodium ion concentration. This may be attributed to a decrease of the repulsive forces between ilie DOPAC anions and the ionic sites in the film by a decrease in the zeta potentials. For catechol the film permeability did not depend on the solution pH in the range studied (2.5-7.0).

370 • ANALYTICAL CHEMISTRY, VOL. 62, NO.4, FEBRUARY 15, 1990
DA NE
10 '0 '0
~ v 0
0.2 0.2 C 0 0.2
(mol 1-1)
Figure 3. Influence of the buffer cation concentration on the intercepts of Koutec<y-Levich plots for DA, E, and NE: analyte concentration, 10-5 molll; acetate buffer, pH = 4.5; film thickness, 3.2 I'm; buffer cation, U+ (0:, Na' (+), or K+ (e).
COPAC
DOPA
~----------~------------~. c
Figure 4. Influence of the potassium ion concentration on the intercept of Koutecky-levich plots for DOPA, DOPAC, and C: analyte concentration,5 X 10-5 mol l-'; acetate buffer, pH = 4.5; film thickness, 3.2 I'm.
Influence of the Methanol Concentration. The influence of the methanol concentration of the solution on the
stability and permeability of the Nafion film was also studied, since ill ethanol is often used as organic modifier in reversed-r·hase chromatography. Depending on the method of prepara ;ion of the films, the stability is affected by organic compon,mts in the solution (19). The stability of the film was evaluatEd from the film permeability for catechol in aqueous buffers after rotation of the electrode in a solution containing methan,,!. At a methanol content of 40% (v/v) and higher, the film was rapidly stripped off from the electrode surface. In solutons up to 25% methanol content the film was stable for at least 48 h.
The film permeability for catechol and dopamine was measured in sodium acetate buffers (pH = 4.5) with 0, 10, and 20% (v/v) methano!. No significant influence of the methanol concent,ation was found.
Detel'mination of Distribution Constants and Diffusion CO'3fficients. The Nafion-coated electrode was allowed to equil brate for at least 10 min in the solution of the compound a; a potential of +0.2 V, then the potential was stepped to +0.8 V. Figure 6 shows a typical time-dependent current and its integral after the potential step. The method to determine q" is also indicated. Measurements were performed with different settings of the time constant and sensitivity of the potentiostat/ amplifier, while other conditions were kept constan;. No influence of the potentiostat settings on the measured values of q" was found, which indicates that these values Vlere not affected by electronic artifacts.
The chronocoulometric experiments were also performed with bare electrodes (with and without DA in solution) and with cOE.ted electrodes in blank buffer solutions. Under the above tl.ree different conditions the same blank values of q" were fm:nd, indicating that the charging of the double layer at the el"ctrode surface was the main contribution. The charge measured (2-5 I'C) increased with the aging of the electrode. Measurtld values of qox were corrected for the blank values.
The Excess charge was measured at low rotation speed, where the measurement is the most reliable since q" is then relatively high and i" low. The value of iss/if was calculated from a Koutecky-Levich plot, and Kd could then be calculated with eq 6. At bare electrodes q,x comprises the depletion of the difhsion layer. Since this charge could not be distinguished from the background loading charge in blank solutions, He term in eq 6 representing the contribution of the diffusior layer at coated electrodes was neglected, being always

ANALYTICAL CHEMISTRY, VOL 62, NO.4, FEBRUARY 15, 1990 • 371
DOPA DOPAC
A mOl 1\
0.10
O.OS
~a --~~>--o-~ b
pH
0.10
0.05
~ . ~~b
pH
Figure 5. Influence of the solution pH on the film-perme"bility for DOPA and DOPAC: 10-' mol L-1 (DOPAC); [Na+j = 0.01 (a) and 0.20 mol L-1 (b); film thickness, 1.6 Mm.
concentration of the compounds, 5 X 10⁻⁵ (DOPA) and
Table I. Determination of Distribution and Selectivity Constants of Catecholamines by Chronocoulometric ExperimentsG
coneD, DA E NE
cation mol L-l qex, IlC i,,/if Kd KMi qex, IlC iss/if Kd KMi qen p'e iss/if Kd KMi
Li+ 0.01 141 0.00 3210 29.7 116 0.00 2640 24.4 20 0.01 460 4.3 0.02 80 0.01 1840 34.0 60 0.01 1380 25.5 10 0.02 230 4.3 0.05 38 0.03 890 41.3 16 0.02 370 17.1 n.d.
Na+ 0.01 73 0.01 1680 15.5 55 0.01 1270 11.7 15 0.01 350 3.2 0.02 35 0.02 810 15.0 29 0.02 670 12.5 7 0.03 160 3.0 0.05 14 0.04 330 15.4 11 0.04 260 12.1 n.d.
K+ 0.01 37 0.01 850 7.9 35 0.02 810 7.5 8 0.02 190 1.7
a Concentration of catecholamines 10-5 mol L-l in ace1ate buffer, pH 4.5. qex determined at 53 rad s-1, corrected for blank value.
smaller than at bare electrodes. Since in most cases i.j if was small, q" was approximately equal to nFAK,J'co (/4). Differences with this simpler method of calculation ""ere up to 4% only. In Table I the observed qox values and the calculated distribution constants are comprised for DA, E, a:ld NE in various buffers. From the teble the following conclL sions can be drawn:
1. The distribution constants are inversely proportional to the buffer cation concentration; hence ion-excha 1ge is the major distribution process.
2. The distribution constants of the catechola:mi 1es are in the order DA > E > NE.
3. The competing effect of the buffer cations is in the order K+ > Na+ > Li+.
From the distribution constants the selectivity ·,onstants have been calculated for the catecholamines over t he buffer cations (Table I). The agreement over different buffer concentrations is reasonable, given the variation of th,· q,x measurements (generally in the order of ±3 Me). From the results it can be seen that the assumption that virtually dl ion-exchange sites in the film are occupied by buffer cations was justified. In the most extreme case (10-5 mol L -I r)A in 0.01 mol L-' Li+) only 3% of the sites was occupied by the analyte cations.
The diffusion coefficients of the three catechol ,mines in Nafion film have been calculated from the distribution con-
Table II. Calculated Diffusion Coefficients of Catecholamines in Nafion
D6 10-7 cm2 8-1
buffer cation DA E
Li+ 0.53 1.02 Na+ 0.87 1.14 K+ 0.94 0.82
NE
2.99 2.52 2.78
stants and the film permeabilities at different buffer ion concentrations (Table II). The diffusion coefficients do not depend significantly on the type of the buffer cation. The diffusion coefficient of the less strongly bound NE is higher than those of DA and E.
It was also attempted to measure the distribution constant of catechol. However, this proved to be difficult, since the excess charge is only slightly different from the loading charge in blank solutions. The distribution constant of catechol was found to be approximately 4. From the distribution constant a film diffusion coefficient of 2 X 10⁻⁷ em' S-l can be calculated. However, these values indicate merely the order of magnitude.
DISCUSSION The mutual selectivity constants of Nafion for the buffer
cations were derived from two types of measurements. First, they were calculated from the influence of the buffer cation

372 • ANALYTICAL CHEMISTRY, VOL. 62, NO.4, FEBRUARY 15, 1990
I 10 JoIC
o t Imin)
o t Imin)
Figure 6. Time-dependent current and charge curves after a potential step, and determination of qex: 10-5 mol L-1 DA in acetate buffer, pH = 4.5; [U+j = 0.02; film thickness, 3.2 I'm.
concentrations on the film permeability for catecholamines in steady-state measurements, as derived from the slopes of the plots in Figure 3. Second, they were calculated from the influence of the cations on the equilibrium fIlm concentrations of the catecholamines in chronocoulometric measurements (Table I). The calculated selectivity constants are given in Table III. The relative selectivity of the Nafion fIlms for Li+, Na+, and K+ can be compared with literature values (I8). Generally, the values found in our study are lower than those of Yeager and Steck. Since their measurements were more direct, their values are probably more accurate.
In two recent studies on the measurement of the diffusion coefficients of catecholamines in Nafion, values of about 2 X 10⁻⁹ em' S-l were published, almost 2 orders of magnitude lower than the values obtained in our experiments. In the first study (9), chronoamperometric measurements were carried out, from which KdDc'/2 was obtained, while Kd values were obtained independently. The reported KiNa values were 1500 for NE and 5000 for DA, about 300 times larger than our results. In the second study (5), the diffusion coefficient of dopamine in Nafion was obtained from response rate measurements in
Table III. Mutual Selectivity Constants of Buffer Cations in Nafion
nlethod compound KLiK KuNa KNa
K
steady state DA 2.3 1.3 1.8 E 4.0 1.8 2.2 NE 2.7 1.6 1.7
chronocoulometric DA 4.1 2.1 1.9 E 3.2 2.0 1.6 NE 2.5 1.3 1.9
literatnre (18) 6.9 2.1 3.3
a flow-through system. With a fast-potantial sweep technique the concentration of dopamine in a Nafion fIlm was sampled close to t 1e electrode surface. Sampling was fast enough to avoid disturbance of the concentration in the film. The permeati m of dopamine in the film after a change of the dopaminE concentration in the flowing solution was measured, and from this rate Dr was calculated. While the response time was calculated the contribution of the transport through the diffusion layer was neglected. However, this is not allowed under alI ~onditions. Even if the response rate of the diffusion layer alone (as measured at a bare electrode) is very high, transport through the diffusion layer may be a limiting factor for the a~cumulation in the film. This effect can cause a considen.ble contribution to the response time, which is proporti< nal to Kd (20). This also explains the decrease of the calcu:ated diffusion coefficient when the buffer concentration d"creased: both Kd and the coupling contribution to the respense time increased. Other studies support the observation that the diffusion coefficients in the film are in the order of 11-2) X 10-7 cm2 s-l, rather than 2 X 10⁻⁹ em' S-l It can be derived (20) that in flow-through detection the contribution to band broadening of a film on an electrode is given by
(8)
where 'Y is a constant ranging from 1/90 for low values of Kd to 1/6 fo, analytes with high Kd. Experimentally observed contribut ions to band broadening (7, 8) are much smalIer than is expect,d for compounds with a film diffusion coefficient of Dr = 2 X 10⁻⁹ em' S-l For instance for a 2-l'm film (7) a " between 2 and 8 s should have been found, where a negligible contribution to peak broadening was reported.
CONCLUSIONS
One of the primary conclusions resulting from this study is that the importance of the buffer cation concentration for the permeability of Nafion films on electrodes should not be underest.mated. The selectivity for cations compared to neutral 0' anionic compounds cannot be accounted for by the differenc"s in diffusion coefficients in the film, but it is mainly the resul; of the differences in distribution constants at the film/solI tion interface. In some analytical applications the solution "omposition is fully restricted (such as in vivo measuremen·,s). However, optimization is often possible if the composition can be chosen within certain limits (e.g., in flow-injection analysis). The following guidelines can be used to obtair maximum selectivity for cationic analytes.
1. L< w buffer concentration improves both the film permeab:Jity for cationic compounds and the shielding efficiency for anionic compounds.
2. Litlium buffer salts are preferred over sodium or potassium :;alts.
3. A proper choice of the solution pH results in an improved shielding of the electrode from interfering compounds which are conVf,rted into anions. The appropriate solution pH can be deriVE d from the pKa value of the interfering compound in solution.

ANALYTICAL CHEMISTRY, VOL. 62, NO.4, FEBRUARY 15, 1990 • 373
Table IV. Calculated Influence of the Buffer CompJsition on the Selectivity of a Nafion-Coated Electrode in Flow-Through Detection'
compound
DA E NE DOPA DOPAC C
0.20 mol L -1 K+ 0.01 mol L-l :oi+
0.77 0.73 0.68 0.23 0.13 0.43
0.99 0.99 0.99 0.26 0.02 0.43
'Film thickness: 2 I'm. Buffer pH = 7.
4. Methanol may be added to the solution up to 25 % (v Iv) without reducing the stability of the film (for the E:W 1100 Nafion used in this study). The methanol content of the solution is of little influence on the selectivity.
5. When a fast response of the coated electrode i; important, this limits the thickness of the film that can be applied. For instance, in order to obtain a band-broadening contribution in liquid chromatography of less than 0.01 S2 for a compound with Dr = 10-7 cm2 s-l, the film thicknesl should not exceed 3 I'm.
To illustrate the utility of the above considerations, the influence of the buffer composition has been calcu.ated on the selectivity of the Nafion film in flow-through d"tection. A mean diffusion layer thickness of 10 I'm has been assumed, which is a realistic value for commercially available flowthrough electrochemical detectors if the liquid flow rate is 1 mL min-I. In Table IV the calculated iss/id values are given for the cationic compounds, representing the ratio of ,he peak areas at coated and bare electrodes. It can be seen that the sensitivity for catecholamines improves if a 0.20 mol L-l potassium buffer is replaced by a 0.01 mol V' lithium buffer. The leakage of (DOPAC) anions through the Nafion film will be strongly diminished at the same time.
APPENDIX
Derivation of Equation 6. To obtain the relation between q" and Kd the differential equations describing the diffusion of the substrate in the diffusion layer and the film have to be evaluated. When x is the distance from the electrode surface and Cr and c, denote the substrate concentrations in the film and the diffusion layer, respectively, these equations are
(9a)
aC, a2c, f <x<f+d --D-=O
'at 'ax2 (9b)
If equilibrium is reached before the potential step, the initial conditions are
t = 0, 0 < x < f, Cr = KdCO
t = 0, f < x < f + d, c, = Co
The boundary condition for the electrode surfacE after a potential step to a sufficiently high value is
x = 0, cr = ° and for the outer surface of the diffusion layer
x = f + d, c, = Co
The assumption that the transport of substrate ,wer the film-diffusion layer interface is not rate-determing leads to
an equilibrium condition for the interface
x = f, cr = Kdc,
The conservation of mass gives a final boundary condition
oCr OC, x = f, Drax = D'ax
The current is given by
i(t) = nFADr(ocr)
ox x=O (10)
Transformation of eq 9a and 9b to the Laplace domain, with the initial and boundary conditions stated above, yields differential equations which can be solved to give the Laplace transform of the current
• Dr'/2 q, cosh P,s'/2 + q2 cosh P2S1/2 l(S) = nFAKdcO-sl/2 (11)
ql sinh PIs'/2 + q2 sinh P2S'/2
f d P, = D '/2 + D '/2 r ,
f d P2 = Dr'/2 - D,'/2
Dr'/2 q2 = 1 - Kd D 112 ,
The Laplace transform of the steady-state current iss (eq 1) is
• DrD, l,,(S) = nFAKdcOs (KddD
r + fD,) (12)
Back-transformation of these formulas to the time domain is not necessary. For any transformable function f(t) the infinite time integral can be written as (21)
roo f(t) dt = lim l(s) J o s-o
(13)
By subtraction of eq 12 from eq 11, series expansion of the hyperbolic terms, and taking the limit for s ~ 0, the excess charge is obtained
q.x = nFAKdcO YaDs2f + KdDrDJ'd + KlDi{d2 + YaKdDr'd3
(14) (KdDrd + DJJ2
Substitution of eqs 1, 2, and 4 in eq 14 and rearrangement yield the convenient expression for q" of eq 6.
ACKNOWLEDGMENT
The authors are grateful to Applikon BV (Schiedam, The Netherlands) for providing the Metrohm equipment.
LITERATURE CITED (1) Murray, R. W. In Electroanalytical Chemistry; Bard, A. J., Ed.; Marcel
Dekker: New York, 1984: Vol. 13. (2) Murray, R. W.; Ewing, A. G.; Durst, R. A. Anal. Chem. 1987, 59,
379A. (3) Gerhardt, G. A.; Oke, A. F.; Nagy, G.; Moghaddam, B.: Adams, R. N.
Brain Res. 1984, 290, 390. (4) Rice, M. E.; Oke, A. F.; Bradberry, C. W.; Adams, R. N. Brain Res.
1985,340, 151. (5) Kristensen, E. W.; Kuhr, W. G,; Wightman, R. M. Anal, Chem. 1987,
59, 1752. (6) Hulthe, P.; Hulthe, B.; Johannessen, K.; Engel, J. Anal. Chim. Acta
1987, 198, 197. (7) Ji, H.; Wang, E. J. Chromatogr. 1987, 410, 111. (8) Wang, J.; Tuzhi, P.; Golden, T. Anal. Chim. Acta 1987, 194, 129. (9) Nagy, G.; Gerhardt, G. A.: Oke, A. F.; Rice, M. E.; Adams, R. N.;
Moore, R. B., III; Szentimay, M. N.; Martin, C. R. J. E/ectroanal. Chem. 1985, 188, 85.
(10) Lawson, D. R.; Whiteley, L. D.; Martin, C. R.; Szentirmay, M. N.; Song, J. I. J. Electrochem. Soc. 1988, 135,2247.
(11) Gough, D. A.; Leypoldt, J. K. Anal. Chem. 1979,51,439. (12) Ikeda, T.; Schmehl, R.; Denisevich, P.; Willman, K.; Murray, R. W. J.
Am. Chern. Soc. 1982, 104, 2683.

374 Anal. Chern. 1990, 62, 374-378
(13) Levich, V. G. Physicochemical Hydrodynamics; Prentice-Hall: Englewood Cliffs, NJ, 1962.
(14) Szentirmay, M. N.; Martin, C. Anal. Chern. 1984, 56, 1898. (15) Marrese, C. A.; Miyawaki, 0.; Wingard, L. B., Jr. Anal. Chern. 1987,
59,248. (16) Ewing, A. G.; Feldman, B. J.; Murray, R. W. J. Phys. Chern. 1985, 89,
1263. (17) Mauritz, K. A.; Hora, C. J.; Hopfinger, A. J. Polym. Prepr. (Am.
Chern. Soc., Div. Polym. Chern.) 1978, 19,324.
(18) Yeeger, H. L.; Steck, A. Anal. Chern. 1979,51,862. (19) Mo(,re, R. B.; Martin, C. R. Macromolecules 1988, 21, 1334. (20) Kok, W. Th.; Tudos, A. J.; Poppe, H. Anal. Chim. Acta 1989, 228, 31. (21) Laa1, E. T. van der Chern. Eng. Sci. 1955, 7, 187.
RECEIVED for review December 1, 1988. Accepted November 3, 1989.
Thin-Layer Chromatography with Supt3rsonic Jet Fluorometric Detection
Totaro Imasaka, Katsunori Tanaka, and Nobuhiko Ishibashi*
Faculty of Engineering, Kyushu University, Hakozaki, Fukuoka 812, J,'pan
A mixture sample Is developed by a silica gel on a flexible thin-layer chromatograph (TLC) sheet. This is mounted on a sliding sheet roller attached to a supersonic jet nozzle. The first dye laser beam (275 nm) is introduced from a small through-hole to desorb the chemical species on the TLC sheet. The vaporized sample is entrained into a carrier gas of argon, and the gas is then expanded into a vacuum to form a supersonic jet. The sample molecule is detected by fluorescence Induced by the second dye laser beam (366-375 nm). This technique allows direct measurements of the excitation spectrum and the chromatogram for the sample developed on the TLC sheet. The amount of sample used for recording a spectrum is 4.4 foL9. The detection limits are ~ 10 ng in spectrometric and chromatographic measurements.
In the environment there are many chemical species with similar structures, whose toxicities drastically change by slight modification of the chemical structure. Therefore, a selective analytical method is essential in their determination. Supersonic jet (SSJ) spectrometry provides a useful means for this purpose, because of sharp line structure in the spectrum (1-3). It has been used for selective determination of polycyclic aromatic hydrocarbons (PAHs) and biological molecules with similar structures. However, there are so many chemical species in the environment that combination with a separation technique is sometimes necessary prior to the measurement.
SSJ spectrometry is a flowing analytical technique, and it is possible to combine it with chromatography. In current works, gas chromatography (GCl is successfully used for this purpose. Methods based on fluorescence (FL) detection (4-8) and multiphoton ionization (MPI) (9-11) have been reported, and picogram quantities of PAHs have already been determined (7). For nonvolatile or thermally labile molecules, liquid chromatography (LC) based on supercritical fluid sample introduction has been used (12). More recently, supercritical fluid chromatography (SFC) is used, instead of LC, for sample separation (I3, 14). The assignment of the chemical species is performed by measuring a fluorescence spectrum with an optical multichannel analyzer (8) or by measuring a mass spectrum with a time-of-flight mass spectrometer (MS) (11),
* Author to whom correspondence should be addressed.
0003-2700/90/0362-0374$02.50/0
during the time period when the sample passes through the detectOl. This approach allows reliable assignment of the chemical species from the well-resolved fluorescence or mass spectrum. Supersonic jet spectrometry combined with chromatography has great selectivity, but it has an inevitable disadva ltage described below.
In CUlrent SSJ spectrometry, a pulsed dye laser is used for excitaticn or multiphoton ionization of the molecule, because of the" ide tuning range and high peak power of the laser. The rep"tition rate of the pumping laser, e.g. an excimer laser, is practically limited to 10-100 Hz. It is difficult to measure the excitation spectrum in the short time period when the eluents transit a chromatograph detector. Thus only the specifiec molecule, whose spectral parameters are known prior to the nleasurement, can be detected with great selectivity, makingt difficult to apply chromatography /SSJ spectrometry to unknown samples.
In this study we use thin-layer chromatography (TLC) for sample leparation in SSJ spectrometry to measure the excitation lpectrum and the chromatogram simultaneously. The sample is deposited at the bottom of the chromatograph sheet in a straight line, and it is developed by a solvent. At an appropriate Rf value (the ratio of migration distances for the sample 00 the solvent), the sample is vaporized by the first dye lase - beam. The molecules are entrained in a carrier gas, which is expanded into a vacuum to form a supersonic jet. The sample is detected by fluorescence induced by the second dye laser bean. The excitation spectrum is measured by scanning the posi1ion oilaser desorption (LD). A similar approach using MPI/MS is reported elsewhere (15). However, a portion of the TLC sheet is cut out and attached on the sample holder for lase' desorption. Thus the sample location should be known :)rior to the measurement. The present analytical techniq',e allows repetitive measurements of the excitation spectruI1 by scanning the position of the TLC sheet, and then it is applicable to unknown samples.
EXPERIMENTAL SECTION Apparatus. A laser ablation/supersonic jet nozzle was ori
ginally developed for the studies of metal clusters by Smalley and co-work,·rs (16, 17). In the present study the nozzle is modified for the application to the sample developed on the TLC sheet. The nozde structure is shown in Figure 1, which is essentially a combi lation of the specially designed component described below m,d the pulsed nozzle (pulse width, ~ 1 ms) used in our gas-phaEe experiment (18). A flexible TLC sheet (100 mm long, 61 mm "ide) is mounted on a sliding sheet roller (diameter, 20
© 1990 ArnE rican Chemical Society

Ablation Laser
Figure 1. Supersonic jet nozzle for thin-layer chromatograph detection.
to Sliding Sheei Roller
Figure 2. Driving unit for translation and rotation of TLC shed attached to supersonic jet nozzle.
mm) supported by ball bearings (THK Bearing), which is rotated with gears (Kyoikusha) attached to the ends of two stadess steel rods (diameter, 3 mm). O-rings are fitted to this shaft· a contact with the TLC sheet softly. Two ball bearings (THK Be;rring) are attached to fit the TLC sheet on the roller, whose holder is mounted on the stage, which is smoothly translate i by ball bearings (THK Bearing). A desorption laser beam is introduced from a small through-hole (i.d., 1 mm) to vaporize the, ample on the TLC sheet. The curvature of the nozzle head EUrface to contact with the TLC sheet is designed to be 11 mm. The separation between the nozzle head and the TLC sheet if adjusted to 0.2 mm.
Figure 2 shows a driving unit for translating and ro.ating the sliding sheet roller. This is performed by rotating th, stainless steel rod by using a stepping motor (Oriental Motor) mounted on the stage, which is translated by rotating a screw wil h a speed control motor (Oriental Motor). Two switches are positioned at both ends to limit the translational distence. The electre nic circuit for controlling the motors is designed in this laborato -y. When the stage arrives at the end switch, the speed control motor stops working during 0.6 s, and the stepping motor rotates the shaft five steps, corresponding to 0.4 mm on the TLC sheet. ' [he speed control motor starts moving again backward to change the scanning direction. A typical translational speed is 20 mm/min. This scan controller is installed outside the vacuum chamber, and the shaft is sealed with an O-ring.
A block diagram of the experimental apparatus is shown in Figure 3. After an argon gas is injected into the nozzle throat (i. d., 1.5 mm), the first dye laser pumped by the second harmonic of a Nd:YAG laser (Quantel, YG581C-20, TDL50, UVX 2, DCC-3, 20 Hz) is fired to vaporize the sample on the TLC sheet. The laser beam is reflected by a dielectric coated mirror anc is exactly focused on the sample surface by a lens (focal length, 3C cm). The
ANALYTICAL CHEMISTRY, VOL. 62, NO.4, FEBRUARY 15, 1990 • 375
Photomultiplier Monochromator 275 nm, 1 mJ
~-~ '~:(I(========~I i Boxcar Integrator: ?- / Pulse Nozzle
Rec~rder /_~ ~Y~':'. 0: c ~N~~~~~eA~I~~:a~:~:~~e~r-' Vacuum Pump 0':; IPulse G~nerator'
'" / '" (\ I ! ~ !Ar: Excimer Laser
, I \ LJ Dye Laser ~ " TLC Sheet II
I
'::Jl======7 Figure 3. Experimental apparatus for TLC/LD/SSJ/FL.
beam position was visually confirmed by looking at it through the dielectric mirror. The laser dye used for desorption was fluorescein 27. The oscillating wavelength was adjusted to 275 nm, which was the shortest wavelength available in the present dye laser system. The pulse energy typically used was ~ 1 mJ. The second dye laser pumped by an excimer laser (Lambda Physik, EMGI02MSC, FL2002, 5 mJ) is synchronously fired at 130 !lS after the first dye laser. This is focused by a lens (focal length, 30 cm) 10 mm away from the top of the nozzle throat. The vacuum chamber is evacuated by a pumping system described elsewhere (19). Fluorescence from the sample is measured by a monochromator (Jasco, CT-I00, 400 groove/mm) equipped with a photomultiplier (Hamamatsu, R928). The typical slit width used was 2 mm, corresponding to a spectral resolution of 4.8 nm. The signal is measured by a boxcar integrator (NF Circuit Design Block, BX-530A), the typical gate width being 1 !lS. The output signal is displayed by a chart recorder (Hitachi, 056).
Reagents. The PAHs used in this study, 1-chloroanthracene, 2-chloroanthracene, 9-chloroanthracene, and 9,1O-dichloroanthracene, were purchased from Aldrich. The P AH 9-methylanthracene was supplied from Nakarai. The laser dyes BBQ, PBD, and fluorescein 27 were obtained from Exciton. The laser dye 7D4MC was purchased from Eastman Kodak. The TLC sheet (Merck, Kieselgel 60, normal phase) for sample separation consists of a thin silica gel layer (0.2 mm) on a polyester film. Nitrogen dioxide, which was used for an investigation of the cooling effect, was purchased from Takachiho.
Procedure. The sample was dissolved in chloroform and was deposited in a straight line at the bottom of the TLC sheet with a glass capillary. The sample was developed 50 mm with a solvent such as n-hexane. This was air-dried and was attached to the sliding sheet roller. After the nozzle was installed in the vacuum chamber, the shaft for translation and rotation of the roller was connected to the motor. The stagnation pressure of the argon gas was adjusted to 200 Torr throughout this experiment.
RESULTS AND DISCUSSION Cooling Effect. The TLC sheet is flexible but cannot be
bent sharply into a V-shape. The nozzle throat becomes longer than the bending diameter, as shown in Figure 3. The cooling effect due to jet expansion can be degraded by increasing the length of the nozzle throat; a hydrodynamic flow becomes a molecular flow, which may substantially increase the jet temperature. First, the cooling effect was investigated hy changing the length of the nozzle throat, using NO, as a sample; an excitation spectrum was measured by monitoring the ", band at around 455 nm. The procedure for the calculation of the rotational temperature from the line profile is descrihed in detail elsewhere (18). The rotational temperature obtained was 3.4-4.1 K for nozzle throat lengths of 0,1,12, 22, and 39 mm. This fact is consistent with a calculated translational temperature of 3 K obtained by assuming direct jet expansion from the nozzle. Thus, it is tentatively concluded that a nozzle throat shorter than 40 mm induces a minor effect in rotational cooling. In this study the length of the nozzle throat is designed to he 29 mm, promising sharp spectral lines in the SSJ spectrum.

376 • ANALYTICAL CHEMISTRY. VOL. 62. NO.4. FEBRUARY 15. 1990
.?:' 'iii c: <I> -.5 <I> () c: <I> () (/J <I> .... o ::J rr:
CI,©©©
Wavelength I nm Figure 4. Supersonic jet excitation spectrum for 2-chloroanthracene adsorbed on TLC. Fluorescence is monitored at 387.0 nm.
Spectral Features. Supersonic jet excitation spectra were measured for 1-, 2-, and 9-chloroanthracene, 9-methylanthracene, and 9,10-dichloroanthracene adsorbed on the TLC sheet. Figure 4 shows the spectrum for 2-chloroanthracene, which is known as a thermally labile molecule to form a polymerized tar at an elevated temperature (12). A rather poor signal to noise ratio (SIN) is due to the low fluorescence quantum yield of 2-chloroanthracene. The line widths of the 0-0 transition peak observed for the above five compounds were 1.9-2.8 em-I Amirav et al. calculated the rotational temperature of anthracene to be 15 K from a line width of 3 cm-1 (20). Thus it is implied that the molecules are sufficiently cooled by jet expansion, at least to 15 K.
Sensitivity. The time period required for the measurement of an excitation spectrum was 15 min. After the sample was laser-desorbed, the TLC sheet was detached from the nozzle. A zigzag trace was found on the TLC sheet, which was 0.1 mm wide and 366 mm long. By extraction of 9,10-dichloroanthracene adsorbed on the TLC sheet into chloroform, a quantity of sample in a unit area was calculated by measuring the concentration with a conventional fluorescence spectrometer. The result indicates that the density of the sample molecule is 0.12 ILg/mm2. During the measurement of an excitation spectrum, 4.4 ILg of sample is calculated to be consumed. By a single laser shot 0.24 ng of sample (6 X lO" molecules) is desorbed in the present condition, which is slightly less than the values reported elsewhere: 3 X 10¹³ molecules in MPI spectrometry (21) and 2 X 10'2 molecules for laser-ablated monomers from a polymer surface (22). In TLC/MPI/MS the detection limits are reported to be -12 ng for indole-3-acetic acid and - 3 ng for imipramine, which are obtained by averaging the signals over 10 pulses (1 s) (15). These values are comparable to a detection limit of -10 ng for 9,10-dichloroanthracene obtained in this study, which is estimated from a desorbed amount of sample during the time constant (0.24 ng X 20 Hz X 5 s) and the SIN ratio of the spectrum (SIN = 7).
Background Signal. The sensitivity was determined by several sources of background emission. Strong light scatter originated from particulates ablated from the TLC gel, but could be reduced to negligible levels by using a fluorescence monochromator. Photoemission induced by laser breakdown
'" " c
'" " UJ (l)
o ::J
u::
Me
©rOO
371 372 373 374 375
Wavelength I nm
Figure 5. Supersonic jet excitation spectrum for chemical species located a1 R, = 0.3 in TLC. Fluorescence is monitored at 393.5 nm. A mixture sample of 9-methylanthracene and 9-chloroanthracene :5 developec by n-hexane.
lasted 20 ILS even at the fluorescence detection port, but it could be also reduced to negligible levels by temporal discriminat~on. Long-lived photoemission continued more than 130 p.s a:'ter the desorption laser pulse. The photoemission intensity was not critical to the excitation and fluorescence wavelen,ths. This was reduced by using a narrow gate width, but it WhS still difficult to remove completely even at a gate width of IlLS. It is probably due to fluorescence from chemicals adsorbed on the small particulates ablated from the TLC gel. MOl e gentle laser ablation, e.g. by using an infrared CO2
laser, may reduce formation of particulates, but this approach was not investigated in this study due to unavailability of the equipment.
Timillg of Two Laser Pulses. The dependence of the signal intensity on the time period between the firing of the two dye lasers was not investigated quantitatively, due to a poor S /\1 ratio of the signal. However, the largest signal providing a cooled spectrum was observed only when the timing was exactly adjusted to 130 p.S ± 2 ns. This fact implies that the sample is localized in the jet pulse and is focused within a short time period. This is consistent with a sample pulse width of -4 p.s observed in the previous studies of LD/SSJ and LA/SSJ (22,23). As pointed out, this is advantagec,us for improving the sensitivity since the amount of the sample on the TLC sheet is quite limited. In current SSJ spectrometry, it is necessary to use at least several milligrams of sample to optimize experimental conditions. This amount sometimes exceeds a fatal dose for a heavily toxic compound. It is not'3d that the sample remaining on the TLC is safely recovered after the measurement. Therefore, even a toxic sample could be measured with negligible levels of contamination 'n the laboratory.
TLC Sample. The sample on the TLC sheet was developed by n-he'ne, and the SSJ spectrum was measured at specified Rf value3. The excitation spectra recorded for the mixture sample ,)f 9-methylanthracene and 9-chloroanthracene are shown if Figures 5 and 6. The wavelength of the fluorescence monochlOmator was adjusted to 393.5 nm to monitor vibronic bands, a; which fluorescence from both the components could be detecoed within a spectral resolution of 4.8 nm. When the excitatic·n spectrum is recorded at Rf = 0.3, a single peak appears 1t 371.16 nm, which corresponds to the 0-0 transition for 9-methylanthracene. When the measurement is carried out at Ii f = 0.4, a single peak appears at 373.25 nm correspondin;, to the 0-0 transition for 9-chloroanthracene. No other pe aks are observed in this narrow spectral range. As demonstrated, this method allows the measurement of the

CD
" t: CD
" '" CD o :::l II
370
CI
OO©
373 374 3 7 5
Wavelength I nm
Figure 6. Supersonic jet excitation spectrum for chemical species located at Rf = 0.4 in TLC. The experimental conditions are identical with those in Figure 5.
excitation spectrum for the chemical species separated by chromatography. This is a distinct advantage of TLCI LD ISSJ over the other techniques combining SSJ with GC, SFC, or LC. This figure of merit may allow the apJlication of this method to unknown samples.
SSJ spectrometry using no chromatograph separation has some difficulties in the assignment of the chemical species in the mixture sample, since there are many possible spectral patterns by a combination of the spectrum. The present TLC technique provides additional selectivity in SSJ spect rometry, and furthermore the assignment of peaks to a spec ific component might be performed even when the separation resolution is incomplete; if a group of peaks tends to in.~rease or decrease in the same manner when the R, is chan~.ed, they might be assigned to the signals originating from t he same component.
Conventionally, absorption or fluorescence spec1.rometry has been used in the TLC detector. More recently, a laserbased TLC detector utilizing fluorescence (24, 25), thermal lens (26,27), or mass spectrometry (28) has been reported. However, these methods sometimes suffer from poor spectral selectivity and from lack of information in the assignment. Low-temperature spectrometry has also been used in the TLC detector; fluorescence line narrowing spectrometry (FLNS) is applied to a PAH-nucleoside adduct adsorbed 01 a TLC plate cooled at a liquid helium temperature (29). However, the spectral lines are not completely resolved, which may be partly due to a complex structure of the adduct molecule and to the interaction between the sample molecule and the solid substrate.
Chromatogram. Figure 7 shows chromatograms neasured by adjusting the excitation and fluorescence wavelEngths to optimum values for 9-methylanthracene and ~'-chloroanthracene, respectively. Only single components are observed in the chromatograms. No other signal peaks are observed at different R, values. It indicates that these compoJnds are present at R, = 0.3 and 0.4, respectively. In the measnrement, 4.9 and 1.7 !J.g of the above compounds are charged on the TLC sheet, respectively; 9-methylanthracene is slightly ove ,charged and is appreciably broadened. From the SIN ratio, the detection limit of 9-chloroanthracene is estimated to be ~ 10 ng, which is similar to the case in the measurement of ';he excitation spectrum. This is comparable to the values for naphthalene derivatives separated by GC using a conventional (noncapillary) separation column combined with a SSJ fluorescence detector (4). The separation resolution is rather poor at present, but it may be improved by using a reversephase sheet, though it is not commercially available yet.
ANALYTICAL CHEMISTRY, VOl. 62. NO.4. FEBRUARY 15, 1990 • 377
1:'iii c CD :s CD
" C CD
" '" CD o :::l II
Rf 0.8
3 4 5 Migration Distance I cm
Figure 7. Chromatograms for mixture sample of 9-chloroanthracene and 9-methylanthracene. The excitation and fluorescence wavelengths (nm) are (A) 371.16, 390.6 and (B) 373.25,393.5.
::B CI
1:- ©rOO 'iii c ~ .E
CD
" C CD
" Me
'" OO© CD 0 :::l II
375
Wavelength I nm
Figure 8. Supersonic jet excitation spectrum for chemical species located at Rf = 0.7 in TLC. Fluorescence is monitored at 393.5 nm. The sample is developed by the mixed solvent of n -hexane and chloroform (2: 1).
Further improvement may be obtained by using high-performance thin-layer chromatography (HPTLC).
Resolution on Excitation Spectrum. Since the real sample contains many chemical species, it is sometimes difficult to resolve all the components by chromatography. Even in such cases, it is possible to resolve the components on the excitation spectrum in TLC/LD/SSJ spectrometry. Figure 8 shows the excitation spectrum measured for the mixture sample developed by the mixed solvent of n-hexane and chloroform (2:1). In this condition, 9-chloroanthracene and 9-methylanthracene are not resolved on the TLC sheet. In room-temperature spectrometry they provide almost identical excitation and fluorescence spectra, and thus it is difficult to determine these components selectively by TLC equipped with a conventional fluorometric detector. As shown in Figure 8, these components are clearly resolved on the SSJ excitation spectrum, since they provide sharp 0-0 transition peaks at different wavelengths. This figure of merit may be ascribed to good spectral selectivity in TLC/LD/SSJ spectrometry.

378 Anal. Chern. 1990, 62, 378-336
LITERATURE CITED
(1) Hayes, J. M.; Small, G. J. Ana/. Chern. 1983, 55, 565A. (2) Johnston, M. V. TrAG, Trends Anal. Chern. 1984, 3, 58. (3) Lubman, D. M. Anal. Chern. 1987, 59, 31A. (4) Hayes, J. M.; Small, G. J. Ana/. Chern. 1982, 54, 1202. (5) Pepich, B. V.; Callis, J. S.; Danielson, J. O. S.; Gouterman, M. Rev.
Sci. Instrum. 1986, 57, 878. (6) Pepich, B. V.; Callis, J. B.; Burnes, D. H.; Gouterman, M.; Kalman, D.
A. Anal. Chern. 1986, 58, 2825. (7) Stiller, S. W.; Johnston, M. V. Ana/. Chern. 1987, 59, 567. (8) Imasaka, T.; Tanaka, K.; Ishibashi, N. Anal. Sci. 1988, 4, 31. (9) Imasaka, T.; Shigezumi, T.; Ishibashi, N. Analyst 1984, t09, 277.
(10) Imasaka, T.; Okamura, T.; Ishibashi, N. Anal. Chern. 1986, 58, 2152.
(11) Imasaka, T.; Tashiro, K.; Ishibashi, N. Anal. Chern. 1986, 58, 3242. (12) Imasaka, T.; Yamaga, N.; Ishibashi, N. Anal. Chern. 1987, 59, 419. (13) Simons, J. K.; Sin, C. H.; Zabriskie, N. A.; Lee, M. L.; Goates, S. R. J.
Microcol. Sep. 1989, 1, 200. (14) Goates, S. R; Sin, C. H.; Simons, J. K.; Markides, K. E.; Lee, M. L. J.
Microco/' Sap. 1989, 1, 207. (15) Li, L.; Lubman, D. M. Anal. Chern. 1989, 61, 1911. (16) Powers, O. E.; Hansen, S. G.; Geusic, M. E.; Puiu, A. C.; Hopkins, J.
B.; Dietz, T. G.; Duncan, M. A.; Langridge-Smith, P. R. R.; Smalley, R. E. J. Chern. Phys. 1982, 86, 2556.
(17) Hopk ns, J. B.; Langridge-Smith, P. R R.; Morse, M. D.; Smalley, R. E. J. Clern. Phys. 1983, 78, 1627.
{18} Haya:;hi, T.; Imasaka, T.; Ishibashi, N. Chem. Phys. 1986, 109,145. (19) Imas3.ka, T.; Fukuoka, H.: Hayashi, T.; Ishibashi, N. Anal. Chim. Acta
1984 156,111. {20} Amirnv, A.; Horwitz, C.; Jortner, J. J. Chern. Phys. 1988, 88, 3092. {21} Li, L. Lubman, D. M. Rev. Sci. Instrum. 1988, 59, 557. (22) Imasaka, T.; Tashiro, K.; Ishibashi, N. Anal. Chem.1989, 61, 1530. (23) Arrm/smith, P.; de Vries, M. S.; Hunziker, H. E.; Wendt, H. R. Appl.
Phys B 1988,46, 165. (24) Berrran, M. R.; Zare, R. N. Anal. Chem. 1975, 47, 1200. (25) Bicking, M. K. L.; Kniseley, R N.; Svec, H. J. Ana.l. Chem. 1983, 55,
200. (26) Chen. T. I.; Morris, M. D. Anal. Chern. 1984, 56, 19. {27} FotioJ, F. K.; Morris, M. D. Anal. Chern. 1987, 59, 185. (28) Finney, R. W.; Read, H. J. Chromatogr. 1989, 471,389. (29) Coor:er, R. S.; Jankowiak, R.; Hayes, J. M.; Pei-qi, L.; Small, G. J.
Anal Chern. 1988, 60, 2692.
RECEIVEI) for review August 14, 1989. Accepted November 22, 1989. This research is supported by Grants-in-Aid for Scientific Research from the Ministry of Education of Japan and by I<.urata Foundation.
Optimization of Separations in Supercritical Fluid Chromatography Using a Modified Simplex Algorithm and Short Capillary Columns
Jeffrey A. Crow and Joe P. Foley'
Department of Chemistry, Louisiana State Uniuersity, Baton Rouge, Lcuisiana 70803
A modified simplex algorithm has been used to optimize supercrltlcal fluid chromatography (SFC) separations of samples containing nonhomologous, nonollgomeric components. Short capillary columns are employed In the Initial separations, with a transfer to a longer column for greater efficiency as needed. Two chromatographic response functions, based on peakvalley ratio or threshold resolution criteria, were found to be suitable for SFC. Two- and three-variable simplexes utilizing (I) density gradient rate and temperature, (Ii) simultaneous pressure and temperature gradient rates, or (iii) initial density, density gradient rate, and temperature provided good results for the samples In this study. Convergence to the global optimum was shown for case i by restarting the simplex in another part of the parameter space. A synthetic mixture of three dlfflcult-to-separate sesquiterpene lactones was separated by optimization on a short column using the three-parameter simplex and then transferring the method to a longer column.
INTRODUCTION More often than not, the initial separation of a given sample
is unsatisfactory, usually because the desired resolution between all the peaks of interest is insufficient. To improve the separation in an efficient manner, an optimization procedure with well-defined goals is strongly recommended (1). The goals set may vary depending on how many peaks are of interest, the resolution required, the importance of analysis time, and other considerations. The point at which an optimization procedure is terminated depends on the quality of the separation desired; there is a distinct difference between an acceptable and an optimum separation. The decision upon which optimization is usually based takes into account a
0003-2700/90/0362-0378$02.50/0
minimum resolution in some maximum time frame (2). Many chromat')graphic response functions (CRF's) have been developed md used based on this idea (3, 4).
Each )f the three terms in the fundamental resolution equation (5) can be optimized to improve the separation. Retentio 1 (k~ and the selectivity (a) should first be optimized via chan;es in the density of the mobile phase, the temperature, and the gradient rates. Optimization of these two paramet,,"s is clearly the first step, since it will indicate if the current mobile phase/stationary phase combination is adequate fo:' the separation being considered. The efficiency of a column, N, is determined by its length and the nature of the statilnary phase, including column diameter or particle size. Giuen the square root dependency of resolution on N, large changes in parameters controlling N (e.g., column length or lineal velocity) will result in only moderate changes in resoluti(n and thus should only be considered if changes in the parameters controlling selectivity and retention in SFC (composition, density, temperature (or their respective gradients, i' employed)) do not suffice.
Super critical fluid chromatography (SFC) displays GCand/or LC-like behavior, depending on both the solutes and the expe -imental conditions. Some components may partition by their vapor pressures while others partition by solventlike properties of the mobile phase (6). As the experimental conditions are changed, the behavior of some or all of these compommts may be reversed. Elution order may also depend on such properties as basicity and steric hindrance (7). Finally, many of the parameters that control retention and selectivity are moderately to highly synergistic (8). For these reasons, univariate optimization strategies (sequential optimization of one p.lJ'ameter at a time) or intuitive approaches are often ineffecti;e in locating a true optimum (3), hence the need for a simult1neous multivariate approach in order to obtain the best po, sible separation.
© 1990 Am€ rican Chemica! Society

Historically, SFC has largely been used for the separation of homologous or oligomeric series of compounds (pruticularly those without chromophores), and methods for these types of separations are relatively easy to develop intuitively. However, as SFC is applied more frequently to samples with diverse, nonhomologous components, it is clear that a better optimization strategy (or theory) will be necessary
The sequential simplex method is a multivariate optimization procedure that uses a geometrical fIgure called a simplex to move throughout the response surface in searOl of the optimum set of experimental conditions (9). The simplex has been successfully used in various forms of chromatography, particularly high-performance liquid chromatograph) (10--12) and gas chromatography (13-16). To our knowledge, however, the present study represents the first application of the simplex method to SFC. In the present work we investigate the ability of a simplex algorithm to optimize SFC sepaations. First, the simplex method is used with a synthetic test mixture for initial assessment of the procedure, and then it is applied to some difficult-to-separate sesquiterpene lactone, using a more rigorous three-parameter optimization.
THEORY
Simplex Algorithm. In the simplex method, the number of initial experiments conducted is one more than the number of parameters (temperature, gradient rate, etc.) t) be simultaneouslyoptimized. These initial experiments Establish the vertices of a geometric figure (simplex), which \liII subsequently move through the parameter space in seare h of the optimum. Once the initial simplex is established, tha vertex with the lowest value is rejected, and a new point is f)und by reflecting the simplex in the direction away from the ,ejected vertex. In this way the simplex proceeds toward the optimum set of conditions. Details on the simplex algori1hm are available elsewhere (3,4, 9, 17-19).
Some advantages of the simplex method include the following: (1) little chromatographic insight is required, (2) computational requirements (relative to other st,ltistical strategies) are minimal, and (3) any number of par,lmeters may be considered. Some disadvantages of the sim plex algorithm are (1) a large number of experiments may be :'equired to fInd an optimum, (2) little insight into the responSE surface is provided, and (3) a local rather than a global optim 1m may be found (3). With respect to the latter defIciency, the chances of fInding a global optimum are enhanced by using a nodifIed simplex which allows other operations besides reflection, such as expansions and contractions. The chances of a m staking a local optimum for the global optimum are also red lced by restarting the simplex in a different region of the pa:'ameter space. If the same optimum is found after restart ing the simplex, it is probable that the global optimum h,s been found.
Response Functions. For chromatographic optirr,ization, it is necessary to assign each chromatogram a numerical value, based on its quality, which can be used as a responSE for the simplex algorithm. Chromatographic response fenctions (CRFs), used for this purpose, have been the topic of many books and articles, and there is a wide variety of such CRFs available (3, 4, 20, 21). The criteria employed by G:l,Fs are typically functions of peak-valley ratio, fraction ,I peak overlap, separation factor, or resolution. After an e>,tensive (but not exhaustive) survey, we identifIed two CRFs ,hat are straightforward and easy to use. We intentionally avoided the more complicated CRFs that include factors of maximum analysis time, minimum retention time, or other a:'bitrary weighting factors. As discussed by Schoenmakers (c), these complex CRFs are neither as versatile nor as desirable as previously believed. The "multiple" weighting factors of these CRFs can usually be reduced to a single weighting factor
ANALYTICAL CHEMISTRY, VOL. 62, NO.4, FEBRUARY 15, 1990 • 379
P 1,2
Figure 1. Illustration of the peak-valley ratio measurement used for the optimization process. See eq 2 for the response function used in conjunction with this criterion.
simply by rearrangement of the CRF. The first CRF we considered uses a threshold criterion
based on resolution between peaks (R,), given the equation
eRF-l = l/kw R"min 2:: x = 0 R"min < x (1)
In eq 1, kw is the capacity factor for the last peak (retention time may be used instead), and R,min is the minimum acceptable resolution set arbitrarily by the user. CRF-l favors chromatograms with a resolution greater than an arbitrary value "x" for all peaks in the shortest amount of time possible. For chromatograms where R,,min < x for any pair of peaks, the response is set to zero. If the resolution between all pairs of peaks is greater than x, the response is set equal to l/kw• Thus as analysis time decreases, the response function value increases provided that the resolution does not fall below the threshold value. For our analyses, R, min was chosen to be unity. A different value may be more' appropriate in some instances.
An inherent problem with CRF-l is its inability to distinguish between chromatograms with a resolution below the threshold. All such chromatograms would have a value of zero, among which the algorithm could not differentiate. A more continuous CRF may therefore be desirable in some instances.
The second CRF we considered is a continuous one based on the ratio of peak height to valley depth. There are several ways in which this ratio can be implemented, and the specific method we used, first introduced by Christophe (22), is illustrated in Figure 1. The resulting CRF is
CRF-2 = II(Pi,i-[Pi,i+1)1/2
tw (2)
where, for the ith peak, Pi,i-l = 1 - (vi-d hi) and Pi,i+l = 1 -(vi+dh i) (see Figure 1).
CRF-2 also favors short analysis times and well-resolved peaks. There is no threshold value for resolution, and the compromise between resolution and analysis time is not as well-defined as in CRF-1. Inclusion of analysis time in the denominator of an objective function may result in the loss of some information, compensated for by a rapid analysis time (23). It is important to note, however, that as peaks become overlapped CRF-2 decreases rapidly, as shown in Figure 2, and it is unlikely that a short analysis time will compensate for poor resolution (3). This is true only to a point, however, as the peak-valley ratio utilized by CRF-2 does not diminish to an appreciable extent until the resolution falls below a value of 1 to 1.25. If a minimum resolution is an absolute requirement, it is probably better to use a threshold criterion such as that introduced earlier so that the desired resolution is set by the user.
Solvent Peak. A common problem in SFC is the separation of the solvent peak and the first peak of interest. For reproducibility and quantitation, it is important to separate the peaks of interest from the highly asymmetric, tailing

380 • ANALYTICAL CHEMISTRY, VOL. 62, NO.4, FEBRUARY 15, 1990
1.2,.---------------------,
1..
~ ... ;a >-'" ...l ... ...l
~
'" .. , ., '" ..
•. 2
•.• -h-__ --_~~ __ ~~ ___ --_-...l 0.00 0.25 0.50 0.75 1.00 1.25 1.50 1.75 2.00
RESOLUTION
Figure 2. Relationship between resolution and peak-valley ratio as calculated from the equation P = 1 - 2 exp(-2R ,'). See ref 3 for details.
Figure 3. Illustration of the method for determining resolution between the soivent peak and the first peak of interest. The method was taken and modified from that introduced by Schoenmakers et al. (24). See eqs 3 and 4 in text.
solvent peak. IfCRF-l or any other CRF that uses resolution (R,) is employed, a procedure suggested by Schoenmakers et al. (24) and modified in our laboratory can be used to measure the resolution between the solvent peak and the first solute peak.
Schoenmakers' calculation uses the width of each peak measured at 13.5% relative to the solute peak and a weighting factor proportional to the width of the solvent peak. Our modification is the measurement of both peak widths at 50% relative to the solute peak instead of at 13.5%. We have found the former measurement significantly easier because it more readily avoid problems caused by (i) potential base-line disturbances on the lower part of the solvent peak tail resulting from the start of a gradient or (ii) imprecise peak width measurements reSUlting from low signal-to-noise ratios (i.e., near the limit of detection).
In order to be equivalent to Schoenmakers' original expression, our modification requires that the coefficient in the denominator of the weighting factor expression be reduced from 4 to 2.35. Our modifications are shown in eq 3 and in Figure 3. In eq 3, w'P is the width of the solvent peak
W,pH'/2 wf=-- (3)
2.35to
measured at 50% relative to the solute peak, N is the plate count of the column, and to is the retention time of the solvent peak. The solute peak used to calculate the efficiency will obviously affect the value of Wf, and should typically have a k'value between two and four. Note that if the solvent peak was ideal (symmetric instead of tailed), Wf would be unity. For broader solvent peaks, Wf becomes larger. The resolution between the solvent peak and first analyte peak (R,'P) is calculated by
2 + k R sp = ___ '_R 0
s 2Wf + k, s (4)
where R, 0 = tltRI W,olute and h, is the capacity factor for the solute p'lak.
Note ',hat no such modifications for the solvent peak are generally necessary for CRFs that employ a peak-valley ratio, since thE overlap is measured directly and no assumptions are made cO:1cerning peak shape. As the first solute peak becomes more ov lrlapped with the solvent tail, the peak-valley ratio will rapi dly decrease toward zero and give rise to an unfa· vorable response.
Increasing N. For a new sample, the time required for analysis must include the development of the method for separation. In the case of SFC, a great amount of time can be savee by performing the method development with a very short column (25). This can be done efficiently in combination with th,· modified simplex algorithm described above. Additional time will of course be saved if this short column proves to be sufficient, once the conditions are optimized, for the final analysis If the current column does not provide the required efficieney, the resolution can be increased by a factor y via a y2 incl'ease in column length. If a gradient is being used, the gradient rate should be decreased appropriately. Assuming that In k vs the variable of interest (density, pressure, or tempen.ture) is linear, the gradient rate should be decreased by y' (25). Note that although an increase in column length results n a proportional increase in analysis time, hours of analysis time have already been saved by first optimizing the separat on on a short column.
If the separation is still unsuitable after optimization of the experirr.ental conditions and column length, selectivity must be optimized further by changing the stationary phase, the type of ~olumn, or the mobile phase by changing it or adding a modifier.
EXPERIMENTAL SECTION SFC System. The chromatographic system consisted of a
Model 501 supercritical fluid chromatograph (Lee Scientific, Salt Lake City, UT) with the flame ionization detector (FID) set at 375°C. The instrument was controlled with a Zenith AT computer. A pneumatically driven injector with a 200-nL or a 500-nL loop wa, used in conjunction with a splitter. Split ratios used were between 5:1 and 50:1 depending on sample concentration and the chosen linear velocity, while the timed injection duration ranged 'rom 50 ms to 1 s. We found that variation of both the split ratio and the injection time allowed greater control over the amount of solute transferred onto the column. Data were collected with an IBM-AT computer using Omega-2 software (PerkinElmer, :-lorwalk, CT). The simplex program and the response funetio;} calculation programs were written in TrueBASIC (TrueB<l.SIC, Inc., Hanover, NH). The capillary columns used were a ('.55·m, a 1-m, and a 3-m SB-Biphenyl-30 (30% biphenyl, 70% methyl polysiloxane), with a 50-,um internal diameter and a film thickness of 0.25 ,urn. The mobile phase was SFC grade carbon dioxide (Scott Specialty Gases, Baton Rouge, LA). Linear velociti"s were 1.5 and 2.0 cmls through the 50',um frit restrictor, estimated from the retention time of methane at 100 atm and 100°C. To prevent plugging, the 15-,um split restrictor was run out of ;he oven into a vial of methylene chloride. This was import<nt in the analysis of the more polar sesquiterpene laetone sample (vida infra). Density was held constant until the solvent had ell ted, at which point a gradient program was initiated.
Samples. Two samples were used to test the simplex method. Sample 1 was a synthetic test mixture consisting of six low-tomediunl molecular weight solutes (acetophenone, propiophenone, bicyclo'lexyl, biphenyl, undecylbenzene, and benzophenone) of varying polarity and functionality dissolved in HPLC grade hexane An injection duration of 100 ms was used with this sample. Sample 2 was a synthetic mixture of three sesquiterpene lactone, (glaucolide A, burrodin, and psilostachyin A) dissolved in HPLC grade methylene chloride. An injection duration of 200 ms was used in conjunction with this sample.
Sim ~lex Algorithm. The modified simplex algorithm was based on that used by NeIder and Mead (27) except that any vertex obtained through a contraction that had the worst response

ANALYTICAL CHEMISTRY, VOL. 62, NO.4, FEBRUARY 15, 1990 • 381
Table 1. Results of Two-Parameter Simplex, Run 1
density rate, temp, response simplex retained vertex (g/mL)/min "C (eq 2) movement vertices
0.075 75 0.150 6.51 0.123 88 0.186 5.00 0.088 123 0.122 4.52 0.110 40 _w b reflection 1,2 0.094 102 0.175 4.84 Cv; contraction 1,2 0.142 115 0.187 3.93 reflection 2,5
7 0.175 135 0.0601 3.45 expansion 2,5 8 0.172 101 0.205 3.85 reflection 2,6 9 0.211 100 0.205 3.67 expansion 2,6
10 0.229 128 reflection 6,9 11 0.150 98 0.199 4.24 Cw contraction 6,9 12 0.218 83 0.201 3.94 reflection 9,11 13 0.279 85 reflection 9,12 14 0.182 95 0.221 3.99 Cw contraction 9,12 15 0.174 112 0.193 3.68 reflection 9,14 16 0.207 90 0.234 3.69 Cw contraction 9,14 17 0.179 84 0.227 4.11 reflection 14,17 18 0.204 80 0.227 3.97 reflection 14,17
(l tw is the retention time of the last eluting peak. b TIllS value is given to conditions that are outside the boundary limits.
was kept and the next-to-worse vertex was rejected inst"ad. This avoids massive contractions which often reduces the I=arameter space too quickly (see ref 9). Experimental conditions for the initial vertex are chosen intuitively by the user; the remaining vertices of the initial simplex are calculated by the algori ohm using a user-specified step size. Boundary conditions for the I ~arameter space were specified according to instrumental limitations or arbitrarily, but with rational user judgement. When the simplex algorithm moved outside the set boundaries, a respons, value of negative infinity was given to that coordinate. Peak and valley heights were measured from the chromatograms on screen using the data collection system and a program was written te calculate the peak-valley ratio response function from these val ues. The response function value was subsequently used in th" simplex program.
RESULTS AND DISCUSSION Two-Variable Simplex. While the simplex algOl ithm can
be performed with any number or kind of param, ters, the number of experiments required for convergence' 0 an optimum rapidly increases as more parameters are censidered (3). Also, since the number of parameters changing is larger, the response surface is more complex, i.e., with more local optima, and thus a global optimum may be more difficult to find. For these reasons it is advisable to limit the parameters to the ones believed to be important in the opti mization process. For SFC, these include density (or pressure), temperature, mobile phase composition, and gradientf of each. To reiterate, the key to a rapid optimization fOJ a given separation is to consider only the most important, ariables.
In our first attempts at SFC optimization we ccnsidered only two parameters: density gradient and columr. temperature. The boundary limits for this simplex were 0.01-0.4 (g/mL)/min for the density gradient rate and 40-20(1 ac oven temperature. The linear velocity for this simple, was approximately 1.5 cm/s. Sample 1 described earlier lias used to test the optimization procedure. Table I gives the experimental conditions and value of the response function (CRF-2) at each vertex of the simplex. The amount of peal: overlap can be ascertained by multiplying the response in t1e tables by tw (see eq 2). Also note that the "retained vertices" column refers to the vertices kept just prior to the generati)n of the current vertex. Figure 4 illustrates the movemellt of the simplex algorithm and the evolution of the CRF. \\Then the simplex algorithm chose conditions outside the boundary limits, a very negative response value was given te that coordinate. This can be seen in the tables and in the response progress figures where negative columns indicate this very
140
(a)
120
'" '" ;0 100 E--< '" '" .. ..,
13 :;:
'" E-60
40 0.05 0.10 0.15 0.20 0.25 0.30
DENSITY RATE
0.25 (h)
'" 0.15 en Z 0 .. en
'" '" 0.05
1 2 3 4 5 6 7 8 ? 10 11 12 13 14 15 16 17 18
VERTEX
Figure 4. First simplex optimization of density gradient rate and column temperature performed on the test mixture, showing (a) simplex movement and (b) response progress.
negative response. Chromatograms for selected vertices in the simplex are shown in Figure 5. The simplex was terminated after a good separation was obtained under 4 min. The best result was obtruned at vertex 16, at a density gradient of 0.207 (g/mL) /min and an oven temperature of 90 ac, as seen in Figure 5d.
Given the possibility of finding a local rather than a global optimum, the simplex was restarted from another region of the parameter space by using the same boundary limits and linear velocity as before. The data for this second simplex are given in Table II. Figure 6 shows the simplex movement
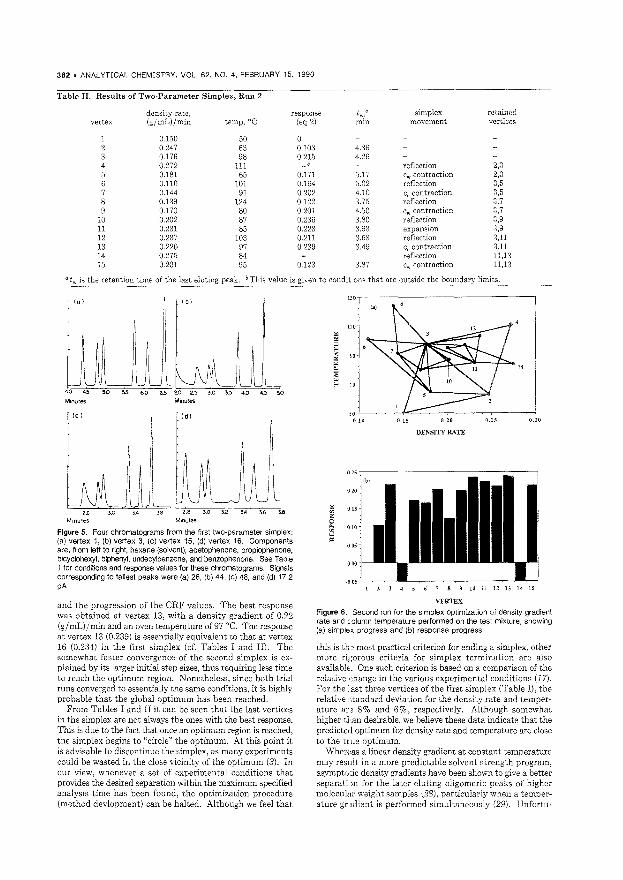
382 • ANALYTICAL CHEMISTRY, VOL. 62, NO.4, FEBRUARY 15, 1990
Table U. Results of Two-Parameter Simplex, Run 2
density rate, response two , simplex retained
vertex (g/mL)/min temp,OC (eq 2) min movement vertices
1 0.150 50 0 2 0.247 63 0.103 4.36 3 0.176 98 0,215 4.26 4 0.272 111 _rob reflection 2,3 5 0.181 65 0.171 5.17 Cw contraction 2,3 6 0.110 101 0.164 5.02 reflection 3,5 7 0.144 91 0.202 4,10 cr contraction 3,5 8 0.139 124 0.122 3.75 reflection 3,7 9 0.170 80 0.201 4.50 Cw contraction 3,7
10 0.202 87 0.236 3.80 reflection 3,9 11 0.231 85 0.223 3.93 expansion 3,9 12 0.237 103 0.211 3.53 reflection 3,11 13 0.220 97 0.239 3.49 <;. contraction 3,11 14 0.275 84 reflection 11,13 15 0.201 95 0.123 3,87 Cw contraction 11,13
a tw is the retention time of the last eluting peak. bThis value is given to condit ODS that are outside the boundary limits.
101
4..0455D5.36.06.5
Minutes Minutes
Ie I Idl
3B
Figure 5. Four chromatograms from the first two-parameter simplex: (a) vertex 1, (b) vertex 3, (c) vertex 15, (d) vertex 16. Components are, from left to right, hexane (solvent), acetophenone, propiophenone, bicyclohexyl, biphenyl, undecylbenzene, and benzophenone. See Table I for conditions and response values for these chromatograms. Signals corresponding to tallest peaks were (a) 26, (b) 44, (c) 48, and (d) 17.2 pA.
and the progression of the CRF values. The best response was obtained at vertex 13, with a density gradient of 0.22 (g/mL)/min and an oven temperature of97 cC. The response at vertex 13 (0.239) is essentially equivalent to that at vertex 16 (0.234) in the first simplex (cf. Tables I and II). The somewhat faster convergence of the second simplex is explained by its larger initial step sizes, thus requiring less time to reach the optimum region. Nonetheless, since both trial runs converged to essentially the same conditions, it is highly probable that the global optimum has been reached.
From Tables I and II it can be seen that the last vertices in the simplex are not always the ones with the best response. This is due to the fact that once an optimum region is reached, the simplex begins to "circle" the optimum. At this point it is advisable to discontinue the simplex, as many experiments could be wasted in the close vicinity of the optimum (3). In our view, whenever a set of experimental conditions that provides the desired separation within the maximum specified analysis time has been found, the optimization procedure (method devlopment) can be halted. Although we feel that
1"~----------------,
lal
110
'o+----~~~--.----____ ~ 0.10 0.15 0.20 0.25 0.30
DENSITY RATE
o~,-----------------,
020
" 015
'" Z 0 :;; 010
" 0: oos
000
1 2 3 4 5 6 7 8 9 10 11 12 13 14 15
VERTEX
Figure 6. Second run for the simplex optimization of density gradient rate and column temperature performed on the test mixture, showing (a) simplex progress and (b) response progress.
this is the most practical criterion for ending a simplex, other more rigorous criteria for simplex termination are also availablE. One such criterion is based on a comparison of the relative "hange in the various experimental conditions (17). For the jast three vertices of the first simplex (Table 1), the relative ::tandard deviation for the density rate and temperature an 8% and 6%, respectively. Although somewhat higher titan desirable, we believe these data indicate that the predicted optimum for density rate and temperature are close to the true optimum.
Wher"as a linear density gradient at constant temperature may reslllt in a more predictable solvent strength program, asympto ;ic density gradients have been shown to give a better separati m for the later-eluting oligomeric peaks of higher molecular weight samples (28), particularly when a temperature gndient is performed simultaneously (29). Unfortu-

ANALYTICAL CHEMISTRY, VOL 62, NO.4, FEBRUARY 15, 1990 • 383
Table III. Results of Two-Parameter Simplex, Simu ltaneous Gradients
temp pressure rate, rate, response tw ,
0 simplex retained vertex atm/min 'Cjmin (eq 2) min movement vertices
30 20 0.263 3.61 69 25 0.326 2.62 40 39 0.283 3.15 79 44 _oob reflection 2,3 42 26 0.283 3.23 Cw contraction 2,3 71 12 0.332 2.59 reflection 2,5
7 86 -1.7 expansion 2,5 8 97 11 0.296 2.33 reflection 2,6 9 83 15 0.341 2.47 Cr contraction 2,6
10 85 1.6 reflection 6,9 11 73 19 0.333 2.59 Cw contraction 6,9 12 85 22 0.342 2.47 reflection 9,11 13 93 27 0.345 2.38 expansion 9,11 14 103 23 0.325 2.31 reflection 9,13 15 80 20 0.344 2.51 Cw contraction 9,13 16 90 33 0.338 2.42 reflection 13,15 17 85 19 0.331 2.46 Cw contraction 13,15 18 98 26 0.338 2.36 reflection 13,17
G tw is the retention time of the last eluting peak. b Thif value is given to conditions that are outside the boundary limits.
4S
'" '" 35
'" '" '" 25
'" ;;,
'" iii 15
'" "" ::;:
'" '" 3. 50 7. 90 110
PRESSURE RATE
1 2 3 4 5 6 7 8 9 10 11 12 13 14 15 16 Ii 18
VERTEX
Figure 7. Simplex optimization using two simultaneous [radients (pressure and temperature) performed on the test mixture, showing (a) simplex progress and (b) response progress.
nately, asymptotic gradients are more tedious to g,merate experimentally, and this disadvantage would be exacmbated during the course of a simplex run. Fortunately, however, asymptotic density gradients can usually be approximlted by a linear pressure program. Thus in order to consider the possible benefits of optimizing these variables, a third Himplex algorithm was run by using simultaneous linear pressnre and temperature gradients on this same test mixture nsed in simplex runs 1 and 2. The boundary limits for this f implex were 5-150 atm/min and 5-40 'Cimino The data 'or this simplex are given in Table III, Figure 7a shows the fimplex progress, and the CRF evolution is shown in Figure 7 J. Two chromatograms for this optimization are shown in F gure 8.
( bl
2.0 1 9 2.0 2.1 22 2.3 2.4
Minutes Minutes
Figure 8. Two chromatograms from the simultaneous gradient simplex: (a) vertex 1 and (b) vertex 13 (best response). See Table I for conditions and response values for these two chromatograms. Signals corresponding to tallest peaks were (a) 22 and (b) 52 pA.
Figure 8a is the chromatogram obtained for the initial vertex, while Figure 8b is the chromatogram for vertex 13, at which the best response was obtained. The major improvement observed is about a 33 % reduction in analysis time. For separations to be transferred to a longer column, this reduction of analysis time becomes very significant. For this separation, a higher linear velocity of 2 cmjs was used, resulting in a shorter analysis time than that observed in Figure 5, and thus higher response function values. The temperature gradient reduced peak tailing (cf. Figure 5 and 8) and allowed closer peak spacing without overlap, also contributing to the shorter analysis time.
Three-Variable Simplex. While the above optimizations provide a useful graphical representation of the simplex progress, the initial density (or pressure) is also an important parameter that should be considered in SFC optimizations. We have found that, other factors being equal, the starting density determines the highest initial temperature that can be used without merging the first solute peak and the solvent peak. For this reason the starting density was also included as a parameter in the simplex.
This three-variable simplex algorithm was employed to optimize the separation of a sesquiterpene lactone sample. One of the largest groups of plant products, sesquiterpene lactones possess great biological activity and are useful in many medical and agricultural capacities (30). Separation techniques often used for these compounds include column liquid chromatography, gas chromatography (GC), and reversedphase high-performance liquid chromatography (HPLC).

384 • ANALYTICAL CHEMISTRY, VOL. 62, NO.4, FEBRUARY 15, 1990
Table IV. Results of Three-Parameter Simplex
initial density, density rate, temp, response two 0 simplex retained
vertex g/mL (g/mL)/min 'C (eq 2) min movement vertices
1 0.250 0.100 60 0.132 4.74 2 0.486 0.171 84 0 3 0.309 0.383 84 _rob
4 0.309 0.171 154 5 0.387 -0.089 115 reflection 1,2,4 6 0.329 0.265 91 0.0901 2.09 Cw contraction 1,2,4 7 0.401 0.186 2 4.74 reflection 1,2,6 8 0.332 0.175 116 1.73 Cw contraction 1,2,6 9 0.121 0.189 95 reflection 1,6,8
10 0.395 0.175 86 0.157 2.06 Cw contraction 1,6,8 11 0.317 0.186 42 reflection 1,6,10 12 0.328 0.177 98 0.055 2.41 Cw contraction 1,6,10 13 0.320 0.037 71 0.129 4.66 reflection 1,10,12 14 0.315 0.031 47 reflection 1,10,13 15 0.325 0.141 85 0.131 2.73 Cw contraction 1,10,13 16 0.326 0.241 83 0.128 2.43 reflection 1,10,15 17 0.322 0.088 74 0.146 3.52 Cw contraction 1,10,15 18 0.319 0.101 62 0.163 3.76 reflection 1,10,17 19 0.316 0.082 50 0 expansion 1,10,17 20 0.440 0.143 88 0 reflection 10,17,18 21 0.298 0.111 67 0.132 3.73 Cw contraction 10,17,18 22 0.231 0.025 49 2.73 reflection 17,18,21 23 0.354 0.138 77 0.136 2.85 Cw contraction 17,18,21 24 0.365 0.107 75 0.141 2.47 reflection 17,18,23 25 0.317 0.060 64 0.143 2.38 reflection 17,18,24 26 0.273 0.059 58 0.128 2.31 reflection 17,18,25 27 0.342 0.095 71 0.131 2.51 Cw contraction 17,18,25 28 0.338 0.130 74 0.147 2.42 reflection 17,18,27 29 0.310 0.117 69 0.130 2.46 reflection 17,18,28 30 0.334 0.101 70 0.133 2.36 Cw contraction 17,18,28
a tw is the retention time of the last eluting peak. bThis value is given to concitions that are outside the boundary limits.
i;l z
~ "' '"
VERTEX
Figure 9. Response progress for the three-parameter simplex on the sesquiterpene lactone sample.
None of these methods, however, has proven to be completely satisfactory. Classical column chromatography does not always provide the needed resolution, GC analysis may result in thermal degradation of the sample, and HPLC is limited by the lack of a sensitive universal detector.
For these reasons, SFC would appear to be a promising alternative for the separation of these compounds. To our knowledge, the present study represents the first separation of this class of compounds by SFC. Although somewhat polar and perhaps more amenable to a modified CO2 mobile phase, at least some sesquiterpene lactones can be separated with pure CO, (vide infra).
For the optimization of the sesquiterpene sample, a 55-cm SB-Biphenyl-30 column with an internal diameter and film thickness of 50 and 0.25 I'm, respectively, was used for the separation. Boundary limits were 0.2-0.5 g/mL (initial den-
(0 ) ( b)
\ IL UVl
1b 18 20
Minutes Minutes
Figure '10. Chromatograms from the sesquiterpene lactone sample optimiz&tion for (a) the separation with the best response from the simplex (vertex 18) and (b) the separation after transfer to the 3-m column. Conditions for chromatogram a are given in Table III and for chronatogram b were 0.319 g/mL initial density, 0.01 g/(mL/min) gradient and 62 °C oven temperature. Components are, from left to right, psi ostachyin A, burrodin, and glaucolide A. Signals corresponding to talles: peaks were (a) 44 and (b) 16 pA.
sity), O.)l-{l.4 (g/mL)/min (density gradient rate), and 50-200 °c (tenlperature). Table IV gives the experimental parameters used in the simplex and the responses for the vertices; simplex movement was not shown due to the difficulty of graphically represe3tation of a three-dimensional figure in two dimensions. Figure 9 shows how the CRF evolved as the simplex progressed. After 30 vertices the simplex was terminated, with vertex [8 giving the best response with initial density of 0.319 g/mL, a 0.101 (g/mL)/min density gradient after solvent elution. and an oven temperature of 62 °C. Figure lOa shows the op' .imized chromatogram for this short column.
Increasing N for the Final Separation, We have found that it is worthwhile to have several different lengths of columns on hand so that the efficiency can be varied as necessary once the selectivity and retention have been op-

ANALYTICAL CHEMISTRY, VOL. 62, NO.4, FEBRUARY 15, 1990 • 385
timized. From Figure lOa it is clear that the 55-cm column does not provide sufficient resolution for this sesquiterpene lactone sample. The resolution in this chromatogram is about 0.4 for the last two peaks. Transferring the method to a 300-cm column, an increase in length of 5.5, should increase R, by a factor of 5.51/2 to a value near unity. Tbe corresponding gradient rate to use would be (0.101 (g/mL)/ min) /5.5 = 0.018 (g/mL) /min. To achieve a resolution greater than unity, we employed a slightly lower gradient rate of 0.010 (g/mL)/min. Note that we intuitively selected this lower gradient rate for the final separation to provide a slightly higher resolution. The resulting separation is shown in Figure lOb. A decrease in the signal to noise ratio is appan'nt here, resulting from longer analysis times which decrease 1 he peak heights.
Response Functions. The continuous CRF used above (CRF-2) proved to be the most efficient and success:'ul of all the CRFs we examined. Calculation of CRF values was quick and straightforward, aided by a simple, yet effective, c,)mputer program. As can be seen from Figure 5, however, and as stated in the theory section, continuous CRFs do compronise resolution with analysis time up to a point. If a threshllid CRF with R,m;n = 1.5 (e.g., CRF-1) been used in the first simplex instead' of the continuous CRF-2, vertex 16 would not have been the best set of conditions but would rather have received a value of zero because of peaks two and three (see F:,gure 5). The simplex would have obviously taken a different course dictated by that criterion.
If column efficiency is constant throughout an optimization procedure, a useful parameter to use in eq 1 instead of R, would be the separation factor S, defined as (31)
t2 - t1 8=-- (5)
t1 + t2
Equation 5 has the advantage of easily being obtained from the chromatogram and is related to resolution in the following manner:
Nl/2 R, = 8*-2- (6)
Unfortunately we cannot always assume that the column efficiency will be constant for all peaks in a chroma togram, or for chromatograms run under different conditions. As shown by Snyder, et al. (32), the bandwidth of a peak observed in gradient elution is reduced compared to that obtain.,d under nongradient conditions. The factor by which the bandwidth is reduced is usually a function of gradient steepne,s and is also determined by the instantaneous value of k' as tJ- e solute leaves the column. This reduction in bandwidth cannot be estimated under nongradient conditions, so that in )rder to correctly use the separation factor approach, bandwidths for each chromatogram under different gradient conditions would have to be calculated. In general, it is easier to measure resolution directly using eq 7
t2 - t1 R = -- (7)
S wavg
where t1 and t2 are the retention times and Wovg is the average width of the peaks at the base line. For pairs of peflks with resolution obviously greater than that desired, a meas:lfement is not needed for threshold CRFs like CRF-1.
Solvent Peak. The anticipated problem of separating the first solute peak from the solvent peak was solved by using a response function which severely penalizes such werlap. Since gradients were initiated immediately after the solvent had eluted, analyte peaks on or near the tail of the solvent peak were broad because they were eluted under non ;radient conditions. Figure 5b demonstrates this effect. S'nce the
peaks eluting under nongradient conditions are not focused, the relative height of the valley is greater and the chromatogram is thus penalized. When the first solute peak elutes late enough to be truly influenced by the gradient, it will receive a better value from the response function. Our results indicate that it requires less than 1 min of gradient conditions for the first solute peak to be sharp and well-separated from the solvent.
Since the length of time necessary to elute the solvent will change depending on initial conditions, it may be difficult to determine the hold time needed. Although it is reasonable to use the longest hold time that will be encountered for any one chromatogram for all the chromatograms considered, doing this will penalize those chromatograms in which the solvent elutes well before the end of the set hold time. A better approach is either to manually start gradients once the solvent has eluted or to run a solvent blank before each sample to determine the hold time. Alternatively, if the linear velocity could be accurately predicted, the elution time of the solvent for a given set of experimental conditions could be predicted, assuming the solvent was more or less unretained (k' = 0). A more sophisticated solution would be the use of a data feedback system to start the gradients once the detector signal returns to a given value after solvent elution.
CONCLUSIONS
A systematic method development scheme is clearly desirable for SFC, and as we have shown in the present work, the modified simplex algorithm is a promising approach to the optimization of SFC separations. By use of a short capillary column and first optimizing the selectivity and retention, rapid separations are possible in the development stage, with the potential of optimizing efficiency later if needed. This saves hours of analysis time, especially if the short column proves to be sufficient for the final separation. Confidence that the global optimum has been found is provided by the convergence to the same conditions of two simplexes started at different points within the parameter space.
Since our report represents the first application of the simplex algorithm in SFC, there are many avenues open for development. Although we have demonstrated the potential of simplex optimization in SFC and have shown how it can be successfully implemented, additional studies focusing on the selection of the best combinations of experimental parameters to optimize are clearly warranted. Other opportunities for research include the extension of the simplex method to packed columns and modified mobile phases and a detailed evaluation of other response functions not examined in the present study. Finally, other optimization strategies, such as a grid search (33), factorial design (34), or window diagrams (35) may also prove to be useful.
ACKNOWLEDGMENT The authors gratefully acknowledge N. H. Fischer and his
group for providing the sesquiterpene lactones.
LITERATURE CITED (1) Snyder, L. R.; Glajch, J. L.; Kirkland, J. J. Practical HPLC Method De
velopment; Wiley: New York, 1988. (2) Watson, M. W.: Carr, P. W. Anal. Chern, 1979, 51, 1835-1842. (3) Schoenmakers, P. J. Optimization of Chromatographic Selectivity; El
sevier: Amsterdam, 1986. (4) Berridge, J. C. Techniques for the Automated Optimization of HPLC
Separations; Wiley: Chichester. England, 1985. (5) Snyder, L. R.; Kirkland, J. J. Introduction to Modern Liquid Chromatog
raphy; Wiley: New York, 1979. (6) Chester, T. L.; Inn;s, D. P. HRC CC, J. High Resolut. Chrornatogr,
Chromatogr. Commun. 1985, 8,561-566. (7) Ashraf-Khorassani, M.; Taylor, L. T. J. Chromatogr. Sci. 1988,26,
331-336. (8) Smith, Roger M., Ed. Supercritical Fluid Chromatography; Royal Socie
ty of Chemistry: London, 1988. (9) Deming, S. N., Morgan, S. L Anal. Chern. 1973, 45 (3), A278-A283.
(10) Berridge, J. C.; Morrissey, E. G. J. Chromatogr. 1984, 316, 69-79.

386 Ana/. Chern. 1990, 62, 386-:389
(11) Berridge, J. C. J. Chromatogr. 1982, 244,1-14. (12) Balconi, M. L.; 8i90n, F. Anal. Chim. Acta 1986, 191,299-307. (13) Dose, E. V. Anal. Chern. 1987, 59, 2420-2423. (14) Morgan, S. L.; Deming, S. N. J. Chromatogr. 1975, 112,267-285. (15) Morgan, S. L.; Jacques, C. A. J. Chromatogr. Sci. 1978, 16,
500-504. (16) Bartu, V.; Wicar, S.; Scherpenzeel, G. J.; Leclercq, P. A. J. Chroma
togr. 1986, 370, 219-234. (17) Jurs, P. C. Computer Software Applications in Chemistry; Wiley: New
York, 1986. (18) Deming, S. N.; Parker, L R., Jr. CRG Grit. Rev. Chern. 1978
(September), 187-202. (19) Shavers, C. L.; Parsons, M. L.; Deming, S. N. J. Chern. Educ. 1979,
56 (5), 307-309. (20) Wegscheider, W.; Lankmayr, E. P.; Budna, K. W. Chromatographia
1982, 15 (8), 498-504. (21) Debets, H. J. G.; Bajema, B. L.; Doornbos, D. A. Anal. Chim. Acta
1983, 151, 131-141. (22) Christophe, A. 6. Chromatographia 1971, 4, 455-458. (23) Smits, R.; Vanroelen, C.; Massart, D. L. Z. Anal. Chem. 1975, 273,
1-5. (24) Schoenmakers, P. J.; Naish, P. J.; Hunt, R. J. Chromatographia 1987,
24,579-587. (25) Crow, J. A.; Foley, J. P. HRC CC, J. High Reso/ut. Chromatogr. Chro
matogr. Commun. 1989, 12,467-470. (26) Snyder, L. R. In H;gh-Performance Uqu;d Chromatography: Ad-
vanees and Perspectives; Horvath, C., Ed.; Academic Press: New York, 1980; Vol. 1, pp 208-316.
(27) Nelcer, J. A.; Mead, R. Computer J. 1965, 7, 308-313. (28) Fjelcisted, J. C.; Jackson, W. P.; Peaden, P. A.; Lee, M. L. J. Chroma
togr. Sci. 1983, 21, 222-225. (29) Later, D. W.; Campbell, E. R.; Richter, S. E. HRC CC, J. High Reso/uf.
Chromatogr. Chromatogr. Commun. 1988, 11, 65-69. (30) Fiscl-ter, N. H.; Olivier, E. J.; Fischer, H. D. Fortschr. Chem. Org. Na
turs'. 1979, 38, 47-390. (31) Ober, S. S. In Gas Chromatography; Coates, V. J., Noebels, H. J.,
Fag'~rson, I. S., Eds.; Academic Press: New York, 1958; pp 41-50. (32) Snyder, L. R.; Dolan, J. W.; Gant, J. R. J. Chromatogr. 1979, 165,
3-3). (33) SvoJoda, V. J. Chromatogr. 1980, 201, 241-252. (34) Kong, R. C.; Sachok, S.; Deming, S. N. J. Chromatogr. 1980, 199,
307-321. (35) Lau), R. J.; Purnell, J. H. J. Chromatogr. 1975, 112,71-79.
RECEIVED for review August 14, 1989. Accepted November 3,1989. J.P.F. gratefully acknowledges support provided by grants from the Exxon Education Foundation and the LSU Center for Energy Studies. J.A.C. is the recipient of an LSU Alumni Federation Fellowship.
Determination of Iodine in Oyster Tissue by Isotope Dilution Laser Resonance Ionization Mass Spectrometry
J. D. Fassett* and T. J. Murphy
Center for Analytical Chemistry, National Institute of Standards and Technology, Gaithersburg, Maryland 20899
The technique of laser resonance ionization mass spectrometry has been combined with isotope dilution analysis to determine iodine in oyster tissue. The long-lived radioisotope, 1291, was used to spike the samples. Samples were equlibrated with the 1291, wet ashed under controlled conditions, and Iodine separated by copreclpltatlon with silver chloride. The analyte was dried as sliver ammonium iodide upon a tantalum filament from which iodine was thermally desorbed in the resonance ionization mass spectrometry instrument. A single-color, two-photon resonant plus one-photon ionization scheme was used to form positive iodine ions. Long-lived iodine Signals were achieved from 100 ng of iodine. The precision of 1271f1291 measurement has been evaluated by replicate determinations of the spike, the spike calibration samples, and the oyster tissue samples and was 1.0 %. Measurement precision among samples was 1.9% for the spike calibration and 1.4 % for the oyster tissue. The concentration of iodine determined in SRM 1566a, Oyster Tissue, was 4.44 I'g/g with an estimate of the overall uncertainty for the analysis of ±0.12 I'g/g.
Iodine is an essential trace element for man. Its accurate measurement in foods is vital to understanding human dietary intake and verifying that minimum daily allowances are observed, especially in restricted diets such as infant formulations. Isotope dilution mass spectrometry (IDMS) is an inherently accurate technique (1), a "definitive method" for which systematic errors can be thoroughly evaluated. In general, the quantity of an element is determined by IDMS by measurement of the change in isotopic ratio that is produced by adding a calibrated amount of an enriched isotope
of the el3ment to the sample. As such, the technique can only be used for elements with more than one isotope. Iodine has only on" stable isotope in nature, 1271. However, the radioisotope 291 is long-lived (half-life, 1.59 x 10⁷ years) and availabh. Thus, the accurate measurement of I in biological and botanical matrices by using IDMS is made possible.
Mass spectrometric methods have been developed both to measurn isotope ratios of iodine for IDMS and to measure ultratrace amounts of 1291 in the environment, which is typically at levels 10-6 to 10-12 of stable 1271, itself at part-permillion evels in botanical and biological material. A negative thermal ionization (TIMS) technique has been developed by Heumalln et al. They have used IDMS to determine I in salt, chemicds, food, and water (2-4). A second negative thermal ionization technique has been published by Delmore in which lanthanum hexaboride is cataphoretically deposited onto a rhenium ionization filament. This filament treatment lowers the work function of the rhenium and results in high ionization efficien·;y and measurement sensitivity for iodine (5). Delmore's technique was adapted in our laboratory and used to determine iodine in SRMs 1572 (Citrus Leaves) and 1549 (Powdered Milk) by IDMS (6).
Secondary ionization mass spectrometry (SIMS) was initially iuvestigated to measure 1291 (7). Ion sputtering ionization, .. is done in SIMS, is also used in accelerator mass spectrometry (AMS), which has achieved the lowest detection limits for 1291 (8). AMS effectively eliminates the limiting backgrcund of isobaric molecular interferences which are observe:l in both secondary ionization and thermal ionization mass spectrometry. The detection of 1291 in the environment after the Chernobyl reactor accident is an example of AMS capabilties (9).
Lase! resonance ionization mass spectrometry (RIMS) has been studied in our laboratory for possible application to 1291
This article not subject to U.S. Copyright. Published 1990 b{ the American Chemical SOCiety

ANALYTICAL CHEMISTRY, VOL. 62, NO.4, FEBRUARY 15, 1990 • 387
measurement (10). A relatively simple, single-color ,esonance ionization scheme (two-photon resonance + one-photon ionization) was shown to be both efficient and moderately selective. The practical application of RIMS to the problem of 1291 measurement is impeded by the difficulties in ~chieving high sample utilization efficiencies while using a combination of pulsed lasers and continuous thermal atomization. These experiments did serve to demonstrate that long-lived ion beams of moderate intensity could be generated from nanogram quantities of iodine. Thus, RIMS appeared npable of being used straightforwardly with IDMS to deternine part per million levels of iodine in biological and botankal materials.
We report here the results of an 1DMS analytical project for determination of iodine in SRM 1566a, Oyster Tissue, using ID-RIMS. This project included the calibration of the 1291 spike for concentration and isotopic composition; the determination of iodine analytical blank; the aralysis of previously certified material, SRM 1549 (Powdered Milk); and the analysis of the new SRM material.
EXPERIMENTAL SECTION
Reagents. High-purity reagents, produced by subboiling distillation (11) at NIST and stored in Teflon bottles, Nere used in this study. Ammoniacal cyanide solution was prepared by passing 50 mL of a solution containing 1 g of KCN followed by 10 mL of high-purity water through an acid-cleaned "ation exchange column and collecting the eluate, containing dilute HCN, in 40 mL of 2 mol/L NH,OH.
Isotopic Spike. The isotopic spike was SRM 4949A, Iodine-129 Radioactivity Standard, obtained from the Office of Standard Reference Materials, NIST, Gaithersburg. MD. A solution of this material was prepared in a Teflon bottle and made alkaline by the addition of sodium carbonate. The solution was calibrated by ID-RIMS against high-purity potassium iodide and contained (4.181 ± 0.081) X 10-8 mol/g (Is, n = 6). The measured spike ratio, 1271/1291, was 0.1579 ± 0.0013 (Is, n = 5) or atom fraction content of 0.1364 for 1271 and 0.8636 for 1291.
Chemistry. Duplicate samples of about 1 g, Lccurately weighed, were teken from each of three different bottl!,s of SRM 1566a, Oyster Tissue. A third sample was teken from each bottle and dried for 48 h in a vacuum desiccator (160 Torr, 2.1 X 10' Pal at room temperature over magnesium perchlorate. The percentage weight loss of each sample was used to c'Jrrect the sample weight to dry weight for each sample from ,he corresponding bottle. (Weight losses ranged from 1.9 to :~.3 %.)
Each sample was transferred to a 250-mL bottI, made of Teflon-FEP and spiked with a weighed quantity of 129 [ solution. The spiked samples were wet ashed by heating with 15 mL of fuming nitric acid (90% HN03), ACS reagent grade. This procedure retains iodine by oxidation to iodate while dest ,oying the organic matrix. Once red fumes of nitric oxide were no longer produced, 5 mL of perchloric acid was added to eacL solution. The solutions were heated to complete the oxidation. Each solution was then diluted with about 10 mL of high-purity water and transferred to a 40-mL centrifuge tube. The insoluole matter (mainly KCIO,) was removed by centrifugation follov'ed by decantation. Iodate was then reduced with 5 mL of hydrll2ine sulfate solution (2 g ofhydrazine sulfate/l00 mL of water). Th, resulting iodide was coprecipitated with chloride by the additicn of 1 mL of 0.01 mol/L HCI and 1 mL of 0.005 mol/L silver nitrate solution. The mixed AgCI-AgI precipitate was allowed to stand overnight in the dark and separated by centrifugation, washed, and dissolved in ammoniacal cyanide solution. Ten milliliters of :l.5 mol/L HN03 was added to reprecipitate AgCI-Agl. The precipitate was again separated by centrifugation and dissolved in anmoniacal cyanide for mass spectrometric analysis at about 20 1'1: of I/mL.
Instrumentation. The RIMS instrument has been previously described in detail (12, 13). The system consists of a pulsed, lO-Hz laser system capable of producing 3 mJ of UV radiation ranging from 260 to 306 nm, a 60° radius-of-curvature magmtic sector thermal source mass spectrometer with an ion multiplie: detection system, and a transient digitizer to accumulate the pulsed ion flux. Tbe mass spectrometer is fully automated with respect to magnet
switching, laser wavelength scanning, and data acquisition from the transient digitizer. For iodine, a 30-cm quartz lens is used to focus the laser to a 200-l'm-diameter beam waist in front of the sample filament.
Sample Filaments and Sample Loading. Tantalum filaments, 6.2 mm X 1.3 mm X 0.025 mm, in which a shallow groove had been formed, were used to dry the samples. A 5-mL aliquot of the sample solution was dried on the sample filament (100 ng of I) for each individual mass spectrometric determination.
RESULTS AND DISCUSSION
The ultimate purpose of this work was to determine the concentration of iodine reliably in oyster tissue by using isotope dilution mass spectrometry. There were two main components to this work: chemical and instrumental. Chemical procedures were developed to ensure equilibration of the spike with the sample and to separate the iodine in a form suitable for measurement. Laser mass spectrometric procedures were investigated for accurate and precise isotopic ratio measurement.
Chemistry_ The accuracy of 1DMS is totally reliant upon the isotopic equilibration of the spike isotope with the natural element in the sample. Thus, loss of analyte from the sample (or the spike added) before equilibration is achieved cannot be tolerated. Once equilibration occurs between the isotopes, loss of the element can be tolerated, since it is the isotopic ratio that defines the original concentration. The key step is dissolving the sample and bringing the spike and natural isotopes to the same oxidation state with no elemental loss.
The equilibration of the spike isotope and natural 1271 was studied by using radioactive 1251 (half-life, 60.1 days) as a tracer isotope and by monitoring the radioactivity during the chemical processing steps. A quantity of 1251 was added to each sample so that sufficient 'Y-ray counts over background were observed in reasonable counting periods (a few minutes). Various methods of wet ashing the organic matrix and oxidizing iodide to iodate were investigated. Fuming nitric acid solubilized the sample while retaining and oxidizing the iodide. Dissolution could be accomplished overnight on a hot plate; addition of perchloric acid and further heating completed the process. Once the samples were oxidized, a slow loss of iodine was observed. However, samples that suffered variable losses of iodine at this stage were analyzed and the precision of the measured results for concentration indicated that equilibration had been achieved.
The 1251 tracer experiments indicate that after the final recovery steps, reduction of iodate to iodide and coprecipitation with chloride, 70-85 % of the iodine is recovered in the experiment.
Resonance Ionization. The ionization potential of iodine is 84340 cm-1 (10.25 e V) and the first electron excited state is 54633 em-I. These parameters dictate the choice of a resonance ionization scheme that uses readily generated UV radiation: a three-photon process, where the absorption of two photons is required to reach the discrete electronic level for iodine and absorption of the third photon results in ionization, a so-called 2 + 1 process. The utility of the generalized 2 + 1 process in resonance ionization has been addressed and experimental results shown for Au, Bi, Ca, Cu, Mg, Y, Ta, and Zr (14) using visible wavelengths. We have previously used this scheme to demonstrate RIMS for both Be (J 5) and C (J 6) using UV wavelengths. Roughly half of the elements in the periodic table are suitable for resonance ionization using the 1 + 1 single-color scheme with wavelengths between 260 and 355 nm. The addition of the 2 + 1 resonance ionization scheme expands significantly the number of elements that can be resonantly ionized using a single tunable laser system.
The efficiency of the 2 + 1 process has been examined for C and for other elements (14, 16). Both theory and experiment have demonstrated that the sensitivity of the process can be

388 • ANALYTICAL CHEMISTRY, VOL. 62, NO.4, FEBRUARY 15, 1990
high for selected transitions. In general, the 2 + 1 scheme will require higher laser intensities than resonance ionization schemes in which all excitation steps are resonantly enhanced. In our experiment, the higher laser intensity is achieved by the insertion of a 30-cm focal length lens that increases the laser fluence in front of the sample filament by a factor of 400, at a cost of decreasing the geometrical overlap with the atom cloud thermally desorbed from the filament. Although we have not measured the efficiency of this arrangement experimentally, ionization efficiency is not the limit to sensitivity in the IDMS determinations described here. The analytical blank provides the sensitivity limit in our measurements.
We have previously reported on the spectroscopy for iodine using our experimental system, examining the wavelength range 278-310 nm (10). The most intense signals were observed at 279.7 and 298.2 nm. These wavelengths correspond to two-photon transitions from the ground state of iodine to levels at 71501.5 and 67062.1 cm-I . The 298.2-nm wavelength is analytically more useful, being both more sensitive and selective than the 279.7-nm wavelength.
Isotope effects must be considered in any RIMS measurement process (17). Even when isotope shifts and hyperfme splitting of resonant levels are expected to be small relative to the laser bandwidth, accurate measurement of isotope ratios cannot be assumed. Fairbank et al. have observed anomalous ratios for Sn and Mo (18). They attribute their observations to the redistribution of population between ground- and excited-state magnetic sublevels by the resonance radiation. We have examined wavelength-dependent effects on iodine isotopes ratios in two ways, using the enriched iodine spike. First, we scanned the laser wavelength for both isotopes and ratioed the results. Second, we measured isotope ratios at wavelengths on both sides of the resonance maximum. Neither experiment showed a significant isotope effect.
Our previous investigations have shown that a number of iodine-containing molecular species are formed in addition to iodine atoms during heating in the mass spectrometer. The formation of these species affects the sample utilization efficiency, but the generation of adequate signals was not a problem here. There exists a much larger nonresonant background at 279.1 nm than at 298.2 nm. This nonresonant background has been ascribed to dissociation and ionization of these iodine-containing species, which occurs more efficiently for the lower wavelength, more energetic photons. The typical ratio of resonance to nonresonance signal at 298.2 nm was 100.
Memory. One of the problems previously noted for iodine analysis using thermal ionization mass spectrometry is instrumental memory (6). This memory is caused by the relatively high vapor pressures of iodine-containing species that are desorbed into the source of the mass spectrometer. The presence of gas-phase iodine species is readily observed using RIMS since iodine signals can be detected without heating of the sample filament. In thermal ionization, the need for having a hot, ionizing filament (1000 CC) increases the likelihood of desorbing iodine which has been deposited on source components. Practically, the problem is avoided by more frequent cleaning of the source of the mass spectrometer, especially between samples of disparate isotopic ratios.
The temperature used in heating the sample filament in RIMS is not measurable with an optical pyrometer and is probably less than 550 cc, the melting point of Ag1. Thus, memory is expected to be less of a problem for RIMS relative to TIMS. The lower precision for ratio measurement in RIMS makes the observation of memory less obvious. However, when the spike (1271/1291 = 0.1579) was run immediately after a set of samples (127Ij129I ~ 7), the measured ratio was about 4 % high. Baking the source with a blank tantalum filament
Table I. Analysis of Oyster Tissue, SRM 1566a
bottle/ sample weight, g run no. ratio I, }J.g/g av
1-1 1.20073 29 3.001 4.486 31 2.990 4.468 4.477
1-2 1.03865 27 2.404 4.455 33 2.373 4.393 4.424
2-1 1.18093 25 3.187 4.420 34 3.132 4.340 4.380
2-2 1.00884 24 2.853 4.376 4.376 3-1 0.99326 28 2.462 4.518
32 2.422 4.439 4.478 3-2 0.90745 30 2.785 4.529 4.529
av 4.444 std dey 0.061 RSD 1.4%
(2000 cC; was effective in eliminating any observable cross contamin,ltion among samples, and this precaution was taken between :;ets of samples with disparate ratios.
Fracti onation. Isotopic fractionation in the thermal vaporizatior process is often the limiting source of measurement precision in thermal ionization. We have assessed the extent of isotopi~ fractionation by dividing the ratio measurements made for each mass spectrometric run into two equal time periods. The average relative difference between the first and second halves of measurement was 0.00% (95% confidence limit, ±0,,;4 %). Thus, isotopic fractionation is not significant relative to the other sources of measurement uncertainty.
Isotope Dilution Results. The isotope dilution experiment required characterization of the 1291 spike, both isotopic analysis ,md concentration measurements, as well as the measurenent of iodine in the oyster tissue samples and the chemical blank for the procedure. In addition, the previously certified naterial Powdered Milk, SRM 1549, was analyzed as a check sample to verify the accuracy of the technique. Replicate isotopic measurements were made in the experiment to assess ;he variability of mass spectromcJ:ric measurement. A total of 40 mass spectrometric runs were made (excluding set up fLns) consisting of 5 measurements of the isotopic composit on of the spike, 10 measurements made on 6 spike calibratic n samples, 13 measurements made on 6 Oyster Tissue and 3 Powdered Milk samples, and 6 blanks. Typical internal measurement imprecision among ratios was 1 % (2 standard deviations of the mean of 50 ratios); the range was 0.55-2.1 %. Ratio measurement precisions for replicates were 1.1 % relLtive standard deviation with 4 degrees of freedom for the s~ike calibration samples and 1.0% relative standard deviation with 4 degrees of freedom for the oyster tissue samples. The relative standard deviation was 0.9% for measurenent of the spike (five determinations). Thus, ratio measureBent precision is consistently about 1.0%.
Six blanks were determined. These were deliberately overspikedJut gave results ranging from 8 to 14 ng. An average blank of 11 ng was subtracted from the isotope dilution results, represeniing an adjustment of 0.2-0.25%. The results for sample aJalysis are summarized in Table 1.
Since the spike calilbration, spike, and samples were mass spectrometrically determined in an identical fashion, any systemat.c error due to instrumental discrimination will be cancelled The uncertainty is dominated by the instrumental measurement precision. The between-bottle variance is larger than the within-bottle variance, but the small number of degrees cf freedom makes it difficult to attach significance to this otservation. An uncertainty which combines the imprecision of the spike calibration and sample measurement by summ ing twice their standard errors has been assigned. The result is 4.44 ± 0.12 }J.g/g (2.7% relative).

Three samples of Powdered Milk, SRM 1549, with a certified iodine concentration of 3.38 ± 0.02 p.g/g were also analyzed. The results, 3.44 ± 0.10 p.g/g (Is, n ; 3), were in goodagreement with the certified value.
CONCLUSIONSAny new analytical technique requires extensive validation
before it will be accepted by the analytical community. IDRIMS was used previously to determine iron in water (SRM1643b) and serum (SRM 909) as part of the certificationprograms for these materials (J 9). Furthermore, a considerablenumber of osmium and rhenium determinations in geologicalmaterials, elemental concentrations by isotope dilution as weUas naturally varying Os isotopic compositions, have been made(20-22). Here we have expanded the demonstrated capabilities of the RIMS instrument to another element, iodine,while at the same time providing further evidence for precisionand accuracy of the generalized ratio measurement process.
Thermal ionization measurements of iodine can be donewith both high precision (6) and with high sample utilizationefficiency, i.e., ions generated per atoms in the sample (5). Theratio measurement imprecision of RIMS of about 1% that hasbeen demonstrated here is greater than that of TIMS, but stillvery useful for IDMS measurements. Since the samples areprepared essentially in the same way for RIMS and TIMS,it is probable that the variability is due to the pulsed ionization/measurement process. The advent of new lasers anddetection schemes for RIMS promises to reduce this variability. Although the ionization efficiency for RIMS may behigh (ions generated per atom in the laser beam), the sampleutilization efficiency will remain low when using a pulsed laserwith a continuous source of atoms such as a thermal filament.Since a nanogram of iodine represents a 5 X 10¹² atoms, thisduty cycle loss (a factor of about 10-5) can be tolerated. Themeasurement limit for iodine by isotope dilution is presentlythe lO-ng chemical blank.
The single-filament, sample loading procedure used inRIMS is simpler than the triple filament procedure, whichrequires preparation of a LaB6 treated ionization filament.The preparation and maintenance of this ionization filament
ANALYTICAL CHEMISTRY, VOL. 62, NO.4. FEBRUARY 15, 1990 • 389
are critical to both the sensitivity and precision of the TIMSmeasurement (6). And, as discussed above, source memoryshould be able to more easily controlled using a single, lowtemperature vaporization procedure. Thus, there are practicaladvantages for RIMS relative to TIMS.
Registry No. I, 7553-56-2.
LITERATURE CITED(1) Fassett. J. D.; Paulsen, P. J. Anal. Chern. 1989. 61, 643A-649A.(2) Heumann. K. G.; Schindlmeier. W. Fresenius' Z. Anal. Chern. 1982.
312. 595-599.(3) Heumann. K. G.; Seewald. H. Fresenius' Z. Anal. Chern. 1985. 320.
493-497.(4) Schindlmeier, W.; Heumann. K. G. Fresenius' Z. Anal. Chern. 1985.
320.745.(5) Delmore. J. E. Int. J. Mass Speclrom. Ion Phys .• 1982. 43.
273-281.(6) GramWch. J. W.; Murphy. T. J. J. Res. NIST 1989,94,215-220.(7) McHugh. J. A.; Stevens. J. F. Anal. Chern. 1972. 44. 2187.(8) Elmore, D.; Phillips, F. M. Science 1987, 236, 543.(9) Paul, M.; Fink. D.; Hollos, G.; Kaufman, A.; Kutschera, W.; Magarnz, M.
Nucl. Instrum. Melhods Phys. Res. 1987,829,341-345.(10) Fassett. J. D.; Walker, R J.; Travis, J. C.; Ruegg, F. C. Anal. Instrum.
1988. 17.69-86.(11) Kuehner, E. C.; Alvarez. R; Paulsen. P. J.; Murphy, T. J. Anal. Chern.
1972, 44. 2050-2056.(12) Fassett, J. D.; Moore, L. J.; Travis, J. C.; Lytle, F. E. Anal. Chern.
1983, 55. 765-770.(13) Fassett, J. D.; Walker, R J.; Travis, J. C.; Ruegg, F. C. Int. J. Mass
Spectrom. Ion Processes, 1987, 75, 111-126.(14) Apel, E. C.; Anderson. J. E.; Estler, R. C.; Nagar, N. S; Miller, C. E.
Appl. Opt .• 1987.26.1045-1050.(15) Clark, C. W.; Fassett, J. D.; Lucatorto, T. B.; Moore. L. J.; Smith, W.
W. J. Opl. Soc. Am. 8 1985,2,891-896.(16) Moore, L. J.; Fassett, J. D.; Travis. J. C.; Lucatorto, T. B.; Clark, C. W.
J. Opt. Soc. Am. 8 1985, 2. 1561-1565.(17) Miller. C. M.; Fearey. B. L.; Palmer, B. A.; Nagar, N. S. In Resonance
Ionizalion Spectroscopy 1988; Lucatorto. T. B., Parks, J. E.• Eds.;Insitute of Physics: Bristol, 1989; pp 297-300.
(18) Fairbank, W. M. Jr.; Spaar. M. T.; Parks. J. E.; Hutchinson, J. M. R InResonance Ionization Spectroscopy 1988; Lucatorto, T. B., Parks, J.E.. Eds.; Institute of Physics: Bristol, 1989; pp 293-296.
(19) Fassett, J. D.; Powell, L. J.; Moore. L. J. Anal. Chem. 1984, 56,2228-2233.
(20) Walker, R J.; Fassett. J. D. Anal. Chem. 1988. 58, 2923-2927.(21) Walker, R J.; Morgan, J. W. Science 1989, 243, 519-522.(22) Lambert. D. D.; Morgan, J. W.; Walker. R J.; Sh~ey. S. B.; Carlson, R
W.; Zientak. M. L.; Koski. M. S. Science 1989, 244. 1169-1174.
RECEIVED for review September 15, 1989. Accepted November20,1989.

390 Anal. Chem. 1990, 62, 390-:394
Dual-Beam, Light-Scattering Interferometry for Simultaneous Measurements of Droplet-Size and Velocity Distributions of Aerosols from Commonly Used Nebulizers
R. H. Clifford, Izumi Ishii, and Akbar Montaser*
Department of Chemistry, George Washington University, Washington D.C. 20052
G. A. Meyer
Analytical Sciences, Building 1897, Dow Chemical Company, Midland, Michigan 48667
Dual-beam, light-scattering Interferometry is introduced lor slmuHaneous measurement 01 droplet-size and droplet-velocHy distributions. The technique was tested in the characterization 01 tertiary aerosols produced by live nebulization systems (a pneumatic, an ultrasonic, and three Irlt-type nebulizers) used In Inductively coupled plasma spectrometry. In general, the Sauter mean diameter (D 3,2) of tertiary aerosol produced by IrH-type nebulizer was smaller than those 01 uHrasonlc and pneumatic nebulizers. At higher injector gas flow, D 3,2 was reduced lor the pneumatic nebulizer but was increased lor the ultrasonic nebulizer. At the same Injector gas flow rate, droplets move sllghtiy laster H helium is used as injector gas Instead 01 argon. For all practical purposes, the D 3.2 values measured lor tertiary aerosol with dual-beam, light-scattering Interlerometry are comparable to the same data obtained by laser Fraunholer diffraction. Compared to laser Fraunholer diffraction, the proposed technique possesses two unique advantages. First, droplet velocity distribution can be measured. Second, spatially resolved Inlormation on droplet-size and velocHy distributions may be obtained directly and rapidly.
INTRODUCTION Sample solutions are commonly converted into aerosols by
nebulizers for introduction to excitation sources in atomic spectrometry. The importance of understanding fundamentals of aerosol generation and transport in order to improve analytical performances of atomic spectrometry has been summarized in recent reports (I-3). Ideally the performance of sample introduction systems should be optimized with perdictive model(s). Such models (3) may be developed either theoretically or empirically. The accuracy of a model in predicting fundamental parameters for any nebulizer is closely tied to the ability to measure the same parameters accurately. Thus, improved diagnostic techniques are required to establish an extensive data base for testing new models or for advancing established ones (3).
Thus far, the most frequently used parameters for correlating aerosol properties (I-3) to analytical performance have been transport efficiency, mass of analyte reaching the atomizer per second, droplet-size distributions, and the solvent load. In essence, droplet-size distribution is the primary measure affecting the magnitudes of other parameters and, ultimately, the analytical signal. The most appropriate term to describe droplet size distribution is the mass median diameter. For pneumatically produced aerosol (1,2), mass median diameter is approximately equal to the Sauter mean
* To whom correspondence should be addressed.
0003-2700/90/0362-0390$02.50/0
diamete:' (volume-to-surface-area ratio diameter). The U chniques (I, 2) used in analytical atomic spectrometry
to estim,te droplet diameter include microscopic measurements, measurement with horizontal elutriators and cascade impacto:'s, and measurements with devices based on optical scatterin;. Cascade impactors have often been used in droplet sizing (I, 2), but compared to the optical scattering techniques, the process is time-consuming. Also, for cascade impactors and certun light scattering techniques (I, 2), aerosol must be drawn by a vacuum for droplet sizing. The presence of a vacuum enhances evaporation of the solvent and all droplets decrease in size. Light scattering techniques (3-5) based on Fraunho 'er theory are not intrusive to the aerosol, but spatially resolved information on droplet size may be difficult to obtain, and no data on velocity of various droplets are attainable. Such inf,)rmation is important to an analytical spectroscopist, especially when a highly polydispersive aerosol is probed.
In this report, we introduce dual-beam, light-scattering interferometry for simultaneous measurement of droplet-size and drof,let velocity distributions of nebulizers used in atomic spectrometry. In the section to follow, the principle of techniql: e is briefly reviewed along with the instrumentation required for the measurements. Advantages and limitations of the proposed technique vs other particle sizing techniques are also :liscussed. The proposed technique is used to characterize tertiary aerosol from pneumatic, ultrasonic, and frit-type nebulizers. As far as we know, this is the first techniql e that has been used for measuring droplet size and velocity simultaneously to obtain a complete description of the aerosol droplet-size distribution.
PRINCIPLE OF THE TECHNIQUE Dual-beam, light-scattering interferometry has extensive
applications in the characterization of sprays in many fields, particularly in study of fuel spray combustion (6, 7). Detailed discussi(>ll on theoretical description of the concept and the experimmtal setup is given elsewhere (6, 7). Because this report constitutes the first application of the technique in diagnostic studies of nebulizers used in atomic spectrometry, it would be relevant to briefly review the principle behind these m"asurements.
FigurE lA shows the typical schematic of the optical system used in dual-beam, light-scattering interferometry. In general, the instrument is similar to a laser Doppler velocimeter (8-12), except hat scattered light is detected at a large angle with two or more photodetectors placed behind a common aperture at fixed distances (7). For the instrument used in this work, three photomultiplier tubes (PMTs) are used. Radiation from a laser ill split into two beams, the beams are focused and crossed over a very small measurement volume to be examined. As the droplets pass through the intersection of the two laser beems, scattering occurs and temporal and spatial fre-
© 1990 Arnel jean Chemical Society

A LASER
B
BEAM SPLITTER
DETECTOR 1
DETECTOR 2
DETECTOR 3
MEASUREMENT VOLUME
DETECTOR 1 DETECTOR 2 DETECTOR 3
Figure 1. (A) Schematic of a dua~beam, light-scattering intE,rterometer; (B) Doppler burst signals illustrating the phase shift between detectors. From ref 7, with permission.
quencies of the droplets are recorded. The scattered radiation produces an interference pattern which appears tJ move at the Doppler difference frequency. This temporal 'requency depends on droplet velocity, laser wavelength, and the angle of the laser beams. The spatial frequency of the scattered interference fringe pattern is inversely proportional to the droplet diameter, but it is also a function of laser wavelength, beam intersection angle, the index of refraction for t;le droplet, and the location of the detector. As shown in Fig'!re lB, all detectors generate similar Doppler burst signals, Jut with a phase shift, as the fringes pass in front of them at the Doppler difference frequency. The phase shift is proporational to the fringe spacing and the droplet size.
For the instrument used in this study, three de1 ectors are used to (a) expand the dynamic range for drople1 size measurement and (b) minimize measurement ambiguity, especially when polydispersive aerosols are probed. For pol, dispersive aerosol, phase shifts exceeding 3600 may occur which is misinterpreted as less than 3600
• Thus, the use of a third detector eliminates such uncertainties. The overall size range of this technique is 0.5 to 10000 /Lm as compared ;0 approximately 0.5 to 600 /Lm for the laser diffraction system (3-5).
In view of the current popularity of the laser F'raunhofer diffraction (3-5) for droplet sizing, a comparison of the unique features of this technique and those of dual-beam, light scattering interferometry is relevant. The former does not measure droplet velocity, and the droplet-size d !stribution represents a line-of-sight integral measurement. To sample the entire cross section of the aerosol with laser c.iffraction, either the nebulizer must be scanned relative to the laser beam while light-scattering data are recorded (13) or that laser beam should encompass an aerosol cross section with l,niform intensity. Alternatively, the lateralline-of-sight data may be Abel inverted to obtain spatially resolved information. For the dual-beam, light scattering interferometry, a very small volume (~3 x 10⁻⁵ cm3) of the aerosol is probed. To obtain distribution for the entire cross section of the aerosol, the nebulizer must be scanned across the measurement volume, and an average weighted by the number flux and ne geometry of the spray calculated (I3). As discussed in a lacer section, one must not assume that the droplet sizes measured with the two techniques are comparable. The size distribu1 ion in laser
ANAL YTlCAL CHEMISTRY, VOl. 62, NO.4, FEBRUARY 15, 1990 • 391
diffraction technique is sensitive to the relative number of droplets per unit volume, while the response of the proposed technique is proportional to the number of droplets per unit time per unit area (droplet flux). Fortunately, data obtained with the dual-beam, light scattering technique may be easily transformed for comparison with data from the laser diffraction technique.
EXPERIMENTAL SECTION
L The Dual-Beam, Light-Scattering Interferometer. The instrument used in this work for simultaneously measuring droplet-size and velocity distributions was the phase/Doppler particle analyzer (PDP A) manufactured by Aerometrics, Inc. (Sunnyvale, CAl. This instrument was developed based on studies by Bachalo and Houser (7). A Compaq computer was used in our work for data acquisition and data treatment.
The parameters measured by PDPA include particle size (0.5-10000 /Lm; dynamic range of 35:1 at anyone configuration; 50 uniform size classes), particle velocity (up to 200 m/s; 50 uniform velocity classes), and sample volume cross-section for each size class. Size and velocity accuracies of 4 % and 1 %, respectively, are reported by the manufacturer for this instrument. Because the maximum particle number density measured with this instrument is 10', we experienced problems in characterizing nebulizers that generate a large number of droplets.
The software for PDP A provides several types of information. These include size and velocity histograms, mean values and statistical mean diameters, probe volume size, number density, volume flux, and cumulative data plots of particle and volume. In addition, experimental data may be fitted to distribution functions and size-velocity correlation plots may be obtained. Because the PDP A response is proportional to droplet flux, PDP A software may be used to transform' the particle size data for comparison with tbe results from laser diffraction experiments. As this paper cOl)stitutes the first pUblication on the application of dual-beam, light-scattering interferometry to commonly used nebulizers for atomic spectrometry, Our discussion shall focus on droplet·size and velocity distributions. For the sake of comparison with the results obtained with laser diffraction (3-5), emphasis shall be placed on Sauter mean diameter and span in the characterization of aerosol. The importance of the two parameters in understanding the fundamental of aerosol generation and transport has been discussed extensively (1-3).
2. Nebulization Systems Investigated. Tertiary aerosol from five nebulization systems used in inductively coupled plasma (ICP) spectrometry were probed to obtain droplet-size and velocity distributions. Both Ar and He injector gases were used for all nebulizers. Aerosol was typically probed as it exited the spray chamber through a 12 mm long tube having an inside diameter of 7 mm. Ideally, the tertiary aerosol must be probed at the exit port of the injector tube of the ICP torch. This was not feasible, bowever, because of condensation of aerosol at the cold tip of the injector tube.
The nebulizers evaluated included a concentric pneumatic nebulizer, an ultrasonic nebulizer, and three frit-type nebulizers (14). The pneumatic nebulizer (TR-50-Al, J. Meinhard Associates, Santa Ana, CAl was made especially for use with He injector gas by the manufacturer. It was used in conjunction with a Scott double-pass spray chamber. Sample uptake rate and injector gas flow rate were changed from 0.1 to 1.0 mL/min and from 0.5 to 1.0 L/min, respectively. The ultrasonic nebulizer (Model UNPS·l, RF Plasma Product, Kresson, NJ), equipped with a spray chamber, was operated at 1.4 MHz with a forward power of 45 W. No desolvation system was used. The ranges for the sample uptake rate and the injector gas flow rate were 0.3-2.7 mL/min and 0.5-2.0 L/min, respectively. Because of the tremendous density of the aerosol by the ultrasonic nebulizer (USN), direct aerosol measurement was not feasible, and therefore, the aerosol had to be directed to the probing site with 7-ft Tygon tubing that had an inside diameter of 8 mm.
The glass frit·type nebulizers consisted of a disk-shaped glass frit nebulizer (DGFN), an externally pressurized cylindrical glass frit nebulizer (EPCGFN), and an internally pressurized thimble glass frit nebulizer (IPTGFN) described in detail elsewhere (14). The sample uptake rate and the injector gas flow rate were

392 • ANALYTICAL CHEMISTRY, VOL. 62, NO.4, FEBRUARY 15, 1990
changed from 0.05 to 1.0 mL/min and from 0.5 to 2.0 Ljmin, respectively, for these nebulizers. All data reported here are based on approximately 5000 particles examined for each nebulization condition.
A peristaltic pump (Minipulse 2, Gilson Medical Electronics, Middleton, WI) was used to deliver sample to all nebulizers. A mass flow controller (Model 8200 Matheson Gas Products, East Rutherford, NJ) was used to control the injector gas flow.
RESULT AND DISCUSSION To characterize the teritary aerosol from the nebulizers, we
used the Sauter mean diameter, designated as DS,2, as the primary parameter. The parameter is defined as the volume-to-area ratio for the entire particle field and is obtained for the following equation (1-3):
N N DS,2 = 'Lnidis /'Lnidi2
i=l i=l
where N is the total number of droplet classes (50 bins for this instrument), ni is the counts for each droplet class i, and di is the diameter for size class i. All the data presented here were obtained by probing a very small (~1O-5 cmS) cross section of the tertiary aerosol emerging from the center section of the tube mounted at the exit port of the spray chamber. Thus, to a first approximation, we have assumed that teritary aerosol is distributed uniformly across the exit tube having an inside diameter of 7 mm. Such an assumption may not be valid for the primary aerosol (13).
1. Effect of Injector Gas Flow and Sample Uptake Rate on Sauter Mean Diameter. Figure 2 shows the effect of the injector gas flow and sample uptake rate on the D32
for five nebulizers operated with two injector gases. Thre'e notable observations are made. First, as the aerosol gas flow increases for both argon and helium injector gases, DS,2 decreases at all uptake rates for the pneumatic nebulizer. For example, DS,2 is reduced from 5.6 to 4.6 I'm as the Ar injector gas is increased from 0.5 to 1 Ljmin for an uptake rate of 1 mL/min. For the He injector gas, DS,2 is 5.9 and 4.9 I'm at 0.8 and 1.0 Ljmin, respectively, at the same uptake rate. Compared to the results obtained for helium, the values for DS,2 are also smaller when argon is used as the injector gas. These observations on the injector gas flow and gas type are in agreement with the trends noted by others (3-5) for primary and tertiary aerosol. Apparently, at higher gas velocities and with heavier injector gases, smaller droplets are produced because of the greater kinetic energy of the injector gas.
The second observation is concerned with the ultrasonic nebulizer which exhibits a trend for Ds 2 contrary to that of a pneumatic nebulizer. For the USN, Ds,; values are increased at higher injector flow for both injector gases and, generally, at most uptake rates. This increase in DS,2 with gas flow for the USN may be attributed to the occurrence of a greater number of collisions between droplets, especially at high droplet number densities, thus leading to the recombination of small droplets. Also, as expected, the DS,2 values for the USN are smaller than those of the pneumatic nebulizer, especially when He injector gas is used.
The third observation is associated with the frit-type nebulizers. The trend in Ds 2 does not agree with either the pneumatic or the ultrasonic 'nebulizer. The DS,2 values seem independent of injector gas flow rate. For DGFN and EPCGFN, the use of helium seem to reduce the DS2 values as compared to argon. For the IPTGFN, the rever~e trend is observed, At uptake rates less than 0.4 mL/min and at 1 L/min, the DS,2 values for IPTGFN are smaller than those measured for DGFN and EPCGFN, These were the conditions used in our previous (14) study for analytical measurements,
Examination of the data shown on Figure 2 reveals a weak linear dependence between DS,2 and sample uptake rate, es-
E 2-II: W IW :lE « is z « w :lE II: W I::> « en
:I~PN~O~, .~'c , ,
00 ) 2 04 0 S 08 10 \ ~
:CPN:M:T'C, H::, 5 --.10
, ,
00 0 2 0 ~ 0 6 0 e 1 0 1 2
F--· 00 J2 04 06 08 10 12
~l-~' :1:=:=-, 3 3~~1.0
, , , ,
)2 04 06 08 '0 12 00 02 04 06 08 10 12
IPTCFN
'b~;: :~IPTGFN , " :~::
.2 04 06 08 10 12 00 02 04 06 08 10
SAMPLE UPTAKE RATE (mLimin) Figure 2, E"fects of injector gas flow and type and sample uptake rate on the Sau :er mean diameter of tertiary aerosol produced by five nebulization systems.
pecially fo/ the pneumatic and ultrasonic nebulizers. For the frit-type nebulizers, this dependence exhibits an erratic behavior, T<, explain this behavior, size-volume histograms are presented in Figure 3 for the pneumatic and ultrasonic nebulizer and the IPTGFN, These data were obtained at an uptake ra1e of 1 mL/min (for pneumatic and USN) and 0.1 mL/min (for IPTGFN) and for the injector gas flow of 1 L/min, As expected, the broadest distribution is observed for the pneumatic nebulizer when Ar injector gas is used. The narrowest distribution is noted for the ultrasonic nebulizer using He illjector gas, For IPTGFN, the distribution is narrow at the left end of the histogram, but very large droplets, representing a large volume percentage of aerosol, are also observed. Similar histograms are observed for DGFN and EPCGFN. To eliminate the large droplets from the teritary aerosol, t!-e spray chamber must be modified for frit-type nebulizers by adding a baffle in the spray chamber, With this change, lower Ds 2 values are expected for the frit nebulizers,
Another par~eter that is useful in aerosol characterization is the spar, which illustrates the breadth of the distribution

ARGON HELIUM
PNEUMATIC
~""[LJ ..... 9.6
g ~
WW<-O""----j 0.0 .5 0.5 6.2 11.8 17.5
USN
~'::D g
" 0.0
0.5 6.2 ll.8 17.5 DIAMETER (IJ.m)
IPTGFN
w ,. ~ 5.4
"
DIAMETER ().I.ml
USN
... ,,~ DIAMETER (!-1m
IPTGFN
Figure 3. Size-volume histograms for tertiary aerosol of three nebulization systems. The continuous lines represent the cumulative volume of aerosol.
Table I. Values of Span Measured by Dual-Beane, Light-Scattering Interferometry for Five Nebuli2ation SystemsG
sample uptake rate, spanb
--------nebulizer type mL/min Ar He
A. Single Run USN 1 1.0 0.5 Meinhard 1 1.6 1.1 DGFN 0.05 2.7 2.3 EPCGFN 0.05 1.5 1.0 IPTGFN 0.05 1.7 2.5
B. Multiple Runs USN 0.3-1.0 0.9-1.4 0.5-0.8 Meinhard 0.2-1.0 1.3-1.7 1.1-1.2 DGFN 0.05-1.0 1.5-2.7 2.2-2.7 EPCGFN 0.05-1.0 0.1-2.8 1.0-1.4 IPTGFN 0.05-1.0 1.7-6.6 2.2-3.4
a All measurements were conducted at an injector 5as flow of 1 L/min. The numbers listed under multiple run for span reflect the ranges observed and not necessarily the span at a particular uptake rate. b Span ~ (Doo - DlO) / D50 where DlO, D,., md D90 refer respectively to droplet diameters below which 10, 50 and 90% of the cumulative aerosol volume are found (3).
(3). Table I shows values for span measured for five nebulization systems using both argon and helium as the injector gas. Compared to other nebulizers, span for the frit-type ne bulizer is the greatest.
2. Effect of Injector Gas Flow and Sam~le Uptake Rate on Droplet Mean Velocities. Particle velocity is an important parameter in the optimization of plasma sources. At higher velocities, the residence time of droplet;,; in a plasma will decrease, and this may lead to incomplete atomization, especially when the gas temperature of a plasma (15) is not as high as an Ar ICP.
Figure 4 shows the effect of injector gas flo,", and sample uptake rate on the mean velocity of the droplets. Mean velocity is independent from uptake rate but, 1S expected, changes linearly with the injector gas flow rat". The most
ANALYTICAL CHEMISTRY, VOL. 62, NO.4, FEBRUARY 15, 1990 • 393
U)
I > le::; o -' w > z « w :iE
::LPNE~UMATIC~ ARGO:N
" '" "" 06 • HI
01. " 05
" 00 02 0<1 06 09 ,0 12
::1P .N.~EUMATlC~ HELlU~M '" 08 10
06 " c os
,. " 00 02 04 05
"~USN-= " USN 12. • • 20 12 ;~ ~~" ::j~i': 02 04" --<J_~ "
o , 2 3 02
0 , 2 3
"bDGFN~ "~DGFN 2'.
14 I.
12 12
10 10
08 08 OJ'''''' " 1.0
06 cc ",.0 06
04 04
02 02 00 02 O. 06 08 10 12 00 02 04 06 06 10 12
EPCGFN EPCGFN
"
"1===---=.:-
14~2.0
" " ,. ,. 04~~1.0
" 00 02 O. 06 08 10 12
04~o.5
::I~'PTGFN~~~ ::~'PTGFN ." 12 _ 2.0,2
10 10
08 08 +- 10
,. ~--~-~- 1.0 06
04 04~O.5 02 02
00 02 O. 06 08 ,0 12 00 02 04 06 OS ,0 12
SAMPLE UPTAKE RATE (mLlmin)
Figure 4. Effects of injector gas flow and type and sample uptake rate on the mean velocity of tertiary aerosol produced by five nebulization systems.
significant effect on mean velocity is noted when injector gas type is changed. Droplets in the helium gas stream travel faster than those transported with argon. At a sample uptake rate of 1 mL/min and an injector flow gas of 1 L/min, mean velocities of 0.595 and 0.772 mls are measured for droplets produced by the pneumatic nebulizer when the injector gas is argon and helium, respectively. Under the same conditions for an USN, mean velocities of 0.622 and 0.703 mls were obtained with Ar and He injector gases, respectively. The mean velocities were 0.604, 0.598, and 0.467 mls for Ar and 0.751,0.763, and 0.827 mls for He at an uptake 0.05 mL/min for the IPTGFN, DGFN, and EPCGFN, respectively.
Another useful parameter for the tertiary aerosol is the velocity distribution of the droplets. Knowledge of this information is significant if different droplets move at varying velocities, and therefore, evaporation-atomization-excitation processes in a plasma could occur at different locations for various droplets. Figure 5 shows droplet size-velocity distributions for a pneumatic nebulizer when argon and helium injector gases are used. For this device, a greater variation

394 • ANALYTICAL CHEMISTRY, VOL. 62, NO.4, FEBRUARY 15, 1990
"' 1.0
~ >-f- 0,6
c::i 0 -' W >
DIAMETER (}1m)
"' 1.0
~ >-f- 0.7
c::i 0 -' W > 0,4
0.5 6,2 11.8 17.5
DIAMETER (}1m) Figure 5. Size-velocity distribution for tertiary aerosol for pneumatic nebulizer using argon (top) and helium injector gas.
in droplet velocity is noted when argon injector gas in used as compared to helium.
The availability of size-velocity distribution has an additional benefit, If the number of droplets in each size class is divided by the average velocity of the droplets in the same class, then the D3,2 values may be compared to those obtained by the laser diffraction technique (13). For the tertiary aerosol, no significant change in D32 values were noted by us after this conversion, For example: the D3,2 values measured by the proposed technique for the pneumatic nebulizer were 4.6 }lm for an argon injector gas, When the number of droplets in each class was divided by average velocity of droplets in the same class, a Sauter mean diameter of 4.5 }lm was obtained. This correction for velocity distribution resulted in less than 2 % change in the D32 value for the pneumatic nebulizer. Similar trends were observed for helium injector gas and also for other nebulizers. For such small droplets this observation should always be true because almost all droplets move at nearly the same velocity. Thus, for all practical purposes, Sauter mean diameters measured for tertiary aerosol with dual-beam, light-scattering interferometry are comparable to the same data obtained by laser diffraction (5), This statement is valid only if there is no spatial variation in the droplet sizes as assumed in this study, Demonstration of this assumption and the characterization of the primary aerosol are the subjects of our future studies.
CONCLUSIONS Dual-beam, light-scattering interferometry was used to
measure simultaneously droplet-size and droplet velocity
distributio 1S of tertiary aerosol produced by five nebulizers used in IC P spectrometry, The principle of the proposed technique, instrumentation required for the measurements, and advan >ages and limitations of this technique vs other particle sizing techniques were also discussed.
The nebulizers investigated included a pneumatic nebulizer, an ultrasoric nebulizer, a disk-shaped glass frit nebulizer, an externally )ressurized cylindrical glass frit nebulizer and an internally> ressurized thimble glass frit nebulizer, In general, the Sauter nean diameter of tertiary aerosol produced by the frit-type n lbulizer is smaller than those of ultrasonic and pneumatic nebulizers, At higher injector gas flow, D3,2 is reduced for the pneumatic nebulizer but is increased for the ultrasonic llebulizer. For the pneumatic and the thimble frit nebulizers, the D32 value is increased as the injector gas is changed from argo~ to helium. At the same injector gas flow rate, dropl,ts move faster if helium is used as injector gas instead of ,trgon. For all practical purposes, the D3•2 values measured fJr tertiary aerosol with dual-beam, light-scattering interferomdry are comparable to the same data obtained by laser Fraullhofer diffraction,
ACKNOWLEDGMENT We thani, H. Tan of GWU and M. J. Houser of Aerometrics,
Inc" for their assistance during the course of this work. Constructi, e comments by Lee G. Dodge, Southwest Research Institute, f;an Antonio, TX, are greatly appreciated.
Registr) No. Helium, 7440-59-7; argon, 7440-37-1.
LITERATURE CITED (1) Gustav~ son, A. Liquid Sample Introduction into Plasmas. In Induc
tively Coupled Plasma in Analytical Atomic Spectrometry; Montaser, A., Golilhtly, D. W .• Eds.; VCH: New York, 1987.
(2) BrownEr, R. F. Fundamental Aspects of Aerosol Generation and Transport. In Inductively Coupled Plasma Emision Spectroscopy, Part II Boumans, P. W. J. M., Eds., John WHey & Sons: New York, 1987.
(3) Canals, A.; Wagner, J.; Browner, R. F.; Hernandis, V. Spectrochim. Acta 1!lB8, 438, 1321-1335.
(4) Moham3d, N.; Fry, R. C.; Wetzel, D. L. Anal. Chem. 1981, 53, 639-645.
(5) Routh, 1.4. W. Spectrochim. Acta 1986, 418, 39-48. (6) Bachale" W. D. Appl. Opl. 1980, 19, 363-370. (7) Bachak" W. D.; Houser, M. J. Opt. Eng. 1984,23,583-590. (8) Farmer W. M. The Interferometric Observation of Dynamic Particle
Size, V9!oclty and Number Density. Ph.D. Thesis, University of Tennessee 1973.
(9) Farmer W. M. Appl. Opl. 1972, 11,2603-2612. (10) Lesinsk, J.; Boulos, M. I. Plasma Chern. Plasma Process. 1988, 8,
113-132. (11) Lesinsk, J.; Boulos, M. 1. Plasma Chem. Plasma Process. 1988, 8,
133-144. (12) Sakuta, T.; Boulos, M. I. Rev. Sci. Instrum. 1988, 59, 285-291. (13) Dodge, L. G. J. Propulsion Power 1988,4,490-496. (14) Clifford, R. H.; Montaser, A.; Sinex, S. A.; Capar, S. G. Anal. Chem.
1989, /1. 2777-2784. (15) Chan, ~.; Montaser, A. Spectrochim. Acta 1987, 428, 591-597.
RECEIVED f"r review August 9,1989, Accepted November 29, 1989, This research was sponsored by the U,S, Department of Energy Hnder Grant No. DE-FG05-87-ER-13659.

AmI. Chern. 1990, 62, 395-402 395
Kinetic Approach to the Measurement of Chemical Oxygen Demand with an Automated Micro Batch Analyzer
Purnendu K. Dasgupta* and Kaj Petersen
Department of Chemistry and Biochemistry, Tel as Tech University, Lubbock, Texas 79409-1061
An automated micro batch analyzer utilizes pressulized reservoirs of concentrated H2SO., K2Cr20 7/HgSO., and AgNO. that are equipped with microprocessor-driven high-speed on/off valves. The sample (460 ILL) Is blown in to a glassfilled PTFE reaction cavity provided with a tempemture programmable heater. Silica optical fibers continuously monitor the disappearance of dichromate in the reaction mixture in a total volume of ::s 1.7 mL with mixing provided by magnetic stirring. The continuous monitoring approach not only provides the equilibrium absOrbance but also provides Information on the rate of oxidant consumption and thus on the nature of substances contributing to the chemical oxygen demand (COD). The system can also be conflgurated to study reaction rates as a function of temperature and to thus further characterize the oxidant consuming constituents. I n the rapid testing mode, the Instrument can process ~ 13 samples/h, using a 3-mln measurement lime at 140°C with a limit of detection of approximately 10 ppm COD. All sanple compounds studied undergo oxidation by dichromate in a rate process that Is first order each with respect to the oxidant and the substrate. On the basis of this observation, observed temporal oxidation profiles may be extrapolated to estimate the oxidant consumption at equilibrium.
INTRODUCTION In the area of water and wastewater analysis the mea
surement of chemical oxygen demand (COD) is )ne of the most important and most frequently used. A search of Chemical Abstracts (CA) shows over 3600 entries under this keyword since 1967 with present rate of citation:; in excess of 200 annually (volumes 109 and 110). Along with the measurement of biochemical oxygen demand (BOD), total oxygen demand (TOD) , total organic carbon COC), and dissolved organic carbon (DOC), the measurement of COD is particularly important for the characterization of industrial and municipal effluents and their treatment. The origin of the BOD test is traced back to Frankland in 1870 and Dupre in 1884 (1). Its broad intent was to determine the extent to which a waste sample would consume oxygen and thereby affect the ecosystem receiving such a discharge. Even the presently abbreviated form of the BOD test requires 5 days (2). As such, the need for a faster comparable procedure culminated in the COD test which measures the number of equivalents of an oxidant consumed. The strict propriety of both the terms of BOD and COD is questionable since neither the biota nor the chemical oxidant is specified, bo,h of which affect the results. Although a variety of oxidizirg agentspermanganate (3-13) cerium(IV) (11, 14, 15), bdate (16), Fenton's reagent (17), persulfate (18), etc.-have been investigated, strongly acidic Cr(VI) at reflux temr,eratures is the preferred reagent (2, 19). The term COD is appropriately parenthesized as dichromate oxygen demand in the ASTM procedure (19).
The first use of Cr(VI) in the present context dates back at least to 1926 (20) albeit the term COD does nc,t appear in
0003-2700/9010362-0395$02.5010
the subject index of Chemical Abstracts until 1952. Numerous variations of the dichromate-based COD measurement method are in the literature (21-45). Semiautomated (32,33) and automated versions with (34-39) and without (40-42) air segmentation as well as adaptation to a complex batch mixer (43) have been described. One commerical COD analyzer also utilizes batcb mixing on a relatively large volumetric scale (44). Air-segmented COD analyzers have been used as postcolumn reactors coupled to a liquid chromatograph (35) and for continuous on-stream analysis of wastewater (38). The present practice of COD measurement (2, 19) reflects in large part the procedures recommended by Moore et aJ. (22) and much of the subsequent important literature has appeared in the pages of this journal (17, 23, 29, 32, 45, 46).
Under the conditions of the prescribed procedure (19), all oxidizable compounds are not oxidized to the same extent. For example, reducing sugars such as glucose are oxidized even without heating while heterocycles such as pyridine are hardly oxidized even after refluxing at 140°C for 2 h. It is impractical to determine the extent of oxidation that talces place for each potential compound in a particular sample, though valiant efforts to do so have been made (17,19,21,22,29,45-48). As an additional complication, it is not widely recognized that the rate of oxidation is first order each in dichromate and in the oxidizable substance. Thus, unless dichromate is in very large excess, the fraction of a compound substance oxidized over any given period depends on its initial concentration. Ever since the original work of McNary et al. (49), colorimetry (2, 26, 27, 30-32, 34-38) has largely replaced titration as a means of evaluating the residual Cr(VI) present after digestion. Because Cr(VI) absorbs more strongly than Cr(lll), optically monitoring Cr(VI) provides the more sensitive procedure and thus represents the present preference in automated methods (35, 40-42). Such procedures preclude using a large excess of Cr(VI) which may account for significant differences in the extent of oxidation for the same compound reported for either the manual (19) or automated procedures (36, 37). In the air-segmented continuous flow analyzers, it remains unknown whether oxidation at the interfacial phase boundaries proceeds at the same rate (as volatile organic compounds partition to the segmenting phase) as in bulk solution.
Presently, COD measurements yield a single number and provide no information about the substances oxidized. At best, the COD test represents " ... a good balance between the value of the information gained and the speed of the analysis when compared to BOD and TOC tests" (32); at worst, it is a poor surrogate for BOD or TOC/TOD values. Many feel that the Holy Grail of quantitative oxidation of everything (COD" TOD) is an inherent measure of the accuracy of the method (see e.g., refs 22, 23, 28, 45, and 50). This is perhaps why the original suggestion of Muers (51) to use Ag+ as catalyst to facilitate the oxidation of straight chain fatty acids (e.g. acetic acid) is now part of all standard procedures. Interestingly, the early English practice of an increased acid concentration, which elevates the boiling point of the reaction mixture and thus increases the extent of oxidation for some samples (43), has rarely been adopted elsewhere (37). Many others feel that COD should represent TOC rather than TOD, thus inorganic
© 1990 American Chemical SOCiety

396 • ANALYTICAL CHEMISTRY. VOL. 62. NO.4. FEBRUARY 15. 1990
substances that are easily oxidized by hot acidic Cr(VI) are considered interferences. Of these, chloride interference is most easily and effectively removed by complexation with Hg2+ (relatively large concentrations must be added) (18,46); standard procedures differ as to whether sulfamic acid addition should be incorporated as a routine part of the protocol for the elimination of nitrite (2,19), and no effective options are available to deal with ferrous iron and reduced sulfur anions, which are often important constituents of many anoxic water samples.
There are also those who believe that the COD test should indeed represent a fast surrogate BOD measurement, its originally intended purpose. At least two versions of the COD test. the rapid COD test (25) and the oxygen demand index (ODI) test (52,53), modify the standard procedure by using shorter digestion periods and, for ODI, a lower temperature. The rapid COD method is claimed to have as good a correlation with BOD as does standard COD (54) and appears to be applicable to a large variety of wastewater samples (55). The correlation of the ODI with BOD is less convincing (26, 56). Neither, however, has been widely adopted. There are numerous studies in the literature concerning the relationship between BOD, COD, and TOC values (see ref 57 for citations). Only one conclusion appears to be generally applicable: BOD and COD are typically well correlated at any given location, although the exact relationship varies greatly from one location to another. In contrast, while TOC-COD and TOC-BOD may on occasion be even better correlated than BOD-COD, this is by no means a general occurrence (26,58). The differences in the exact BOD-COD relationship from one type of sample to another are hardly surprising inasmuch as bacteria may be much more efficient in oxidizing some species than acidic Cr(VI) (e.g., acetobacter for acetate) while others (e.g., unsubstituted aromatic hydrocarbons) are significantly oxidized in the COD test but do not undergo measurable degradation in the BOD measurement. Some compounds are cytotoxic and yield "sliding" BOD values (58). The generally good COD-BOD correlation at any given location reported in the literature is more likely an indication that the nature and distribution of the species contributing to the oxygen demand remain essentially the same at the same location rather than any intrinsic relationship between the two methods.
The above discussion makes it clear that the COD value as presently measured is an operationally defined quantity with little absolute meaning. The information content is limited to a single numerical value. The importance of kinetic methods to chemical analysis constitutes the focus of a recent monograph (59). The potential value of the technique can be much greater if it is able to provide information as to not only how many total equivalents of oxidant are consumed but also the rate at which such consumption occurs. Second, in a variety of situations there is a dire need to provide the results faster than a method requiring 2 h of refluxing. Third, because of the use of toxic mercury salts and the generation of hazardous liquid wastes, it is necessary that any automated analyzer work on as small a scale as possible. In this paper, we propose an alternative for COD measurements based on the automated micro batch analyzer (AMBA) (60-62) that can fulfill the above needs.
EXPERIMENTAL SECTION The experimental system is shown schematically in Figure l.
Reagents (concentrated H,80" 10 mM K2Cr20, + 80 mM HgSO" 8% (w/v) AgNOa) and wash liquid (water) are contained in heavy-walled borosilicate glass bottles pressurized to 9.5 psi from a common N2 pressure source. The liquid outlet from each reservoir is connected through fast-acting all-PTFE two-way solenoid valves VI-V4 (type 075T2WNCI2-32, Bio-Chem Valve corp., East Hanover, NJ), The valve outlets are in turn connected to the top of the reaction chamber RC by PTFE connecting lines
Figure 1. <'ystem schematic: V1-Va. inert fluid-path solenoid valves; RC. reaction chamber (see Figure 2 for details); R 1-R3. adjustable resistors (R2 and R3 connected via relays). R4 = R5 = 10 kll. R6 = 1 kQ; R, temperature control relay; H, main heater relay; U1, '/4 - LM 339.
rih=----- PTFE FITTING
THERMISTOR
OPTICAL FIBER
5==·- TO AC POWER
HI!---c'-=-:- VENT / OVERFLOW
LIQUID INLETS
O-RING
THERMISTOR
HEATER GLASS SHEATH OPTICAL FIBER
STIR - FIN
1------ EXIT
Figure 2. Jetails of the reaction chamber.
(270 X O.Sf;, 255 X 0.30, 245 X 0.66, and 500 X 0.30 mm for H2S04,
K2Cr20,/HgSO" H20, and AgNOa, respectively). V5 and V6 are three-way luorocarbon fluid path valves (type LFYX 0500200AC, the Lee Cc., Westbrook, CT) used together as a loop injector where S" represents the sample volume (6(H)2). Valve V7 is a three-way solenoid (Bio-Chem type 075T3WI2-32) and VS is a PTFE valve similar to Vl-V 4.
The heart of the system is the reaction chamber RC, machined from glass·filled PTFE. It is shown in detail in Figure 2 and the approximate scale is indicated. The reaction cavity is approximately conical at the bottom and a triangular PTFE stir-bar is trimmed to fit this shape and provide smooth stirring. All delivery Iven t tubes and the heater are press-fit through undersized holes drill.,d in the lid. Three screws and a Viton O-ring secure and seal the lid. The tubes entering through the lid are heavily covered w th black tape to prevent intrusion of stray light. One side of the circular across section of the cavity contains a machined depression to better accommodate the cartridge heater (top view,

ANALYTICAL CHEMISTRY, VOL. 62, NO.4, FEBRUARY 15, 1990 • 397
Table I.' Operation Sequence
time, s VI V2
0.O~5.0
5.0~16.5 on 16.5-31.5 on 31.5-211.5'
211.5-216.5 216.5-223.5 223.5~226.8 on 226.8~232.3
232.3-242.3 242.3~279.9 (on) 274.9-279.9
V4
on on
(on)
V5/V6b
on
V7b/V8
on
on (on)
H
on
function
sample delivery dichromate delivery conc H2S04 delivery heat under thermostatic control, acquire signal continuing to read signal dispose chamber contents acid and rinse water added adding more rinse water dispose chamber contents repeat above three steps twice load sample
a Refer to Figure 1 for components. b The ports connected by the open symbols in Figure 1 are connected when valve is on. C This step can be indefinitely lengthened to extend the observation period.
Figure 2). The 1.25 X 0.125 in. cartridge heater (type ClE14, 25 W at 120 V, Watlow, Inc., St. Louis, MO) is wrapped in AI-foil to tightly fit inside 4 mm i.d. Pyrex glass sheath tubing. A glass-sealed precalibrated thermistor (type P30, 10 k£' at 25°C, Thermometries, Edison, NJ) is used to monitor the temperature and provide active control via the simple resistance brid;e/voltage compositor driven relay circuitry depicted in Figure 1. Referring to Figure 1, 90 V ac is applied to the heater via a main relay switch H and the temperature control circuit. Adjustable re"istors Rl, R2, and R3 have values of 994, 930, and 1527 Q and the connections of R2 and R3 to the circuit are governed by reJ ays driven by the microprocessor. The following set point temperatures are obtained in accordance with the resistors connected: R1,101.1 °C; R1 and R2, 120.9 °C, Rl and R3, 130.6 °C; Rl, 1':2 and R3, 142.S °C. Some initial experiments were also conducted at a set temperature of 110.0 °C. These temperatures are ref"rred to in rounded figures in the text.
The optical absorbance of the liquid in RC was monitored via optical fibers as shown in Figure 2. Tefzel-jacketed silica fibers (type HCN-M1000T-12, Ensign-Bickford Optics, Avon, CT), 1 mm in core diameter, were sealed into the reaction cbtmber with one ferrule-end and one blunt end externally threadec! all-PTFE bushings (modified Omnifit fittings, Rainin, Inc., Woburn, MA). The fiber ends were ~4 mm from each other, defining the optical path length. The light source was a lens-end lamp (t:lPe LS050, 5 V S10 rnA, Gilway Technical Lamps, Woburn, MA) placed behind an eight-position, logic-addressable ratchetecl solenoiddriven mter wheel holding '/ 2 in. interference mters. Only a single mter (15 nm band-bass at full width half maximum centered at 450 nm) was used in this work. The monochromatic light output was coupJed to one end of a randomized bifurcated glass fiber bundle approximately 20 em long with a common leg bundle diameter of ~4.5 mm (Welch Allyn, Inc., Skaneateles Falls, NY). Each of the bifurcated legs (ca. 3 mm diameter) was coupled to the 1 mm diameter silica fibers; as a consequence a major fraction of the light was lost. One silica fiber (reference arm) ,erminated directly in a photodiode while the second fiber termir ated in the reaction chamber, RC. The exit fiber from RC was coupled to the detector photodiode. Both photodiodes were the same (type G 1115, Hamamatsu Corp., Middlesex, NJ) and ohe output photocurrents were fed directly into a log-ratio amplifier (type 757 N, Analog Devices, Norwood, MA). The amplifier gain was fixed at 1 V / absorbance unit. Detector signals are referred throughout the rest of the text in absorbance units (AU). The amplifier output was fed to a strip-chart recorder, generally through a digital filter (Model 102lA filter and amplifier, Spectrum, Inc., Newark, DE) using a cut-off frequen"y of 0.1 Hz and the unfiltered signal was sampled by an Appl" lIe microcomputer with an S-bit analog-digital converter.
The sample volume used in this work was 460 f.'L (45S ± 0.5 f.'L, gravimetrically determined for water as sample). An identical volume of the 10 mM dichromate reagent was used (corresponding to a valve on time of U.5 s). This choice limits the \lpper range of applicability to about 4S0 mg of CODjL. Of course, smaller sample volumes and greater Cr(VI) concentration/volume can be chosen to extend the upper limit of applicability. Following Cr(VI) addition, 940 f.'L of concentrated H2S04 is added (gravimetrically measured, density I.S4 g/mL, valve on-oime 15.0 s).
H,O NaQAc K~P AgNOs NaOAc
r-- ...-- AgNol
L \ \
Figure 3. System output showing temporal oxidation profiles: (a) water, (b) glucose, (c) KHP, (d) CH,COONa, (e) CH,COONa with Ag+ catalyst, (f) KHP + CH,COONa, Ag+ catalyst added at time indicated by the arrow.
The total reaction volume is slightly smaller than the nominal sum, due to volumetric contraction. Heating is commenced immediately after H2S04 addition. An operating temperature of 140°C is reached in under 1 min. The routine operation, a total observation time of only 3 min, starting from the commencement of heating, was used. A typical operational sequence is shown in Table I (AgN03 addition step is not shown in the table; when used, AgN03 is delivered at a rate of ~20 f.'L for a 1-s valve-on time). The controller outputs were typically assigned as follows: VI, V2, V 4, V5/V6, V7/VS, H, R2, R3 (slashes indicate common operation).
Reagents. Reagents used were of analytical reagent or reagent grade. Water used was distilled and deionized and met ASTM type I specifications.
RESULTS AND DISCUSSION Kinetics of Cr(VI) Oxidation. With the rare exception
of a study by Goodwin et aJ. (63) and two citations therein, the COD literature surprisingly does not contain any quantitative information on the reaction order involved in this reaction system for representative compounds. Potassium hydrogen phthalate (KHP) is most commonly used as a standard in COD measurement procedures (2, 19). Although the use of glucose as a standard for automated procedures has been claimed to produce analytical data that compare well with results from the standard manual procedure for a variety of water samples (12, 13,40--42), it cannot be overemphasized that glucose is the most easily oxidized among common COD reference substances used. Figure 3 shows system outputs for water, glucose, KHP, and sodium acetate. Glucose is fully oxidized by the time data acquisition is commenced. The progress of the oxidation reaction is most clearly evident in the KHP case. There is essentially no oxidation of acetate unless silver catalyst is added. Glutamic acid behaves similarly
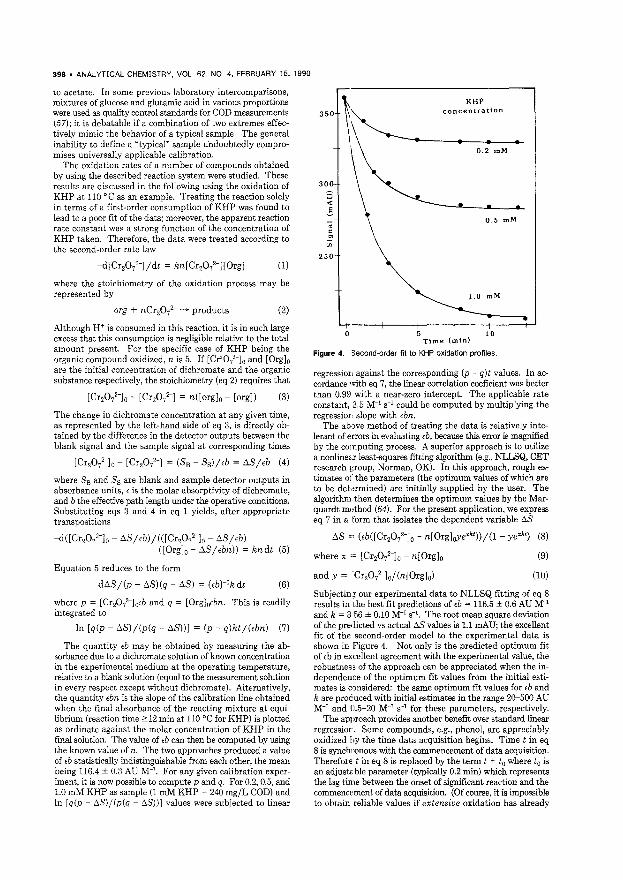
398 • ANALYTICAL CHEMISTRY, VOL. 62, NO.4, FEBRUARY 15, 1990
to acetate. In some previous laboratory intercomparisons, mixtures of glucose and glutamic acid in various proportions were used as quality control standards for COD measurements (57); it is debatable if a combination of two extremes effectively mimic the behavior of a typical sample, The general inability to define a "typical" sample undoubtedly compromises universally applicable calibration.
The oxidation rates of a number of compounds obtained by using the described reaction system were studied, These results are discussed in the following using the oxidation of KHP at 110°C as an example, Treating the reaction solely in terms of a first-order consumption of KHP was found to lead to a poor fit of the data; moreover, the apparent reaction rate constant was a strong function of the concentration of KHP taken, Therefore, the data were treated according to the second-order rate law
where the stoichiometry of the oxidation process may be represented by
org + nCr20l- ~ products (2)
Although H+ is consumed in this reaction, it is in such large excess that this consumption is negligible relative to the total amount present. For the specific case of KHP being the organic compound oxidized, n is 5. If [Cr"072-]0 and [Org]o are the initial concentration of dichromate and the organic substance respectively, the stoichiometry (eq 2) requires that
[Cr20l-]0 [Cr20l-] = n([org]o - [org]) (3)
The change in dichromate concentration at any given time, as represented by the left-hand side of eq 3, is directly obtained by the difference in the detector outputs between the blank signal and the sample signal at corresponding times
[Cr20l-]0 - [Cr2072-] = (SB - Ss)/,b = tlS/,b (4)
where SB and Ss are blank and sample detector outputs in absorbance units, , is the molar absorptivity of dichromate, and b the effective path length under the operative conditions, Substituting eqs 3 and 4 in eq 1 yields, after appropriate transpositions
-d([Cr2072-]o - tlS/,b)/«[Cr20l-]o - tlS/,b) ([Org]o tlS / ,bn)) = kn dt (5)
Equation 5 reduces to the form
dtlS /(p - tlS)(q - tlS) = (,bt' k dt (6)
where p = [Cr20,z-]0,b and q = [Org]o,bn. This is readily integrated to
In [q(p - tlS)/(p(q tlS))] = (p q)kt/(,bn) (7)
The quantity ,b may be obtained by measuring the absorbance due to a dichromate solution of known concentration in the experimental medium at the operating temperature, relative to a blank solution (equal to the measurement solution in every respect except without dichromate), Alternatively, the quantity ,bn is the slope of the calibration line obtained when the final absorbance of the reacting mixture at equilibrium (reaction time ~12 min at 110°C for KHP) is plotted as ordinate against the molar concentration of KHP in the final solution. The value of ,b can then be computed by using the known value of n, The two approaches produced a value of ,b statistically indistinguishable from each other, the mean being 116.4 ± 0,3 AU M-l, For any given calibration experiment, it is now possible to compute p and q. For 0,2, 0,5, and 1.0 mM KHP as sample (1 mM KHP = 240 mg/L COD) and In [q(p - !!.S)/(p(q - !!.S))] values were subjected to linear
250
o
KHP concentration
0.2 mM
0.5 mM
1.0 mM
10 Time (min)
Figure 4. Second-order m to KHP oxidation profiles.
regression against the corresponding (p q)t values. In accordance 'vith eq 7, the linear correlation coeficient was better than 0,99 with a near-zero intercept, The applicable rate constant, 3,5 M-l S-1 could be computed by multiplying the regressiorl slope with ,bn.
The above method of treating the data is relatively intolerant of errors in evaluating ,b, because this error is magnified by the computing process. A superior approach is to utilize a nonlineH least-squares fitting algorithm (e.g., NLLSQ, CET research group, Norman, OK), In this approach, rough estimates of the parameters (the optimum values of which are to be det'lfmined) are initially supplied by the user, The algorithm then determines the optimum values by the Marquardt method (64). For the present application, we express eq 7 in a form that isolates the dependent variable tlS
tlS =, (,b([Cr2072-]0 - n[Org]oYexkt))/(l - ye<kt) (8)
where x ,= [Cr20l-]0 - n[Org]o
and y = Cr2072-]0/(n[Org]0)
(9)
(10)
Subjectin5 our experimental data to NLLSQ fitting of eq 8 results in the best fit predictions of ,b = 116.5 ± 0,6 AU M-l and k = 356 ± 0,10 M-l S-I, The root mean square deviation of the predicted vs actual tlS values is 1.1 mAU; the excellent fit of the second-order model to the experimental data is shown in Figure 4. Not only is the predicted optimum fit of ,b in excellent agreement with the experimental value, the robustnes3 of the approach can be appreciated when the independence of the optimum fit values from the initial estimates is considered: the same optimum fit values for ,b and k are produced with initial estimates in the range 2G-500 AU M-l and 0.5-20 M-l S-1 for these parameters, respectively,
The approach provides another benefit over standard linear regressior. Some compounds, e,g" phenol, are appreciably oxidized by the time data acquisition begins, Time t in eq 8 is synchronous with the commencement of data acquisition. Therefore t in eq 8 is replaced by the term t + to where to is an adjustEble parameter (typically 0.2 min) which represents the lag time between the onset of significant reaction and the commencement of data acquisition, (Of course, it is impossible to obtain reliable values if extensive oxidation has already

ANALYTICAL CHEMISTRY, VOL. 62, NO.4, FEBRUARY 15, 1990 • 399
Table II. Statistical Summary of Calibration Results, KHP, 140 'c
time, min 2 3 4 5 8 10 linear corr coeff LOOO UOO 0.998 0.998 0.996 0.996 slope, mAD/ppm COD in 0.571 ± 0.009 0.{;09 ± 0.010 0.631 ± 0.010 0.641 ± 0.010 0.644 ± 0.013 0.648 ± 0.013
sample intercept, mAU 384.4 ± L6 386,(, ± L6 388.8 ± 1.8 390.5 ± 1.7 392.1 ± 2.2 393.6 ± 2.2 std error of determination, ppm 9.2 9 .. 9.3 9.1 10.0 10.1
COD estimated limit of detection,tl 8.4 7 .~I 8.6 8.0 10.2 10.2
ppm COD
a Based on a S / N value of 3 (70). Lowest concentratic n in the calibration set was 24 ppm; this was well above the LOD.
Figure 5. Typical system outPut on strip-chart recorder, the .;ample series shown indicates freedom from chloride interference. All samples represent a COD level of 200 ppm, with varying amounts of chloridE (ppm CI indicate below each trace). NOise between sample runs is due to repeated rinsing and evacuation of chamber.
occurred prior to data acquisition; this is the case for glucose). Such an approach also compensates for the time to reach the set temperature, particularly important for those compounds that display a low oxidation rate at lower tempera lures but are rapidly oxidized at the set temperature. In th s case, to is negative.
Temperature Effect on Reaction Rate, Despite the rudimentary temperature programming capability of the COD AMBA system, the temperature dependence of the :)xidation rate for a given sample can be rapidly determined. Oxidation by acidic Cr(VI) appears to conform well to the imhenius equation (65). With KHP as sample (200 mg/L COD) in each case, the rate constants were determined to be 2.[,1 ± 0.08, 3.56 ± 0.10, 6.68 ± 0.18, and 11.60 ± 0.84 M-I S-I at 100, no, 130, and 140 cC, respectively. A plot of In k vs the 'eciprocal of absolute temperature is linear with a correlation <oefficient of 0.997 and an activation energy of 10.7 kcal/mol. A preexponential factor of 4.52 X 10⁶ M-I S-I can be computed. Similar experimental data for phenol yield an acti'ration en· ergy of 3.9 kcal/mol and a preexponential factor of 2.17 X 10³
M-I S-l Such data for individual samples can "e rapidly determined in an unattended fashion with the pcesent in· strument.
Calibration Behavior. The system was calibrated with three reference substances, glucose, phenol, and KHP, at a reaction temperature of 100 cC. The reaction profil.,. indicate that final (equilibrium absorbance) is reached in .53, 8, and 15 min for glucose, phenol, and KHP, respecthely. The calibration slope, expressed in terms of "mAU/ppm COD in sample, was experimentally indistinguishable for the three substances, 0.636 ± 0.0085 mAU /ppm COD. lr terms of actual concentration in the reaction volume this sl,)pe is 2.35 ± 0.03 mAU/ppm COD. Recognizing that 1 ml\[ K2Cr207
neutralizes 48 ppm COD, the corresponding ,b value is 113 ± 2. Sample carryover, measured by alternating 250 ppm COD samples with water, was :<::2.5%.
More detailed statistical data are listed in Table II for repeated calibration runs with KHP (seven concentrations, 0-480 ppm, n = 3-5 at each concentration) for a reaction temperature of 140 cC. The reaction is essentially complete (> 99 %) within 5 min. The performance parameters (line· arity, standard error, LOD etc.) remain virtually the same for a reaction time of 2-10 min despite the fact that the reaction is incomplete at low concentrations. Strategies to predict the equilibrium (final) absorbance for incomplete reaction are described in " subsequent section.
Elimination of Chloride Interference. Other than Hg· (II), the addition of Cr(III) has been suggested as a remedy for preventing the oxidation of chloride to chlorine (66). Although complexation of chloride by Cr(III) has been sug' gested to be the operative basis of this procedure, available equilibrium data (67) suggest that the operative factor is likely a decrease in the oxidizing ability of the dichromate due to lowering of the oxidation potential. This may also reduce the rate of oxidation of some compounds. In any case, the available data (66) do not indicate that addition of Cr(III) leads to completely satisfactory results. As such, much as it is undesirable to use toxic Hg(II), no practical alternatives are available. Addition of HgS04 to an extent of 80.8 mM to the Cr(VI) reagent in our system enables it to handle samples containing 5000 ppm chloride without interference. Typical recorder output indicating freedom from chloride in terference is shown in Figure 5.
Slow Oxidations: Extrapolated Equilibrium Values. Obviously, samples for which oxidation proceeds slowly rep· resent the more challenging situations. In a single point

400 • ANALYTICAL CHEMISTRY, VOL. 62, NO.4, FEBRUARY 15, 1990
measurement, the option is limited to determining the residual Cr(Vl) concentration after a specified period of time. In the present case, termination of the measurement period can be user specified a priori or be governed by a microcomputer based data acquisition device which terminates the measurement as the rate of change of absorbance falls below some user-selected threshold. Most importantly, the final portion of the rate profile can be processed to predict final equilibrium values. The final few minutes of the temporal profile of the dichromate concentration can be subjected to standard curve-fitting algorithms (including NLLSQ) without specific knowledge of the substrate concentration or the oxidation rate constant but assuming a second-order rate law. Other approaches previously described in this journal may also be potentially applicable (68, 69). Oxidations of glutamic acid or acetate proceed slowly even with a silver catalyst. On selected 10-min runs of replicate 200 ppm (COD) glutamate samples and 15-min runs of 175 ppm (COD) acetate samples, we were able to obtain predicted equilibrium results of 191 ± 19 and 168 ± 20 ppm (n = 6 each), respectively, from experiments in which oxidation was obviously incomplete. These experiments were conducted with three concentration levels of silver catalyst, and despite the different oxidation rate in each case, the overall agreement is reasonable. Future work is aimed at extending this approach to multicomponent mixtures using a more sophisticated algorithm.
Component Performance. The overall system performance of the analyzer is controlled by the individual performance characteristics of a number of different components in the analyzer. These include detector precision, detector linearity, volumetric reproducibility of reagent addition, and the reproducibility of the temporal temperature profile. Note that the apparent optical absorbance of an acidic Cr(Vl) solution is a function of the solution temperature. This likely stems more from a change in refractive index and dimensional changes of the cell rather than a real change in molar absorptivity of dichromate itself.
With only water the in reaction chamber at room temperature, the reproducibility of the detector output upon repeated evacuation and filling of RC was largely governed by the intrinsic detector noise. Considering the nature of the optical fiber coupling used, the observed peak-to-peak noise level (0.6 mAD) was quite acceptable. The detector ouput was linear ($1 % deviation) with dichromate concentration at least up to 1.2 AD. Because all experiments were conducted with a maximum absorbance background of 0.4 AD (all specified absorbance values refer to water at room-temperature as the zero level), detector linearity is not expected to be a significant limiting factor.
In a conventional continuous flow analysis system, pumping concentrated H2S04 with peristaltic pumps at a constant rate over extended periods represents a major problem. Even with so-called "acid-resistant" pump tubing, it was found necessary to replace tubing every 3-4 h (42). Pneumatic delivery via inert valves therefore represents a very useful solution. The ability to use undiluted H2S04 as a reagent also permits its large heat of hydration to be exploited toward raising the reaction temperature. With all components initially at room temperature, the internal temperature reaches 70 °C immediately following H2S04 addition. Also, to make this addition procedure reproducible, the addition sequence involves adding the concentrated acid to the aqueous sample + Cr(Vl) /HgS04•
In the absence of auxiliary heating, the temperature rapidly drops, however. The reactor vessel has considerable thermal mass and glass-filled PTFE is a much better thermal conductor than PTFE. More efficient use of the heat input to the system (whether electrically or chemically generated) is warranted to attain the desired reaction temperature more
quickly from the start of a given determination cycle as well as to ad ieve fast thermal equilibration of the entire system during s,;art up. External insulation, not used in this study, should (.e helpful.
With all reagents added and with water as sample, the absorbance reproducibility of the system was measured at t = 3 min :solution temperature is -50 °C, heater off). Overall reproducibility was judged adequate, the detector output was 348 ± 2.4 mAD (relative standard deviation 0.7%, n = 8). With the heater turned on and a set temperature of 140 °C, the reproducibility was measured at t = 2, 5, 8 and 10 min; the respective signal outputs were 380 ± 2, 385 ± 3, 388 ± 4, and 389 ± 4 mAD, 0.5-1.0% in relative standard deviation. The slig:lt increase in the mean background absorbance between t = 2 and 10 min is not due to lack of attainment of the set t"mperature for the reaction mixture (the temperature sensor indicates this occurs long before 2 min) but due to slow changes in the system, p~:~ibly dimensional changes due to thermal,xpansion. This does not constitute a source of error per se be:ause the behavior of the sample is always interpreted with ref, rence to a blank. As these data indicate, the blank behavior is reproducible. Note also that the change in backgrol.nd absorbance as a function of solution temperature is highly nonlinear-in going from 50 to 120 °C, t.A is only 15 mAD while the change is nearly 20 mAD in going from 120 to 140 °C.
Heating Considerations and Noise Sources. A further reductiol of reaction volume from ca. 1.6-1.7 mL was precluded primarily by the heater. However, since the present study W8S completed, we have been able to fabricate heaters of the same wattage with a total volume of <30% of that used in this work. Initially we attempted to heat the solution by resistive heating (ac) of a platinum coil (0.1 X 250 mm) immersed in it. Although a much smaller heater could be fabricated 'n this manner, it was not possible to use such a heater in the present system because even at relatively low applied voltages ;he surface temperature of the platinum wire is high enough to cause self-decomposition of the Cr(Vl) solution. The self·decomposition of acidic Cr(Vl) solutions at high temperatures (even without the benefit of any catalytic effects, as may be present with a heated platinum wire) is well documented in the literature (54). No matter what heater design is chosen material compatibility willi the extremely aggressive reaction conditions is the foremost consideration.
By far the most important noise source in the detector output i, the turn on/ off spikes caused by the heater thermostat relay. The result is that the signal of interest represents an ,envelope below the noise spikes as in Figure 5. This does not constitute a real deterrent in data interpretation, albeit the noise represents a nuisance in aesthetic terms. Proportional, rather than on-off temperature control should eliminat" this noise. We chose, however, to omit it through appropri.lte software. Since the data acquisition begins at a time before the thermostat switches, the initial data has no noise in it. Because the type of noise encountered is abrupt spikes, the software looks at successive data points (acquisition rate 16 points/s) and ignores the most recent one if it represents a sudden (e.g., by 25%, extent user-specified) change from the Jrevious datum. The net result is the transformation of raw data as shown in Figure 6A to that in Figure 6B.
Powermg the heater at volatages significantly above 90 V causes bu bbles at the heater surface and leads to optical noise. The same happens at reaction temperatures ~150 °C. Both of these limitations could be removed with a higher H2S04 content of the reaction mixture which would raise the boiling point.
Operadng Considerations. COD measurements are often used for reporting to regulatory agencies. Even a minor de-

ANALYTICAL CHEMISTRY, VOL. 62, NO.4, FEBRUARY 15, 1990 • 401
.JJ.l.lLLlAU ill.llilJ111.J.J,J.J-J-'-'-\11 ~IIII ~~. B 2 min
~---------------------Figure 6. Examples of noise spike removal by software Tlanipulation: (A) raw data; (B) postsoftware treatment.
viation from procedures prescribed by a regulatory>gency such as the U.S. EPA requires that the new procedUl e must undergo an equivalency testing program of set protocol before the new procedure can be approved for regulatory purposes. We hope to report on results of such tests in the future. Meanwhile, COD measurements are routinely used also in a large number of treatment facilities, especially th(,se involved with sewage and wastewater, to follow the CO'lrse of the treatment process. In wastewater treatment fa~ilities of a chemical/petrochemical complex, the effluent f'om a large number of individual plants is typically treated at a single central location. The major concern is to quickly detect the occurrence of an "upset" and thence to identify the particular manufacturing plant responsible for the increase:l COD and take appropriate corrective action. Broader information than that represented by a single measurement value is particularly useful in such cases. It is obvious that a measurem,nt protocol (with or without added Ag+) as shown in Table I not only is capable of providing information of at least the same value as the rapid COD or ODI tests faster, it can also provide additional information on the rate of sample oxi dation. Individual plant effluents have characteristic oxidation rates and under "upset" conditions a single plant is often by far the dominant contributor to the COD. Therefore, such kinetic information, especially if coupled to a temperature effect measurement, may be all that is needed to tentati"ely identify the malfunctioning plant. With complex samples, one protocol that yields a lot of information involves beginning with a 3-4 min measurement period without the silver catalyst. The catalyst is added at the end of this period and the course of the reaction is followed for another 4 min. Thus, this procedure provides demand levels as well as rate inf(,rmation on both the "normal" and "argentoactive" regions. Figure 3f illustrates this for a mixture of KHP and sodium acetate. It is for this reason we prefer a separate Ag+ reagent. For both acetate and glutamate, it has been observed that the oxidation rate continues to increase with an increase in th" amount of AgN03 added in the range 10-40 mg (50 I'L of 2-8% solution), albeit the gain is minimal in going from 20 to 40 rrg. We have chosen to use AgN03 for this purpose because 8f its much greater solubility relative to Ag2SO.. As sud., relatively concentrated solutions can be used and volumetric dilution resulting from the Ag+ -reagent addition can be minimal. In control experiments with KHP standards and blanks, we have observed no effects of AgN03 on the equilibrium absorbance value, i.e., nitric acid does not appear to participate as an oxidant in the presence of excess dichromate. Of course, if the separate Ag+ -reagent addition strategy is not esed, Ag2SO. can be dissolved in the requisite amount directly if the sulfuric acid reagent.
CONCLUSIONS The determination of COD is both a diagnostic and regu-
latory measure in the treatment and disposal of municipal and industrial effluents. The approach described herein represents a fast convenient automated procedure that provides much more information than single value measurements. The total volume of reagents consumed per sample can be favorably compared to presently existing methods. Although the total number of samples that can be processed per unit time is not larger than efficient manual methods involving in-tube batch-mode digestion and photometric measurement, the minimum processing time for a sample can be much faster. The instrument is well-suited as an on-line analyzer or in conjunction with autosamplers. A simple inexpensive autosampler suitable for this application has been described (62). Although the instrument operates in a vented fashion, it should be easily possible either to operate the instrument under mildly pressurized conditions (2-3 atm) or to provide a microsize reflux condenser.
LITERATURE CITED (1) Phelps, E. B. Stream Sanitation; Wiley: New York, 1944; pp 65-66. (2) American Public Health Association. Standard Methods for the Exam
ination of Water and Wastewater, 16th ed.; APHA: Washington, DC, 1985; pp 525-538.
(3) Japan Industrial Standard JIS K 0102, 1974. (4) Benson. H. K.; Hicks. J. F. G., Jr. Ind. Eng. Chern. (Anal. Ed.) 1931.
3.30-31. (5) Haupt. H. Vorn Wasser 1935, 10,60-77. (6) Kashkin, M. L.; Karasik, R. M. Med. Exp. (Kharkov) 1940. 4, 9-13. (7) Matubara. T. Mitt. Med. Akad. Kioto 1940, 2B, 563-575. (8) Klein. L. J. Proc. Inst. Sewage Puril. 1941, 174-191. (9) Lovett, M. J. Proc. Inst. Sewage Purff. 1941, 194-195.
(10) American Public Health Association. Standard Methods for the Examination of Water and Wastewater, 9th ed.; APHA: Washington, DC. 1946; P 122.
(11) Nasr. M. S.; MacDonald. D. G. Pulp Pap. Can. 1975, 76,91-93. (12) Korenaga, T.; Ikatsu, H. Analyst 1981, 106.653-662. (13) Korenaga, T.; Ikatsu, H.; Moriwake, T. BUll. Chern. Soc. Jpn. 1982.
55,2622-2627. (14) Bezel, L. l. J. Appl. Chern. USSR (Engl. Transl.) 1945, lB,361-366. (15) EI-Dib, M. A.; Ramadan, F. M. J. Sanff. Eng. Div., Am. Soc. elv.
Eng. 1966. 92. 97-101. (16) Dzyadzio. A. M. Vodosnabzh. Sanit. Tekh. 1938, B19, 117-125. (17) Medalia, A. l. Anal. Chern. 1951, 23,1318-1320. (18) Gilmour, C. M.; Merryfield, F.; Burgess, F.; Punkerson, L.; Carswell, K.
Purdue Univ., Eng. Bufl .• Ext. Ser. 1960, 106,143-149. (19) American Society for Testing and Materials. Methods D1252-83. In
Annual Book of ASTM Standards, ASTM: Philadelphia, PAt 1984; Vol. 11.01, pp 62-68.
(20) Adeney, W. E.; Dawson, B. B. Sci. Proc. R. Dublin Soc. 1926, 18, 199-202.
(21) Ingols, R.; Murray, P. E. Water Sewage Works 1948,95, 113-117. (22) Moore, W. A.; Kroner, R. C.; Ruchhoft, C. C. Anal. Chem. 1949, 21,
953-956. (23) Moore, W. A.; Ludzack, F. J.; Ruchho~, C. C. Anal. Chern. 1951.23.
1297-1300. (24) Jenkins, S. H.; Harkness, N.; Hewitt, P. J.; Snaddon, X. V. M.; Ellerker,
R.; Divito, 8.; Dee, H. J. J. Proc. Inst. Sewage Purif. 1965, 6. 533-565.
(25) Jeris, J. S. Water Wastes Eng. 1967. 4(5). 89-91. (26) Shriver, L. E.; Young, J. C. J. Water Pollut. Control. Fed. 1972,44,
2140-2147. (27) Chaudhuri, N.; Niyogi, S.; De, A.; Basu, A. J. Water Pollut. Control
Fed. 1973, 45,537-541. (28) Wolff, C. J. M. Water Res. 1975. 9. 1015. (29) Himebaugh. R. R.; Smith, M. J. Anal. Chern. 1979, 51, 1085-1087. (30) Bulletins TCOD and ACOD; O. I. Corporation: College Station. TX,
1986, 1987. (31) Methods for Chemical Analysis of Water and Wastes; EPA 600/4-79-
020; U.S. Environmental Protection Agency. Environmental Monitoring and Support Laboratory: Cincinnati, OH, 1979.
(32) Jirka, A. M.; Carter, M. J. Ana/. Chern. 1975,47. 1397-1402. (33) Edwards, S. J.; Allen. M. Analyst 1984. 109, 671-672. (34) Adelman, M. H. In Automation in Analytical Chemistry. Technicon
Symposia 1966; Mediad, Inc.: White Plains, NY, 1967; pp 552-556. (35) Zuckerman. M. M.; Molof, A. H. In Advances in Automated Analysis.
Technicon International Congress 1969; Mediad, Inc.: White Plains, NY, 1970; Vol. II, pp 121-124.
(36) Haines, G. D.; Anselm, C. D. In Advances in Automated Analysis. Technicon International Congress 1969; Mediad, Inc.: White Plains, NY, 1970; Vol. II, pp 159-162.
(37) Tifft, E. C.; Cain, B. E. In Advances in Automated Analysis. Technicon International Congress 1972; Mediad, Inc.: Tarrytown, NY, 1973; Vol. VIII, pp 11-15.
(38) Stanley, G. H. In "Advances in Automated Analysis. Technicon International Congress 1972; Mediad, Inc.: Tarrytown, NY 1973; Vol. VIII, pp 17-21.
(39) Fleet. B.; Ho, A. Y. W.; Tenygl, J. Analyst 1972.97,321-333. (40) Korenaga, T. Bull. Chem. Soc. Jpn. 1982, 55, 1033-1038. (41) Korenaga. T.; Ikatsu, H. Anal. Chim. Acta 1982,141,301-309.

402 Anal. Chern. 1990, 62, 402-407
(42) Appleton, J. H. M.; Tyson, J.; Mounce, R. P. Anal. Chim. Acta 1986, 179,269-278.
(43) Harkness, N.; Hey, A. E.; Willetts, O. G. Water Pollut. Control 1972, 71,261-277.
(44) Model 304 COD Analyzer Bulletin; Ionics, Inc.: Watertown, MA, 1988.
(45) Moore, W. A.; Walker, W. W. Anal. Chern. 1956, 28,164-167. (46) Dobbs, R. A.; Williams, R. T. Ana/. Chern. 1963, 35, 1064-1067. (47) Buzzell, J. C.; Young, R. H. F.; Ryckman, D. W. Behavior of Organic
Chemicals in the AquaUc Environment. Part II. Dilute Systems; Manufacturing Chemists Association: Washington, DC, 1968; P 34.
(48) Chudoba, J.; Datesicky, J. Water Res. 1973, 7,663-668. (49) McNary, R. R.; Dougherty, M. H.; Wolford, R. W. Sewage Ind. Wastes
1957,29,894-900. (50) Foulds, J. M.; Lunsford, J. V. Water Sewage Works 1968, 115,
112-115. (51) Muers, M. M. J. Soc. Chern. Ind. 1936, 55, 71T. (52) Westerhold, A. F. Digester 1965,22(1),4-11. (53) Westerhold, A. F. Digester 1965, 22 (2), 18-22. (54) Wells, W. N. Water Sewage Works 1970, 117,123-129. (55) McLean, D. A.; Spicher, R. G. Proc. Ind. Waste Conf. 1973, 28,
1017-1024. (56) Reynolds, J. F.; Gollner, K. A. Water Sewage Works 1974, 121,
31-34. (57) Cooper, W. J.; Young, J. C. In Water Analysis; Minear, R. A.; Keith, L.
H., Eds.; Academic Press, New York, 1984; Vol. III. (58) Ford, D. L.; Eller, J. M.; Gloyna, E. F. J. Water Pol/ut. Control Fed.
1971,43,1712-1723. (59) Mottola, H. A. Kinetic Aspects of Analytical Chemistry; Wiley: New
York, 1988.
(60) Sweilel, J. A., Lopez, J. L; Dasgupta, P. K. Rev. Sci. Instrum. 1988, 59,2(09-2615.
(61) Sweileh, J. A.; Dasgupta, P. K. Anal. Chim. Acta 1988, 214, 107-1 t9.
(62) Ping, L.; Dasgupta, P. K. Ana/. Chern. 1990, 62, 85-88. (63) Good'v\in, A. E.; Cabbiness, D. E.; Mottola, H. A. Water, Air, SOi/Pol
lut. 1977, 8, 467-478. (64) Marquardt, D. W. J. Soc. Ind. App/. Math. 1963,11,431-441. (65) Frost. 1:>... A.; Pearson, R. G. Kinetics and Mechanism, 2nd ed.; Wiley:
New York, 1961; p 22. (66) Thompon, K. C.; Mendham, D.; Best, D.; de Casseras, K. D. Analyst
1986, 111, 483-485. (67) Sillen, _. G.; Martell, A. E. Stability Constants of Metal-ion Complexes;
Special Publication no. 17; The Chemical Society: London, 1964; p 276.
(68) Williarrs, G. R.; Tolbert, L. M.; Holier, F. J. Anal. Chem. 1982, 54, 256-230.
(69) Holier, F. J.; Calhoun. R. K.; McClanahan, S. F. Anal. Chern. 1982, 54,7t:5-761.
(70) Ameri{.an Chemical SOCiety Committee on Environmental Improvement. Anal. Chem. 1980, 52. 2242-2249.
RECEIVED 'or review June 21, 1989, Accepted November 22, 1989. Thif research was supported by a cooperative research agreement with the Dow Chemical Company, U,S.A,
Optimization of Multienzyme Flow Reactors for Determination of Acetylcholine
P. Chandrani Gunaratna and George S, Wilson*
Department of Chemistry, University of Kansas, Lawrence, Kansas 66045
Immobilized enzyme reactors have been used with highperformance liquid chromatography (HPLC) and electrochemical detection to detect acetylchOline and choline in brain tissue samples. AcetylchOline and choline eluting from the LC column are introduced into a reactor containing immobilized acetylchOlinesterase, which hydrolyzes acetylcholine to choline. The product is converted by a second enzyme, choline oxidase, to hydrogen peroxide, which is determined amperometrically. Several novel immobilization techniques including immobilization through enzyme-specific anllbodies were used to immobilize these enzymes to retain maximum activity. Improved detection limits were observed when the enzymes were immobilized through the avidin-biotin linkage. Beller sensitivity and detection limit were obtained when both enzymes were immobilized together on the same support through the avidin-biotin linkage than when they were separately immobilized and used in two columns. The postcolumn system was applied to brain tissue extracts.
INTRODUCTION Acetylcholine (Ach), the main neurotransmitter in the
cholinergic neurotransmitter system, is found in mammalian brain tissues. Determination of Ach and Ch levels in the brain is very important due to the significant role it plays in neuropsychiatric diseases (1). Increasingly sensitive assay techniques are required to measure the low concentrations of Ach and Ch in the brain,
* To whom correspondence should be addressed.
0003-2700/90/0362-0402$02.50/0
Several physicochemical methods are available for the determination of Ach, These methods include GC-MS (2) and radiometric assays (3), However, these techniques are associated with time-consuming, complicated procedures and require expensive equipment. Recently, immobilized enzyme reactors (l MERs) have been used with high-performance liquid chrcmatography (HPLC) and electrochemical (EC) or chemiluminescence detection to assay Ach (4-7). These methods are now gaining popularity.
Use of I VIERs utilizing HPLC with EC detection is based on the seraration of Ach from brain tissue extracts by reverse-pha,e HPLC, passing the effluent through acetylcholinesterase (AchE) and choline oxidase (ChO) immobilized reactors, fellowed by the amperometric detection of hydrogen peroxide rroduced by the following reaction scheme;
Ach ~ choline (Ch) + CH3COO
Ch ~ betaine + 2H20 2
However, the IMERs are not without problems. One major limitation s the loss of enzyme activity in the immobilization step due to either the binding of the enzyme to the support through or near its active site or binding in an orientation such that the active site is inaccessible. Performance of the IMER depends 0:1 the properties of the enzyme immobilized, For example, in our system AchE is more durable than ChO and can be immobilized without losing activity, ChO is very sensitive tc its environment, and any change in the immediate environme at surrounding the enzyme can cause a significant loss in act. vity.
Various methods of immobilization have been used in our studies to retain the maximum activity ofthe enzymes, These
© 1990 Americon Chemical Society

ANALYTICAL CHEMISTRY, VOL. 62, NO.4, FEBRUARY 15, 1990 • 403
L ~ ~N 1 o-C-NU + NH2-~ ------+
(a)
L ~ r-N 1 o-C-NU
I spacer arm
II I~~NH + o-C-N 2 r 0 H Glutereldehvde ------->
[-0-1-," ~,"JNH-~~ (b)
+
avidin
j ~~ ~~
~-O-~-NH -<} 0,. "/~
(c)
·1· CD ---.
(d)
Figure 1. Schematic representation of various immobilization methods: (a) direct, (b) spacer arm, (c) avidin-biotin linkage, (d) antibodies.
methods include immobilization of enzyme (a) di:'ectly, (b) through a spacer arm, (c) through avidin-biotin complexation, and (d) through antibodies specific to the enzym"s. These are illustrated in Figure l.
To overcome the limitations caused by direct immobilization, the enzyme can be immobilized through a spacer arm that couples to the enzyme at a specific distance from the active site, thereby allowing the substrate to access the active
site effectively. Lengthening the spacer arm localizes the enzyme farther from the solid support, making it free to interact with substrate. A particularly well-suited system for this purpose is the avidin-biotin linkage. Avidin has a high affinity for biotin (dissociation constant 10-15 M), and the binding of avidin to biotin is undisturbed by extreme pH or change in ionic strength. The enzyme can be immobilized through the avidin-biotin linkage as shown in Figure lc.

404 • ANALYTICAL CHEMISTRY, VOL. 62, NO, 4, FEBRUARY 15, 1990
Figure 2, Schematic representation of site-directed antibody immobilization: immobilized antibody goat-anti-mouse IgG, Fc specific,
It has been shown that it is possible to immobilize enzymes while retaining high activity through immobilized antibodies specific to the enzyme (8). In this case, it is important to immobilize the antibody efficiently in order to couple a maximum amount of enzyme. When antibodies are coupled to the support, they can bind in various orientations as shown in Figure Id. It is important to promote coupling through the Fe region of the antibody molecule in order to avoid attachment through an amino group near the antigen binding site (Figure 2).
Immobilizing enzymes through antibodies has the advantage of easy regeneration of the enzyme once its activity is lost. It is very convenient to immobilize new enzyme on an antibody column just by washing off the old enzyme and injecting a new aliquot of the enzyme. This allows the user to regenerate the column within minutes.
EXPERIMENTAL SECTION Materials. Acetylcholine (Ach) chloride, choline (Ch) chloride,
AchE type III (electric eel) and ChO (Alcaligenes), triethylenetetramine tetrahydrochloride (TETA), 4-aminoantipyrine, and tetramethylammonium chloride (TMA) were purchased from Sigma Chemical Co. (St. Louis, MO). Sodium octyl sulfate (SOS) was purchased from Eastman Kodak (Rochester, NY). Avidin was purchased from Calbiochem Behring (San Diego, CAl. NHS-LC-Biotin and CD! activated Reactigel HW-65 were obtained from Pierce Chemical Co. (Rockford, IL). Ethylhomocholine (Ehc) iodide (internal standard for Ach and Ch) was synthesized (4) from 3-(dimethylamino)·I-propanol and iodoethane, both obtained from Aldrich (Milwaukee, WI). Goatanti-mouse Fe specific antibodies were purchased from Organon Teknika-Cappel (Malvern, PA). Mouse myloma cell line P3/ NSI/I-Ag4·1 (ATCC No. TIE 18) for the preparation ofhybridomas was obtained from American Type Culture Collection (Rockville, MD). All other reagents used were of analytical grade. Solutions were prepared in water obtained from a Barnstead Nanopure II system. The buffers used in the flow injection analysis (FIA) system were additionally filtered through 0.45-ILm filters. Brain (striatum) tissue samples obtained from microwave·killed or decapitated Sprague-Dawley mice were a generous donation from LeRoy Blank of the University of Oklahoma.
Apparatus. A Shimadzu LC-6A liquid chromatographic system consisting of a SCL-6B controller, LC-6A pump, SIL-6B autoinjector, FCV-2AH high-pressure switching valve, and CR4A integrator (all from Shimadzu Corporation, Kyoto, Japan) and a BAS LC-4B amperometric detector (BioAnalytical Systems, West Lafayette, IN) coupled to a LC-17AT flow-through thin-layer electrochemical cell were used. The complete HPLC system is shown in Figure 3. An Altex Nucleosil C-18, 5-ILm, 0.46 x 15 em (Alltech Associates, Deerfield, IL) reverse-phase column was used with a Brownlee guard column (Applied Biosystems, Santa Clara, CAl for HPLC separations. A Shimadzu 160 UV -vis spectrophotometer was used for the spectrophotometric measurements. The stainless steel columns used to make IMERs were purchased from Upchurch Scientific, Inc. (Oak Harbor, WA).
Methods. Direct Enzyme Coupling to Support. The activated HW-65 gel (1 mL) was washed according to the manufacturer's instructions. The enzyme (2 mg/mL) was dissolved in 0.1 M carbonate buffer (pH 9.35), and the solution was mixed with the prewashed gel by mechanical inversion for 30 h at 4°C. The coupled gel was then allowed to settle, and the supernatant was removed. The collected gel was then washed on a glass frit, first with 2 M Tris buffer and then with 0.1 M phosphate buffer (PB, pH 7.4) three times, and stored in the same buffer. The protein content in the supernatant and the washings was determined by the BCA assay (9).
f~p mobile phllse
HPlC column ChO column
AchE column lIutosampler
Figure 3, Schematic diagram of the HPLCIIMER system,
Enzym., Coupling through a Spacer Arm to the Support. A solution Qi' triethylenetetramine tetrahydrochloride (TETA) (150 mg/15 mL) in 0.1 M carbonate buffer was mixed with 2 mL of unwashed gel by mechanical inversion for 48 h at 4°C. The coupled gd was then washed with 0.1 M PB pH 8.5. The enzyme (2 mg/mL) was then cross-linked to TETA-gel with 100 ILL of 0.1 % glutlfaldehyde. The reaction mixture was allowed to react at room temperature for 2 h by mecbanical inversion. The coupled gel was th,m washed with 0.1 M PB pH 8.5 and stored in the same buffer for further use.
Enzym., Coupling through Avidin-Biotin Linkage. Avidin (6 mg/mL) was dissolved directly in 0.1 M carbonate buffer (pH 9.35), and the solution was mixed with 2 mL of prewashed gel by mechanical inversion for 30 h at 4°C. The coupled gel was washed and stored in 0.1 M PE. The biotinylated enzyme was prepared by reacting NHS-LC-Biotin (6 mg) and ChO (5 mg) in 1 mL of 0.05 M carbonate buffer (pH 8.0) for 2 h at 4°C. The reaction rlixture was then dialyzed against two volume changes of 0.1 M PB (pH 7.4) to remove the excess biotin. The same procedUrE was followed for AchE except that 2 mg of AchE and 2.4 mg of biotin were used in 0.5 mL of 0.05 M carbonate buffer. The biotinylated enzyme was then allowed to react with the avidin-coupled gel for 2 h at room temperature. The gel was then washed a'1d stored in 0.1 M PB as before.
Antiboly Coupling to Support. A solution of mouse monoclonal ant-enzyme antibody (5 mg/mL) in 0.1 M carbonate buffer (pH 9.35) was mixed with 2 mL of prewashed gel for 42 h at 4 °C by mechanical inversion. The coupled gel was first washed with one volume of 2 M Tris buffer (pH 8) and then one volume of 0.01 M phosphate-buffered saline (PBS, pH 2.2) and finally with 0.01 M PBS (pH 7.4). The washed gel was then stored in the same buffer containing 0.02% azide until further use. The goat-anti, mouse Fe specific antibody was coupled to the support by the sa:ne procedure.
Preparation of Monoclonal Antibodies. Murine monoclonal antihodie, specific to ChO and AchE were prepared by the method of Kohler and Milstein (10). Six to eight week old female Balb/C mice were immunized intrasplenically with 20 ILg of antigen. Two weeks lau·r, the mice were again immunized intrasplenically. The mice wen· then boosted with the antigen 48 h before the fusion. The spler,ocytes were fused with NSI mouse myleoma cells. The positive wells were screened by an enzyme-linked immWlosorbent assay (ELISA) method. The monoclonal antibodies to both acetylcholinesterase (19D) and choline oxidase (F2DIA6) were of the IgG 1 subclass. Monocloal antibodies in large quantities were obtained from the ascites fluid. The antibodies were then purified flfSt by ammonium sulfate precipitation and then by ion exchange chromatography with 300 mM NaCl in 10 mM Tris buffer (pH 8.0) gradient elution (11). The IgG fraction was collected, concentrated, and then dialyzed against 0.1 M PB (pH 7.4).
Sampl,'? Preparation. Striatum tissue were homogenized in 1.0 mL of 0.1 M perchloric acid containing 2 nmol of ethylhomooholine and centrifuged at 12000g for 10 min. The pH of the supernatant was adjusted to 4.0 by adding about 40 ILL of 4 M potassium acetate, and the solution was centrifuged at 12000g for 10 min. The supernatant was directly injected into the HPLC system.
Standards and Solutions. Acetylcholine and choline stock solutions (0.1 M) were prepared in 0.02 M citrate-phosphate buffer (pH 4.0) weekly and stored at 4°C. Dilutions were daily made in the reaction buffer from these standards. The reaction buffer
for the assay was 0.2 M PB (pH 8.5) containing 1 mM disodium ethylenediaminetetraacetic acid (Na,EDTA). The same amount (2 nmol/mL) of Ehc, the internal standard, was added to the standards as well as to the samples. The mobile pha;e was 0.1 M potassium dihydrogen phosphate containing 1.2 mM TMA, 0.372 g EDTA, and 10 mg/L SOS. The pH was adjm.ted to 7.0 by adding 5 N KOH. For the AchE antibody bound-fr"e studies, the carrier buffer was 0.1 M PB (pH 7.4) and the eluting huffer was 0.1 M PB (pH 2.2). For ChO antibody studies, the carrier buffer was the same as the reaction buffer and the elution buffer was 0.2 M PB (pH 2.2). The IMER column was 0.21 x 4.0 cm. These columns were packed with coupled gels as described elsewhere (8).
ChO activity on the support was measured by the method of Ikuta et al. (12) with some modifications. The reagent mixture, which consisted of 1 % 4-aminoantipyrine, 1 % phenol, 2.1 % choline chloride, and horseradish peroxidase in 0.1 M Tris buffer (pH 8.0), was added to a known amount of ChO immobilized support and incubated at room temperature for 10 'llin. The reaction was stopped by adding ethanol. The absorbance of the supernatant was measured at 500 nm. Reagent added to an equal volume of pure gel was used as a blank.
RESULTS AND DISCUSSION
The two enzymes used here, ChO and AchE, have very different characteristics. ChO is a monomer with a molecular weight of 72 000 (13) and contains a flavin adenine dinucleotide group as the active site. AchE exists as a dim,'r usually containing two tetrameric sets of catalytic subunits U 4). AchE has a very high turnover number (15) and a hig~ specific activity. ChO has a very low intrinsic turnover rate and specific activity compared to AchE.
Performance of the immobilized ChO column "as always evaluated before it was used in conjunction with an immobilized AchE column. First, the ChO column was used in the FIA system to detect choline standards. When the ChO column was found to be satisfactory, it was used with an AchE column to detect Ach standards.
When ChO was coupled to the support directly :ODe) , the performance of the column was very poor. In this else, it was found that the activity of ChO on the support wa,; very low even though 72 % of added ChO was bound to the support. In other words, the ChO lost virtually all of ita acti, ity (about 99 %) during the coupling step.
When both enzymes were coupled through the s pacer arm (Ose for ChO and Esc for AchE), the detection li'llit of the assay was found to be about 2 pmol for choline. The assay is less sensitive for Ach than for Ch. It was found Lhat when AchE was cross-linked to the spacer arm, the emount of coupling was less (53%) than when coupled directly (72.5%). Therefore, AchE was coupled directly. The enzyme activity of both AchE and ChO IMERs was lost after abolt a week.
The enzymes coupled through avidin-biotin (EAvl; for AchE and OAve for ChO) retained the highest activity, and enhanced sensitivity was observed. The detection limit in this case was 100 fmol (10-8 M). The columns can be used contirluously for about 2 weeks without losing activity.
To enhance the sensitivity, both EAve and 0Ave were packed in the same column in the following different configurations: (a) well-mixed, (b) packed as two separate banes, and (c) packed in several small alternate bands. Configurations a and c both gave broad peaks for the analysis; configurE.tion b did not show any improvement. In fact, the current was lower for b than when EAve and 0Ave were packed in tWI) columns.
To achieve increased sensitivity, the biotinylated enzymes were mixed and allowed to couple to the avidin-botnd support in the same mixture. This support (E/OAvcl was packed in a column and used in the FIA system. This cor figuration showed greatly improved sensitivity, and the detection limit was lowered lO-fold (10 fmol). A wide linear range cf detection was observed. This compares with a previously reported
ANALYTICAL CHEMISTRY, VOL. 62, NO.4, FEBRUARY 15, 1990 • 405
detection limit of about 100 fmol (5). This result is not unexpected, as previous studies have shown that attaching two enzymes in a multienzyme system to the same support results in enhanced efficiency (15). This is because if the two enzymes are in intimate contact, the local concentration of the first product is higher, leading to an increased rate for the second step.
Immobilization through Antibodies. Use of antibodies to immobilize enzymes has not been widely applied due to the difficulties in obtaining monoclonal antibodies (MABs). Preparation of MABs is time-consuming and expensive. The advantages of their use, however, outweigh the difficulties associated with them. Immobilized antibodies are stable for several months if stored properly at 4 °C in a buffer containing an antibacterial agent such as sodium azide. Immobilizing the enzyme through an antibody-antigen reaction is extremely simple.
When each antibody was mixed in excess in solution with its respective enzyme antigen, no inhibition of the enzyme activity was observed, suggesting that the antibodies do not block the active site of the enzyme. However, when immobilized antibody to ChO was reacted with soluble ChO, about 30% of the enzyme activity was inhibited. This may be due either to the nonspecific adsorption of the enzyme on the support or to the crowding of the support with too many antibody molecules.
Antibodies to both ChO and AchE were immobilized on the support as described above. The enzymes were immobilized by injecting an aliquot of enzyme solution in carrier buffer. The bound and free fractions were evaluated for different injection volumes and different enzyme concentrations to establish an optimum concentration and injection volume. The two antibody columns were studied separately.
AchE antibody shows high affinity toward the AchE enzyme. The AchE antibody was coupled to the support (AADe/E) directly and used with an OAve IMER in the FIA system. AchE solution (25 I'L of 0.2 mg/mL solution) was injected into the column before it was connected to the 0 AVe IMER so that the free fraction of AchE would not nonspecifically adsorb on the 0 Ave IMER and give a response for Ach. The detection limit was 100 fmol, and the linear range was from 10-8 to 10-8 M. The same sensitivity was observed when the AchE antibody was immobilized through goatanti-mouse Fe specific IgG (AFCDe/ AE/E).
When ChO antibody was bound to the support and used to immobilize ChO, it was found that the enzyme binds to the antibody effectively even though it has an apparently lower binding affinity than that of the AchE antibody. Since the reaction of ChO with the immobilized antibody is not rapid, optimal attachment is best achieved by injecting small aliquots of enzyme, i.e., it is better to inject 10 aliquots of 10 I'L of 0.1 mg/mL ChO solution than to inject 100 I'L of same ChO solution. For example, when 100 I'L of 0.1 mg/mL ChO was injected, the response for 200 pmol of Ch was only 2.2 nA. When ChO was instead injected in small aliquots (10 I'L) 10 times, the response for 200 pmol was 10.9, indicating the higher enzyme activity in the latter case. Subfemtomole quantities of Ch could be detected soon after the enzyme was injected. The response decreases with each injection of the sample until it reaches a constant value. This decrease in response could be due to nonspecifically adsorbed enzyme being slowly washed off. This was avoided by first injecting 100 I'L of 0.1 mg/mL bovine serum albumin (BSA) solution to saturate the nonspecific sites and then injecting the enzyme. The reproducibility of the method was tested by injecting samples containing known amounts of Ach, Ch, and Ehc repeatedly. The coefficients of variation of the assay are as follows: for Ach, 1.7%; for Ch, 1.1 %; and for Ehc, 2.3% (n = 6). The

406 • ANALYTICAL CHEMISTRY, VOL. 62, NO.4, FEBRUARY 15, 1990
Table I. Comparison of the Immobilization Methods for the Bienzyme Reactor
method of immobilizationO detection
limit, pmol
2000 2.0 0.1 0.01 0.1
response to 200 pmol of Ach,
nA
5.1 ± 0.05 13.6 ± 0.26 72.4 ± 0.17 10.9 ± 0.12
" Abbreviations: E, AchE; 0, ChO; DC, direct coupling; SC, spacer coupling; Ave, avidin-biotin coupling; AE, antibody to AchE; AO, antibody to ChO. 'Indicates two separate columns in series. C Indicates support material for two enzymes mixed.
Table II. Comparison of Detection Limits Obtained with Different AchE Columns
detection immobilization methoda limit, nM
EDC Esc EAve AEDc/E
10 100
1 10
% immobilized on support
93 ± 0.9 53 ± 1.7 91 ± 0.5
100
"Abbreviations: E, AChE; DC, direct coupling; SC, spacer coupling; A VC, avidin-biotin coupling; AE, antibody to AchE.
detection limit was 100 fmol. Equivalent sensitivity was seen when the ChO antibody was immobilized through goatanti-mouse Fc specific antibodies (AFCDe/AO/O). This method in principle is superior because a common support containing this antibody can be used to immobilize the monoclonals for both enzymes.
The results obtained by all these immobilization methods are summarized in Table 1. Since the experimental data obtained so far suggest that the detection limit of the assay is determined by the ChO column, experiments were carried out to study the efficiency of the AchE column independent of the ChO column, the effluents from the AchE column were collected, and the choline content was determined. Ch in the effluent, produced by the conversion of Ach as it passes through the AchE column, is converted to H20 2 by adding ChO and incubating for 1 h at 37°C. The produced H20 2 is then determined electrochemically in the FIA system. The lowest concentration of Ach that could be converted by the AchE column was thus detected. AchE columns prepared by all the immobilization methods discussed before were compared, and these results are shown in Table II. The results show that in contrast to ChO, immobilized AchE has retained most of its activity during the immobilization step regardless of the immobilization method used.
These studies have shown that the activity of the ChO column defines the detection limit of the assay. To further study this, the activity of ChO on the support after immobilization was determined. These results are shown in Table III.
The data in Table III show that the ChO immobilized through avidin-biotin linkage, 0 Ave, has the highest activity. Enzyme activity on the supports that have ChO immobilized through the antibody is considerably higher than that of the other methods, but lower than that attained with the avidin-biotin method. Random coupling of the antibody yields a low number of properly oriented antibody molecules on the support (17), and this, along with some reduction of enzyme activity on binding, contributes to the low observed activity. Multisite attachment of the antibody molecule also lowers its antigen binding capacity. Low activity of the antibody is substantiated from the data in Table III and the amount of
Table III Performance of ChO Supports.
loading of immobzd ChO, enzyme
immobzn mg/mL % uptake activ, method" support ofChO units % actiVC
°DC 1.2 (5.5)' 85 0.015 0.32 Osc 1.0 (4.6)' 81 0.23 6.2 °Ave 2.5 (11.5)' 91 3.8 36.3 E/OAvc 2.5 (11.5)' 84 3.1 32.1 AODC/O 0.02 (0.09)' 100 0.023 25.6 AFC/AO)c/O 0.02 (0.09)' 100 0.018 20.0
" Abbreviations: 0, ChO; E, AchE; DC, direct coupling; SC, spacer coupling; A VC, avidin-biotin coupling; AO, antibody to ChO; AFC, goat-anti-mouse Fc specific antibody. 'Units of enzyme in parentheses. C Percent activity on the support relative to soluble en..::'yc.m_ec.. _________________ _
.r: U
o
o .r: w
15 o
.r: U
o Gi
15
(b)
Figure 4. HPLC/IMER chromatograms: (a) 20 ILL of standard mixture containing 40 pmol of Ch and Ach and 40 pmol of Ehc; (b) 20 ILL of tissue extr3ct containing 40 pmol of EhC.
antibody immobilized. It has been estimated that only 6 % of the im o:J.obilized antibody is active in effective binding of enzyme. This can be corrected by coupling Fab' fragments or by oriented coupling through the Fc region (17, 18). Since the turnc ver rate and specific activity of ChO are very low, a higher concentration of active enzyme in the column is required to obtain significant activity.
Tissu" Analysis. Since E/OAVC showed the best performance, this column was used for the analysis of brain tissues. mnce ChO has a pH optimum between 7.5 and 8.5 and the "olumn material is unstable at pHs above 7.0, a compromise had to be made between the optimum pH of ChO and the column stability. Therefore the mobile phase used was 0.1 M KH2PO, containing 1.2 mM TMA, 10 mg/L SOS, and 1 mM Na2EDTA. TMA was added to the mobile phase to reduce the strong adsorption of Ach to the solid phase. But the addition of TMA shortens the lifetime of the IMER and reduces the detector response by inhibiting ChO. About 88% of enzyme activity is lost after 20 sample injections. Very well-resolved peaks were observed for a standard mixture containing Ch, Ehc, and Ach. The calibration curves obtained for Ach, Ch, and Ehc standards are linear (r = 0.999 for all three analytes) in the 0.1-500-pmol range. The current response for Ehc is less than those of Ch and Ach. Typical chromatograms for a standard mixture and a sample are

Anal Chern. 1990, 62, 407-409 407
shown in Figure 4. The usual neurotransmitters (dop, mine. norepinephrine, and homovanillic acid) found in brain 1 issues gave no response in the assay system.
From the assays, the Ach content in the decapitated group was found to be 14.3 ± 2.1 pmol/mg and the Ch content was 75.7 ± 3.4 pmol/mg. The respective values for the microwave-killed group are 38.9 ± 2.6 and 22.8 ± 1.8 pmol/m,. The data are presented as the mean ± standard error of the mean and n ; 5. These results are in agreement with the pul: lished values (5). The values show that Ch concentration is high in decapitated brain tissue either due to the conversion 0' some Ach to Ch as a consequence of the action of residual AchE in the tissue or due to the release of membrane· bound Ch.
CONCLUSIONS In conclusion, we have demonstrated that effective immo
bilization of enzymes can be achieved through antibo,iies or the avidin-biotin complex. Highest activity of the imme bilized enzymes was attained by the latter immobilization method. The extended spacer arm of biotin allows more efficient access to the enzyme molecule and is effective in reducing th,) steric hindrances associated with binding. It is also much eLsier to control the extent of covalent coupling of biotin to the e 1zyme. This system cannot be regenerated, which is a disadvantage. The immobilization through antibodies has the added advantage of easy and quick regeneration of the IMEK The quick regenerating ability of the column is very useful, specially for tissue analysis where the TMA in the mo bil" phase inhibits the ChO. Optimization of antibody activity and site density, possibly with the use of spacer arms and/ or coupling of Fab' fragments, may give a more satisfactory performance. Because of the inherently low specific activity of ChO and its sensitivity to its environment, the enzyme system will need to be regenerated frequently. Thus the use of antibody coupling is well worth the additional effort. A select.ve and sensitive method has been developed for the detection of Ach and Ch at femtomole levels. The sensitivity of the method
CORRESPONDENCE
can further be enhanced by improving the antibody immobilization procedures to obtain increased response, and such work is currently in progress.
ACKNOWLEDGMENT We thank Rohan Wimalasena and Dilbir S. Bindra for their
assistance in the preparation of monoclonal antibodies and Uditha de Alwis for helpful discussions.
LITERATURE CITED (1) Davis, Kenneth L.; Berger, Philip A. P. Brain Acetylcholine and
Neuropsychiatric Disease; Plenum Press: New York, 1979. (2) Newton, M. W.; Ringdahl, B.; Jenden, O. J. Anal. Biochem. 1983.
130,88-94. (3) McCaman, R. E.; Stetzler, J. J. Neurochem. 1977,28,669-671. (4) Potter, P. E.; Meek, J. L.; Neff, N. H. J. Neurochem. 1983, 41,
188-194. (5) Asano, M.; Miyaauchi, T.; Kato, T.; Fujimori, K.; Yamamoto, K. J. Uq.
Chromatogr. 1986, 9, 199-215. (6) Israel, M.; Lesbats, B. Bio/urnin. Chemilumin. Instrum. Appl. 1985,
2,1-11. (7) Damsma, G.; Westerink, B. H. C.; Horn, A. S. J. Neurochem. 1985,
45, 1649-1652. (8) De Alwis, U.; Wilson, G. S. Talanta 1989, 36, 249-253. (9) Wiechelman, K. J.; Brawn, Robert D.; Fitzpatrick, J. D. Anal. Bio
chern. 1988, 175,231-237. (10) Kohler, G.; Milstein, G. Nature 1975, 256, 495-497. (11) Goding, J. W. Monoclonal Antibodies: Principles and Practice; Aca
demiC Press: New York, 1983; pp 100-115. (12) Ikuta, S.; MaTuura, K. Imamura, S.; Misaki, H.; Horiuti, Y. J. Bio
chern. 1977, 82, 157-163. (13) Ohta-Fukuyama, 0.; Miyake, Y.; Emi, S.; Yamano, T. J. Biochem.
1980, 88, 197-203. (14) MacPhee-Quigley, K.; Vedvick, T. S.; Taylor, P.; Taylor, S. S. J. BioI.
Chern. 1986, 261, 13565-13570. (15) Zubay, Geoffrey L. Biochemistry Macmillan Publishing CO.: New York,
1988; p 271. (16) Mosbach, K.; Mattiasson, B. Methods in Enzymology, Vol. XLIV; Aca
demiC Press: New York, 1976; pp 453-478. (17) Matson, Robert S.; Little, Michael C. J. Chromatogr. 1988, 458,
67-77. (18) Cress, M. C.; Ngo, T. T. Am. Biotechnal. Lab. 1989, 7, 16-19.
RECEIVED for review August 9, 1989. Accepted November 28, 1989. We gratefully acknowledge support from the National Institues of Health (GM 40038).
Multichannel Electrochemical Detection System for Flow Analysis
Sir: Electrochemical detection in flow systems r as been widely used for trace analysis of electroactive materials (1). The most common method is amperometric detecLon with a single disk (or plate) electrode maintained at constant potential. However, this method only provides poor infCTmation on the electrochemical properties of a species to be c etected. Recently, much attention has been focused on electrochemical flow-through voltammetric detection with scanning p,)tentials in order to obtain three-dimensional information (time, potential, and current). This method usually require" a rapid potential scan to catch species flowing in and out 0'" the detector, resulting in increases in the background due to charging current and also in distortion of the voltammetric Sf ape. To overcome this problem, several techniques have been reported, including square-wave voltammetry (2-9), staircase voltammetry (J 0-12), normal (12) and differential pulse ( 13) techniques, microdisk or microwire voltammetry (12, 14, 15), and a combination of voltammetric and amperometric c.etection (16, 17).
0003-2700/90/0362-0407$02.50/0
In this paper, we report on multichannel electrochemical detection in flow systems using a microelectrode array. The microelectrode array consisted of an assembly of independent microband electrodes held at different potentials. The currents flowing in the individual electrodes were collected to obtain three-dimensional results. This detection system was used for flow injection analysis (FIA).
EXPERIMENTAL SECTION Ferrocenylmethyl alcohol (FMA) was synthesized by reducing
ferrocenecarboxaldehyde (Aldrich) with NaBH, and recrystallized twice from heptane. (Ferrocenylmethyl)trimethylammonium perchlorate (FA +C10, -) was prepared from its iodide salt (Aldrich) by using sodium perchlorate and was recrystallized from water.
The microelectrode array was fabricated (18) by conventional photolithography using a Shipley photoresist (Microposit 1400-31) on a glass plate sputtered with a thin gold film (film thickness; 200 nm). Figure 1 shows a schematized illustration of the array electrode. The array consisted of 16 microband electrodes. Only a part of this, shown in Figure 1 as a square, was exposed to the
© 1990 American Chemical SOCiety

408 • ANALYTICAL CHEMISTRY, VOL. 62, NO.4, FEBRUARY 15, 1990
Table I. Various Three~Dimensional Detection Systems
method equiv scan rate, V /s time, sa potntl resoiutiol, mV detection lim (compd) ref
this study (16 channel) 28' 0.027 50 4 X 10⁻⁷ M, 2 X 10-11 mol (FMA, FA+) (80 channel) 2.8' 0.27 10 4 x 10⁻⁷ M, 2 X 10-11 mol (FMA, FA +)
voltammetric/amperometric 2.0 0.375 3.7 x 10⁻¹² mol (gentisic acid) 18 open tubular 1.0 0.75 10 10-8 M (hydroquinone) 16 square wave 1.0 0.75 10 10-7 M (N-nitroproline) 2
0.5 1.5 5 5 X 10-12 mol (catecholamines) 9 staircase 1.25 0.6 5 10-11 mol (phenanthrenequinone) 12
0.6 1.25 10 10-12 mol (catecholamines) 11 0.5 1.5 50 1.9 x 10⁻¹¹ mol (norepinephrine) 13
differential pulse 0.03 25 50 10-7 M (acetaminophen) 14
aTime required to obtain a voltammogram over the potential range of 750 mY. bCalculated by dividing the potential range (750 mY) by the data acquisition time.
Figure 1. Schematized illustration of the microelectrode array used in this study. The area inside the square was exposed to the solution.
solution. The remainder was covered with photoresist to avoid leakage of the solution. Each band exposed to the solution was 0.1 mm in width and 7 mm in length, The flow-through cell was basically same as that used in previous studies (18, 19). The electrode array was held in the flow-through cell by a Teflon spacer (thickness: 0.1 mm). The flow channel was 4 mm wide and 12 mm long, and the total cell volume was 4.8 ILL. The auxiliary electrode was a glassy carbon disk mounted in the opposite wall, An Ag/ AgCI reference electrode was placed in a downstream compartment.
The multipotentiostat with 16 independent working electrode terminals was made in our laboratory. The basic circuit of the potentiostat is shown in Figure 2, The 16 responses from the current~toMvoltage converters in the multipotentiostat were drawn into two-channel multiplexers, and the resulting two sets of eight signals were digitzed successively by a eight-channel analog-todigital (12 bit) converter system (Stanford Research Systems, Model SR245). All these instruments were controlled by an NEC 9801 VX2 personal computer with an 80286 central processing unit and an 80287 coprocessor. The program for instrument timing and data acquisition was written in Turbo Pascal with binary data transfer.
The FIA measurements were conducted with a JASCO 880-PU pump, an injector with a 50-ILL sample loop, and the multipotentiostat connected with the flow-through cell. A stainless steel tube (10 m X 0.25 mm i,d.) was placed between pump and loop injector to serve as a pulse damper. The mobile phase was 0.1 M Na2S0, aqueous solution, and a flow rate of 1 mL min-1 was used.
RESULTS AND DISCUSSION Figure 3a illustrates a typical three-dimensional FIA result
for a mixture of 25 nmol of FMA and 25 nmol of FA + observed
Figure 2. Basic circuit of the multipotentiostat: WCW'6' working electrodns; R, reference electrode; C, counter electrode.
Figure 3 Three-dimensional FIA results for a mixture of 2.5 nmol of FMA ane 2.5 nmol of FA+: (a) i6-channel detection: (b) BO-channel detectior.
by 16-channel detection with a potential resolution of 50 m V, In this ;ase, the potential applied to the array ranged from o to 750 m V vs Ag/ AgCI and the potential of each microband electroC:e differed by 50 m V from that of the adjacent electrode, The oxidation peaks for the two ferrocenes appear at 15 s. Since the half-wave potentials for the two ferrocene derivatives differ by ca, 0,2 V, two plateaus are seen at the peak time. Unlike potential scanning methods (2-15), this 16-charnel detection system does not suffer from the undesired effect of charging current, since the potentials for the individual electrodes were held at constant values, A series of curnmts from 16 electrodes provides a hydrodynamic voltammogram, The voltammogram is acquired within a short period; in the present 16-channel detection, 27 ms.
The ,esolution in terms of potential can be improved by applyin, small stepping potential to the 16 microband electrodes. Figure 3b shows the three-dimensional FIA result of a mixtu:e of two ferrocenes observed by 80-channel detection with a rotential resolution of 10 m V, In this case, a five-step potential staircase of 10-m V step height was applied to the

Anal Chern. 1990, 62, 409-411 409
l50nA
o 0.2 0.4 0 .. 6 0.8 E I V vs Ag/AgCI
Figure 4. Hydrodynamic voltammogram for a mixture of 2.b nmol of FMA and 2.5 nmol of FA+ The voltammogram was obtained from a cross section of Figure 3b at the peak time.
individual microband electrodes. Thus, the current rEsponses at 80 different potentials were obtained in one eye: e. The currents at the 16 microband electrodes were sampled at least 20 ms after each potential step to eliminate the influence of charging current. The collection and displaying of 80 current signals at different potentials were completed in 0:27 s.
The hydrodynamic voltammogram for this mixture can easily be obtained from a cross section at various times Figure 4 shows the hydrodynamic voltammogram obtained f 'om the cross section at the peak time of Figure 3b. The voLammogram has two stairs corresponding to the oxidatior of two ferrocenes; the first for FMA and the second for F A+. The half-wave potentials for FMA and FA + were identical with those observed in cyclic voltammetry. The concentr.ltion of the ferrocenes can be determined from the height of the steady-state currents. Since each microband electr~de has a different potential, cross talk between the electrodes may occur. However, the influence of the cross talk was m·gligible in this case. The steady-state currents for both ferrocenes linearly increased with concentration over the range C.1 nmol (2 x 10⁻⁶ M) to 200 nmol (4 x 10⁻³ M). The detection limit (S/ N; 2) was 20 pmol (4 X 10⁻⁷ M).
The results obtained in the present study are summarized in Table I, together with those in flow analyses with the potential scanning detections reported in the literatu 'e. The equivalent scan rates in the present method were calculated by dividing the potentia! range (750 m V) by data acquisition times. Table I also lists the time required to obtair, a voltammogram over the potential range of 750 m V. The comparison demonstrates that the present system, especially with 16-channel detection, is superior to the potential s"anning
methods in terms of the data acquisition time for voltammograms. Thus, the present system will be particularly suitable for three-dimensional detection by FIA with small injection volumes. Although the detection limit is not satisfactory at the present stage, it will be decreased by improving the flow cell construction and the circuits of the potentiostat. Various applications to biological samples in FIA and liquid chromatography as well as efforts to further refine the technique are now underway in our laboratory.
ACKNOWLEDGMENT We thank Dr. J. R. Selman, a visiting professor of our
faculty, for helpful suggestions. This study has been partly supported by Grant-in-Aid for Scientific Research (Nos. 01470076 and 01850175) from The Ministry of Education, Science and Culture, Japan.
LITERATURE CITED (1) Kissinger, P. T. Laboratory Techniques in ElectroanaJytical Chemistry;
Kissinger, P. T., Heineman, W. R., Eds.; Marcel Dekker: New York, 1984; Chapter 22.
(2) Samuelsson, R.; O'Dea, J.; Osteryoung, J. Anal. Chern. 1980, 52, 2215-2216.
(3) Wang, J.; Ouzie], E.; Yarnitzky, C.; Ariel, M. Anal. Chim. Acta 1978, 102. 99-112.
(4) Last, J. A. Anal. Chern. 1983. 55, 1509-1512. (5) Scanlon, J. J.; Flaquer, P. A.; Robinson, G. W.; O'Brien, G. E.; Strrock,
P. E. Anal. Chim. Acta 1984, 158,169-177. (6) Reardon, P. A.; O'Brien, G. E.; Strurrock, P. E. Anal. Chim. Acta
1984, 162,175-185. (7) Thomas, M. B.; Msimanga, H.; Sturrock, P. E. Anal. Chim. Acta 1985,
174,287-191. (8) Owens, D.; Sturrock, P. E. Anal. Chim. Acta 1986, 188,269-274. (9) Kounaves, S. P.; Young, J. B. Anal. Chern. 1989. 61, 1469-1472.
(10) Owens, D. S.; Johnson, C. M.; Sturrock, P. E.; JaramlUo, A. Anal. Chirn. Acta 1987, 197,249-256.
(11) Gunasingham, H.; Tay, B. T.; Ang, K. P. Anal. Chern. 1987, 59, 262-266.
(12) Gaudill, W. L.; Ewing, A. G.; Jones, S.; Wightman, R. W. Anal. Chem. 1983.55, 1877-1881.
(13) Wang. J.; Dewald, H. D. Anal. Chirn. Acta 1983. 153.325-330. (14) White. J. G.; Claire, R. L. S., III; Jorgenson, J. W. Anal. Chern. 1986.
58. 293-298. (15) White, J. G.; Jorgenson, J. W. Anal. Chern. 1986, 58. 2992-2995. (16) Lunte, C. E.; Ridgway, T. H.; Heineman, W. R. Anal. Chem. 1987, 59,
761-766. (17) Lunte, C. E.; Wheeler, J. F.; Heineman, W. R. Anal. Chim. Acta 1987,
200,101-114. (18) Matsue. T.; Aoki, A.; Abe, T.; Uchida. I. Chern. Lett. 1989, 133-136. (19) Matsue, T.; Aoki. A.; Uchida, I.; Osa. T. 8ull. Chern. Soc. Jpn. 1987,
60,3591-3595.
Tomokazu Matsue* Atsushi Aoki
Eiji Ando Isamu Uchida*
Department of Molecular Chemistry and Engineering Faculty of Engineering Tohoku University Aoba, Sendai 980, Japan
RECEIVED for review August 7, 1989. Accepted November 13, 1989.
Lanthanum Hexaboride Electron Emitter for Electron Impact and Electron-Induced Dissociation Fourier Transform Ion Cyclotron Resonance Spectrometry
Sir: Ribbon filaments of either tungsten or rhenit:m have been used as electron sources for electron impact iOllization studies by Fourier transform ion cyclotron resonance spectrometry (FT-ICR) for a number of years. Unfortunately, these filaments are also a major source of down time for these instruments. The primary reason for filament failuro is me-
0003-2700/9010362-04')9$02.50/0
chanica! instability resulting in twisting which, in turn, results in a loss of electron throughput due to breakage or misalignment. This twisting is a result of the torque imposed on the filament as a relatively high current (3-4 A) runs perpendicular to the strong magnetic fields employed in many of these instruments. These problems are intensified on in-
© 1990 American Chemical Society

410 • ANALYTICAL CHEMISTRY, VOL. 62, NO.4, FEBRUARY 15, 1990
struments that use superconducting magnets. In addition, ribbon filaments require considerable power (work functions for Wand Re on 4.55 and 4.96 eV, respectively) and operate at high temperatures (ca. 2500 °C) causing heating of the cell and concomitant outgassing. One solution to both of these problems is to mount the filament external to the field as in recent commercial systems.
LaB6 cathodes (work function 3.5 eV) have been successfully used as thermionic electron emitters (1) in a number of devices including scanning electron and scanning tunneling microscopes and X-ray sources. These emitters have been successfully interfaced with both quadrupole and sector mass spectrometers operated in both chemical ionization (Cl) and electron impact (EI) modes (2, 3). They offer several benefits over tungsten-rbenium filaments including (i) decreased power consumption (a few watts) (4), (ii) lower temperature operation «2000 °C), (iii) increased thermal/mechanical stability, (iv) very tightly focused beams (0.5 mm to 2-3 !Lm (3)) with current densities of up to 100 A cm-2 (5), and (v) low evaporation rate (operating at 10 A/em', the evaporation rate is about 10-8 g cm-' S-l (4» resulting in long emitter lifetime. A 10-fold increase in electron emitter lifetime was observed for a LaB6 cathode over a rhenium filament operated at conditions generic to CI and EI ionization in quadrupole and sector mass spectrometers (2). In addition, LaB6 emitters like tungsten and rhenium emitters are inert to repeated exposure to the atmosphere while cool.
There are two principal disadvantages to using LaB6 electron emitters as electron sOurces for ionization in mass spectrometry. Namely, these cathodes (i) are expensive with respect to rhenium or tungsten counterparts, and (ii) show chemical sensitivity to electronegative species. It is thought that electronegative atoms (such as 0 and Cl) bind to the surface increasing the work function and reducing the electron emission. Poisoned cathodes can normally be cleaned by increasing the operating temperature for a short period of time to volatilize the oxidized LaX species (3). Surface oxidation reduces emitter lifetime in direct proportion to the amount of material that is poisoned, and exposure to high pressures (>10-6 Torr) of oxidizing gases is, therefore, discouraged.
In this note, we discuss the use of a LaB6 cathode as an electron source for electron impact Fourier transform ion cyclotron resonance spectrometry (FT-ICR). The feasibility of routine use of these emitters is considered in terms of projected lifetime and chemical sensitivity. Because the extremely high electron flux densities can be obtained by these emitters, we have also examined their use for electron induced ion dissociation.
EXPERIMENTAL SECTION All experiments were performed on an ICR system built at
TAMU and equipped with a Nicolet 1280 computer. The instrument is equipped with a 3-T superconducting magnet (Oxford). The instrument has been described in detail previously (6).
The LaB6 cathode used for this work (Model ES-423-BF, Kimball Physics) has a circular single crystal plane emitting surface 0.33 mm in diameter (Figure 1). The emitter is mounted in a custom ceramic holder in order to support the cathode rigidly in the magnetic field and to protect it from damage (see Figure 2). The cathode support also holds an extraction lens. The LaB6 emitter, lens, and holder are mounted as one unit to a trap plate of the ICR cell. The cathode is floated at the desired ionizing potential (10 to -70 V) and electrons are gated to the cell by pulsing the extraction plate from 5 V below to 5 V above this potential.
RESULTS AND DISCUSSION LaB6 cathodes are superior to tungsten and rhenium fila
ments for most applications, but it was not known if such emitters could withstand the high magnetic fields used in
Carbon Conduct ing Posts
Cer ami c Bas e
Tantalum Conductor
Figure 1 The Kimball Physics ES-423-BF LaB6 electron emitter. Driving C'jrrent flows in one tantalum conductor, up one of the conducting carbon posts, through the crystal mounting base, down the other ca()on conductor post, and out of the other tantalum conductor.
/ LaBe Enlltter
Figure 2. Section view of the electron source used in the studies reported here. The LaBs emitter is held in place by a macor receiving cup placed in a macor terminal holder. The extraction lens also fits in the er1itter holder assembly.
FT-ICE. It was feared that the current flowing through the cathodE would break the carbon posts supporting the crystal emissiol surface due to the torque imposed by current flowing perpendicular to the high magnetic field at the emitter's tip. Experimentally, however, these concerns were found to have no basi". The cathode showed no sign of failure upon passing current3 of up to 1.9 A while in the magnetic field. Emission currents of 25 nA to 200 !LA were obtained on adjusting the driving current between 1.2 and 1.6 A. Outgassing of the cathodE and the surrounding ceramic holder was not observed.
For these studies, the electron emitter is mounted at one end of a two-section FT-ICR cell described previously (6). Becaus'o the system is differentially pumped, the pressure in the region of the emitter could be maintained at 2 X 10'" Torr

A
I I ~ B
.• ,u •• 1
so '00 1SQ MASS IN A.M.U.
200
Figure 3. (A) Fe(CO), ionized by 20-eV electrons for 2JO {.ts, (B) Fe(CO), ionized by 9-eV electrons for 300 ms.
while the pressure in the ion cell (single cell mode) could be maintained at 2 X 10⁻⁶ or less.
The maximum current density for LaB6 emitter; exceeds that for ribbon filaments by at least a factor of 2 :< 105 (5), allowing ionization periods to be very short «60 I.S). Ionization periods of greater than 1 ms can easily result in Coulombic space charge effects between ionized sample nolecules. Excellent signal-to-noise ratio spectra were obtained for benzene for ionization periods of 60 {.tS at sample pressures of <10-7 Torr (8/ N = 1000; 1000 signal averaged s,;ans). In addition, increase emission current density could have serious ramifications for chemical studies, because the possibility of multiple electron interactions is increased.
As a test of multiple electron interactions, a study of electron impact ionization of Fe(CO)5 was performed. Fe(CO)5 was admitted to the vacuum system at a static prebsure of 2 x 10⁻⁷ Torr. Two different ionization conditions were probed. In the first, the electron energy was set to 20 e V for a period of 200 {.tS at an emission current of ca. 10 {.tA. The resulting spectrum for these ionization conditions is found n Figure 3A. Note that all the Fe(CO)x (x = 0-5) species are present in the spectrum as expected due to the fact tha; the appearance potentials for all members of this series are less than 20 e V (7). In the second test, the electron energy \las set at 9 e V and the ionization period was set to 300 ms. ,A,gain, the emission current was maintained at ca. 10 {.tA. The :;pectrum for these conditions (Figure 3B) shows that only Fe-- is in the cell (appearance energy (AE) ca. 15 e V). On the basis of the appearance energies for the fragment ions, only Fe(CO)/ (AE = 9 e V) and Fe(CO)5 + (AE = 8 e V)(7) should app,ar in the spectrum if single electron interactions are occurring Clearly, multiple electron interactions with Fe(CO)x + are occurring under the latter conditions. The electron beam flu { density for the spectrum in Figure 3A was approximately [,5 x 10-3
electron/ A and approximately 2 electrons/ A for the 3pectrum
ANALYTICAL CHEMISTRY, VOL. 62, NO.4, FEBRUARY 15, 1990.411
in Figure 3B. Multiple electron interactions have been observed to cause ion dissociation in FT-ICR studies using conventional ribbon filaments (8, 9).
The potential use of LaB6 emitters as high flux density electron sources for electron impact induced dissociation is very promising. Potential studies in this laboratory indicate that polyatomic species can be readily fragmented by using the electron beam produced by these cathodes. Significant fragmentation of benzene was observed by using ionizing electrons with nominal energies between 10 and 12 e V under high flux conditions (i.e. emission current> 100 {.tA). Under these conditions, ionization periods of <100 {.tS produced C3
and C4 fragment ions in abundance. The lifetime of LaB6 emitters for operation at a given
emission current with reference to a different emission current is given approximately by n2.45 (4). That is, if the emission current is decreased by a factor of 4300, then emitter lifetime increases by 43002.45 or 8 X 10⁸• For our system, operating the emitter at 0.023 A cm-2 (20 {.tA emission) should increase its lifetime by 8 x 10⁸ times over operating at 100 Acm-2• On the basis of an estimated lifetime of 400 h at 100 A cm-2, the projected lifetime of the LabB6 emitter in the TAMU system is approximately 3.2 x 10¹¹ h without considering chemical degradation.
As mentioned above, LaX species formed by the reaction of electronegative atoms with LaB6 increase the work function, thereby poisoning the emissive properties of the cathode. To circumvent this problem, the cathode must be operated at temperatures such that the various oxidized LaX species evaporate at a rate greater than the formation rate of LaX species itself (4) decreasing the expected lifetime by orders of magnitude. Actual performance will depend strongly on the chemical environments to which the emitter is exposed; higher pressures of oxidizing species will dramatically attenuate the lifetime. We anticipate that functional lifetimes will probably not exceed 5000 h under the conditions of the FTICR experiment.
Registry No. LaB6, 12008-21-8.
LITERATURE CITED (1) Lafferty, J. M, J, Appl, Phys, 1951, 22, 399-309, (2) Kelner, L.; fales, H. M.; Markey, S. P.; Crawford, C. K. Int. J. Mass
Spectrom, Ion Phys, 1982, 43, 249-259. (3) Kelner, L.; Markey, S. P.; Fales, H. M.; Cole, P. A.; Crawford, C. K
Int. J. Mass Spectrom. Ion Phys. 1983, 51, 215-223. (4) Crawford, C. K. Scanning Electron Microsc. 1979, 1, 19-30. (5) Hohn, F, J.; Chang, T. H. P.; Broers, A, N.; Frankel, G, S,; Peters, E.
T.; Lee. D. W. J. Appl. Phys, 1982, 53,1283-1296, (6) Kerley, E, L.; Russell, D, H. Anal. Chern, 1989, 6t, 53-57, (7) Rosenstock, H. M.; Draxl, K.; Steiner, B. W.; Herron, J. T. J. Phys.
Chern, Ref, Data 1977, 6, 1-520, 1-521. (8) Cody, R. 8.; Freiser, B, S. Anal. Chern. 1979, 51,547-551, (9) Cody, R. 8.; Freiser, B, S, Anal. Chern. 1987, 59, 1056-1059.
Department of Chemistry Texas A&M University College Station, Texas 77843
Eric L. Kerley Curtiss D. Hanson David H. Russell'
RECEIVED for review August, 24, 1989. Accepted November 22, 1989. Support for this work was provided by the NSF (CHE-8821780).

412 Anal. Chern. 1990. 62. 412-4'14
TECHNICAL NOTES
Elimination of Power Line Noise from Transient Signals by Selective Triggering
Emilie Lasson and Vernon D. Parker*
Department of Chemistry and Biochemistry, Utah State University, Logan, Utah 84322-0300
Periodic noise originating from the power line is often troublesome in analytical measurements, especially at low signal levels. In recent years a great deal of effort has gone into the development of digital filters to obtain signals free of noise (1). Selection of the trigger interval (Tn can be a useful strategy to reduce the effects of periodic noise. In this paper trigger interval refers to the interval between response evoking trigger pulses. It is commonly believed that the trigger interval should not be an integer multiple of the power line frequency (2). However, Bialkowski has shown that there can be advantages to making the experimental cycle synchronous with the line frequency when a base-line subtraction procedure is used (3). Nielsen and Hammerich (4) use a triggering device with an alternating phase shift so that successive triggers are shifted by 1800 relative to the line frequency. We have found that averaging signals obtained by triggering at exact selected intervals is very effective in the elimination of noise at the line frequency and the first overtone. The method is convenient, and the TI can be designed to fit the application at hand.
EXPERIMENTAL SECTION Instrumentation and Procedures. Hewlett-Packard HP-
3314A function generators were used to trigger Nicolet 310 digital oscilloscopes for recording signals. The current follower output from JS Instrument Systems Model J-1600-B potentiostats provided signals with periodic noise. Sine waves were generated with a Princeton Applied Research selective amplifier Model PAR 189. The oscilloscopes were interfaced to personal computers by using IEEE-488 interfaces. Data manipulations were carried out with FORTRAN programs.
The procedure for selecting trigger intervals involved averaging two successive oscilloscope recordings of a continuous sine wave and comparing amplitudes before and after averaging. TIs were generated with a resolution of 1 ms below 10 sand 10 ms above 10 s. No difference could be detected when triggering was performed with any of five function generators. All TIs possible with this resolution between 1 and 30 s were evaluated. This range of TI values was selected for voltammetry applications, but others outside of this range can readily be evaluated as welL
RESULTS AND DISCUSSION A sample of the data generated during the trigger selection
process is shown in Table I. At a trigger interval of 10.36 s the 60-Hz amplitude ratio was about 3000 and that at 120 Hz was nearly 30. A significant feature of the data is that large ratios were observed every fifth O.01-s increment for the 60-Hz signal while large ratios appear every sixth to seventh O.Ol-s increment for the 120-Hz signaL However, it was possible to find TIs, such as that at 10.36 s, where high ratios were observed for both the 60- and 120-Hz signals. For our applications we selected TI values of 1.036, 3.41, 10.36, and 27.6 s.
The effectiveness of the procedure for reducing the amplitude of periodic signals is illustrated in Figures 1 and 2. The amplitude of the sine wave (Figure 1a) was reduced by a factor of about 500 (Figure Ib) when two successive scans were averaged with a trigger interval of 10.06 s. The output of the current follower of a potentiostat at a rest potential of
0003-2700/90/0362-0412$02.50/0
Table I. Examples of Noise Reduction Factors for Various Trigger Times
Ir gger time!s
10.26 10.27 10.28 10.29 10.30 10.31 10.32 10.33 10.34 10.35 10.36 10.37 10.38 10.39 10.40 10.41 10.42 10.43 10.44 10.45 10.46
signal intensity ratioG at
60 Hz 120 Hz
747 1.3 1.1 1.0 3.3 1.3 2.6 3.3 1.1 114.8
1494 6.1 1.1 1.6 3.0 1.0 2.8 1.1 1.1 2.5
2986 28.1 1.1 11.2 3.0 2.0 3.0 1.1 1.1 1.1
1495 1.8 1.1 9.3 2.8 30.8 3.0 2.5 1.1 1.2
747 1.0
(l The anplitude of the signal before averaging divided by that after aven ging two scans.
o V VS Ag+ / Ag electrode in acetonitrile-Bu.N+PFs- (0.1 M) is shown in Figure 2a. Averaging 20 oscilloscope traces taken at a 3.40-s interval (Figure 2b) reduced the high-frequency noise but left the 60- and 120-Hz periodic noise unchanged. Changing the TI by only 0.01 s to 3.41 s resulted in the essentially ·,omplete removal of the periodic noise (Figure 2c). The resu;t for a TI of 3.42 s was nearly identical with that shown in Figure 2b.
Measu"ements over a period of several months have not revealed any significant differences in effective TI. This indicates that any instability in the line noise phase does not significancly affect the utility of the method. It is obvious that large varhtions in the phase would have a detrimental effect, but we have not experienced problems of this nature.
Electr(,analytical chemistry is an area where elimination of power line noise can be essential for quantitative work. This is especially true when ultramicroelectrodes, which give rise to exceedingly low currents, are used in voltammetry experiments. nhe application of the triggering technique to linear sweep vO.tammetry is illustrated in Figure 3. The voltammogram recorded at 10 V /s for the oxidation of 9,10-diphenylanthracene (0.5 mM) in acetonitrile-Bu.NPFs (0.1 M) measured at a platinum disk electrode (d ; 100 I'm) is severely distorted by periodic noise (Figure 3a). Averaging 20 scans with a TI of 10.00 s followed by a fast Fourier transform (FIT) treatment (4, 5) of the data gave a voltammogram in which the 60-H,. component of the noise remained (Figure 3b). The same procedure carried out with a TI of 10.06 s gave a voltammogram free of periodic noise (Figure 3c).
© 1990 American Chemical Society

ANALYTICAL CHEMISTRY, VOl. 62, NO.4, FEBRUARY 15, 1990 • 413
v
\ b
v
~~~o~------",------~~------~------~
time (ms)
Figure 1. (a) Continuous sine wave (60 Hz) recorded 00 a digital oscilloscope. (b) Average of two consecutive recordings 8:; in a with a trigger interval of 10.06 s. Note the 100-fold scale change.
r ~r-------------------------------------~
~c~------~~------~=--------oc~------~
time (ms)
Figure 2. (a) Output from a potentiostat current follower at" constant potential in the absence of Faradaic current. (b) Average of 20 scans with a trigger interval of 3.40 s. (c) Average of 20 scans with a trigger interval of 3.41 s.
The frequency content of linear sweep voltammo"rams as a function of voltage sweep rate is summarized in Table II. To emphasize the effect of power line noise interfer<lllce, the number of60-Hz cycles that appear in a I-V scan are included
r
I
I
0.400 1. 200 E (V Y.L Ag't-/Ag)
Figure 3. (a) Linear sweep voltammogram for the oxidation of 9,10-diphenylanthracene (0.5 mM) in acetonitrile-Bu,NPF, (0.1 M) at a voltage sweep rate of 10 V Is. (b) Average of 20 scans wfth a trigger interval of 10.00 s after treating the data wfth an FFT procedure. (c) As in b with a trigger interval of 10.06 s.
Table II. Frequency Content of Linear Sweep Voltammograms
no. of cycles, 60
sweep rate, V / s Hz/scan freq range,<I Hz
1 240 2-500 10 24 20-5000
100 2.4 200-50000 1000 0.24 2000-500000
filter cutoff,b
Hz
40 400
4000 40000
a The frequency content of the linear sweep voltammogram US~ ing 512 points for a 1 V scan in the FFT procedure. bLow-pass filter cutoff used in the FFT procedure.
as well. The frequency ranges of the voltammetric signals in column 3 are from (liNT) to (1/2T) where N is the number of points (512) in the FFT procedure and T is the time per point. The last column gives the FFT filter cutoff. The FFT filter is effective for voltage sweep rates of 1 V I s or less, and 60-Hz noise is not very significant at 100 V Is or higher sweep rates. The problem area is from about 1 to 50 V I s where the FFT filter cannot eliminate the noise due to significant 60-Hz components in the voltammograms. Under these circumstances, a suitably selected TI eliminates the effect of the power line interference.
Trigger intervals that give 1800 phase shifts for successive scans may be calculated from eqs 1 and 2 where x and yare
ideal trigger interval (60 Hz) = x(I/60) + 1/120 (1)
ideal trigger interval (120 Hz) = y(I/120) + 1/240 (2)

414 Anal. Chem. 1990, 62, 414-416
integers. Equating the right-hand sides of the equations shows that y = 2x + ';" It is obvious that ideal TI for the two frequencies cannot be achieved simultaneously, so it is necessary to compromise. We therefore believe that our empirically based procedure for finding suitable TI cannot be greatly improved upon.
We conclude that the use of precise selected TI for repetitive recording of transient signals is a highly effective method of eliminating periodic noise. The method is especially attractive because of its simplicity and convenience of application.
ACKNOWLEDGMENT We thank Dr. Stephen Bialkowski for helpful discussions.
LITERATURE CITED
(1) Bialk.)wski, S. E. Anal. Chern. 1988, 60, 355A, 403A. (2) Heiftje, G. M.; Anal. Chern. 1972, 44, 69A, 81A. (3) Bialk,)wski, S. E. Rev. Sci. lnstrum. 1987. 58, 687. (4) Niels;~n, M. F.; Hammerich, 0.; Laursen, S. A. Acta Chern. Scand., in
pres~·.
(5) Hayes, J. W.; Glover, O. E.; Smith, D. E.; Overton, M. W. Anal. Chern. 1973, 45. 277.
RECEIVED for review August 7, 1989. Accepted October 23, 1989. Tlte National Science Foundation (CHE-8803480) is thanked for generous support of this work.
Real-Time Monitoring of Iodine in Process Off-Gas bV Inductively Coupled Plasma-Atomic Emission Spectroscopy
Toshihiro Fujii,- Takashi Uehiro, and Yukihiro Nojiri
National Institute for Environmental Studies, Tsukuba, Ibaraki 305, Japan
Yoshihiro Mitsutsuka and Hitoshi Jimba
Department of Chemistry, The Meisei University, Hodokubo, Hino 191, Japan
During nuclear fuel reprocessing and waste immobilization, iodine monitors are required on-line to ensure that discharged iodine is within regulation limits (1). Reliable methods are needed that are capable of measuring iodine-129 in real time at or below the maximum permissible concentration of 0.1 part per million (ppm) (v Iv) in the off-gas (2). A detection capability of 0.1 ppm would make it possible to attest whether more than 99.6% radioiodine Was removed. This would meet the regulation requirement of abatement facilities of the radioiodine in the nuclear fuel reprocessing plants (3). There have been a number of methods for developing such monitors (4).
Fernandez et aJ. (5) developed a technique that includes cryogenic sample collection, chemical form separation, quantitation by gas chromatography (GC), and isotope dilution mass spectrometry (IDMS). This technique employs negative surface ionization. They concluded that (1) less than 1 ng of CH3r can be measured by GC, but iodine molecules must be measured by IDMS and (2) isotopic ratios of 127r/,29r as large as 10-5 can be successfully measured on samples as small as 80 ng of iodine. However, this method is not a real-time on-line analysis.
Some on-line measurement instruments based on laser spectrometry have been tested on a laboratory scale. Baronvavski's group (6) used a He-Ne laser to detect 129r by an extracavity fluorescence configuration. They detected a concentration of 129r in air in the range of 2 X 10⁻⁷ moll dm3
(4.48 ppm, (v/v)) and claimed an 129r detection limit of about 10-10 moll dm3. The main disadvantage of this method is interference from nitrogen oxides (NO,) that are present in the off-gas streams.
rntracavity absorption spectroscopy has been used to detect very weak absorption lines in a number of atomic and molecular species (7). Hohimer and Hargis (8) used a continuous wave (CW) dye laser to detect 127r and 129r at 488 nm by intracavity absorption. They detected iodine in the concentration range 10-9 to 10-5 moll dm3 (22.4 to (2.24 X 10³) ppb (v Iv)). Goles et aJ. (9) used a CW dye laser at 580 nm and detected an 129r concentration of about 10-12 mol/dm3.
* Author to whom correspondence should be addressed.
0003-2700/90/0362-0414$02.50/0
There is no doubt that a gas analyzer based upon electron impact quadrupole mass spectrometry would be very helpful to deternine the amount of specific compounds known to be present in air environments. The first application of r2 detection has been reported by Matsuoka's group (10). Their results indicate a straight calibration curve for r2 peaking at mlz 256 down to a O.l-ppm (v Iv) level of the standard gas sample "ithout noticeable interferences.
As a IMallS of atomizing an analytical sample, inductively coupled .olasma (ICP) has been shown to have a remarkable adaptability for the determination of analyte concentrations with a variety of spectroscopic techniques (11). In recent years rcp has found applications in commercial instruments for atomic emission spectrometry (AES), atomic fluorescence spectrometry (AFS), and mass spectrometry (MS). Particularly the rCP-AES, the earliest of these, has come to be a comparatively mature technique due to the accumulated understanding of its function and behavior. According to this knowled,e, in contrast to most elements, iodine has its most sensitive spectral lines in the vacuum ultraviolet region. TherefOle, spectral lines in the vacuum region were proposed by various authors (12), the first being Kirkbright et al. (13). They purged the monochromator and optical path between the plasna torch and the entrance slit with nitrogen gases and determi"ed a detection limit of 50 ppb for the iodine solution. These c'lllsiderations led to rCP-AES being a candidate method 'or iodine monitoring. The advantage of rCP-AES, in principle, is that it is able not only to determine the total concentntions of both the organic and molecular radioiodines in the 0 :'i-gas stream, but also to offer the potential for a real-time determination.
This lOaper describes a method for monitoring the gas phase of iodine by rcp emission spectroscopy. The technique uses the spectral lines in the vacuum ultraviolet region with the aid of a vacuum spectrometer. The gas sample containing iodine n.olecules is fed directly into the plasma.
EXPERIMENTAL SECTION ICP. The equipment used will be discussed with reference to
the schematic diagram shown Figure 1. The ICP atomic emission spectrometer (14) used was a vacuum instrument equipped with 45 channels for simultaneous detection. The vacuum polychro-
© 1990 Ame'-ican Chemical Society

ANALYTICAL CHEMISTRY, VOL. 62, NO.4, FEBRUARY 15, 1990 • 415
Figure 1. Schematics of experimental set-up: A, diluent air gas cylinder, B, thermal mass flow controUer; C, diffusion tube 0, diffusion ceU; E, water bath; F, T connector; G, ICP plasma; H, optical path extension tube; I, polychromator; J, PMT detector.
mator (I) was Daini Seiko's version of JY 48 PVH (J obin Yvon, Paschen-Runge type). The main body ofthe polychr,)mator was evacuated to approximately 3 X 10⁻³ Torr. The ootical path extension tube (H) between the polychromator le:ls and the plasma discharge (G) extends into the plasma dischruge rood was purged with nitrogen gas at a rate of approximately 14 L/min. The PMT (J) is a photomultiplier (HAMAMATSU R-306) for the 178.28-nm iodine chroonel. The lowest usable wa\elength for this system is limited to about 160 nm. The radio frequency (rf) generator is a product of RF Plasma Products System and is attached with an autopower control unit (APCS-3) and an automatic matching network unit (AMN-PS-1).
Standard Gas. Struodard iodine gases were prepar ,d by using the diffusion cell method (I5). The diffusion cell (D) "ystem was all-glass rood home-built. Three different diffusion tuhes (C) (10. 5.6, and 3 mm i.d.; 10 cm long) were purchased from Hokushin Corp. (Tokyo). The diffusion cell chamber was en~losed in a waterbath (E) (K4R D, MGW Lauda, West Germany) equipped with a heater that was operated by a proportional controller. The diluent air gas (reagent-grade air, Takachiho, Tokyo) ,mtered the diffusion cell chamber via a glass flow line. The who Ie flow line was heated to more than 100°C. The flow through tl:e diffusion cell chamber was controlled and monitored by a thfrmal mass flow control system (B) (Model SEC-421 MKII-SS-500·4IS, STEC Corp., Kyoto, Japan), which was situated between the diffusion cell chamber and the diluent gas supply cylinder (A). The standard gas mixture leaves the cell and croo be deliv'"ed to the ICP plasma for analysis through a T-shaped glass connector (F) while the argon gas flows along by way of the glass connector.
The sample gas concentration was prepared by uling either a different diffusion tube or a different temperature of the water bath containing the diffusion tube. The I, vapor concentration delivered by the diffusion cell was either determined gravimetrically or calculated from the diffusion equation )6). The agreement between the experimental and theoretical diffusion rates of iodine vapor compares favorably with a differmce of less than 10%.
Procedure. The sample gas was directed to the ICP-AES. Iodine determination was carried out in a "profile mode" with the standard addition mode. In the profile mode, a wavelength scanning around the set wavelength could be made oy moving the entrrooce slit slong the Rowlrood circle under competer control (up to ca. 0.85 nm, 0.17 pm/step).
The spectrometer optimization was performed by \ arying the rf power and the carrier Ar gas flow rate at various f,ample gas flow rates.
The vacuum wavelength of 178.28 nm was taken from the most recently published tabulation (I 7) rood was the most analyticallY useful emission line. Presumably, it gives a detection capability 20 times higher than that of the 206. 16-nm line in the ccnventional ultraviolet/visible region.
RESULTS AND DISCUSSION
Optimization Studies. The emission intensity of the plasma is proportional to the introduction rate of a sample (grams per second). Therefore, it is advantageous t,) keep the
10'
10'
SIN
10'
10
n.3 n 4 O_S 0.6
Argon gas flow rate ( Llmin )
Figure 2. Influence of ICP rf power and plasma Ar gas flow rate on the signal to noise ratio (SIN). Data were taken at the sample gas flow rate at 400 mLlmin. The ICP rf power is marked on the curve.
sample gas flow rate as large as possible in order to reduce the volume concentration of I, to be detected. A higher sample gas flow rate would be beneficial for the detection of lower volume concentration samples. Therefore, optimization should be directed to finding the maximum sample gas flow rate, which was limited to 400 mL/min. Beyond this rate the plasma was unstable rood finally was extinguished, even if the Ar flow rate and ICP rf power were varied to achieve good plasma stability.
Figure 2 shows the relationship of the signal to noise (S/N) ratio to the ICP rf power rood Ar carrier gas flow rate. These results were obtained under a constant introduction rate of analyte (I" 12.5 ng/s), which was realized by means of the diffusion cell filled with I,. A 400 mL / min air gas flowed through the diffusion cell in the 41°C water bath. This setup allowed the detection of the sample gas volume concentration as low as 0.17 ppm. This study revealed that the SIN value increased with increasing rf power supplied to the Iep at the optimum Ar gas flow rate. This suggests the use of the highest power available (at present, 2.5 kW). At this level the plasma torch becomes very hot and may start to erode. Therefore, for safety reasons, the Iep was operated at no more throo 2.25 kW of power.
The relationship between SIN ratio, Iep power, and Ar carrier gas flow rate was investigated as a function of air sample gas rates of 50,100,200, and 400 mL/min. As far as the best detection capability at the lowest I, concentration in the air is concerned, good operational conditions should be obtained by comparing the product of the SIN value and the sample gas flow rate. In conclusion, the sample gas rate of 400 mL/min and the plasma Ar gas rate of 0.4 L/min at the 2.25-kW rf power represented optimal conditions and hence were used throughout the experiments.
Response Characteristics. Under the conditions described above, the following response characteristics were determined: the sensitivity, the linearity, and the detection limit (DL, the minimum detectable amount). All quantities

416 • ANALYTICAL CHEMISTRY, VOL. 62, NO.4, FEBRUARY 15, 1990
were examined by using the standard gas of the diffusion cell method, For these measurements, a plot of ICP response during 3-s integration was measured against the iodine concentration. When the signal is expressed in counts, this plot yields a sensitivity, S, of 2.9 X 10⁶ (counts/s)/ppm.
Detection response was linear over the chosen range of 0.16-11 ppm standard gases for iodine.
Three times the standard deviation of the noise measured with the sensitivity gives the DL as 0.19 ppb, which corresponds to 0.014 ng/s at the sample gas rate of 400 mL/min. This value is reasonably consistent with the following consideration. The limits of detection are reported on the order of 50 ppb (17) when the water solution of iodine is supplied to the nebulizer. On the assumption that the nebulizer efficiency to the plasma is 2% with the water sample uptake rate at 1 mL/min, we can calculate the DL for the iodine in case that the whole analyte is introduced for the analysis:
1 mL/min X 59 ng/mL X 0.02 X 1/60 = 0.017 ng/s
This result is in good agreement with that obtained for the DL of iodine in an air sample.
The precision of the method was determined from replicate analyses (five times) of the standard sample gas at a 0.16-ppm concentration of iodine in the air when the standard deviation was 1500 counts and the relative standard deviation was 0.2% using the peak counts.
Concluding Remarks. This study demonstrated that the detection of iodine by ICP-AES in a vacuum ultraviolet region meets the requirements for a real-time and sensitive monitor. The real-time determination can be realized by a plot of the integration of responses during short, i.e, seconds, periods. Scaling estimates indicate that a concentration level of 0,19 ppb (v Iv) in air may be achieved. This method also offers the potential for rapid determination of total iodine in the mixture sample containing the various iodine compounds.
It should be noted that further study is needed to investigate the possible source of interference of iodine determination among air components and other off-gas components and to examine the reproducibility of signals over long periods of time.
A final note is that for actual interfacing, an ICP-AES apparatus with a high-volume sampling pump, capable of sampling directly from the fuel reprocessing plants, should be incorporated into a mobile laboratory.
ACKNOWLEDGMENT We are grateful to S. Matsuoka, H. Kishi, and H. Kawano
for helpful discussion and to Phillip R. Sandfur and M. L. Messersmith at Yokota Air Base for the manuscript preparation.
Registry No. Iodine, 7553-56-2.
LITERATURE CITED (1) United States Regulations 40 CFR 190, 1977. (2) Hebel, W., Cottone, G., Eds. Management Modes for lodine-129;
Harwcod Academic Publishers: New York, 1982. (3) Kawano, H.; Matsuoka, S.; Fujii, T.; Tsuchiya, M.; Fumoto, H.; Kishi, H.
Mass Spectrose. 1986, 34, 249. (4) Molina, R. Monitoring of Radioactive Effluents from Nuclear Facilities;
Procet3dings of the Ir:ternational Symposium on the Monitoring of Radioactive Airborne and Liquid Releases from Nuclear Facilities, Portoroz, Yugoslavia, Sept 1977; International Atomic Energy Agency: Vienna, 1978; p 181.
(5) Fernandez, S. J.; Rankin, R. A.; McManus, G. J.; Nielson, R. A. Proc. 18th [lOA Air Cleaning ConI. 1985,2, 1318.
(6) Baranavski, A. P.; McDonald, J. R. NRL Memo. Rep. 1977, No. 3514. (7) Peterson, N. C.; Kurylo, M. J.; Braun, W.; Bass, A. M.; Keller, R. A. J.
Opt. Soc. Am. 1971, 746,61. (8) Hohimer, J. P.; Hargis, P. J., Jr. Ana/. Chern. 1979, 51,930. (9) Goles, R. W.; Fukuda, R. C.; Cole, M. W.; Brauer, F. P. Anal. Chem.
1981,53,776. (10) Matsuoka, S.; Ito, Y. Iodine Analysis; Tokyo University Nuclear Engi
neerin;! Research Laboratory Report (Japanese), UTNL-R-0174/43, 1984.
(11) Fasse, V. A.; Kniseley, R. N. Anal. Chern. 1974, 46, 1110A. (12) Wallace, G. F. At. Spec/rose. 1980, 1,38. (13) Kirkbright, G. F.; Ward, A. F.; West, T. S. Anal. Chirn. Acta 1972, 62,
241. (14) Uehirc, T.; Morita, M.; Fuwa, K. Anal. Chern. 1984. 56, 2020. (15) Miguel, A. H.; Natusch, D. F. S. Anal. Chern. 1975, 47,1705. (16) Altsull,,,, A. P.; Cohen, I. R. Anal. Chern. 1960, 32, 802. (17) Nygaard, D. D.; Leighty, D. A. Appl. Spec/rose. 1985, 39, 9968.
RECEIVED for review June 5, 1989. Revised manuscript received November 15, 1989, Accepted November 20, 1989, This work was supported in part by a Grant-in-Aid for Scientific Re,earch (No. 60880026) from the Education Ministry in Japan.

..... e'n put all th ~ t ~ ~:-lflCtS in the chemical sciences right in yom hands~~~ And you won't need to Hft a finger!
AMERICAN CHEMICAL SOCIETY STANDING
ORDER PLANS
AS EASY AS 1-2-3
1.
2.
3.
The ACS has a simple way to ensure that your library always has the chemistry titles your patrons require. It's called the ACS Standing Order Plans.
With ACS Standing Order Plans, you can save the time you'd otherwise spend on literature searches and purchase order details. and make certain that your library has the titles your patrons want--when they need them.
You can select h'om three Standing Order Plans-choose one or all or a combination .. , whatever best suits your patrons' needs!
By Series: Advances in Chemistry Series ACS Symposium Series ACS Monographs Professional Reference Books All ACS Series
By Single Title: ACS Abstract Books ACS DirectcllY of Graduate Research College Chemistry Faculties
By Subject: Analytical· Agricultural! Agrochemical o Biological. Biotechnology. Carbohydrate. Cellulose/Paper/Textile· Colloid/Surface· Computers in Chemistry· Electronic Materials· Environmental!Chemical Health and Safety· Foml/Flavor. Energy/Fue\;Petroleum/Gcochemistry. Industrial! Chemical Engineering- Inorganic o Materials Science· Medicinal/Pharmaceutical· Nuclear·Organic· Polymer/Applied Polymer Science. Physical Chemistry
PLUS FIVE NEW SIjBJECT AREAS .. , Chemical Information. Directories • History. Non-Technical.Toxicology!
You tell us which Standing Order Plan (or Plans) you'd like-I, 2, 3, or a combination. Your one-time order assures prompt, automatic delivery of each new title in the plan or plans you've chosen as soon as it's published. We'll send you an invoice with your shipment. You'll have thirty days to examine each new book and (if you decide for any reason) to return it for full credit. And you may modify or cancel your Standing Order Plan at any time, It's that easy!
Make sure your chemistry resources are always complete-don't overlook a single hook from the world's most respected publisher in the chemistry fielcl. Enroll in ACS Standing Order Plans today.
Write to American Chemical Society, 1155 Sixteenth Street, N.W., Washington, DC, 20036. Or call us TOLL FREE (800) 227-5558.

GET TO THE POINT! c __ ~r-----------~
di
'" ()
With MAX - the Multi-Method System for High Precision Surface Analysis When several different surface analysis methods are required to so lve a problem, MAX holds the key to success. All excitati on
,-------.-------------------, sources point to the same spot on the sample.
Visi t us at Booth 11 28, Level 1 PITTSB URGH CONFERENCE Javits Conven ti on Center, N.Y.C . March 5-8, 1990
As an analysis proceeds step by step, one technique after another is appl ied, in the same system, wi thout moving either sample or source. • X-ray Photoelectron Spectroscopy (XPS) • Scanning Auger Electron Spectroscopy (SAM) • Ion Scattering Spectroscopy (ISS) • Secondary Ion Mass Spectrometry (SIMS) • Sputtered Neutral Mass Spectrometry (SN MS)
To find out how MAX can help you to "Get to the point" , contact us al (412) 327-5700 .
• LEYBOLD VACUUM PRODUCTS tNC. LAS GROUP 5700 Mellon Road, Export, PA 15632
• LEYBOLD AG Bonner Strasse 498, 0-5000 Cologne 51, West Germany
~ lEYBOLD
I nn o vative Vac uum Te c hn o log y A O'gus," Company
CIRCLE 75 ON READER SERVICE CARD