Will climate policy leave our energy investments stranded?
124
How our environment and our societies will change The world we live in is changing, and so are our societies. Some transformations we can observe and experience every day. Others, such as the aging of our societies and global warming, might appear far removed from our everyday life. Yet these developments will have profound consequences for us. This book assembles research, forecasts and ideas from scientists around the world. They look into the future and explain what climate change and demographic trends will mean for us. They also suggest what govern- ments, societies, companies and we as individuals can do to manage change and turn it to our advantage. Among the authors: Eileen Claussen, Founder and former President of the US climate think-tank C2ES Elsa Fornero, Demographics Professor in Turin and former Italian Labor Minister Ian Goldin, Director of the interdisciplinary Oxford Martin School K.S. James, Head of the Population Research Centre in Bangalore N. Kavitha, Senior Research Officer at the Population Research Centre in Bangalore David Keith, Professor for Applied Physics at Harvard University and inventor Andreas Knie, Professor of Sociology in Berlin and Research Fellow at WZB Julia Marton-Lefèvre, Director-General of the world’s largest conservation charity IUCN Pan Jiahua, Professor at CASS in Beijing and China’s Green Person of the Year Andy Parker, Research Fellow on geoengineering in Potsdam Christian Scherf, Researcher at the InnoZ innovation think-tank Ursula M. Staudinger, Founding Director of the Robert N. Butler Columbia Aging Center Robert N. Stavins, Director of the Harvard Environmental Economics Program Frank Wolter, Senior Project Manager at InnoZ
Transcript of Will climate policy leave our energy investments stranded?

How our environment and our societies will change
The world we live in is changing, and so are our societies. Some transformations we can observe and experience every day. Others, such as the aging of our societies and global warming, might appear far removed from our everyday life. Yet these developments will have profound consequences for us. This book assembles research, forecasts and ideas from scientists around the world. They look into the future and explain what climate change and demographic trends will mean for us. They also suggest what govern-ments, societies, companies and we as individuals can do to manage change and turn it to our advantage.
Among the authors:Eileen Claussen, Founder and former President of the US climate think-tank C2ES
Elsa Fornero, Demographics Professor in Turin and former Italian Labor Minister
Ian Goldin, Director of the interdisciplinary Oxford Martin School
K.S. James, Head of the Population Research Centre in Bangalore
N. Kavitha, Senior Research Officer at the Population Research Centre in Bangalore
David Keith, Professor for Applied Physics at Harvard University and inventor
Andreas Knie, Professor of Sociology in Berlin and Research Fellow at WZB
Julia Marton-Lefèvre, Director-General of the world’s largest conservation charity IUCN
Pan Jiahua, Professor at CASS in Beijing and China’s Green Person of the Year
Andy Parker, Research Fellow on geoengineering in Potsdam
Christian Scherf, Researcher at the InnoZ innovation think-tank
Ursula M. Staudinger, Founding Director of the Robert N. Butler Columbia Aging Center
Robert N. Stavins, Director of the Harvard Environmental Economics Program
Frank Wolter, Senior Project Manager at InnoZ

Our world and us
How our environment and our societies will change

B – And us130 Introduction Part B How our societies are
changing
136 Chapter 7 The future of aging: How will I live? by Ursula M. Staudinger
150 Box 6 How we lived 125 years ago
154 Chapter 8 European pensions and social security: Can there be a happy ending? by Elsa Fornero
172 Box 7 The future of the family
176 Chapter 9 How will my world change? by Andreas Knie, Christian Scherf and Frank Wolter
188 Box 8 How we produce things in 2050
192 Chapter 10 World on the move: The future of migration by Ian Goldin
209 Box 9 Education 2.0
214 Chapter 11 View from a fast-growing nation: What demographic change means for India by K.S. James and N. Kavitha
228 Chapter 12 How will the private sector deal with demographic change? by Michaela Grimm
243 Imprint
244 Photo credits
245 Index of figures
TABle Of COnTenTACknOwledgmenTs
A – Our world16 Introduction Part A How our world is
changing
20 Chapter 1 From the science to the economics and politics of climate change: An introduction by Robert N. Stavins
37 Box 1 International climate talks: A short history of a long process
40 Chapter 2 Nature – Our life insurance by Julia Marton-Lefèvre
52 Box 2 How we saw our environment 125 years ago
56 Chapter 3 The future of climate policy: The role of governments, cities, companies … and me by Eileen Claussen
72 Box 3 Can climate protection boost growth and jobs?
76 Chapter 4 Will solar geoengineering help us manage the risks of climate change? by David Keith and Andy Parker
93 Box 4 Will climate policy leave our energy investments stranded?
96 Chapter 5 How China could lead in the fight against climate change by Pan Jiahua
111 Box 5 And now the weather forecast for Germany ... in 2040
114 Chapter 6 The business of climate change: A view back from 2050 by Julia McNally, Simone Ruiz-Vergote and Verena Treber
4 foreword Why we are publishing this book by Michael Heise
6 Introduction What this book is about by Katinka Barysch
I would like to thank the authors of this book for their insightful and timely contributions as well as their patience with my editing of their work. Any mistakes are my responsibility. Many thanks to my colleagues at Allianz who have helped in the planning and execution of this project, to Christine Madden for her speedy and thorough proof reading and to the team at opus 5 for their imaginative layout.
Katinka Barysch, Editor

and our societies are changing. We have therefore created a platform for these views and ideas, without necessarily endorsing them.
Over the last 125 years, Allianz has developed knowledge and ideas for risk solutions, together with our customers as well as scientists, non- govern-mental organizations and other stakeholders.
Our business is, by its very nature, oriented towards the future. We look beyond the short term and focus on the analysis, mitigation and management of future risks and challenges.
Our business is also global. Allianz is closely connected with the people and cultures of over 70 countries – countries that are home to our customers and employees. Since 1890, a multi-faceted community of trust has grown out of this.
Our business is responsible and caring. We aim to promote the sustainable use of resources and smart solutions to social change. The experience, know-how, motivation and passion of Allianz’s 148,000 employees are our most valuable asset in achieving this.
Michael Heise is Chief Economist of Allianz SE, where he advises the board on economic and strategic issues and is responsible for economic analysis and forecasts as wells as financial markets and risk analyis. He is also Honorary Professor at the Johann Wolfgang Goethe University. Before joining Allianz Group, Prof Heise was Secretary General of the German Council of Economic Experts, Chief Economist of DG Bank and Chief Economist and Head of Research at DZ Bank.
Michael Heise
To protect our future, we must find ways to guard our social and environ-mental resources, to keep them safe for future generations. Climate change is threa tening our planet, while demographic and technolo gical develop-ments are affecting the way we live. We will have to mobilize our knowledge, creativity and ideas to find solutions for the challenges ahead.
Faced with often worrisome projections about what may happen to our environment and our societies, many people appear resigned. Hopeless ness is not a good place from which to start searching for solutions. This book seeks to make a constructive contribution to the global debates about climate change and demographics. The authors – internationally renowned scientists as well as some of Allianz’s own experts – show clearly where the challenges lie, but they also look for new angles, creative solutions and future opportunities.
We broadly know how our world is changing. It is up to us to anticipate and manage those changes.
We at Allianz want to use the 125th anniversary of our company to draw together a variety of perspectives, from different countries and scientific disciplines, to help broaden and enliven the debates about how our world
Why we are publishing this bookby Michael Heise
fOrewOrd
4 5

The world we live in is changing, and so are our societies. Some transfor-mations we can observe and experience every day: the technologies we use, the way we work, our more diverse neighbourhoods, for example. Then there are broader, more long-term trends. Global warming and the aging of our societies might appear far removed from our everyday life. Yet these trends may well have the most profound impact on our way of life in coming decades.
We do not yet fully understand how our environment and our societies are changing. But we have a pretty clear picture of what that change will bring. We know how much carbon is in the atmosphere – and how much more will be added in coming years unless we mend our ways. We understand roughly what impact climate change will have on our planet. We know how our societies are changing because many of the people who will populate this planet in 50 years’ time are alive today, and because demographics tend to move very gradually.
If unaddressed, climate and demographic change could have serious consequences for our well-being and economic security. Faced with
What this book is aboutby Katinka Barysch
InTrOduCTIOn
Global warming and the aging of our societies might appear far removed from our everyday life
7

The latest reports from the Intergovernmental Panel on Climate Change tell us that the world is already 0.8 degrees C warmer than it was in the second half of the 19th century (introduction to part A). What happens after this depends on us. If we manage to eliminate carbon emissions from our economies, global warming could be contained in the long run. If we continue on our current path, temperatures may rise by much more than scientists consider bearable for the planet.
All the experts writing in this book agree that it is up to us to change our economies, the way we produce electricity, travel both short and long distances and construct our cities.
They differ, however, in their optimism about humankind’s ability to make the necessary changes. They also offer different prescriptions and solutions. Robert Stavins, a climate professor at Harvard University, hopes for a rapprochement between the US and China – together these coun-tries account for over 40 per cent of global CO2 emissions – as the basis for an international climate deal (chapter 1). Eileen Claussen, who used to run a think tank and worked for the US government on envi ronmental issues, has more faith in new technologies – not only with regard to renewable energy but also, for example, the capture and storage of carbon (chapter 3).
Pan Jiahua, one of China’s most prominent climate experts, argues that nothing less than a new paradigm – an ecological civilization – can save the planet (chapter 5). Encouragingly, he sees signs of positive change in his home country – for example the government’s strict environmental targets or the fact that in 2013, China expanded its renewable energy capacity more than its traditional power plants.
Julia Marton-Lefèvre, who runs the world’s biggest conservation charity IUCN, explains how nature can protect us from the impact of climate change (chapter 2). Coral reefs, for example, dampen the force of in coming waves – a welcome protection at a time when hurricanes and typhoons are becoming more frequent.
David Keith, an inventor and professor at Harvard, and Andy Parker, a research associate in Potsdam, would agree with many of these pre-scriptions. They point out, however, that even if we stopped burning carbon tomorrow, the world would continue to get warmer for decades or longer. They therefore advocate that we think seriously about how
It is up to us to change our economies, the way we produce electricity, travel and construct our cities
alarming predictions about melting icecaps, rising sea levels and looming natural disasters, we might be forgiven for tuning out and resigning our-selves to an uncertain future. Visions of aging societies overwhelming our social security systems or migrants streaming across our borders could have a similarly numbing effect. The authors of this book, however, argue that it is up to us to shape our future.
don’t close your eyesFor this to happen, we need a change in mind-sets. Such a change will be uncomfortable but not impossible. Today, neither governments, nor business, nor we as individuals are fully prepared for what lies ahead. In these pages, we read about politicians who use climate change for their own political agendas, societies that struggle to understand the value of education, baby boomers who cling to the belief that they are owed an early, generous pension, activists who reject new technologies out of hand and companies that are ill-prepared for the upcoming revolu-tion in their workforces.
We won’t tackle the world’s challenges if we feel resigned, frightened or powerless. To broaden and enliven the debates on climate change and demographics, we have asked a number of famous scientists as well as some of Allianz’s own experts to approach these issues from various different angles. Their analyses are clear, often sobering, and some times surprising. More importantly, they all come armed with ideas and solu-tions for anticipating, managing – even finding opportunities in – the changes that lie ahead.
The views assembled here are multi-faceted, interesting and thought-provoking. They are not intended to present a comprehensive picture of our future and are not always fully compatible with one another. With this book, Allianz has instead created a platform for the exchange of research results, views and ideas. This doesn’t mean that we necessarily endorse all the points and projections made within these pages.
Part A: what we can (and must) do about climate changeAll authors who write in part A on environmental change agree on one thing: climate change is happening, and the main reason is that humanity has constructed an economic system, a way of life, that is powered by the burning of oil, gas and coal.
Nei ther governments, nor business, nor we as individuals are fully prepared for what lies ahead
Climate change is happening, and the main reason is an economic system powered by the burning of oil, gas and coal
8 9

A combination of alarming weather events, strident political leadership, technological innovation and changing consumer and business mind-sets could create the momentum necessary for preventing catastrophic climate change. The experts in this book explain what must be done and how. It is up to us to make it happen.
Part B: demography is destiny – or is it?A similarly constructive spirit informs the contributions to part B, which deals with the changes in our societies and our immediate environment.
The broad trends are very clear: all over the world, people are living longer and are having fewer children. Therefore, societies everywhere are aging, in many places they are stagnating and in some, even shrink-ing. There are great differences between the demographics of various countries and regions, and these will shift the tectonic plates of the world economy and geopolitics. By 2030, for example, India will be more pop-ulous than China, and by 2050 Nigerians will outnumber US residents. At the same time, Europe’s population will be declining not only in rela-tive but also in absolute terms (introduction to part B).
Several authors in part B deal with the consequences of aging. Ursula Staudinger, an internationally acknowledged aging researcher, rejects the idea that an aging society will be full of decrepit and lonely octoge-narians. She presents evidence that an active lifestyle and positive attitude can help us live longer, healthier and happier (chapter 7).
Elsa Fornero – a professor in Turin who, while serving as Italy’s Labor Minister, reformed the country’s pension system – conjures up a vision of how European countries can successfully deal with the social policy challenges created by demographic change (chapter 8). She pleads for a new solidarity between generations, as Europe’s younger people often struggle to attain the same level of security and comfort as their parents. New forms of solidarity as well as new policies will also be needed to deal with increasingly diverse family structures (box 7).
Michaela Grimm, a demographics expert at Allianz, worries about the consequences that aging and other trends will have on the competitive-ness of countries and individual companies. She lists measures that busi-nesses will have to implement if they want to attract increasingly scarce younger employees while helping their older ones to stay productive for longer (chapter 12).
All over the world, people are living longer and are having fewer children
New solidarity between generations is needed
technology, in particular solar geoengineering, could help us to deal with the inevitable consequences of global warming (chapter 4).
Several authors highlight the role that we as individuals will have to play in safeguarding our future (chapters 3 and 6). We are free to make our own choices and change our habits – as well as let politicians and business leaders know that we expect them to take climate change seriously.
Cost and consequencesNevertheless, we (as individuals as well as societies) often shy away from action because we fear that the cost could be exorbitant. For some sec-tors, such as conventional oil and power companies, that may actually be the case (box 4). On the whole, however, the necessary investment in new energy and transport infrastructure, greener cities, better land use or insulated buildings could become a huge economic opportunity (box 3).
For private businesses, climate change will be a challenge as well as an opportunity, as Julia McNally, Simone Ruiz-Vergote and Verena Treber, Allianz experts in sustainability, point out (chapter 6). Changing weather patterns will affect supply chains and investment locations. The huge outlay needed for sustainable infrastructure and housing, especially in emerging markets, represents an opportunity for investors. Companies prepared for stricter climate policies will stay ahead, as will those that detect groundbreaking trends not only in the US and Europe but also Africa, Asia and elsewhere.
The authors in part A agree that, if we fail to take climate change seriously, the consequences are likely to be exorbitant, highly unsettling and largely irreversible. Many regions of the world are already experiencing more frequent flooding, storms and droughts. These extreme weather events will gain in frequency and force as the climate continues to warm (chapters 2 and 6; box 5). Animal and plant species are disappearing at unprecedented rates, with ecosystems suffering irreparable damage (chapter 2). People will be forced to flee from areas affected by climate change, adding to the 50 million refugees that the countries of the world had to accommodate in 2014 (chapter 10). Policy makers and businesses have already begun to shift their focus from preventing climate change to dealing with its inevitable consequences (chapters 3 and 6; box 1).
The investments necessary for tackling climate change could become a huge eco- nomic opportunity
A combination of alarming weather events, strident political leadership, techno-logical innovation and changing mind-sets could create the necessary momentum
1110

continually (chapters 7 and 12). More independent schools, universally available online courses and a focus on applicable skills will be the hall-marks of education systems around the world in 20 years’ time (box 9).
Urbanization is another trend weaving its way throughout this book. By 2050, there could be as many people living in cities as are alive all over the world today. Most of the new megacities will be in Asian and other emerging nations. Since city people are better connected and more likely to emigrate, urbanization and globalization reinforce each other (chapter 10). On the one hand, urbanization drives up energy demand (chapter 5) but, on the other, cities are more compact and efficient than dispersed towns and villages (chapter 6). The world’s metropolises will become great laboratories for innovation – both technical and social (chapters 6 and 7).
looking back, looking forwardNevertheless, despite all these predictions, we can never really know what the future will bring. A view back to the year 1890, when Allianz was founded, illustrates how much our world has changed in just 125 years. Back then, Europe and the US were witnessing the early beginnings of environmental movements: nature was no longer seen as an all- power-ful goddess but something that needs our protection (box 2). Societies have also changed profoundly over the last century and a quarter, as have attitudes towards work and the family (box 6).
This book does not pretend to illustrate the next 125 years – too much speculation would be involved. Instead, we hope it makes an insightful and encouraging contribution to the debate about how we can shape our future in coming decades.
Katinka Barysch is Director of Political Relations at Allianz SE, where she works in the research and public policy teams. Previously, Ms Barysch was Chief Economist and Deputy Director at the Centre for European Reform (CER), a London-based think-tank. She has also worked as an analyst and editor for The Economist Intelligence Unit and as an advisor to several European governments, the European Commission, the British House of Lords and various multinational companies and financial institutions.
Views from fast growing nationsThe issue of aging is by no means a priority for all countries. K.S. James and N. Kavitha, who conduct research into demographics and health in Bangalore, take us on a journey to India. Here, people until recently considered rapid population growth and an abundance of young people as their country’s greatest challenge. Now that the number of Indians is growing more steadily, new opportunities beckon. Whereas China’s working-age population is shrinking, India’s will continue growing for some time. India, however, will only fulfil its economic potential if it tackles its poverty, skill shortages and rigid family structures (chapter 11).
Ian Goldin, who runs an interdisciplinary research center at Oxford Uni versity, also considers developments in fast-growing nations and directs our attention to the issue of international migration (chapter 10). In 2014, 230 million people were living outside their home country. This number is set to grow further, spurred by globalization, huge income differences between countries and uneven demographic developments. Migration can gen erate concern in wealthier countries. But it is, first and foremost, an opportunity – not only for the people from poorer countries looking for a better life, but also for economies grappling with aging and shrinking workforces.
Technology, education and urbanizationTechnology as well as demographic trends will be changing the way we live. The two will interact in novel ways. Technology, for example, will help us remain active and productive until late in life (chapters 7 and 12). It will also change the way we organize and run our lives, as Andreas Knie, Christian Scherf and Frank Wolter at the innovation think-tank InnoZ in Berlin explain (chapter 9). The family car parked in the garage will be replaced by flexible public transport and car-pooling options (see also
chapter 6). Internet-based platforms will allow us to book concert tickets, organize transport and find like-minded music fans with just one click. The way we produce things will also be transformed: production lines will run themselves, products will act to avoid being damaged and spare parts will be printed on demand (box 8). Such innovations are likely to leave our economies more connected, efficient and sustainable.
Several authors highlight the importance of learning and education for shaping our future. Reformed pension and social security systems will only work if people are financially literate (chapter 8). Careers soon to span five decades or more will require us to update our knowledge and skills
Migration is first and foremost an opportunity
Technology will change the way organize and run our lives
12 13

A
Our worldHow can we anticipate and manage change in our environment?

The science of climate changeThe Intergovernmental Panel on Climate Change (IPCC) is the world’s leading authority on climate change. It operates under the aus-pices of the UN and works with the support of renowned scientists from around the world. Since its inception in 1988, the IPCC has pub-lished five sets of “assessment reports”, the most recent ones (referred to as AR5) in 2013 and 2014. The new reports represent the most detailed assessment of climate change and its impacts to date. Over 830 scientists in fields such as physics, meteorology, engineering and economics have worked on these reports.
what we know about man-made climate changeThe overwhelming majority of scientists agree that the accumulation of greenhouse gases in the atmosphere are causing an increase in the global mean temperature; this is to say, on average, that the world is getting warmer – more in some places, less in others. The world is already 0.78 degrees C warmer than it was in the second half of the 19th century – even though scientists think that most of the warm-ing caused by additional CO2 took place in the world’s oceans, not in the atmosphere.
Among the greenhouse gases, carbon diox ide (CO2) is the most important driver of climate change. In the relatively short period since indus trialization began, the concentration of CO2 in the atmosphere has increased by 40 per cent. It now exceeds the highest con-cen trations recorded in ice cores during the past 800,000 years. Scientists agree that this increase is the result of human activity – essentially, the burning of oil, gas and coal.
In the new reports, scientists project what would happen to global mean temperatures in the period leading up to year 2100 depending on how much CO2 we burn in the future (see figures
A.1 and A.2). Climate experts refer to this as “emission pathways”.
scenarios for CO2 emissions and rises in temperature
scenario IThe world economy becomes carbon neutral around 2080 as the result of very stringent climate policies and widespread use of green technologies, including carbon capture and storage. Climate change remains limited.
How our world is changingby Freia Then
InTrOduCTIOn PArT A
830scientists were involved in writing the latest IPCC climate reports
$1 trillionthe approximate amount invested in renewable energy between 2010 and 2013
1,000hunter antelopes are left in Africa, 80 per cent less than in the 1970s
78 %of greenhouse gas emissions were caused by the burning of oil, gas and coal in the last 40 years
$70–100 billionwe will have to spend every year until 2050 to cope with the consequences of climate change
2/3of the world’s biggest cities are in low-lying coastal areas
43 % rise in global water demand until 2030
17

scenario I scenario II scenario III scenario IV
will also represent a massive challenge for farming and food production.
Climate change will occur in unpredictable and often self-reinforcing ways. For example, if the world continues to get warmer, the thawing of the permafrost in Siberia could release huge amounts of methane (a greenhouse gas), which in turn would make climate change even worse. The repercussions would be profound, global and largely irreversible in the longer run. The disintegration of the Greenland ice sheet could lead to a sea-level rise of up to 7 meters. A weakening of the Gulf Stream (a warm Atlantic ocean current) or a shift in Asia’s Monsoon rain season could result in changing seasons and agricultural productivity.
In the world’s oceans, CO2 from the atmos-phere leads to increasing acidity, which is the cause of the widely observed coral bleaching. Also, if the ocean’s surface becomes warmer, the water will contain less oxygen. With less
oxygen in the water, it is increasingly difficult for fish to survive. Already today, there are dead zones in the oceans without animal life.
Climate change indirectly threatens the lives of people, especially in developing countries. Droughts, floods and storms will create food shortages because of crop shortfall as well as health problems for the affected populations.
Freia Then, Allianz Climate Solutions & Freie Universität Berlin
figure A.2 rises in temperature
In degrees C
Sources: For temperature scenarios: IPCC, “Annex I: Atlas of Global and Regional Climate Projections – Supplementary Material”, in: Climate Change 2013: The Physical Science Basis, Contribution of Working Group I to the Fifth Assessment Report of the Inter governmental Panel on Climate Change. Cambridge University Press pp. 1311–1394, 2013. For emissions scenarios: M. Meinshausen, S. Smith, et al., “The RCP Greenhouse Gas Concentrations and their extension from 1765 to 2500”, Climatic Change (Special Issue on RCPs), 2011.
4
3
2
1
0
−1
−2
1980
s
1970
s
1960
s
1950
s
1940
s
1930
s
1920
s
1910
s
1900
s
1890
s
1880
s
1870
s
1860
s
1990
s
2000
s
2010
s
2020
s
2030
s
2040
s
2050
s
2060
s
2070
s
2080
s
2090
s
scenario IICountries gradually adopt green technologies. Through pricing of land use emission, the for-est area extends throughout the rest of the century. Emissions rise until mid-century.
scenario IIIGovernments and business are slow to roll out green technologies. A high share of energy production comes from coal, oil and gas with-out carbon capture and storage. Emissions more than double in the 21st century.
scenario IVThe world’s population grows to more than 11 billion. GDP in developing countries remains low. The adoption of green technologies is very slow. Energy production quadruples. Emissions triple by 2100.
How will climate change affect our lives? Scientists agree that the effect of global warming will slowly change the world in which
we live. Sea levels will rise and glaciers and ice sheets will melt. Patterns of rainfall and storms will change, which will cause floods, droughts and other extreme weather events.
Some areas of the world will be more severely affected than others. Among those most at risk are people living in coastal areas, including c ities such as New York and Venice; river deltas, such as those in Bangladesh and in the Netherlands; and areas where water is scarce, such as the Middle East. Even regions less at risk, such as northern Europe, will suffer if temperatures change rapidly.
Moreover, in an interconnected world, events in one part of the world have knock-on effects in others. For example, a major flood, like the one in Thailand in 2011, can disrupt global sup-ply chains, which in turn can lead to production bottlenecks and drive up prices for clothes, computers, cars and other consumer goods worldwide. Big changes in weather patterns
figure A.1 CO2 emission
In gigatons
scenario I scenario II scenario III scenario IV
100
80
60
40
20
0
−20
1980
s
1970
s
1960
s
1950
s
1940
s
1930
s
1920
s
1910
s
1900
s
1890
s
1880
s
1870
s
1860
s
1990
s
2000
s
2010
s
2020
s
2030
s
2040
s
2050
s
2060
s
2070
s
2080
s
2090
s
18 19

The science on climate change is pretty clear: if we stay on the current path and continue burning oil, coal and gas at present rates, the earth will eventually warm to what could be a catastrophic degree. Although many politicians and scientists largely agree on what would constitute a “safe” path towards mitigating climate change, there are economic conse-quences of such action. These consequences would be expensive, but they would not be unwarranted – given the alternatives.
However, the fiendishly complicated politics of climate change have held back progress, in particular the once strict distinction between developed countries – which committed to cutting CO2 – and developing ones – which did not. Now that this distinction is blurring, the chances of moving towards a meaningful global agreement are rising.
Most important is that the world’s biggest emitters take action, most notably the US and China. While domestic politics in the US remains intractable and China prioritizes growth, I can find six areas of conver-gence between the two nations that might give cause for cautious optimism.
If we stay on the current path, the earth will eventually warm to what could be a catastrophic degree
From the science to the economics and politics of climate change: An introductionby Robert N. Stavins
CHAPTer 1
2015
2050?
The population of polar bears is decreasing, according to the IuCn red list of Threatened species
21
a year from now through 2100. The numbers are accurately reported, but potentially misleading. A small difference in the interest rate on your savings account can make a big difference in your bank balance after a couple of decades. Likewise, a very small difference in the average growth rate is very significant when it occurs over a 100-year period, which is the case here. The widely reported 0.06 per cent difference in annual growth amounts to an estimated 5 per cent loss of global consumption.
Furthermore, this cost estimate is based on a scenario with “optimal con-ditions”. The assumption is that all countries immediately reduce their emissions to the necessary degree in a cost-effective manner. They could do so in reaction to a single global carbon price and with the help of vari-ous new technologies. These optimal conditions are highly unlikely to be met. For example, if technologies for capturing the carbon emitted from
A very small difference in the average growth rate is very significant when it occurs over a 100-year period
The science of climate changeThe ever growing concentrations of greenhouse gases in our atmos-phere, caused by the burning of fossil fuels, appear likely to change our earth’s climate in ways that many will come to regret. As reports from the Intergovernmental Panel on Climate Change (IPCC, see introduction to
part A) make clear, decades of political inaction have now left us with little choice but to make intensive efforts over coming decades to avoid the worst consequences of global climate change.
Scientists predict that severe consequences are most likely to occur when global average temperatures increase by more than 2 degrees C. Such a degree of warming would be caused by concentrations of green-house gases of about 450 parts per million (ppm) in CO2-equivalent (CO2eq) terms. But we are now on a path to more than double green-house concentrations, to about 1,000 ppm CO2eq by the end of this century. This would result in average global temperature increases of 3 to 8 degrees C relative to pre-industrial levels.
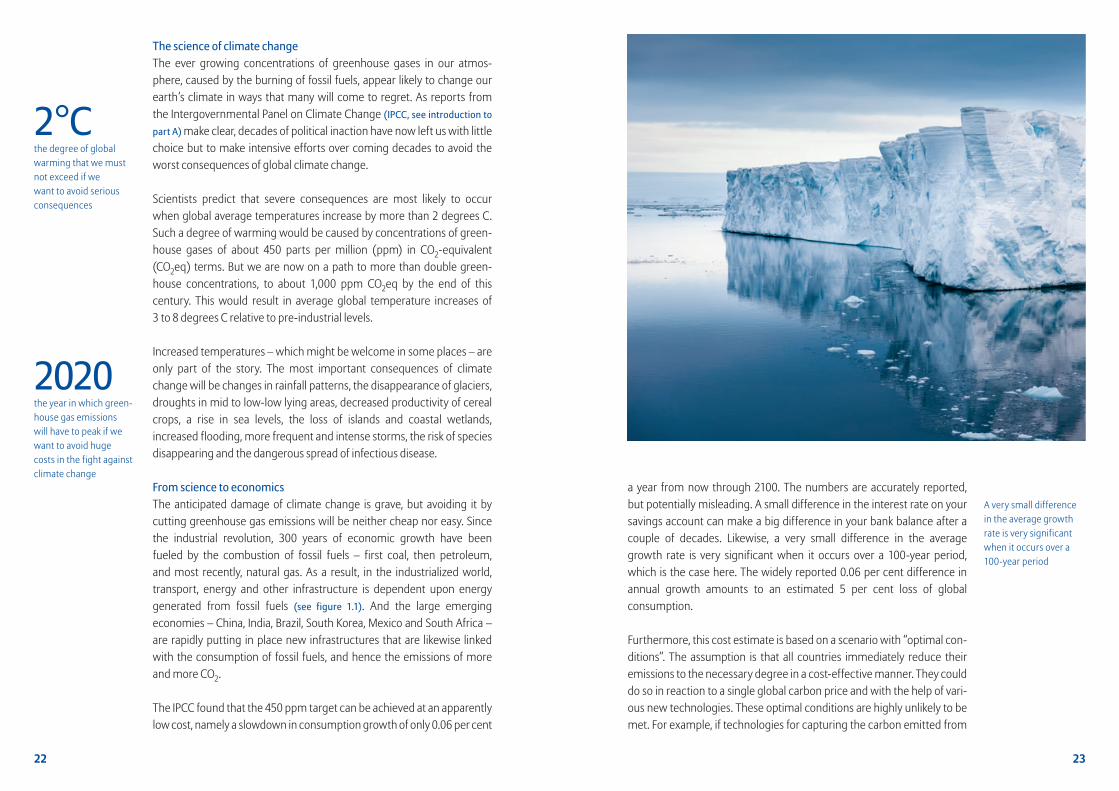
Increased temperatures – which might be welcome in some places – are only part of the story. The most important consequences of climate change will be changes in rainfall patterns, the disappearance of glaciers, droughts in mid to low-low lying areas, decreased productivity of cereal crops, a rise in sea levels, the loss of islands and coastal wetlands, increased flooding, more frequent and intense storms, the risk of species disappearing and the dangerous spread of infectious disease.
from science to economicsThe anticipated damage of climate change is grave, but avoiding it by cutting greenhouse gas emissions will be neither cheap nor easy. Since the industrial revolution, 300 years of economic growth have been fueled by the combustion of fossil fuels – first coal, then petroleum, and most recently, natural gas. As a result, in the industrialized world, transport, energy and other infrastructure is dependent upon energy generated from fossil fuels (see figure 1.1). And the large emerging economies – China, India, Brazil, South Korea, Mexico and South Africa – are rapidly putting in place new infrastructures that are likewise linked with the consumption of fossil fuels, and hence the emissions of more and more CO2.
The IPCC found that the 450 ppm target can be achieved at an a pparently low cost, namely a slowdown in consumption growth of only 0.06 per cent
2°Cthe degree of global warming that we must not exceed if we want to avoid serious consequences
2020the year in which green-house gas emissions will have to peak if we want to avoid huge costs in the fight against climate change
22 23

II Economically, virtually all reliable analyses have found that the cost-effective path of climate action would involve a gradual tightening of emission targets globally so as not to render our entire (fossil-fuel burn-ing) infrastructure obsolete in one go (see box 4).
In other words, an affordable climate policy will not outlaw the use of current carbon-intensive technologies, but will instead provide incen-tives (or possibly requirements) for the adoption of more carbon-friendly technologies as we go on renewing our infrastructure and machinery. It would be absurdly costly to confiscate and destroy your gasoline- powered car today and force you to purchase a zero-emission vehicle. Rather, it makes economic sense to put in place policies that increase the likelihood that your next car will be significantly more fuel efficient, if not carbon neutral.
III Technological change (innovation) will be crucial to bringing down the costs of fighting climate change in the long term, both for economic rationality and political feasibility. Companies will only develop and adopt low-carbon technologies in response to long-term price signals.
IV Administratively, the creation of durable international institutions will be essential. The climate challenges the world faces today are at least as great as the challenges faced by world leaders when they gathered in Bretton Woods, New Hampshire, in 1944 to establish international mon-etary and financial order after World War II. Five decades were required to develop and solidify the World Bank, the International Monetary Fund and the World Trade Organization. A new international climate regime will not be effective overnight.
For all of these reasons, international climate negotiations will be an ongoing process – not a single task with a clear end point. Climate nego-tiations should aim at progress towards the foundation of meaningful long-term action, rather than focusing on an unattainable immediate “solution”.
The challenge presented by the long-term character of the climate prob-lem is immense. Politicians in representative democracies have strong incentives to appeal to today’s voters by giving them benefits that will be financed by future generations. The climate challenge calls for precisely the opposite – today’s citizens agreeing to costly actions that will protect future generations.
100non-OECD countries had renewable energy policies in place in 2014, compared with only 15 in 2005
A new international climate regime will not be effective overnight
The climate challenge calls for today’s citizens agreeing to costly actions that will protect future generations
burning fossil fuels (“carbon capture and storage”) are unavailable, then the cost of cutting emissions to the necessary levels more than doubles.
So, from a purely economic perspective, the cost of achieving the 450 ppm target will be significant, but not necessarily unwarranted. A reasonable economic assessment of the target might be “very difficult, but not impossible”. Things become more challenging when we move from economics to politics.
from economics to politicsTwo fundamentals of the science of climate change – one spatial and one temporal – are of utmost importance for the politics of climate change.
First, greenhouse gases mix globally in the atmosphere, and so damage is spread around the world irrespective of where the emissions come from. This means that any jurisdiction taking action – a country, state, or city – will bear the direct cost of its actions, but the direct benefits (averted climate change) will be distributed globally. Hence, the direct benefits any jurisdiction reaps from its actions will inevitably be less than the costs it incurs, despite the fact that global benefits may be greater – possibly much greater – than global costs. This means that climate change pres-ents us with a classic “free-rider” problem: no country sees taking action as being in its own interest, yet each hopes to reap the benefits from the actions taken by other countries. This is why international, if not global, cooperation is essential. Since our atmosphere is a globally shared good, scientists also refer to the dilemma as a “global commons” problem.
The other scientific reality is that many greenhouse gases, in particular CO2, linger in the atmosphere for decades and up to a century or more.
The frequently heard cliché about the baseball season applies even more to international climate change policy: it is a marathon, not a sprint. Here are four reasons why:
I Scientifically, what matters is the stock of carbon in the atmosphere, not how much we emit at any given point in time. The damages from climate change are linked with concentrations, not with emissions per se. The stock of CO2 in the atmosphere is like a bathtub that is filling up as water continues to flow from the spout. But this atmospheric bathtub has a very slow drain, as it takes decades to centuries for greenhouse gases to precipitate out of the atmosphere (mainly as oceans slowly absorb CO2).
No country sees it in its interest to take action, and each hopes to reap the benefits from the actions taken by other countries
The stock of CO2 in the atmos phere is like a bathtub that is filling up as water continues to flow from the spout
24 25

In the end, the Kyoto Protocol failed to constrain the world’s six largest greenhouse gas emitters
When the members of the UNFCCC met for the first follow-up meeting in 1995 in Berlin, they agreed that “common but differentiated responsibili-ties” meant that only the industrialized countries listed in Annex I would commit to emission reductions. The developing countries not listed in Annex I would take on no such commitments. This so-called Berlin Man-date was then codified with numerical national targets and timetables in the 1997 Kyoto Protocol. It opened up a dramatic gap between rhetoric and reality.
By the time of the Berlin Mandate, the developing countries already emitted more greenhouse gases every year than the richer countries listed in Annex I. Even in terms of emissions per head, they were not far behind. By 2005, when the Kyoto Protocol entered into force, almost 50 of the non-Annex I countries already had per capita fossil fuel CO2 emissions that were higher than those of the lowest- emitting Annex I country.
In the end, the Kyoto Protocol failed to constrain the world’s six largest greenhouse gas emitters – either because they were still classed as developing countries and therefore did not take on commitments to reduce emissions (China, India, Brazil and Indonesia), or because they failed to ratify the Protocol (the US), or ratified it but adopted only a non-binding emissions target (Russia).
Since 1990, the base year of the Kyoto Protocol, emissions have grown by approximately 5 per cent annually in the non-Annex I countries, while remaining relatively constant in the Annex I nations. Furthermore, the split into countries with commitments and those without has made fighting climate change much more expensive: it has effectively quadrupled the global cost of emissions cuts that are necessary to stabilize atmospheric concentrations of greenhouse gases, relative to a cost- minimizing scenario.
But prospects for change began to emerge in 2009, when the UNFCCC members met in Copenhagen, Denmark, and a year later in Cancun, Mexico. The agreements they reached there began to blur the distinction between Annex I and non-Annex I.
They departed even further from the distinction into developed and developing countries at their meeting in Durban, South Africa, in 2011. Here they agreed on a structure that would entail the participation of all parties in the effort to mitigate greenhouse gas emissions. Under this
The global commons and geopoliticsThese fundamental realities – the global commons nature of the problem together with its long-term character – present fundamental geo political challenges (see also chapter 3). Twenty years ago, when 172 governments met in Rio de Janeiro, Brazil, for the original Earth Summit, they agreed on a legally binding framework for climate policies – the United Nations Framework Convention on Climate Change (UNFCCC) – and established two key principles. One was the “stabilization of greenhouse gas concentrations at a level that would prevent dangerous anthropogenic (man-made) interference with the climate system”. The other defined how this goal should be pursued: “The Parties (to the UNFCCC) should protect the climate system … on the basis of equity and in accordance with their common but differentiated responsibilities and respective capabilities”.
This second principle signaled the conviction that, although the climate problem is a global commons issue with all countries contributing to it, some countries had contributed more to the stock of emissions in the atmosphere than others – and those countries were the wealthier countries of the world. Hence, a specific set of industrialized countries (listed in Annex I of the convention) were committed to take actions “with the aim of returning [their greenhouse gas emissions] individually or jointly to their 1990 levels”.
figure 1.1 share of fuel type in total energy consumption
In per cent, 2011
Sources: US Energy Information Agency; European Commission fossil (Oil, Coal, gas) renewable nuclear
usA China eu
Some countries had contributed more to the stock of emissions in the atmosphere than others
26 27
In the US, congressional support for environmental legislation now mainly reflects partisan divisions
In the 1980s, under president Ronald Reagan, the US Environmental Pro-tection Agency (EPA) put in place a trading program to phase out leaded gasoline. President George H.W. Bush not only pushed through the use of cap and trade to cut SO2 emissions, but his administration also advo-cated in international forums the use of emissions trading to cut global CO2 emissions – a proposal initially resisted but ultimately adopted by the EU. In 2005, under President George W. Bush, the EPA issued the Clean Air Interstate Rule, aimed at reducing SO2 emissions by a further 70 per cent from their 2003 levels. Cap and trade was again the policy instrument of choice.
From the 1970s through much of the 1990s, environmental and energy debates in the US typically broke along geographic rather than partisan lines. A politician’s stance on environmental legislation would depend more on whether his or her state was urban or rural and on which fuel the state primarily relied. For example, the Clean Air Act Amendments of 1990 passed by both houses of Congress were supported by large majorities of both Democrats and Republicans.
But 20 years later, when climate change legislation received serious consideration in Washington, environmental politics had changed dra-matically. Congressional support for environmental legislation now mainly reflects partisan divisions.
In 2009, the House of Representatives passed the American Clean Energy and Security Act (known as the Waxman-Markey bill) that included an economy-wide cap-and-trade system to cut CO2 emissions. The bill passed by a narrow margin, with support from 83 per cent of Democrats, but only 4 per cent of Republicans. In July 2010, the Senate abandoned its attempt to pass similar legislation in the face of opposition from Republicans, as well as coal-state Democrats.
What are the implications of this somewhat sordid political history for US climate change policy? The bad news is that the enactment and imple-mentation of a cost-effective, economy-wide carbon pricing mechanism in the US is very unlikely in the short term. Emissions of CO2 from coal-fired power plants will no doubt be reduced by EPA rules on other pollutants (SO2, NOx, mercury, coal fly ash) that are working their way through the regulatory process, because those rules will drive up the cost of generating electricity with coal. But those rules – and others now proposed by EPA in response to a Supreme Court requirement that it
54 %of Americans agree that climate change is largely the result of human activity
93 %of Chinese agree that climate change is largely the result of human activity
“Durban Platform”, delegates agreed to craft a future legal regime that would be “applicable to all Parties ... under the Convention”. This has the potential essentially to eliminate the Annex I/non-Annex I distinction and could be an important step toward breaking the logjam that has pre-vented progress. All eyes are now on the Paris climate conference sched-uled for the end of 2015.
International cooperation is necessary for fighting climate change. But fully global action is not. Therefore, forums other than the global UNFCCC (now with 196 parties) may be productive as complements, if not substi-tutes, in the search for solutions. Such forums include the “Major Econo-mies Forum for Energy and Climate” (which includes 17 large economies, both developed and emerging) and the Group of Twenty Finance Ministers and Central Bank Governors – the G-20.
The reality is that 16 countries and regions (counting the EU as one) account for approximately 80 per cent of global emissions. And two countries stand out as the greatest current – and historical – contributors: the US, estimated to have accounted for 15 per cent of global CO2 emissions in 2012; and China, with 29 per cent of the estimated global total in that year. Next in line are the 27 EU countries (12 per cent), India (6 per cent), Russia (5 per cent) and Japan (4 per cent). With the top two contributors accounting for nearly half of all emissions, attention has understandably focused on China and the US.
us climate policyIn 2012, US President Barack Obama renewed his commitment to aggres-sive climate change policy. In his efforts to reduce US emissions, he has since used executive orders aimed at cleaning up car exhaust fumes and power stations – knowing full well that he cannot get any climate change legislation through Congress.
It would be worth reflecting on what happened since Congress’s great success two decades earlier, when it enacted president George H.W. Bush’s path-breaking sulfur dioxide (SO2) cap-and-trade system to cut acid rain by 50 per cent, as part of the Clean Air Act Amendments of 1990.
For a long time, market-based approaches to environmental protection bore the label of the Republican party, including “cap-and-trade schemes”, under which companies and utilities are allowed to emit only a certain amount of pollutants and then have to pay for additional pollution permits.
International coope-ration is necessary for fighting climate change; but fully global action is not
44 %of global carbon emissions came from just two countries in 2012: China and the US
28 29

China’s burgeoning middle class has begun to demand action to improve air quality
regulate CO2 under the Clean Air Act – are unlikely to be cost-effective policies for reducing economy-wide greenhouse gas emissions in the long run.
Chinese developmentsThe prognosis for meaningful, economy-wide climate policy in China is similar to the US case, despite positive developments in China on several fronts (see also chapter 5). China may achieve its stated goal of reducing the carbon intensity of its economy (measured as emissions per unit of GDP) 45 per cent below the 2005 level by 2020. But China’s coal con-sumption and total CO2 emissions are expected to continue to increase.
Much has been written in the Western press regarding the Chinese government’s concern about worsening local air pollution – the mix of particulates, ozone, sulfur and nitrogen oxides that hangs over Beijing and other cities. Pollution has been growing gradually, but daily and hourly peak levels – especially of particulates – have been increasing more rapidly, with hourly concentrations in Beijing now having exceeded the worst experienced in Los Angeles in the 1960s by more than 10 times.
China’s burgeoning middle class has begun to demand action to improve air quality, partly facilitated by the spread of social media, and govern-ment statements have started responding to this pressure. Prime Minister Li Keqiang opened the 2014 session of the National People’s Congress with a resounding declaration of war on environmental pollution, warning about the downside of the rapid and unconstrained economic development China has enjoyed.
Emissions of many of the local air pollutants – including those from coal-fired power plants, industrial facilities, and motor vehicles – are correlat-ed with emissions of CO2 from the same sources. Hence, actions aimed at improving air quality will also be likely to curb CO2 emissions (although in some cases, CO2 and local air pollutants are substitutes, not comple-ments, as in the case of using coal gasification to produce clean-burning methane).
Convergence of us and Chinese perspectivesChina and the US have engaged in debates on climate change regarding the fundamental question of who should do what. They and their respec-tive allies in the developing and developed worlds have clashed over the call under the Durban Platform for a global climate deal that is “applicable
31

figure 1.2 Cumulative greenhouse gas emissions
Per cent of total emissions in 1850–2010
Source: PBL Netherlands Environmental Assessment Agency
developed Countries of which, in per cent of total:
developing countries of which, in per cent of total:
ChinaIndonesiaIndiaBrazilmexico
11.64.84.13.91.3
18.617.1
7.22.81.9
united stateseu-27russiaJapan
Canada
5248
to all Parties … under the Convention”. The US and other industrialized countries insist that this calls for an agreement that brings about emis-sions reduction pledges from all countries. In particular, they understand it to include industrialized countries plus the large emerging economies.
But China and India – as well as most countries in the developing world – point out that the Durban Platform was adopted under the auspices of the UNFCCC, with its key principle of “common but differentiated respon-sibilities” – the idea that rich countries should bear a greater share of the burden of tackling climate change – as well as the subsequent mandate calling for emissions reductions only by developed (Annex I) countries. Therefore, they now say, the Durban Platform calls only for emission reduction commitments from the industrialized nations.
In the midst of this frustrating finger-pointing, there may be reason for cautious optimism – namely, bilateral discussions on climate change policy between China and the US. Such bilateral negotiations – possibly outside of the UNFCCC – may be where real progress is eventually made. If this happens, it will occur partly because of an emerging convergence of interests.
I The annual levels of CO2 and greenhouse gas emissions of these twocountries have converged. While US CO2 emissions in 1990 were almost twice the level of Chinese emissions, by 2006 China had overtaken the US. These are the world’s two largest emitters.
II Cumulative emissions are particularly important, because it is theaccumulated stock of greenhouse gases in the atmosphere that cause cli-mate change. Any discussion of distributional equity in the climate realm therefore inevitably turns to considerations of “historic responsibility”.
Looking at the period 1850–2010, the US led the pack, accounting for nearly 19 per cent of cumulative global emissions of greenhouse gases; with the EU in second place at 17 per cent; and China third, accounting for about 12 per cent of global cumulative emissions (see figure 1.2). But that picture is rapidly changing. Emissions are stable to declining throughout the indus-trialized world, while increasing rapidly in large, emerging economies – in particular China. Depending on relative rates of economic growth, China may top all countries in cumulative emissions within 10 to 20 years.
Bilateral nego tiations between China and the US may be where real progress is eventually made
32

Importantly, both countries have very large shale gas reserves. US gas output (and use for electricity generation) has been increasing rapidly, bringing down CO2 emissions. Chinese exploitation has been constrained by available infrastructure – it lacks pipelines – but that will change.
IV Both countries have been moving forward with policies that explic-itly address greenhouse gas emissions, and in both countries, these have featured sub-national, market-based policy instruments – in particular, cap-and-trade systems. In China, the government has launched local and regional CO2 cap-and-trade systems in Shenzhen, Shanghai, Guandong, Beijing, Tianjin, Hubei, and Chongqing. In the US, California’s ambitious AB-32 cap-and-trade system continues to make progress, while in the northeast, the Regional Greenhouse Gas Initiative is witnessing higher allowance prices due to the more severe targets recently adopted by the nine participating states.
V CO2 policy action is also immanent at the national level in both coun-tries. In China, the government has stated its intention to link its local and regional CO2 cap-and-trade systems together in a nationwide system. In the US, the failure in 2009 of meaningful carbon-pricing policy in Congress has led the Obama administration to turn to regulatory action, including its June 2014 announcement of proposed CO2 regula-tions for existing power plants.
It is striking that, just as CO2 emissions reductions in China are most likely to be achieved as a byproduct of policies targeting particulates and other local air pollutants, the Obama administration’s economic analysis of its proposed CO2 limits on power plants justifies the costs of those limits by appealing to the health benefits of reductions in correlated local air pollutants.
VI Finally, there is the reality of geopolitics. If the 20th century was the “American century”, then many observers – including leaders in China – anticipate (or at least hope) that the 21st will be the “Chinese century”, one of global leadership, not obstruction.
The path aheadThe political climate in the US presents its own challenges to progress. Indeed, it will take a great deal of dedicated effort – and profound luck – to find political openings that can bridge the wide partisan divide that exists on climate change policy and environmental issues more broadly.
Both China and the US have very large shale gas reserves, which can bring down CO2 emissions
III Historically, China and the US have both relied mostly on coal for generating electricity – and both are trying to do something about it. At a time when US dependence on coal is decreasing (largely due to increased supplies of natural gas and hence lower gas prices), China continues to rely on this dirty fuel. But China’s concern about the health impacts of local air pollution may lead it to wean itself away from coal.
34 35

A truly global framework for climate protectionThe United Nations Framework Convention on Climate Change (UNFCCC) is an international treaty that seeks to address climate change and its conse-quences. To date, 196 countries have signed this treaty. This universal mem-bership ensures that decisions taken within the UNFCCC framework are regarded as legitimate by all nations, but it also makes working within this framework uniquely complex.
Every year, delegates from all the signatory countries meet at the Confer-ence of the Parties (COP) to assess progress and discuss new greenhouse gas reduction targets. At the sidelines of the COP meetings, a growing num-ber of activists, businesses, researchers and other groups are making their voices heard.
The UNFCCC’s first success was the drawing up of national greenhouse gas inventories. Before that, countries simply had no common matrix with which
International climate talks: A short history
of a long process
by Verena Treber
BOx 1
Robert N. Stavins is Albert Pratt Professor of Business and Government at the Harvard Kennedy School, Research Associate of the National Bureau of Economics Research, and University Fellow of Resources for the Future. Formerly, he was Chair of the US Environmental Protection Agency’s Environmental Economics Advisory Board and he directed Project 88, a bipartisan effort to develop innovative approaches to environmental problems. He is the author of several books and numerous scholarly articles on environmental economics and policy and has advised government agencies, international organizations, corporations, and advocacy groups.
Think about the following. Nearly all major US environmental laws were passed in the wake of highly publicized environmental events or “disas-ters”, such as the spontaneous combustion of the Cuyahoga River in Cleveland, Ohio, in 1969, and the discovery of toxic substances at Love Canal in Niagara Falls, New York, in the mid-1970s. But the day after the Cuyahoga River caught fire, no press reports commented that the cause was uncertain, that rivers periodically catch on fire from natural causes. On the contrary, it was immediately apparent that the cause was waste dumped into the river by local industry. A direct consequence of the observed “disaster” was, of course, the Clean Water Act of 1972.
But climate change is distinctly different. Unlike the environmental threats addressed successfully in past US legislation, climate change is essentially unobservable to the general population. We observe the weather, not the climate. Until there is an obvious, sudden and perhaps cataclysmic event – such as a loss of part of the Antarctic ice sheet leading to a dramatic sea-level rise – it is unlikely that US public opinion will provide the tremendous bottom-up demand that inspired previous national action on the environment.
That need not mean that there can be no truly meaningful, economy-wide climate policy until disaster has struck. But it does mean that bottom-up popular demand may not come in time, and that instead what will be required is inspired leadership at the highest level that can somehow begin to bridge the debilitating partisan political divide.
Nearly all major US environmental laws were passed in the wake of highly publicized environmental events or disasters
36 37

jurisdictions implement or plan to establish carbon pricing instruments, including emissions trading systems and taxes.
2009 – The goal is clear, the path is notHopes are high for the 2009 Copenhagen meeting to deliver a breakthrough on binding CO2 cuts after 2012, when the Kyoto commitments lapse. Par-ticipants hope that, this time, the US as well as emerging nations like China and India will also participate.
In the early morning hours of the last day of the conference, delegates agree that the world must keep global warming below 2 degrees C to prevent catastrophic consequences. But they do not agree on how to get there. The wealthier countries promise to find $100 billion a year by 2020 to help poorer countries address climate change.
The way forwardIn 2012, the countries that still participate in the Kyoto Protocol agree to extend it until 2020. Rich and poor countries continue to differ over who is responsible for the greenhouse gas emissions in the atmosphere and who should do what. Most agree that a binding deal on cuts should be finalized by 2015 (when the COP will meet in Paris) so that a new treaty can come into force by 2020.
While levels of carbon emissions are still rising, the focus of international climate talks is shifting to dealing with the negative consequences of climate change that are already becoming a reality (see chapter 3). Developed coun-tries pledge to help developing countries and small island nations to deal with the losses and damages associated with climate change. In which form and by when these pledges are supposed to be realized is still under discussion.
Verena Treber, Allianz Climate Solutions
to measure and compare their emissions. The inventory now allows coun-tries to formulate CO2 reduction targets against an agreed baseline.
1992 – The birth of climate negotiationsThe UNFCCC is signed at the Earth Summit in Rio de Janeiro in 1992. The 172 countries that take part agree to stabilize “greenhouse gas concentrations in the atmosphere at a level that would prevent dangerous anthropogenic [man-made] interference with the climate system”. This commitment, however, is not legally binding, and the UNFCCC parties do not adopt specific targets for emission cuts.
1997 – A first concrete agreementOver 150 countries sign the Kyoto Protocol in which they commit to binding greenhouse gas emissions targets to be achieved in stages by 2008 and 2012. They agree on market mechanisms, such as carbon trading, that might be used to achieve those targets. To become law, at least 55 countries, covering over 55 per cent of industrialized countries’ emissions, must ratify the proto-col. This takes time and is only achieved in 2005.
The protocol recognizes that the industrialized countries are responsible for most of the accumulated greenhouse gases in the atmosphere. Therefore, only they have binding targets, while developing countries are encouraged to take voluntary action (see also chapter 1).
2001 – not much agreement on the agreementAt the COPs in 1998, 1999 and 2000, some countries – including Australia, Canada, Japan and the US – try to exploit loopholes in the Kyoto Protocol’s emissions trading mechanism. In 2001, the US completely withdraws from the Kyoto process.
2005 – Cutting emissions becomes law – but only for someThe Kyoto Protocol enters into force, which means it becomes legally binding for those countries that ratified it. The EU establishes its emissions trading scheme, under which carbon emissions from participating industries are capped at a certain level, and permits for emitting CO2 can be traded. Expectations that a global carbon market would develop proof to be unfound-ed. However, over the following years, 39 national and 23 sub-national
38 39

Imagine it is the year 2030 and you are watching the evening news broad-cast in your living room. The breaking news is about the latest in a series of powerful hurricanes that have landed on the coast near your home.
But despite gale-force winds and storm surges, the damage to your city has been minimal and, most importantly, there has been no loss of life – largely thanks to mangroves and coral reefs that protect the shoreline.
The main item in the business news that evening is a report about companies that are investing in the protection of watersheds (these are river basins and catchments that collect and clean water for human use). The report highlights that the profits of these companies are now higher than those that build expensive water treatment facilities for burgeoning megacities.
The final story that night is about doctors who are prescribing greater contact with nature to improve their patients’ health. Outdoor activity,
Nature – Our life insuranceby Julia Marton-Lefèvre
CHAPTer 2
nature is part of the solution
41

Forests deliver $130 billion worth of direct, tangible benefits each year to 1.6 billion of the world’s poorest people, including 60 million indigenous people who are almost entirely dependent on these ecosystems, according to recent research from the International Union for Conservation (IUCN).
One-third of the world’s 100 largest cities – including New York, Beijing and Sydney – take their water directly from protected areas such as national parks and nature reserves.
Half of the world’s most frequently prescribed drugs, including aspirin, have their origins in nature.
Some of our greatest inventions, from Velcro to helicopters, were inspired by nature; and nature continues to drive innovation in the 21st century.
We may not always be aware of these benefits from nature, and too often we take them for granted – until they’re not there anymore.
Today, more than 22,000 animal and plant species on our planet are threatened with extinction, and 60 per cent of the world’s ecosystems are in grave danger from human activity (see box next page). How can we change this grim outlook and ensure a brighter future for all of nature’s creations, including us humans?
A beeline for food securityThe humble honeybee is vital to our food security. Bees perform a free pollination service valued at over $200 billion per year, or nearly 10 per cent of the world’s agricultural output for human food. If bees disap-peared completely, more than one-third of the world’s food production would be threatened.
This threat is already beginning to materialize in some parts of the world. In Sichuan, China, for example, insecticides have wiped out the bees that used to pollinate the region’s vast orchards. Now farmers there have to deploy some 40,000 workers each year to feather-dust fruit trees with pollen.
In Europe and the US, bee populations are also declining rapidly, as high-quality farmland and natural areas are shrinking and famers use many harmful pesticides.
Species are dis ap- pearing up to 1,000 times faster than the natural extinction rate calculated from fossil records
22,000documented animal and plant species are threatened with extinction
the reporter explains, can help to reduce the soaring healthcare costs associated with our sedentary lifestyles.
Sounds far-fetched? Implausible? Too good to be true? All three news items are grounded in the realities of today. Whether these will be the stories that make headlines in 2030, however, depends on the actions we take today.
We hear more and more about the negative impacts of climate change: most parts of our planet are getting warmer, some are getting wetter, others drier, and we will all have to cope with less predictable weather. Climate change is also threatening to make our water and food supplies less stable and secure, resulting in a greater spread of new and infectious diseases.
We must adapt to the changes that are already underway, and those that we can already foresee. And while, at first sight, insurance and nature conservation may seem worlds apart, they are in essence about the same thing: risk-proofing our future.
There is currently a lot of discussion about how much we will have to invest in order to make our cities and communities more resilient to climate change. When thinking of such investments, most people con-jure up images of concrete, steel and other man-made structures. They tend to forget that nature itself can be the best protection against natural disasters. We must not neglect to invest in our natural infrastructure, too.
nature’s benefitsAnimal and plant species, together with their genes and the ecosystems in which they live – known collectively as “biodiversity” – are our planet’s life-support system. Insects pollinate our crops, wetlands purify fresh-water, oceans provide seafood, forests store carbon. Nature not only meets our basic human needs, it is also a source of inspiration. It re charges our batteries and nourishes our soul.
Here are some examples of how we depend on nature for our survival and well-being:
An estimated one billion people depend on fish for their food and income. Of these, at least 85 per cent rely on fish as their major source of protein.
Nature itself can be the best protection against natural disasters
Insects pollinate our crops, wetlands purify freshwater, oceans provide seafood, forests store carbon
1 billionpeople rely on fish for their food and income
42 43

Europeans have recognized the need to protect Europe’s bee populations to secure food production in the years to come. The EU has therefore banned the use of neonicotinoid pesticides. In the US, more than half the nation’s commercial bees are needed to pollinate just one crop: almonds, the country’s most lucrative nut produce, with the annual harvest valued at $4.8 billion.
A famous statement widely attributed to Albert Einstein asserts that, if the bee disappears from the surface of the earth, man would have no more than four years to live. We surely don’t wish to take this gamble.
natural defensesBut let’s go back to the hurricane story from our news bulletin. Tsunamis, floods, famines, droughts and landslides are examples of disasters that show how closely we are tied to nature. They can also illustrate how investment in nature can help us to become more resilient in times of exceptional hardship.
We don’t have to think ahead to 2030 to feel the urgency of dealing with natural calamities. We are, in the present day, already looking for
If bees disappeared completely, more than one-third of the world’s food production would be threatened
$200 billionis the value of pollina-tion services that bees provide every year
red AlertThe Red List of Threatened Species is consid-ered the world’s most comprehensive and authoritative source of information on the con-servation status of animals and plants. The Red List is compiled by the International Union for Conservation of Nature (IUCN, the world’s old-est and largest global environmental member-ship organization) and its partners.
The Red List covers all major groups of species: mammals, birds, amphibians, sharks, reef-building corals, conifers, cycads, mangroves and sea grasses. It is far from complete, how-ever. The vast majority of species on our planet have yet to be documented or assessed – the Red List covers only 3 per cent of all known species. The biggest gaps are to be found among the fungi, plants and invertebrates.
Of the roughly 70,000 species that are assessed through the Red List, more than 22,000 are threatened with extinction, including one-quarter of all mammals, one in three corals and two out of five amphibians.
Although the extinction of species is part of the evolutionary process, what we are wit-nessing today is a disappearance rate of up to
1,000 times faster than the natural extinction rate calculated from fossil records.
The sample of species covered by the Red List gives us an indication of how life on earth is faring, what we know and don’t know, and how urgently we need to reinforce our efforts to preserve the amazing diversity of species around us. It is therefore a powerful tool to catalyze action and policy changes.
Fortunately, not all news from the IUCN Red List is bad. Thanks to targeted conservation action, we have managed to slow down the rates at which species are going extinct by one-fifth. Nevertheless, we need to do more to turn the Red List into a more complete “barometer of life”. We are currently working on raising the number of species included to at least 160,000 by 2020.
www.iucnredlist.org
examples of species that are threatened with extinction
25 %
mammals threatened Birds threatenedAmphibians threatened
13 %41 %
45

as part of a green reconstruction project to protect the damaged coast-line from future disasters.
The Caribbean nation of Barbados could avoid more than one-third of the losses it is expected to suffer from climate change if it protected its coast-al ecosystems. Coral reefs, in particular, can reduce the force of incoming waves by 90 per cent. Such protection would be cost effective: every dollar invested in the Folkestone Marine Park on the west coast of Barbados could reduce hurricane losses by $20.
When hurricane Katrina hit the coastlines of Louisiana and Mississippi in the US in August 2005, the wetlands, marshes and barrier islands of two nature preservation areas (Jean Lafitte National Historic Park and the Gulf Islands National Seashore) helped to protect life and property by absorbing some of the force of the storm surges. Katrina still turned out to be the costliest storm in US history, inflicting an estimated $81 billion in damages and causing 1,836 deaths.
To reduce the damage from future calamities, the US government is now investing $400 million in the restoration of the Gulf Islands National Seashore and another $50 million in rebuilding the Jean Lafitte Park – a sensible investment and a small sum compared with the economic losses caused by hurricane Katrina.
Coping with water stressLess than 1 per cent of all water on our planet is freshwater available for human use. Already, one in five people around the world does not have sufficient access to fresh water; and water may well become one of nature’s most precious resources.
The Andean páramos – high-altitude grasslands running through Peru, Ecuador, Colombia and Venezuela – are critical to millions of rural and urban people. They support livelihoods, provide habitat for species found nowhere else and are important for cultural identity.
The páramo ecosystems in South and Central America is the largest supplier of water in the northern Andean countries. Almost all river systems in Venezuela, Colombia, Ecuador and northern Peru originate in the páramo. Irrigation, the supply of drinking water and hydroelectricity all largely rely on the ability of the páramo regions in this area to store and release water.
Coral reefs can reduce the force of incoming waves by 90 per cent
$81 billion damage from hurricane Katrina
≤1 %of water on earth is freshwater and available for human use
“no-regrets” options – cost effective actions that can help stave off the worst effects of climate change. Many of these climate solutions come from nature.
Holiday makers the world over flock to coastal areas with their sandy beaches and azure waters. Yet these areas are particularly vulnerable to the effects of climate change. For example, in the Caribbean, hurri-canes are responsible for 90 per cent of the recorded damage of buildings and infrastructure. Their impact is often comparable to that of an economic recession.
In February 2011, tropical cyclone Yasi, roughly the size of Italy, struck the northern coast of Queensland, Australia. Yasi was one of the most powerful cyclones to have affected Queensland since records began.
Cyclone Yasi left much devastation in its wake: damage to property and infrastructure alone was estimated at over (US) $700 million. Property values in cyclone-affected areas dropped, and the sugar cane industry was hit particularly hard. If the damage is measured in insurance pay-outs, Yasi was the second worst cyclone to ever hit Australia (after Cyclone Tracy, which struck the northern city of Darwin in 1974).
The example of Cyclone Yasi shows us how important natural buffers such as mangroves, coral reefs and forests could be in reducing the impacts of natural hazards. The larger the protective buffer, especially along the coastline, the greater the damage protection. In the wake of Cyclone Yasi, the authorities in Queensland decided to limit house building in hazard-prone areas and consider climate change when drawing up plans for land use.
Using natural ecosystems as a defense to reduce the risk of disaster is not a new idea. In southern India, for example, the name of a sacred coastal grove literally translates as “the forest that controls the waves”. In the Philippines, 90 per cent of the fishermen (and women) surveyed as part of a recent research project said that mangroves provided protection from storms and typhoons. Japan planted forests on steep slopes to prevent landslides as far back as the 15th and 16th centuries.
Countries around the world are now investing in “natural infrastructure” to reduce the risk and impacts of disasters. In the wake of the 2011 earth-quake and tsunami, Japan established the Sanriku Fukko National Park
Coastal areas are particularly vulnerable to the effects of climate change
46 47

More than 400 of China’s 660 cities now suffer from permanent water shortages. China’s authorities, as well as the voluntary and private sec-tors, are looking at the possibility of investing in natural infrastructure to deal with the water crisis.
Over the next few years, IUCN and its partners will analyze 30 to 50 Chinese megacities and their drinking water sources and watersheds. The Miyun reservoir, for example, supplies 40 per cent of the drinking water for the 20 million people now living in Beijing. The reservoir covers almost 16,000 km2 – an area seven times the size of Paris.
In recent years, however, the reservoir has been threatened by defor-estation as well as the pollution caused by the use of chemicals in agricul-ture and community waste. The volume and quality of Miyun’s water continues to decline, and Beijing now faces a serious water crisis. IUCN’s approach seeks to restore the watershed back to health in order to secure the future water supply for the Chinese capital.
Health, naturallyFor millennia, communities have understood the inherent health bene-fits gained from nature. Today, we are amassing a great deal of scientific evidence for what our intuition has always been telling us: nature is good for our health.
In recent years, conservation experts and medical professionals have been reporting a growing phenomenon known as “nature deficit dis-order”, which they have connected with deteriorating public health.
In the UK, Natural England, a body that advises the government on how to look after landscapes and wildlife, estimates that, if every household in England had easy access to quality green space, this could save around €2.5 billion every year in health costs. Another recent study found that people who visited parks for three days in a row every month were less likely to get cancer or had better chances of containing or over-coming it.
In addition to physical benefits, contact with nature has also been proven to improve mental health. For example, research shows that a 20-minute walk in a park or other natural environment enhances the ability of children with poor concentration to focus.
More than 400 of China’s 660 cities now suffer from permanent water shortages
�2.5 billionpotential savings in healthcare costs if every English household had easy access to green space
But this ecosystem is vulnerable to climate change. More immediately, human activity – such as farming, livestock grazing, the burning of grass-lands, mining, inadequate water management and urban expansion – all pose serious risks to its integrity and to the water it provides.
Protected areas in Columbia, which cover 10 per cent of the country, provide water for one in two inhabitants and generate one-fifth of the country’s hydroelectric power. Nowhere is this vital link more obvious than in the capital, Bogotá, home to 8 million people. Bogotá gets 80 per cent of its water from the Chingaza and Sumapaz national parks. An innovative project has been set up to ensure that these water reservoirs are also available in the future.
The Nature Conservancy (a conservation charity and IUCN member) has created a conservation trust fund that will collect voluntary contributions from Bogotá’s water companies. The fund will be used to support conser-vation projects – such as improving the management of and expanding protected areas, and creating incentives for ecologically sustainable cattle ranching. These projects will help keep the region’s rivers in good health and protect its watersheds. They are also estimated to save Bogotá’s water treatment facilities some $4 million a year.
Bogotá (8 million people) gets 80 per cent of its water from surrounding national parks
48 49

In Australia, the Parks Victoria authority works with a range of partners – from health professionals to NGOs and local authorities – on the “Healthy Parks, Healthy People” initiative. This program emphasizes public health and other benefits of protected areas and encourages a greater use of nature in developing public health strategies.
In Canberra, Australia’s capital, local authorities have planted 400,000 trees to improve air quality, store carbon and provide natural shade (which reduces the need for air conditioning). In just five years, these benefits have been estimated to be worth between (US) $20 million and 67 million.
solutions from natureAs these examples demonstrate, nature can help us address some of the biggest challenges we face today, and will come to face in the future.
Nature can offer solutions for reducing the impact of climate change in order to ensure our food and energy supplies, and improve our water and health. Nature can save us money and support our economic development.
This is why we at IUCN have coined the concept of “nature-based solutions”, initially in the context of climate negotiations, as a refreshingly different way of looking at nature: not as a victim, but as part of a solution to climate change and other global challenges.
The biggest question today is how we can capture and communicate the positive impact of nature on all aspects of our lives in order to influence future investments and a broader political agenda, and thus recognize nature for what it is – our life insurance on this planet.
Julia Marton-Lefèvreis Director General of the International Union for Conservation of Nature (IUCN). IUCN is the world’s oldest and largest global environmental membership organization, with more than 1,200 government and NGO members and almost 11,000 volunteer experts in some 160 countries. Before IUCN, Ms Marton-Lefèvre was Rector of the UN University for Peace and Executive Director of the Leadership for Environment and Development program. She is a member of the Leadership Council of the Sustainable Development Solutions Network and the World Future Council, among others.
We look at nature not as a victim, but as part of the solution
To alleviate obesity, diabetes and other modern-day ills linked to a seden-tary lifestyle, some doctors are now literally prescribing a walk in the park. In the US, the National Parks Service (the body that oversees some 400 US national parks) has developed Park Rx, a list of local parks and green areas that allows doctors to recommend outdoor activity to their patients as a supplement or alternative to conventional drug treatments.
Around the world, local authorities are also realizing that nature makes a strong contribution to both the well-being of their citizens and the com-petitiveness of their cities and economies.
€2.5 billionestimated savings in healthcare costs if every household in England had better access to nature
Doctors are now literally prescribing a walk in the park
50 51
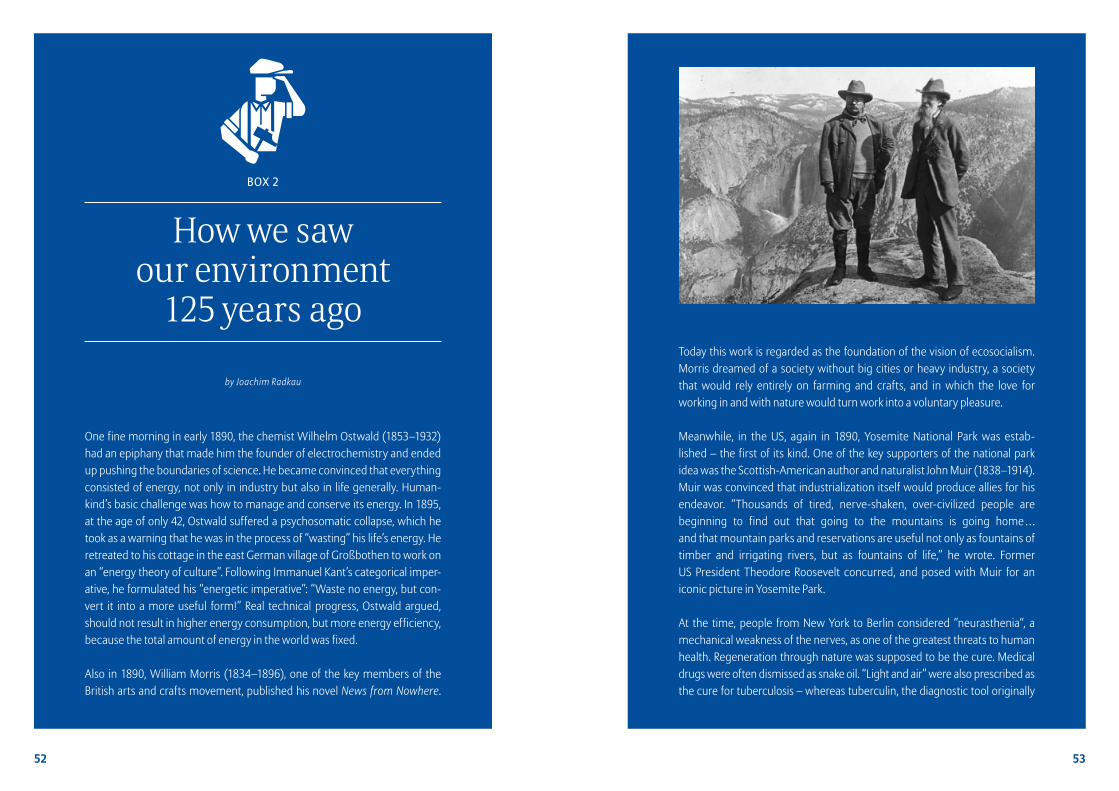
Today this work is regarded as the foundation of the vision of ecosocialism. Morris dreamed of a society without big cities or heavy industry, a society that would rely entirely on farming and crafts, and in which the love for working in and with nature would turn work into a voluntary pleasure.
Meanwhile, in the US, again in 1890, Yosemite National Park was estab-lished – the first of its kind. One of the key supporters of the national park idea was the Scottish-American author and naturalist John Muir (1838–1914). Muir was convinced that industrialization itself would produce allies for his endeavor. “Thousands of tired, nerve-shaken, over-civilized people are beginning to find out that going to the mountains is going home … and that mountain parks and reservations are useful not only as fountains of timber and irrigating rivers, but as fountains of life,” he wrote. Former US President Theodore Roosevelt concurred, and posed with Muir for an iconic picture in Yosemite Park.
At the time, people from New York to Berlin considered “neurasthenia“, a mechanical weakness of the nerves, as one of the greatest threats to human health. Regeneration through nature was supposed to be the cure. Medical drugs were often dismissed as snake oil. “Light and air” were also prescribed as the cure for tuberculosis – whereas tuberculin, the diagnostic tool originally
One fine morning in early 1890, the chemist Wilhelm Ostwald (1853–1932) had an epiphany that made him the founder of electrochemistry and ended up pushing the boundaries of science. He became convinced that everything consisted of energy, not only in industry but also in life generally. Human-kind’s basic challenge was how to manage and conserve its energy. In 1895, at the age of only 42, Ostwald suffered a psychosomatic collapse, which he took as a warning that he was in the process of “wasting” his life’s energy. He retreated to his cottage in the east German village of Großbothen to work on an “energy theory of culture”. Following Immanuel Kant’s categorical imper-ative, he formulated his “energetic imperative”: “Waste no energy, but con-vert it into a more useful form!” Real technical progress, Ostwald argued, should not result in higher energy consumption, but more energy efficiency, because the total amount of energy in the world was fixed.
Also in 1890, William Morris (1834–1896), one of the key members of the British arts and crafts movement, published his novel News from Nowhere.
How we saw our environment
125 years ago
by Joachim Radkau
BOx 2
52 53

The remedy at the time, and for decades thereafter, was to build increasingly higher chimneys. But only the most ignorant people at the end of the 19th century still believed in the “endless skies” in which pollution would simply waft away. Most became aware that the atmosphere around our planet is finite.
Much of what we today classify as part of the environmental movement was already visible 125 years ago. If these early movements had not been dis-rupted by the two world wars, the era of ecology would probably have started already in the late 19th century. Then, the tension between the elec-trical revolution, nervous tension and the longing for nature was very similar to today’s three-way relationship between the electronic revolution, rising stress levels and the quest for ecological sustainability.
People 125 years ago were firm believers in the future. For most of the 19th century, people had believed that history repeated itself in principle. Now they became convinced that the future could bring entirely new develop-ments. Nevertheless, faced with rapid progress in technology and science, many thought that the laws of natural science would allow them to forecast the future, at least in its long-term trends. This belief became essential, particularly for the insurance industry.
One of Wilhelm Ostwald’s students was the Swede Svante Arrhenius (1859–1927). In the 1890s, Arrhenius was the first person to suggest that rapidly growing CO2 emissions would alter the world’s climate in the long term. He did not convince many of his compatriots at a time when smog still blocked out the sunlight from city streets, and the end of the Little Ice Age (which was thought to have started in the 16th century) lay only a few generations back. The fear of a new ice age persisted up until the 1970s, at times descending into panic. Against this background, the idea that our actions might lead to global warming had something comforting. Looking back, we know today that, even with the constant advancement of science and technology, we still cannot fully predict the future of our planet.
Joachim Radkau is Professor of History at Bielefeld University and the author of many books, including The Age of Ecology (2011), the first major study of the history of environmentalism.
invented in 1890 by the Nobel Prize-winning German physician Robert Koch (1843–1910) to cure tuberculosis, did not prove effective.
When the International Electrotechnical Exhibition opened in Frankfurt in 1891, the biggest sensation was a 178-kilometer high-voltage power line that ran from Lauffen on the Neckar river to Frankfurt. Oskar von Miller (1855–1934), the renowned engineer and prophet of the electrical age, demon-strated with this power line not only that long-distance transmission of elec-tricity was possible but also that electricity could come from hydropower – which conjured up visions of a future without smoke- billowing chimneys.
At the same time, Germany’s first big environmental conflict was about to escalate: the first countrywide conservation movement was formed in oppo-sition to a hydropower station that was planned in 1891 at the picturesque Laufenburg rapids on the upper Rhine. The building project went ahead regardless. The momentum of the environmental movement, however, could no longer be stopped. Even industrialists and other staunch believers in technical progress broadly agreed that nature needed to be protected against the damage caused by industrial pollution. This represented a complete change in attitude towards nature. From the Enlightenment through the Romantic era, nature had been seen as an all-powerful goddess; now nature was considered to be vulnerable and in need of protection. And “nature” did not only denote green landscapes but also human nature.
The German physicist Friedrich Kohlrausch (1840–1910) prophesied in the 1890s that – provided solar technology was developed further – “a few square miles in northern Africa” would be sufficient to produce the energy for the entire German Reich. With that, his vision foreshadowed the Desertec Foundation, which is today trying to develop solar power stations in and around the Sahara to generate green energy for Europe.
The then leader of the Socialist Democratic Workers’ Party of Germany, August Bebel (1840–1913), took up the idea of solar power with enthusiasm in a new edition of his bestselling book Woman under Socialism: “Electrifi-cation without limits and without pollution!” The dark clouds hanging over cities at the time made industrialization manifest in a way that we can hardly imagine today.
54 55

We know that climate change is happening and that its consequences will be severe. Yet we do not act forcefully to stop global warming and prepare for its impact.
Global climate diplomacy has had a limited effect thus far, and this is unlikely to change. Governments around the world will increasingly adopt voluntary national targets. Other parties – cities, companies, civil societies – will no longer wait for a global deal but make efforts on their own. Nevertheless, without robust national and international frame-works, such efforts will remain feeble. Technology will be the one bright spot in this gloomy picture. But even investments in green technologies will only happen if the policy framework is right.
growing knowledge does not lead to actionClimate policy is not made in a vacuum. It must start from our assess-ment of what a world subject to global warming might look like, and of the progress we are making in tackling these challenges. With this in mind, I want to have a look at what kind of policies the world will have to adopt by 2030 and beyond to fight global warming effectively.
23years that the inter-national community has been working on a global climate agreement
The future of climate policy: The role of governments, cities, companies … and meby Eileen Claussen
CHAPTer 3
As educated and active citizens, we can make a difference
to climate change
57

countries persist in relying on coal, oil and gas for their electricity gene-ration and transport. If we stay on the current path, global emissions in 2030 will be double what they were in 1990.
The failings of global climate diplomacyWhy does the world not take action? A short look at what we have done, or tried to do, thus far to tackle climate change leaves us with no cause for optimism. Over the last decade, the focus of climate policy has shifted from an internationally coordinated, top-down approach, exemplified in the 1997 Kyoto Protocol (see Box 1), to one that relies more on individual countries setting their own emissions goals and implementing them on a voluntary basis.
This devolution is occurring because successive attempts to forge a global deal on carbon reductions have failed. There are many reasons for this failure. Developed and developing countries alike could not agree on who should have binding targets and how large those targets should be (see chapter 1). Some countries, most notably the US, did not manage to ratify an inter national climate treaty because of their skeptical domestic politics; and many countries simply did not trust the other signatories to stick to the agreed targets.
The Kyoto Protocol was a good start. But since not enough countries committed to reducing emissions within this framework, it did not make a meaningful difference. The US – the largest emitter of CO2 in 1997 – never ratified the protocol. China – the second largest emitter – ratified it but was not given a target for reducing emissions since it still quali fied as a developing country. Many other countries used the fact that the big emitters were not committed to cutting CO2 as an excuse for their own inaction.
Various follow-up conferences to Kyoto – for example Bali in 2007 and Copenhagen in 2009 – did not produce an agreement. Instead, climate policy moved further from the global to the national level. This process is likely to reach fruition at the next big global climate conference in Paris in December 2015. The treaty expected to be signed there will likely be an agglomeration of voluntary national targets.
This shift towards a more bottom-up approach is important. But we are not yet sure what its outcome will be. On the one hand, even if all the countries that have adopted national targets manage to meet them
Climate change policy has shifted from a top-down approach to one that relies on countries setting their own goals
Many countries used the fact that the big emitters were not committed to cutting CO2 as an excuse for their own inaction
The latest reports from the Intergovernmental Panel on Climate Change (IPCC, see introduction to part A) are very clear about the following circum stan ces: climate change is happening; it is caused by human action; and its impacts are likely to be substantial and expensive.
Rainfall patterns have already changed and will continue to do so, which will affect our food supplies worldwide. Many parts of the world will struggle with a lack of water. The growing incidence of extreme weather events – droughts, floods, storms – will damage our infrastructure. Rising sea levels will lead to more floods and storm surges in coastal regions. The IPCC also makes it clear that the more greenhouse gases we emit, the more our planet will warm up and the more severe the impacts will be.
We know all this. And yet current trends in greenhouse gas emissions suggest that we are far from the path that scientists regard as safe to keep our world liveable. Today, we stand virtually no chance of meeting the goal that governments agreed on in Copenhagen in 2009 – namely, to limit global warming to 2 degrees C above pre-industrial levels.
The picture is not uniformly grim. In the next 15 years or so, we will make much progress in modernizing the two sectors that account for the bulk of global carbon emissions: power generation and transport. Technolo-gies for storing electricity (crucial for using renewables more widely) are advancing. Power generation will move from large, centralized plants to more dispersed models, such as solar panels on rooftops or natural gas plants that can swiftly be put together from different modules.
Most of this progress will take place in the industrialized world. But many poorer countries are catching up fast. Europe and the US will close down many of their large, older power plants, either because they will have come to the end of their useful life, or because they do not comply with stricter pollution laws. They will be replaced with newer, cleaner technol-ogies. In the transport sector, the use of electric and hybrid vehicles is spreading, as are other methods of using low-carbon fuels for powering cars and trucks.
And yet, although we will be witnessing a global technological transfor-mation in the decades to come, oil, gas and coal will still be our main sources of power in 2030. Even if we in the more developed countries manage to stabilize or reduce our emissions, those of emerging econo-mies and developing countries will continue to rise steeply, as those
63 %of fuel-related CO2 emissions came from just two sectors in 2010: energy and transport
58 59

EU countries have met or even gone beyond the commitments they made under the Kyoto Protocol. In 2005, the EU adopted a pioneering “Emissions Trading Scheme” (ETS). The ETS was modeled on the US Acid Rain program (which was part of the 1990 amendments to the Clean Air Act, see also chapter 1) but implemented the idea that a pollutant is a “bad” that should have a price on a much grander scale. Under the ETS, the EU capped the total amount of CO2 emissions for all its member states and set up a market in which participating industries can buy and sell “permits” to emit carbon.
In 2007, the EU went further and adopted a unilateral pledge to reduce total carbon emissions by 20 per cent by 2020 (from 1990 levels) as well as improve energy efficiency and increase the amount of renewables in energy generation.
Within the EU, Germany has been leading in the adoption of renewable sources of energy. It has more than doubled the percentage of energy coming from renewables in 10 years (although some European coun-tries, such as Sweden or Austria, have much higher levels, partly due to their reliance on hydroelectric power). But even in Germany, current trends are going in the wrong direction, and emissions are rising again. This is due in part to the government’s decision to shut down all nuclear power plants by 2022 and to reduce subsidies for renewable energy.
The EU is likely to remain at the forefront of global efforts to fight climate change
figure 3.1 The european carbon price
Source: www.quandl.com
Annual averages, € per ton of CO2
25
20
15
10
5
02008 2009 2010 2011 2012 2013 2014
81 %increase in the amount of renewable energy produced in the EU between 2002 and 2012
(a big if), that won’t be nearly enough to limit global warming to 2 degrees C. On the other, if the poorer countries use the 2015 Paris conference to adopt their own CO2 emissions targets for the first time, this would be a huge step forward. Almost all future growth in carbon emissions will come from these emerging markets.
each country on their ownThe big challenge posed by national targets is that they are all so differ-ent. And that they are subject to the vagaries of national politics. A quick look at what the biggest emitters have done so far illustrates this clearly.
I europeEurope – or more precisely, the countries in the European Union (EU) – has taken the greatest strides in fighting climate change to date. Many
Even if all countries meet their voluntary targets, that won’t nearly be enough to limit global warming
60 61

continues to build new coal-fired plants, albeit more efficient ones. In its environmental policy, China has been experimenting with carbon pricing to get emissions down – an approach that would have great promise if implemented nationally. Overall, China’s efforts might slow the speed at which emissions grow, but they will not stabilize – let alone reduce – them in the near to medium term.
Other countries in the developing world are even further behind. India, for example, gives priority to providing its people and industries with electricity. Its emissions will therefore continue to grow significantly in the next decade.
who can act now?Although the adoption of unilateral targets is encouraging, national efforts usually remain half-hearted in the absence of a binding global accord or the political will to mandate substantial CO2 reductions. Meanwhile, new parties operating below the national level are emerging in climate policy.
I CitiesPerhaps the most active among these are cities. Since an estimated 70 per cent of global emissions already come from urban areas, and hundreds of millions more people will move to cities in coming decades, efforts at the local level could be hugely significant. Many large metropolitan areas have adopted their own climate targets. London, for example, wants to reduce its emissions by 60 per cent by 2025 (from 1990s levels). New York seeks to cut its emissions by 80 per cent by 2050, and Rio de Janeiro by 20 per cent (both from 2005 levels). Many cities have also joined international clubs to rein force each other’s environmental efforts, such as the C40 Cities Climate Leadership Group or the global Compact of Mayors.
Most cities are focusing their climate policies on two areas: saving energy, for example by using more efficient lighting and better insulation of municipal buildings; and reducing emissions from transport, for example by encouraging car-pooling and ride-sharing or extending bike lanes and investing in cleaner public transport. Such programs will help cities to cut their consumption of electricity and fuel. But they are unlikely by themselves to dent global greenhouse gas emission levels, in part because most local efforts are likely to remain feeble unless they are part of an ambitious national framework.
London wants to cut its emissions by 60 per cent by 2025, and New York by 80 per cent by 2050
Most local efforts are likely to remain feeble unless they are part of an ambitious national framework
8,068number of climate measures that the C40 cities had implemented by late 2014
EU climate policy has also suffered setbacks. For example, the EU’s differ-ent targets for CO2 emissions, renewables and energy efficiency have proved hard to reconcile in practice. Such inconsistencies – together with the economic recession that started in 2008 and the fact that emissions permits have been oversupplied – have depressed the ETS carbon price to a level where it no longer offers an incentive for companies to invest in cleaner technologies (see figure 3.1). The EU has started various initiatives to improve its climate policies, and it is likely to remain at the forefront of global efforts to fight climate change in coming decades.
II The usClimate policy in the US looks very different from that of Europe. The US has relied much less on domestic climate legislation – and even less on international agreements – and more on regulations issued by the executive, mostly as amendments to the Clean Air Act. For example, the US has imposed binding standards on car emissions and is in the process of setting limits for heavy-duty vehicles and power plants. Nevertheless, these measures remain controversial. While they should help reduce emissions in the US, the results will not be dramatic – even if the regula-tions survive the inevitable legal and political challenges.
Meanwhile, the US has made no progress towards comprehensive climate change legislation. The last serious attempt to set up an emis-sions trading system (the American Clean Energy and Security Act, also known as the Waxman-Markey Bill) failed in 2009. No further attempts seem likely in the near future.
At the Copenhagen conference in 2009, the US promised to cut its emis-sions by 17 per cent by 2020, compared with 2005 levels. Despite the complexities of US climate policy, this target appears within reach, as emissions have already fallen well below 2005 levels. This reduction has been the result of CO2 limits under the Clean Air Act, other limits on toxic pollutants (that often reduce carbon emissions in the process) and, significantly, the shale gas boom that has allowed the US to switch from coal to cleaner natural gas.
III ChinaChina is currently the world’s biggest emitter of greenhouse gases (see
also chapter 5). While the country has been making significant efforts to shift its energy and industrial sector towards cleaner sources of power, it still relies on coal for about 70 per cent of its power generation and
Climate policy in the US has relied more on regulations issued by the executive
China has been experimenting with carbon pricing to get emissions down
62 63

On the positive side, the private sector has been driving the development of green technologies. Companies, however, will only invest in the devel-opment and deployment of such technologies when the incentives are right. Such incentives could come from a (reasonably high) carbon price, greenhouse gas regulations, other government action (such as subsidies) or consumer choice – when the green product can be easily distin-guished from other products. For example, the developers of mobile phones were successful because they offered a product that was both novel and useful compared with landline telephony. The providers of clean electricity cannot distinguish themselves in the same way: the customer who switches on the electricity at home does not usually know (or care) what the source of power is.
III non-governmental organizationsNon-governmental organizations (NGOs) have historically played three separate but interconnected roles in climate policy. Some of these groups have lobbied governments to take climate change seriously and act forcefully. They have had limited impact globally – although in some countries, particularly in Europe, they have managed to influence national policy.
Other NGOs have focused on analysis and research in order to counter those people or groups who either deny the science of climate change or assert that the costs of dealing with it would be so high as to ruin the national or global economy. These NGOs have been most prominent in high-income countries, especially the US.
Finally, NGOs have campaigned on specific issues. One example are the efforts of US NGOs to stop the Keystone pipeline designed to bring oil from the (very polluting) Canadian tar sands across the border. All three types of NGOs will continue their activities, but the public and direct campaigns will most likely become more prevalent as emissions continue to rise and governments remain unable or unwilling to address climate change effectively.
Policy will focus more on adaptationAs the consequences of climate change become more concrete around the globe, the focus of climate policy will broaden – from preventing global warming (mitigation) to building more resilient communities and dealing with the impacts of climate change (adaptation). Such efforts will require both global and national strategies and lots of investment.
The focus of climate policy will broaden, from preventing global warming to adapting to its consequences
The private sector has been driving the development of green technologies
21,000climate NGOs attended the UN climate meeting in Copenhagen in 2009II Companies
Many companies around the world have adopted voluntary emission reduction targets as part of their sustainable business practices. Typically, these targets have been based on what the company could reasonably hope to achieve through making its operations more efficient. Some firms have adopted – and met – ambitious reduction targets of 20 to 30 per cent. Nevertheless, as national governments have reinforced their climate agenda – be it through carbon pricing or regulations – many companies have reduced their voluntary efforts, or stopped them altogether.
Also, in most places, only a small share of the private sector has adopted climate targets. Traditional industries, including those in fossil fuel-dependent energy sectors and transport, have not been among the most enthusiastic adopters of CO2 reduction targets (with the exception of several major oil and gas companies). Instead, these industries have often led attempts to prevent their governments from adopting ambitious environmental policies. The efforts of the fossil fuel industries to preserve their market shares and profits have been remarkably successful in many countries. In the US, they have been the major obstacles to the passage of climate change legislation.
Traditional industries have not been among the most enthusiastic adopters of CO2 reduc-tion targets
64 65

In the period leading up to 2030, countries around the world will continue to build power plants and factories that burn fossil fuels. There is little chance that governments and companies, particularly in the developing world, will simply write off these investments (leaving power plants as “stranded assets”, see box 4). The only chance we have to contain the negative impact of these investments on the climate is by capturing the carbon they will emit. The technologies for this are being refined but are not yet widely used. With “carbon capture and storage” (CCS), the carbon emitted through burning fossil fuels is trapped, then buried underground. In some cases, the captured carbon might be recycled in productive ways, for example for use in chemicals or in oil extraction (this is called carbon capture, utilization and storage, or CCUS). What matters is that the carbon is not released into the atmosphere.
Governments must pay for pilot projects in these new technologies and encourage their wider roll-out. Once there is the prospect of a commer-cial market, companies will invest more in the development of CCS and CCUS technologies, bringing down costs over time. If governments and
The steady improve-ment in low-carbon technology is the one bright spot
Currently, only a few countries have (more or less effective) national strategies, and funding is grossly inadequate.
In coming decades, as the consequences of climate change become increasingly severe, governments will get more serious about increasing their country’s resilience. But this will also serve to worsen the dichot omy between richer and poorer nations. Developed countries are likely to be less affected by climate change but have more resources to deal with it. In the developing countries, however, the impact will be greater – as well as out of proportion to their contributions to climate change – and the costs of dealing with it will be prohibitive.
The critical role of technologySo here is what the world of 2030 is likely to look like: the impact of climate change will be increasingly tangible; global greenhouse gas emissions will still be on the rise; and policy responses will be inadequate, both in terms of mitigation and resilience.
Any realistic assessment of current and future policy efforts leads us to the critical role that technology will have to play in a more robust climate policy. The steady improvement in, and falling cost of, low-carbon or zero-carbon technology is the one bright spot in an otherwise rather gloomy global policy landscape (see figure 3.2).
figure 3.2 The cost of solar power
Source: Bundesverband Solarwirtschaft (BSW)
In developing countries, the impact of climate change will be greater and the costs of dealing with it will be prohibitive
€ per installed watt peak capacity
5
4
3
2
1
02007 2008 2009 2010 2011 2012 2013 2014
66 67

US – affordable for both consumers and industry. Most governments have found it impossible to shift away from cheap, reliable but polluting energy sources to cleaner supplies for which the technology, while available, remains either more expensive or less dependable.
Developing countries, meanwhile, have prioritized economic growth and improvements in living standards. Therefore, they also rely heavily on proven technologies and available resources. Most emerging market countries have increased – not decreased – their use of fossil fuels for power generation and transport, and have not invested much in newer, more expensive technologies.
Only strong government policies will divert us from our current path. The private sector will only make substantial investments in new techno-logies if the policy framework is clear, consistent, enduring and not vulnerable to changing political whims. Governments must pursue policies that mandate the use of new low-carbon technologies, prohibit the continued use of polluting technologies or – at least – provide strong incentives to shift toward cleaner ones.
Governments need to invest much more in the research, development and testing of new technologies and bring down costs of existing ones. And they must make clear that, the longer we wait to make these
Only strong government policies will divert us from our current path
companies fail to do this – and costs remain prohibitive – there is simply no way to restrain climate change and its negative effects.
We must also speed up the development of low-carbon sources of ener gy. While the technologies for solar and wind power have already improved signifi cantly, much work remains to be done before we can effectively store and transmit renewable energy despite its often intermittent supply. We must also focus on building the necessary infrastructure so that electric cars and other alternative-fuel vehicles can be more widely used. Again, the private sector and governments must work hand in hand to develop, refine and deploy such new technologies.
It is hard to see how we can contain climate change without retaining, and perhaps expanding, the generation of nuclear energy. Newer, safer technologies will be required here, including methods of nuclear waste disposal. But investment in such improvements will only take place if there is a clear policy framework that emphasizes the need to deploy low-carbon or carbon-free technologies, including nuclear.
Finally, we will need improved technologies to become more resilient to the consequences of climate change. In some cases, all that is needed is a change in strategy – for example, building more safeguards into a system so that services can still be provided even if there is a flood, heatwave or storm. In other areas, we will need new technologies – for example, something that will make it possible to shorten the time it takes to respond to a disaster. Some technological advances will help us both to cut carbon emissions and make our societies more resilient – such as new energy systems built on better distributed and renewable sources of power that emit less CO2. They will also be more able to withstand a hurricane or flood than a large, centralized system that requires power transmission over long distances.
governments must change courseOver the past two decades, weak, divided and dysfunctional govern-ments – particularly in many developed countries – have lacked the political will to move away from our fossil fuel-based systems. This paralysis has persisted even though we have become increasingly confident in the science of climate change and aware of its danger.
The basic truth is this: the use of fossil fuels for both electricity and transport has been reliable and – in many countries, particularly the
If governments and companies do not develop and deploy carbon capture and storage technologies, there is no way we will restrain climate change
435nuclear reactors were operational worldwide in 2014, with a further 71 under construction
68 %of global electricity came from oil, gas and coal in 2014
68 69

the actions necessary to change our path? One thing is clear: this shift will only happen if we, as educated, active and involved citizens, through our choices and actions, put pressure on governments and business.
We can vote for political candidates that take climate change seriously and promise practical but effective solutions. We can invest our savings in companies that sell and use green technologies. We can buy products from businesses that produce and market solutions to climate change. We can work with our employers to become environmentally responsi-ble partners in a sustainable supply chain. And we can support and lobby governments to take the necessary action.
Opinion polls today suggest that most people around the world realize that our climate is changing and that the consequences may be signifi-cant. For example, 70 per cent of US citizens think their government should limit the release of greenhouse gases from existing power plants (Washington Post/ABC News poll, June 2014). Nine out of 10 Europeans consider climate change “a serious problem” (European Commission survey, March 2014).
By 2030, as greenhouse gas emissions rise and the consequences become increasingly severe, the public is likely to become even more aware and concerned. We must translate this awareness into an organized, direct and persuasive call for action, so that politicians understand that their fortunes are tied directly to their efforts in limiting climate change and the damage it may cause. We need a combination of more rapid development and the implementation of low-carbon technologies, increasing awareness and a general understanding of the costs of climate change (both human and economic) and more active citizen engagement if we are to develop effective climate policies in the coming decades. This is certainly possible. Whether we achieve it or not is up to us.
Eileen Claussenis the Founder and past President of the Center for Climate and Energy Solutions (C2ES), formerly the Pew Center on Global Climate Change. Her other roles included Assistant Secretary of State for Oceans and International Environmental and Scientific Affairs, Director of the Office of Atmospheric Programs for the Environmental Protection Agency, Chair of the Montreal Protocol Multilateral Fund, and Senior Director for Global Environmental Affairs at the National Security Council.
changes, the more costly the transition will be. Not only will the damage from climate change become more severe, but the cost of stranded assets will also be substantial and increase over time if the policy is unclear or subject to change (see boxes 3 and 4).
It is hard to imagine that the world will return to a global, top-down approach to climate policy by 2030 or thereafter. Economic global ization will not be followed by political globalization. Yet economic globalization itself provides opportunities for climate policies. In a global market, both collaboration and competition (between governments and businesses) can stimulate the development of new technologies. To some degree, countries will also have to coordinate their climate messages and policies if change is to happen at the global level. But the greatest efforts will have to take place at the national level and, to some degree, at the subnational level.
The policy instruments available to governments are well understood: carbon pricing or regulation; significant investment in technology research, development and demonstration; more subsidies for the initial use of new technologies; and fewer subsidies for traditional, more polluting energy sources. If some of these measures could be coordi-nated across borders, the benefits would be greater. For example, a global levy on carbon – in the form of either a straightforward tax or the cap-and-trade system envisioned in the Kyoto Protocol – would be far more effective and efficient than scattered and inconsistent national or subnational schemes.
Local governments must focus on encouraging the use of low-carbon or zero-carbon technologies in the power and transport sectors. They must also invest much more time and money in helping their communities withstand the impact of climate change.
Just because we understand what needs to happen – in terms of policy and technology – does not mean that it will happen. Governments have often lacked the political will, and we still do not fully appreciate the consequences of inaction.
Our role as citizensThe basic question about the future of climate policy is: will the combina-tion of increasingly severe climate change (and the costs associated with it) and advances in technology be enough to make governments take
Economic globalization will not be followed by political globalization
$121 billionsubsidies to renewable energy worldwide in 2013
$548 billionsubsidies to fossil fuels worldwide in 2013
70 71

Developing systems that allow us to recycle more products and resources.
Developing and deploying new technologies to capture and store or use the carbon that is emitted by power plants and factories.
Some people argue that the world simply cannot afford to make the investments needed to reduce carbon emissions significantly. Electricity prices could soar, some traditional industries atrophy and many parts of the existing power sectors become obsolete (see box 4). Many people fear that effective climate policies will come at a huge cost in terms of economic growth and jobs, especially if countries do not all implement such policies simulta neously.
Others are using the climate policy debate to push for a wider agenda of economic change. Some left-wing activists, for example, argue that cli-mate change can be stopped only if capitalism itself is extensively reformed (see also chapter 4).
A new approach to the economics of climate changeOver the last decade, economists, scientists and business leaders have started thinking differently about the economics of climate change. In 2006, a widely discussed report (the Stern Review) calculated what it would cost the world to adopt effective climate policies quickly. It compared these investments with what it would cost if the global community acted late or not at all – and therefore suffered the consequences of unabated climate change.1 The report demonstrated clearly that the benefits of early action would outweigh the immediate investments. More importantly, it showed that late action, let alone inaction, carries the risk of unbearably high costs.
Many people and their governments have since realized that new, low- carbon technologies can be a promising business opportunity. In the period 2010 to 2013, almost $1 trillion was invested in renewable energy. In 2013, over 40 per cent of the new power capacity installed worldwide was linked to renewable sources.2 While Germany’s groundbreaking feed-in tariffs have done much to spread renewable technologies, China now invests more in renewable energy than the entire European Union and it is also the world’s biggest producer of solar panels.
Climate change represents a threat to our world and our way of life. That much we know. We also know what we need to do to contain global warm-ing, at least in theory. In practice, we shun the costs that we think are associ-ated with moving to a greener economy.
An effective climate change strategy would require investments and profound change in many sectors of our economies. For example:
Shifting our energy systems from coal, oil and gas to renewable sources. Developing and distributing new technologies for storing energy. Since
the wind does not always blow, nor the sun always shine, we will only be able to rely fully on renewables once we know how to store the energy they generate.
Changing our transport systems. This includes more extensive and greener public transport; developing electric and solar vehicles while phasing out cars fueled by oil; and a smarter traffic infrastructure that includes, for example, recharging stations for electric cars.
Making our industries more efficient and improving our houses so that we use much less energy.
Can climate protection boost growth and jobs?
by Thomas Liesch and Stefan Geutler
BOx 3
72 73

For example, the International Energy Agency calculated that, if the world invested roughly $12 trillion into energy-efficiency measures, it could halve its energy use by 2035. Countries would then need to spend less on buying fuel and building energy supply infrastructure. The resulting savings would be almost twice as high as the investments.4
Another study found that, if Japan increased the share of renewable sources in its total energy consumption to 16 per cent by 2030 (from less than 5 per cent today), the benefits would be two to three times greater than the investment costs. The savings would come from lower import expenditures for oil, gas and coal; the health and environmental benefits of lower CO2 emissions; and the wider benefits for the economy from local value creation and technological innovation.5
Clean technology can also be good for the job market. One study found that every $1 million invested in renewable energies creates more jobs than if the same money is spent on nuclear energy or the oil, gas and coal sectors.6
The longer it takes the world to get serious about climate action, the higher the costs will be. Emissions will continue to rise, with the result that the action required to offset global warming will become more extensive, with mea-sures needing to be implemented with much greater urgency. For example, all “dirty” power plants would then have to be shut down very quickly. The Intergovernmental Panel on Climate Change calculated that the most cost-efficient path to preventing global warming would require carbon emissions to peak no later than 2020. If the world delayed significant emission cuts to 2030, the costs of reducing CO2 would rise by almost 50 per cent.
Thomas Liesch, Allianz Climate SolutionsStefan Geutler, Allianz Climate Solutions and University of Bayreuth
1 Nicholas Stern, Stern Review: The Economics of Climate Change, HM Treasury, London, 2006.
2 Excluding large hydro projects. Frankfurt School, FS-UNEP Collaborating Centre for Climate & Sustainable Energy Finance, Global Trends in Renewable Energy Investment 2014, Bloomberg, 2014.
3 New Climate Economy, Better Growth, Better Climate, 2014.
4 International Energy Agency, World Energy Outlook, 2012.
5 Japanese Ministry of Environment, “Costs and Effects of the Deployment of Renewable Energies”, 2008.
6 International Renewable Energy Agency, Rethinking Energy 2014, 2014.
Against this background, the discussion about the economics of climate change has progressed further. Economists no longer focus solely on the costs of climate action but on the opportunities associated with changing our economies. Today’s debate focuses on two questions. First, can policies that support green investments help revive the world economy? Second, if this is so, what action do we need to take in order to reap the benefits?
In 2013, a group of former heads of states and finance ministers as well as high officials and business leaders from all parts of the world got together to revisit the link between climate action and growth. They asked research insti-tutes and economists from around the world to prepare a report on the sub-ject. This report – Better Growth, Better Climate – presented in September 2014, argues strongly that effective climate action would not be hugely expensive. On the contrary, it would be good for growth.3
The report identifies measures that would be relatively easy and cheap to implement but could deliver sizeable benefits in terms of productivity and growth. The measures include improvements in energy efficiency, more productive land use and making cities greener and more compact.
The investments needed are not hugeThe world will in any case have to invest around $90 trillion until 2030 to keep its existing infrastructure intact and expand it to cope with population growth, urbanization and economic development. Against this background, the additional investment needed to keep global warming below 2 degrees C would be remarkably low.
If these climate investments were made early, the total additional sums required globally would be only $4 trillion by 2030, or $270 billion a year.2 Since much of the new, low-carbon infrastructure would be more efficient, operating costs would be lower – so at least some of the new infrastructure would pay for itself. These green investments would also bring additional benefits such as cleaner air, improved health, better protection of plants and animals and increased energy security.
Other studies have also come to the conclusion that the benefits of climate investments would be greater than the costs.
74 75

In 1896, the Swedish scientist Svante Arrhenius was the first to publish a quantitative estimate of how much the world would warm if industrial activities increased the concentrations of carbon dioxide in the atmo-sphere. His estimate was roughly the same as that generated today by climate models running on the world latest supercomputers. Yet Arrhenius was not troubled by industrial pollution as we are today. Instead he speculated about a virtuous circle in which warming caused by the carbon accumulating from burning coal would warm the world, spreading the limits of agriculture northward and so help to feed a growing population.
We draw a simple lesson from Arrhenius: understanding of the basic science linking CO2 and climate change has remained remarkably con-stant while the social context of this obstinate fact has changed hugely over the century.
Will solar geoengineering help us manage the risks of climate change?by David Keith and Andy Parker
CHAPTer 4
77

The basic science is simple and well understood. Large volcanic eruptions can blast millions of tons of sulphur into the upper atmosphere (strato-sphere). Tiny sulphate particles (also known as aerosols) remain in the stratosphere for a year or two and reflect away a small amount of sunlight, which cools the planet. The last time this happened was the eruption of Mount Pinatubo in the Philippines in 1991, which caused global tempera-tures to drop by about half a degree C for a year.
Faced with a warming planet, increasing CO2 emissions and stalled climate talks, scientists are asking if it might be possible to add aerosols to the stratosphere to slow down global warming. And if so, what the effects (both desirable and undesirable) might be.
Even if humanity elimi-nated carbon emissions tomorrow, the planet would continue warming for decades
In this chapter, we speculate about the future of solar geoengineering – also called solar radiation management or SRM.
SRM is a proposal for cooling the planet by reflecting sunlight away from the earth (of which more below), and it looks likely to overshadow nucle-ar energy and shale gas as the most controversial issue in climate politics. Here we look out to the year 2035 and, to make our discussion concrete, we assume that someone will deploy solar geoengineering that year. We make an (unrealistic) assumption that scientific understanding of SRM will remain identical to today. This assumption allows us to con-centrate on how political ideology and geopolitics might influence the development of geoengineering. We want to show how the very same act of deployment could have greatly different implications, depending on who does it and how.
The risks and opportunities of solar geoengineeringThe basic facts of climate change are painfully simple. From the telegraph and railroad to the smartphone and jet airliner, fossil energy – coal, gas and oil – has energized the rise of industrial civilization. Use of fossil fuels has involved the transfer of carbon from deep underground to the at mosphere, where it lingers for centuries and drives global warming.
The only way to stop the long-term rise of carbon dioxide concentrations is to stop adding carbon to the atmosphere. This means bringing emis-sions to zero, which in turn requires transformation of our systems of transportation, energy production and agriculture. This transformation is entirely possible. The world’s failure to restrain emissions is not a forced choice, but rather a collective decision to extract the maximum benefits of cheap energy today while passing along the risky consequences of our actions to future generations. In our view, the failure to act represents an acute moral failure on the part of those in the best position to act: the world’s richest and most powerful.
Even if humanity eliminated carbon emissions tomorrow, the planet would continue warming for decades and would remain warmer for thousands of years. This leaves us with a rather disagreeable reality: should we wish to stop global warming before emissions cuts take effect – and at the current rate of decarbonization, that could be many, many decades – then solar geoengineering is our only option. It is in this context that Eli Kintisch, author of one of the first books on geoen-gineering, described it as “a bad idea whose time has come”.
Solar geoengineering looks likely to over-shadow nuclear energy and shale gas as the most controversial issue in climate politics
78 79

Solar geoengineer-ing would only ever mask the problem of accumulating greenhouse gases rather than treating its cause
of lower average temperatures and less extreme rainfall pattern, than a world where SRM was not used.
It is certain that there would be some side effects: possibilities include delays in the regeneration of the ozone layer, hazier skies, and some areas with slightly worse weather than they would have had otherwise. But in general, our current understanding indicates that the drawbacks would be greatly outweighed by the benefit of reducing the impacts of climate change.
Politics will be as important as scienceThe potential socio-political consequences may, however, be more worrying than the physical effects. SRM would only ever mask the problem of global warming rather than treating its cause. It is not yet clear to what extent the idea of SRM might distract people from tradi-tional action to fight climate change.
Some people also fear that, over time, irresistible political momentum might build for larger and larger research projects and possibly even deployment, regardless of what is learned from research results. On top of all of this, we must ask hard questions about the use of SRM. Who would get to decide about deployment, and how? How could liability and compensation schemes work to resolve claims for damages from people who believe that they have been harmed by climate engineering (from an extreme weather event, for example)? What would demo cratic decision-making look like for an inherently global technology?
Given all these risks and uncertainties, it is clear that SRM can never be the sole solution to climate change. Climate change is far too complex to be addressed by just one solution, either technical or social. But it would be a risky gamble to dismiss SRM out of hand. The earth will continue warming for decades (at the very least), and the world’s most vulnerable people are already beginning to suffer the consequences. Climate change will have many consequences that we cannot avoid through adjustment and adaptation, for example the loss of Arctic ecosystems or low-lying lands that will be inundated by rising seas.
The large risks of climate change, plus the risks and uncertainties of solar geoengineering, place us in a risk/risk scenario. There are obvious risks from developing SRM (such as possible effects on weather patterns and ozone) but there are also significant risks from not developing it
Solar geoengineering is in fact not a new idea. When the threat of climate change was first brought to the attention of then US President Lyndon Johnson in 1965, his advisers proposed blocking out a small amount of sunlight as a possible solution. For decades the topic remained a taboo amongst climate scientists, who feared that even researching and discussing the idea could prove a dangerous distraction from the need to reduce carbon emissions. In the last decade, however, fueled by concerns over how best to minimize the risks of the climate change we are already facing, geoengineering has moved from the margins to the mainstream and is now being seriously researched.
Even though funding levels are still very low (probably less than $40 million has been spent on research around the world to date), there are research projects or programs in the US, China, Japan, India and various EU countries. Almost all research has so far taken place in doors, in studies and laboratories, rather than outdoors in the field. Geo engineering research is not only conducted in the areas of climate modeling and atmospheric chemistry but also in politics, law, philo sophy and eco nomics. In 2013, for the first time, there were more publications about solar geoengineering in the fields of social sciences than in physical sciences.
Calls are increasing to do more small-scale field experiments to better understand what the possible benefits and drawbacks might be, but so far most governments have been timid about investing in SRM research.
At this stage, engineers are arguing over how such deliberate cooling of temperatures might best be achieved, whether with planes or balloons spraying sulphates or perhaps a tailor-made nanoparticle. But it does seem possible to spray aerosols into the stratosphere, where they would circulate the planet and reflect away sunlight for a year or two. It also seems that this would be extremely cheap, with a projected price tag of a few billion dollars per year.
Whether we could deploy SRM is one question, whether we should deploy it is something entirely different. Understanding the potential physical and socio-political consequences is a huge challenge.
Computer models of the potential climate impacts of SRM have produced some encouraging results. A growing body of research indicates that a world in which SRM were used would be much more palatable, because
Solar geoengineering would be extremely cheap, with a projected price tag of a few billion dollars a year
$40 millionestimated amount spent on research on solar geoengineering worldwide
1965the year in which solar geoengineering was first discussed in US politics
80 81

(our vulnerability to the damaging consequences of climate change that are already emerging and to which we cannot adapt).
In this situation of uncertainty, it is hard to overstate the importance of the manner in which SRM is perceived, researched and developed.
Predictions about geoengineering – about any complex technology – are most probably doomed to ignominious failure. There are huge uncer-tainties, not only about the science, but also about the roiling morass of political power, social relations, beliefs, norms, hopes and fears in which the science is developing. This is not to say that projections are useless. Even if they turn out to be wrong, they are needed to fuel debate about the decisions that will shape the future.
At the Climate Engineering Conference 2014 (the largest conference yet held on the topic of geoengineering), writer Jamais Cascio pointed out that projections will probably be wrong, but that they can be wrong in a useful way. Where projections are based on sound analysis, even when proved comically wrong, they can encourage thought on the forces that might produce more or less desirable outcomes. The reader will judge whether the analysis here is sound, but we have tried to identify factors that could be influential in the use of SRM.
Political scenarios for the use of solar geoengineering As outlined above, there are great uncertainties in both the scientific and socio-political dimensions of SRM. To keep our analysis manageable, we assume that the science remains stuck and that SRM will work in line with our current understanding until 2035:
It would be cheap to deploy. It would generally reduce the impacts that global warming is set to
have on temperatures and rainfall patterns in all regions of the world. There would be some side effects but these would be outweighed
by the positive impacts.
It is worth restating with unambiguous clarity that SRM is highly unlikely to work exactly in this way. The taboos surrounding SRM research means that very little effort has been expended to improve the technology. As these taboos are lifted and the research community expands, new inno-vation will likely overturn our conception of SRM. But assumptions are necessary for manageable analysis.
We need projections – even if wrong – to fuel debate about the decisions that will shape the future
83

warming effects of increased greenhouse gas concentrations while doing nothing to address emissions. While it might be useful for reducing climate risk in the short term, SRM cannot be a complete solution to climate change.
If right-wing ideology dominates the development of geoengineering up until our projected deployment date in 2035, then SRM will have dis-tracted attention from fighting climate change and dealing with its consequences. Such a distraction would increase environmental risk as the world would then have to use much more SRM and for longer in an effort to maintain the balance between cooling and warming effects, until such time as atmospheric carbon concentrations could finally be brought under control.
Moreover, if SRM is seen as a substitute for coordinated, meaningful emission cuts, the global climate policy landscape will be much more antagonistic. Trust between countries and governments will be low, and effective international cooperation on developing and using SRM will be very difficult. (Below we explain why international cooperation will be vital for the effective use of SRM.)
II The left-wing debateAs the right wing of the political spectrum has warmed to the idea of solar geoengineering, some on the left wing have moved into short-sighted, knee-jerk opposition. In part, this opposition is driven by the rea-sonable fear that right-wing ideologues might use the prospect of SRM to avoid climate change action. But some on the left are also frustrated that SRM threatens their view of climate change as a vehicle for other political goals, notably overhauling the way the global economy works.
At least some people on the left have supported traditional climate policy (such as carbon taxes or reducing consumption) because they hope that such measures could also be a direct challenge to the excesses of corporate capitalism. According to anti-capitalist author and activist Naomi Klein, climate change is “the best argument progressives ever had … to block harmful free trade deals”. This may be so, and making the economic system more just is a goal that both authors of this chapter share. But climate change is first and foremost an immediate and grow-ing threat to vulnerable people and nature. It would be dangerous to mislead people that useful action to reduce climate risk can only come from overhauling the global economic system.
Extrapolating from our assumptions about the science of SRM, our starting premise is that, in the year 2035, solar geoengineering will be deployed. The rationale is that at least one country will find the prospect of a cheap, instantaneous way of mitigating warming too much to resist. We use this basic premise to explore how political ideologies and geo-politics might influence the use of SRM.
The political history of climate change has shown the extent to which science can be distorted to suit pre-existing political ideology. This tendency has been particularly strong for right-wing commentators, think-tanks and publications that have a sorry track record of denying that climate change is happening or is man-made.
Geoengineering already appears to be following the same path. Sections of not only the right but also the left-wing political spectrum are seeking to contort the available evidence to match their beliefs. Ideology will shape our understanding and use of geoengineering. To understand how this might happen, we examine the topic’s recent history and speculate about its future.
I The right-wing debateRight-wing ideologues, with a history of global warming skepticism, are already promoting geoengineering as a way of addressing climate change without emissions cuts. In the US, the Heartland Institute, a conservative Chicago think-tank, and the Republican politician Newt Gingrich, have already started promoting SRM as a possible climate solution, as has Madsen Pirie, President of the free-market Adam Smith Institute in the UK.
The argument is simple and seductive: why bother with the hassle and expense of decarbonizing the economy over decades while geoengi-neering would allow us to affect temperatures now?
The seamless switch from climate change denial to the embrace of geo-engineering stems from a false skepticism about global warming. This skepticism was not born of genuine doubts about science. Rather, climate skeptics fear that the actions needed to deal with climate change present a threat to the agenda of small government and deregulation.
To think about geoengineering as a substitute for climate action is dangerous. We know that solar geoengineering would only mask the
Right-wing ideologues are already promoting geoengineering as a way of addressing climate change without emis-sions cuts
84 85

the potential risks of SRM, but are deeply cavalier to dismiss it outright, given the scale of the problem of climate change.
Some organizations have gone even further. ETC Group, an anti-tech-nology pressure group, has campaigned aggressively against geo-engineering science and scientists for years. It has pushed hard (but unsuccessfully) for a ban on “all geoengineering activities” at the United Nations Convention on Biological Diversity. The potential impact of more radical organizations should be a genuine concern for anyone who favors evidence-based and open public debate.
If left-wing ideological opposition to SRM is successful at stopping, delay-ing or severely hampering research on SRM, the technology could still be deployed in 2035, but it might then be poorly controlled and more dangerous.
The basic characteristics of SRM mean that at least some people, proba-bly some countries, will want to deploy the technology by 2035, if only out of desperation. Without proper research on SRM, the drive for its deployment might even be stronger since facts would not be available to counter blind, fear-fueled determination. But it would then be far less likely that the use of SRM would be widely agreed, carefully planned and well controlled.
III The political outlookThe more controversial and rigid elements of left and right will feed off each other, each seeking to polarize the debate. Such a debate will get the opponents of SRM into the news but it will undermine well-informed decision-making. The more that the right-wing “SRM is the solution to climate change” narrative prevails, the greater the risk that climate miti-gation will be sidelined. Long-term climate risks would then increase. Equally, the greater the success of those on the left who oppose even research, the greater the chances that SRM will be sidelined, denying the most vulnerable a chance to temper short-term climate risk.
The geopolitics of geoengineeringDecisions over SRM will not be based simply on political battles within countries because (at least for the foreseeable future) decision-making powers over climate engineering are likely to be the preserve of nation states.
If research on SRM was stopped, the technology could still be deployed, but it might then be poorly controlled and more dangerous
Like some other contentious environmental technologies (such as carbon capture and storage and nuclear power), SRM may help reduce the risks of global warming without doing anything to change the global eco-nomic system. This is perhaps why it has met with some fierce opposition on the left.
Naomi Klein took an entire chapter of her recent book to oppose SRM, particularly by attacking the science and scientists with half-truths, cherry-picked facts and misleading insinuations. Some center-left politi-cians have also been skeptical, for example former US Vice President Al Gore, who has described solar geoengineering as “insane, utterly mad and delusional in the extreme”. Left-wing critics are right to be wary of
Some technologies might help reduce the risks of global warming without changing the global economic system
86 87

Academics have only recently started to think seriously about how the deployment of SRM could play out in our chaotic, multipolar international system, but theories are starting to emerge.
SRM would be very cheap to use, which could make it possible for a single state to deploy the technology unilaterally, without international coordination. The effects of SRM, however, would not stop at state boundaries.
It seems inescapable that some countries will want more SRM, some less, and others will want none at all. Harvard economist Marty Weitzman characterizes this as a “free driver” problem, in contrast to the classic “free rider” problem that bedevils efforts to cut CO2 emissions. If the use of SRM was so cheap as to be an option open to all, then the state wanting the greatest degree of cooling might be the only one to get its wish, and all others might be “oversupplied” with cooling. This would be the exact opposite of the “undersupply” of emissions cuts in the fight against climate change (see chapter 1).
Other researchers have argued that it might be hard for an individual state to deploy SRM in the face of opposition from powerful neighbors. Nevertheless, a sufficiently strong coalition of countries might have the political clout to use SRM regardless of opposition from others. The members of this coalition might have an interest in keeping the group as small as possible to retain maximum influence over where to set the global thermostat.
The idea that individual countries could use solar geoengineering with-out further coordination initially looks alarming. But we think this risk is overblown. Powerful nations could probably use the traditional tools of statecraft to try to dissuade any one state that intended to deploy SRM on its own. But if research continues to show that SRM would be benefi-cial, it seems likely that big countries, too, would also want to play a role in deployment.
Many people may also think that traditional power relations will hold sway when it comes to the use of this technology, with the richest coun-tries deploying SRM against the will of the developing world. It would certainly be understandable if developing countries were initially suspi-cious of the SRM, as the basic facts are fairly damning: this is a technology conceived in the global North to address a problem that was largely
If solar geoengineering was so cheap as to be an option for all, then the world might get an oversupply of cooling
88

verifiable agreement on cutting carbon emissions. In such an environ-ment, the chances of international cooperation over, and trust in, geoengineering would be much diminished. Similarly, if developing countries are not empowered to take part in geoengineering discussions and research early on, and their opposition to SRM becomes entrenched, SRM deployment will lack legitimacy and opposition will be fierce.
Discussion of solar geoengineering tends to gravitate to the eye-catching technical details. Yet the who and the how matter as much as the what when it comes to the use of geoengineering. We have used unrealistic and rigid assumptions to accentuate some of the ways in which the same physical deployment of SRM could be cast in very different lights de pending on the circumstances and the political forces shaping them.
The siren calls of ideologues on either side of the political spectrum must be resisted. No one yet knows enough to say that SRM should be used or should be rejected. Those who seek to prevent SRM research are taking an unnecessary gamble with the lives of the world’s most vul-nerable people. Those who say SRM obviates the need for tackling carbon emissions are taking a risk with the long-term health of the planet. Thankfully, there are plenty of people from diverse political backgrounds who recognize the large potential risks from the develop-ment of this technology, but also recognize the large risks from not developing it. These people are concerning themselves with the more pressing and practical questions of how research and development should be governed to ensure accountability, transparency and safety.
It will be crucial to internationalize SRM research from an early stage. Establishment of cooperative research programs and shared governance standards can help create the conditions for international agreement, which will be necessary for large-scale research and deployment. Developing countries must be involved. People in the global South probably have the most to gain or to lose from solar geoengineering. But they also have the reasonable right to be suspicious of a technology being developed by the same rich countries that caused most of the climate change being experienced today, and who have done little to fulfil their responsibilities to decarbonize. It is therefore very important to secure their early participation – or active leadership – in research, governance and international discussions.
Those who seek to prevent SRM research are taking an unneces-sary gamble with the lives of the world’s most vulnerable people
created by the global North. The North has done little to address the problem it created and could try to sidestep its responsibilities altogether through use of the technology. In this light, skepticism from the South may seem inevitable.
We believe, however, that developing countries will be the most likely to demand deployment of solar geoengineering. The worst impacts of cli-mate change are expected to hit developing countries, which are often least able to cope with environmental change. If the science continues to indicate that SRM could relieve the worst effects of global warming, there will be pressure from the global South to use geoengineering. In addition, it is expected that the global economy will have doubled by the early 2030s, with the highest growth rates among developing countries and emerging economies. Where developed countries are not taking action on the climate, developing countries might feel both justified and empowered to start taking matters into their own hands.
The use of solar geoengineering – what happens next?Even if SRM were used successfully to stop all planetary warming, there would still be storms, floods and droughts afterwards. After all, extreme weather was around long before humanity first put spark to tinder, tilled the earth or sent sulphate-laden jets to the stratosphere.
But current modeling studies suggest that SRM could improve tempera-tures and precipitation in almost all regions of the planet. Yet, even if the vast majority of areas enjoyed a more palatable climate, some people would suffer extreme weather events that they would not otherwise have experienced. The problem is that it would not be possible to say who would be affected and how with any degree of confidence.
These uncertainties will have a large effect on the public perception of solar geoengineering. Just as today people question whether a hurricane or drought was the result of global warming, people would wonder whether a major typhoon or heatwave was linked to use of solar geo-engineering.
If ideological opposition to SRM severely hampers research, SRM may in future be deployed in a panicked or improvised manner, without international norms or governance institutions having been established. Alternatively if SRM is used to distract attention from the need to reduce emissions, deployment may take place without a solid, binding and
People might ques-tion whether a major typhoon or heatwave was linked to solar geoengineering
Developing countries will be the most likely to demand deployment of solar geoengineering
90 91

The world still runs on fossil fuels. This is not compatible with arresting global warming. But if we do get serious about fighting climate change, what will happen to our existing oil platforms, gas pipelines and coal-fired power stations? Will they get “stranded”?1
Despite years of efforts to shift our power sectors to cleaner sources of energy, 68 per cent of global electricity production still comes from oil, coal and gas. By contrast, wind, solar power, water and other renewable sources of energy account for only 20 per cent.2 In principle, governments have agreed to limit global warming to 2 degrees C compared with pre-industrial times. To stick to this limit would mean emitting only a certain amount of carbon into the atmosphere. We could think of this as the carbon “budget” that we are free to spend. By 2011, we had already spent half of our available carbon budget, mostly through burning fossil reserves (see chart)3. This means that the other half of the carbon budget must last for humankind’s entire future.
Will climate policy leave our energy invest-
ments stranded?
by David Fischer
BOx 4
Finally, it is worth repeating that the science of SRM will most likely surprise us. Extrapolating from current understanding served our pur-pose here, but we do not expect the science to develop along a smooth trajectory. There are many surprises ahead in the social and natural sciences that cannot be guessed at this early stage. Only continued research will help us understand them. Such understanding will help us decide whether the use of solar geoengineering is indeed a bad idea whose time has come, or just a plain bad idea.
David Keithhas worked at the interface between climate science, energy technology and public policy for 20 years. He is Gordon McKay Professor of Applied Physics in the School of Engineering and Applied Sciences (SEAS) at Harvard University as well as Professor of Public Policy at the Harvard Kennedy School. As a technology developer and innovator, he has built a high-accuracy infrared spectrometer for NASA’s ER-2 high-altitude airplane and developed new methods for reservoir engineering to increase the safety of stored CO2. Prof Keith has received the MIT’s Prize for Excellence in experimental physics, and was listed as one of TIME magazine’s Heroes of the Environment 2009.
Andy Parkeris a Research Fellow at the Institute for Advanced Sustainability Studies in Potsdam. His research focuses on the politics and governance of research into solar geo-engineering. He has worked on geoengineering for over six years, including as a Research Fellow in the Harvard Kennedy School and as a Senior Policy Adviser at the British Royal Society, where he led the production of the seminal 2009 report “Geoengineering the climate” and the development of the Solar Radiation Manage-ment Governance Initiative. He was also a member of the UN Convention on Bio-logical Diversity’s expert working group on geoengineering.
92 93

If we want to get serious about fighting climate change, we simply cannot afford to burn all those fossil fuels that we are now getting ready to access. On the other hand, if we leave the oil, coal and gas in the ground, some investments in the fossil fuel sector will, by definition, become unprof itable – they will turn into “stranded assets”. How quickly and comprehensively this stranding takes place will depend on the roll-out of renewable energy technologies worldwide, the pace of regulatory action and the shift in market dynamics. If we were serious about achieving the 2 degree C target, the amount of investments stranded in fossil fuels over the next 20 years could be $300 billion.5
For energy companies – and their investors – these developments could pose significant risks and uncertainties. For example, if we already had more stringent climate policies and better technologies in place today, the market capitalization of major European oil companies could drop by 40 to 60 per cent, according to 2013 estimates.6 Investments in more expensive and very polluting fossil fuel projects are most at risk, for example those exploring unconventional sources such as tight gas or oil sands.
Today, the risk of stranded fossil fuel assets might seem remote. But energy companies often plan their investments decades ahead. They should take these issues seriously today. So should financial investors, who face the decision whether they can still afford to invest in fossil fuel companies, the value of which may decline in the future. They owe this foresight to their customers, many of whom rely on such investments for their old-age pensions. In the end, however, only a clearer policy framework can help solve these dilemmas.
David Fischer, Allianz Climate Solutions and Oxford University
1 See also University of Oxford’s “Stranded Assets Programme”; http://www.smithschool.ox.ac.uk/research/stranded-assets/
2 International Energy Agency, World Energy Outlook 2013.
3 University of Cambridge Programme for Sustainability Leadership, 2013.
4 International Energy Agency, World Energy Investment Outlook, 2014.
5 Ibid.6 HSBC, “Oil & carbon revisited”, 2013
It is clear that governments will have to put stricter constraints on the use of oil, gas and coal. Most people work on the assumption that there will be significant shifts in the world’s energy landscape after around 2020. Techno-logical advances and stricter climate policies will push up the share of renew-ables in the power sector, while fossil fuels are expected to lose ground. Public pressure is also building. Campaigners are calling on big investment companies to pull their money out of oil, coal and gas ventures as well as traditional utilities, and instead channel it into cleaner energy projects.
Although these trends are obvious, the world’s big energy companies keep investing billions into acquiring and developing new oil wells and gas fields, building new pipelines and erecting power plants that run on fossil fuels. In 2013, almost a trillion dollars was invested in projects aimed at burning fossil fuels. This is four times more money than went into renewables.4 These fossil fuel investments will only pay off if prices for oil, gas and coal stay high. Prices will only stay high if the world keeps burning as much fossil fuel as it is today, and no major additional oil or gas discoveries are made in the future.
Our carbon budget for
2°C Carbon budget we have left
nowstart of industrial era
2°C
Carbon budget we have spent
By 2011, we had already
emitted half of our allowance
94 95

China is currently the world’s biggest emitter of greenhouse gas emissions in absolute terms. Even in per capita terms, China’s emissions are now higher than the EU’s. If China stays on its current course, the fight against climate change cannot be won. The Chinese government has so far been reluctant to agree to binding emissions targets in international climate talks. But profound shifts are happening within China that could – if sustained and successful – change the course of China’s development and prove pivotal in the fight against global warming.
Even though China was a latecomer to industrialization, it has followed the same path towards economic development as the wealthy devel oped countries. In the last few decades, China has not only impressed the world with its rapid economic growth but also dismayed it with an un precedented increase in resource consumption and the environ men-tal pollution associated with it.
How China could lead in the fight against climate changeby Pan Jiahua
CHAPTer 5
97

If we look at emissions per capita, the trajectory looks similar, but there is a huge disparity between the developed and developing countries (figure 5.2). Up to the end of the 20th century, per capita emissions in wealthy, developed nations were around 10 times higher than those of developing countries. Since the 1980s, the growth in per capita emissions in the developed world halted, then reversed. China’s per capita emis-sions, on the other hand, have increased fivefold since 1971, and rose particularly rapidly over the past decade. In 2014, China’s emissions per capita had overtaken those of the EU; by 2020, they should reach the OECD average (which also includes the US, with its much higher per capita emissions level).
In the period up to 2030, China’s energy-related CO2 emissions will grow almost twice as fast as the world average (3.1 per cent, compared with 1.6 per cent) while those of the US will hardly grow at all. Unless China changes its policies, its CO2 emissions will double by 2050 to reach over 16 gigatons (which is about half of what the whole world emits today).
If China started using new energy technologies on a grand scale after 2030, it could cut emissions by almost 12 gigatons by 2050. This compari-son shows that China’s future emissions – and therefore the future of the world’s climate – depend on the path of development it chooses today.1
China’s emissions per capita have increased fivefold since 1971
figure 5.2 CO2 emissions per capita
Source: World Bank Development Indicators China eu India us
In metric tons
25
20
15
10
5
01960 1970 1980 1990 2000 2010
The environmental challenges we are now facing, within China and globally, indicate that China cannot possibly continue its industri al-ization and urbanization by following the same approach as the developed world. We can only tackle climate change if we change our entire model of development. We must move away from the established paradigm of an industrial civilization and towards what I call an “ecological civili zation”. Unbeknown to many, this paradigm shift has already started in China.
The trends and driversIn 1971, less than half a century ago, China’s greenhouse gas emissions amounted to a small fraction of the global total (less than 6 per cent). Emissions rose gradually until the late 1970s, then started to explode as reforms and efforts to open up the economy led to much faster industrialization. By 2006, China had become the world’s biggest emitter of greenhouse gases (figure 5.1). Since 2010, China alone has been responsible for over a quarter of the world’s total CO2 emissions. While emissions growth in most developed countries halted or reversed in the wake of the financial crisis and ensuing recession, those of emerging economies – including China and India – have continued to grow briskly.
5.7 %China’s share in global greenhouse gas emissions in 1971
29 %China’s share in global greenhouse gas emissions in 2012
figure 5.1 Total CO2 emissions
Source: World Bank Development Indicators China eu India us
In kilo tons
7,000,000
6,000,000
5,000,000
4,000,000
3,000,000
2,000,000
1,000,000
01960 1970 1980 1990 2000 2010
98 99

Chinese incomes are supposed to reach the level of the rich developed countries. That implies another doubling of per capita income from 2020 levels.
II Heavy industries dominate the economyChina’s phenomenal growth could not have been achieved without a profound change in the structure of its economy. In the early 1980s, manufacturing and industry accounted for 48 per cent of the economy, according to official statistics. Agriculture3 accounted for about 28 per cent and services for only 24 per cent. By 2013, industry’s share of the economy had remained relatively stable, at 44 per cent of total GDP. In the same period, agriculture’s portion of the economy had fallen to 10 per cent, while that of services had grown to 46 per cent.
Nevertheless, compared with the wealthy developed countries, China’s economy remains heavily dominated by energy and resource-intensive manufacturing. In the US, for example, services made up 79 per cent of the economy in 2013. Even with regard to current trends, by 2030 the proportion of services in China’s economy will still be smaller than it was in the US in the 1960s.
This heavy industrialization is one of the main reasons for China’s high CO2 emissions. Of the total amount of electricity consumed in 2012 (around 5 trillion kilowatt hours), almost three quarters were gobbled up by the industrial sector. The services sector accounted for 11.5 per cent, households slightly more than that, and agriculture for only 2 per cent of total energy consumption.4
III most energy comes from coalChina has enormous coal reserves, so it is not surprising that it has been relying on coal for more than two-thirds of its primary energy consump-tion up to now. Only 8 per cent of Chinese energy is generated from non-fossil fuels (renewables and nuclear energy). The rest comes from oil and, to a lesser extent, gas.5
The burning of coal emits about twice as much CO2 as natural gas for each unit of power generated, and also substantially more than oil. At the Copenhagen climate summit in 2009, the Chinese government announced its plan to increase the portion of non-fossil fuels to 15 per cent of total energy consumption by 2020. But the share of coal would be still over 60 per cent in that year.
By 2030, the share of services in China’s economy will still be smaller than it was in the US in the 1960s
44 %share of industry in China’s economy in 2013
14 %share of industry in the UK economy in 2013
where China’s emissions come fromIf we analyze the factors that are driving China’s high emissions, we can see where there is room for change:
I growth is the prioritySince the economic reforms and opening-up of the late 1970s, China’s economy has been growing at a nearly double-digit rate. In 2014, China overtook the US to to become the world’s biggest economy on one measure – much earlier than most economists had expected.2
Although growth is likely to slow down somewhat in the future, official announcements indicate that it will remain a priority. The ruling Communist Party decided in 2012 that income levels should double between 2010 and 2020. To reach this goal, China’s GDP must grow by 7.5 per cent every year during this decade. And by 2049 – the year in which Communist China is due to celebrate its 100th anniversary –
9.5 %annual average growth rate of Chinese GDP over the last 20 years
100 101

of the industrial civilization. Others, however, still have a choice to devel-op their economies without producing so much carbon. For latecomers to industrial development, such as China, it is neither necessary nor possible to follow the high-carbon route. We need a new direction.
Industrialization has helped China to develop at a fast pace. Growing social, economic and environmental tensions, however, now call for a rethink of the prevailing paradigm of the industrial civilization.
For latecomers such as China, it is neither necessary nor possible to follow the high- carbon route
China’s demand for energy will continue to grow and, given its endow-ments with natural resources, it will continue to rely heavily on coal in any given scenario. According to current trends, China’s total energy demand is expected to rise to 6.7 billion metric tons coal equivalent (btce) in 2050, which is almost 80 per cent more than it was in 2013, and 10 times the level of 1980. In a best-case scenario, in which China manages to decar-bonize its economy and make it more energy efficient, energy demand would be lower – around 5 btce – by 2050. Of this, a significant portion (37 per cent) would still come from coal, with 20 per cent from oil, 14 per cent each from natural gas and nuclear power, 8 per cent from hydropower and 5 per cent from other renewable sources.6
IV City people consume moreMore than half of China’s 1.3 billion people live in cities. Back in the late 1970s, it was less than a fifth. By 2030, it is projected to be 70 per cent, which implies that another 300 million people will be moving to urban areas in the next 15 years.
But even these numbers underestimate the true scale of urbanization in China. An estimated 260 million migrants are living and working in China’s cities; however, they are not officially registered as urban resi-dents. Without urban registration (“hukou”), these migrants are not enti-tled to partake in local education, medical care or pensions, or even to buy a car or an apartment in the same way as registered urban residents. Because of these restrictions, unregistered residents tend to consume a lot less than fully registered ones. The government is now making efforts to extend hukou entitlements to many of the migrant workers, which will lead to a growing proportion of China’s urban dwellers consuming more energy and making greater use of urban social services.
Moreover, most of the older towns and former villages that are now within city limits lack even basic urban infrastructure, such as sewage pipes and centralized energy supplies. A huge construction effort will therefore be needed for further urbanization. Migration into cities, the extension of urban entitlements and social services to migrant workers and urban reconstruction will all drive up energy demand.
An ecological civilization?Countries follow different paths towards social and economic develop-ment. Some countries have been locked into development pathways that rely heavily on high-carbon technologies. They are living in the paradigm
Unregistered migrant workers tend to consume a lot less than registered city dwellers
6cities the size of New York have sprung up in China since the late 1970s
102 103

into its national debate, as well as policy planning and implementation. This is vital in keeping our air breathable, our environment livable and our energy provision secure.
Only a paradigm shift will bring the required change. Currently, the ideological foundation of the industrial civilization is utilitarianism, or the belief that any action is good as long as it produces beneficial results. An action that is useful in that sense has value. Actions that do not produce results within that definition have no value.
Under the industrial civilization paradigm, the aim of production is to maximize profits – without much regard to their negative effects on peo-ple and nature. The dominant style of consumption within this system is materialism – an ideology that, in my consideration, leads to the perpe-tual pursuit of unhealthy and wasteful material consumption. The driver of the industrial revolution has always been technological innovation, which is a positive thing. But the energy source of industrialization are fossil fuels. Fossil fuels are exhaustible. And if we continue to burn them, we also damage our environment. We must therefore question the sustainability of any paradigm that relies on fossil fuels for its realization.
A new paradigm is needed to restore harmony between humans and nature. Let’s call this new paradigm the ecological civilization, as opposed
56 %of people in the Asia-Pacific region see climate change as the biggest global threat
We live according to the belief that any action is good as long as it produces beneficial results
figure 5.4 growth in the population, gdP per capita and car ownership
Source: World Bank Population growth (left scale) gdP per capita growth (left scale) Passenger cars (right scale)
1970s 1980s 1990s 2000s 2010s
growth in population and gdP per capita, in per cent Passenger cars, per 1,000 people
10
8
6
4
2
0
100
80
60
40
20
0
Inequality and poverty seem to be the inevitable social outcomes of our economic model. We enjoy fast economic growth, but we do not seem to be able to prevent economic and financial crises, nor cope with them when they arise.
The Chinese are becoming increasingly concerned about their environ-ment – the severe pollution, depletion of natural resources, extinction of wildlife and, of course, climate change. China’s appalling air pollution is largely the result of the growing amounts of coal and oil that we burn. Fertilizers and detergents seep into our water system, which damages biodiversity and threatens our drinking water. Warmer temperatures have led to a retreat of glaciers and snowlines in the Himalayas and Tianshan Mountains. This has provoked serious concerns about the water supplies that the arid western regions need to survive. Extreme weather events have become more frequent and severe in China in recent decades.7 Climate change could leave our cities more vul ner able to floods, storms and landslides.
Our political system and our economy work within the current paradigm, but both are problematic in the medium to long term. The current sys-tem takes care of the interests of capital, but it is less serviceable to those of the people, let alone the environment. China must integrate economic, energy and environmental issues more thoroughly and comprehensively
Fertilizers and detergents seep into our water system, which damages bio-diversity and threatens our drinking water
1960s 1970s 1980s 1990s 2000s 2010s
figure 5.3 energy consumption per capita
Source: World Bank Development Indicators switzerland China uk Japan us
In kg of oil equivalent
8,000
7,000
6,000
5,000
4,000
3,000
2,000
1,000
0
104 105

(see also chapter 12). Even though the government has decided to relax the one-child policy, the size of China’s population is projected to peak in the early 2020s, stabilize, then decline.
If the population ceases to grow, and if consumption per capita reaches a saturation point (as seems to be the case in both Japan and western Europe), then China’s demand for energy and material goods may remain stable.
But this is not a given. Growing incomes usually lead to higher levels of material consumption. Car ownership is a good example. Until the end of the 20th century, car ownership in China was low. But since then, the numbers have been rocketing and, in 2013, China became the largest car market in the world. Nevertheless, car ownership in China is still only about one eighth of the OECD average (see also chapter 9).
Therefore, if China is to follow the path of the wealthier developed coun-tries – with a massive increase in demand for cars and other material goods – such a lifestyle change must no longer be based on fossil fuel consumption, like it was in the West.
China is setting a new directionScarce resources and a fragile environment are putting the brakes on large-scale urbanization and industrialization in China. This is why the Chinese government has started to push for a paradigm shift from con-ventional industrialization to the building of an ecological civilization. China’s new leadership has set goals to support this transformation.
One goal is the protection of China’s natural assets. The government has ordered the compilation of a “balance sheet” of natural assets, similar to the economy’s national accounts. Such a balance sheet would allow China to evaluate its use of resources and set targets for a sustainable balance in the future.
The government’s second goal is to set “ecological red lines” to make sure that our economic development does not exceed nature’s capacity to adjust. The third goal is to account for the wider costs of resource use (such as pollution and depletion) in order to make sure that demand and supply reflect the true costs of consumption (economists call this the internalization of external costs).
1,354,040,000population of China in 2013
$56 billionChinese investment in renewable energy in 2013
$48 billionEU investment in renewable energy in 2013
to the industrial civilization. The foundation of an ecological civilization is respect for – not conquest of – nature. Within this new paradigm, we could seek economic, ecological and social efficiency simultaneously.
Ecological efficiency means a natural environment that is resilient and productive. Economic efficiency suggests an economy that requires less input but generates more output without producing harmful emissions. Social efficiency requires institutions that reduce inequality and poverty. Within this new civilization, we would enjoy harmony between humanity and nature, economic development and social evolution, individuals and society, production and consumption, and rural and urban areas. Ultimately, a new paradigm such as this would facilitate nothing less than the sustainability of human development – that is, a healthy and dignified way of life.
If we look at trends in wealthier economies, we can see that transforma-tion has already begun. Post-industrial economies tend to consume less, and cleaner, energy. Their energy consumption per capita rose until the early 1970s – when it peaked, remained stable for a while, then started to decline around the turn of the century (see figure 5.3). The levels at which energy consumption peaked, however, were very high, and the process of reversal took a long time.
If China were to follow a similar path, its energy consumption would rise by another 50 per cent. Consumption would then remain stable for four decades as China completes its industrialization and urbanization. This would be unsustainable.
If China adopted a new paradigm, however, it would no longer aspire to the kind of development aimed solely at the accumulation of material wealth, but instead at harmony between humanity and nature. This would entail consuming less energy at any given level of development, and relying more on renewables and less on fossil fuels. As a result, carbon emissions would be substantially reduced. The challenge for China is to lead in this paradigm shift. China’s family planning policies have prevented the population explosion that many experts had predicted in the 1970s and 1980s (see figure 5.4). Although China’s income levels are still those of a middle-income devel-oping country, its demographics look more like those of the wealthy, developed countries – low birth rates and a rapidly aging population
In the developed countries, energy consumption per capita peaked in the early 1970s
We would enjoy harm-ony between humanity and nature, economic development and social evolution, individuals and society
106 107

China sets its development goals in five-year plans. It compiles these plans not through a centralized, top-down approach, as many people believe, but instead uses bottom-up assessments and consultations to ensure that targets can actually be implemented. The five-year plan contains two types of targets: indicative and mandatory (or binding). Economic targets are usually indicative but most environmental targets are made mandatory.
For instance, the government has set strict, mandatory targets to
stop the decline in land that can be used for farming; preserve natural reserves in certain regions; increase energy efficiency; reduce carbon intensity (how much CO2 is burned per
unit of output); manage forests; raise the share of non-fossil fuel in total energy consumption.
The government has set limits for conventional pollutants in absolute terms, which means that they apply irrespective of how much the eco nomy grows. To encourage households to save energy, China is implementing a progressive pricing policy, so that households pay less for each unit of electricity if they manage to keep their overall con-sumption low.
After China reached the environmental goals it had set itself in the 11th five-year plan (2005–2010), it adopted further targets for energy savings and renewables in its 12th five-year energy development plan for 2011 to 2015 (see figure 5.5). Development targets are usually indicative, while those for environmental protection and energy intensity are compulsory. The government tends to break down overall targets into more specific ones, and define policy measures and investments for each target to make sure they are achievable.
In 2013, for the first time, China built more new renewable power capacity than new fossil fuel and nuclear power stations. With that, renewables together accounted for about a fifth of China’s total electricity genera-tion. The true share is even higher, since China does not include small, non-commercial renewable power sources – such as solar water heaters or solar-powered streetlights – in its energy statistics.
In 2013 China built more new renewable power capacity than new fossil fuel and nuclear power stations
In China’s five-year plans, environmental targets are usually binding
Target for unit 2010 2015 rate of change nature of target
Total primary energy consumption Billion tons of coal equivalent (tce)
3.25 4.00 +4.3 % per year I
Percentage of non-fossil fuels in energy consumption
% 8.6 11.4 +2.8 percentage points
m
Energy intensity Ton of coal equivalent for each RMB 10,000 output produced
0.81 0.64 −16 % m
Efficiency of thermal power plants Grams of coal per kilowatt hour
333 323 −0.6 % per year I
Electricity installed capacity Gigawatt (GW) 970 1,490 +9.0 % per year I
Thermal Gigawatt (GW) 660 960 +7.8 % per year I
Hydro Gigawatt (GW) 220 290 +5.7 % per year I
Nuclear Gigawatt (GW) 10.8 40.0 +29.9 % per year I
Natural gas Gigawatt (GW) 26.4 56.0 +16.2 % per year I
Wind Gigawatt (GW) 31.0 1.0 +26.4 % per year I
Solar PV Gigawatt (GW) 0.9 21.0 + 89.5% per year I
CO2 reduction 17 % m
SO2 reduction g/kWh 2.9 1.5 −12.4 % per year m
NOx g/kWh 3.5 1.5 −15.1% per year m
figure 5.5 Targets of the 12th five-year plan for energy development
Source: Council, Directive 2013 Indicative target mandatory target
109

Within three days in early summer, between 200 and 400 liters of rain soaked each square meter of soil in some parts of Bavaria, southern Germany. Usually, these regions can expect around 900 liters of precipitation per square meter a year. With grounds already saturated, water levels rose fast. In some areas, the Danube swelled to 12 metres above its usual level, flooding towns and destroying fields. The estimated damage amounted to well over €10 billion, with people still in the process of restoring their properties months after the floods had receded.
An apocalyptic vision? No. Twice in just 11 years (in August 2002 and June 2013), Germany suffered floods that were worse than anything the country had seen in the previous 500 years. Researchers are pretty sure that climate change is the main reason for this conspicuous increase in rainfall and flooding in some parts of Germany. They say that it is likely that certain German rivers will break their banks more often while other parts of Germany will experience more droughts.1
And now the weather forecast for Germany ...
in 2040
by Peter Köferl
BOx 5
1 China’s 2050 Energy and CO2 Emission Report, China Science Publishing House, Beijing, 2009.
2 Based on purchasing power parity. IMF, World Economic Outlook database, 2014.
3 China measures not agriculture per se but the primary sector, which includes agriculture, forestry, animal husbandry and fisheries. The secondary sector includes mining, manufacturing, utilities and construction. The tertiary sector is everything else, particularly services.
4 National Energy Administration, January 14th, 2013.5 National Bureau of Statistics, Energy Yearbook of China,
Various years.6 China’s 2050 Energy report, 2011, pp. 753–820.7 Qin Dahe (ed), National Assessment Report of Climate Change
in China, Science Press, 2014.8 Wang Wei Guang and Zheng Guoguang, China’s Climate
Change Report, Social Academic press, Beijing, 2014.
Pan Jiahuais Director of the Institute for Urban and Environmental Studies at the Chinese Academy of Social Sciences (CASS) and Professor at CASS graduate school. Formerly, he was an advisor to the United Nations Development Program in Beijing, lead author of the IPCC Working Group III 3rd and 4th Assessment Reports on Mitigation; a member of China’s National Expert Panel on Climate Change and the National Foreign Policy Advisory Group as well as an advisor to the Ministry of Environment Protection. Prof Pan is the author of over 300 papers, articles and books in both English and Chinese. Among his distinctions are the 1st and 2nd prizes for best research work at CASS (2002 and 2004), the Sun Yefang Economic Science Prize (2011) and the China Green Person of the Year award (2010/2011).
The Chinese government is now preparing its 13th five-year plan for the period 2016–2020. It will make climate policies more explicit and ambi-tious, as this is required for both fighting climate change and limiting local pollution. Stringent enforcement and a gradual paradigm shift should help the Chinese leadership to implement the new targets.
In its climate policies, China has chosen a new approach – one that does not rely solely on technical measures. As a latecomer to industrialization, China is now seeking to lead the move towards a new paradigm: the ecological civilization. If these efforts are successful, China’s develop-ment will be more sustainable, its energy consumption will peak at a lower level and its carbon emissions will not remain high for long. Carbon emissions are now projected to peak as early as 2025, and China could cut its emissions in half by 2050, compared with 2010 levels.8
110 111

less vegetation than rural areas. Heatwaves – which will also become more frequent – will thus affect cities particularly severely, with grave conse-quences for the health of vulnerable people.
In Germany, like other countries, the impact of climate change will be costly. Houses, roads, canals, power stations and sewage systems were all built to work under current climatic conditions. They might not function so well in the future, when they will be battered by extreme weather. Germans will not only have to invest in more air conditioning and better insulated houses, but they will also have to repair their rooftops, roads and bridges more often since severe weather will leave its marks.
Climate change will also affect Germany’s ecosystem. For example, the decreasing supply of water will stunt the growth of forests, whereas the trees’ ability to absorb CO2 will improve. Germany has already begun to rethink its forestation plans to take account of such changes, but much remains to be done. German agriculture, meanwhile, could well become more productive, since a balmier climate is good for wheat production. Such average increases in farm production might then have to be counted against the sporadic losses from floods and droughts.
Peter Köferl, Group Public Policy and Economic Research, Allianz SE
1 Shaochun Huang, Valentina Krysanova and Fred. F Hattermann, “Projections of climate change impacts on floods and droughts in Germany using an ensemble of climate change scenarios”, in Regional Environmental Change, 2014
2 Friedrich-Wilhelm Gerstengabe and Harald
Welzer, “Zwei Grad mehr in Deutschland: Wie der Klimawandel unseren Alltag ändern wird”, Frankfurt: Fischer, 2013
3 For example, Deutscher Wetterdienst, press release, August 7th 2014
4 Umweltbundesamt, press release 09/2011, February 15th 2011
Climate change is affecting our planet’s water cycle. For example, as tem-peratures increase, more water evaporates, which means there is more moisture in the lower parts of the atmosphere. This can cause heavy rainfall and flooding. Meanwhile, spring now often arrives earlier in central Europe and other parts of the northern hemisphere. The melting snow supplies lots of water early in the year, when the weather is still cool. But this is followed by droughts in the summer, when hot temperatures leave soils parched.
Scientists are generally cautious about predicting concrete consequences of climate change. What they do know is that changing weather patterns will affect many areas of our lives. What they do not know is exactly how. One group of scientists looked at the implications of global warming in Germany, assuming that temperatures would rise by 2 degrees C by 2040.2 Two degrees more does not mean a balmier climate all year round, but instead perhaps long periods of scorching temperatures followed by prolonged cold snaps, leading to more extreme weather changes. German winters are likely to get wetter, and its summers drier.
In Germany as a whole, average precipitation will probably decline a little, as some regions will have to go for longer periods without rain, interspersed with dramatic downpours. While less rain in itself should not worry the Germans, higher temperatures will make water evaporate faster, which means scarcer water supplies in some regions – especially during the summer months.
More importantly, extreme weather events are likely to become more fre-quent, even in this decade.3 In coastal areas, the frequency of floods and storms could double in 2040–2100, compared with the period 1960 to 2000.4 While the Alpine regions should remain relatively unscathed, many areas between the seas in the north and the mountains in the south will have to grapple with higher incidences of flash flooding, forest fires, spoilt harvests and other consequences of extreme weather.
Germany’s cities will be particularly vulnerable to extreme weather. The rivers that roll through most big cities will be increasingly prone to overflow. Moreover, cities tend to store heat because of their high concentration of buildings and people in a limited amount of space and because they have
112 113

Welcome to Allianz’s historical archive and museum. My name is Mandeep, and it is my pleasure to be your guide today. I am a SavvyX-3 knowledge-conveyer robot and used to work in the British Museum before I was redeployed to this job.
From the information I already have about you, I gather that you are especially interested in how this company has been dealing with climate change. I’m looking forward to telling you some fascinating stories about this, as well as how companies like Allianz have played their part in shaping global climate solutions.
I see that we have eight nationalities represented in today’s group. Every-thing I say will be simultaneously translated into your first language as indicated on your identification chip. If you wish to listen to me in a different language, please change the options on your chip now.
The business of climate change: A view back from 2050by Julia McNally, Simone Ruiz-Vergote and Verena Treber
CHAPTer 6
Humans used to question whether renewables could ever
supply the world’s energy …
115

profitable business. These vineyards use hailstorm protection and have planted drought-resistant grapes of the type developed in San Felice.
Back in 2020, when this Chianti was produced, some people still put the weather changes down to bad luck. Remember that, back then, sea levels were 30 centimeters lower than they are today, and we still had Arctic ice in the summer. This was before all coral reefs were fully bleached, the bark beetle decimated European forests and watercress started to cover central European lakes. But in 2020, most people already knew that things would only get worse. And they slowly came to the realization that the global community would have to act much more decisively.
Sea levels were 30 centimeters lower than they are today, and we still had Arctic ice in the summer
Of course, if we don’t manage to cover all the issues you’re interested in today, you can continue your tour virtually through our homepage, the address of which I have just added to your digi-me devices.
OK, if you would like to follow me through here please.
These archives started assembling memorabilia from Allianz and the world in which it operates almost 60 years ago. The company itself is more than 160 years old.
After the delugeWhat you see on display here is a bottle of Chianti Classico Il Grigio from the year 2020. It comes from the vineyard of San Felice in Tuscany. In the 1970s, an Italian insurance company called Ras bought San Felice for its real-estate portfolio. Therefore, when Allianz took over Ras in 2006, it also acquired more than 1,500 hectares of vineyards.
The bottle is here because, to our knowledge, it is the last remaining bottle of a very small vintage.
Some of you might remember that the period from 2017 to 2020 came to be known as “the deluge” because of the incessant heavy rainfalls. For three years in a row, more than 90 per cent of San Felice’s grape harvest was spoiled. The 2020 vintage in particular was tiny because the roots of the vines had already started to rot, and a hailstorm had devastated the vineyard in April earlier that year. So we decided to display one of the bot-tles here in order to illustrate how climate change can affect business.
Of course, not only San Felice but also the entire Chianti region suffered tremendously in those years, and several large wine producers went bankrupt around that time before the European Union stepped in to help.
After 2020, there were a few better years for the wine makers of Tuscany. But unpredictable weather continued to spoil harvests throughout the 2030s. Winemaking in this region has now become more of a niche busi-ness for highly specialized producers.
San Felice bottled its last wine in 2043. Today it is a scientific institute that researches drought and flood-resistant grape varieties. Allianz currently owns two vineyards in northern Germany and one in Norway, since the warmer temperatures have made wine growing in northern Europe a
Warmer temperatures have made wine growing in northern Europe a profitable business
116 117

fact that modern infrastructure has become much more extensive and expensive. But unfortunately many countries also persisted in developing and building in areas particularly vulnerable to the effects of climate change. This is a particular concern in Asia, the region that is home to eight of the world’s ten most exposed cities.
Did you know that coastal areas were expanding faster than other regions, both in terms of people and investments, until around 2035? Only then did national and local authorities start to prohibit new developments in high-risk regions and reverse the destruction of natrual protections such as riverbeds and mangrove forests (see chapter 2).
Overall, more people are insured against risks from extreme weather than ever before. But in some of the most exposed regions, insurance cover for property and business is no longer available today – although the demand for insurance there would of course be particularly high. Insurers can predict precisely what the flood or storm risks are in each area. Because insurance premiums would have to be incredibly high in these areas in order to cover the risk, the market there is basically non existent.
In some regions, collaboration between residents, local governments and insurance companies has resulted in creative solutions – for exam-ple, solidarity funds or large-scale risk pooling. Additionally, after the mid-2030s, houses and infrastructure were built to better standards, warning mechanisms were improved and people took prevention more seriously. The follow-up versions to the Allianz WeatherSafe App now offer precise forecasts and warnings as well as advice on precautionary measures.
from “no-go-tiations” to a global dealIf you would follow me through here, please.
What you see on this stand is an electronic name badge dating back to 2030. Does the name Ebba Joven sound familiar? She was the CEO of Allianz in 2030 – the year in which governments agreed on the Global Climate Action Treaty, or GlobAct.
For Joven, taking climate change seriously was not only good business, it was also her personal mission. She made a special point of participating in the 2030 Tianjin climate conference. Those of you who are older might remember that, in the decades leading up to GlobAct, international
In some of the most exposed regions, insurance cover for property and business is no longer available
€120 billionglobal cost of weather-related disasters in 2012
This growing public pressure was one reason why most countries acted to cut their CO2 emissions in the 2020s by more than the levels to which they had originally committed themselves. Another reason for achieving emissions reductions was, of course, the rather sluggish performance of the world economy and the roll-out of new technologies.
Global emissions finally peaked in 2032, then started a slow, steady decline. Today they are back at 2010 levels.
All this was too little too late to prevent global warming. While in some areas there had been only limited temperature changes, in others – particular in the polar and sub-polar regions – temperatures went up faster than expected. The US Midwest was also severely affected, as were eastern Europe, northern Africa, Central Asia and western Australia.
forecasting the weatherWe’ll continue on the topic of the weather for a while, if you’d care to follow me over here.
What you see here is what used to be known as a smart phone – yes, it’s funny to think that this device was once considered smart, but some of you are old enough to remember using one of them. This particular phone dates back to 2021. Let’s switch it on. This little program – it used to be called an app back in the day – was developed by Allianz for its customers around the world.
The Allianz WeatherSafe App provided weather forecasts and severe weather warnings for registered users. Back then, its forecasts were state of the art, but compared to today’s they’re ridiculously imprecise.
Today, of course, models are much better at predicting the weather in the short run and climate changes in the long run. Insurance companies can therefore make very concrete predictions regarding weather-related risks for homeowners, businesses and supply chains. The risk maps and modeling available today are in a totally different league compared with what was available 50 or even 30 years ago. Using huge amounts of intelligent data, this modeling allows insurance companies to offer almost instantaneous, customized, weather-related cover.
Despite these vast improvements in weather predictions, the costs caused by natural disasters remain high. One of the reasons for this is the
Insurance companies can make very concrete predictions regarding weather-related risks for homeowners, businesses and supply chains
118 119

established the Carbon Market Oversight Board and gave it the mandate and independence it needed to ferret out cheating and contravention and prescribe appropriate disciplinary measures.
The large increase in the price of carbon played an important part in bringing down emissions. Alongside targeted subsidies, it really helped to push technological innovation forward. The world now uses energy more efficiently than anyone could have imagined even 20 years ago.
A few decades ago, many people would also have been rather skeptical as to whether the world would ever be able to generate most of its energy from renewable sources. Today we take this for granted. There was a time when people did not believe that new technologies for capturing and recycling the carbon produced from burning coal, gas and oil could ever be commercially viable. Today these technologies are standard.
Allianz was one of the companies that helped shape this transition. Quite early on, Allianz investment managers used an artificially high carbon price when allocating the funds they managed. From the beginning, Allianz wanted to factor in risks that were relevant but not necessarily reflected in the global carbon-pricing scheme.
Allianz also sought to future-proof its investments by testing whether the companies into which it invested would be able to cope with higher carbon-related prices. For the most part, the companies that passed this test also had innovative approaches to climate change. For Allianz, this investment strategy paid off, as these companies then performed partic-ularly well when governments tightened environmental regulations.
The world slowly wakes upThe years that followed the GlobAct treaty were turbulent. On the one hand, Allianz – as well as most other global companies – had to cope with the consequences of an increasing number of natural and humanitarian disasters. On the other, technological developments and innovative financial schemes opened up entirely new opportunities.
Like politicians the world over, companies shifted their focus from fight-ing climate change to living with its consequences, from speculation and debate to action and cooperation. Both governments and businesses were expected to take their responsibilities very seriously.
20 %share of global emissions covered by carbon trading in 2014
climate meetings had met with so little real success that people started calling them “no-go-tiations” in their frustration.
The compromise achieved at the 2015 Paris climate conference covered two-thirds of global emissions but countries failed to agree on a monitor-ing mechanism. As a result, only a limited number of signatories lived up to their commitments. Negotiations remained painfully slow in subse-quent years, but people and businesses were becoming exasperated. Under Ebba Joven’s direction, Allianz was part of the pro-climate coalition that continually ratcheted up the pressure on governments. The growing number of natural catastrophes also created a sense of urgency. So, by 2030, governments had little choice but to agree on a package of mean-ingful measures. GlobAct was born.
As part of this treaty, the 100 or so existing local and regional carbon markets were merged into one global system. For the first time in history, there was one price for harmful emissions in 2030, whether they came from Europe, the US, Asia or Africa.
Initially, many industries continued to exploit loopholes that allowed them to avoid paying for the pollution they caused. Governments then
For the first time, there was one price for harmful emissions, no matter where they came from
120 121

how much energy and water the u4Tower currently produces and uses, and also how many people are inside and what kind of services they are using. This building really embodies all the innovative power that you humans can muster.
Allianz insured the construction of u4Tower. When it was finished, Allianz then bought a share in it. This building is also important to Allianz because it was here that the company first offered new and innovative insurance products. I’ll be telling you a bit more about these later.
If you look over here, I can show you something that illustrates that changing sense of responsibility. This is a bag of salt. To be more precise: it is some of the first salt produced in our desalination facility on Austra-lia’s southeastern coast. In 2039, it was Allianz’s first investment of this kind. Now the company also owns desalination facilities in Peru and California. Facilities such as these can help keep regions that no longer have enough ground water livable.
Allianz bought its first wind farm 45 years ago, in 2005. But circum stances at the time meant that institutional investors were slow to shift their portfolios towards green investments. From today’s perspective, it is hard to understand why this took so long. Back in the early years of the new century, people still believed that governments would have to take the lead on solving global problems, including climate change.
It took the financial crisis of 2025 to illustrate that governments could no longer deal with the hyper-connected world on their own, and that both people and businesses could no longer wait for public policy to change before they adopted strategies geared towards the longer term. It was then that the new coalition between the public and private sectors emerged.
Please also remember that, back in the early years of the century, the greatest need for greener investments was in countries that were still rather poor and often unstable. The risks attached to such investments were frequently so high that private investors would shy away from them.
In 2030, governments and investors together developed a de-risking facility designed to help investors offload certain risks. For example, for the eventuality that conditions and regulations changed abruptly, they agreed a minimum return in order to protect the original investment. Such facilities led to a better understanding of green investments, which then began to attract serious amounts of money – particularly in devel-oping countries. Allianz, for example, invested in railway connections between rapidly growing African cities or water management systems in regions where it already sold agricultural insurance to farmers. Allianz also issued its first green bond to co-finance activities of this kind.
Innovation in an urban and aging worldThis here to your right is a hologram model of the u4Tower in Mumbai. This model is connected to the actual building in India and it shows you
Allianz bought its first wind farm 45 years ago, in 2005
122 123

Many of the newer megacities had a latecomer advantage because, from the start, they could apply stricter standards to achieve a smarter, more efficient infrastructure. But the u4Tower proves that even older cities can upgrade their infrastructure to the latest standards.
Forty years ago, Mumbai’s population already numbered 20 million (see
also chapter 11). Back then, most planners did not think in the long term; they just wanted to provide housing, energy and transport to meet the demands of an increasingly urban population. Today, this shortsighted-ness continues to create problems, even for the u4Tower.
Some of the older buildings around the u4Tower do not generate their own energy. But they use lots of it, since they do not absorb enough natural light and they don’t have internal water cycles, nor can they produce their own food. So all these things – energy, water and food – need to be delivered to them. The u4Tower also has to deal with the extra heat emitted from adjacent buildings.
Of course, the u4Tower can withstand very strong storms, flash floods and earthquakes. But the same is not necessarily true of its neighboring build-ings. Therefore, the u4Tower pays extra insurance premiums to cover the risk of one of the nearby towers collapsing and the building’s owners are trying to help make the neighborhood more resilient to climate change.
Changing climate, shifting mindsetThe last exhibit in our tour today will tell you a lot about how society’s values have changed. In the area of transport, the hot topic 30 or 40 years ago was electric cars. Then the focus shifted to car sharing, then towards smart and CO2-neutral urban transport systems (see also chapter 9). In today’s megacities, the idea of moving a vehicle every time only one or two people want to go somewhere sounds a bit ridiculous. So cities have been shifting to systems that need little infrastructure but can transport millions.
If you look over here, you’ll see something in this case that looks a bit like a speck of dust. Actually, it’s a nanochip. Let’s switch on the content enlargement. Here we are. What you see here is in fact an insurance policy for an autonomous solar-powered vehicle, which is in the fleet of a popular car pooling scheme in Lusaka, Zambia. We particularly chose to feature Lusaka because it has one of the best-integrated transport systems in Africa today. Almost no-one in Lusaka owns their own vehicle.
9,340,000number of registered cars in the Netherlands in 2010 (16 million people)
340,000number of registered cars in Zambia in 2010 (15 million people)
What makes the u4Tower exceptional is not its height – at 1,111 meters, it still can’t compete with the Burj Khamara in Dubai, which is 1,200 meters high. But in terms of ground area and the number of people working, living and using services there, this building is number one in the world. Most people internationally, however, will know it because it has vertical farms and its own ecosystem.
Many of the innovations in the u4Tower were inspired by nature. Ultra-light, stable materials were used in its construction. Natural ventilation and its green facades and spaces in between floors work together as a natural cooling system, even during Mumbai’s early, stifling summer. The sun is the main source of light, even for the bottom floors. The closed water recycling system also irrigates the plantations and parks inside the building – and these, in turn, clean the air indoors.
Of course, the u4Tower also uses the latest technologies – for example, continuous online health monitoring for its residents. This makes the building very suitable for older people whose health is deteriorating.
This in-built health monitoring allows Allianz to provide individualized health insurance to u4Tower residents. For example, the risk of conta-gious disease or heatstroke is much lower for u4Tower residents than for the population at large. On the other hand, the risk of diseases of affluence, such as obesity, is slightly higher – despite the building’s gyms, swimming pools and indoor parks. Perhaps this is an unexpected negative effect of the in-house transport system being so comfortable and convenient.
In the u4Tower, it was also the first time Allianz sold an integrated “home contents and health” insurance – because today we know that the well-being of humans critically depends on their immediate surroundings.
The u4Tower shows how humankind can deal with overcrowding, air pollution, energy shortages and water problems in megacities in a sus-tainable way. After all, there are as many people living in cities today as were alive 35 years ago. In many respects, of course, this is good, as cities allow people quick and easy access to healthcare, transport and energy. And the two-thirds of the world’s population living in cities can live more efficiently, using fewer resources, than if they were dispersed in small towns and villages.
2/3of all people could be living in cities by 2050
The closed water system also irrigates the plantations and parks inside the building
124 125

main objective. Physical things, such as cars, or digital things, such as data, are only the means to an end.
Africans also spearheaded the change in attitudes and expectations towards elites, not only politicians but also business leaders. You humans now expect your leaders to think about not only their own voters, or employees and shareholders, but also the well-being of the wider society and the environment. This company was one that embraced the new way of thinking early on, and that’s why it’s still here today to show you artifacts from its 160-year history.
Now I would like to thank you very much for your attention. I hope you enjoyed the tour. Please rate the quality of your guide on your digi-me devices. There, you can also upload pictures of yourselves in the Allianz archives as a souvenir.
Have a nice day and goodbye.
Julia McNallyis Head of Sustainable Development for Allianz. Together with her team, Ms NcNally is responsible for the publication of the Group’s annual Sustainability Report, sustainability-oriented investor dialogues and ratings as well as mana ging the Group’s own environmental footprint, among other topics. She has worked in the insurance industry since 2002 in the UK and Germany and has been with Allianz since 2005 in various central positions. Ms NcNally is Australian and a studied marine scientist.
Simone Ruiz-Vergoteis head of the Climate Advisory & Policy team at Allianz Climate Solutions (ACS). ACS advises companies within the Allianz group and external customers on renewable energy and climate change solutions. Previously, Ms Ruiz-Vergote worked on European climate and energy policy in Brussels, first at BusinessEurope and then as EU head of the International Emissions Trading Association. She started her career at the European Central Bank in Frankfurt.
Verena Treberis a Project Manager in the Climate Advisory & Policy team at Allianz Climate Solutions (ACS). She works on integrating climate change considerations into Allianz core business and looks at the risks that climate change causes for insurance companies and their customers. Before joining Allianz, Ms Treber was a Carlo Schmid scholar at the International Union for Conservation of Nature (IUCN). She started her career at the German Agency for International Cooperation GIZ.
The public transport system has never had a major failure despite Lusaka’s fast growth and the often harsh weather conditions in this high-altitude city.
Only 30 years ago, Lusaka was snarled up in traffic jams, like most emerg-ing-market cities. But then, like many parts of Africa, Lusaka simply skipped some steps in what people then considered a normal path to economic development. Most people in Africa have never owned a car; they went straight to car sharing and public transport. Nor did they ever have landline telephones installed in their homes; they went from having no telephone to portable devices.
People in Africa were much quicker than Europeans to cut the connec-tion between social status and private mobility. Even 20 years ago, most young Africans thought that owning a big, shiny car was “sooo” 20th century. From there it was only a small step for them to question the whole lifestyle based on the constant consumption of goods. They were the pioneers in the move from a world that evolved around private ownership of things to one in which access to experiences became the
Even 20 years ago, most young Africans thought that owning a big, shiny car was “sooo” 20th century
126 127

B
And usHow can we anticipate and manage change in our societies?

Demographic trends are not as visible or im mediate – let alone exciting – as techno lo-gical innovation. The way in which our societies are changing tends to be slow and subtle. Nevertheless, demographics will shift the global economic and political balance, and decisively, enduringly alter the nature of our societies. Demographic projections – such as those from the United Nations Population Division1 – illustrate what lies ahead.
The world’s balance will shiftIn the next four decades, the world’s pop ula-tion is projected to increase by one third, from 7.2 billion people in 2014 to 9.6 billion in 2050. There are two main reasons for this devel op-ment. First, life expectancy is increasing in almost every country of the world. Second, although fertility rates are declining every-
where, the global fertility rate is still above the replacement level of 2.1 (the rate needed to keep a population stable).
Nevertheless, developments in fertility rates and life expectancy differ markedly between and within regions. The coming decades will therefore see major demographic shifts, not only within the societies of individual countries, but also between countries, regions and conti-nents, which will have major implications for the world’s economic and geopolitical balance.
In Europe, the size of both the UK’s and France’s populations will overtake that of Germany in coming decades. Russia’s population will shrink by 20 million between now and 2050, whereas Turkey’s will grow by about the same number.
How our societies are changingby Michaela Grimm
InTrOduCTIOn PArT B
4.2was the average number of children a German woman had in 1900
9.6 billionpeople will be alive by 2050
31 yearsis the additional life expectancy that the average human being will have gained between 1950 and 2050
1.5 billionwill be the number of people aged 65 and over in 2050
1.4is the average number of children a German woman has today
60 % of the world’s population is living in Asia today
87 % of girls worldwide have at least basic reading skills
25 %of the world’s population will be living in Africa in 2050
232 millionpeople lived outside their home country in 2013
28 %of households in the OECD countries consist of just one person
131

highest, although the difference between the two continents has narrowed.
With an average of 1.6 children per woman, the fertility rate in Europe is below replace-ment level. The same holds true for Northern America, with an average birth rate of 1.9 chil-dren. In Asia and Latin America – which have seen the fastest decline in fertility since the 1970s – fertility rates are now only slightly higher than in the developed countries (at 2.2 and 2.1, respectively). The average birth rate in the region around Australia (Oceania)2 declined to 2.4 children in 2014. UN demographers expect the fertility rates of all these regions to continue to converge until 2050, when they should range between 1.8 and 2.1.
The big exception is Africa. Here, the decline not only started later, namely after 1990, but was also less distinct than in Latin America and Asia. Though demographers expect total fertil-ity in Africa to decrease further, from today’s
4.5 children to 3.0 children in 2050, it will re main above levels observed in the other parts of the world. There are also marked differences within Africa. While fertility rates have halved in the north and the south of the continent, they have stayed high in the countries in the west and the middle, and will continue to do so.
By 2050, we will gain another 6 yearsSince 1950, the average life expectancy of a newborn has risen by almost 25 years: from around 46 to 70 years in 2014. By mid-century, global average life expectancy at birth is expected to rise by another 6 years, reaching 76 years in 2050 (almost 79 for women and 74 for men).
Medical advancements and improving stan-dards of living have been the main reasons for this increase in life expectancy. Not surprisingly, therefore, there are huge differences between countries and regions.
figure B.2 fertility rates by region
Source: UN Population Division, World Population Prospects, 2012 Revision
1950s 1960s 1970s 1980s 1990s 2000s 2010s 2020s 2030s 2040s
Africa world Oceania northern America Asia latin America europe replacement rate
Average number of children per woman
7
6
5
4
3
2
1
0
Europe as a whole is the only continent that will see its population contract in coming decades. This decline, together with continued popula-tion growth in other regions, will cause Europe’s global significance to diminish, at least from a demographic point of view. In 1950, around 20 per cent of the world’s population lived in Europe. Today that figure is closer to 10 per cent, and by 2050 it is projected to decrease to 7 per cent.
Meanwhile, the number of people living in Africa will more than double between now and 2050, to 2.4 billion – then one quarter of the projected world population. Back in 1950, Africa’s share was less than 10 per cent.
The size of Nigeria’s population will overtake that of the US. Currently, approximately 180 mil-lion people live in Nigeria, which is a little more than half the size of the US population. Although the US population will keep growing, it will be smaller than that of Nigeria in 35 years.
Ethiopia will surpass Egypt as Africa’s second most populous country.
The share of people living in Northern and Latin America, on the other hand, will decrease slightly, while that of Australia and New Zealand will remain roughly stable.
Today, well over half of the world’s population lives in Asia. Even though population growth in Asia is slowing rapidly, it will remain the world’s most populous region. But within Asia, the balance will shift: the size of China’s population will peak around 2030 and be overtaken by India’s around this time.
fertility rates are convergingIn 1960, Europe’s fertility rate was 2.6 children per woman – even then the lowest in the world – while in Africa, the average woman had 6.7 children. Fertility in other global regions fell somewhere in between. Europe today still has the lowest fertility rate and Africa the
figure B.1 The world’s population
Source: UN Population Division, World Population Prospects, 2012 Revision
1950s 1960s 1970s 1980s 1990s 2000s 2010s 2020s 2030s 2040s
Africa Oceania northern America Asia latin America europe world population growth (right scale)
Population by region, in million Population growth, in per cent
10,000
8,000
6,000
4,000
2,000
0
2.5
2.0
1.5
1.0
0.5
0
132 133

combination of declining fertility rates and increasing life expectancy, it faces the most pronounced shifts in its age structure. By mid-century, nearly one in three Europeans will be 65 or older. Asia and Latin America will also see substantial increases, from around 7 per cent today to 17 per cent in 2050. Although aging will affect Africa, it will remain the world’s youngest continent, with only 6 per cent of its population over 65 by 2050.
Michaela Grimm, Group Public Policy and Economic Research, Allianz SE
1 The United Nations World Population Division regularly publishes World Population Prospects, one of the most comprehensive demographic databases in the world, covering 233 countries. Based on differing assumptions about the future development of fertility, mortality and international migration flows, the UN published eight projection variants in 2013. See United Nations Department of Economic and Social Affairs, Population Division, World Population Prospects: The 2012 Revision, New York, 2013. The figures in this text refer to the medium variant.
2 In the UN definition, Oceania includes Australia, New Zea land, Papua New Guinea and the small island nations and terri tories in that region, such as the Solomon Islands, Fiji and Samoa.
figure B.4 Population aged 65 and older
Source: UN Population Division, World Population Prospects, 2012 Revision
Africa Asia europe latin AmericaCaribean
northern America
Oceania
1950 1970 1990 2014 2030 2050
In per cent of total population
25
20
15
10
5
0
The average newborn in Northern America, Europe and Oceania already had a high life expectancy in the 1950s. Today, babies born in the US and Canada can expect to live to 79, and those in Europe to 76. By 2050, UN demo-graphers expect average life expectancies in Oceania, Europe and Latin America to converge at around 82, while Northern America’s will still be slightly ahead, at 84.
Asia has experienced the most pronounced improvements in life expectancy over the last half century, in line with its rapid economic development. Life expectancy has increased by 31 years between 1950 and today, and it will rise by another 6 years by 2050, to 77. Life expectancy in Africa has traditionally lagged behind global averages, but it will see the big-gest change going forward: from 59 years today to almost 70 by 2050.
Africa is also the region with the biggest inter-nal differences in life expectancy. On the island
of Réunion, the average newborn can already expect to live to 80, while newborns in Sierra Leone will live to only their mid-40s. Other continents also experience large internal differ-ences. In Asia, a Japanese baby can expect to reach the age of 84, which is 22 years more than a newborn in Afghanistan. In Oceania, the difference between Australia, where average life expectancy is 83 years, and Papua New Guinea is 20 years.
A billion and a half people over 65Due to the increase in life expectancy, the num-ber of people aged 65 or older will almost triple in the next 35 years – from 586 million in 2014 to 1.5 billion in 2050. Most of the over 65 year olds (900 million) in 2050 will be living in Asia, with another 290 million in Europe and North-ern America.
The absolute number of older people in the world is less significant than their share in the total population. As Europe has the most striking
figure B.3 life expectancy at birth
In years
8580757065605550454035
1950s 1960s 1970s 1980s 1990s 2000s 2010s 2020s 2030s 2040s
Africa world Oceania northern America Asia latin America europe
Source: UN Population Division, World Population Prospects, 2012 Revision
134 135

The last century has witnessed a breathtaking increase in longevity – and the trend is set to continue. By 2040, the average person in the developed world may expect to live to 85. Although this is clearly a positive thing, many people also fear the consequences of aging, both for their own lives and the societies in which we live.
Will we be, in 2040, a society of forgetful, helpless and lonesome octo-genarians? Will the healthcare and pension costs associated with aging undermine solidarity in our societies and depress our economies?
In many respects, it is up to us to determine how we age and how we shape our aging and eventually also shrinking societies. There is an alternative future in which people age happily and healthily; in which education systems, healthcare providers and job markets cater for the needs of all generations; and in which we find new ways of living together that benefit us all. After all, we ought to remember: living is aging, and aging means living.
In the midst of big demographic changesBefore talking about the future of aging, we need to take stock and look back to where we came from. Why? Living in the year 2014 – that is, at the beginning of the 21st century – is something special when it comes
Will we be a society of forgetful, helpless and lonesome octoge narians?
The future of aging: How will I live?by Ursula M. Staudinger
CHAPTer 7
A positive attitude towards aging can literally add years to your life …
137

surviving into adulthood has steadily risen. At the same time, investment per child has increased due to a more elaborate education system, with economies increasingly requiring a more skilled labor force.2
Demographers project that world population growth will come to a halt at 9.4 billion around 2070, stabilize and then slowly decline to 9 billion by the end of the 21st century.3 This means that, in the future, we will have to come to terms with a finite amount of not only natural but also human resources. The combination of these two challenges, however, holds promise for economic and social innovation.4
Given the increase in average life expectancy in the last 100 years, the period of life reserved for retirement has lengthened tremendously. In 1889, Bismarck invented and introduced the old age pension program in Germany in order to provide a pension annuity for workers who had worked for a minimum of 30 years and reached the age of 70. But in those days, the average life expectancy in Germany was around 45, and only 2 per cent of the population lived to be 70 (see also box 6). Very few employees were able to take advantage of their pensions and, if they did, only for a rather short time.
In the US, when the Social Security system was established in 1935, workers who had paid into the system became eligible for benefits at the age of 65. Afterwards, they could expect to live another seven years on average. In contrast, actual retirement ages today have dropped to between 63 to 65 years (depending on the country), but average life expectancy at birth is 81 years in Germany and 79 in the US. In both countries, 65-year-olds can reasonably expect to live about 18 more years. This small histo rical excursion illustrates the enormous changes in the retirement phase of life, which have major implications for indivi duals, employers and societies alike.
The future of aging is up to usWe are witnessing – and shaping – fundamental historical changes in the nature of human development and aging. This is possible because human development and aging are not determined by the genetic information contained in our cells. They emerge out of the continuous interactions between our biology, our socio-cultural environment and our attitudes, decisions and behavior.5 What aging means is up to us. Human aging is modifiable. We can illustrate this “positive plasticity” of human aging in five areas.
Bismarck’s old-age pension program provided annuities for workers over 70 – the average life expec- tancy was 45
18 yearsthe time that Americans and Germans can expect to live beyond the age of 65
to human life and human aging. In the course of the last 100 to 150 years, dramatic and unprecedented changes have taken place with regard to how long we can expect to live and how many children we have.
Between 1900 and 2000, average life expectancy in the developed world increased by 30 years to, on average, 80 years (see figure 7.1). Fertility rates – the average number of babies a woman can expect to have – have declined from around 5–6 to 1.3–2.2.
At first these changes were confined to the developed world. Since 2000, China, Brazil, and the four Asian Tigers, including Singapore and South Korea, have joined the “club of demographic change” – but at a stunning pace. Just to give you an idea of the dramatic differences in the speed of demographic change: in France it took 120 years to double the share of elderly people over 65 in the population (from 7 to 14 per cent). In China or South Korea, the same process took roughly 20 years.1
Demographic change seems closely linked with increases in living stan-dards, improvements in the education and health systems and condi-tions in the labor market. Such improvements in living conditions also affect fertility rates: as life expectancy increased over the last 100 years, fertility rates have steadily declined. The causes of this decline are mani-fold. One of the most important is the fact that the probability of children
figure 7.1 life expectancy at birth in developed countries
Source: UN Population Prospects male female
In years
90
85
80
75
70
65
60
5519501955
19701975
19901995
20102015
20302035
20502055
20702075
20902095
138 139

work environments and, last but not least, increased investment in preventing diseases.
II more years spent in good healthMany epidemiological studies have demonstrated that, throughout most of the years gained in life expectancy, we remain healthy and indepen-dent.8 An 80-year-old today is about as healthy as a 70-year-old was 20 years ago.9 Some developed countries, however, such as the US and Russia, seem to have fallen off this trajectory at present, which highlights the fact that this development is not automatic but the result of complex societal and individual efforts.10
III Cognitive aging 2.0We tend to fear mental – cognitive – aging because of the negative stereotypes equating old age with dementia, or at least becoming for-getful and slow, and therefore unable to keep track of what is going on
An 80-year old today is about as healthy as a 70-year old was 20 years ago
I we have expanded our livesThe enormous expansion of the average life expectancy is the first evidence that human aging is modifiable. The aging processes we have observed in our parents and grandparents will not necessarily apply to us in the same way; neither will our own aging process apply to our children and grandchildren.
Average life expectancy is easy to measure, which is why demographers have been using it to study historical changes in biological aging. They found that the human species has managed to increase its average life expectancy by 40 years since 1840.6 This expansion of the life span shows how biology and socio-cultural contexts interact; not only biological but also cultural evolution plays an important role.7 The cultural changes that have helped us live longer include improved hygiene and nutrition, better accident prevention (especially for children and young people), develop-ment of medical knowledge and practice, better education, healthier
194number of deaths from tuberculosis per 100,000 people in the US in 1900, compared with 0.7 per 100,000 people in 2011
140 141

openness increases, rather than decreases, over time.15 Thus, personality is not set in stone but rather depends on the incentives and disincentives to which we are exposed at various ages. Future societies may make use of this insight by helping older people to stay engaged and exposed to new situations.
V The power of beliefThe way in which we think about aging also affects how we age. People who adhere to negative stereotypes about aging have less self-esteem and self-confidence and hence their motivation is lower and their mental performance declines.16 In a long-term study, it was found that middle-aged people who believe they will be sick and helpless in old age tend to have shorter lives – on average, seven years less than those who believe that old age will bring them lots of freedom and opportunities to do things they never had time to do before.17 The study made sure that indi-vidual socio-economic circumstances, objective health and subjective well-being in midlife did not skew the results. It showed that people with negative expectations of their old age actually lost their will to live.
This self-fulfilling prophecy of the fear of aging has also been document-ed in the workplace. Older people who work in a company with negative
7years is the difference that a positive outlook on aging can make to life expectancy
around us. But we now have evidence that such an outcome is not neces-sarily our destiny. From one generation to the next (what demographers call “cohorts”), there are massive – and positive – differences in intellec-tual functioning. In other words, each generation is more intelligent than the previous one.
These improvements in cognitive functioning help to ameliorate the negative effects of the observed age-related slowdown, for instance, in processing new information. This tendency towards higher levels of cognitive performance in old age is so pronounced that, even though the UK, for example, will be a much older society in terms of its mean age in 2042, it will be cognitively younger.11
Moreover, researchers have found that we can actively influence age-related loss in mental capacity in later life. Aerobic exercise seems to work best: moderately strenuous exercise three times a week for 45 min-utes is proven to keep up cognitive performance.12 This increases the speed of information processing, with areas of the brain that have already undergone age-related decline showing signs of reactivation. The mech-anisms that seem to be responsible for this change, which have been primarily established in animal research, are condensing connections between neurons (nerve cells), neurogenesis (the process by which new neurons are created) and changes in the dopaminergic metabolism that are crucial for the transmission of information in the brain, which under-goes age-related declines.
IV we are who we are, aren’t we?National and international studies have found that, as we age, our self-esteem, subjective well-being and ability to control our lives do not or only minimally decline. As we get older, we find it easier – not harder – to adapt. Emotional stability, conscientiousness and affability grow. Older people are, on average, socially more competent and more agreeable. They are better in defining goals as they have a better knowledge of their limits. Older people are also more effective in adapting their ways of reaching a goal.
On the downside, older adults are less open to new experiences. There-fore, while older people find it easier to adjust, and their social skills improve, their potential for personal growth declines.14 This, however, does not have to be the case. If older people continue to be exposed to new activities and receive training for them, research shows that their
Moderate exercise three times a week is a good way to keep up cognitive performance
Older people are, on average, socially more competent and more agreeable
142 143

higher health care costs. So, rather than fretting about these increasing costs, societies in which people live longer need to commit unequivo-cally to the investments required to keep citizens healthy. At the same time, they also need to put checks and balances in place that make sure that health-care providers and other participants in the health-care system do not unduly profit.
The health system of the future will truly deserve its name: rather than being a system for curing illnesses, it will promote health from the very beginning of life until its very end. Doctors shall be paid according to the health, not the illness, of their patients.
II we will reorder our livesWe can only achieve these health, education and work-related goals if we reorder our lives. The current structure of our lives focuses on educa-tion at the beginning, work in the middle and leisure towards the end. In future, we will rearrange this structure so that these three domains will run parallel across our the whole of our lives. We should then be able to switch back and forth between work and educational episodes at any time, but also between work and family or leisure. Employers will have to help make this possible (see chapter 12).
Education, work and leisure will run in parallel across the whole of our lives
figure 7.2 lifelong learning
Source: Eurostat
share of the working age population who have recently taken part in some form of training, in per cent, 2013
switzerland
35
30
25
20
15
10
5
0denmark swedenfrance ukspainItalygermany
male female
stereotypes about older workers also perform worse and are less motivated than others of the same age who work in companies where a more positive image prevails.18
These five examples show that if we – both as individuals and collectively as a society – keep a positive attitude towards aging and make the efforts necessary to enjoy our longer lives, then aging in the year 2040 and beyond will be a more positive experience than what we have known in the past. In the following, I will sketch the image of a society that is aging and possibly also shrinking, or what I call a society of longer and fewer lives. It is up to us to create this kind of society.
five features of a society of longer of and fewer lives
I we will need to value education, health and work A society of fewer people with longer lives will have to reshuffle its priorities. It must pursue three goals first and foremost: education for all ages and levels, healthcare for everyone and satisfying work at all levels of education.
Econometric modeling, for instance, suggests that if we invest more in each individual’s education, a society can survive and stay productive with fertility rates of only 1.4 to 1.7, rather than 2.0 or 2.2 – the rates generally defined as the replacement level.19 Moreover, these simu lations do not include the productivity-enhancing effects of lifelong educational invest-ments but only focus on education in the first 20–25 years of life.
Another crucial factor in keeping a society of longer and fewer lives productive will be higher participation in the formal labor market. There are four major ways of doing this: getting more older people (over 55) into work; increasing the participation of women in the labor force; insuring more young people get a high-school degree and therefore have better job prospects; and attracting more qualified labor from abroad (see chapter 12). If Germany managed to increase its labor force participation to the higher levels in Denmark or Switzerland, for example, it could offset the potentially detrimental economic effects of demo-graphic change.20
Additionally, good health cannot be valued highly enough in a society of fewer people with longer lives. Even if governments manage to keep a grip on their healthcare systems, it is a fact that longer lives will entail
With better education, a society can stay productive even with very low fertility rates
144 145

IV work will be more flexible and variedA new ordering of our life course also requires more flexible labor markets and pension systems. “Lifetime working-hours accounts” will enable each worker to offset periods of employment with time spent in child-care, retraining or leisure. Our pension systems will allow with-drawals not only at the end but also throughout a person’s life.
Given that there will most likely be fewer workers, the competition for good employees will be stronger. Companies will be keen not to exhaust but continuously develop the productivity of their employees at all levels of qualification. They will put into practice long-term findings about what makes workers more productive – for example, giving them a certain amount of autonomy in as well as appreciation of their work. But most importantly, to avoid physical and mental exhaustion, it will be common practice to change tasks and/or professions during the course of a work-ing life. We now know, for example, that assembly-line workers who alternate their tasks more often have higher levels of cognitive function-ing than do those that perform the same tasks over a long period.22
Aside from task and job changes, it will rejuvenate our bodies and brains to take a good break from work once in a while in order to return with new energy and ideas. Work is of the utmost importance for us as individ-uals and societies, not only economically but also to provide meaning and structure to our lives. In the future, older people will seek to be involved much longer than today – and diversify their activities (see chapter 12). While voluntary activities keep growing, there will be more opportunities for paid work throughout adult life because we will need the input of all generations for our economies.
These new life course patterns will result in a society that mixes age groups in all spheres of life rather than segregating them.23 Thus, we will be able to make the most of each age group’s strengths and counter-balance its weaknesses.
V Infrastructure and technology will serve all agesIn a society of longer and fewer lives the majority of citizens will live in or close to large metropolitan areas. New infrastructure and planning will help people of all ages to get the most out of urban living (see also
chapter 9). For instance, neighborhood-based housing structures will allow different generations to help each other easily by exchanging what each has to offer, be it spare time or physical strength.24
It will become common practice to change tasks and/or professions in the course of a working life
Companies will be keen not to exhaust but continuously develop the productivity of their employees
We also need to find ways to finance such family or educational sabbat-icals. For instance, it may be possible to use retirement funds not only at the end of life but also all along as we make contributions. A society of fewer people with longer lives shall cherish and incentivize different types of activity – not only paid work in the classical sense but also, for example, care provision for children and/or elderly parents as well as repeated learning episodes that increase productivity.
III learning not just for the youngCrucial to this new life course structure will be an educational system that offers adequate opportunities for all ages and levels of qualification, is easily accessible to everyone and employs teachers qualified to train people of all ages (see box 9). A lifelong education system will help us deal with a rapidly changing world, both in our everyday lives and our jobs (see figure 7.2). Lifelong learning will allow us to maintain – even increase – our productivity and keep us employable as well as healthy. Educational investments pay off in general welfare. Therefore, governments must create better incentives for continuing education – for instance, tax cuts or social insurance benefits linked to further training.21
97the age at which Allan Stewart from Australia gained his masters degree in clinical science, making him one of the oldest students in the world
146 147

or worse, the human species is characterized by enormous adaptability. We need to become more aware of this opportunity for change and col-lect ever better information about exactly which socio-cultural features facilitate healthy, active aging. Societies in the year 2040 and beyond will no longer measure their success purely in terms of economic output. New measures of achievement will include investments in health and education across the human life span as well as the ability to combine work with other goals in life. Such indices will help citizens of this planet decide where they want to settle to shape and enjoy their longer lives.26
Contextual and personal resources are needed to increase openness to new experiences” in Psychology and Aging, Vol 27, Issue 3, 2012, pp 855–866.
16 Rothermund, Klaus, “Effects of Age Stereotypes on Self-Views and Adaptation” in Werner Greve, Klaus Rothermund and Dirk Wentura (eds), The Adaptive Self: Personal Continuity and Intentional Self-Development, Hogrefe & Huber, Cambridge, MA, 2005, pp 223–243.
17 Levy, Becca R., Martin D. Slade, Suzanne R. Kunkel and Stanislav V. Kasl, “Longevity increased by positive self-perceptions of Aging.” Journal of Personality and Social Psychology, Vol 83, Issue 2, August 2002, pp 261–270.
18 Catherine. E. Bowen, C. Maring G Noack and Ursula M. Staudinger, “Aging in the Work Context” in K Warner Schaie and Sherry L. Willis (eds.), Handbook of the Psychology of Aging, 7th edition, Academic Press, San Diego, 2006, pp. 263–277.
19 Erich Striessnig and Wolfgang Lutz, W., “Can below- replacement fertility be desirable?” in Empirica, Vol 40, Issue 3, 2013, pp 409–425.
20 Axel Börsch-Supan, Marcel Erlinghagen, Karsten Hank, Hendrik Jürges and Gerd G. Wagner, Produktivität in alternden Gesellschaften: Altern in Deutschland, Band 4, Wissenschaftliche Verlagsgesellschaft mbH, Stuttgart, 2009.
21 Ursula. M. Staudinger and Heike Heidemeier, “Altern, Bildung und lebenslanges Lernen – Eckpunkte für Handlungsan-sätze.” In Ursula M. Staudinger and Heike Heidemeier (eds.), Altern, Bildung und lebenslanges Lernen: Altern in Deutsch - land, Band 2, Wissenschaftliche Verlagsgesellschaft mbH, Stuttgart, 2009, pp 269–279). Also in Ursula M. Staudinger and Heike Heidemeier, Altern, Bildung und lebenslanges Lernen, Nova Acta Leopoldina, No 364, Vol 100, 2009.
22 Jan Oltmanns, Ben Godde, and Ursula M. Staudinger, “Job-related task changes as facilitators of cognitive devel- opment”, manuscript in preparation.
23 Matilda White Riley, and John W. Riley, “The lives of older people and changing social roles” in The Annals of the American Academy of Political and Social Science, Vol 503, 1989, pp 14–28.
24 Stephan Beetz, Bernhard Müller, Klaus J. Beckmann and Reinhard F. Hüttl, Altern in Gemeinde und Region: Altern in Deutschland, Band 5, Wissenschaftliche Verlagsgesell-schaft mbH, Stuttgart, 2009.
25 Ulman Lindenberger, Jürgen Nehmer, Elisabeth Steinhagen-Thiessen and Julia Delius, Altern und Technik: Altern in Deutschland, Band 6, Wissenschaftliche Verlagsgesellschaft mbH, Stuttgart, 2011.
26 Mastering demographic change in Europe. 8 European Academies’ Statement, German National Academy of Sciences Leopoldina, Halle (Saale), 2014.
Ursula M. Staudingeris a lifespan psychologist and an internationally acknowledged aging researcher. She is Founding Director of the Robert N. Butler Columbia Aging Center. Prof Staudinger’s academic leadership is reflected in her appointments as Vice President and Foreign Secretary of the German National Academy of Sciences and Chairwoman of the Board of the Federal Institute of Population Research.
Technological change will also make aging easier.25 Innovations will include biotechnology – for example, techniques used in stem cell therapy – and the use of regenerative tissue, such as retina implants. But also more traditional, electronic, mechanical devices will play an important role, such as exoskeletons that allow paralyzed patients to walk or grip things. Electronic assistants will help older people in their jobs and at home – for example, electronic arms for lifting heavy goods and robots to help with cleaning.
At the same time, it will be crucial that such assistive technology does not discourage people from using their bodies and brains but only supports them when necessary. In the future, we will also use such technologies to train our brains and to support healthy lifestyles. Special gadgets, for instance, might be able to remind us to act in a way that supports our good health and give us feedback about the consequences of our behavior patterns.
The future starts todayIt is crucial for all of us to realize that, in shaping the future of aging and old age, we simultaneously compose the future of our societies. For better
1 Kevin Kinsella and Wan He, An Aging World: 2008. International Population Reports, U.S. Census Bureau, Washington, DC, 2009.
2 Günter Stock, Jörg Hacker et al, A Future with children: Myths, Core Concepts and Recommendations on Fertility and the Development of Society, Leopoldina Nationale Akademie der Wissenschaften and Berlin Brandenburgische Akademie der Wissenschaften, Berlin, 2013.
3 Wolfgang Lutz, William P. Butz and KC Samir (eds.), World Population and Human Capital in the Twenty-First Century. Oxford University Press, 2014.
4 Mastering demographic change in Europe: 8 European Academies’ Statement, German National Academy of Sciences Leopoldina, Halle (Saale), 2014.
5 Paul B. Baltes, Ulman Lindenberger and Ursula M. Staudinger, “Life Span Theory in Developmental Psychology” in William Damon and Richard M. Lerner (eds), Handbook of Child Psychology, Vol. 1, Theoretical Models of Human Development, 6th edition, Wiley & Sons, New York, 2006, pp 569–664.
6 Jim Oeppen and James W. Vaupel, “Broken limits to life expectancy” in Science, Vol 296, Issue 5570, 2002, pp 1029–1031.
7 For example, William H. Durham, “Advances in Evolutionary Culture Theory” in Annual Review of Anthropology, Vol 19, October 1990, pp 187–210.
8 Kaare Christensen, Gabriele Doblhammer, Roland Rau, James W. Vaupel, “Ageing populations: the challenges ahead” in The Lancet, Vol 374, Issue 9696, 3-9 October 2009, pp 1196–1208.
9 James W. Vaupel, “Biodemography of human ageing” in Nature, Vol 464, Issue 7288, 2010, pp 536–542.
10 Eric N. Reither, S. Jay Olshansky, and Yang Yang, “New Forecasting Methodology Indicates More Disease And Earlier Mortality Ahead For Today’s Younger Americans” in Health Affairs, Vol 30, No 8, 2011, pp 1562–1568.
11 Vegard Skirbekk, Marcin Stonawski, Eric Bonsang, and Ursula M. Staudinger, “The Flynn effect and population aging” in Intelligence, Vol 41, Issue 3, 2013, pp 169–177.
12 Claudia Voelcker-Rehage, Ben Godde and Ursula M. Staudinger, “Cardiovascular and coordination training differentially improve cognitive performance and neural processing in older adults” in Frontiers in Human Neuroscience, 5, 2011, pp 1–12.
13 Ursula M. Staudinger, “Personality and Aging” in Malcolm L. Johnson (ed), The Cambridge Handbook of Age and Ageing, Cambridge University Press, 2005, pp 237–244.
14 Ursula M.Staudinger and Ute Kunzmann, “Positive adult personality development: Adjustment and/or growth?” in European Psychologist, Vol 10, Issue 4, 2005, pp 320–329.
15 Mühlig-Versen, Andrea, Catherine E. and Ursula M. Staudinger, “Personality plasticity in later adulthood:
Neighborhood-based housing structures will allow different generations to help each other
148 149

How we lived 125 years ago
by Greg Langley
BOx 6
With time on his hands, Thomas would often sit in the morning sunlight cast through the window of their small fifth-floor apartment, smoking one of the Paladin cigarettes that he kept in the red tin in the living room and reading the pages of the Berliner Tageblatt. Mina would often startle him when she rushed into the room.
When she did, she put it down to the fact that her papa was lost in loneliness for his late wife, Johanna, who had passed away painfully of puerperal fever after giving birth to Mina. Despite advances in nutrition, sanitation and health-care, people in cities still died at a higher rate than those in the coun-tryside. Childbed mortality was particularly common. Not until the 1930s would it drop noticeably (from 500 for every 100,000 births to seven per 100,000) as obstetricians finally accepted that asepsis prevented disease.
Although many widowers remarried, also in order to save the expense of a housekeeper, her father never did – even though Johanna was only 37 when she died, well short of the average life expectancy (life expectancy at birth was only 43 years for women, which was due to high infant mortality rates; those who survived childhood, could expect to live to 65 on average).
In the early years of their marriage, Johanna had insisted that Thomas join a general health insurance company so that, in case of illness, the doctor and the pharmacy would be free of charge, and a bit of sick pay would be granted as well. While it returned nothing on Johanna’s death, it had helped Thomas
One February day in 1890, Wilhelmina Schmitt, aged 24, walked briskly down a busy commercial street in Berlin. She was dressed in a simple dark jacket with puffed arms, a lace blouse and a long, pleated skirt too formal for her pace. She feared she would be late for her father’s funeral.
Thomas Schmitt, the family patriarch, had died four days earlier from the influenza that had swept the city that winter. He had lived about eight years longer than was common for men who made it into middle age. Neverthe-less, his passing at age 68 had taken “Mina” and her three older brothers by surprise, as their father had been in robust health until the end.
When he had stopped working as a master locksmith a few years before, it was because of a decade-long downturn in the economy, not because of any noticeable infirmities. “Only two more years,” he joked at his last birthday, “and maybe I can receive the Prince’s new pension.” He was referring to wily Chancellor Bismarck, who the year before had introduced a universal pension scheme – the world’s first – but you had to survive to the almost impossible age of 70 to qualify.
150 151

Employed by the electrical engineering concern of Siemens & Halske, Ernst had a promising career as an accountant. He and his seven-year-younger bride had moved to Kreuzberg to be closer to the rapidly growing firm. Costing the princely sum of 62 marks a month, the apartment had three rooms and featured the luxury of cold running water.
As she hurried towards the church, Mina worried what the death of her father would mean for her own future. Unmarried and without a suitor, the family would expect her to help Helene, Karl’s wife, in exchange for upkeep.
Mina’s youngest brother, Diederich, a public servant in the Royal Prussian registrar’s office, had made it very clear that he did not approve of working women. “You are just blocking your own marriage prospects,” he told her when she first took a job. Diederich’s admonitions always carried particular weight because of his stern looks and his imposing height of 187 centimeters – which made him almost a head taller than the average man at the time.
Yet, giving up her employment as a clerk for the Wertheim brothers on Rosenthaler Straße was not something she was prepared to do. The pay was modest (and of course only about half that of the men), and the hours long, with barely a break in between. But Mina loved the hectic pace, and the ideas the brothers had brought from Stralsund were exciting. Middle-class customers came in their droves to exercise the right to return faulty goods and because prices were clearly marked and didn’t have to be haggled.
Mina sighed before entering the church. Boys were treated with respect and called “Herr” as soon as they stopped wearing short pants. Would there ever be a day when an unmarried woman, regardless of her age, would not be addressed as “Fräulein” (little woman) – as if only a union with the opposite sex would make a woman mature?
She quickly brushed her thoughts away, feeling guilty that she worried about her own concerns at a time of such tragedy. After composing herself to honor her beloved father, she pushed open the church door and walked inside.
Greg Langley is chief editor of PROJECT M (www.projectm-online.com)
make ends meet whenever he got sick during his working years, and it would now pay a small benefit to cover his funeral expenses.
Stepping out onto Spittelmarkt, Mina carefully picked her way through the confusion of delivery and garbage carts, horse-drawn trams, Hansom cabs and even a cyclist on a penny-farthing bicycle. As she crossed the road, she reflected that the year had earlier started with joy.
A girl had been born to her oldest brother Karl, aged 36, and his wife, Helene, 28. It was the couple’s third child – all girls – in five years. They had very much hoped for a boy this time, but the baby, Gretel (named after the heroine of the Brothers Grimm fairy tale) was a sweet bundle. Undoubtedly, more would follow, though the trend was clearly moving to smaller families of four children or fewer. Ernst, Mina’s middle brother, had also, at the advanced age of 33, finally gained permission to marry his beloved Maria, the daughter of a local Catholic shopkeeper. Neighbors looked askance at the betrothal, as interfaith marriages were rare (only 8 per cent of marriages overall). But Ernst was smitten the first time he saw Maria behind the counter of her parents’ store, surrounded by barrels of pickles and herrings, and arranging signs that advertised raisins for five pfennigs and sauerkraut for 10. Eventually, his heartfelt conviction had worn down both his and Maria’s skeptical fathers.
152 153

retirement in 2040: Two european stories
June 1st, 2040. Berlin, germanyKarl Weiss closes the screen on his multi-media device and sighs with relief. He has just checked his online bank account: his first monthly pension transfer has come in on time and in the expected amount. His pension will allow him to maintain his comfortable lifestyle, and every year from now on it will increase with inflation. Karl’s regular income will also include quarterly payments from his voluntary – but tightly structured – private pension fund.
Karl owes the fact that he is so well provided for to the “Finance for everyone” night classes he attended 20 years earlier. Almost every year since then, he has gone to a one-day “Update your finance know-how” seminar. “A small investment for a big return,” he thinks, smiling to himself.
European pensions and social security: Can there be a happy ending?by Elsa Fornero
CHAPTer 8
If we change our attitudes, the future will be more certain …
155
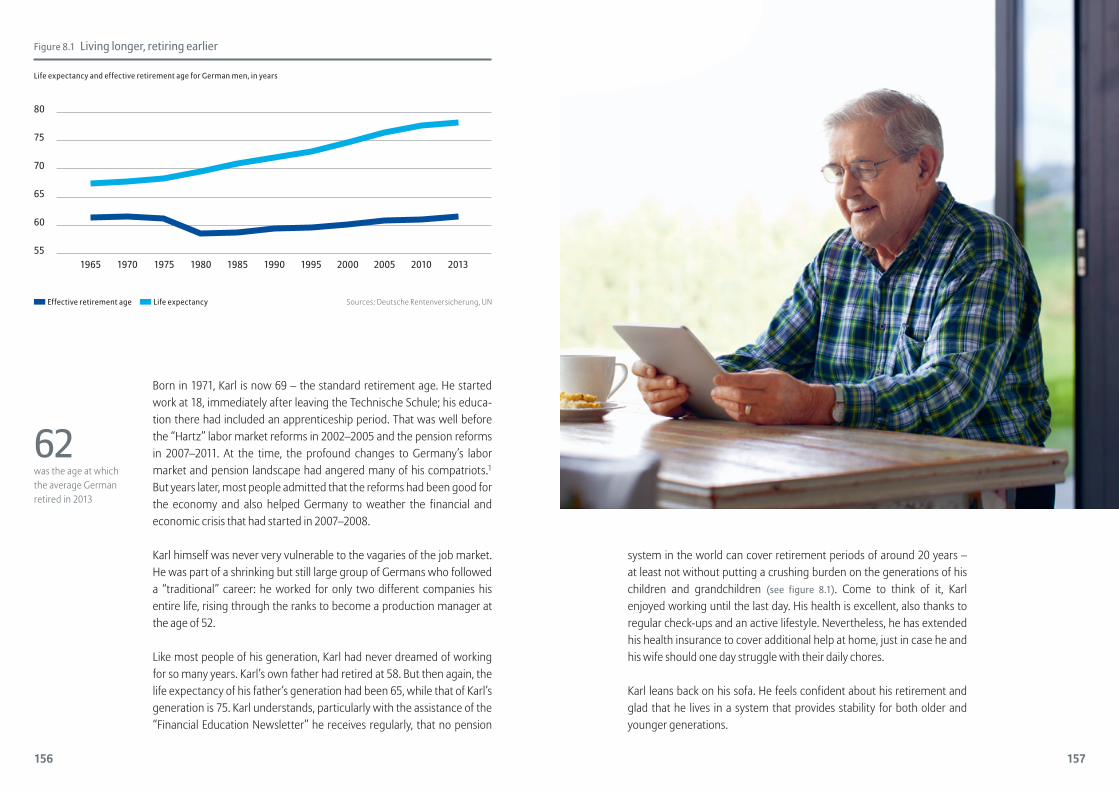
system in the world can cover retirement periods of around 20 years – at least not without putting a crushing burden on the generations of his children and grandchildren (see figure 8.1). Come to think of it, Karl enjoyed working until the last day. His health is excellent, also thanks to regular check-ups and an active lifestyle. Nevertheless, he has extended his health insurance to cover additional help at home, just in case he and his wife should one day struggle with their daily chores.
Karl leans back on his sofa. He feels confident about his retirement and glad that he lives in a system that provides stability for both older and younger generations.
Born in 1971, Karl is now 69 – the standard retirement age. He started work at 18, immediately after leaving the Technische Schule; his educa-tion there had included an apprenticeship period. That was well before the “Hartz” labor market reforms in 2002–2005 and the pension reforms in 2007–2011. At the time, the profound changes to Germany’s labor market and pension landscape had angered many of his compatriots.1 But years later, most people admitted that the reforms had been good for the economy and also helped Germany to weather the financial and economic crisis that had started in 2007–2008.
Karl himself was never very vulnerable to the vagaries of the job market. He was part of a shrinking but still large group of Germans who followed a “traditional” career: he worked for only two different companies his entire life, rising through the ranks to become a production manager at the age of 52.
Like most people of his generation, Karl had never dreamed of working for so many years. Karl’s own father had retired at 58. But then again, the life expectancy of his father’s generation had been 65, while that of Karl’s generation is 75. Karl understands, particularly with the assistance of the “Financial Education Newsletter” he receives regularly, that no pension
62was the age at which the average German retired in 2013
figure 8.1 living longer, retiring earlier
Sources: Deutsche Rentenversicherung, UN effective retirement age life expectancy
1965 1970 1975 1980 1985 1990 1995 2000 2005 2010 2013
life expectancy and effective retirement age for german men, in years
80
75
70
65
60
55
156 157

the new system. But now it is widely seen as fair, particularly to the younger generation.
Carlo’s working life has had its ups and downs. It took him almost two years to find his first proper job. He had several spells of unemployment, the longest one during the “great contraction” of 2008–2014, and a hectic couple of years when he ran a pizzeria with his wife Marta. Finally, in 2016, when the Italian economy started to recover, he landed the job at the food distribution company, where he stayed until his retirement.
Carlo’s pension will not be big, but it should be enough for a decent life, especially since the Bianchis – like three quarters of their generation – own their home. Marta also has her own (albeit much smaller) pension. So she is not fully reliant on her husband, nor on a meagre widow’s pension, should he die before her.
The Bianchis can rely on a reasonably well-functioning healthcare system. Like many of their fellow retirees, they also count on their daughter to provide care should they become frail – although Alessandra is very busy with her wine business. She started the company with the help of some of her parents’ savings, and it has become a moderate success of which the whole family is proud.
Carlo also did another clever thing: many years ago, he took the option of transferring the “severance pay fund”, to which every Italian was entitled at that time, into his occupational pension fund. This tidy sum (amounting to around 7 per cent of his annual salary) will now bolster his retirement benefits.
Although Carlo has never enrolled in any financial courses, he has benefited from the general increase in financial awareness that followed the crisis years of 2008–2014. Back then, Italians began to realize that their reformed pension system would require them to make important choices themselves. TV programs, newspaper supplements and govern-ment-sponsored leaflets helped Carlo and Marta’s generation to under-stand things like compound interest and risk diversification. As a result, the Bianchis can look forward to sunny times in the hills of Umbria.
45years was the median age in Italy in 2013
October 1st, 2040. Bologna, ItalyCarlo Bianchi is toasting his last working day with his colleagues at the food distribution company where he has been working for the last 25 years. Carlo is almost 70, and he is now looking forward to moving to Umbria and helping out at his daughter Alessandra’s vineyard.
A long time ago, when Carlo was in the early stages of his professional life, Italy had one of the lowest retirement ages in Europe. After several starts and stops, the pension reforms of 2010–2011 substantially increased the pension age by making it much harder to retire early and by linking future retirement ages to life expectancy. Many Italians took their time to accept
158 159

strengthened the link between individual contributions and pension pay-outs;
encouraged pre-funding of pensions by making it easier for people to participate in (mainly occupational) pension funds;
gave workers the possibility (within strict limits) to link their pension to prices or nominal wages;
harmonized entitlements for men and women; raised retirement ages and, thanks to the link between contributions
and benefits, made them more flexible. This gave workers the freedom to choose when to retire – within specified limits and with his or her pension adjusted accordingly;
created automatic links between demographic changes, such as increases in life expectancy, and adjustments in the pension system;
tightened access to early retirement and disability schemes; reduced pension payouts for those choosing the remaining early
retirement options; enhanced transparency, partly through better information for
workers; allowed people to transfer their pension entitlements from one EU
country to another.
from crisis to turning pointLet’s stay in 2040 and dream on. Let’s assume that these two stylized stories illustrate the success that European countries have had with big and bold reforms in the early decades of the 21st century. Pension reform had been on the agenda in Europe for decades. But it was the financial and economic crisis that started in 2007–2008 that forced several Euro-pean countries – not only Italy, but also Spain, Portugal and Greece – to get serious about putting their social security systems on a stronger footing. Given how turbulent these crisis years were, this was a difficult task. But these troubled countries lived up to the original meaning of the Greek word “crisis”, namely turning point. A turning point can signal oppor tunity as well as a catastrophe.
European countries grasped this particular opportunity and pushed through important changes.2 By 2014, Europe was at a crossroads. With the European economy slowly recovering, would governments slacken their reform efforts? Or would the reforms already implemented create a kind of virtuous circle in which positive changes generate the growth and courage needed for further measures? Let’s assume for a moment that Europe went into this virtuous circle, and spin our story further …
what europe did nextFollowing the initial changes to job markets and pensions systems in the troubled southern European countries, the reform momentum spread to other places, including France, Belgium, Germany, the Netherlands and some northern European countries that had been doing better economi-cally but were resting on their laurels. Those countries that had under-gone initial pension reforms in 2008–2014 went further and redesigned their entire social security systems in a consistent way.
In many European countries, the ratio of old-age pensioners to the work-ing age population (the old-age dependency ratio) nearly doubled between 2000 and 2040. This resulted in an ever-growing tax burden on workers and a shift in government spending away from education and other investments towards pensions and healthcare for older genera-tions. Only the social security reforms implemented after the 2008 crisis helped to restore a fairer generational balance in Europe.
Although European countries followed their own, tailored paths to pension reforms in 2020–2030, a common pattern emerged, as govern-ments everywhere
By 2014, Europe was at a crossroad: would reforms slacken or create a virtuous circle?
28people over 65 for 100 people of working age in Italy in 2013, compared with 19 in Ireland
160 161

Any successful pension reform starts with a shift in attitudes. People should no longer see pensions as welfare or redistribution but as an insurance mechanism tailored to each indi-vidual that also takes into account the broader risks that apply to whole generations and groups of people.
What governments should aim for in a pension system is a balance between general obliga-tions (for example, what share of your salary you must pay into the system) and personal choices (for example, when you decide to retire within the given options). In this way, citizens become aware of the features, options and costs of their pension system. They no longer see a pension as something that the govern-ment will somehow provide, but as an entitle-ment that they first need to acquire.
Bearing this in mind, a solid pension reform should reflect the following aspects: 1
I A “mixed” system – partly public and funded through taxes or social security contributions and partly private and reliant on pension
funds – allows the best diversification of risk. The transition from one system to another is tricky and needs to be planned carefully.
II Governments must consider a society’s en tire life cycle – education, active working life, retirement – which means integrating labor market and pension policies. It also means moving from a pension system based on “defined benefits” (in which retirees receive a pre-determined, usually generous, monthly pension) to one based on “defined contri-butions” (in which the size of the monthly pension depends on the contributions an individual has made throughout his or her working life). The defined contribution formula increases the savings function of the pension system, avoids the penalties on later retirement that occur in the defined benefits system and makes it easier for workers to take their pension from one job to the next – which is important in today’s more dynamic labor markets. Defined contribution systems are also more transparent and less vulnerable to political meddling.
What solid pension reform should look likeby Elsa Fornero
Europeans not only reshaped their pension systems, they also imple-mented a self-reinforcing package of reforms designed to boost their economies’ competitiveness, generate steady growth, deal with the aging of societies and, to some extent, harmonize social security systems across the EU.3 They also addressed some of the gaps in income and wealth that had widened during the “golden age” of free markets before 2008. During the turbulence of 2008–2014, few Europeans could have imagined that the crisis would result in a successful move towards efficiency and solidarity.
The reform package that European countries implemented included more flexible labor markets, the privatization of some public services and more emphasis on education, innovation and scientific research. Other measures were designed to bring more women into employment and to give younger people an easier start to their working lives.
Younger people in particular had faced growing uncertainty from around the 1990s onwards, as globalization and technological change started profoundly to affect the job market. While their parents had mostly enjoyed secure jobs and steady growth in earnings, younger people often faced spells of unemployment, got stuck in part-time or temporary jobs and struggled to get a reliable monthly salary.
The apprenticeship systems that had helped Germany and other central European countries get so many young people into decent jobs needed to be updated. By 2014, between a quarter and a third of new jobs were in innovative and rapidly transforming areas, in which the traditional three-year apprenticeships made little sense. Politicians and experts started looking at measures that would allow young people periodically to leave work in order to update their education. Today, in 2040, public financial support for lifelong learning is part of the new integrated work-retirement welfare.
Women also benefited from the general reform momentum. Changes to the welfare system interacted with long-term trends affecting women’s role in the economy and society. In the 20th century, women were able to join the labor force not only because of changing social attitudes but also because of the broader availability of organized care for children and the elderly – not to mention the universal introduction of washing machines, vacuum cleaners and electric ovens.
Younger people often faced spells of unemploy ment, got stuck in part-time or temporary jobs and struggled to get a reliable monthly salary
14 millionyoung people across the EU were not in employment, education or training in 2013
33 %of women in the EU worked part-time in 2013, compared with 9 % of men
162

While women were free to go to out to work, however, they still had to do the bulk of the household chores. Especially in southern Europe, many women still did an additional (unpaid) job at home. Unreformed pension systems “compensated” women by letting them retire earlier than men and giving them generous widow’s pensions.
With their increasing participation in the labor market and public life, as well as changing family structures, women demanded more say over their pensions. They wanted equal treatment compared with men, the same retirement age (which meant better career opportunities in later working years) and more responsibility for their own incomes. By 2040, all European countries finally treated women as “normal” citizens rather than as (dependent) spouses.
These policies designed to support younger workers and women result-ed in an increase in the labor force. More people in jobs meant not only a boost to output but also higher tax revenue, both of which made it easier for European countries to support a growing population of retirees.
Politically, this virtuous circle of reforms was not easy to create. Initially, many Europeans resented the austerity measures imposed by the EU institutions in Brussels. But then the debate became more nuanced, especially after some eurozone countries were able to show off their first successful reforms. After much controversy, many misgivings and lively debate, an entire generation – the then 40 to 65-year-olds – accepted substantial reductions in their original pension promises. In that way, they helped restore Europe’s social and political stability.
Until the turn of the century, reforms in Europe had often been imple-mented piecemeal and with excessive caution, as politicians worried about a backlash from their voters.4 It was the crisis of 2008–2014 that helped politicians overcome their fear of big reforms and allowed them to devise and adopt long-term, consistent programs designed to tackle demographic, economic, social and political changes all in one go. These programs are in full swing in 2040.
A new understanding of reform Coming back to the realities of today, we need to ask ourselves what it would take to move from the deadlocked and often antagonistic reform debates of the past to the kind of virtuous circle that I have described in my 2040 scenario.
Unreformed pension systems “compensated” women by letting them retire earlier than men
53the average age of an elected European politician in 2014
III Retirement ages should go up automati-cally with life expectancy. Such an indexation avoids the political agony and social tensions that usually accompany every decision to increase the pension age.
IV Rules should be uniform and transparent to avoid a fragmentation of the pension system and the emergence of hard-to-abolish pockets of privileges. Instead, the system should include straightforward, tax-finan ced benefits for those workers who did not manage to pay sufficient contributions during their working lives to reach an acceptable retirement income.
V Redistribution must still be part of the system. Benefits should be targeted at the most needy and financed through taxes, rather than through social contributions levied on wages.
VI Governments must make sure that such changes are recognized as progress towards a
more sustainable and equitable system, which also reduces the burden on today’s younger generations as well as those not yet born. State-ments about how fiscal emergencies require austerity are less helpful. Instead, governments must present reforms as a rebalancing of the financial and economic relationship between the generations.
VII Increases in financial literacy are neces-sary to create the broad societal consensus without which pension reforms cannot work. Citizens must be enabled to react to reforms by changing their spending and working habits and improving their planning for the future. Financial literacy is not a sufficient condition for the success of reforms, but a necessary one.
disruptive change2
1 Peter Diamond, “Social Security” in American Economic Review, Vol 94, Issue 1, 2004, pp 1–24.
2 Dick Fosbury was the first high jumper who in the 1960s used a back-first technique to clear the bar
165

European welfare reforms are of the fundamental kind, since they demand not only legal but also cultural and economic changes. People have to abandon long-standing convictions – such as the belief that, when older people work longer, they take jobs away from the young. Businesses have to change their practices; for example, they need to learn to use older workers in a productive manner (see also chapter 12). Most importantly, the current generation of workers has to abandon the idea that they are “owed” a certain old-age provision irrespective of the demographic, economic or fiscal framework.
In the course of 20th century, European countries have become wedded to the idea that pensions should consist of guaranteed, stable and gener-ous payouts at a relatively young age. Typically, these were “defined ben-efit” pensions, which means that the amount that a retiree could expect was fixed in advance as a proportion of an average income in late career.
As societies aged, this system resulted in a huge and increasing mountain of “pension debt” (the net value of future pension entitlement in today’s money). This invisible debt mountain added to the growing (visible) public debt and was clearly becoming unsustainable, especially against the background of rapidly aging societies and sluggish increases in pro-ductivity (see figure 8.2). This left younger workers – and their dwindling number of offspring – with the impossible burden of paying lavish benefits to a fast-growing number of people who retired early but lived increasingly l onger.
Not only were Europe’s welfare systems relatively expensive, they also often worked badly. Over the years, many had become incredibly com-plex, fragmented and hard to understand. This lack of transparency encouraged political tinkering and allowed benefits for the privileged few to persist. The result was often a kind of perverse redistribution that channeled benefits from the less well-off to the middle classes or even the wealthy. European countries had little choice but to redesign the systems – or face sovereign bankruptcy.
In principle, it would have been easier to introduce reforms during a period of steady growth, when sacrifices would have been easier to make than at times of recession. Redistributing a growing pie is always easier than cutting up a shrinking one. But it lies in the nature of electoral politics that no political party will promise to spoil the good times by introducing painful reforms designed to prevent distant problems.
Pension systems created a perverse redistribution from the less well-off to the middle classes
240 %of GDP was the implicit pension debt of Italy in 2009, according to OECD estimates, compa-red with 160 % for west Germany
As Minister of Labor in Italy’s technocratic government during the economic crisis, I was responsible for the design and introduction of a comprehensive pension reform in 2011 as well as labor market reforms in 2012.5 From this very hands-on experience, I have concluded that what we need is nothing less than a new understanding of what reform means for a government, an economy and a society.
Today, international institutions and economists talk about reform as if it were some kind of panacea that will magically improve complex finan-cial, economic and social structures simply through the passage of a law. They seem to assume that, once the law is passed, everyone and every-thing will comply with its letter and spirit.
In practice, however, such transformative effects only work on a small scale for incremental reforms – changes that do not shake the founda-tions of the system but build upon them. Think of a car company design-ing a new model but taking it for granted that a car should have four wheels, an engine and a steering wheel. Things look very different for the fundamental reforms that affect the workings of the system itself. In our example, the car company would call into question the four- wheel concept and the way in which a vehicle is powered and steered. The implementation of fundamental reforms is much more complex and its implications are wide-ranging.
Economists seem to assume that, once a reform law is passed, everyone and every thing will comply with its letter and spirit
1960s 1970s 1980s 1990s 2000s 2010s
figure 8.2 Italian economic growth and public debt
Sources: Eurostat, World Bank, M. Reinhart and K.Rogoff, “This time is different”, 2011 Public debt (left scale) economic growth (right scale)
Public debt, in per cent of gdP economic growth, per cent
140
120
100
80
60
40
20
0
6.0
5.0
4.0
3.0
2.0
1.0
0
−1.0
166 167

This did not happen in Germany, which had to become “the sick man of Europe” before it implemented effective pension and labor market reforms (and they still cost Chancellor Gerhard Schröder his job in the 2005 elections). Italy, Spain, Greece and Portugal had to push through reforms in much stormier economic times, and both the sacrifices required from the people and the political upheaval were far greater.
In the Italian case, the need finally to tackle pension and labor reforms was one – perhaps the main – reason for appointing a technocratic government, the members of which belonged to no political party. Italy’s center-right and center-left parties put aside their long-standing, bitter quarrels and passed the reforms with a huge parliamentary majority – albeit with little conviction or enthusiasm. Immediately after they had approved the laws, the same parties – indeed, the same politicians – started to criticize them and tried (unsuccessfully) to cripple them with amendments.
The Italian example shows that fundamental reforms are not mere tech-nical matters or a quick fix for deep-seated problems. In order to work, such reforms require changes not only in rules but also in behavior. In fact, they can frequently alter the structure of society. For example, when Italy introduced compulsory primary education in 1873, it took families about 15 years fully to grasp that their kids must now go to school.
Fundamental reforms are social investments in that they require sacrific-es today in the expectation of tomorrow’s benefits. They therefore need the strong support of most of the citizens affected. It is important to get the technical aspects of reforms right. And it is at least as important to inform the population about the planned steps and their implications and to give them access to financial education so that they can benefit from the new system in the future.
Inform, implement, educateGiven the demographic transition that we are going through in Europe, fundamental reforms must no longer be distant ideas. They are a political necessity – now. Today, those of us who are middle-aged or above are still enjoying an almost unprecedented concentration of wealth (including generous pension entitlements), privilege and political power. But this concentration has left many younger people struggling financially and with limited options. In many European countries, unemployment rates for younger people are twice what they are for more senior workers.
Germany had to be-come “the sick man of Europe” before it im-plemented pension and labor market reforms
87 %of people in the Eurozone agree that pension reforms are important (but 70 % are against raising retirement ages as a way of making pension systems more sustainable)
168

The efficiencies of electronic banking can only be reaped if customers understand how their bank accounts work. People can only make clever investments if they understand how interest rates and yields affect their savings and if they grasp the difference between risk and uncertainty.
Therefore, financial education must go beyond helping wealthy individ-uals understand their complex financial portfolios. It must become a tool that allows citizens to make less complex – but fundamental – choices about their financial future.
1 Alexander Börsch-Supan, “Living Standards in an Aging Germany: The Benefits of Reforms and the Costs of Resistance” in Journal of Economics and Statistics, Vol. 229, 2+3, 2009, pp 163–179.
2 See The 2012 Ageing Report: Economic and budgetary projections for the 27 EU Member States (2010–2060), European Commission, 2012. Pensions at a Glance 2013: OECD and G20 Indicators, OECD, 2013. Pension Adequacy in the European Union 2010–2050, European Commission, 2012.
3 Axel Börsch-Supan, Klaus Härtl and Alexander Ludwig, “Aging in Europe: Reforms, International Diversification, and Behavioral Reactions”, in American Economic Review, Vol 104, Issue 5, 2014, pp 224–229.
4 Gøsta Esping-Andersen, “Welfare States at the End of the Century” in Family, Market and Community, OECD, 1997.
5 Elsa Fornero, “Reforming labor markets: reflections of an economist who (unexpectedly) became the Italian Minister of Labor” in IZA Journal of European Labor Studies, Vol 2, Issue 20, 2013.
6 Tito Boeri and Guido Tabellini, “Does information increase political support for pension reform?” in Public Choice, Vol 150, Issues 1–2, 2012, pp 327–362.
7 Annamaria Lusardi and Olivia S. Mitchell, “Financial literacy around the world: an overview” in Journal of Pension Economics and Finance, Vol 10, Issue 4, 2011, pp 497–508.
Elsa Fornerois Professor of Economics at the University of Turin in Italy and scientific coordi- nator of CeRP, the Center for Research on Pensions and Welfare at the Collegio Carlo Alberto. In 2011–13, she was the Italian Minister of Labor, Social Policies and Equal Opportunities, during which time she drafted the pension and labor market reforms that were then approved by the Italian Parliament. Prof Fornero is the author of a large number of publications on household savings, pensions systems and reforms and is now working on economic and financial literacy. For many years she regularly contributed op-eds to Il Sole-24 Ore, Italy’s leading business daily.
Financial education must go beyond helping wealthy individuals understand their complex portfolios
The demographic transition therefore represents a challenge not only because of shrinking labor forces but also in terms of income distribution and the perspective we can offer to younger people. Fundamental reforms are needed to offset the effects of demographic transition. We need them to make our social systems efficient, inclusive and sus-tainable again.
Social security reform cannot be left to economists, lawyers and actuar-ies. The concept of reform must become much more comprehensive and encompass three different dimensions:
I Information6
Reforms will be useless, or even produce a backlash, if they are not firmly endorsed by the political forces that have a parliamentary majority. These political forces must act as a bridge between the public, govern-ment officials and experts. Reforms must never be mere theoretical constructs, concocted by eggheads behind the closed doors of uni-versities or research centers. Any big reform must include a broad social and political debate. Politicians must personally stand up for their reform projects to give them a “face” and make them less abstract.
II ImplementationWe must move away from the naive idea that one legal change can miraculously save a whole economy. Even if we just look at the legal aspects of fundamental reforms, these constitute a complex process designed to deal with a complex society. Any big reform will require several laws, usually over a period of years. To implement reforms, gov-ernments often have to set up new institutions or teach new procedures to existing bureaucracies. It can therefore take a year or more for a new law to show any effects – even longer if the law is groundbreaking and bureaucracies must first learn how to deal with them.
III education Reform processes are a learning experience not only for governments but also for society. Just like the bureaucracies implementing new laws, a society needs to get accustomed to the new framework. Most changes to the welfare system only work if the population has at least some level of financial education.7 Universal literacy – reading and writing – was essential for the establishment of democracies in the 19th century. What we need for successful reforms in the 21st century are societies that are numerate as well literate.
Reforms must never be concocted by eggheads behind closed doors
170 171

more children. In its report, the Commission defines “family” as any forma-tion in which children and related (or caregiving) adults live together, so childless households are excluded from the analysis.
The Commission argues that policymakers should stop seeing divorce, single parenthood and smaller families as problems to be fixed, and instead recognize that they are symptoms of broader social developments, including changing attitudes towards work and relationships. The Commission also reminds governments that the concept of the nuclear family that dominated Europe from the 1950s to the 1970s – and was subsequently considered the norm – was an anomaly; over the ages and across cultures, people have always lived together in a variety of ways.
Against this background, the Commission recommends that European governments abolish the last vestiges of universal, one-size-fits-all family policies. Instead, it suggests that EU countries use the following categories for designing more targeted policies.
new equalsNew equals are co-habiting parents (for the most part unmarried but in a long-term relationship) who try to share work and family duties fairly. This category also includes the growing number of same-sex couples with chil-dren. The majority of families in the Nordic countries and France can today be classified as new equals.
From a policy perspective, new equals pose the fewest challenges. As dou-ble-income, often highly educated couples, they can afford quality childcare and education as well as help in the home, which allows them to spend time with their children despite demanding jobs. Their approach to dividing tasks means that these couples usually handle the demise of relationships well, with both partners subsequently sharing responsibility for their offspring.
neo-traditionalistsThese families like to divide tasks along lines once considered traditional, with one parent focused more on earning money and the other on raising children and running the household. Neo-traditionalists are far more likely to be married than new equals.
Brussels wants countries to embrace the reality of modern familiesEvening update, 19:00 CET, March 1st, 2040
The European Commission in Brussels today presented a report to the 35 member states of the European Union recommending a fundamental rethink on family policies. The report argues that policies must be based on a better understanding of families as they function today. In Europe, families have become so fragmented and fluid that policies designed almost a century ago for an average family of two parents and two children simply do not work anymore.
The report examines developments over the last 25 years, noting that trends first visible in the 1970s, such as fewer children per family and high divorce rates, have since developed unevenly. In many countries, birth rates have recovered slightly, while divorce rates have dropped – although the latter is due to the demise of marriage as an institution, since many couples do not get married in the first place. The number of couples without children has continued to grow, while at the same time, more families are having three or
The future of the family
by Katinka Barysch
BOx 7
172 173

not only share childcare, but also often look after great-grandparents, who not infrequently live into their 90s.
Extended families often lack adequate housing. Even 25 years ago, a third of European households consisted of only one person, so the housing market for small apartments has boomed. Governments now need to help extended families to find larger and affordable accommodation.
Hybrid formsIn addition to the main categories, a growing variety of other family forms is emerging. These include family groupings in which children predominantly live with grandparents; groups of two or more single parents who form a household together; and larger communal arrangements in which several families rely on each other, although they do not necessarily live in the same house permanently. Governments will need to be flexible in devising policies that provide stability and solidarity for such novel family forms.
Katinka Barysch, Group Public Policy and Economic Research, Allianz SE
This family form is more prevalent in German-speaking and some Mediterra-nean countries, where the universal roll-out of quality childcare took until the 2020s or longer. But the shape of traditional families is changing. For example, 25 years ago in Germany, the husband was the main breadwinner in the vast majority of families, while the wife worked part-time or not at all. Today, in almost a fifth of German households, the roles have reversed. Sev-eral factors – taxation changes, improving career chances for women, changing role models and the introduction of university tuition fees – have made it less attractive for mothers to work part-time or not at all.
The neo-traditionalist family needs little state support as long as it stays together. After a divorce or separation, however, the main caregiver often struggles. Re-entry training programs are needed for parents who have not, or only partially, participated in the labor market in recent years. And pension laws need to be adjusted so that old-age provisions are more equally dis-tributed between both the caregiver and breadwinner.
single providersEven 25 years ago, one in five European households with children was head-ed by a single parent. In 80 to 90 per cent of the cases, this was the mother. Back then, half of these households were at risk of poverty. While the share of single providers has risen further, the poverty risk has not increased apace, as there is a growing proportion of highly educated and successful single parents who can pay for the upkeep and education of their offspring.
Nevertheless, this is the area where government intervention is most urgently needed. Many children in single provider families remain trapped in poverty. Inexpensive and readily accessible childcare, tax credits and more flexible working hours would allow single parents to work and support their families. Special grants for education would assist children to gain a good education.
extended families Widespread social-spending cuts across Europe have encouraged people to look for support outside the state system. In the new extended families, three or four generations live together and support each other. In a small but growing number of cases, the members of these extended families are only loosely related, or not at all. Parents and grandparents in extended families
174 175

Our world is getting faster, less centralized and more connected. What impact will such changes have on our lives? Ultimately, the change we experience will be a gradual one. Many transformative processes have been underway for quite some time, and many will continue to shape our future. Our everyday life will adapt – and only a look back in time will make the changes obvious to us.
In this chapter, we have drawn up three scenarios to illustrate a vision of life in the future. The world that surrounds us – for example, the way in which we move around and how we generate the power we need – will change; and that, in turn, will affect the way we live. This evolution will be fueled by three mega-trends: deregulation, decentralization and digitalization, which we refer to as the 3Ds.
The 3Ds will fundamentally affect our everyday world – so much so that many of the issues we are concerned about today will no longer be important. No matter what the world of tomorrow will look like, the transformative powers of the 3Ds seem unstoppable.
I deregulationIndividualized ways of life and innovative products will increasingly call federal and centralized rules and laws into question. Is it still necessary or helpful that central bodies regulate all aspects of our lives in detail? Will there be just one general legal framework in which we organize ourselves? Probably not.
Three megatrends – deregulation, decentrali-zation and digital ization – will fundamentally affect our everyday world
How will my world change?by Andreas Knie, Christian Scherf and Frank Wolter
CHAPTer 9
177

what our future lives may look like as they are shaped by global and local developments in the fields of energy and transportation.
scenario 1mobility sharing – from public transport to mobility providersOn an overcast and dull morning in March 2030, Stefanie Bender steps out of her townhouse near the central station in Bonn to go to her first business meeting of the day. Her com pany’s main office is located directly on the Rhine, in Köln-Deutz, around 30 kilometers from where she lives. She commutes to Köln-Deutz only a couple of times a week, rather than every day. But her job entails other travel.
Stefanie works at a small recruitment consultancy that has a European customer base, with most of its clients being located in the German-speaking regions along the Rhine. These are the areas to which Stefanie travels the most.
Our first scenario, of the German public transport sector in 2030, illus-trates how central regulation will increasingly be replaced by more targeted rules and self-regulated organization.
II decentralizationBig industrial facilities used to be a symbol of the power, prowess and efficacy of the industrial age. Centralized power generation based on oil, gas, coal or nuclear sources, was considered particularly efficient. But at the same time, an energy sector of that sort entailed political and economic dependence on the countries exporting those fuels as well as significant environmental pollution (see also chapter 3).
One of our core concerns will be to move our energy sector away from central to decentralized supplies and from fossil fuels towards renewable energy. This transition will not only make our energy systems greener but will also address worries about energy security.
Our second scenario depicts a world where such concerns have been mostly resolved, and where going back to the way things were before seems unimaginable. The scenario of a local smart energy grid in Israel in 2040 shows how energy production and consumption will become one, and how that changes the dynamics of international energy policy.
III digitalizationOur third scenario deals with the impact of digitalization on our everyday life by imagining what a concert visit in the US might look like in the year 2035. By then, it will be nearly impossible to think back to a time when each problem or task had a confusingly complex number of potential solutions offered by different kinds of media.
Once upon a time, a concert visit entailed buying a ticket from the concert organizer and coordinating the visit with friends or other like-minded contacts via telephone, with the choice of how to get there usually boiling down to the private car. In the future, connected network solutions will make things easier. It is an open question, however, what the impact will be on our individuality and spontaneity.
The 3Ds will not affect all parts of the world equally. Countries and regions will most likely continue to have their distinct political, economic and social systems even several decades from now. Nonetheless, the three scenarios from Germany, Israel and the US provide a glimpse at
Connected network solutions will make things easier
400,000electrically powered vehicles worldwide in early 2014
20–50 billionobjects and devices could be connected to the internet by 2020
178 179

encryption and operating procedures became more secure. MobyCol also includes one of the most widely used ridesharing platforms, where now more than 20 per cent of all Germans are registered. Stefanie also likes to use the new, convenient and safe driverless car services, especially when she is too busy to collect her children from school or sports activities herself.
When she tells her kids about her life back in the early 2000s, she real-izes that her demands of convenient and comfortable transport have changed only slightly: then as now, she wants to get from A to B without too much thought or effort. What has changed is that, in the past, people had great attachments to their personal cars or bikes – a state of affairs that seems utterly redundant to her in 2030, especially since the new system offers more flexibility and freedom (see also chapter 6).
Back in the day, when the mobility market was strongly regulated and centrally organized, Stefanie’s choice of how to get around would usually have been decided by one of two factors: her final destination or the purpose of her journey. For example, when she wanted spontaneously to visit her parents in the evening, she had to factor in that, in all likelihood, she would not be able to take public transport back. She usually had no choice but to take her car. In 2030 this is no longer the case. MobyCol
Stefanie also likes to use driverless car services, especially when she is too busy to collect her children from school or sports activities herself
figure 9.1 Car ownership
Source: International Energy Agency (IEA)
450
400
350
300
250
200
150
100
50
0
million vehicles
20352030202520202015201020052000
us China India Brazil eu
Back in the days when public transport in Germany was centrally governed and state-regulated, Stefanie would usually drive in her own car to appointments. Only occasionally would she take a train. She reckoned that the car gave her more flexibility, which she considered important in her line of work. Train schedules were often inconvenient, and on some days the train was overcrowded or it was delayed or even cancelled.
Even for her short commute from Bonn to Köln-Deutz, Stefanie had few options. Back then, the German Personenbeförderungsgesetz (passen-ger transportation act) did not allow for much competition in the public transport sector. The law was designed to make public transport gener-ally accessible by operating trains according to a fixed schedule, giving every ticket holder equal access and offering uniform tariffs and ticket prices. These conditions were meant to open up public transport to everyone, but Stefanie found using trains tedious, complicated and, most of all, inflexible.
When the German Bundestag eventually discarded the Personenbeför-derungsgesetz in 2020, the market for transport diversified enormously. Local, state-owned public transport still exists, as does the Deutsche Bahn, and there are still taxis for hire. But new companies have also sprung up to sell novel services. Mobility providers offer package deals to customers as well as various car and bike-sharing platforms on which people can offer a rideshare or look for one. There is also a plethora of new services that offer the use of driverless, autonomous cars.
Stefanie chose a mobility provider called MobyCol. The service that MobyCol offers reminds Stefanie of the mobile phone contracts she used to have in the past: as part of her subscription, MobyCol grants her a monthly “mobility budget” of �750.
Stefanie’s mobility budget, which has replaced her company car, allows her to step out the door and use any service or vehicle that happens to drive by or is parked on standby in her area. This choice is readily available to her on her smartphone. The app immediately tells her what her mobil-ity options are, based on her location and whichever infrastructure and services are available.
An automated positioning service allows for precise billing. Her initial concerns about data protection and privacy have been addressed since
These conditions were meant to open up public transport to everyone, but Stefanie found using trains tedious, compli- cated and inflexible
9 %of all journeys in Germany in 2010 were done by using public transport
180 181

communities are still connected to the regional and national energy grids, but they tend to use them for selling off surplus energy. These sales have even led to a modest increase in the communities’ incomes. The majority of Israeli kibbutzim nowadays generate their own electricity. Solar panels are combined with wind turbines of different shapes and sizes. They provide the energy needed for the kibbutzim’s houses, air-conditioning, irrigation systems and charging the electric vehicles.
The Lotan kibbutz was the first to combine its systems and energy infra-structure with a micro smart grid, which allows the residents to bundle all their energy and use it efficiently throughout the entire system. As the costs of photovoltaic systems and wind turbines kept falling, Lotan quickly became a net-provider of energy, which has led to considerable overall savings and allowed the kibbutzim to pay off its initial investment in the new energy system. Lotan still has an old diesel engine, in the case of emergency or general energy shortages, but these have yet to occur.
12,100square kilometers of solar panels would theoretically be enough to supply the EU’s entire power (the Sahara is 9.6 milliom square kilometers)
offers her various options and Stefanie no longer needs to think much about planning her trips: “anything goes at any time”, as MobyCol’s slogan aptly says.
When Stefanie now leaves for work or a business trip, she simply checks her phone for mobility options. Most of the time she has access to three different rideshare offers. But it does happen occasionally that none of her usual ridesharers are online, and then she might use a train or taxi.
Recently, she had a rare experience: when she was in the rural Eifel area, MobyCol was unable to suggest travel options to her. But even in such cases, MobyCol has provisions in place – free of charge, of course. A private driver came to pick Stefanie up. She is grateful for the emergency service, but knows that if she were to live in a more remote place, she would need it more frequently, and then she would have to pay for it. Stefanie’s family therefore decided to live in a well-connected area, where her reduced mobility expenses compensate the slightly higher rent.
scenario 2The micro smart grid – energy self-sufficiency in the kibbutzIn the spring of 2040, the energy-kibbutz Lotan in the Israeli Negev desert is celebrating its 10th anniversary. A huge banner hangs on one of the kibbutz’s houses and there are billboard with photos of proud residents. Some of the images show residents standing in front of their houses and fields, which are equipped with impressive photovoltaic systems; others depict small wind turbines next to a vegetable garden. The selection of photos emphasizes Lotan’s ethos of combining tradition with innovation, sustainability with self-sufficiency.
Israel, which itself has limited oil, gas and coal resources, had to import energy from abroad for decades. But then the country realized that it had plenty of alternative and sustainable energy sources – the wind on the coast, the harsh sun in the desert – and it began to make the most of these natural resources. It was only when the kibbutzim discovered the issue for themselves that the dependence on foreign energy sources actually shrunk. Israel’s energy sector can now be considered to be nearly self-sufficient.
It all began in Lotan with a handful of enthusiastic people and some rooftop solar panels. Now, in 2040, the movement has caught on, and there are many self-sufficient communities across the Middle East. Most
Israel realized that it had plenty of alternative and sustainable energy sources – the wind on the coast, the harsh sun in the desert
When Stefanie now leaves for work or a business trip, she simply checks her phone for mobility options
182 183

to develop independent intelligent energy grids. No single kibbutz alone would have been able to handle the cost of investing in smart systems that balance energy demand on a local and regional level, as well as in energy storage solutions.
The state has learned to appreciate its citizens’ resourcefulness and vol-unteering spirit – which contributed to establishing a decentralized ener-gy policy, as well as playing a significant part in the détente with its Mid-dle-Eastern neighbors. Most of the other Middle-Eastern countries had to refocus their energy policies and supply solutions, too. Learning from their Israeli counterparts helped at least in part to overcome historical grievances and paved the way for even more far-reaching cooperation.
Several countries in the region are now thinking about interlinking their smart grids across borders – something that would have been unthink-able just 20 years earlier. Now such transnational plans appear feasible, in part because they would not endanger the self-sufficiency of any given participant. Even if a community or state were to opt out of the transna-tional smart grid, there would be no major complications. But all partici-pants would gain from joining because they can only achieve the most effective grid, and thus the lowest energy price available, if they can use the cheapest and most readily available source of energy in a wider area.
scenario 3seamless access – The limitless concert ticketMike is an American teenager who lives in the small town of Eureka, northern California. Like many in his age group, he enjoys going to concerts. He loves the vibrant concert atmosphere and sharing the experience with his peers. Now, in September 2035, Mike is particularly looking forward to seeing his favorite band play in San Francisco.
In the past, Mike would have ordered the ticket online on the event orga-nizer’s website. But in 2035, there are other ways of doing things. Mike finds out about the upcoming concert on the social media platform Connection (a Facebook successor), where he immediately gets in touch with other fans from the region, who are also planning to attend the con-cert. He buys the ticket with just one click, since Connection is partnered with almost every US event organizer and ticket reseller.
As soon as Mike buys the ticket, Connection automatically shows him his options for getting to the concert venue and back. And, as other
3.8 billionmobile internet users by 2020, compared with 2.2 billion in 2014
Several countries in the Middle East are now thinking about interlinking their smart grids
It was the momentum of the Lotan eco-pioneers that motivated others to increase their energy efficiency. Solar cooking, houses made of eco-friendly materials and waterless toilets were only the beginning. In the past, the 250 kibbutzim in Israel tended to use a lot of water and energy and dumped or burned their trash in the desert. The success of the eco-mavericks from Lotan changed all this. Their success story inspired others and, for most communities, building their own energy supply and increasing their self-sufficiency have become integral parts of everyday communal life. It was the self-sufficiency aspect – more than the sustain-ability factor – that attracted most communities.
Independence, self-sufficiency and decentralized systems are popular issues among voters in a small and resource-poor country such as Israel. The national government eventually recognized this, too, after it had initially viewed the new small grid structures with suspicion. The govern-ment then started a long-term funding initiative and subsidies program
Solar cooking, houses made of eco-friendly materials and waterless toilets were only the beginning
184 185
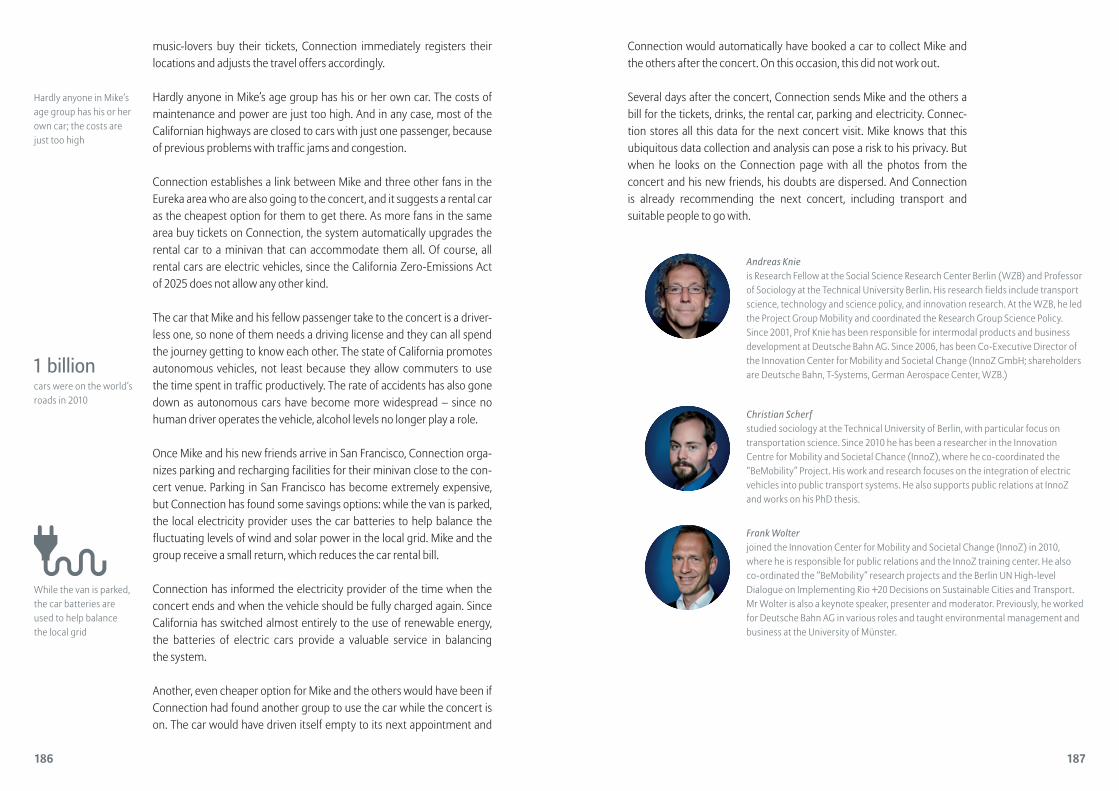
Connection would automatically have booked a car to collect Mike and the others after the concert. On this occasion, this did not work out.
Several days after the concert, Connection sends Mike and the others a bill for the tickets, drinks, the rental car, parking and electricity. Connec-tion stores all this data for the next concert visit. Mike knows that this ubiquitous data collection and analysis can pose a risk to his privacy. But when he looks on the Connection page with all the photos from the concert and his new friends, his doubts are dispersed. And Connection is already recommending the next concert, including transport and suitable people to go with.
Andreas Knieis Research Fellow at the Social Science Research Center Berlin (WZB) and Professor of Sociology at the Technical University Berlin. His research fields include transport science, technology and science policy, and innovation research. At the WZB, he led the Project Group Mobility and coordinated the Research Group Science Policy. Since 2001, Prof Knie has been responsible for intermodal products and business development at Deutsche Bahn AG. Since 2006, has been Co- Executive Director of the Innovation Center for Mobility and Societal Change (InnoZ GmbH; shareholders are Deutsche Bahn, T-Systems, German Aerospace Center, WZB.)
Christian Scherfstudied sociology at the Technical University of Berlin, with particular focus on transportation science. Since 2010 he has been a researcher in the Innovation Centre for Mobility and Societal Chance (InnoZ), where he co-coordinated the “BeMobility” Project. His work and research focuses on the integration of electric vehicles into public transport systems. He also supports public relations at InnoZ and works on his PhD thesis.
Frank Wolterjoined the Innovation Center for Mobility and Societal Change (InnoZ) in 2010, where he is responsible for public relations and the InnoZ training center. He also co-ordinated the “BeMobility” research projects and the Berlin UN High-level Dialogue on Imple menting Rio +20 Decisions on Sustainable Cities and Transport. Mr Wolter is also a keynote speaker, presenter and moderator. Previously, he worked for Deutsche Bahn AG in various roles and taught environmental management and business at the University of Münster.
music-lovers buy their tickets, Connection immediately registers their locations and adjusts the travel offers accordingly.
Hardly anyone in Mike’s age group has his or her own car. The costs of maintenance and power are just too high. And in any case, most of the Californian highways are closed to cars with just one passenger, because of previous problems with traffic jams and congestion.
Connection establishes a link between Mike and three other fans in the Eureka area who are also going to the concert, and it suggests a rental car as the cheapest option for them to get there. As more fans in the same area buy tickets on Connection, the system automatically upgrades the rental car to a minivan that can accommodate them all. Of course, all rental cars are electric vehicles, since the California Zero-Emissions Act of 2025 does not allow any other kind.
The car that Mike and his fellow passenger take to the concert is a driver-less one, so none of them needs a driving license and they can all spend the journey getting to know each other. The state of California promotes autonomous vehicles, not least because they allow commuters to use the time spent in traffic productively. The rate of accidents has also gone down as autonomous cars have become more widespread – since no human driver operates the vehicle, alcohol levels no longer play a role.
Once Mike and his new friends arrive in San Francisco, Connection orga-nizes parking and recharging facilities for their minivan close to the con-cert venue. Parking in San Francisco has become extremely expensive, but Connection has found some savings options: while the van is parked, the local electricity provider uses the car batteries to help balance the fluctuating levels of wind and solar power in the local grid. Mike and the group receive a small return, which reduces the car rental bill.
Connection has informed the electricity provider of the time when the concert ends and when the vehicle should be fully charged again. Since California has switched almost entirely to the use of renewable energy, the batteries of electric cars provide a valuable service in balancing the system.
Another, even cheaper option for Mike and the others would have been if Connection had found another group to use the car while the concert is on. The car would have driven itself empty to its next appointment and
Hardly anyone in Mike’s age group has his or her own car; the costs are just too high
1 billioncars were on the world’s roads in 2010
While the van is parked, the car batteries are used to help balance the local grid
186 187
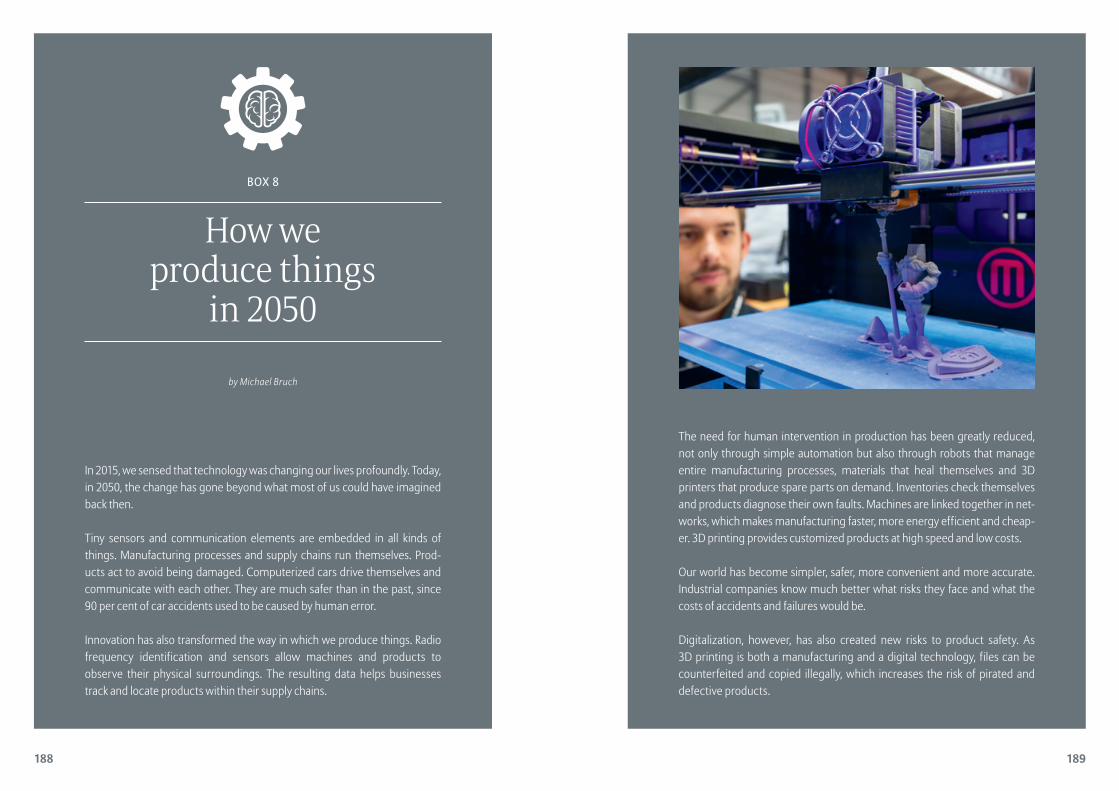
The need for human intervention in production has been greatly reduced, not only through simple automation but also through robots that manage entire manufacturing processes, materials that heal themselves and 3D printers that produce spare parts on demand. Inventories check themselves and products diagnose their own faults. Machines are linked together in net-works, which makes manufacturing faster, more energy efficient and cheap-er. 3D printing provides customized products at high speed and low costs.
Our world has become simpler, safer, more convenient and more accurate. Industrial companies know much better what risks they face and what the costs of accidents and failures would be.
Digitalization, however, has also created new risks to product safety. As 3D printing is both a manufacturing and a digital technology, files can be counterfeited and copied illegally, which increases the risk of pirated and defective products.
In 2015, we sensed that technology was changing our lives profoundly. Today, in 2050, the change has gone beyond what most of us could have imagined back then.
Tiny sensors and communication elements are embedded in all kinds of things. Manufacturing processes and supply chains run themselves. Prod-ucts act to avoid being damaged. Computerized cars drive themselves and communicate with each other. They are much safer than in the past, since 90 per cent of car accidents used to be caused by human error.
Innovation has also transformed the way in which we produce things. Radio frequency identification and sensors allow machines and products to observe their physical surroundings. The resulting data helps businesses track and locate products within their supply chains.
How we produce things
in 2050
by Michael Bruch
BOx 8
188 189

but offer innovative solutions for detecting and managing risk. If a business suffers a disruption, the insurer not only pays out the claim but swiftly and automatically coordinates all necessary steps, such as tidying up, starting repairs and ordering replacement parts.
The data from each incurred loss feed directly into a predictive modeling sys-tem – developed jointly by industrial managers, IT experts and insurance companies. The system produces customized data of the biggest risks for each company and how they can be prevented in the most cost-effective way. Managers use their digital risk assistants to learn how frequent and how costly specific risks are, how best to prevent them and how to insure against them. As soon as the manager has chosen a risk-management solution, the insurer implements it.
The momentous changes in the world of things have greatly benefited society. Factories are quieter, cleaner and leaner. They can even be built in densely populated areas, which reduces the need for long transport routes and commutes. Modern supply chains run themselves in a way that increases resilience. Companies no longer churn out things in the hope that people will buy them, but instead very often customize products to the specific demands of individual customers. Although data privacy is still an issue in this world of smart production, there is a lot less waste.
Michael Bruch is Head of Research & Development, Risk Consulting at Allianz Global Corporate & Specialty SE
In the past, companies would buy insurance against the losses caused by hard-to-predict events – for example, the failure of a piece of machinery, a fire in the factory, a fault in their products or disruption to their supply chain. Today, wireless sensors in factories monitor and control every step of the production process. They inform managers immediately if a part of machinery needs to be replaced. If the supply chain is interrupted, sensors instantly detect this and propose solutions in order to keep damages to a minimum. Burst water mains, fires or serious road traffic accidents are now exceptional events.
Big interruptions to business are much more rare. When such events do occur, however, the damages are much greater because systems are now often fully automated, tightly run and universally connected.
In this world of smart things, insurance companies have become active part-ners. In industry, their main function is no longer to provide financial services
190 191

Very few of us would be where we are today if we, our parents, our grandparents or great grandparents had not migrated to the countries in which we now live. But while we proudly reflect on how such moves have shaped our lives and our families, we tend to neglect the implica-tions for our economies and societies, for our own future and that of generations to come.
Intense arguments are raging in European and other nations regarding migration. Much heat and smoke has been generated, but this has been at the cost of clarity and evidence-based analysis. Our current policies will shape future outcomes, so it is vital to think longer term.
Migration is a complex subject. We cannot even agree on how we define migrants. Typically we mean people who live in a country other than that of their birth, but there is no agreement as to whether this includes students or temporary visitors. How such definitions will evolve is a source of uncertainty for the study of migration, as is the question of how borders might change. In September 2014, Scotland voted by a narrow margin to remain part of the UK. If it had voted for independence, the hundreds of thousands of Scots who live in England would suddenly have been classified as migrants.
History shows that change dislodges people and compels them to search for a better life away from their original homes. In 2013, some 230 million people were living outside their home country – which is more than the combined populations of Germany, France and Great Britain. Since 1990, the number of international migrants has grown by 50 per cent. This growth trend will be amplified over the first half of the 21st century, as the forces of globalization continue to swell the ranks of those who
Some 230 million people were living outside their home country – more than the combined populations of Germany, France and Great Britain
World on the move: The future of migrationby Ian Goldin
CHAPTer 10
madeleine Albrightborn in Czechoslovakia to become the first
female secretary of state of the united states of America
193

Nevertheless, countries will not respond in a uniform way. The EU, for example, has created an area of free movement between its member states (and some neighboring countries). Other countries, however, have raised barriers to migration.
One reason why there is so much uncertainty over how countries will deal with growing people movements is that there are no global rules for migration. The growth of financial and trade flows is facilitated by inter-national organizations such as the International Monetary Fund and the World Trade Organization. By contrast, no global body exists to facilitate, and set a legal framework for, the movement of people. Migration thus remains the orphan of international liberalization efforts. For the move-ment of people, borders are becoming more, not less significant.
As a leading scholar has asked, “If everything else is globalized, why not labor?”2 The answer is that countries still see migration as a sovereign prerogative: they insist on determining their own rules. Powerful countries
If everything else is globalized, why not labor?
move for economic and social reasons. By 2030, there could be 300 million migrants worldwide (see also figure 10.1).
For millions of people, these growing movements will bring unprece-dented opportunities. Others, however, especially those in richer socie-ties that already have a large share of newcomers, may look forward to higher levels of migration with trepidation (see also figure 10.3).
To get an indication of how migration will develop, we need to under-stand the forces that drive people to pack up and re-start their lives somewhere else. Understanding the forces behind migration is also important in predicting its consequences, both for the societies from which the migrants come and for their new host countries.
Population growth in the developing world will increase migration flows, as a growing number of working-age people look for opportunities abroad. The reverse is true for developed countries. Here, collapsing birth rates and population aging will increase the demand for workers from abroad (see chapter 12). But supply and demand factors only explain a part of migration. Other relevant factors include historical migration patterns (people prefer to move to places where they find existing communities from their home countries), policies in the sending and receiving coun-tries and wage gaps between countries. It is usually a combination of factors that explain migration, not any one factor.
In addition, wars, natural disasters and other threats propel people to move. These refugees tend to be the most desperate of the migrants, incurring extraordinary hardships and even death, as we have seen with refugees escaping Syria, Iraq, Afghanistan and Libya who have tragically drowned in the Mediterranean. Climate change and the associated threat to livelihoods posed by ocean rises, flooding and droughts could well further encourage people to migrate.
The link between globalization and migrationGlobalization will continue to facilitate the growth of migration in the future. The process will not be smooth. Globalization – the erosion of economic, financial and informational barriers since the second World War – has resulted in a sharp increase in international travel and commu-nication, which has made it easier for people to move. As the economies of the world become even more integrated, rising numbers of workers and students will move, while travel and tourism will continue to grow.1
People in richer societies may look forward to higher levels of migration with trepidation
50 millionrefugees worldwide in 2014
194 195

These factors, together with the growing supply and demand for migrants, leads us to believe that migration will continue to grow – political obstacles notwithstanding. The greater barriers at official bor-ders, however, will also lead to a continuous rise in the number of undoc-umented migrants, as well as the risks endured by refugees and others who are forced to move.
what drives the supply of migrants?There are several factors – often complex and interrelated – that encour-age people to make the sacrifices associated with migration. They need careful consideration. Stories in the media about “floods” of migrants fleeing poverty by moving to richer countries only serve to confuse us. So let us look in more detail at the factors that drive the supply of migrants.
I Income differencesThe prospect of higher earnings elsewhere can make people move – but other factors are typically more important. In the 19th century, for ex ample, millions of people moved from Europe to the New World. Wage differentials at the time were actually rather small – around 4:1 between the US and Italy in 1870. But employment opportunities, the promise of a better life and escape from European famines, wars and other threats led to mass migrations.
Stories in the media about “floods” of migrants fleeing poverty only serve to confuse us
figure 10.2 gdP per capita
*including forecast until 2019Source: World Economic Outlook Database eu emerging Asia sub-saharan Africa us
In $ based on purchasing power parity
50,000
40,000
30,000
20,000
10,000
01980s 1990s 2000s 2010s*
have rejected global rules designed to facilitate migration. This is partly because citizens of richer countries do not suffer as many restrictions on movement as those of poorer countries.
While crossing national borders may be getting more onerous – par tic-ularly due to the growing use of shared databases among border agen-cies, secure travel documents, retina scans and other new technologies – in other respects migration will continue to become easier. Globalization means falling international transport costs and a multiplication of cheap flights and international airports. The Internet allows people to access information on other places more easily, stay in contact with family and friends and draw and remit money. Individuals have more opportunity to learn about foreign cultures and customs and connect with networks of their own kin abroad.
As migrant populations grow around the world, other would-be migrants will often find existing communities of their own people in other coun-tries. That means that the risk of identity loss associated with migration is much reduced. In their search for opportunity and security, migrants are more likely to move to countries that have geographic and social ties to their home countries and with which they have already had some sort of contact.
The Internet allows peo-ple to access information on other places, stay in contact with family and friends and draw and remit money
figure 10.1 developements in mirgration
Source: Author’s calculation global population (left scale) share of migrants (right scale)
global population, in billion
9
8
7
6
5
4
3
2
1
01880s 1980s 2010s 2030s
migrants as per cent of the total population
4
3
2
1
0
196 197

II urbanizationFor the first time ever, more than half of mankind lives in cities. The flow of people into urban areas will continue, especially in rapidly growing emerging markets. By 2050, half of the world’s urban population will be in Asia.
Rural-urban and cross-border migration tend to be mutually reinforcing, since urban areas are the primary source of international migrants. Labor shortages in urban areas and higher salaries entice rural workers to move to cities. Once there, their incomes improve, which makes them candidates for cross-border migration.
Urbanization would lead to more emigration even if the move from country to town did not put people into a higher income bracket. Urban populations are more likely to migrate simply because they are typically younger and more willing to take risks, have higher expectations in life, are more plugged into all sorts of networks and are more likely to have received education. They also have access to better information and transport. Finally, inequality raises the pressure to migrate, and urban-ization leads to greater awareness of inequality and hence contributes to the propensity to search for opportunities elsewhere.
Rural-urban and cross-border migration tend to be mutually reinforcing
41mega-cities with more than 10 million people by 2030
It is often the poorest people that are unable to leave, while those who have already escaped poverty have the means to pay for their voyage and other costs associated with migration. So there is no simple link between income differences and migration.
Income differences between countries, however, are at historic highs (see figure 10.2). Even the most conservative estimates put the welfare gain of an average worker from a developing country migrating to the US at $10,000 a year – that is double the average GDP per capita of the developing world. Therefore, “it is at least plausible that the existing wage differences indicate potential forces for substantially larger labor movements than those currently observed”.3
Much will depend on the overall situation in the home country of the migrants. If people in poor countries see that their lives are improving and their incomes are rising faster than those in rich countries, then they may feel that the costs of uprooting themselves are not justified by the monetary benefits. On the other hand, a combination of large and rising wage differentials and declining security or employment prospects is likely to encourage people to emigrate.
Historically, developing countries have gone through a migration “life cycle”: emigration first increases as growing incomes enable people to move, but then the incentives to leave get weaker as wages continue to rise. Following this logic, as sub-Saharan economies grow over the next 50 years, emigration from that region is likely to increase while emigra-tion rates from Latin America and East Asia, where incomes are higher, will likely fall.
In poorer countries, not only rising income levels but also the associated effects of urbanization, better education and demographic change will further increase the supply of migrants. Once countries move from low to middle income levels, better job opportunities and falling birth rates decrease population and employment pressures and may well lead to labor shortages. In China, this may already be coming to pass, as the economically active workforce is declining sharply, which is putting upward pressure on wages.
As sub-Saharan econ- omies grow, emigration from that region is likely to increase while that from Latin America and East Asia will likely fall
$65,461GDP per capita in Norway in 2013
$913GDP per capita in Niger in 2013
198 199

IV The size of the workforceAs poorer countries develop economically, people tend to live longer and have fewer children. In part, a family’s decision about how many children to have depends on how long they can be expected to live. More impor-tant, however, are other factors associated with economic development, including that women increasingly get educated, move to cities and work outside the home.
In the early stages of economic development, mortality rates usually fall before birth rates do (declines in fertility tend to lag 10 to 20 years behind increases in life expectancy). This means that the population initially gets bigger. It takes many decades before this bulk of young workers reaches retirement, so development is associated with a rapidly growing work-force. This demographic transition usually affects cities first, where faster economic development and the delivery of social services allow people to live longer than in the rest of the country.
China, however, is a special case. Although China’s average income levels are still low, the number of workers relative to dependents (old-age pensioners and children) is declining. This is exceptional for this stage of development, and is due to the one-child policy having been enforced for 35 years.
Countries that are in this first phase of demographic transition (where mortality rates fall but birth rates remain high) typically also experience high emigration rates, since for many young people emigration might be the only option to enter gainful employment. Once birth rates also fall and populations grow more slowly, emigration decreases.
V Climate change and environmental stressThe impact of climate change is becoming more tangible (see box 5) and this, too, will have an impact on the global movement of people. Damage to livelihoods resulting from floods, droughts, storms, excessive fluctu-ations in heat or cold and other weather factors will play a larger role in migratory patterns.9
The impact will be most severe in developing countries. The damage in those countries will be particularly acute as the citizens and governments of poor countries do not have the resources to respond to such stresses.
In the early stages of economic development, the population initially gets bigger
+1.3 billionchange in the working-age population in the world’s less developed regions until 2050
–75 millionchange in the working-age population in the world’s more developed regions until 2050
III rising education levels Education and migration are closely linked. Young people leave rural areas either to seek an education or use their existing skills in jobs that do not exist in the countryside.4 A similar logic applies to international migration. Better educated people tend to have higher expectations and they find it easier to get work visas that are often restricted to skilled workers. The prospect of being able to go abroad, in turn, creates an additional incentive for people to acquire skills, so the demand for higher education rises.5
Students themselves make up a growing share of global migration. Over four million students studied abroad in 2012 and the number is growing rapidly.6 This trend reflects not only the dearth of high-quality universi-ties in developing countries, but also the lure of more internationally recognized qualifications and the ensuing potential for better job oppor-tunities at home or abroad. Moreover, the increasing standardization of content and qualifications further encourages the migration of students.7 So do the growing number of “branch campuses” that prestigious universities are setting up in developing countries, as well as distance-learning programs, often delivered over the Internet (see also box 9). The education revolution will leave students better prepared to move due to increased social mobility and recognition of skills.8
Better educated people tend to have higher expectations and they find it easier to get visas
figure 10.3 stock of migrants
Source: United Nations Population Division
In per cent of the total population
20
15
10
5
01900 2013
China Japan russia uk Italy germany us Canada
200 201

It is difficult to make projections for environmental migration because so much depends on how national and international institutions handle environmental change. Moreover, environmental migrants are not gen-erally a different class of migrants. Changes in the natural environment are only one of many factors that shape the decision to move somewhere else. As the impacts of climate change get more severe, these pressures will get stronger, adding further to our view that we should anticipate higher levels of migration, especially from poor places that are under high levels of environmental stress.
where does the demand for migrants come from?The main factor that determines demand for migrants is employment opportunities. “If jobs are available, people come. … If jobs are not avail-able, people don’t come”.12 This principle was, for example, illustrated by the fact that both the US and UK saw steep declines in migrants in the immediate aftermath of the 2007/08 financial crisis, when unem-ployment in both economies rose. However, there are also other, longer-term factors at work.
I Population decline and agingPeople have been living increasingly longer as healthcare has improved around the world (see also chapter 7). Meanwhile, birth rates have fallen as countries have been getting richer. In almost all developed countries, fertility rates are now below the replacement level rate of 2.1 (the aver-age number of children per women required to sustain the size of a population).
The sharp decline in fertility, coupled with rising life expectancy among the baby-boomer generation, is leading to a increasing share of the pop-ulation above the age of 65. The rising dependency ratios (the proportion of working to non-working-age citizens) will put considerable strains on state budgets: spending on pensions, healthcare and social security will go up while tax revenues will be squeezed as fewer people are in work (see also chapter 8).
Current proposals to mitigate the effect of this demographic shift include tax hikes, increasing the retirement age and encouraging more women to work – all of which are important, but none of which is likely to be popular or provide an adequate solution to the challenges posed by structural demographic shifts.13
If jobs are available, people come; if jobs are not avail able, people don’t come
44 people over 65 for 100 people of working age in France by 2050
A deteriorating environment – and the resulting shortages of farm prod-ucts, fish stocks, water and other resources – can add to the pressures that encourage people to migrate. But the actual impact that environ-mental change will have on migration will likely be determined by local conditions and political responses.10
One critical factor is how big the environmental changes are and whether they are temporary or permanent. Sudden environmental crises, such as hurricanes and short-term flooding, rarely affect international migration or result in long-term displacement, as people usually return to their homes after the threat has passed. A similar effect can be seen with slow-paced environmental changes that affect livelihoods: if their local condi-tions deteriorate, people generally prefer to move to towns or villages within their current borders rather than go abroad.
This tendency may shift in the future. Climate change exacerbates con-flicts over land and resources; such conflicts, in turn, create more political refugees. This has already happened in Sudan, where an ecological crisis has added to political and military tensions, leading to hundreds of thousands of refugees and over a million internally displaced people. Also, countries that face a direct existential threat from climate change, such as the Maldives (where 80 per cent of land is less than a meter above sea level) will almost certainly see a rise in emigration as sea levels rise and destroy existing land.
Whether environmental changes lead to migration depends crucially on the degree to which the affected country or region is prepared and how it responds. “A tropical typhoon, for example, (only) becomes a disaster if there is no early-warning system, the houses are poorly built and people are unaware of what to do in the event of a storm”.11
The importance of the capacity to respond was clearly illustrated by trop-ical cyclone Gorky and hurricane Andrew in the early 1990s. Even though hurricane Andrew was stronger, it killed only 65 people in the US; Cyclone Gorky was weaker but killed 138,000 and left 10 million homeless in Ban-gladesh. A similar contrast in the impact of natural disasters is evident when comparing Haiti and the Dominican Republic which share the same island; floods and hurricanes affect both parts of the island similarly, but as Haiti is far less prepared, the impact on its citizens is inevitably much more severe, and the number of migrants from Haiti much greater.
Countries that face a direct threat from climate change, such as the Maldives where 80 per cent of land is less than a meter above sea level, will see a rise in emigration
Whether environ-mental changes lead to migration depends on the degree to which the affected country is prepared and how it responds
202 203

A growing body of research shows a direct correlation between immi-gration policies and the rate of innovation.17 In the short term, knowledge-intensive industries face potentially large losses when visa restrictions prevent them from hiring skilled workers from abroad. In the US, for example, the IT industry is estimated to have lost $4.5 billion a year in the late 1990s because of visa restrictions.18 In the medium term, those countries that maintain restrictive immigration policies will lose out to those who allow themselves to benefit from the increased mobility of human capital. Not only countries, but also cities and regions will be competing for the best and brightest. For example, the US cities of Cleveland and Philadelphia have already hosted campaigns to attract high-skilled migrants.
In an increasingly competitive global environment, businesses will encourage governments to adopt more open attitudes towards migra-tion. A growing chorus of employers is calling for new measures to attract high-skilled workers. Large businesses are also increasingly looking for cross-cultural workers who are comfortable living and working in multiple locations.
Many countries are now considering – or are already in the process of implementing – immigration policies designed to attract high-skilled workers. At the same time, however, the economic crisis has fueled a backlash against globalization and a rise in nationalist tendencies. Across Europe and in the US, political parties that promise to reverse immigra-tion have been doing well at the polls. Such sentiments are understand-able in the context of high unemployment, rising inequality and stagnant living standards. On the other hand, demographic pressures and compa-nies’ needs for workers, both skilled and unskilled, will push against the populist tide.
Since restrictions on migrants will dampen economic growth and harm innovation, I do not believe they are likely to be sustained. It may take some time, but eventually the migration debate will be “overwhelmed by the economic demand for more migration”.19
III demand for lower skilled laborSome developed countries are already experiencing a shortage not only of professionals but also of low-skilled labor, as their workforces shrink while workers get better educated. Rising education levels leave people with higher career expectations, so they are less willing to take on more
Visa restrictions cost the US IT industry an estimated $4.5 billion a year in the late 1990s
700,000–900,000 estimated unfilled vacancies in the EU IT sector in 2015
Many commentators and some international organizations are therefore exploring how immigration could help mitigate the consequences of aging labor forces. The European Commission, for example, sees part of the solution in encouraging more economically active migrants “through bilateral agreements and a partnership for mobility” with developing countries.14 Such a replacement policy, though adding immigrants to the local labor market, will not in itself solve the problem. An estimated 25 million workers would have to be admitted to the European continent every year until 2050 to keep dependency ratios at their 1995 levels.15 Such movements would dra mati cally affect the makeup of the countries affected and are politically unimaginable.
Not only the advanced economies are seeing their dependency ratios rise. Many developing countries are experiencing a similar transformation. China, as mentioned, already has a shrinking workforce. East Asia and Latin America, too, are likely to see a sharp decline in their economically active populations (see chapter 12). Many of the emerging market countries will no longer be suppliers of migrants but will instead start looking for foreigners to fill vacancies in their own local labor markets. Demographic change will therefore result in a growing competition for migrants worldwide.
II national competitiveness and mobile skilled laborOn a global level, economic growth, together with demographic and technological changes, will expand both the supply and demand for labor. But within each country there will be growing imbalances, with an excess either of demand for, or supply of, workers.16 In the advanced economies, we are already seeing shortages in knowledge-intensive industries. In the future, there will be fierce competition for an increas-ingly global group of highly talented people.
Already, the number of people gaining university degrees in developing countries exceeds that in advanced economies. Nevertheless, for many poorer countries, the emigration of their best and brightest (“brain drain”) will continue to be an issue. For example, a large proportion of profession-als from the small Caribbean island economies are leaving to work in the US. But in the future, we will also see more “brain circulation”, with gradu-ates working in a number of countries over their careers and perhaps returning home for periods of time – especially when political and eco-nomic conditions there improve. As people live increasingly longer, yet can expect fewer secure retirement benefits from any one job or country, more and more of them will move several times during their lives.
Many emerging markets will no longer be suppliers of migrants but will instead start looking for foreigners to fill vacancies
66 % of young Koreans have been to university
29 % of young Germans have been to university
204 205
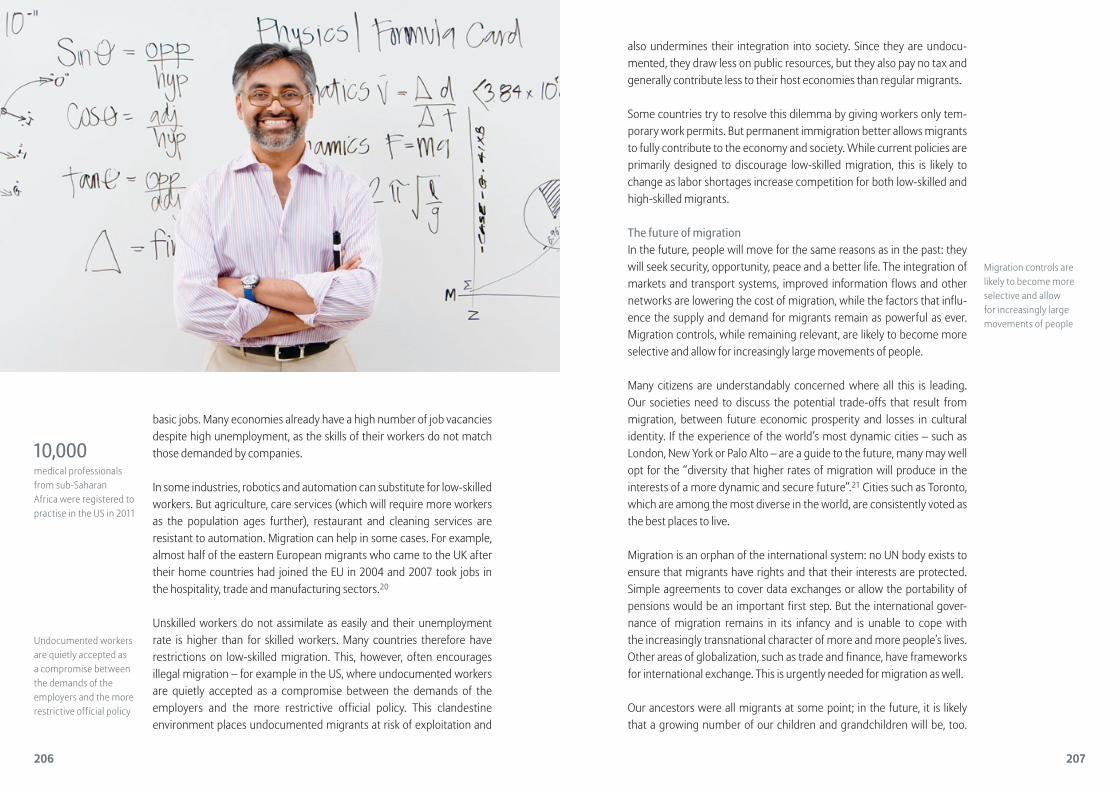
Migration controls are likely to become more selective and allow for increasingly large movements of people
also undermines their integration into society. Since they are undocu-mented, they draw less on public resources, but they also pay no tax and generally contribute less to their host economies than regular migrants.
Some countries try to resolve this dilemma by giving workers only tem-porary work permits. But permanent immigration better allows migrants to fully contribute to the economy and society. While current policies are primarily designed to discourage low-skilled migration, this is likely to change as labor shortages increase competition for both low-skilled and high-skilled migrants.
The future of migrationIn the future, people will move for the same reasons as in the past: they will seek security, opportunity, peace and a better life. The integration of markets and transport systems, improved information flows and other networks are lowering the cost of migration, while the factors that influ-ence the supply and demand for migrants remain as powerful as ever. Migration controls, while remaining relevant, are likely to become more selective and allow for increasingly large movements of people.
Many citizens are understandably concerned where all this is leading. Our societies need to discuss the potential trade-offs that result from migration, between future economic prosperity and losses in cultural identity. If the experience of the world’s most dynamic cities – such as London, New York or Palo Alto – are a guide to the future, many may well opt for the “diversity that higher rates of migration will produce in the interests of a more dynamic and secure future”.21 Cities such as Toronto, which are among the most diverse in the world, are consistently voted as the best places to live.
Migration is an orphan of the international system: no UN body exists to ensure that migrants have rights and that their interests are protected. Simple agreements to cover data exchanges or allow the portability of pensions would be an important first step. But the international gover-nance of migration remains in its infancy and is unable to cope with the increasingly transnational character of more and more people’s lives. Other areas of globalization, such as trade and finance, have frameworks for international exchange. This is urgently needed for migration as well.
Our ancestors were all migrants at some point; in the future, it is likely that a growing number of our children and grandchildren will be, too.
basic jobs. Many economies already have a high number of job vacancies despite high unemployment, as the skills of their workers do not match those demanded by companies.
In some industries, robotics and automation can substitute for low-skilled workers. But agriculture, care services (which will require more workers as the population ages further), restaurant and cleaning services are resistant to automation. Migration can help in some cases. For example, almost half of the eastern European migrants who came to the UK after their home countries had joined the EU in 2004 and 2007 took jobs in the hospitality, trade and manufacturing sectors.20
Unskilled workers do not assimilate as easily and their unemployment rate is higher than for skilled workers. Many countries therefore have restrictions on low-skilled migration. This, however, often encourages illegal migration – for example in the US, where undocumented workers are quietly accepted as a compromise between the demands of the employers and the more restrictive official policy. This clandestine environment places undocumented migrants at risk of exploitation and
Undocumented workers are quietly accepted as a compromise between the demands of the employers and the more restrictive official policy
10,000 medical professionals from sub-Saharan Africa were registered to practise in the US in 2011
206 207

Of the 650 million children currently in primary education (according to UNESCO estimates), 250 million are not learning the basics. In low and middle-income countries, one in three children who have spent five to six years in school cannot read. At current rates of progress, it will take until 2072 to eradicate youth illiteracy.1
If we continue to follow traditional education models, we will not prepare our societies for the challenges of a globalized, digitalized and increasingly automated economy. Radical change is required. Here are the five areas in which change will most likely happen in the next 20 years.
I we won’t care who runs our schools, as long as they perform One fundamental problem with our education system is that we seem to be stuck in 19th-century thinking when it comes to the roles of the state and the
Education 2.0
by Vikas Pota
BOx 9
1 Robert Wright, Nonzero: The Logic of Human Destiny, Vintage, London, 2001, Vintage, p 4.
2 Lant Pritchett, Let Their People Come: Breaking the Dead lock on Global Mobility, Center for Global Development, Washington, DC, 2006, p 31.
3 Pritchett, 2006, p 24. See also Global Economic Prospects: Economic implications of Remittances and Migration, World Bank, Washington, DC, 2005.
4 G.J. Lewis, Human Migration: A Geographical Perspective, Taylor and Francis, New York, 1983.
5 Rodrigo Lluberas, “The Untapped Skilled Labour of Latin America”, Watson Wyatt Worldwide Technical Paper, December 2007, p 14.
6 Philip B. Altbach, “Higher Education Crosses Borders” in Change (March-April 2004) and http://www.uis.unesco.org/Education/Pages/international-student-flow-viz.aspx, 2004.
7 Sajitha Bashir, Trends in International Trade in Higher Education: Implications and Options for Developing Countries, World Bank, Washington, DC, 2007, p 21.
8 International Organisation for Migration, World Migration 2008: Managing Labour Mobility in the Evolving Global Economy, IOM, Geneva, 2008, p 106.
9 Koko Warner, Tamer Afifi, Olivia Dun, Marc Stal, and Sophia Schmidl, Human Security, Climate Change, and Environmentally Induced Migration – Report, United Nations University Institute for Environment and Human Security, 2008, p 6.
10 Stephen Castles, “Environmental Change and Forced Migration: Making Sense of the Debate”, New Issues in Refugee Research, Working Paper No. 70, UNHCR, 2002, p 4.
11 Oli Brown, “Climate change and forced migration: Observations, projections and implications”, Human Development Report 2007/2008, Fighting Climate Change:
Human Solidarity in a Divided World, Human Development Office Report, Occasional Paper, 2007/17, p 11.
12 Julia Preston, “Mexican Data Show Migration to U.S. in Decline”, New York Times, 14 May 2009.
13 See Jean-Philippe Cotis, “Population Ageing: Facing the Challenge”, OECD Observer, No. 239, September 2003.
14 European Parliament, “Answer Given by Mr Barrot on Behalf of the Commission”, Parliamentary Questions E-5971/2008, 12 January 2009. Available at http://www.europarl.europa.eu/slides/getAllAnswers.do?reference=E-2008-5971&language=EN
15 United Nations, Replacement Migration: Is It a Solution to Declining and Ageing Populations? United Nations, New York, 2000.
16 Lynn A. Karoly and Constantijn W.A. Panis, “Supply of and Demand for Skilled Labor in the United States” in Jagdish Bhagwati and Gordon Hanson (eds.), Skilled Immigration Today: Prospects, Problems and Policies, Oxford University Press, Oxford, 2009, pp 15–52.
17 William R. Kerr and William F. Lincoln, “The Supply Side of Innovation: H–1B Visa Reforms and US Ethnic Invention” in Harvard Business School Working Paper 09–005, 2008
18 Diane Gershon, “US Congress Encouraged to Lay Out the Welcome mat for Skilled Foreigners” in Nature 405: 2000, pp 597–598.
19 Ian Goldin, Geoffrey Cameron and Meera Balarajan, Exceptional People: How Migration Shaped our World and will Define our Future, Princeton University Press, Princeton, NJ, 2011, p 257.
20 OECD, International Migration Outlook SOPEMI: 2008 Edition, Organisation for Economic Co-operation and Development, 2008, pp 130–132.
21 Goldin, Cameron, and Balarajan, 2011, p 258.
Our lives and our economies will increasingly depend on migration. It is high time that we thought more about the consequences and prepared ourselves for a future of not only more migrants, but also better- managed migration. This is in the interest of our societies, our economies and of the migrants themselves.
Ian Goldinis Director of the Oxford Martin School and Professor of Globalisation and Develop-ment at the University of Oxford. From 2001 to 2006, Prof Goldin worked at the World Bank, first as Director of Development Policy and then as Vice President. Prior to that, he was Chief Executive and Managing Director of the Development Bank of Southern Africa and served as an advisor to President Nelson Mandela. He was also Principal Economist at the European Bank for Reconstruction and Development (EBRD) in London, and Program Director at the OECD Development Centre in Paris. Prof Goldin is author or co-author of numerous books, including Exceptional People: How Migration Shaped our World and will Define our Future, 2011, on which this chapter draws extensively.
208 209

II we will learn useful thingsAnother massive shift in the education system of the future will be a growing emphasis on employability. In the 20th century, many governments were obsessed with pushing up the number of young people that go to university. In the future, we will see education as a way of acquiring a good job, not some kind of intellectual exercise.
How important this shift will be is illustrated by the current situation, in which many countries have both cripplingly high youth unemployment and companies that complain about not being able to find skilled workers. In Europe, half of the youngsters who take academic courses say they would have preferred a vocational one.5
In many countries, people still regard vocational education as inferior to university degrees. But attitudes are changing. In Great Britain, for example, the middle-class no longer look down at apprenticeships.6 Faced with the frequently exorbitant costs of higher education, many young people are asking themselves how much they would really benefit from investing in a university degree.
Germany is often seen as a model. Here, the traditional apprenticeship, which combines on-the-job-training and formal schooling, guarantees most young people a job straight after their education. German youth unemployment rates are a fraction of what they are in most other European countries. Ger-many has signed agreements with Spain, Greece and other countries to help them improve their own vocational education systems.
Emerging market countries, especially in Africa, now recognize that they need to train more nurses, engineers and electricians if they want to sustain their economic development.
III we will never stop learningLearning will no longer stop at 15 or 25. A portion of the workers now reach-ing retirement age have not had much formal training since they entered the job market. In the future, staying ahead in the job market will become more of a priority. The need for lifelong learning will be fueled by the breakneck speed of technological change, increased global competition and working
private sector.2 By 2035, the question of whether education should be deliv-ered by the public or the private sector will be seen as an irrelevant or even counterproductive obsession.
Even today, parents from London to Lahore and Lagos care only about the quality of the education their kids are receiving. Governments care (or should care) only about whether children from all levels of society have access to a good education. Who owns and runs a school – whether the state, a private business, an NGO or any combination of these – will become increasingly irrelevant.
Some of the old battle lines are blurring already. England, for example, has rolled out a program of “academies”: schools run by charities, reli gious groups or businesses that have a higher degree of independence than the traditional state school. Teacher unions remain suspicious of this new model, but all political parties now support it to varying degrees. Why? Because it works.
Ofsted, the schools inspectorate, found that schools that opted to become academies have improved more quickly than those that have remained under the control of local authorities.
There is similar evidence from the US. Charter schools, which receive public money but operate independently, have not become the plaything of rich benefactors, as some have feared. They have been shown to deliver good results with less public money than traditional state schools.
In many ways, the obsession with public versus private education is a West-ern phenomenon. Emerging market countries are less concerned about it. In India, for example, the government’s decision in 2007 to make primary schooling compulsory triggered an explosion in the number of private schools.3 Some of the most efficient now deliver education for as little as $100 to $300 a year. In Ghana, low-cost private providers like Omega Schools are challenging both state schools and more traditional private establish-ments because they offer a decent education for only 40 pence a day.4 Innovations such as these are vital in achieving the huge increase in high-quality schools that we will need over the next two decades.
210 211

Moocs are transforming learning opportunities, especially for those people who have traditionally lacked access to high quality education. In Africa, for example, Internet use is expected to increase 20-fold in the next five years alone, which could open up an entirely new education universe for the children there.
Moocs will also disrupt the traditional model of educating children according to their age, rather than their academic progress. Take the case of Khadijah Niazi from Lahore, Pakistan, who completed online courses in artificial intelligence and physics before she was 12 years old.8
Yet it is important that we don’t succumb to breathless tech-utopianism. Much will change in education, but many of the key challenges will remain the same. Too often teachers remain undertrained, underpaid and under-valued. In China, teachers are highly respected, but most Western countries do not value them highly.9 Whether they are using chalk, a tablet computer or not-yet-invented device of the future, it is the quality of teachers that determines the quality of education. Only if we improve the status of teach-ers – so that we can attract the best and brightest into this valuable profes-sion – will we be able to unlock the potential of millions of young people. That’s one prediction that won’t be proven wrong by 2035.
Vikas Pota is the Chief Executive of Varkey GEMS Foundation, a not-for-profit organization established to improve standards of education for underprivileged children.
1 UNESCO, Advocacy Toolkit for Teachers to Provide a Quality Education, 2014.
2 Gabriel Sanchez Zinny, “Education 3.0 and the Future of Quality” in The Huffington Post, 19t August 2013.
3 “Rich pickings: bad state education means more fee-paying schools in poor countries” in The Economist, 17 March 2012.
4 Peter Wilby, “Professor James Tooley: A champion of low-cost schools or a dangerous man?” in The Guardian, 12 November 2013.
5 McKinsy & Company, “Education to employment: Getting Europe’s youth into work”, January 2014.
6 Graeme Paton, “Apprenticeships ‘increasingly attractive to middle-classes’” in The Telegraph, 11 August 2014.
7 Helen Warrell, “Chasing a generation of globally mobile students” in The Financial Times, 7 October 2014.
8 “Davos: 12-Year-Old Pakistani Prodigy Girl Talks About Her Online Learning” in WiredAcademic, 29 January 29 2013.
9 https://www.varkeygemsfoundation.org/teacherindex
lives that will last as long as six decades (see also chapter 12).
IV we will understand technology – not just use itThe growing focus on employability will also change the way in which schools approach new technology. Today, schools teach children how to use computers for word processing, creating presentations or compiling spreadsheets – sufficient for many jobs, but employers also need people who know how computers actually work. Computer science is starting to make a comeback on many curricula – from Israel to New Zealand, Australia to Denmark. In the next few decades, programming will take its place in the curriculum alongside physics, maths and chemistry.
V going to school will mean something elseTechnological changes will disrupt the traditional classroom. This sounds obvious. But it’s remarkable that, while innovation has transformed health-care, entertainment, transport and just about every other sector, education has remained impervious to change.
If a surgeon from 1915 walked into an operating theatre in 2015, he would be befuddled by the all the new technology being used there. But if a teacher from 100 years ago walked into a modern classroom, she would only notice that the blackboard has been replaced by a whiteboard and that the pupils are dressed more casually. Everything else – from the front-facing desks to the way lessons are taught – would feel familiar to her.
Fast forward another two decades and things will look very different. First, classrooms will have a different purpose. Much of the actual teaching of material and absorption of information will not take place in schools. Pupils will watch instructional videos at home and then meet their teachers in school to work on specific tasks or problems.
Second, massive open online courses (Moocs) will open education up to mil-lions and allow students of all ages to study at their own pace. Moocs are online courses that thousands of students can take simultaneously without having to go through a selection process beforehand. Moocs are already spreading fast today, and future growth will be brisk.7 Harvard, Yale and other elite universities are already offering Moocs.
212 213

India today has over 1.2 billion people – almost as many as the entire European Union, the US, Japan, Brazil and Russia combined. Two-thirds of India’s population is below the age of 35, and almost 30 per cent are kids under 15. Most Indians live in rural villages, and the average house-hold still consists of five people. Poverty is still a major problem.
India is a highly diverse nation. Its 2,000 ethnic groups speak half a dozen languages and practice various religions. India is so diverse that it resem-bles a continent more than a nation state. With these features, India is in many ways the opposite of the well-off, aging, individualized, urbanized and still pretty homogenous (by Indian standards) European countries.
But India is changing. By around 2030, India is projected to overtake China to become the world’s most populous country. This is despite the fact that, like in most emerging-market countries, India’s birthrate has been falling rapidly in recent decades. Since India has long considered it a challenge to feed, house and educate its fast-growing population, this demographic transition is good news. The country’s economy should benefit from a very large and stable working-age population.
Indian demographics, however, exhibit characteristics that are very different not only from developed countries but also from other emerging
India’s economy should benefit from a very large and stable working-age population
30 %of Indians are under the age of 15
View from a fast-growing nation: What demographic change means for Indiaby K.S. James and N. Kavitha
CHAPTer 11
On the wayto become the world’s most
populous country
215

influenza epidemic of 1918, but then it steadied and started to increase again. The momentum of growth picked up and reached nearly 2 per cent a year by the 1960s, and even more in the 1970s and 1980s. Two per cent a year might not sound like a lot, but it adds up to growth of a quarter over a decade. As a result, India’s population exploded from around 400 million at the beginning of the 1960s to more than 1.2 billion today.
This trend is now reversing. Since around the year 2000, the population growth rate has fallen sharply. This decline will remain steep during the first half of this century (see figure 11.1). By 2050, India’s population should be stable. But by then, almost one in five people on the planet will be living in India.
Not only the size but also the age composition of India’s population will change drastically during this period (see figure 11.2). Adults of working age will make up 60 to 70 per cent of the population. The share of children will spiral down. The number of elderly people will grow significantly during the entire period, especially after 2025. All these changes will undoubtedly create ripples in both in the economy and society.
women are having fewer childrenMore than any other factor, changes in fertility patterns in recent years have impacted on India’s population trends. Until around 1950, the
Two per cent a year might not sound like a lot, but it adds up to growth of a quarter over a decade
figure 11.2 India will have a large and stable working-age population
Source: United Nations Population Division, “World Population Prospects: The 2012 revision”
Age groups as per cent of the total population
90
80
70
60
50
40
30
20
10
01950 1975 2000 2025 2050 2075 2100
0–14 15–64 65+
markets. India’s policy makers will have to grapple with challenges such as a general lack of skills and education, vast regional diversity, traditional marriage and family patterns, and a persistent “overhang” in the number of men compared with women.
In this chapter, we will describe the trends and patterns of India’s changing demographics as well as illustrating future scenarios. We will briefly discuss the effect of such changes on the economy and society, and conclude by looking at the challenges that the country faces as a result of its changing population.
Population growth is slowingEven though India’s birthrate has declined rapidly in recent decades, the population will continue to grow for the best part of this century. According to UN projections, India will overtake China and become the most populous country in the world by 2025–2030.
During the early years of the 20th century, India’s population grew very slowly. Although women had many children, death rates were also very high – particularly because of recurring famines and epidemics such as the plague, influenza and cholera.1 The result was a wide variation in population growth rates in the early part of the last century. In the decade between 1911 and 1921, the population actually shrank due to the
India will overtake China and will become the most populous country in the world
figure 11.1 India’s population growth is slowing sharply
Source: United Nations Population Division, “World Population Prospects: The 2012 revision”
Population in million Annual growth rate in per cent
1,800
1,600
1,400
1,200
1,000
800
600
400
200
0
2.5
2.0
1.5
1.0
0.5
0
−0.51950 1975 2000 2025 2050 2075 2100
Total population (left scale) growth rate (right scale)
216 217

average Indian woman had six children2, and this did not change signifi-cantly even after the introduction of family planning programs in 1952. It was only in the 1980s that Indian women started to have fewer babies. This decline in fertility has accelerated since the 1990s.3 According to the latest reliable data, the number of children per women stood at 2.4 in 2012 and, if current trends continue, India will most likely achieve the “replacement level” of 2.1 children per woman within this very decade. (The replacement level is the number of children people need to have in order to replace themselves and keep their society stable in numbers.)
Although fertility rates have declined in all parts of the country, the overall trend masks considerable regional differences. Not only is there a split between urban and rural areas – as you would expect, given the disparate development of cities compared with the countryside – but there are also big differences between the southern and northern parts of the country.
In cities, where almost a third of Indians now live, the fertility rate has already dropped below replacement level (it was down to 1.8 in 2012). All the southern states also have low birthrates (below 2), while in the six northern states, fertility rates are still above 2.5 children per woman.
India will most likely achieve the replacement level of 2.1 children per woman within this very decade
figure 11.3 fertility is higher in the north and lower in cities
Average number of children per woman, 2012
4.0
3.5
3.0
2.5
2.0
1.5
1.0
0.5
0
Source: Sample Registration System, 2012
Him
achal Pradesh
Punjab
Tamil n
adu
west Bengal
Andhra Pradesh
delhi
kerala
maharashtra
Jamm
u & kashm
ir
karnataka
Odisha
gujarat
Haryana
Assam
Chhattisgarth
Jharkhand
madhya Pradesh
rajasthan
uttar Pradesh
Bihar
Total urban
219

poor, with over 60 per cent living on less than $2 a day (at purchasing power parity) in 2010.
In most places, as more and more women go out to work, they tend to have fewer children. But in India, the birthrate dropped although most women were still not part of the formal work force. Less than a third of working-age women participate in the labor market in India, compared with almost two-thirds in China, for example.
In western European and East Asian countries, birthrates fell as increasing numbers of people married late or not at all. But the trend to get married later in life has not come to India. By the time they reach their early 30s, more than 98 per cent of women in India are married, compared with only 65 per cent in Japan, for instance. Although Indian women are also marrying somewhat later than before, their average age at marriage is still only 22, and 15 per cent get married before they are 20. Marriages are also more stable in India than elsewhere, with divorce rates that are only a tiny fraction of those seen in the US, Japan and Europe.
Another factor we looked at in India was female education, because there is a noticeable difference in birthrates between states where more girls go to school and those where many of them remain illiterate. But even this link does not hold everywhere. The first state where birthrates dropped was Kerala in the south. Here, female literacy played an impor-tant role. In the late 1980s and 1990s, however, two other southern states (Tamil Nadu and Andhra Pradesh) recorded a rapid decline in fertility but without any significant progress in girls’ education.8
Since neither an improvement in living standards nor changing family patterns nor education offer a sufficient explanation for the develop-ments in Indian birthrates, there must be another factor at work. It seems that differences in birthrates are due to differences in the use of birth controls. Arguably, the implementation of family planning programs has been less effective in the north of India, where contraception is less widely available than in the south.9 Not only family planning initiatives but also general health-care systems are less efficient in the north than in the south.
Successive Indian governments have made determined efforts to con-trol the birthrate since independence, particularly since the 1970s. The programs have had mixed success, with too much emphasis on rigid –
By the time they reach their early 30s, more than 98 per cent of Indian women are married
61 %of Indians lived on less than $2 a day in 2010
Since most Indians live in the north, where population growth is declining the fastest, India’s overall birthrates are set to come down rapidly in the near future.
This prospect has led to considerable optimism. In the past, Indians have perennially worried about overpopulation. India’s policy makers, academics and even the general public have for decades considered rapid population growth to be the main reason for poverty and unem-ployment.
The UN projects that India’s fertility rate will ultimately stay within a “safe” range of 1.8 to 2.1, which would mean that India’s population would remain stable. Europe’s history, however, shows us that once birthrates start to fall, they often continue to do so – to far below replacement levels.
Many European countries saw their fertility rates plunge between the mid-1960s to the mid-1980s4 – with all the associated economic and social challenges (see also chapter 8). Such a collapse in birthrates is no longer an exclusively European phenomenon; they have been dropping in an increasing number of areas.5 Some countries are now subject to what demographers call “lowest low fertility”6, by which they mean 1.3 children or fewer per woman. Many cities in India have already seen rates drop to below 1.8 in recent years, and in the cities of West Bengal to as little as 1.2 (see figure 11.3). Such developments could indicate that India’s birthrate will plunge far below replacement level in the future. India would then struggle with an aging and shrinking society before it has had a chance to prosper.
what makes India specialFalling birthrates have been the subject of a fierce debate in our country. Conventional theories of why women have fewer children do not seem to apply.7 In the developed world, improving living standards, changing family patterns and the growing share of women joining the labor force were behind the drop in fertility. These factors, however, never appeared to be a plausible explanation for India – not even in those states where fertility rates have dropped below replacement levels.
Birthrates tend to drop as a society gets more affluent, partly because families assume they need fewer children to toil the fields and look after their aging parents. But in India, fertility has fallen much faster than the improvement in living standards would suggest. Most Indians are still
People in India have for decades considered rapid population growth to be the main reason for poverty and unem ployment
220 221

However, India has had much less success in bringing down its very high infant mortality rates – despite various government programs aimed at improving the chances of survival for newborns. Although the infant mortality rate has declined from a very high 300 per 1,000 live births around 1950 to 42 in 2012, this is still 10 times higher than in the EU.
It is worrying that infant mortality has stayed so high even though the fertility rate has declined. In most other countries, these two develop-ments have gone hand in hand, as women typically have fewer babies as the survival rate of their existing children improves. Many people have been critical of a public health system that focuses too much on family planning at the expense of healthcare for mothers and babies.
at times coercive – targets, and not enough education, options and choice. The authorities used to set unrealistic targets for the number of sterilizations that health workers were supposed to perform in their area. Health workers sometimes resorted to forced sterilizations to achieve their targets.
On the whole, this approach worked badly. Despite India’s growing focus on family planning, birthrates remained high, and the population kept growing at more than 2 per cent a year, even in the early 1990s. India therefore announced a new National Population Policy in 2000. This affirmed that families should be able to make a voluntary and informed choice about their offspring. It made reproductive health services more widely available and moved away from its previous targets, instead setting more realistic goals for the short, medium and long term – particularly to achieve the replacement level of 2.1 children per woman by 2010 (although it did not meet that goal either).
In its family planning efforts, India has primarily relied on non-reversible methods of contraception, namely the sterilization of women. This prac-tice has attracted much criticism and concern. Under the National Population Policy of 2000, the government sought to promote other methods of contraception, but without much success to date. Steriliza-tion of women still accounts for up to 90 per cent of the birth control methods put in to practice. One result of this is that Indian women tend to have their children very young and without much of a break in between, which can have severe health consequences.
Since government policies have been so important in shaping India’s demographic transition, it has been different from that in other parts of the world. But this targeted intervention has not been free of problems. Pushing down the birthrate without also achieving commensurate social and economic progress will have serious repercussions for the future of India’s economy.
Improving the chances of infant survivalIndia’s life expectancy has improved slowly but steadily, particularly in the second half of the last century. In 1950, the average Indian could expect to live only 36 years. By 2010, that had risen to 65 years.10 Life expectancy in India is expected to rise to 70 years by 2025 and 74 years by 2050.
India has pushed down its birthrate without commensurate social and economic progress
20the age at which the average Indian woman is having her first child, compared with 30 in Italy, for example
29years was the increase in life expectancy in just five decades after 1950
222 223

The difference between men and womenNevertheless, there have always been big differences in mortality and life expectancy between men and women in India, with women historically the worse off. In the past, this was one of the main reasons why India has always had an “overhang” in the number of men compared with women.12 In the 1950s, a woman’s average life expectancy was at least two years less than a man’s. But subsequently the mortality rate fell faster for women than for men, with the result that women now live on aver-age three years longer than men. It would be reasonable to expect the preponderance of men in society to disappear if women have the same mortality rates and higher life expectancy than men.
But it hasn’t. On the contrary, the imbalance between men and women has worsened, particularly among the younger ages. In 1961, there were 961 girls for every 1,000 boys below six years of age. By 1991, there were only 945 girls for every 1,000 boys, and in 2011, this went down to 914.
Factors other than demographic trends must be responsible for this growing imbalance. The most likely reason is the widespread practice of gender-selective abortions. Many Indian families have a high preference for sons, as they fear the burden of having to marry off their daughters – which, in the Indian system, requires a dowry. Moreover, only sons can performs the last rites for parents.
The government has tried to stop the practice of gender selection, for example by banning scans in 2001 that reveal to would-be parents the gender of their child. But it appears that these measures have not had much success. India’s excess of men over women will have great societal implications in the future. The skewed gender ratio leaves many men struggling to find women of marriageable age. As a result, men often marry women far younger than they are. There is also evidence that, in areas with a particularly pronounced excess of men over women in the population, violence against women has increased.
The consequences of demographic changeIndians have always been worried that an overly fast-growing population would stunt their economic development. Now that population growth rates are rapidly declining and the fertility rate is approaching replace-ment level, Indians are more optimistic that demographics will work in their country’s favor – as was the case in other East Asian countries.13 Since the vast majority of its population will be of working age for decades
It would have been reasonable to expect the preponderance of men over women in society to disappear – on the contrary.
914girls for every 1,000 boys in 2011
In 2005, the government launched a major initiative (called the National Rural Health Mission) to allow more women to deliver their babies in hospitals, thereby reducing infant mortality. And in fact, the share of births taking place in hospitals more than doubled between 2005 and 2012, to almost three-quarters. Since the introduction of the new policy, the decline in infant mortality has accelerated11 – without any under-lying improvements in socio-economic conditions or public health. This indicates that not only birth but also infant mortality rates are a function of government policy in India.
224 225

1 Pravin Visaria and Leela Visaria, “Demographic transition: Accelerating fertility decline in 1980s” in Economic and Political Weekly, Vol 29, Issues 51/52), 1994, pp 3281–3292.
2 P.M. Kulkarni, “Towards an explanation of India’s fertility transition”, George Simmons Memorial Lecture presented at the 33rd annual conference of the Indian Association for the Study of Population (IASP), Lucknow, November 11–13 2011
3 K.S. James, “India’s demographic change, opportunities and challenges” in Science, American Association for the Advancement of Science (AAAS), Vol 333, no 6042,July 29 2011, pp 576–580.
4 Tomáš Sobotka, “Is Lowest-Low Fertility in Europe Explained by the Postponement of Childbearing?” in Population and Development Review, Vol 30, Issue 2, June 2004, pp 195–220.
5 Ron J. Lesthaeghe, “The Unfolding Story of the Second Demographic Transition”, Population and Development Review, Vol 36, Issue 2, June 2010, pp 211–251.
6 Hans-Peter Kohler, Franceso C. Billari and Jose Antonio Ortega, “The Emergence of Lowest-Low Fertility in Europe During the 1990s” in Population and Development Review, Vol 28, Issue 4, Dec 2002, pp 641–680.
7 K.S. James, “India’s demographic change”.8 K. Srinivasan, P.C. Saxena, T.K. Roy and R.K. Verma,
“Effect of Family Planning Program Inputs on Contraceptive Acceptance in India” in International Family Planning Perspectives, Vol 17, Issue 1, 1991, pp 14–24. K.S. James,
“Fertility Decline in Andhra Pradesh: A Search for Alternative Hypotheses”, Economic and Political Weekly, Vol 34, Issue 8, 1999, pp 491–99.
9 K. Srinivasan, Regulating Reproduction in India’s Population: Efforts, Results, and Recommendations, Sage Publications, New Delhi, 1995.
10 K.S. James, “Recent Shifts in Infant Mortality in India: An Exploration” in Economic and Political Weekly, Vol 49, No 3, January 18 2014, pp 14–17.
11 K.S. James, “Recent Shifts in Infant Mortality in India: An Exploration” in Economic and Political Weekly, Vol 49, No 3, January 18 2014, pp 14–17.
12 P. Visaria, The Sex Ratio of the Population of India. Census of India 1962, Monograph 10, Office of the Registrar General, New Delhi, 1972.
13 David E. Bloom, Jeffrey G. Williamson, “Demographic Tran sitions and Economic Miracles in Emerging Asia” in World Bank Economic Review, Vol 12, Issue 3, September 1998, pp 419–455.
14 Alaka Malwade Basu, “Demographic Dividend Revisited: The Mismatch between Age and Economic Activity-Based Dependency Ratios” in Economic & Political Weekly, Vol 66, No 39, September 24 2011, pp 53–58.
15 Sonalde Desai, “The Other Half of the Demographic Dividend” in Economic & Political Weekly, Vol 45, No 40, 12–14, October 2 2010, pp 12–14.
will become a country to be reckoned with in the coming decades. But we must also urgently deal with the perils lurking in our demographic development – in particular, the excess of men over women in the popu-lation, the use of female sterilization and the slow change in marriage age.
K.S. Jamesis Professor and Head at the Population Research Centre, Institute for Social and Eco nomic Change (ISEC) in Bangalore, India. He has worked extensively on demographic changes with focus on population, development and aging. Prof James has published widely on India’s demographic transition and demographic dividend. He has been a visiting fellow at the Harvard Center for Population and Development in the US, the International Institute for Applied System Analysis (IIASA) in Austria, The London School of Economics and INED in Paris.
N. Kavithais the Senior Research Officer at the Population Research Centre, Institute forSocial and Economic Change, Bangalore. She received MA and PhD degrees from the Department of Population Studies, Bharathiar University in Coimbatore. She has published research papers in the areas of reproductive and child health. Her current areas of interest are population and health.
to come, India should have a natural advantage over many other countries that have to make do with a shrinking workforce.
Nevertheless, the nature of India’s demographic transition also creates economic disadvantages. Demographic changes were not preceded by sufficient progress in education, particularly for girls. More than one-third of women in India cannot read and write, and even many women who are literate have very basic education levels.
Therefore, although India has plenty of workers, they are often badly educated or not at all. This will stay true for generations to come. Over a third of India’s working-age population is is neither working nor study-ing – and hence will be completely unprepared for employment in the 21st century.14 And, as explained earlier, most women in India are still not part of the official labor market – despite the fact that they have fewer and fewer babies, which means they spend much less time on bearing and rearing their children.15
All these indicators imply that, unless India addresses its deficit in skilled men and women as a priority, its favorable demographics will not trans-late into economic gain, as similar developments have done in other parts of the world.
India may also remain unique by virtue of the fact that demographic change has not been accompanied by widespread changes in marriage patterns and family structure. In India, family traditions and rules remain strong. Arranged marriages within the tightly defined limits of caste and religious groups are still the norm. The system of arranged and stable marriages is unlikely to change any time soon, rooted as it is in India’s caste and religious systems.
Demographic changes are shaping India’s society, and government policy has been instrumental in this. Fears that population growth would limit economic progress have given way to optimism about economic opportunity. Parents with fewer children put more emphasis on educat-ing their offspring. Therefore the future now looks brighter than it did a few decades ago, when larger families had lesser means to invest in their children’s future.
If demographic opportunities are now backed by government efforts to improve education and skills, particularly for girls and women, then India
Unless India addresses its deficit in skilled men and women, its favorable demographics will not translate into economic gain
287 millionIndians are still illiterate
226 227

Demographic trends are gradually changing the business environment for companies, on the national, regional and global level. In the course of declining fertility, on the one hand, and increasing life expectancy, on the other, the number of people over 65 is projected to triple by 2050 to reach 1.5 billion. At the same time, the number of younger people between 15 and 24 years will level off at around 1.3 billion.1 These devel-opments will result in major shifts in the age structure of societies.
Discussions about aging have thus far been focused on how it will strain social security systems. Many countries have adopted a broad range of reforms in order to ease the financial burden on future generations and make pension systems more sustainable (see chapter 8). Governments have reduced the benefit ratios of tax or contribution-funded (pay-as-you-go) public pension systems, increased retirement ages and intro-duced or further strengthened capital-funded occupational and/or private pension schemes. Furthermore, many industrialized countries, particularly in Europe, have stepped up their efforts to become more fam-ily friendly. Public subsidies, tax breaks and the provision of better child-care are designed to make having more children attractive to families.
Demographic change will also have a major impact on a country’s inter-national competitiveness, as it determines the composition and the size of its consumer market as well as its labor force. So far, current or expected
How will the private sector deal with demographic change?by Michaela Grimm
CHAPTer 12
229

74 per cent of her total life. On average, men and women aged 65 could expect to spend respectively another 8.4 and 8.5 years in good health.4
Demographers are optimistic that the time spent in good health will increase further, last but not least due to medical advancements. In Malta, the leading EU country in this respect, the average newborn boy in 2012 could already expect to spend 91 per cent of his life in good health, and a girl, 87 per cent. Demographers expect the onset of age-related illnesses – such as cancer, cardiovascular disease, dementia and diabe-tes – to occur later. This will not only add to the quality of life but also reduce health care costs.
know your (aging) customerFor companies, these trends will entail great changes in their pool of potential customers in a rather short period of time. In 2014, the over- 50s already accounted for more than half of consumer spending in many Western countries.5 This trend is set to persist: nearly one in two potential customers in Europe and the US in 2030 will be aged 50 or older. Among them, the share of those over 65 will also increase further. In the US and Canada, one in five potential customers will be 65 or older in 2030; in western and southern Europe, it will be one in four; and in Japan, almost one in three.
In Europe, a newborn boy can expect to spend 61 years of his life in good health
figure 12.1 Time spent in retirement is getting longer
Source: UN Population Division, World Population Prospects, 2012 Revision
Africa Asia europe latin AmericaCaribean
northern America
Oceania
1950–1955 1970–1975 1990–1995 2010–2015 2030–2035 2050–2055
further life expectancy at age 65, in years
23
21
19
17
15
13
11
9
changes in the working-age population have mainly been discussed with a view towards the future financing of social security systems, if at all. Less attention has been paid to the question of how companies might cope with a workforce that is aging and, in some places, stagnating or even shrinking. These aspects will gain in importance, especially because the availability of qualified workers is a prerequisite for eco-nomic growth.
Older, but healthierThere are two reasons for the impressive rise in the number of people of retirement age.2 First, the baby-boomer generation is reaching retire-ment age. In the US, for example, the number of baby boomers – those born during the years of high birth rates between 1946 and the mid-1960s – is estimated at 76 million, or almost one quarter of the total population. Second, life expectancy is rising fast while retirement ages are changing slowly. In the 1950s, a 65-year-old man could expect to live an average of almost 11 years after retiring; a woman of the same age around 12 years. In 2014, a man retiring at 65 could expect to spend an average of 15 years in retirement, while the average further life expec-tancy of a 65-year-old woman had increased to 18 years. By 2030, if people could still leave work at 65, men would be looking forward to more than 16 years and women to around 19 years of retirement.
These numbers, however, refer to the global average. There are of course significant differences between countries and world regions (see figure 12.1). An Aus tralian man in 2014 can expect to live 19 years beyond age 65; and a Japanese woman 24 years, for example. In Sierra Leone, by contrast, the average further life expectancy of both men and women at 65 was less than 10 years. Nevertheless, what all countries and regions have in common is that life expectancy at birth as well as life expectancy at higher ages is set to increase further.3
It matters not only how long we live, but also whether these addi tional years are spent in relatively good health and without disability (see chapter 7). In recent years, researchers have collected growing amounts of data on the actual and perceived health of people of different ages. These statistics show that healthy life expectancy has also increased.
In the EU-28 countries, for example, an average boy born in 2012 could expect to spend 61 years, or 79 per cent, of his life, in good health, while the healthy life expectancy of a baby girl was almost 62 years, or
2019the year when there will be more people over 65 on the planet than children under five
76 millionnumber of baby boomers in the US
230 231

construction industry, for example, will also have to cater to the growing demand for barrier-free, senior-friendly residences, public buildings and hotels, while the transport sector will have to provide easily accessible buses and trains.
The financial services industry could see a rising number of applications for start-up loans from company founders over 60, who will want to continue utilizing their experience and know-how, either because they need an additional source of income or because they are simply not ready to retire. There may also be a growing demand for modular insur-ance solutions, designed to allow older customers to assemble insurance coverage in line with their individual needs. Due to cuts in social services, products such as pension annuities, health policies and long-term care policies will probably remain the basic and most popular products for this age group. In addition, there may be a growing demand for short-term travel or accident insurance tailored to the needs of the customers. And, with traditional family structures disintegrating and the number of single or two-person households on the rise, there will be probably be a greater demand for assistance services.
A changing workforceHowever, companies should prepare for a customer base that is not only older but also still active. They will have to adjust to the changing needs of an aging and stagnating or even declining workforce. The question of whether companies will be able to hire sufficient numbers of qualified people will become crucial in the economic fortunes of countries and regions.
Due to decreasing fertility rates worldwide, growth in the number of people of working age – here defined as those between 20 and 64 – will slow down more or less markedly in all regions of the world. At the same time, the share of those aged between 50 and 64 in the overall working-age population will increase. However, countries and regions will be affected to varying degrees by changes in the size and age structure of the working-age population.
In the US, the working-age population will have grown by less than 4 per cent by 2030 – from around 192 million in 2014 to 199 million in 2030. The developments in Latin America, Asia and Africa will be much more dynamic. In Latin America, the working age population is expected to increase by around 20 per cent; in Asia, it will grow by around 13 per cent;
Older generations of the future will demand cars with the latest driver-assistance systems, gadgets with senior-friendly key-boards and new mobile care technologies
43 millionfewer people of working age on the European continent by 2030
The elderly of 2030 are likely to differ from the older generations of today in their tastes, consumption habits and activities. They will be much more familiar with the Internet and new technologies, for example. Pension reforms mean that a higher share of people between 65 and 69 will be active in the labor market. The older generation will not only be healthier, but most of them are also likely to have more money to spend on goods, leisure and travel.
Older generations of the future will demand age-appropriate products, such as cars with the latest driver-assistance systems, gadgets with senior-friendly keyboards and new mobile care technologies.
Consumer industries and healthcare providers are not the only sectors that will have to adjust to an increasing number of older customers. The
The over-50s account for more than half of consumer spending in many Western countries
232 233

there are growing complaints about a shortage of skilled workers in coastal regions. Thailand’s working-age population will start to shrink in 2017; and South Korea’s, two years later. Japan has had to cope with a declining working-age population since 1998, and the number of work-ers is projected to contract by another 10 per cent in the next 15 years.
In most Latin American countries, the growth of the working-age pop-ulation will slow down markedly, reflecting the steep decline in fertility rates since the 1970s. Brazil, the region’s largest economy, might even face an absolute decrease of its working-age population from the end of the 2030s onwards.
Working-age populations, however, will not only grow more slowly or shrink in many parts of the world, but they will also age. This trend will persist even after the baby boomers will have left the labor market, largely due to declining fertility rates. In the US, Canada, Japan and most European countries today, one in three people of working age is already over 50. And this proportion will continue to increase. By 2030, around 40 per cent of the workforce in Spain and Portugal, for example, will be in this age group, like in Japan and South Korea (see figure 12.3).
How countries can cope with demographic changeCountries have several options for mitigating the impact that demo-
In the US, Canada, Japan and most European countries, one in three people of working age is over 50
figure 12.3 The aging of workforces is a worldwide trend
Source: UN Population Division, World Population Prospects, 2012 Revision 1990 2014 2030 2050
Older workers (50–64), as per cent of total working-age population
40
35
30
25
20
15usA Brazil Chile China Japan south
koreaThailand eastern
europesouthern
europewestern europe
and in Africa, by around 53 per cent. By contrast, the growth rate in Europe (including Russia and eastern Europe) has already turned nega-tive and the number of Europeans in this age group is expected to decline by 9 per cent, from 461 million today to 418 million in 2030. EU countries will be affected by demographic change to varying degrees (see figure 12.2). While Lithuania will have to cope with a 36 per cent decrease in its working-age population between 2014 and 2030, the decline in Germany will be 13 per cent, and in France, only 2 per cent. By contrast, the working-age population in the UK, Sweden, Denmark and Luxembourg is expected to continue to grow. The forecast for an extremely high growth rate of almost 40 per cent in Luxembourg, how-ever, is based on the assumption that the country will continue to attract high numbers of immigrants.6
Nevertheless, not only European countries will have to cope with a shrink-ing working-age population. Asia and Latin America will also be facing demographic challenges. Asia’s comparatively favorable outlook in this respect is largely due to India’s demographic development (see chapter 11), even though Japan, Thailand, China and the Asian Tiger countries (Hong Kong, Singapore, South Korea and Taiwan) will have to come to terms with diminishing working-age populations. In China, for example, the working-age population is projected to peak in 2016.7 Already today,
1998the year in which Japan’s working-age population started to shrink
figure 12.2 europe’s shrinking pool of workers
Source: Eurostat (2014)
40
30
20
10
0
−10
−20
−30
−40
Change in the working age population (20 to 64), per cent, 2013–2030
lTu
lAT
Bul
gre
ger
POl
POr
esP
rOm
Hu
n
CZe
eu 28
frA
ITA
uk
swe
lux
esT
234 235

grants to the US are from Latin America – mostly from Mexico – and another 30 per cent come from Asia.10 As both Asia and Latin America also face demographic challenges, immigration to North America and Europe from these regions may decline in the future, while intra-regional migration in Asia and Latin America could increase.
II education and trainingWith skilled migrants becoming a scarcer resource and working-age populations in stagnation or decline, Western countries will have to take measures to raise their levels of productivity in order to cushion the demographic effects on their working-age populations. The most prom-ising way to do this is to improve the education and qualification of the working-age population. This, however, does not simply involve sending increasing numbers of young people to university. It will also entail offering people of all ages more training, either within companies or externally. Lifelong learning will become more important, especially against the background of an aging workforce and a longer working life (see also chapters 7 and 8 as well as box 9).
III Increased labor force participation In most countries, only a portion of the working-age population is actually available on the labor market. Therefore, measures to increase activity rates can help cushion the impact of demographic change on the labor market.
There are marked differences in labor force participation rates between countries and age groups as well as between men and women. In general, men’s participation rates are higher than those of women (see figure 12.4). In many countries, women still struggle to combine work and family, and they either drop out of the labor market for several years or, if possible, work part-time.
Moreover, the proportion of those available for work is higher among those aged 25 to 54 than those aged 55 to 64, as many people who are still entitled to early retirement leave the labor market before reaching the statutory retirement age.
Some countries, such as Sweden and Switzerland, are very successful in drawing a large share of the working-age population into the labor market. In 2013, more than 90 per cent of those aged 25 to 54 in both countries were available on the labor market. For the age group 55 to 64,
49 %of those aged 55 to 64 are available for work in France
78 %of those aged 55 to 64 are available for work in Sweden
Lifelong learning will become more important against the background of an aging workforce and a longer working life
graphic change will impose on their economies and businesses: fostering immigration; increasing labor productivity, for example through educa-tion and training; bringing more people into the labor force; and extend-ing working lives, especially by postponing retirement.
I ImmigrationCountries facing a shrinking working-age population can try to attract more skilled immigrants in order to ease labor shortages, at least tempo-rarily. If future net migration were zero (in other words, the number of emigrants leaving were balanced out by immigrants to the country), in the EU-28 for example, the EU’s working-age population would shrink by 30 million – instead of the currently predicted 17 million – to 277 million in 2030.8 In the US, the working-age population would drop by 8 million, to 184 million – instead of increasing by 7 million, if current immigration rates persist.9
Although such scenarios are unlikely, it may well become more difficult for Western countries to attract qualified migrants, as the countries and regions where most migrants come from today are also subject to demographic change (see chapter 10). Today, around one-third of immi-grants in the EU originate from other European countries, with 25 per cent coming from Africa, especially from the former French colonies, and around 21 per cent from Asia. More than half of the 38 million immi-
Western countries will find it more difficult to attract qualified migrants
figure 12.4 Potential to increase participation in the labor force
Source: ILO men (25 to 54) women (25 to 54) Total (55 to 64)
Activity rates by sex and age group, per cent of respective age group, 2013
80 85 90 95 100 50 60 70 80 90 40 50 60 70 80
JPnsuImexswefrAgerukkOrCAnAusnOrusAITA
swesuInOrfrACAngerukAusJPnusAITAkOrmex
swesuInOrJPngerkOrCAnusAAusukmexfrAITA
236 237

Young people entering the labor market around 2030 (often referred to as Generation Z) will be even more digitally savvy than those starting work today, and they will probably have different demands and expec-tations. Ongoing digitalization is likely to continue blurring the bound-aries between work and leisure. Therefore, when choosing an employer, Generation Z will be weighing up not only career opportunities and fringe benefits, but also flexible working hours and an improved work- life balance.
Furthermore, faced with such pressing demographic challenges, neither societies nor companies can afford to leave less qualified young people behind. Therefore, efforts to attract young people as employees should not solely focus on university graduates. As the number of school leavers is shrinking, companies will have to reinforce their efforts to integrate those with poorer academic performance. Providing these young people with targeted support – for example mentoring and special education courses – may not only help them pass their exams and prepare for working life, but it could enable companies to retain them as qualified workers in the medium to long term.
As the competition for qualified migrants increases, it will also become more important for companies to overcome intercultural and language barriers (with the latter probably being easier to achieve). Simple steps can help – for example, providing information about a company and its career opportunities not only in the language of the country where the company is based in but also in English. Many companies already offer international employees assistance in dealing with everyday life in their new country, or mentoring through a colleague who speaks the same language. Such measures will become more important distinguishing characteristics of companies in the future.
Many countries are already discussing how better to retain and integrate women in the labor market. Nevertheless, numerous companies still seem to adopt an attitude of wait and see. In future, in order to attract and retain female employees, companies will have to provide more childcare facilities – either by running their own nurseries, kindergartens and after-school facilities or by subsidizing establishments nearby. In addition, flexible working hours and the possibility of reducing working time temporarily will increase in importance, as will career chances for those – both women and men – who work part time.
Future entrants into the labor market will value flexible working hours and an improved work-life balance
70 %of German mother with under-age children work part-time, compared with 6 % of fathers
Sweden reported an overall activity rate of 78 per cent, and Switzerland of 74 per cent. The main reason for these high numbers is that both coun-tries have succeeded in integrating a high share of the female population into the labor force. Japan, on the other hand, has even higher activity rates among men, but the overall labor force participation was much lower, as the proportion of working women is lower.11
Many governments are trying to copy measures taken in countries with high participation rates, such as Sweden or Switzerland, since an increase in participation would have a significant impact on the labor market. If the US, for example, succeeded in increasing the labor force participation of those aged 55 to 64 from today’s 64 per cent to the 78 per cent that Sweden has achieved, it would add another 5.6 million people to its labor market by 2030. In Germany, the increase in the official retirement age – from 65 to 67 years – will potentially add another 2.7 million people to its workforce in 2030.
Raising the retirement age and reducing early retirement options can help increase activity rates among older age groups. Pension reforms in various EU-28 countries since 2001, for example, have extended the average working life by about three years. This has contributed to a rise in the average labor force participation rate of those aged 55 to 64 – to 54 per cent, an increase of 11 percentage points.
Companies, however, must also be willing to employ older workers. It makes little sense to restrict early retirement options and raise retirement ages if older people cannot find jobs.
what companies must doIn most industrialized countries, as the baby boomers approach retire-ment age, the number of people in the 15–24 age bracket completing their education and entering the labor market will either shrink or stagnate. In the US, for example, their number will increase by a mere 0.1 per cent between 2014 and 2030. In western Europe, the number of new entrants will shrink by 6 per cent over the same period.
Faced with these demographic trends, one of the key challenges for companies will be to attract young people and immigrants while main-taining and training existing staff and adapting to the needs of an aging workforce.
It makes little sense to restrict early retirement options and raise retirement ages if older people cannot find jobs
238 239

When planning future workflows and work organization, companies will also have to consider their older employees’ growing demand for sabbaticals and part-time employment. This demand doesn’t just stem from the wish to have time for hobbies or travel. Many employees over 50 will want to spend more time with their family, and many will have to provide care for a frail parent or relative. A growing number of employees will have parents in their 80s and 90s who may require help or care. Today, between 60 and 70 per cent of all people in need of care are being
Many older employees will have to provide care to a frail parent or relative
The shortage of younger workers, the need to attract highly qualified migrants and the question of how to draw women into the workforce are all issues that have been the subject of lively debate in many countries. By contrast, much less attention has been paid to the challenges of an aging workforce. One reason for this could be that many companies are still not aware of this development, as activity rates in this age group today are still relatively low. With the curtailment of early retirement options, increases in retirement ages and lowering of public pension ben-efit levels, this is likely to change. Moreover, in a few years, companies in countries with shrinking working-age populations might depend even more heavily on their older, more experienced employees.
As the aging of the workforce is an irreversible trend, the working environment must be adjusted to the changing needs of older employees, particularly to maintain or increase their productivity. While some necessary adjustments may be made quickly, others will take considerable time. Worryingly, surveys show that many companies still claim that they will not be affected by these changes and have no clear picture of what the age structure of their workforce might look like in 10 to 15 years’ time.
One of the easier – though not necessarily cheaper – ways to adapt would involve making workplaces more age-friendly by, for example, installing brighter lighting, bigger screens, height-adjustable desks and ergonomic chairs. Companies may also have to consider how they assemble teams: whether it is more effective to integrate younger and older workers into teams or to collect teams of colleagues in the same age bracket.
It will probably take some time to find solutions that fit best for each task and workflow. In companies that rely on shift work, for example, re- scheduling day and night shifts could raise overall productivity, with younger colleagues working more night shifts than older ones.
Furthermore, with retirement ages rising, career paths should not end at the age of 50, as they often do now. Longer career paths would not only reduce pressure during the earlier stages of careers, they would also provide incentives for companies to offer – and workers to enroll in – more education and training even at later stages of a career. Lifelong learning will become increasingly important as companies require high-qualified staff to remain competitive.
In countries with shrinking working-age populations, companies will have to depend more on their older, more experienced employees
Career paths should not end at the age of 50
240 241

1 Population projections in this chapter are from the UN Population Division, World Population Prospects – The 2012 Revision, 2013, CD-ROM edition, unless stated otherwise.
2 The majority of people aged 65 and older live in Asia, where we will also see the most dynamic development of this age group. Their number will nearly triple by 2050 – from 317 million today to 900 million – whereas it will increase by only one third in Europe – from 127 million to 191 million.
3 UN demographers expect that, by mid-century, the average further life expectancy in Japan of a 65-year-old man will be 23 years, and of a woman 28 years.
4 See Eurostat, http://epp.eurostat.ec.europa.eu.5 See for example Statistisches Bundesamt, Wirtschaftsrech-
nungen. Laufende Wirtschaftsrechnungen. Einnahmen und Ausgaben privater Haushalte, Wiesbaden, May 2014. Bank of America-Merrill Lynch, The Silver Dollar – Longevity Revolution: Growing the Silver Economy in Europe, September 2014.
6 Eurostat database.7 This refers to the age group 20 to 59, taking into account
the official retirement age of 60 years. The number of people aged between 15 and 59, however, has been shrinking since 2011.
8 In its central scenario, Eurostat assumes annual net immigration of around 1 million until 2030.
9 UN Population Division (2013). The US Census Bureau assumes an annual net immigration rate of 955,000 until 2030.
10 US Census Bureau; data refers to 2011.11 Japan has the highest labor force participation among men,
with 96 per cent of those aged 25 to 54, and 84 per cent aged 55 to 64, available on the labor market in 2013. Sweden has the highest labor force participation among women, with 88 per cent of prime-age women, and 74 per cent of those aged 55 to 64, available on the labor market in 2013. See ILO database.
looked after by their own children or family members, most of whom are over 55 themselves. This will create a conflict between the demands of the labor market and the growing need for care provision. Companies can play an important role in alleviating this dilemma, for example by offering flexible working arrangements.
Finally, and perhaps most urgently, as the baby boomers start to retire, companies need to implement measures to manage the transfer of know- how from the older to the younger generations.
This list of measures to cope with demographic change is not meant to be comprehensive. Nevertheless, it illustrates the urgent need for companies and countries to adapt to upcoming demographic shifts in order to stay competitive in a changing environment.
Michaela Grimmis Senior Economist in Group Public Policy and Economic Research, Allianz SE. After studying economics and Chinese at Eberhard Karls University Tuebingen, Germany, and Peking University, PR China, Ms Grimm joined Allianz Group in 2000, where she has held various research positions. Since 2009, she has been working in the Economic Research department, focusing on insurance market developments in emerging countries and the impact of demographic change on the private sector, social security systems and financial markets.
editorial OfficeAllianz SEGroup Public Policy and Economic ResearchKoeniginstr. 2880802 MunichGermany
Creative Agencyopus 5 hamburg gmbhGroßneumarkt 5020459 HamburgGermany
Printing HouseLangebartels & Juergens GmbHWoerdemanns Weg 5822527 HamburgGermany
This book is published by Allianz SE, Koeniginstr. 28, 80802 Munich, Germany. All right reserved. Reproduction in whole or in part without permission is prohibited. All paper used in the production of this book comes from well managed sources.
ImPrInT
242 243

18 fIgure A.1 CO2 emission19 fIgure A.2 Rises in temperature26 fIgure 1.1 Share of fuel type in total
energy consumption33 fIgure 1.2 Cumulative greenhouse gas
emissions61 fIgure 3.1 The European carbon price66 fIgure 3.2 The cost of solar power98 fIgure 5.1 Total CO2 emissions99 fIgure 5.2 CO2 emissions per capita104 fIgure 5.3 Energy consumption per capita105 fIgure 5.4 Growth in the population,
GDP per capita and car ownership108 fIgure 5.5 Targets of the 12th five-year plan
for energy development132 fIgure B.1 The world’s population133 fIgure B.2 Fertility rates by region134 fIgure B.3 Life expectancy at birth135 fIgure B.4 Population aged 65 and older138 fIgure 7.1 Life expectancy at birth in
developed countries145 fIgure 7.2 Lifelong learning156 fIgure 8.1 Living longer, retiring earlier166 fIgure 8.2 Italian economic growth
and public debt181 fIgure 9.1 Car ownership196 fIgure 10.1 Developements in mirgration197 fIgure 10.2 GDP per capita200 fIgure 10.3 Stock of migrants216 fIgure 11.1 India’s population growth is
slowing sharply217 fIgure 11.2 India will have a large and
stable working-age population219 fIgure 11.3 Fertility is higher in the north
and lower in cities231 fIgure 12.1 Time spent in retirement is getting
longer
234 fIgure 12.2 Europe’s shrinking pool of workers235 fIgure 12.3 The aging of workforces is a
worldwide trend236 fIgure 12.4 Potential to increase participation
in the labor force
Index Of fIgures
OfC xPACIFICA/Corbis6 plainpicture/Cultura14 Henn Photography/Corbis20 Paul Souders/Corbis23 Patrick J. Endres/AlaskaPhotoGraphics/Corbis30 picture alliance/dpa34 2/Don Farrall/Ocean/Corbis40 Perry L Aragon/Moment/Getty Images45 Cyril Ruoso/JH Editorial/Minden Pictures/Corbis48 Enrique Castro-Mendivil/Reuters50 Monalyn Gracia/Corbis53 Bettmann/Corbis56 plainpicture/Elektrons 0860 Karim Jaafar/AFP/Getty Images64 P.H. Yang/Demotix/Corbis67 Mike Blake/Reuters69 Vincent West/Reuters76 NASA/Roger Ressmeyer/Corbis79 picture alliance/dpa82 NASA/Reuters86 Torsten Blackwood/AFP/Getty Images89 Paul Yeung/Reuters96 Jason Lee/Reuters/Corbis100 Tony Law/Redux/laif103 Keren Su/Corbis113 MeteoSchweiz113 Thomas Ebert/laif114 Vincent Nguyen/Riva Press/laif117 Jonathan Blair/Corbis120 Cameron Davidson/Corbis123 SURE Architecture126 Peathegee Inc/Blend Images/Getty Images128 Nash Photos/Photographer’s Choice/
Getty Images136 plainpicture/Fancy Images140 Jose Luis Pelaez/Corbis141 Rana Faure/Corbis
143 Musketeer/Iconica/Getty Images146 Mads Nissen/laif151 collector/voller Ernst/fotofinder152 Vintage Germany/fotofinder154 picture alliance/dpa157 Paul Sutherland/13/Ocean/Corbis158 John Fulton/Gallery Stoc161 Luis Rubim/Demotix/Demotix/Corbis164 Tony Duffy/Sports/Getty Images169 BartekSzewczyk/iStock/Thinkstock175 Michele Constantini/PhotoAlto/Corbis176 picture alliance/dpa179 picture alliance/dpa183 Sarah Johanna Eick/Corbis184 Jon Hicks/Corbis189 picture alliance/dpa190 picture alliance/dpa192 Andy Kropa/Getty Images195 Darrin Zammit Lupi/Handout/Reuters199 Shutterstock206 moodboard/Corbis214 Jim Holmes/Design Pics/Corbis218 Silke Wernet/laif223 Dirk Kruell/laif224 Francois Lenoir/Reuters228 Ian Lishman/Juice Images/Corbis232 Colin Hawkins/Corbis241 plainpicture/Maskot
PHOTO CredITs
244 245