Optimization of Marine Bacteria Enterococcus sp. Biomass Growth by using Response Surface...
8
Optimization of Marine Bacteria Enterococcus sp. Biomass Growth by using Response Surface Methodology Abstract Enterococcus sp. is one of the most important causes of substantial infections worldwide. It is a fastidious micro organism with fine nutritional and environmental requirements to cultivate, a characteristic that prevents the development of useful animal models to study the biology of the micro organism. This study was designed to determine optimal conditions for culture and growth of Enterococcus sp. The bacteria Enterococcus sp. was selected from isolates of marine water. Response surface methodology was employed to optimize a bacterial biomass growth. The five variables involved in the study of growth conditions were Yeast extract, beef extract, NaCl concentration, pH and Temperature. This is an estimate of the fraction of overall variation in the data accounted by the model, and thus the model is capable of explaining 99.96% of the variation in response Keywords : Enterococcus sp.; Growth, Optimization ; Response Surface Methodology. _______________________________________ *C.Kannan. Tel.: +919443507036 E-mail : [email protected] Nattokinase production by Bacillus subtilis (Deepak et al., 2008) chitinase production by Pantoea dispersa (Gohel et al. 2005) cyclodextrin glycosyltransferase production from Klebsiella pneumoniae AS-22. (Gawande and Patkar 1999), alkaline protease from Bacillus horikoshii (Joo et al. 2002), thermostable alkaline protease from ther- mophilic and alkalophilic Bacillus sp. JB-99 (Johnvesly and Naik 2001) were produced previously. There are many designs playing an important role in the increasing of biomass growth. In that Fractional factorial design provides an option when the numbers of runs for a full factorial design is too large to be feasible. Plackett–Burman design, Taguchi design, central composite design and Box–Behnken design are fractional factorial designs that were used for increased microbial production processes. In that Box– Behnken design provides an inexpensive option to the central composite design(Jianlong and Wei 2008). Optimizing of biomass growth is one of the important processes in microbiology J. Environ. Nanotechnol. Volume 2, No. 1 (2013) pp. 20-27 ISSN (Print) : 2279-0748 ISSN (Online) : 2319-5541 S. Rajeshkumar 1,2 , G. Gnana Jobitha 1,2 , C. Malarkodi 1 , C. Kannan 2,* , G. Annadurai 1,* 1 Environmental Nanotechnology Division, Sri Paramakalyani Centre for Environmental Sciences, Manonmaniam Sundaranar University, Tirunelveli, TN, India. 2 Department of Chemistry, Manonmaniam Sundaranar University, Tirunelveli, TN, India. Received : 27.11.2012 Revised on : 30.01.2013 Accepted : 04.03.2013 1. INTRODUCTION Response surface methodology (RSM) is a compilation of mathematical and statistical techniques useful for emergent, improving, and optimizing processes. It is a well-known method applied in the optimization of composition in the medium and other critical variables responsible for the fabrication of biological molecules (Myers and Montgomery 2007). For the rapid optimization of microbiological media RSM is vigorously involved (Maddon and Richard 1977). Marjory it plays an important role in the production of enzymes using microorganisms like cyclodextrin lucanotransferase from Bacillus stearothermophilus HR1 ( Rahman et al. 2004), lucosyl transferase by Aspergillus niger Lee and Chen 1997). linolenic acid in Mortierella ramanniana var. ramanniana (Dyal et al. 2005) alpha amylase production by Bacillus amyloliquefaciens ( Dhanya et al. 2008),
Transcript of Optimization of Marine Bacteria Enterococcus sp. Biomass Growth by using Response Surface...
Optimization of Marine Bacteria Enterococcus sp. Biomass Growth by usingResponse Surface Methodology
Abstract
Enterococcus sp. is one of the most important causes of substantial infections worldwide. It is a fastidiousmicro organism with fine nutritional and environmental requirements to cultivate, a characteristic that prevents thedevelopment of useful animal models to study the biology of the micro organism. This study was designed to determineoptimal conditions for culture and growth of Enterococcus sp. The bacteria Enterococcus sp. was selected from isolatesof marine water. Response surface methodology was employed to optimize a bacterial biomass growth. The five variablesinvolved in the study of growth conditions were Yeast extract, beef extract, NaCl concentration, pH and Temperature.This is an estimate of the fraction of overall variation in the data accounted by the model, and thus the model is capableof explaining 99.96% of the variation in response
Keywords : Enterococcus sp.; Growth, Optimization ; Response Surface Methodology.
_______________________________________*C.Kannan. Tel.: +919443507036E-mail : [email protected]
Nattokinase production by Bacillus subtilis (Deepak et al.,2008) chitinase production by Pantoea dispersa (Gohelet al. 2005) cyclodextrin glycosyltransferase productionfrom Klebsiella pneumoniae AS-22. (Gawande and Patkar1999), alkaline protease from Bacillus horikoshii (Jooet al. 2002), thermostable alkaline protease from ther-mophilic and alkalophilic Bacillus sp. JB-99 (Johnveslyand Naik 2001) were produced previously. There aremany designs playing an important role in the increasingof biomass growth. In that Fractional factorial designprovides an option when the numbers of runs for a fullfactorial design is too large to be feasible.
Plackett–Burman design, Taguchi design, centralcomposite design and Box–Behnken design are fractionalfactorial designs that were used for increased microbialproduction processes. In that Box– Behnken designprovides an inexpensive option to the central compositedesign(Jianlong and Wei 2008). Optimizing of biomassgrowth is one of the important processes in microbiology
J. Environ. Nanotechnol.Volume 2, No. 1 (2013) pp. 20-27
ISSN (Print) : 2279-0748 ISSN (Online) : 2319-5541
S. Rajeshkumar1,2, G. Gnana Jobitha1,2, C. Malarkodi1, C. Kannan2,*, G. Annadurai1,*
1 Environmental Nanotechnology Division, Sri Paramakalyani Centre for Environmental Sciences,Manonmaniam Sundaranar University, Tirunelveli, TN, India.
2Department of Chemistry, Manonmaniam Sundaranar University, Tirunelveli, TN, India.
Received : 27.11.2012 Revised on : 30.01.2013 Accepted : 04.03.2013
1. INTRODUCTION
Response surface methodology (RSM) is acompilation of mathematical and statistical techniquesuseful for emergent, improving, and optimizing processes.It is a well-known method applied in the optimization ofcomposition in the medium and other critical variablesresponsible for the fabrication of biological molecules(Myers and Montgomery 2007). For the rapidoptimization of microbiological media RSM is vigorouslyinvolved (Maddon and Richard 1977). Marjory it playsan important role in the production of enzymes usingmicroorganisms like cyclodextrin lucanotransferase fromBacillus stearothermophilus HR1 ( Rahman et al. 2004),lucosyl transferase by Aspergillus niger Lee and Chen1997). linolenic acid in Mortierella ramanniana var.ramanniana (Dyal et al. 2005) alpha amylase productionby Bacillus amyloliquefaciens ( Dhanya et al. 2008),
and microbial technology having a wide varietyapplication. There are many kind of secondary metabolitesare isolated from marine bacterial strains (Jensen andFenical 1994). In this investigation we produced themaximum growth of Enterococcus sp by using Responsesurface methodology.
2. MATERIALS AND METHODS
2.1 Media, chemical and Microorganism
Microbiological nutrients Yeast extract, Beefextract and sodium chloride were purchased from HiMedia, Mumbai. The marine water sample was collectedfrom Kanyakumari coastal area, Kanyakumari district,South Tamilnadu, India in a clean sample container. Abacterial strain was isolated by serial dilution techniqueand identified by biochemical tests.
2.2 Selection of significant variables by Box-Behnkendesign
Response surface methodology (RSM) consistsof a group of empirical techniques devoted to theevaluation of relations existing between a cluster ofcontrolled experimental factors and the measuredresponses, according to one or more selected criteria. Forthe selection of significant variables for optimization ofMaximum Biomass Activity by bacterial strainEnterococcus sp, a variety of Yeast Extract (g/L), Peptone(g/L), NaCl (g/L), Temperature (oC) and pH were testedand identified via the Box-Behnken design experiments.A total of five parameters were included for selection, witheach variables represented at three levels (-1, 0, +1). Thevariables were as follows: peptone (g/dL) (0.1, 0.5 0.9)(X1); Yeast extract (0.15, 0.3, 0.45) (g/dL) (X2), NaCl (g/dL) (0.1, 0.5, 0.9) (X3), pH (6.3, 7.05, 7.8.) (X4) andTemperature (25, 30, 35 0C) (X5) at different concentrationsof above nutrient designed (Design expert 7.0.1.) asshown. The design experiments were carried out inconical flasks containing minimal medium and inoculatedwith bacterial strain Enterococcus sp at 180 rpm in shakerfor different incubation period (hrs). After incubationperiod (hrs), the amount of maximum Biomass Activitywas calculated by taking samples. The principal effectsof each variable on maximum biomass activity were
estimated as the difference between both averages ofmeasurements made at the higher level and at the lowerlevel. The significance of each variable was determinedvia Student’s t-test. The statistical software package ‘De-sign Expert@ 7.0.1. Stat Ease Inc., (Minneapolis, MN.USA) was used to analyze the experimental design. Atcertain time intervals, 5 ml of sample was withdrawn,analyzed with a UV–Vis spectrophotometer and returnedto the reactor. The Maximum Biomass Activity wasmeasured with the above-mentioned spectrophotometerat 600 nm. Calibration plot based on Beer–Lambert’slaw was established by relating absorbance to theconcentration.
2.3 Experimental design and optimized by responsesurface methodology
RSM is an empirical statistical modeling tech-nique employed for multiple regression analysis usingquantitative data obtained from properly designed experi-ments to solve multivariable equations simultaneously.RSM is used to determine the optimum response of cells,for the biosynthesis of nanoparticles under a wide rangeof nutrient conditions. Basically this optimization processinvolves three major steps, performing the statisticallydesigned experiments, estimating the coefficients in amathematical model, predicting the response and check-ing the adequacy of the model (Box and Hunter 1957;Box and Behnken 1960).
In order to describe the effect of factors onresponse surface in the region of investigation, a Box-Behnken design with five levels was performed. ABox - Behnken design in the five independent variableswere used to obtain the combination of values that opti-mize the response within the region of three dimen-sional observation spaces, which allows one to design aminimal number of experiments (Cochran and Cox 1968;Gopinath et al. 2003). The Box-Behnken design wasapplied using Design-Expert (version 7.0.1) and the totalnumber of experiments with four variables was 46experiments. Fourty experiments were augmented with tenreplications at the center points to evaluate the pure error.In the optimization process the response can be related tochosen factors by linear or quadratic models. Theaverage of the maximum biomass activity of the duplicate
21 Kannan et al. / J. Environ. Nanotechnol., Vol. 2(1), 20 - 27, (2013)
values obtained was taken as dependent variable orresponse Yi (U). Duplicates are necessary to estimate thevariability,of experimental measurements, i.e. therepeatability of the phenomenon. Replicates at the centreof the domain in three blocks permit the checking of theabsence of bias between several sets of experiments. Theexperimental results of RSM were fitted via the responsesurface regression procedure, using the following second–order polynomial equation:
)..........,,,,( 54321 kXXXXXXfY (1)
The true relationship between Y and Xk may becomplicated and in most cases, it is unknown; however, asecond-degree quadratic polynomial can be used torepresent the function in the range of interest:
ji
k
jij
k
jiii
k
iiii
k
iio XXRXRXRRY
2
1
,1
2
11 (2)
where X1, X2, X3, X4, X5, …, Xk are the input variableswhich affect the response Y, R0, Ri, Rii and Rij (i = 1–k,j = 1–k) are the known parameters, ε is the random error.A second-order model is designed such that variance of Yis constant for all points equidistant from the center of thedesign. Coding of the variables was done according to thefollowing equation
(3)
Where Xi is the coded value and Xo is the actual value ofthe independent variable, Xo is the actual value at the centerpoint and Xi is the step change value. The followingequation was used for coding the actual experimentalvalues of the factors in the range of (1- to +1). In systeminvolving five significant independent variables X1, X2,X3, X4 and X5 the mathematical relationship of the responseof these variables can be approximated by quadratic(second degree) polynomial equation;
i
oii X
XXX
Where Y is the predicted value, bo is the constant, YeastExtract (g/L) (0.5, 1.5, 2.5) (X1); Peptone (g/L) (0.5, 1.52.5) (X2), NaCl (g/L) (0.5, 1.5, 2.5) (X3), Temperature (35,30, 400C) (X4) and pH (6.0, 7.4, 8.8.) (X5), b1, b2, b3, b4and b5 are linear coefficients, b12, b13, b14, b15, b23, b24 b25,b34, b35 and b45 are cross product coefficients and b11, b22,b33 b44 and b55 are quadratic coefficients. The design ofexperiments was carried out for analysis using the designexpert by Stat Ease lnc, Statistics Made Easy, Minneapolis,MN Version .7)
3. RESULTS AND DISCUSSION
3.1 Isolation and Identification of microorganism:
The microorganism in the marine water samplewas isolated by serial dilution technique. The dominantbacterial strains are identified as Enterococcus sp. on themorphological and biochemical the characteristicdescribing the organism found to be Enterococcus sp.wasdetermined using Bergey’s manual of determinativebacteriology (Holt et al. 1994)
3.2 Optimization by response surface methodology
The experimental conducted in the present studywere targeted toward the construction of a quadratic modelconsisting of forty six trials. The design matrix and thecorresponding results of RSM experiments to determinethe effects of five independent variables peptone (g/L) (0.1,0.5, 0.9) (X1); yeast extract (g/L) (0.15, 0.3, 0.45) (X2),NaCl (g/L) (0.1, 0.5, 0.9) (X3), pH (6.3, 7.05, 7.8) (X4)and Temperature (25, 30, 350C) (X5), are shown, alongwith the mean predicted values. The fisher F-test with avery low probability value (P model > F= 0.0001)demonstrate a very high significance for the regressionmodel.
The goodness of fit of the model was checked bythe determination coefficient (R2). The ANOVA analysisof the optimization study indicated that the model terms,linear PX1 < 0.0001, PX2 < 0.0001, PX3 < 0.0001, PX4 <0.0001, PX5 0.0074; quadratic PX11 < 0.0001, PX22 <0.0001, PX33 0.0051, PX44 < 0.0001, PX55 < 0.0001 and6 interaction PX1X2 0.058,, PX1X5 < 0.0001, PX2X50.008, PX3X4 < 0.0001, PX3X5 0.3852, PX4X5 0.002 c
Kannan et al. / J. Environ. Nanotechnol., Vol. 2(1), 20-27, (2013) 22
5445533543345225
4224322351154114
311321122
5552
444
3333
2222
211155
443322110
XXbXXbXXbXXbXXbXXbXXbXXb
XXbXXbXbXb
XbXbXbXb
XbXbXbXbbY
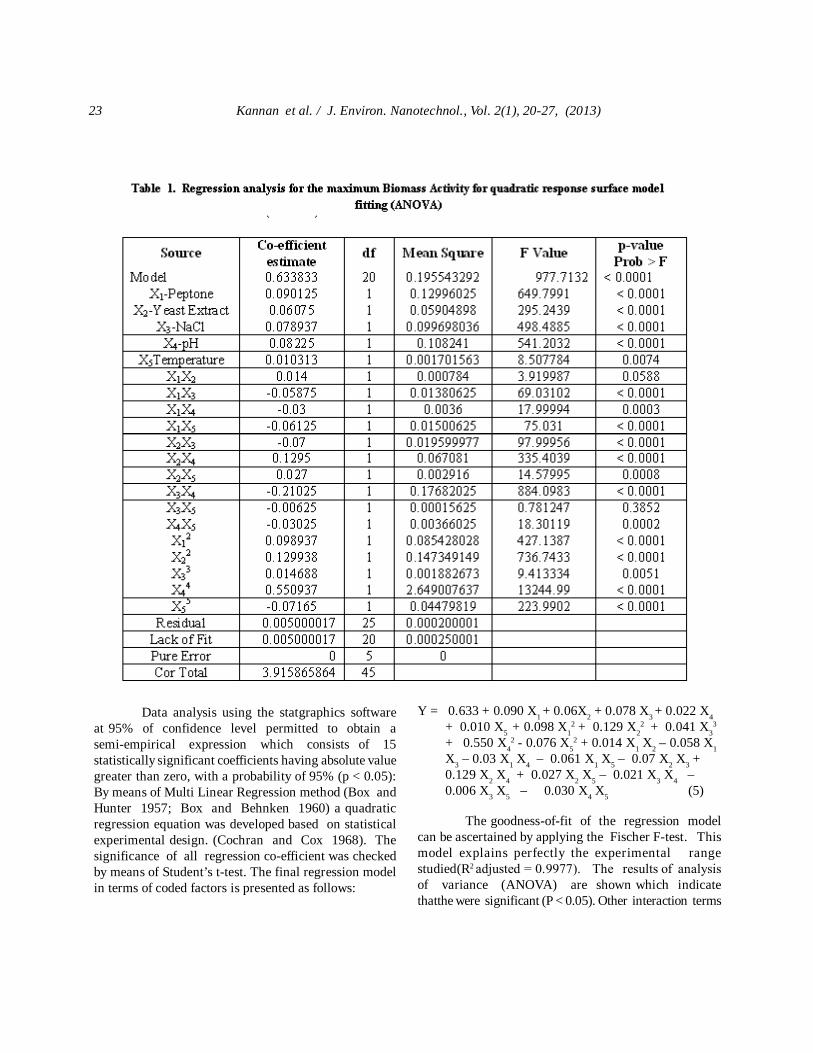
Data analysis using the statgraphics softwareat 95% of confidence level permitted to obtain asemi-empirical expression which consists of 15statistically significant coefficients having absolute valuegreater than zero, with a probability of 95% (p < 0.05):By means of Multi Linear Regression method (Box andHunter 1957; Box and Behnken 1960) a quadraticregression equation was developed based on statisticalexperimental design. (Cochran and Cox 1968). Thesignificance of all regression co-efficient was checkedby means of Student’s t-test. The final regression modelin terms of coded factors is presented as follows:
The goodness-of-fit of the regression modelcan be ascertained by applying the Fischer F-test. Thismodel explains perfectly the experimental rangestudied(R2 adjusted = 0.9977). The results of analysisof variance (ANOVA) are shown which indicatethatthe were significant (P < 0.05). Other interaction terms
Y = 0.633 + 0.090 X1 + 0.06X2 + 0.078 X3 + 0.022 X4+ 0.010 X5 + 0.098 X1
2 + 0.129 X22 + 0.041 X3
3
+ 0.550 X42 - 0.076 X5
2 + 0.014 X1 X2 – 0.058 X1X3 – 0.03 X1 X4 – 0.061 X1 X5 – 0.07 X2 X3 +0.129 X2 X4 + 0.027 X2 X5 – 0.021 X3 X4 –0.006 X3 X5 – 0.030 X4 X5 (5)
23 Kannan et al. / J. Environ. Nanotechnol., Vol. 2(1), 20-27, (2013)
were negleted.predictability of the model is at 95% and99% confidence interval. The regression equation obtainedfrom the ANOVA showed that the R2 (multiplecorrelation co-efficient) was 0. 9987 (a value > 0.61%indicated fitness of the model). This is an estimate of thefraction of overall variation in the data accounted by themodel, and thus the model is capable of explaining 99.96%of the variation in response. The adjusted R2 is 0. 9977and the predicated R2 is 0. 9987, which indicates that themodel is good (the range of the R2 values 0-1.0 and nearerto 1.0 the value is the more fit the model). The adequateprecision value of the present model was 71.51.
3.3 Response surface (contour) plots and optimizationconditions
After performing a screening of factors and theirinteractions, the response surface analysis was carried out,in order to find the optimal conditions for the maximumbiomass activity. Response surface plots provide a methodto predict the nitrogen, salt, pH and Temperature variablesnecessary to achieve a complete disappearance maximumbiomass activity for different values of the test variables.In addition, the contours of the plots help in identificationof the type of interactions between the selected variables.Each contour curve represents an infinite number ofcombinations of the two selected variables with the othermaintained at their respective zero coded level. A circularcontour of response surfaces indicates that the interactionbetween the corresponding variables is negligible. Anelliptical or saddle nature of the contour plots indicatesthat the interaction between the corresponding variables issignificant.
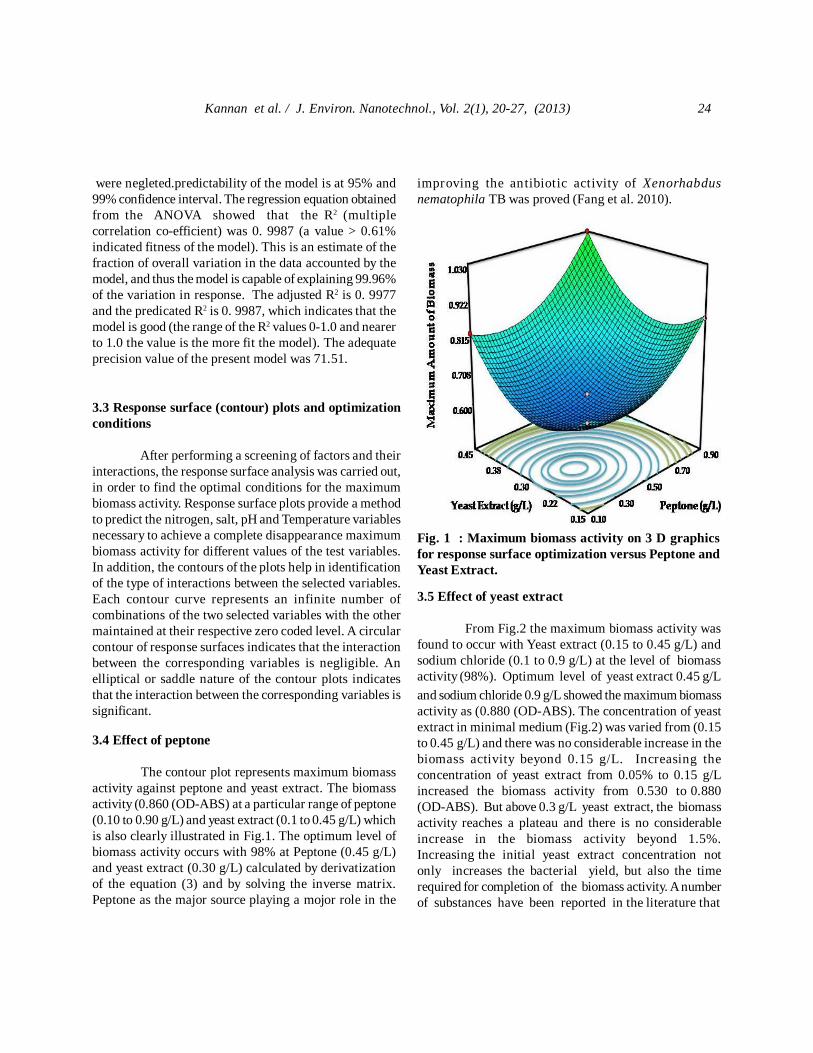
3.4 Effect of peptone
The contour plot represents maximum biomassactivity against peptone and yeast extract. The biomassactivity (0.860 (OD-ABS) at a particular range of peptone(0.10 to 0.90 g/L) and yeast extract (0.1 to 0.45 g/L) whichis also clearly illustrated in Fig.1. The optimum level ofbiomass activity occurs with 98% at Peptone (0.45 g/L)and yeast extract (0.30 g/L) calculated by derivatizationof the equation (3) and by solving the inverse matrix.Peptone as the major source playing a mojor role in the
improving the antibiotic activity of Xenorhabdusnematophila TB was proved (Fang et al. 2010).
Fig. 1 : Maximum biomass activity on 3 D graphicsfor response surface optimization versus Peptone andYeast Extract.
3.5 Effect of yeast extract
From Fig.2 the maximum biomass activity wasfound to occur with Yeast extract (0.15 to 0.45 g/L) andsodium chloride (0.1 to 0.9 g/L) at the level of biomassactivity (98%). Optimum level of yeast extract 0.45 g/Land sodium chloride 0.9 g/L showed the maximum biomassactivity as (0.880 (OD-ABS). The concentration of yeastextract in minimal medium (Fig.2) was varied from (0.15to 0.45 g/L) and there was no considerable increase in thebiomass activity beyond 0.15 g/L. Increasing theconcentration of yeast extract from 0.05% to 0.15 g/Lincreased the biomass activity from 0.530 to 0.880(OD-ABS). But above 0.3 g/L yeast extract, the biomassactivity reaches a plateau and there is no considerableincrease in the biomass activity beyond 1.5%.Increasing the initial yeast extract concentration notonly increases the bacterial yield, but also the timerequired for completion of the biomass activity. A numberof substances have been reported in the literature that
Kannan et al. / J. Environ. Nanotechnol., Vol. 2(1), 20-27, (2013) 24
enhances the growth ofenhances the growth of Geotrichumcandidum and likely constituents of nitrogen sources(Gopinath et al. 2003).
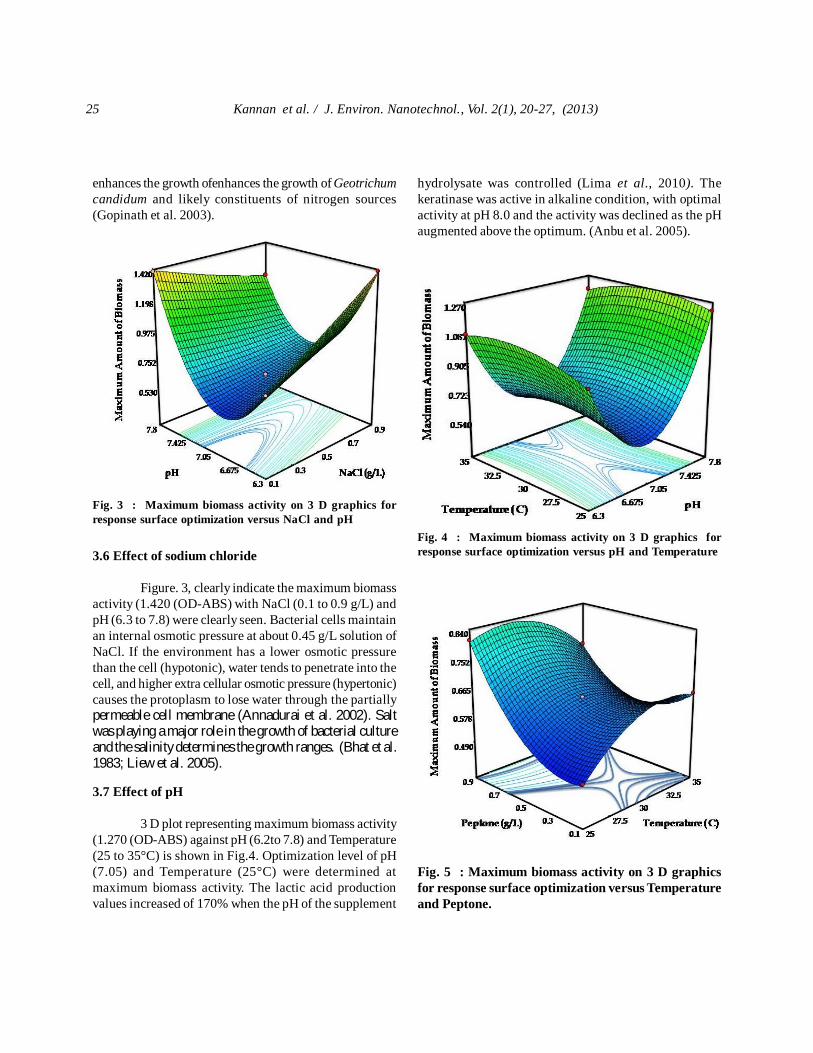
3.6 Effect of sodium chloride
Figure. 3, clearly indicate the maximum biomassactivity (1.420 (OD-ABS) with NaCl (0.1 to 0.9 g/L) andpH (6.3 to 7.8) were clearly seen. Bacterial cells maintainan internal osmotic pressure at about 0.45 g/L solution ofNaCl. If the environment has a lower osmotic pressurethan the cell (hypotonic), water tends to penetrate into thecell, and higher extra cellular osmotic pressure (hypertonic)causes the protoplasm to lose water through the partiallypermeable cell membrane (Annadurai et al. 2002). Saltwas playing a major role in the growth of bacterial cultureand the salinity determines the growth ranges. (Bhat et al.1983; Liew et al. 2005).
Fig. 3 : Maximum biomass activity on 3 D graphics forresponse surface optimization versus NaCl and pH
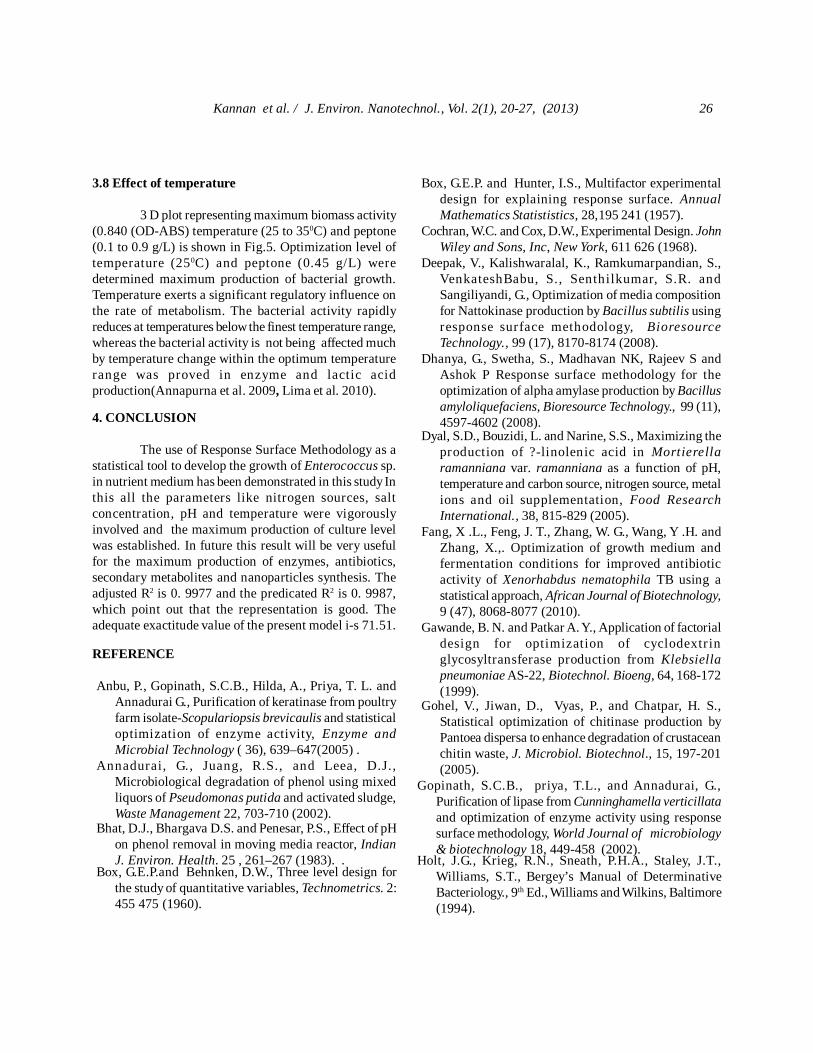
3.7 Effect of pH
3 D plot representing maximum biomass activity(1.270 (OD-ABS) against pH (6.2to 7.8) and Temperature(25 to 35°C) is shown in Fig.4. Optimization level of pH(7.05) and Temperature (25°C) were determined atmaximum biomass activity. The lactic acid productionvalues increased of 170% when the pH of the supplement
hydrolysate was controlled (Lima et al., 2010). Thekeratinase was active in alkaline condition, with optimalactivity at pH 8.0 and the activity was declined as the pHaugmented above the optimum. (Anbu et al. 2005).
Fig. 4 : Maximum biomass activity on 3 D graphics forresponse surface optimization versus pH and Temperature
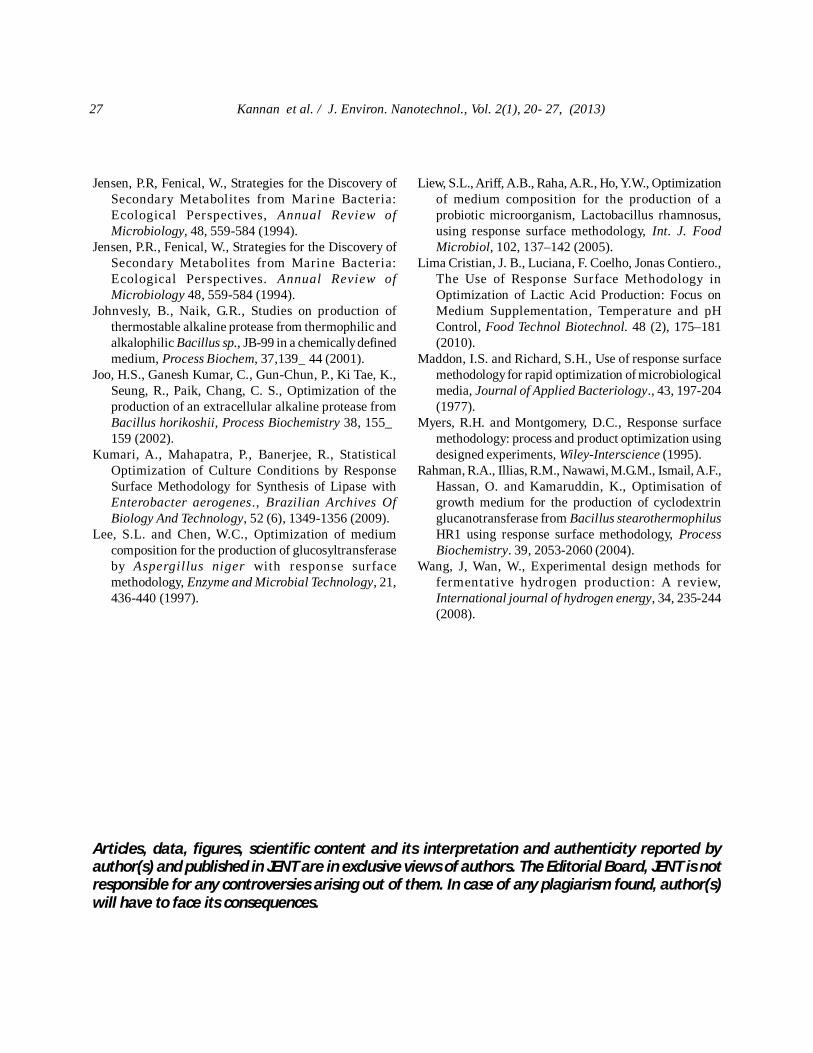
Fig. 5 : Maximum biomass activity on 3 D graphicsfor response surface optimization versus Temperatureand Peptone.
25 Kannan et al. / J. Environ. Nanotechnol., Vol. 2(1), 20-27, (2013)
3.8 Effect of temperature
3 D plot representing maximum biomass activity(0.840 (OD-ABS) temperature (25 to 350C) and peptone(0.1 to 0.9 g/L) is shown in Fig.5. Optimization level oftemperature (250C) and peptone (0.45 g/L) weredetermined maximum production of bacterial growth.Temperature exerts a significant regulatory influence onthe rate of metabolism. The bacterial activity rapidlyreduces at temperatures below the finest temperature range,whereas the bacterial activity is not being affected muchby temperature change within the optimum temperaturerange was proved in enzyme and lactic acidproduction(Annapurna et al. 2009, Lima et al. 2010).
4. CONCLUSION
The use of Response Surface Methodology as astatistical tool to develop the growth of Enterococcus sp.in nutrient medium has been demonstrated in this study Inthis all the parameters like nitrogen sources, saltconcentration, pH and temperature were vigorouslyinvolved and the maximum production of culture levelwas established. In future this result will be very usefulfor the maximum production of enzymes, antibiotics,secondary metabolites and nanoparticles synthesis. Theadjusted R2 is 0. 9977 and the predicated R2 is 0. 9987,which point out that the representation is good. Theadequate exactitude value of the present model i-s 71.51.
REFERENCE
Anbu, P., Gopinath, S.C.B., Hilda, A., Priya, T. L. andAnnadurai G., Purification of keratinase from poultryfarm isolate-Scopulariopsis brevicaulis and statisticaloptimization of enzyme activity, Enzyme andMicrobial Technology ( 36), 639–647(2005) .
Annadurai, G., Juang, R.S., and Leea, D.J.,Microbiological degradation of phenol using mixedliquors of Pseudomonas putida and activated sludge,Waste Management 22, 703-710 (2002).
Bhat, D.J., Bhargava D.S. and Penesar, P.S., Effect of pHon phenol removal in moving media reactor, IndianJ. Environ. Health. 25 , 261–267 (1983). .
Box, G.E.P.and Behnken, D.W., Three level design forthe study of quantitative variables, Technometrics. 2:455 475 (1960).
Box, G.E.P. and Hunter, I.S., Multifactor experimentaldesign for explaining response surface. AnnualMathematics Statististics, 28,195 241 (1957).
Cochran, W.C. and Cox, D.W., Experimental Design. JohnWiley and Sons, Inc, New York, 611 626 (1968).
Deepak, V., Kalishwaralal, K., Ramkumarpandian, S.,VenkateshBabu, S., Senthilkumar, S.R. andSangiliyandi, G., Optimization of media compositionfor Nattokinase production by Bacillus subtilis usingresponse surface methodology, BioresourceTechnology., 99 (17), 8170-8174 (2008).
Dhanya, G., Swetha, S., Madhavan NK, Rajeev S andAshok P Response surface methodology for theoptimization of alpha amylase production by Bacillusamyloliquefaciens, Bioresource Technology., 99 (11),4597-4602 (2008).
Dyal, S.D., Bouzidi, L. and Narine, S.S., Maximizing theproduction of ?-linolenic acid in Mortierellaramanniana var. ramanniana as a function of pH,temperature and carbon source, nitrogen source, metalions and oil supplementation, Food ResearchInternational., 38, 815-829 (2005).
Fang, X .L., Feng, J. T., Zhang, W. G., Wang, Y .H. andZhang, X.,. Optimization of growth medium andfermentation conditions for improved antibioticactivity of Xenorhabdus nematophila TB using astatistical approach, African Journal of Biotechnology,9 (47), 8068-8077 (2010).
Gawande, B. N. and Patkar A. Y., Application of factorialdesign for optimization of cyclodextr inglycosyltransferase production from Klebsiellapneumoniae AS-22, Biotechnol. Bioeng, 64, 168-172(1999).
Gohel, V., Jiwan, D., Vyas, P., and Chatpar, H. S.,Statistical optimization of chitinase production byPantoea dispersa to enhance degradation of crustaceanchitin waste, J. Microbiol. Biotechnol., 15, 197-201(2005).
Gopinath, S.C.B., priya, T.L., and Annadurai, G.,Purification of lipase from Cunninghamella verticillataand optimization of enzyme activity using responsesurface methodology, World Journal of microbiology& biotechnology 18, 449-458 (2002).
Holt, J.G., Krieg, R.N., Sneath, P.H.A., Staley, J.T.,Williams, S.T., Bergey’s Manual of DeterminativeBacteriology., 9th Ed., Williams and Wilkins, Baltimore(1994).
Kannan et al. / J. Environ. Nanotechnol., Vol. 2(1), 20-27, (2013) 26
Jensen, P.R, Fenical, W., Strategies for the Discovery ofSecondary Metabolites from Marine Bacteria:Ecological Perspectives, Annual Review ofMicrobiology, 48, 559-584 (1994).
Jensen, P.R., Fenical, W., Strategies for the Discovery ofSecondary Metabolites from Marine Bacteria:Ecological Perspectives. Annual Review ofMicrobiology 48, 559-584 (1994).
Johnvesly, B., Naik, G.R., Studies on production ofthermostable alkaline protease from thermophilic andalkalophilic Bacillus sp., JB-99 in a chemically definedmedium, Process Biochem, 37,139_/44 (2001).
Joo, H.S., Ganesh Kumar, C., Gun-Chun, P., Ki Tae, K.,Seung, R., Paik, Chang, C. S., Optimization of theproduction of an extracellular alkaline protease fromBacillus horikoshii, Process Biochemistry 38, 155_-159 (2002).
Kumari, A., Mahapatra, P., Banerjee, R., StatisticalOptimization of Culture Conditions by ResponseSurface Methodology for Synthesis of Lipase withEnterobacter aerogenes., Brazilian Archives OfBiology And Technology, 52 (6), 1349-1356 (2009).
Lee, S.L. and Chen, W.C., Optimization of mediumcomposition for the production of glucosyltransferaseby Aspergillus niger with response surfacemethodology, Enzyme and Microbial Technology, 21,436-440 (1997).
Liew, S.L., Ariff, A.B., Raha, A.R., Ho, Y.W., Optimizationof medium composition for the production of aprobiotic microorganism, Lactobacillus rhamnosus,using response surface methodology, Int. J. FoodMicrobiol, 102, 137–142 (2005).
Lima Cristian, J. B., Luciana, F. Coelho, Jonas Contiero.,The Use of Response Surface Methodology inOptimization of Lactic Acid Production: Focus onMedium Supplementation, Temperature and pHControl, Food Technol Biotechnol. 48 (2), 175–181(2010).
Maddon, I.S. and Richard, S.H., Use of response surfacemethodology for rapid optimization of microbiologicalmedia, Journal of Applied Bacteriology., 43, 197-204(1977).
Myers, R.H. and Montgomery, D.C., Response surfacemethodology: process and product optimization usingdesigned experiments, Wiley-Interscience (1995).
Rahman, R.A., Illias, R.M., Nawawi, M.G.M., Ismail, A.F.,Hassan, O. and Kamaruddin, K., Optimisation ofgrowth medium for the production of cyclodextringlucanotransferase from Bacillus stearothermophilusHR1 using response surface methodology, ProcessBiochemistry. 39, 2053-2060 (2004).
Wang, J, Wan, W., Experimental design methods forfermentative hydrogen production: A review,International journal of hydrogen energy, 34, 235-244(2008).
27 Kannan et al. / J. Environ. Nanotechnol., Vol. 2(1), 20- 27, (2013)
Articles, data, figures, scientific content and its interpretation and authenticity reported byauthor(s) and published in JENT are in exclusive views of authors. The Editorial Board, JENT is notresponsible for any controversies arising out of them. In case of any plagiarism found, author(s)will have to face its consequences.