Photoheterotrophy by aerobic anoxygenic bacteria ... - Nature
9
ARTICLE OPEN Photoheterotrophy by aerobic anoxygenic bacteria modulates carbon fluxes in a freshwater lake Kasia Piwosz 1,2 ✉ , Cristian Villena-Alemany 1,3 and Izabela Mujakić 1,3 © The Author(s) 2021 Lakes are a significant component of the global carbon cycle. Respiration exceeds net primary production in most freshwater lakes, making them a source of CO 2 to the atmosphere. Driven by heterotrophic microorganisms, respiration is assumed to be unaffected by light, thus it is measured in the dark. However, photoheterotrophs, such as aerobic anoxygenic photoheterotrophic (AAP) bacteria that produce ATP via photochemical reactions, substantially reduce respiration in the light. They are an abundant and active component of bacterioplankton, but their photoheterotrophic contribution to microbial community metabolism remains unquantified. We showed that the community respiration rate in a freshwater lake was reduced by 15.2% (95% confidence interval (CI): 6.6–23.8%) in infrared light that is usable by AAP bacteria but not by primary producers. Moreover, significantly higher assimilation rates of glucose (18.1%; 7.8–28.4%), pyruvate (9.5%; 4.2–14.8%), and leucine (5.9%; 0.1–11.6%) were measured in infrared light. At the ecosystem scale, the amount of CO 2 from respiration unbalanced by net primary production was by 3.69 × 10 9 g CO 2 lower over these two sampling seasons when measured in the infrared light. Our results demonstrate that dark measurements of microbial activity significantly bias the carbon fluxes, providing a new paradigm for their quantification in aquatic environments. The ISME Journal (2022) 16:1046–1054; https://doi.org/10.1038/s41396-021-01142-2 INTRODUCTION Alleviating consequences of the climate change requires a profound understanding of the global carbon cycle. Lakes are an important component of the carbon cycle: their annual burial of organic carbon in sediments exceeds that of oceans [1], but they are still a net source of CO 2 to the atmosphere at a rate of about 0.9 Pg C y -1 (range 0.7–1.3 Pg C y -1 )[2]. Almost 70% of this surplus CO 2 production is driven by microbial heterotrophic respiration [3]. Microbial respiration in lakes is predicted to increase as climate change progresses, which may slow down the rate of carbon sequestration [1]. Therefore, an accurate estimate of microbial respiration is crucial for precise global carbon fluxes assessments. Microbial respiration is typically considered to be independent of light [4]. This assumption has been challenged by the discovery that photoheterotrophic bacteria, such as rhodopsin-containing bacteria and aerobic anoxygenic phototrophic (AAP) bacteria, are abundant in aquatic environments [5, 6]. AAP bacteria use bacteriochlorophyll (BChl)-containing reaction centers to harvest energy from light but cover most of their energy requirements through respiration. Both processes compete for quinone pool on the same membrane. In consequence, respiration gets reduced with the increasing light intensity [7]. Moreover, photochemical ATP production enhances the anabolism, resulting in more efficient incorporation of organic matter and increased bacterial growth efficiency [8, 9]. AAP bacteria comprise up to 30% of total bacteria in the epilimnion during spring and summer [10, 11]. They are on average larger and more active than heterotrophic bacteria [12], exhibit fast growth rates and high susceptibility to grazing, substantially contributing to aquatic food webs and bacterial production [10]. Cultured AAP species exposed to light decrease their respiration by 75% and increase biomass yield by 50% [7, 8]. Light exposure also raises the proportion of active AAP bacteria in freshwater lakes [12]. However, the benefits of light-harvesting by photoheterotrophic bacteria in situ, especially of highly active AAP bacteria, remain unquantified. Measurements of microbial respira- tion in light are hampered by the oxygen production by photoautotrophic phytoplankton, the inhibitory effect of UV radiation, and the photooxidation of organic matter [13, 14]. Consequently, the rates are typically measured in the dark [15], which biases such estimates in times of an elevated abundance of photoheterotrophs. This study aimed to quantify the contribution of photoheter- otrophic metabolism by AAP bacteria to the carbon fluxes in a freshwater lake. Their BChl-containing reaction centers have an absorption maximum at ~870 nm, which allowed us to use infrared light in the experimental incubations. Phytoplankton and all other microorganisms perceived such conditions as lightless, allowing direct comparison of rates from the IR and conventional dark measurements. We hypothesized that the respiration rate would be lower, while assimilation rates of organic compounds w- Received: 29 April 2021 Revised: 11 October 2021 Accepted: 12 October 2021 Published online: 20 November 2021 1 Centre Algatech, Institute of Microbiology, Czech Academy of Sciences, 37981 Třeboň, Czechia. 2 National Marine Fisheries Research Institute, 81-332 Gdynia, Poland. 3 Faculty of Science, University of South Bohemia, 370 05 České Budějovice, Czechia. ✉ email: [email protected] www.nature.com/ismej 1234567890();,:
-
Upload
khangminh22 -
Category
Documents
-
view
3 -
download
0
Transcript of Photoheterotrophy by aerobic anoxygenic bacteria ... - Nature

ARTICLE OPEN
Photoheterotrophy by aerobic anoxygenic bacteria modulatescarbon fluxes in a freshwater lakeKasia Piwosz 1,2✉, Cristian Villena-Alemany 1,3 and Izabela Mujakić 1,3
© The Author(s) 2021
Lakes are a significant component of the global carbon cycle. Respiration exceeds net primary production in most freshwater lakes,making them a source of CO2 to the atmosphere. Driven by heterotrophic microorganisms, respiration is assumed to be unaffectedby light, thus it is measured in the dark. However, photoheterotrophs, such as aerobic anoxygenic photoheterotrophic (AAP)bacteria that produce ATP via photochemical reactions, substantially reduce respiration in the light. They are an abundant andactive component of bacterioplankton, but their photoheterotrophic contribution to microbial community metabolism remainsunquantified. We showed that the community respiration rate in a freshwater lake was reduced by 15.2% (95% confidence interval(CI): 6.6–23.8%) in infrared light that is usable by AAP bacteria but not by primary producers. Moreover, significantly higherassimilation rates of glucose (18.1%; 7.8–28.4%), pyruvate (9.5%; 4.2–14.8%), and leucine (5.9%; 0.1–11.6%) were measured ininfrared light. At the ecosystem scale, the amount of CO2 from respiration unbalanced by net primary production was by 3.69 × 10⁹
g CO2 lower over these two sampling seasons when measured in the infrared light. Our results demonstrate that darkmeasurements of microbial activity significantly bias the carbon fluxes, providing a new paradigm for their quantification in aquaticenvironments.
The ISME Journal (2022) 16:1046–1054; https://doi.org/10.1038/s41396-021-01142-2
INTRODUCTIONAlleviating consequences of the climate change requires aprofound understanding of the global carbon cycle. Lakes arean important component of the carbon cycle: their annual burialof organic carbon in sediments exceeds that of oceans [1], butthey are still a net source of CO2 to the atmosphere at a rate ofabout 0.9 Pg C y−1 (range 0.7–1.3 Pg C y−1) [2]. Almost 70% of thissurplus CO2 production is driven by microbial heterotrophicrespiration [3]. Microbial respiration in lakes is predicted toincrease as climate change progresses, which may slow down therate of carbon sequestration [1]. Therefore, an accurate estimate ofmicrobial respiration is crucial for precise global carbon fluxesassessments.Microbial respiration is typically considered to be independent
of light [4]. This assumption has been challenged by the discoverythat photoheterotrophic bacteria, such as rhodopsin-containingbacteria and aerobic anoxygenic phototrophic (AAP) bacteria, areabundant in aquatic environments [5, 6]. AAP bacteria usebacteriochlorophyll (BChl)-containing reaction centers to harvestenergy from light but cover most of their energy requirementsthrough respiration. Both processes compete for quinone pool onthe same membrane. In consequence, respiration gets reducedwith the increasing light intensity [7]. Moreover, photochemicalATP production enhances the anabolism, resulting in moreefficient incorporation of organic matter and increased bacterialgrowth efficiency [8, 9].
AAP bacteria comprise up to 30% of total bacteria in theepilimnion during spring and summer [10, 11]. They are onaverage larger and more active than heterotrophic bacteria [12],exhibit fast growth rates and high susceptibility to grazing,substantially contributing to aquatic food webs and bacterialproduction [10]. Cultured AAP species exposed to light decreasetheir respiration by 75% and increase biomass yield by 50% [7, 8].Light exposure also raises the proportion of active AAP bacteria infreshwater lakes [12]. However, the benefits of light-harvesting byphotoheterotrophic bacteria in situ, especially of highly active AAPbacteria, remain unquantified. Measurements of microbial respira-tion in light are hampered by the oxygen production byphotoautotrophic phytoplankton, the inhibitory effect of UVradiation, and the photooxidation of organic matter [13, 14].Consequently, the rates are typically measured in the dark [15],which biases such estimates in times of an elevated abundance ofphotoheterotrophs.This study aimed to quantify the contribution of photoheter-
otrophic metabolism by AAP bacteria to the carbon fluxes in afreshwater lake. Their BChl-containing reaction centers have anabsorption maximum at ~870 nm, which allowed us to useinfrared light in the experimental incubations. Phytoplankton andall other microorganisms perceived such conditions as lightless,allowing direct comparison of rates from the IR and conventionaldark measurements. We hypothesized that the respiration ratewould be lower, while assimilation rates of organic compounds
w-
Received: 29 April 2021 Revised: 11 October 2021 Accepted: 12 October 2021Published online: 20 November 2021
1Centre Algatech, Institute of Microbiology, Czech Academy of Sciences, 37981 Třeboň, Czechia. 2National Marine Fisheries Research Institute, 81-332 Gdynia, Poland. 3Faculty ofScience, University of South Bohemia, 370 05 České Budějovice, Czechia. ✉email: [email protected]
www.nature.com/ismej
1234567890();,:
ould be higher in the IR light compared to the dark. Moreover, weexpected that the effect would vary seasonally with changingenvironmental conditions and the community composition of allbacteria and of AAP bacteria. We demonstrated that darkmeasurements of microbial activity significantly bias the estimatesof the carbon fluxes in the studied lake, providing a new paradigmfor its quantification in aquatic environments.
MATERIALS AND METHODSamplingWater was sampled from Cep lake in Czechia, at a regularsampling site of 10m depth (48.944 °N, 14.877 °E). The lakeoriginates from sand mining in the 1970–80s. It is a permanentmeso-oligotrophic (chlorophyll-a concentrations ranged from1.4–16.4 µg L−1) seepage reservoir filled with groundwater pene-trating from the nearby river Lužnice. The lake area is about 1.16km2, with the maximum depth about 11–12m. These character-istics are representative for most of temperate and boreal lakes[16].Samples were collected every four weeks from April till October
in 2018, and from April till November in 2019. Ten liters of waterwere collected from 0.5 m depth using a Ruttner Water Sampler(model 11.003KC Denmark AS). Temperature and oxygen profileswere taken with an EXO1 multi-parameter probe (YSI Inc., YellowSprings, USA). Water was transported to the laboratory within 2 hfrom the collection in a closed container made from high-densitypolyethylene, rinsed three times with the sampled water andstored in a cooled box.
NutrientsSamples were filtered through glass fiber filters with 0.4 µmnominal porosity (GF-5, Macherey-Nagel, Düren, Germany). Con-centrations of soluble reactive phosphorus (SRP) were determinedspectrophotometrically [17, 18]. Concentrations of nitrate andammonium were measured according to Procházková [19] andKopáčkek and Procházková [20]. Dissolved organic carbon (DOC)and dissolved nitrogen (DN) were measured with a TOC 5000 Aanalyzer (Shimadzu, Kyoto, Japan).
PigmentsSeston from 1.43 to 3.65 L of water was collected onto GF-5 glassfiber filters (diameter 47 mm, Macherey-Nagel). The filters weredried of excess water by gently pressing in a paper towel, andflush frozen in liquid nitrogen. Pigments were extracted andanalyzed by HPLC as described in Piwosz et al. [21].
Net primary production (NPP) and community respiration(oxygen measurements)Oxygen concentration was measured with the Winkler method[22]. It was chosen because it allows O2 concentration to bemeasured directly in the water without the need to considercarbonic equilibrium, which is the case when changes in CO2
concentration is measured [23]. Samples were unfiltered to avoidthe removal of particle-associated bacteria and also of free-livingAAP bacteria, which tend to be larger than average freshwaterbacteria [12]. Glass stoppered Winkler type oxygen bottles (115mLnominal capacity, VTR glass, Prague, Czechia) were filled with thesampled water directly from the sampler via a rubber tube. Eachbottle was first rinsed three times and then filled without theformation of air bubbles. Water was allowed to overflow the neckof the bottle for about 1 min, and the bottle was closed with aglass stopper to avoid air bubbles. The closed bottles were kept inthe dark in a cooled box. On the shore, three bottles were selectedas T0, and 1.2 mL of manganese (II) chloride solution (concentra-tion 3mol L−1) was addded, followed by the addition of 1.2 mL ofa mixture containing 4mol L−1 of sodium iodide solution and 8mol L−1 of sodium hydroxide solution. These samples were
processed in the laboratory within 3 h. The remaining bottleswere incubated for 24 h at in situ temperature in the IR-boxprepared from the MAKROLON IR polycarbonate sheet (4 mmthickness, Professional Plastics, Inc. Fullerton, CA, USA). Thesepanels have a maximum transmittance of 90% in the infraredregion 850–2000 nm, 50% at 780 nm, and 0% <740 nm. Darkbottles were wrapped in tinfoil to cut off all irradiance.Illumination was provided with 40W incandescent (tungstenfilament) lightbulbs delivering approx. 50 Wm−2 of IR irradiance,which according to our measurements corresponds to IRirradiation on a sunny day. Bottles for NPP were incubated inwhite light next to the IR-box. To ensure stable temperature andavoid overheating, the incubations were done in a 60 L water bathand the temperature was controlled with a CTB 06 C cryostat(LABIO a.s., Prague, Czechia).The incubations were terminated by adding manganese (II)
chloride and sodium iodide – sodium hydroxide solutions, asdescribed above for the T0 samples. The bottles were incubatedfor 1 h in a fridge (4 °C). Subsequently, 2.4 ml of 50% H2SO4 wasadded, and samples were immediately titrated with 0.01 mol L−1
Na2S2O3 solution. The precise concentration of the Na2S2O3
solution was determined each time by titrating the KIO3 standard.For the samples collected in 2018, titrations were done manually:the samples were titrated until the solution turned pale yellow.Then, 1 mL of 0.1% starch solution was added, and the titrationcontinued until full decolorization was achieved. In 2019, sampleswere titrated to a monotonic equivalence point using Metrohm877 Titrino plus equipped with a double Pt-wire coulometricelectrode (Herisau, Switzerland). Respiration rates were calculatedas a difference between oxygen concentrations at the end of theincubation and T0 samples.To calculate the balance between the NPP and respiration
measured in the dark and in the IR light, we assumed that onemole of O2 produced or consumed was equivalent to one mole ofCO2. Such assumption may not be always accurate for respirationmeasurements, but considering the high variability of a respiratoryquotient in freshwaters, we decided to adopt the most frequentchoice [3]. Values of daily NPP were calculated based on thelength of light time from sunrise to sunset on the sampling day(Equation 1 in Supplementary File S1). Values of daily darkrespiration were taken directly from the measurements, whilevalues of the daily IR-respiration were calculated as an averageweighted for the length of light time to take into account that theeffect of light was only during the light time (Equation 2 inSupplementary File S1). Rates were integrated over the duration ofthe season with water temperatures >10 °C according to ourmeasurements (180 days, Equation 3 in Supplementary File S1).Subsequently, the differences in the Cep Lake’s carbon budget forthe surface layer (down to 0.5 m depth) were calculated bymultiplying the integrated values by the volume of this layer(Equation 4 and 5 in Supplementary File S1).
HCO3− incorporation
Triplicated water samples (32 mL) were incubated for 3.2–5.2 h inthe IR light and the dark at in situ temperature, as described forrespiration. Total activity added to each bottle was measured from1mL aliquot of the incubated sample that was transferred to ascintillation vial containing 20 μl of 5 mol L−1 NaOH (to prevent aloss of 14C-bicarbonate). Thirty mL of sample was filtered through2.5 μm nitrate cellulose filters (Pragopor, Prague, Czechia, dia-meter 25 mm). Five mL of the filtered water was collected andsubsequently filtered through a 0.17 μm nitrate cellulose filter. Theresulting cell-free filtrate, which contained 14C-DOC was collected.The filtration was done at a low vacuum (0.02 MPa) to avoid cellbreakage. The total CO2 assimilation rate was calculated as thesum of all these fractions.The filters were kept in an HCl-saturated atmosphere for 24 h at
room temperature in a fume hood. They were placed in
K. Piwosz et al.
1047
The ISME Journal (2022) 16:1046 – 1054

scintillation vials and dissolved in 1 mL of ethyl acetate (Penta,Prague, Czechia). Then, 5 mL of Ultima Golt LLT scintillationcocktail (PerkinElmer, Waltham, MA, USA) was added. Five mL ofcell-free filtrates were acidified by adding 100 μL 5mol L−1 HCl tovolatilize non-incorporated H14CO3 and incubated 24 h at roomtemperature in a fume hood. Then, 10mL of the scintillationcocktail was added. Finally, 5 mL of the scintillation cocktail wasadded to the total activity samples. Subsequently, the sampleswere gently mixed and left in the dark for 48 h. The radioactivity inthe samples was measured using a Tri-Carb 2810 TR scintillationcounter (PerkinElmer).To estimate carbon fluxes (μmol C L–1 h–1), a fraction of the
added H14CO3 incorporated or released was corrected for theincubation time and multiplied by the concentration of totaldissolved inorganic carbon (DIC). The DIC concentration wascalculated based on temperature, pH, and alkalinity measure-ments (Inolab pH 720, WTW Xylem Inc. Rye Brook, NY, US)determined by Gran titration.
Assimilation of organic monomersThe difference between microbial activity in the IR light and darkwas also estimated based on assimilation rates of radiolabeledglucose, pyruvate, leucine and thymidine (American RadiolabeledChemicals, St. Louis, MO, USA). Tritiated glucose (specific activity(SA): 2220 GBq mmol−1), leucine (SA: 4440 GBq mmol−1) andthymidine (SA: 2275.5 GBq mmol−1) were added to 5mL samplesto a final concentration of 5 nmol L−1. 14C-pyruvate (SA: 2.035 GBqmmol−1) was added to a final concentration of 10 nmol L−1.Trichloroacetic acid (TCA) was added to the killed controls to afinal concentration of 1%. Samples were incubated for 1 h in thedark and IR light as described for respiration. The incubations wereterminated as the killed controls and kept at 4 °C in the dark untilprocessed within <4 h. Biomass was collected onto 0.17 μm nitratecellulose filters as described for HCO3
− incorporation. The filterswere washed twice with 2.5 mL of ice-cold 5% TCA, and then twicewith 2.5 mL of ice-cold 80% ethanol [24]. They were placed in thescintillation vials and air-dried overnight. Dried filters weredissolved in 1 mL of ethyl acetate, and 5mL of Ultima Golt LLTscintillation cocktail (PerkinElmer) was added. Samples weregently mixed and left in the dark for 48 h. The radioactivity inthe samples was measured using a Tri-Carb 2810 TR scintillationcounter (PerkinElmer).
Bacterial and AAP abundanceSamples of 50mL were fixed with buffered, sterile-filtered parafor-maldehyde (Penta, Prague, Czechia) to a final concentration of 1%,and 0.5mL was filtered onto white polycarbonate filters (pore size0.2 µm, Nucleopore, Whatman, Maidstone, UK). Cells were stainedwith 4’,6-diamidino-2-phenylindole (DAPI) at concentration of 1mgL−1 [25]. Total and AAP bacterial abundances were determined usingan epifluorescence Zeiss Axio Imager.D2 microscope equipped withCollibri LED module illumination system (Carl Zeiss, Jena, Germany).Ten microphotographs were taken for every sample under 325–370nm excitation and 420–470 nm emission wavelengths for DAPIfluorescence (total bacteria), 450–490 nm excitation and 600–660 nmemission wavelengths for autofluorescence from Chl-a (algae andcyanobacteria), and combined 325–370 nm, 450–490 nm, 545–565nm and 615–635 nm excitation and 645–850 emission wavelengthsfor autofluorescence from BChl-a (AAP bacteria). As some part of Chl-a autofluorescence is also visible in the infrared spectrum, only theIR-positive cells that did not show any autofluorescence from Chl-awere counted as AAP bacteria [26].
DNA extractionBetween 300 and 1460mL of water were filtered through sterile 2µm and 0.2 µm Nucleopore Track-Etch Membrane filter units(Whatman). The filters were put inside sterile cryogenic vials
(Biologix Group Limited, Jinan, Shandong China) containing 0.55 gof sterile zirconium beads, flash-frozen in liquid nitrogen andstored at −80 °C. Total nucleic acids were extracted within amonth following the protocol by Nercessian et al. [27]. Lysis buffer(75 µl of 10% sodium dodecyl sulfate (Tokyo Chemical IndustryCO, LTD., Tokyo, Japan), 75 µl of 10% N-Lauroylsarcosine(Sigma–Aldrich, St. Louis, USA), 750 µl of phenol-chloroform-isoamyl alcohol (25:24:1; AppliChem GmbH, Darmstadt, Germany)and 750 µl of 10% hexadecyltrimethylammonium bromide (CTAB;Sigma-Aldrich) in 1.6 M NaCl and 240mM potassium-phosphate-buffer, pH= 8) was added to the vials and they were vortexed for10min. After centrifugation for 10 min at 4 °C and 16,000 x g,supernatant was mixed carefully with the equal volume ofchloroform (PENTA s.r.o., Prague, Czechia). After the secondcentrifugation, the supernatant was mixed with two volumes of30% Poly(ethylene glycol) (PEG; Sigma–Aldrich) in 1.6 M of NaCl,and incubated for 2 h in the dark at 4 °C, followed bycentrifugation for 90 min at 4 °C and 17,000 x g. The pellet waswashed with 70% ethanol (VWR International S.A.S., Fontenay-sous-Bois, France) and centrifuged again for 1 min. Extracted DNAwas re-suspended in 35 µl of DNase and RNase-free water (MPBiomedicals, Solon, OH, USA) and stored at −20 °C. Concentrationand quality of the extracts were checked using NanoDrop (ThermoFisher Scientific).
Bacterial community compositionThe V3-V4 region of bacterial 16S rRNA gene was amplified using341F and 785R primers [28]. PCR was performed in triplicate 20 μLreactions using Phusion™ High-Fidelity DNA Polymerase (ThermoScientific, USA) with the following reaction conditions: 98 °C for 3min, 25 cycles at 98 °C for 10 s, 60 °C for 20 s, 72 °C for 20 s, and afinal extension at 72 °C for 3 min. The triplicate product reactionsfor each sample were pooled andpurified from the gel using thekit Wizard SV Gel and PCR Clean-Up System (Promega, USA), andsequenced on Illumina MiSeq (2 × 250 bp) platform of theGenomic Service of the Universitat Pompeu Fabra (Barcelona,Spain).Initial analysis, performed as described below, indicated that the
communities in both fractions were similar for each sampling day(Bray-Curits similarity >65% except for the samples from 9th Mayand 29th Aug 2018 (10% each), 1st Aug 2018 (21%), 25th Nov2018 (1%), and 14th Aug 2019 (22%), Supplementary Fig. S1A).Thus, we decided to concatenate the fastaq files and analyze bothfractions together as the total community. This also facilitatedstatistical analysis, as the activity rates were measured for thewhole community without fractionations.Reads quality was evaluated using FastQC v0.11.7 (Babraham
Bioinformatics, Cambridge, UK). After primer sequences trimmingusing Cutadapt [29] (v1.16), the number of reads per sampleranged from 49,354 to 188,942. Subsequent analyses were done inthe R/Bioconductor environment using the dada2 package(version 1.14.1) [30]. Forward and reverse reads were truncatedto 225 bp and low quality sequences were filtered out with thefilterAndTrim function (truncLen= c(225, 225), maxN= 0, maxEE= c(2, 2), truncQ= 2), which reduced the number of reads persample to range from 30,190 to 143,552. After merging andchimera removal using the removeBimeraDenovo function, 4,893amplicon sequence variants (ASV) were obtained. Rare ASVs (notseen >3 times in at least 20% of the samples) were removed,which reduced the number of ASVs to 658, and the number ofreads to 14,613–69,046 per sample. Taxonomic assignment wasdone using SILVA 138.1 database [31, 32] released on August 27,2020. ASVs identified as Chloroplast or Cyanobacteria wereexcluded from the analyses, giving the final number of 546 ASVsand from 10,819 to 54,799 reads per sample. The bacterialcommunity composition graphs were done using phyloseq [33]and ggplot2 [34] packages.
K. Piwosz et al.
1048
The ISME Journal (2022) 16:1046 – 1054

AAP community compositionThe composition of AAP community was analyzed by ampliconsequencing of pufM gene encoding the M subunit of bacterialtype-2 reaction centers. This gene is routinely used for diversitystudies of AAP bacteria [35].PufM gene amplicons (approx. 245 bp) were prepared using
pufM_UniF (5′-GGN AAY YTN TWY TAY AAY CCN TTY CA-3′) andpufM_WAW (5′-AYN GCR AAC CAC CAN GCC CA-3′) primers [36].PCR was performed in triplicate 20 μL reactions using Phusion™High-Fidelity DNA Polymerase (Thermo Scientific, USA) with thefollowing reaction conditions: 98 °C for 3 min, 27 cycles at 98 °C for10 s, 58 °C for 30 s, 72 °C for 30 s, and a final extension at 72 °C for5 min. The triplicate product reactions for each sample werepooled and gel purified using the kit Wizard SV Gel and PCR Clean-Up System (Promega, USA). The sequencing was performed on theIllumina MiSeq platform (2 × 150 bp) at Macrogen, South Korea.The fastq files were concatenated as described for bacteria
communities. The Bray-Curtis similarity between two fractions foreach sampling day was >70%, except for the samples from 1stAug 2018 (47%) and 14th Aug 2019 (18%, SupplementaryFig. S1B).The samples were analyzed as described for bacterial commu-
nities. The number of reads per sample ranged from 192,360 to239,418 after the cutadapt trimming. Forward and reverse readswere truncated to 130 bp, and the number of reads per sampleafter the quality filtering and denoising ranged from 189,432 to235,311. Merging the forward and reverse reads with mergePairsfunction created 12,692 ASVs and reduced the number of reads to183,136–221,281 per sample. The chimera removal lowered thenumber of ASVs to 1816, and the number of reads to159,451–208,679. Rare ASVs (not seen >3 times in at least 20%of the samples) were removed, which resulted in the final 566ASVs, and a number of reads ranging from 155,915 to 203,021 persample. A manually curated taxonomic database was used fortaxonomic assignment following the naïve Bayesian classifiermethod [37]. It contained 1580 unique pufM sequences, down-loaded from the Fungene repository on May 16, 2019 (http://fungene.cme.msu.edu [38]), from metagenomes from the ŘímovReservoir [39, 40] and from the Genome Taxonomy databaseaccessed on September 16, 2020 [41].
Statistical analysisLinear mixed-effects models were calculated in R (version 3.6.2)using lme function from the nlme package (version 3.1.143) onuntransformed activity data and log10 transformed environmentalvariables [42]. Models’ parameters were estimated using max-imum likelihood method and their significance was tested withANOVA. Relationships between the activity measures, theenvironmental variables and the composition of AAP communitieswere investigated with distance-based linear models (DistLM)[43, 44] in Primer (version 7.0.13) with PERMANOVA+ 1 add on (e-Primer, Plymouth, UK) [45]. The sequence reads were transformedwith the varianceStabilizingTransformation function of the DESeq2package [46] (version 1.14.1, blind= FALSE, fitType= “mean”).
Data accessibilityThe sequences of 16S and pufM amplicons that support thefindings of this study have been deposited in the EMBL databaseas the BioProject with the accession number PRJEB41596, togetherwith most of the environmental metadata. The scripts and theremaining data supporting the results are included in theSupplementary Material.
RESULTS AND DISCUSSIONMicrobial activity was the highest during spring phytoplanktonmaxima, and in summer at temperatures >20 °C (Fig. 1 andSupplementary Fig. S2). The difference between the activity rates
measured in the dark and IR light varied over the sampling periodand were the highest in April and May in both years (Fig. 1).The average respiration rate was 15.2% (95% CI: 6.6–23.8%, p
value= 0.0008) higher in the dark (average (95% CI): 0.30(0.25–0.35) μmol O2 L
−1 h−1) than in the IR light (0.27 (0.22–3.20)μmol O2 L
−1 h−1; Fig. 2A). To exclude the possibility that theobserved difference was due to oxygen production by phyto-plankton, we also measured incorporation of H14CO3
− in the darkand the IR light. The bicarbonate incorporation rates were about5-fold lower than respiration rates (Fig. 1B) and did not differsignificantly between the dark and IR light (p value= 0.5646,Fig. 2B). Thus, the lower respiration rates measured in the IR lightcan be attributed to the photoheterotrophic activity of AAPbacteria and not due to oxygen production by phytoplankton.The decrease in the respiration rate in the IR light compared to
dark was driven by production of ATP from the light energyharvested by the reaction centers, which results in a more efficientmetabolism as the organic carbon can be redirected fromcatabolism to anabolism [7]. Consequently, increased assimilationrates of sources of organic carbon should be observed in the IRlight. Such differences ought to be especially conspicuous formolecules that can be directly channeled either to anabolic orcatabolic reactions depending on the cells’ requirements for ATPproduction, e.g., glucose and pyruvate [8]. In agreement with thisprediction, the average assimilation rate of glucose was 18.1%(7.8–28.4%, p value= 0.0009) higher in the IR light (0.67(0.51–0.82) nmol C L−1 h−1) than in the dark (0.55 (0.42–0.68)nmol C L−1 h−1; Fig. 2C). The most noticeable difference wasmeasured in April 2018, when the assimilation rate in the IR lightwas 9-fold higher than in the dark (Fig. 1C). Likewise, theassimilation rate of pyruvate was enhanced by 9.5% (4.2–14.8%; pvalue= 0.0006) in the IR light, and averaged at 13.94(11.10–16.78) nmol C L−1 h−1 for the IR light, and at 12.67(10.40–14.95) nmol C L−1 h−1 for the dark measurements (Fig. 2D).We also compared assimilation rates of leucine (Fig. 1E). This
molecule is used by bacteria for protein synthesis and is routinelyapplied to measure bacterial secondary production in aquaticenvironments [24]. The average assimilation rate of leucine in theIR light (0.39 (0.23–0.55) nmol C L−1 h−1) was 5.9% (0.1–11.6%; pvalue= 0.0461) higher than in the dark (0.36 (0.20–0.51) nmol CL−1 h−1, Fig. 2E). This further supports the notion that the lowerrespiration rates in the IR light allowed for more efficientmetabolism and increased biomass production by the microbialcommunity. Finally, we also used thymidine (Fig. 1F), which isroutinely applied to measure rates of DNA synthesis and todetermine growth rates of aquatic bacteria [47]. The exposure tothe IR light did not significantly affect thymidine assimilation rates(p value= 0.5601), which were even slightly lower in the IR (0.11(0.08–0.14) nmol C L−1 h−1) than in the dark conditions (0.12(0.09–0.15) nmol C L−1 h−1, Fig. 2F). This agrees with the previousobservations that the thymidine assimilation rate is independentof irradiance in a cultured AAP species [8], and might result fromthe fact that DNA synthesis occurs in evening hours [48].The effect of the IR light on microbial activity, as compared to
dark measurements, varied seasonally (Fig. 1). Such dynamics inaquatic environments often correlate with environmental vari-ables, such as temperature [11]. Thus, we augmented the linearmixed-effects models with measured physico-chemical (tempera-ture, pH, inorganic N and P, dissolved organic carbon), andbiological (bacterial and AAP numbers, photosynthetic pigments)variables (Supplementary Fig. S2) to test their correlations with theactivity rates, and also to test whether such relationship had beenaffected by light. Respiration rates, both those measured in thedark and in the IR light, correlated positively only with BChl-aconcentrations (Fig. 3A), indicating overall high contribution ofBChl-a containing AAP bacteria to the total community respira-tion, a phenomenon observed also in other lakes [11, 12]. Theslope of this relationships was similar for the dark and the IR rates,
K. Piwosz et al.
1049
The ISME Journal (2022) 16:1046 – 1054

likely reflecting the fact that the rate of ATP production byphotophosphorylation depends, among others, on the number ofBChl-a containing reaction centers that generate electrons flow[8]. AAP species differ with regard to the number of BChl-amolecules in reaction centers [49], which may explain the lack ofsignificant correlation between the concentrations of BChl-a andthe absolute abundances of AAP bacteria (Pearson correlation test,p value= 0.05902, R2= 0.4665878, t= 2.0431), and the concentra-tions of BChl-a and the relative abundances of AAP bacteria (pvalue= 0.07377, R2= 0.4445804, t= 1.9223). Therefore, the lack ofdirect relationship between the respiration rates and AAP bacteriaabundance does not contradict our conclusion on their impor-tance in total microbial respiration.Assimilation rate of glucose negatively correlated with concen-
trations of ammonia, however, the correlation was stronger for therates measured in IR light than those measured in the dark(Fig. 3B). This indicates that although such relationship was
important for both heterotrophic and photoheterotrophic bacteriaassimilating glucose, it affected AAP bacteria more strongly. Inagreement with this interpretation, glucose assimilation ratesmeasured in the IR light (but not in the dark) correlated positivelywith the relative abundance of AAP bacteria (Fig. 3C). Similarly, thecorrelations between the relative AAP abundance and assimilationrates of pyruvate (Fig. 3D) differed for dark and IR lightmeasurements. The significantly steeper slopes of these correla-tions for the rates measured in IR light indicate not only the overallhigh importance of AAP bacteria for assimilation of glucose andpyruvate, but also that their contribution was additionallyenhanced in the light. This supports attributing the observeddifferences between the dark and the IR rates of microbialactivities to photoheterotrophic metabolism by AAP bacteria.Interestingly, while catabolic processes correlated with BChl-a
concentration, anabolic were related with relative abundance ofAAP bacteria. The former relationship can result from direct
Fig. 1 Microbial activity in the surface layer of Lake Cep measured in the dark (dark gray) and the IR light (dark red). A respiration rate; (B)incorporation rate of H14CO3
−; (C) assimilation rate of glucose; (D) assimilation rate of pyruvate; (E) assimilation rate of leucine; (F) assimilationrate of thymidine. Bar plots show mean values of triplicate measurements; error bars indicate 95% confidence intervals. Scales on Y axes differbetween the panels except for panels (A) and (B).
K. Piwosz et al.
1050
The ISME Journal (2022) 16:1046 – 1054
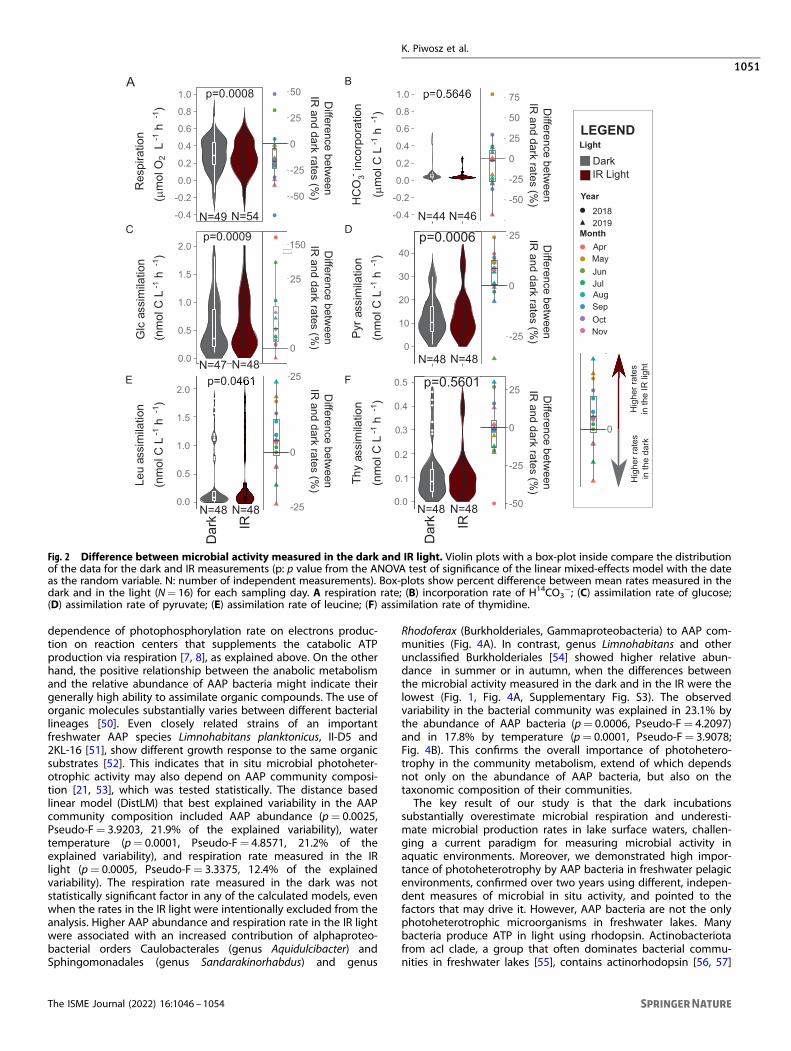
dependence of photophosphorylation rate on electrons produc-tion on reaction centers that supplements the catabolic ATPproduction via respiration [7, 8], as explained above. On the otherhand, the positive relationship between the anabolic metabolismand the relative abundance of AAP bacteria might indicate theirgenerally high ability to assimilate organic compounds. The use oforganic molecules substantially varies between different bacteriallineages [50]. Even closely related strains of an importantfreshwater AAP species Limnohabitans planktonicus, II-D5 and2KL-16 [51], show different growth response to the same organicsubstrates [52]. This indicates that in situ microbial photoheter-otrophic activity may also depend on AAP community composi-tion [21, 53], which was tested statistically. The distance basedlinear model (DistLM) that best explained variability in the AAPcommunity composition included AAP abundance (p= 0.0025,Pseudo-F= 3.9203, 21.9% of the explained variability), watertemperature (p= 0.0001, Pseudo-F= 4.8571, 21.2% of theexplained variability), and respiration rate measured in the IRlight (p= 0.0005, Pseudo-F= 3.3375, 12.4% of the explainedvariability). The respiration rate measured in the dark was notstatistically significant factor in any of the calculated models, evenwhen the rates in the IR light were intentionally excluded from theanalysis. Higher AAP abundance and respiration rate in the IR lightwere associated with an increased contribution of alphaproteo-bacterial orders Caulobacterales (genus Aquidulcibacter) andSphingomonadales (genus Sandarakinorhabdus) and genus
Rhodoferax (Burkholderiales, Gammaproteobacteria) to AAP com-munities (Fig. 4A). In contrast, genus Limnohabitans and otherunclassified Burkholderiales [54] showed higher relative abun-dance in summer or in autumn, when the differences betweenthe microbial activity measured in the dark and in the IR were thelowest (Fig. 1, Fig. 4A, Supplementary Fig. S3). The observedvariability in the bacterial community was explained in 23.1% bythe abundance of AAP bacteria (p= 0.0006, Pseudo-F= 4.2097)and in 17.8% by temperature (p= 0.0001, Pseudo-F= 3.9078;Fig. 4B). This confirms the overall importance of photohetero-trophy in the community metabolism, extend of which dependsnot only on the abundance of AAP bacteria, but also on thetaxonomic composition of their communities.The key result of our study is that the dark incubations
substantially overestimate microbial respiration and underesti-mate microbial production rates in lake surface waters, challen-ging a current paradigm for measuring microbial activity inaquatic environments. Moreover, we demonstrated high impor-tance of photoheterotrophy by AAP bacteria in freshwater pelagicenvironments, confirmed over two years using different, indepen-dent measures of microbial in situ activity, and pointed to thefactors that may drive it. However, AAP bacteria are not the onlyphotoheterotrophic microorganisms in freshwater lakes. Manybacteria produce ATP in light using rhodopsin. Actinobacteriotafrom acI clade, a group that often dominates bacterial commu-nities in freshwater lakes [55], contains actinorhodopsin [56, 57]
Fig. 2 Difference between microbial activity measured in the dark and IR light. Violin plots with a box-plot inside compare the distributionof the data for the dark and IR measurements (p: p value from the ANOVA test of significance of the linear mixed-effects model with the dateas the random variable. N: number of independent measurements). Box-plots show percent difference between mean rates measured in thedark and in the light (N= 16) for each sampling day. A respiration rate; (B) incorporation rate of H14CO3
−; (C) assimilation rate of glucose;(D) assimilation rate of pyruvate; (E) assimilation rate of leucine; (F) assimilation rate of thymidine.
K. Piwosz et al.
1051
The ISME Journal (2022) 16:1046 – 1054

that have ion-pumping activity in green light and are highlyexpressed in situ [58]. The net energy gain from rhodopsin-basedphototrophy is lower than from bacteriochlorophyll-based photo-systems of the AAP bacteria [59]. Nevertheless, their contributionto the lake photoheterotrophy might have been substantial, asActinobacteriota were a dominant group of bacteria in bothsampling season (Supplementary Fig. S4A). Unfortunately, acti-norhodopsins absorb green light that is also used by oxygenicphotoautotrophs. Thus, their photoheterotrophic activity cannotbe as easily measured by applying a specific light wavelength as inthe case of AAP bacteria. In our previous experiment, we used (3-(3,4-dichlorophenyl)−1,1-dimethylurea) to block photosystem II inoxygenic phototrophs without affecting bacteria [21]. However, astrong inhibition of the dark bacterial respiration was observed inthis treatment, indicating some detrimental effect on bacterialactivity and hampering the use of such approach to environ-mental studies. Picocyanobacteria are another group of micro-organisms that assimilate amino acids in the dark, as observed formarine Prochlorococcus [60]. This does not seem to be the case for
picocyanobacteria in lakes [50], whose communities in our studywere dominated by an obligate photoautotroph Cyanobium [61].Finally, the fact that we had to use IR light to avoid confoundingeffect from oxygenic photosynthesis might have lowered photo-heterotrophy even by AAP bacteria, as they can also use light inthe visible spectrum (400–600 nm). Taken together, our results arethe lower estimates for the importance of the photoheterotrophyin freshwater lakes.Nevertheless, they alter the current understanding of carbon fluxes
at the ecosystem level. For instance, the balance between the netprimary production (NPP) and bacterial respiration (BR) determineswhether a system is heterotrophic, i.e., releases CO2 to theatmosphere (NPP < BR), or autotrophic, i.e., absorbs CO2 from theatmosphere (NPP > BR). This balance is negative for most freshwaterlakes, making them an important source of CO2 to the atmosphere atthe global scale [1]. However, as we have shown here, darkmeasurements overestimate microbial respiration, resulting in biasedcarbon budget for lakes. Calculations of the carbon fluxes for thesurface layer of the Lake Cep indicated that it is heterotrophic both in
Fig. 3 Correlations between microbial activity rates and environ-mental variables. Average and 95% confidence intervals are givenfor intercept (Int.) and slope values. Star indicates an interaction withthe light (i.e. significantly different correlation coefficients for therates measured in the dark and the IR light). Correlations between(A) concentrations of bacteriochlorophyll-a and respiration rate; (B)concentrations of ammonia and assimilation rates of glucose; andbetween relative abundance of AAP bacteria and assimilation rate ofglucose (C), pyruvate (D) and leucine (E).
Fig. 4 Relationships between bacterial and AAP communitycomposition and environmental variables. Distance-based redun-dancy analysis biplots relating the observed variability in thecomposition of communities of AAP (A) and all bacteria (B) to theexplanatory variables (black lines). The pie charts in the panel (A)show relative abundance of the top three AAP orders (bar plotsshowing composition of AAP and bacterial communities can befound in Supplementary Figs. S3 and S4). AAP: abundance of AAPbacteria, Res.IR: respiration rate in the IR light, Temp: watertemperature.
K. Piwosz et al.
1052
The ISME Journal (2022) 16:1046 – 1054

case of dark and IR measurements (Fig. 5). However, the amount ofexcessive CO2 during months with water temperature >10 °C (April-October) was significantly lower for the respiration measurements inthe IR light compared to dark (p value= 0.0255). The estimates ofCO2 released during these months based on the IR measurementswere lower by 0.54 × 10⁹ g CO2 in 2018 and by 3.15 × 109 g CO2 in2019 (Fig. 5). These numbers illustrate the potential impact ofphotoheterotrophic activity by AAP bacteria in freshwater lakes. Moremeasurements of microbial activity in the IR light instead of in thedark, and especially in habitats where AAP bacteria are abundant,such as the coastal areas of the ocean or mountain lakes [35], willimprove estimates of microbial respiration and production, providinga comprehensive understanding of the role of photoheterotrophy inthe global carbon cycle.
REFERENCES1. Tranvik LJ, Downing JA, Cotner JB, Loiselle SA, Striegl RG, Ballatore TJ, et al. Lakes
and reservoirs as regulators of carbon cycling and climate. Limnol Oceanogr.2009;54:2298–314.
2. Maberly SC, Barker PA, Stott AW, De Ville MM. Catchment productivity controlsCO2 emissions from lakes. Nat Clim Chang. 2013;3:391–4.
3. Berggren M, Lapierre J-F, del Giorgio PA. Magnitude and regulation of bacter-ioplankton respiratory quotient across freshwater environmental gradients. ISMEJ. 2012;6:984–93.
4. del Giorgio PA, Duarte CM. Respiration in the open ocean. Nature.2002;420:379–84.5. Beja O, Aravind L, Koonin EV, Suzuki MT, Hadd A, Nguyen LP, et al. Bacterial
Rhodopsin: evidence for a new type of phototrophy in the sea.Science.2000;289:1902–6.
6. Kolber ZS, Plumley FG, Lang AS, Beatty JT, Blankenship RE, VanDover CL, et al.Contribution of aerobic photoheterotrophic bacteria to the carbon cycle in theocean. Science. 2001;292:2492–5.
7. Koblížek M, Dachev M, Bína D, Nupur, Piwosz K, Kaftan D. Utilization of lightenergy in phototrophic Gemmatimonadetes. J Photochem Photobio B: Biol.2020;213:112085.
8. Piwosz K, Kaftan D, Dean J, Šetlík J, Koblížek M. Non-linear effect of irradiance onphotoheterotrophic activity and growth of the aerobic anoxygenic phototrophicbacterium Dinoroseobacter shibae. Environ Microbiol. 2018;20:724–33.
9. Hauruseu D, Koblížek M. Influence of light on carbon utilization in aerobicanoxygenic phototrophs. Appl Environ Microbiol. 2012;78:7414–9.
10. Cepáková Z, Hrouzek P, Žišková E, Nuyanzina-Boldareva E, Šorf M, Kozlíková-Zapomělová E, et al. High turnover rates of aerobic anoxygenic phototrophs inEuropean freshwater lakes. Environ Microbiol. 2016;18:5063–71.
11. Kolářová E, Medová H, Piwosz K, Koblížek M. Seasonal dynamics of aerobicanoxygenic phototrophs in freshwater lake Vlkov. Folia Microbiol.2019;64:705–10.
12. Garcia-Chaves MC, Cottrell MT, Kirchman DL, Ruiz-Gonzalez C, del Giorgio PA.Single-cell activity of freshwater aerobic anoxygenic phototrophic bacteria andtheir contribution to biomass production. ISME J. 2016;10:1579–88.
13. Koehler B, Landelius T, Weyhenmeyer GA, Machida N, Tranvik LJ. Sunlight-induced carbon dioxide emissions from inland waters. Glob Biogeochem Cycles.2014;28:696–711.
14. Lewis WM. Global primary production of lakes: 19th Baldi Memorial Lecture.Inland Waters. 2011;1:1–28.
15. Ruiz-González C, Simo R, Sommaruga R, Gasol JM. Away from darkness: a reviewon the effects of solar radiation on heterotrophic bacterioplankton activity. FrontMicrobiol. 2013;4:131.
16. Verpoorter C, Kutser T, Seekell DA, Tranvik LJ. A global inventory of lakes basedon high-resolution satellite imagery. Geophys Res Lett. 2014;41:6396–402.
17. Murphy J, Riley JP. A modified single solution method for the determination ofphosphate in natural waters. Anal Chim Acta. 1962;27:31–6.
18. Kopáček J, Hejzlar J. Semi-micro determination of total phosphorus in freshwaters with perchloric acid digestion. Int J Environ Anal Chem. 1993;53:173–83.
19. Procházková L. Bestimmung der Nitrate im Wasser. Fresenius’ Z für analytischeChem. 1959;167:254–60.
20. Kopáčkek J, Procházková L. Semi-micro determination of ammonia in water bythe rubazoic acid method. Int J Environ Anal Chem. 1993;53:243–8.
21. Piwosz K, Vrdoljak A, Frenken T, González-Olalla JM, Šantić D, McKay RM, et al.Light and primary production shape bacterial activity and community compo-sition of aerobic anoxygenic phototrophic bacteria in a microcosm experiment.mSphere 2020;5:e00354–20.
22. Carpenter JH. The Chesapeake Bay Institute. Technique for the Winkler oxygenmethod. Limnol Oceanogr. 1965;10:141–3.
23. Allesson L, Strom L, Berggren M. Impact of photochemical processing of DOC onthe bacterioplankton respiratory quotient in aquatic ecosystems. Geophys ResLett. 2016;43:7538–45.
24. Kirchman D, Knees E, Hodson R. Leucine incorporation and its potential as ameasure of protein-synthesis by bacteria in natural aquatic system. Appl EnvironMicrobiol. 1985;49:599–607.
25. Coleman AW. Enhanced detection of bacteria in natural environments by fluor-ochrone staining of DNA. Limnol Oceanogr. 1980;25:948–51.
26. Cottrell MT, Mannino A, Kirchman DL. Aerobic anoxygenic phototrophic bacteriain the Mid-Atlantic Bight and the North Pacific Gyre. Appl Environ Microbiol.2006;72:557–64.
27. Nercessian O, Noyes E, Kalyuzhnaya MG, Lidstrom ME, Chistoserdova L. Bacterialpopulations active in metabolism of C-1 compounds in the sediment of LakeWashington, a freshwater lake. Appl Environ Microbiol. 2005;71:6885–99.
28. Klindworth A, Pruesse E, Schweer T, Peplies J, Quast C, Horn M, et al. Evaluation ofgeneral 16S ribosomal RNA gene PCR primers for classical and next-generationsequencing-based diversity studies. Nucleic Acids Res. 2013;41:e1.
29. Martin M. Cutadapt removes adapter sequences from high-throughput sequen-cing reads. EMBnet J. 2011;17:10–2.
30. Callahan BJ, McMurdie PJ, Rosen MJ, Han AW, Johnson AJA, Holmes SP. DADA2:High-resolution sample inference from Illumina amplicon data. Nat Methods.2016;13:581–3.
31. Pruesse E, Quast C, Knittel K, Fuchs BM, Ludwig W, Peplies J, et al. SILVA: acomprehensive online resource for quality checked and aligned ribosomal RNAsequence data compatible with ARB. Nucleic Acids Res. 2007;35:7188–96.
32. Quast C, Pruesse E, Yilmaz P, Gerken J, Schweer T, Yarza P, et al. The SILVAribosomal RNA gene database project: improved data processing and web-basedtools. Nucleic Acids Res. 2013;41:D590–D6.
33. McMurdie PJ, Holmes S. phyloseq: an R package for reproducible interactiveanalysis and graphics of microbiome census data. PLOS ONE. 2013;8:e61217.
34. Wickham H. ggplot2: Elegant graphics for data analysis: Springer-Verlag NewYork; 2009.
35. Koblížek M. Ecology of aerobic anoxygenic phototrophs in aquatic environments.FEMS Microbiol Rev. 2015;39:854–70.
36. Yutin N, Suzuki MT, Béjà O. Novel primers reveal wider diversity among marineaerobic anoxygenic phototrophs. Appl Environ Microbiol. 2005;71:8958–62.
37. Wang Q, Garrity GM, Tiedje JM, Cole JR. Naïve bayesian classifier for rapidassignment of rRNA sequences into the new bacterial taxonomy. Appl EnvironMicrobiol. 2007;73:5261–7.
Fig. 5 Comparison of carbon fluxes for the surface layer of theLake Cep measured in the dark and the infrared light. CO2 fluxes(1010 g CO2 over the season with water temperature >10 °C) fromnet primary production (NPP, green color) and respiration (Res) forthe surface layer (0.5 m) of the whole area of the lake Cep based ondark (gray color) and infrared (red color) measurements. Lengths ofthe arrows are scaled to reflects the differences, and the dash linesare meant to aid direct comparison between the arrows. Thedifference between the excessive CO2 from the respiration based ondark vs infrared (IR) measurements was 0.54 × 10⁹ g CO2 in 2018 and3.15 × 109 g CO2 in 2019, summing up to 3.69 × 10⁹ g CO2 over thesetwo years. Lightning indicate energy from light, pink microbeindicates AAP bacteria.
K. Piwosz et al.
1053
The ISME Journal (2022) 16:1046 – 1054
38. Fish J, Chai B, Wang Q, Sun Y, Brown CT, Tiedje J, et al. FunGene: the functionalgene pipeline and repository. Front Microbiol. 2013;4:291.
39. Andrei A-Ş, Salcher MM, Mehrshad M, Rychtecký P, Znachor P, Ghai R. Niche-directed evolution modulates genome architecture in freshwater Planctomy-cetes. Isme J. 2019;13:1056–71.
40. Mehrshad M, Salcher MM, Okazaki Y, Nakano S-I, Šimek K, Andrei A-S, et al.Hidden in plain sight—highly abundant and diverse planktonic freshwaterChloroflexi. Microbiome.2018;6:176.
41. Parks DH, Chuvochina M, Waite DW, Rinke C, Skarshewski A, Chaumeil P-A, et al. Astandardized bacterial taxonomy based on genome phylogeny substantiallyrevises the tree of life. Nat Biotechnol. 2018;36:996.
42. Field A, Miles J, Field Z. Discovering Statistics Using R. London, UK: SAGE Pub-lications Ltd; 2012. p. 993.
43. Anderson MJ, Legendre P. An empirical comparison of permutation methods fortests of partial regression coefficients in a linear model. J Stat Comput Simul.1999;62:271–303.
44. Legendre P, Anderson MJ. Distance-based redundancy analysis: testing multispeciesresponses in multifactorial ecological experiments. Ecol Monogr. 1999;69:1–24.
45. Anderson MR, Gorley R, Clarke KR. PERMANOVA+ for PRIMER: Guide to Softwareand Statistical Methods. Plumouth, UK: PRIMER-E; 2008.
46. Love MI, Huber W, Anders S. Moderated estimation of fold change and dispersionfor RNA-seq data with DESeq2. Genome Biol. 2014;15:550.
47. Fuhrman JA, Azam F. Thymidine incorporation as a measure of heterotrophicbacterioplankton production in marine surface waters - evaluation and fieldresults. Mar Biol. 1982;66:109–20.
48. Ruiz-Gonzalez C, Lefort T, Massana R, Simo R, Gasol JM. Diel changes in bulk andsingle-cell bacterial heterotrophic activity in winter surface waters of the north-western Mediterranean Sea. Limnol Oceanogr. 2012;57:29–42.
49. Selyanin V, Hauruseu D, Koblížek M. The variability of light-harvesting complexesin aerobic anoxygenic phototrophs. Photosynthesis Res. 2016;128:35–43.
50. Salcher MM, Posch T, Pernthaler J. In situ substrate preferences of abundant bac-terioplankton populations in a prealpine freshwater lake. ISME J. 2013;7:896–907.
51. Kasalický V, Zeng Y, Piwosz K, Šimek K, Kratochvilová H, Koblížek M. Commonpresence of aerobic anoxygenic photosynthesis within the genus Limnohabitans.Appl Environ Microbiol. 2018;84:e02116–17.
52. Kasalický V, Jezbera J, Hahn MW, Simek K. The diversity of the Limnohabitansgenus, an important group of freshwater bacterioplankton, by characterization of35 isolated strains. Plos ONE. 2013;8:e58209.
53. Ruiz-González C, Garcia-Chaves MC, Ferrera I, Niño-Garcia JP, del Giorgio PA.Taxonomic differences shape the responses of freshwater aerobic anoxygenicphototrophic bacterial communities to light and predation. Mol Ecol.2020;29:1267–83.
54. Fecskeová LK, Piwosz K, Hanusová M, Nedoma J, Znachor P, Koblížek M. Dielchanges and diversity of pufM expression in freshwater communities of anoxy-genic phototrophic bacteria. Sci Rep. 2019;9:18766.
55. Neuenschwander SM, Ghai R, Pernthaler J, Salcher MM. Microdiversification ingenome-streamlined ubiquitous freshwater Actinobacteria. Isme J.2018;12:185–98.
56. Sharma AK, Sommerfeld K, Bullerjahn GS, Matteson AR, Wilhelm SW, Jezbera J,et al. Actinorhodopsin genes discovered in diverse freshwater habitats andamong cultivated freshwater Actinobacteria. ISME J. 2009;3:726–37.
57. Sharma AK, Zhaxybayeva O, Papke RT, Doolittle WF. Actinorhodopsins:proteorhodopsin-like gene sequences found predominantly in non-marineenvironments. Environ Microbiol. 2008;10:1039–56.
58. Dwulit-Smith JR, Hamilton JJ, Stevenson DM, He S, Oyserman BO, Moya-Flores F,et al. acI Actinobacteria assemble a functional actinorhodopsin with nativelysynthesized retinal. Appl Environ Microbiol. 2018;84:e01678–18.
59. Kirchman DL, Hanson TE. Bioenergetics of photoheterotrophic bacteria in theoceans. Environ Microbiol Rep. 2013;5:188–99.
60. Zubkov MV, Fuchs BM, Tarran GA, Burkill PH, Amann R. High rate of uptake oforganic nitrogen compounds by prochlorococcus cyanobacteria as a key to their
dominance in oligotrophic oceanic waters. Appl Environ Microbiol.2003;69:1299–304.
61. Shih PM, Wu D, Latifi A, Axen SD, Fewer DP, Talla E, et al. Improving the coverageof the cyanobacterial phylum using diversity-driven genome sequencing. ProcNatl Acad Sci. 2012. https://doi.org/10.1073/pnas.1217107110.
ACKNOWLEDGEMENTSAuthors thank Michal Koblížek for providing the idea of discriminating between theAAP and bulk bacterial activity using IR light, Petr Šmilauer for assistance withstatistical analysis, Vít Náhlík and Jason Dean for help during the sampling campaign,Petr Porcal for measuring nutrients concentrations, Kasia Huzarska from malaidea.plfor drawing of phytoplankton (Fig. 5), Alastair Gardiner, Michaela M. Salcher, andJosefa Antón for commenting on the paper. This study was supported by a juniorproject no. 18–14095Y from the Czech Science Foundation awarded to KP.
AUTHOR CONTRIBUTIONSKP conceived the project, performed measurements of respiration and assimilationrates of radioactive compounds, microscopic analysis, analyzed the data, preparedthe figures, and wrote the paper. CVA helped with sample collections and writing andcommenting on the paper, prepared the samples for sequencing, analyzed thesequencing data and prepared figures. IM helped with sample collections, did theDNA extractions, and commented on the paper.
COMPETING INTERESTSThe authors declare no competing interests.
ADDITIONAL INFORMATIONSupplementary information The online version contains supplementary materialavailable at https://doi.org/10.1038/s41396-021-01142-2.
Correspondence and requests for materials should be addressed to Kasia Piwosz.
Reprints and permission information is available at http://www.nature.com/reprints
Publisher’s note Springer Nature remains neutral with regard to jurisdictional claimsin published maps and institutional affiliations.
Open Access This article is licensed under a Creative CommonsAttribution 4.0 International License, which permits use, sharing,
adaptation, distribution and reproduction in anymedium or format, as long as you giveappropriate credit to the original author(s) and the source, provide a link to the CreativeCommons license, and indicate if changes were made. The images or other third partymaterial in this article are included in the article’s Creative Commons license, unlessindicated otherwise in a credit line to the material. If material is not included in thearticle’s Creative Commons license and your intended use is not permitted by statutoryregulation or exceeds the permitted use, you will need to obtain permission directlyfrom the copyright holder. To view a copy of this license, visit http://creativecommons.org/licenses/by/4.0/.
© The Author(s) 2021
K. Piwosz et al.
1054
The ISME Journal (2022) 16:1046 – 1054