Light scattering by marine heterotrophic bacteria
11
JOURNAL OF GEOPHYSICAL RESEARCH, VOL. 97, NO. C6, PAGES 9619-9629, JUNE 15, 1992 Light Scattering by Marine Heterotrophic Bacteria OSVALDO ULLOA 1 AND SHUBHA SATHYENDRANATH 1 Department of Oceanography, Dalhousie University, Halifax, NovaScotia, Canada TREVOR PLATr Biological Oceanography Division, Bedford Institute of Oceanography, Dartmouth, Nova Scotia, Canada RENATO A. QUIllONES Department ofBiology, Dalhousie University, Halifax,NovaScotia, Canada Mie theoryis applied to estimate scattering by polydispersions of marineheterotrophic bacteria, and a simple expression is derivedfor the bacterial scattering coefficient. The error incurred in derivingbacterialoptical properties by useof the van de Hulst approximations is computed. The scattering properties of natural bacterial assemblages in three marine environments, Georges Bank, Northeast Channel, and Sargasso Sea, are assessed by applying Mie theory to field dataon bacterial sizeand abundance. Results areused to examine the potential contribution of bacteria to the scattering properties of seawater.The utility of usingpigmentdata to predictthe magnitude of scattering by bacteria is discussed. INTRODUCTION The role of heterotrophic bacteria in radiativetransfer in the ocean hasbeen little studied. The common practice in marine op- tics has beento partition the opticalproperties of seawater into contributions from purewater,phytoplankton, yellow substances, and inorganic sediments [e.g., Jerlov,1976; Kirk, 1983],and there- fore to ignore any independent contribution from nonchlorophyl- lous cells.Under this scheme, phytoplankton is considered to bethe main component influencing theoptical properties of ocean waters [Gordonand Morel, 1983]. Earlymeasurements of theabsorption properties of a marine heto erotrophic bacterium in culturewere reported by ¾entsch [1962]. More recently, measurements of boththeabsorption andscattering properties of heterotrophic bacteria have beenmade on cultures isolated frommarine environments [Kopelevich et al., 1987; Morel and Ahn, 1990; Strataski and Kiefer, 1990]. Theselatter results show thatheterotrophic bacteria are much moreefficient as scatø terers of light than as absorbers andsuggest thatin natural waters bacteria could contribute significantly to thescattering of light. No directmeasurements of the contribution of heterotrophic marine bacteria to the absorption andscattering of light in theocean have yet beenmade,although it hasbeenrecognized that bacteria can affect significantly in situmeasurements of optical properties such astheattenuation coefficient [Spinrad et al., 1989a, b]. Physical theories of scattering have been usedto account for the optical properties of biological particles [e.g.,Petukhov, 1965; Koch,1968; Bryantet al., 1969],aswell asof suspended particles (organic and inorganic) in the ocean[Gordon and Brown, 1972; Brown and Gordon, 1973, 1974;Morel, 1973]. With the assumpo 1Also at Biological Oceanography Division, Bedford Institute of Oceanography, Dartmouth, Nova Scotia, Canada. Copyright 1992by theAmerican Geophysical Union. Paper number 92JC00785. 0148-0227/92/92JC-00785505.00 tionthattheparticles arespherical, Mie theory [Mie, 1908]and the simpler approximations of van de Hulst [ 1957] have been used for phytoplankton [Morel and Bricaud, 1981a,b, 1986;Bricaudand Morel, 1986], including autotrophic bacteria [Strataski and Morel, 1990], for marine heterotrophic bacteria[Morel and Ahn, 1990; Strataski and Kiefer, 1990], and more recently for heterotrophic nanoflagellates andciliates[Morel andAhn, 1991]. These theories provide estimates of optical properties of the cells,giveninforma- tion only on theirsizeandrefractive index. The size distribution of bacteria in nature candiffersignificantly from that of laboratory cultures [Glide,1989; Robertson andButton, 1989], since the latterrepresent a selected group, free of predators. On the other hand, information on bacterial size in the ocean is still limited. Although bacterial size can be measured in cultures using electronic particle sizers [Kogure andKoike,1987], bacterial sizes in natural samples are still most commonly determined using epifluorescence microscopy [e.g.,ChoandAzam, 1990],a tedious and time-consuming method. With most particle sizers it is notpos- sibleto distinguish between living andnonliving particles, and in most cases the resolution of the instruments has been insufficient to yieldreliable information on particles smaller than1/tm and there- fore on the size ranges comprising heterotrophic bacteria [Kogure and Koike, 1987]. This work is basedon detailed size measure- ments of bacterial natural samples, obtained with image-analyzed, epifluorescence microscopy. Here we use Mie theory to calculate scattering by heterotrophic bacteria. We showthat for the size rangeof marinebacteria ob- served in thefield, thevan de Hulstapproximations leadto signif- icanterrors in the estimation of their optical properties. We then assess the opticalcharacteristics of naturalbacterial assemblages in Georges Bank,the Northeast Channel, andthe Sargasso Seaby applying Mie theory to bacterial sizeand abundance measurements. We estimate thecontribution of bacteria to thescattering properties of seawater in each of the three environments studied. We show that whenthe complete size distribution is not available, bacterial scattering can be computed usinga simpleexpression which is a function ofjustthe mean and standard deviation. Finally, wediscuss theutility of using pigment data to estimate bacterial scattering. 9619
Transcript of Light scattering by marine heterotrophic bacteria
JOURNAL OF GEOPHYSICAL RESEARCH, VOL. 97, NO. C6, PAGES 9619-9629, JUNE 15, 1992
Light Scattering by Marine Heterotrophic Bacteria
OSVALDO ULLOA 1 AND SHUBHA SATHYENDRANATH 1
Department of Oceanography, Dalhousie University, Halifax, Nova Scotia, Canada
TREVOR PLATr
Biological Oceanography Division, Bedford Institute of Oceanography, Dartmouth, Nova Scotia, Canada
RENATO A. QUIllONES
Department of Biology, Dalhousie University, Halifax, Nova Scotia, Canada
Mie theory is applied to estimate scattering by polydispersions of marine heterotrophic bacteria, and a simple expression is derived for the bacterial scattering coefficient. The error incurred in deriving bacterial optical properties by use of the van de Hulst approximations is computed. The scattering properties of natural bacterial assemblages in three marine environments, Georges Bank, Northeast Channel, and Sargasso Sea, are assessed by applying Mie theory to field data on bacterial size and abundance. Results are used to examine the potential contribution of bacteria to the scattering properties of seawater. The utility of using pigment data to predict the magnitude of scattering by bacteria is discussed.
INTRODUCTION
The role of heterotrophic bacteria in radiative transfer in the ocean has been little studied. The common practice in marine op- tics has been to partition the optical properties of seawater into contributions from pure water, phytoplankton, yellow substances, and inorganic sediments [e.g., Jerlov, 1976; Kirk, 1983], and there- fore to ignore any independent contribution from nonchlorophyl- lous cells. Under this scheme, phytoplankton is considered to be the main component influencing the optical properties of ocean waters [Gordon and Morel, 1983].
Early measurements of the absorption properties of a marine heto erotrophic bacterium in culture were reported by ¾entsch [1962]. More recently, measurements of both the absorption and scattering properties of heterotrophic bacteria have been made on cultures isolated from marine environments [Kopelevich et al., 1987; Morel and Ahn, 1990; Strataski and Kiefer, 1990]. These latter results show that heterotrophic bacteria are much more efficient as scatø terers of light than as absorbers and suggest that in natural waters bacteria could contribute significantly to the scattering of light. No direct measurements of the contribution of heterotrophic marine bacteria to the absorption and scattering of light in the ocean have yet been made, although it has been recognized that bacteria can affect significantly in situ measurements of optical properties such as the attenuation coefficient [Spinrad et al., 1989a, b].
Physical theories of scattering have been used to account for the optical properties of biological particles [e.g., Petukhov, 1965; Koch, 1968; Bryant et al., 1969], as well as of suspended particles (organic and inorganic) in the ocean [Gordon and Brown, 1972; Brown and Gordon, 1973, 1974; Morel, 1973]. With the assumpo
1Also at Biological Oceanography Division, Bedford Institute of Oceanography, Dartmouth, Nova Scotia, Canada.
Copyright 1992 by the American Geophysical Union.
Paper number 92JC00785. 0148-0227/92/92JC-00785505.00
tion that the particles are spherical, Mie theory [Mie, 1908] and the simpler approximations of van de Hulst [ 1957] have been used for phytoplankton [Morel and Bricaud, 1981a, b, 1986; Bricaud and Morel, 1986], including autotrophic bacteria [Strataski and Morel, 1990], for marine heterotrophic bacteria [Morel and Ahn, 1990; Strataski and Kiefer, 1990], and more recently for heterotrophic nanoflagellates and ciliates [Morel and Ahn, 1991]. These theories provide estimates of optical properties of the cells, given informa- tion only on their size and refractive index.
The size distribution of bacteria in nature can differ significantly from that of laboratory cultures [Glide, 1989; Robertson andButton, 1989], since the latter represent a selected group, free of predators. On the other hand, information on bacterial size in the ocean is still limited. Although bacterial size can be measured in cultures using electronic particle sizers [Kogure and Koike, 1987], bacterial sizes in natural samples are still most commonly determined using epifluorescence microscopy [e.g., Cho and Azam, 1990], a tedious and time-consuming method. With most particle sizers it is not pos- sible to distinguish between living and nonliving particles, and in most cases the resolution of the instruments has been insufficient to
yield reliable information on particles smaller than 1/tm and there- fore on the size ranges comprising heterotrophic bacteria [Kogure and Koike, 1987]. This work is based on detailed size measure- ments of bacterial natural samples, obtained with image-analyzed, epifluorescence microscopy.
Here we use Mie theory to calculate scattering by heterotrophic bacteria. We show that for the size range of marine bacteria ob- served in the field, the van de Hulst approximations lead to signif- icant errors in the estimation of their optical properties. We then assess the optical characteristics of natural bacterial assemblages in Georges Bank, the Northeast Channel, and the Sargasso Sea by applying Mie theory to bacterial size and abundance measurements. We estimate the contribution of bacteria to the scattering properties of seawater in each of the three environments studied. We show
that when the complete size distribution is not available, bacterial scattering can be computed using a simple expression which is a function ofjust the mean and standard deviation. Finally, we discuss the utility of using pigment data to estimate bacterial scattering.
9619

9620 ULLOA ET AL.: LIGHT SCATTERING BY MARINE BACTERIA
THEORETICAL CONSIDERATIONS AND TERMINOLOGY
The primary objective of this paper is to use measurements of abundance and size distribution of marine bacteria to estimate their
importance as light scatterers at sea. The coccoid shape, random orientation, and simple cellular structure of most free-living ma- rine bacteria suggest that as a first approximation, bacteria may be assumed to be spherical and homogeneous particles. For such par- ticles, Mie theory of scattering [Mie, 1908] gives exact solutions, provided that the refractive index of the particles is known. Since we made no direct measurements of refractive index during our cruises, we examine in this section the Mie solutions to the problem for the range of refractive indices that have been previously reported [Morel and Ahn, 1990; Strataski and Kiefer, 1990]. We also exam- ine the suitability of using the much simpler approximations of van de Hulst [ 1957] for estimating scattering by heterotrophic bacteria. We start by recalling the definitions of the optical properties and parameters to be used throughout the text.
Inherent Optical Properties of an Aquatic System
The absorption and scattering properties of an aquatic system, composed of pure water plus other substances in solution and in sus- pension, can be specified in terms of the total absorption coefficient a, the total scattering coefficient b, the total attenuation coefficient c, and the total volume scattering function/•(0). These properties are referred to as the inherent optical properties [Preisendorfer, 1961], since their magnitudes depend only on the substances comprising the system and are independent of the geometry of the incident radiant field.
The inherent optical properties (all with dimensions [L-l]) are defined for an infinitesimally thin layer of the system illuminated by a monochromatic collimated beam normal to the layer. Let &o be the incident radiant flux, d&a and d&b the absorbed and scattered fluxes, respectively, dck(O) the flux scattered into an element of solid angle dw oriented at angle 0 to the direction of the incident beam, and dr the thickness of the layer. Then we have [cf. Kirk, 1983]
1 d•ba a-- Cko dr (la)
1 b-- •odr (lb)
c-a+b (lc)
1 d2q•(O)
The integral of (ld) over all directions yields the total scattering coefficient. For scattering with rotational symmetry,
b = 2•r /•(0) sin OdO (2)
For many optical problems (e.g., theory of ocean color), it is neces- sary to distinguish between light that is scattered into the forward and the backward directions. The total backscattering coefficient (or total backward scattering coefficient) b• is obtained by integrat- ing the total volume scattering function over the backward hemi- sphere (•r/2 _< 0 • •)'
b• - 2• •(0) sin OdO (3)
The total backscattering ratio • - b•/b is defined as the ratio of the total backscattering coefficient to the total scattering coefficient.
Optical Properties of a Single Particle
When a single particle is illuminated by a monochromatic, col- limated beam, a certain fraction of the incident radiant flux is ab-
sorbed or scattered (or both) from the beam. The efficiency factors (dimensionless) for absorption Q•, scattering Q•, and attenuation Qc are defined as the ratios of the absorbed, scattered, and attenu- ated (absorbed + scattered) fluxes, respectively, to the radiant flux incident onto the geometrical cross section of the particle normal to the incident beam [van de Hulst, 1957].
The refractive index of the particle relative to the surrounding medium (water) is specified by a complex number m = n - in', where the real part n corresponds to the ratio of the phase velocity of light in the medium to the phase velocity of light inside the particle, and the imaginary part n' is related to a', the absorption coefficient of the material of which the particle is made, according to n' = (a'X)/(4•r m•,), where X is the wavelength of light in vacuum and m•, is the refractive index of the medium (water). In the visible range (400-700 nm), the imaginary part of m•, is less than 10 -7 and can therefore be neglected. With this approximation, mw can be replaced by n•o = 1.34 [Jerlov, 1976], the real part of the refractive index of water in the visible range.
Mie Scattering
The optical characteristics of an optically homogeneous spher- ical particle can be determined precisely using Mie theory [Mie, 1908; van de Hulst, 1957]. The relevant dimensionless parameters involved in the calculations are m, the complex refractive index of the particle relative to that of the surrounding medium, and x, the size of the particle scaled to the wavelength of light in the medium according to
•'Dn•, x = (4)
where D is the diameter of the particle, n• is the refractive index of water, and A is the wavelength of light in vacuum.
The solutions are expressed in terms of the complex Mie coeffi- cients from which the efficiency factors for attenuation, Qc(m, and scattering, Qb (m, a:), are computed. The efficiency factor for absorption, Q• (m, a:), is obtained by subtraction (Q• = Q• -Q•). The Mie coefficients can also be used to compute the angular distri- bution of the scattered light, specified by the dimensionless angular intensity functions i1(0, m, a:) and i2(0, m, a:), where 0 is the scat- tering angle.
The efficiency factor for backscattering, Q•, can be computed directly from the Mie coefficients [Chfiek, 1973], or alternatively, by integrating numerically the angular intensity parameters over the backward hemisphere:
Q• (m, x) = x -2 [i1(0, m, x) + i2(0, m, x)] sin OdO (5) /2
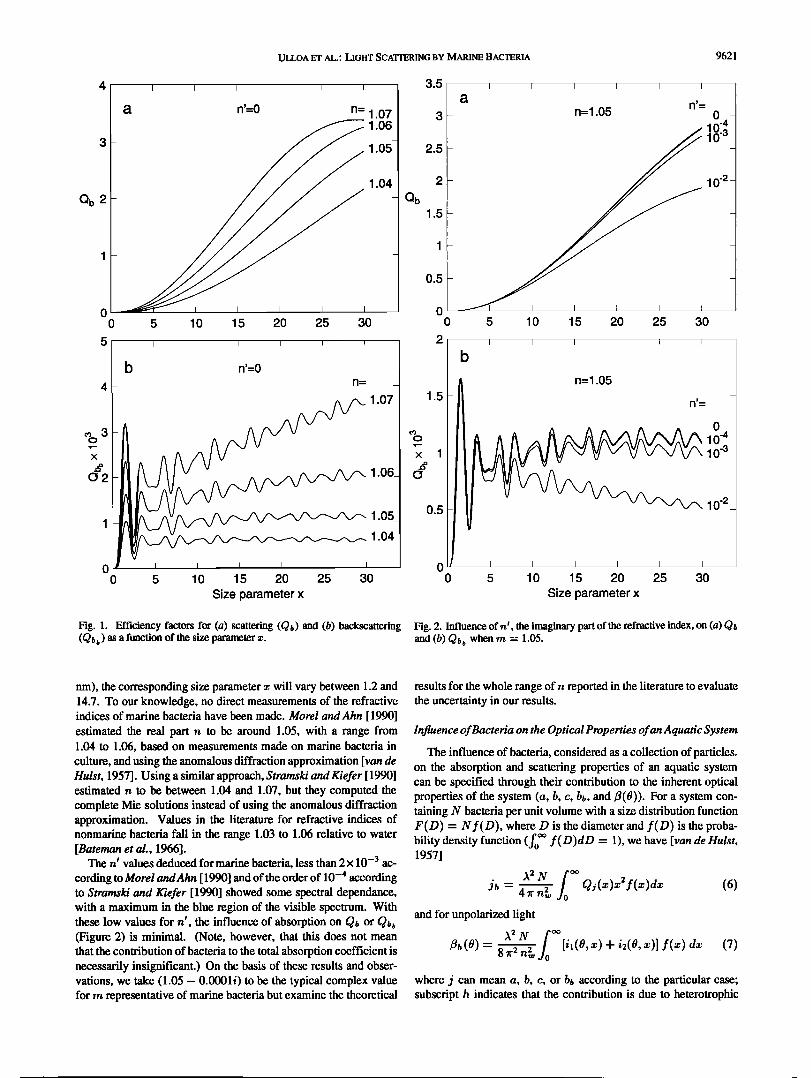
Figures la and lb show the variation in Q• (=Q• when n • = 0) and Qb• as a function of x for different values of n. Computations were carried out with code according to Bohren and Huffman [ 1983], which does not give Q• directly but allows it to be com- puted from the intensity functions.
The equivalent spherical diameter D (defined as the diameter of a sphere having a cross-sectional area equal to the projected area of the particle) in our field data varies from about 0.2 to 1.4 tim (see Figure 6). For wavelengths in the visible range (400 to 700
ULLOA ET AL.: LIGHT SCATTERING BY MARINE BACTERIA 9621
a n'=o n= 1.o7 n=1.05 0. 4_
1.04 - 0 '2 -
Qb -_ Qb _ 0 O- 5 10 15 20 25 30 0 5 10 15 20 25 30 5 ' ' ' ' ' ' I b ' ' ' ' ' ' •b n'=o n= J n=1.o5 n' / 3 V- 0 ',- 0.3_ r• x,,
d2I• •/'• 1,061 0 '2 -
I-Y "ø41 0 II I I I I I I / I I I I I
0 5 10 15 20 25 30 0 5 10 15 20 25 30
Size parameter x Size parameter x
Fig. 1. Efficiency factors for (a) scattering (Q•) and (b) backscattering Fig. 2. Influence of n f, the imaginary part of the refractive index, on (a) Q• (Qt, b ) as a function of the size parameter z. and (b) Qt, b when rn = 1.05.
nm), the corresponding size parameter x will vary between 1.2 and 14.7. To our knowledge, no direct measurements of the refractive indices of marine bacteria have been made. Morel and Ahn [ 1990]
estimated the real part n to be around 1.05, with a range from 1.04 to 1.06, based on measurements made on marine bacteria in culture, and using the anomalous diffraction approximation [van de Hulst, 1957]. Using a similar approach, Strataski and Kiefer [ 1990] estimated n to be between 1.04 and 1.07, but they computed the complete Mie solutions instead of using the anomalous diffraction approximation. Values in the literature for refractive indices of nonmarine bacteria fall in the range 1.03 to 1.06 relative to water [Bateman et aL, 1966].
The rd values deduced for marine bacteria, less than 2x 10 -3 ac- coMing to Morel andAhn [ 1990] and of the order of 10 -4 according to Strataski and Kiefer [ 1990] showed some spectral dependanco, with a maximum in the blue region of the visible spectrum. With these low values for n •, the influence of absorption on (Figure 2) is minimal. (Note, however, that this does not mean that the contribution of bacteria to the total absorption coefficient is necessarily insignificant.) On the basis of these results and obser- vations, we take (1.05 - 0.0001 i) to be the typical complex value for rn representative of marine bacteria but examine the theoretical
results for the whole range of n reported in the literature to evaluate the uncertainty in our results.
Influence of Bacteria on the Optical Properties of an Aquatic System
The influence of bacteria, considered as a collection of particles. on the absorption and scattering properties of an aquatic system can be specified through their contribution to the inherent optical properties of the system (a, b, c, b•, and/•(0)). For a system con- taining N bacteria per unit volume with a size distribution function F (D) = N f (D), where D is the diameter and f (D) is the proba- bility density function (fo © f(D)dD = 1), we have [van de Hulst, 1957]
A 2 N fo jh - 4 •r n2,, O)(x)x2 f(x)dx (6) and for unpolarized light
,•2N fo © /•t•(0) -- 8•r2 n2 • [i1(0, x) + i2(0, x)] f(x) ax (7) where j can mean a, b, c, or b• according to the particular case; subscript h indicates that the contribution is due to heterotrophic

9622 ULLOA ET AL.: LIGHT SCATTERING BY MARINE BACTERIA
bacteria; and i1(0, x) and i2(0, x) are the Mie angular intensity functions. The function f(x) is obtained directly from f(D) by change of variable using (4).
An effective efficiency factor can also be defined for the entire population [van de Hulst, 1957],
O• - føø• Qs(x)x2f(x)dx f(x)ctx (s) which corresponds to the ratio of the total optical cross section for j - a, b, c, or bb, to the total geometrical cross section.
Simple Expression for Bacterial Scattering
Applying Mie theory to a bacterial population with a measured size distribution would require numerical integration of (6) and (7). However, economy of computing time dictates a preference for analytic solutions when the results so obtained have the required accuracy. Computing efficiency could be crucial when the solutions are to be incorporated into other bio-optical models, for example, in the calculation of primary production from remotely sensed data. Furthermore, when the full size distribution is not available, a sim- ple approximation is useful. Morel and Ahn [1990] gave simple formulae for scattering and absorption, but their expressions are based on van de Hulst approximations and are applicable only to monodisperse populations. We now proceed to derive a more exact solution for polydisperse suspensions.
In the case of scattering, the first step is to find a simple expres- sion for Qb(x). For m between 1.04 and 1.07 and for x _< 30, we found that the monotonic increase of Q• with x (Figure 1) can be empirically approximated by
k
Qb(x) -- E øqixs j=O
(9)
where a s are empirically determined coefficients and depend only on m. For k = 5, the relative error in Q, is less than 7% over the size parameter range of interest. The coefficients a s for different values of n and n' are given in Table 1.
The next step is to select a function that fits the actual size distribution. Among the two-parameter distribution functions used to describe naturally occurring particles, the most common are the normal and the lognormal distributions. However, in the case of skewed distributions, the gamma distribution has also been shown to fit the experimental data well [Deirmendjian, 1969]. Therefore we can choose f (x) to be
f(x) - F'• x("-•)e-n' (10) where F is the gamma function, and v and r/are the parameters of the distribution. The two parameters are related to the mean •-, the mode x,•, and the standard deviation rr• of the population:
v - = -- (11a)
r/- •' _ x,, er2• (11b) Using (9) and (10), we can now integrate (6) to find an analytical
expression for the scattering coefficient:
bh = 4 •r n2• • a• (v)•+2 .j+2 (12) where (v)•+2 is the p•ticular case, p = j + 2, of the Pochhammer
p--1 polynomial (v)•, defined by the expression (v)• - •t=0 (v + 1).
We can also evaluate (8), obtaining an expression for the effective efficiency factor for scatte•ng:
k
+ O,-•a• , (13)
j=0
where we have used the recursion property of the Pochhmmer polynomi• to set (v)i+2/(v)i = (v + 2)i.
The van de Hulst Approximations
For homogeneous spherical particles with refractive index close to 1 and x >> 1, the efficiency factor Q c can be computed more easily using the anomalous diffraction approximation [van de Hulst, 1957]:
Qc(p)-2_4e-Ot•n•(c-•-•)sin(p_•)
+4 (c•--•) 2 [cos (2•) - e -•'t• cos (p - 2•)] (14)
where p - 2 x (n - 1) and tan • - n'/(n - 1). In addition, van de Hulst [ 1957] derived an expression for Qa, valid under the same conditions:
TAB LE 1. Coefficients (Dimensionless) for the Approximation of the Function Q • (z) for Different Values of m
m a0 •1 •2 •3 •4 •5
1.04- 0i 2.1067 X 10 -4 -2.6768 x 10 -3 3.6311 x 10 -3 -1.4931 x 10⁻⁵ -9.7510 X 10 -7 6.6087 x 10 -9 1.04- 0.0001i 2.1278 X 10 -4 -2.6791 x 10 -3 3.6322 x 10 -3 -1.5613 x 10⁻⁵ -9.6744 x 10 -7 6.6504 x 10 -9 1.04- 0.001i 2.2358 X 10 -4 -2.6911 x 10 -3 3.6419 x 10 -3 -2.1541 x 10⁻⁵ -9.0154 x 10 -7 7.0599 x 10 -9 1.05- Oi 2.5404 X 10 -4 -4.1414 x 10 -3 5.7044 x 10 -3 -1.7986 x 10⁻⁵ -3.1131 x 10 -6 3.3582 x 10 -8 1.05 -0.0001i 2.5953 X 10 -4 -4.1480 x 10 -3 5.7072 x 10 -3 -1.9219 x 10⁻⁵ -3.0912 x 10 -6 3.3578 x 10 -8 1.05 -0.001i 3.0380 x 10 -4 -4.2042 x 10 -3 5.7340 x 10 -3 -3.0292 x 10⁻⁵ -2.8851 x 10 -6 3.3365 x 10 -8 1.06- 0i 4.4312 x 10 -4 -6.1325 x 10 -3 8.3223 x 10 -3 -2.3909 x 10⁻⁵ -7.0740 x 10 -6 9.5221 x 10 -8 1.06- 0.0001 4.5650 X 10 -4 -6.1500 x 10 -3 8.3291 x 10 -3 -2.6092 x 10⁻⁵ -7.0178 x 10 -6 9.4923 x 10 -8 1.06- 0.001i 5.7538 X 10 -4 -6.3079 x 10 -3 8.3928 x 10 -3 -4.5717 x 10⁻⁵ -6.5021 x 10 -6 9.2010 x 10 -8 1.07- 0i 1.3299 x 10 -3 -9.3811 x 10 -3 1.1714 x 10 -2 -5.5654 x 10⁻⁵ -1.2716 x 10 -5 2.0198 x 10 -7 1.07- 0.0001i 1.3546 x 10 -3 -9.4150 x 10 -3 1.1728 x 10 -2 -5.9216 x 10⁻⁵ -1.2600 x 10 -5 2.0101 x 10 -7 1.07- 0.001 1.5906 x 10 -3 -9.7383 x 10 -3 1.1852 x 10 -2 -9.1674 x 10⁻⁵ -1.1531 x 10 -5 1.9177 x 10 -7
See equation (9) in the text.

ULLOA ET AL.: LIGHT SCATTERING BY MARINE BACTERIA 9623
Q•(p') - 1 + 2 -•-;- + 2 pt2 (15)
where p' - 4 x n'. The efficiency factor Qb is then given by the difference between Qc and Qa. However, under this scheme, no expressions are available either for Qbb or for the angular intensity functions. Note that the expression for Qa given in (15) is identical to the solution of Duysens [ 1956]. Both Duysens [ 1956] and van de Hulst [ 1957] make the same approximations in deriving the expres- sion for Q• (for example, no refraction at the interface between the particle and the medium).
For the size parameter range representative of bacteria (• 1 to 15) the condition x >> 1 is not satisfied everywhere. To test the validity of the van de Hulst expressions over the ranges of x and m typical for bacteria, we calculated the exact Mie solutions for Q• and Qc and compared with the approximate results according to (14) and (15). For n between 1.04 and 1.07 and for x between 1 and 15, the error for Q• was found to be less than 15% for n' _< 10 -3, while the error in Q• can exceed 100% (see also Moore et al. [1968]). We also examined the error in the case of polydisperse suspensions. For a given •, we varied the standard deviation (a•) in the gamma distribution. The results for m - 1.05 are shown in Figure 3. It is clear that the error in Q• can exceed 100%, depending mainly on ß . This error increases rapidly with decreasing •.
Morel and Ahn [ 1990] and Strataski and Kiefer [ 1990] have re- lied on the van de Hulst approximation for Q• to evaluate n', and Morel and Ahn [ 1990] used the anomalous diffraction approxima- tion for Q• to estimate n. We have tried to evaluate whether the corresponding errors are within reasonable limits when applied to bacteria.
According to this method, which was originally described by Bricaud and Morel [1986] and later modified by Strataski et al. [ 1988], the imaginary part of the refractive index n' is first deter- mined at each wavelength of the spectrum by an iterative process: the computed Qa(p') obtained from (8) and (15) is matched with
a laboratory-determined value of •. The experimental • at a given wavelength is in turn obtained from measurements of the bacterial absorption coefficient an and the size distribution f(D), according to
Q•_ 4_. at, (16) ;r N •o øø f(D) D 2 dD
Compared with the exact Mie computations, we have established that this method will give n' values within 20% over the range in x and m representative of marine bacteria (Figure 4).
The next step in the method, as modified by Stramski et al. [ 1988], is the determination of the real part of the refractive index by iteration. By varing n, a computed efficiency factor for attenuation Q•(p) is made to match the corresponding experimental Q• value. The computed Q• values are obtained from (8) and (14), and the experimental values are obtained from an equation analogous to equation (16).
We have determined the error in n, as estimated using the anoma- lous diffraction approximation of van de Hulst, by the following iter- ative process. We varied n such that a Qc, computed using (14), was made to approach a Q• obtained from Mie computation for a given n and x. The iteration was terminated when IQ•/t• - II <_ 10 -3. We took the n value used to compute Q• as the initial guess to obtain Q•. The results for the relative error in (n - 1) as a function of n and a: are shown in Figure 5. For the low end in the size pa- rameter range of interest here, the errors are significant. (Note that the size parameters for bacteria in the data of Morel and Ahn [ 1990] are higher than in ours, and consequently their analysis would be less affected by this type of errors.)
It appears from these results that the anomalous diffraction ap- proximation is not valid for the size range of bacteria in our ob- servations. We have therefore used the complete Mie solutions to compute the contribution of bacteria to the light scattering in seawater.
f(y)=gamma distribution m -1 .05
-o
Fig. 3. Relative error in computation of the effective efficiency factor Q/• (= Qc when n • = 0) using the anomalous diffraction approximation as a function of the mean and standard deviation of the size parameter of a polydispersion with a gamma size distribution and m = 1.05.

9624 ULLOA ET AL.' LIGHT SCATTERING BY MARINE BACTERIA
BACTERIAL SCATTERING IN MARINE WATERS
In this section we assess the scattering properties ofheterotrophic bacteria in waters of different trophic status (i.e., with different phy- toplankton abundances as indexed by their pigment concentration). Our general approach is to apply the exact Mie theory to field data on bacterial size and abundance. For the scattering coefficient, we compare these results with those obtained using the analytical expression derived above. We then examine the potential contribu- tion of bacteria to the scattering properties of seawater. Finally, we examine recent data [Liet al., 1992] on the relationship between bacterial abundance and pigment concentration and evaluate the utility of pigment data as a basis for predicting the magnitude of scattering by bacteria.
Sampling and Size Measuretnents
Samples for bacterial counts and size measurements were taken from C.S.S. Hudson during August-September, 1988. Data from
0.2
-:- o.1 - o
• 0-
-0.1
10 -1 0.2
a n'= 10 '4 n= 1.07 1 .O6 1 .O5 - 1 .O4
-0.1
10 '1 0.3
2:: 0.2-
.o
• 0.1-
n' 0-
-0.1
10 '1
.5 [ ] ] [ [ • [ [ [ ] i [ [ ill ] [ [ [ [ [ •
b
bacteria
I I I I I I I tl I I I I t ill{ I I I I I I I I
100 101 102 I I
n'=10 -3 n= 1.07 1.06
1.05 -
1.04
bacteria
i i t i i /tl i i I I I ] I I I I I I I
100 101 102 ] • ] i • ] '11 • [ i i it[
.07
.06 _
.05
1.04
0.5
_
-0.5 10 -1
n'=O
n--
1.04 1.05 - 1.06 1.07
bacteria
i i t t i till i i i i i i i i I i i i i i i i i
100 101 102 Size parameter x
Fig. 5. Relative error in computation of n- 1 using the anomalous diffraction approximation as a function of a: and for different values of n.
bacteria
"[ ........ [ ...... of those observed for natural samples from the Southern California 10 ø 101 10 2 Bight and waters off the Scripps Institution of Oceanography Pier
Size parameter x [Fuhrman, 1981], as well as those from waters associated with a warm-core Gulf Stream ring [Ducklow, 1986]. They are slightly Fig. 4. Relative error in computation of n f using the van de Hulst approxi-
mation, for different values of n and for n f -- (a) 10 -4, (b) 10 -3, and (c) higher than those reported by Cho and Azam [ 1990] for the central 10 -2. North Pacific gyre and coastal waters off California and than those
two stations on Georges Bank, two stations in the Northeast Channel (Gulf of Maine), and one station in the Sargasso Sea are presented. They represent waters that varied over almost 2 orders of magnitude in their pigment concentration (see Figure 8a). Water samples were collected with 30-L Niskin bottles from different depths and were fixed with prefiltered formaldehyde (0.2-/tm pore size Nucleopore filters) to a final concentration of 2%, and stored at 4øC in the dark until further analysis. Pigment data and additional information are given by Irwin et al. [ 1990a, b].
In the laboratory, cells were stained with 4',6-Diamidino-2- phenylindole dihydrochloride hydrate, DAPI, according to Porter and Feig [ 1980] and filtered onto 0.2-ttm pore size black Nucle- opore filters using a vacuum at a pressure of <l.3x 10 4 Pa. The counting was performed with a Leitz Orthoplan epifluorescence mi- croscope under 1000x. Three slides per depth, with five to seven fields per slide, were counted using an ocular grid reticule. For the size determination, pictures (Kodak Ektachrome, P800/1600, slides) of randomly selected fields were taken. The slides were projected to a final magnification of 1500x. The images of the slide projection were captured with a video camera, and then dig- itized and processed with an Image Analyzer. A Newvicon tube camera and an Oculus-300 (Coreco Inc.) framegrabber video dig- itizer board were used in our case; otherwise, the configuration of the system was the same as the one described by Campana [ 1987]. The reported sizes correspond to the equivalent spherical diameter D derived from the measured projected areas.
Size and Optical Characteristics of Bacteria
A total of 32 bacterial size-spectra was examined (Table 2). The observed mean equivalent spherical diameter D varied between 0.50 and 0.65 ttm among samples. These values are within the range

ULLOA ET AL.: LIGHT SCATYERING BY MARINE BACTERIA 9625
TABLE 2. Bacterial Concentration and Size in Georges Bank (GB; 41ø43'N, 67ø 29'W), Northeast Channel (NC; 42ø20'N, 66ø4WW), and Sargasso Sea
(SS; 36ø02'N, 65ø09'W) During Summer 1988
Station Depth Bacterial No. D SD N
GB 1 Aug. 23
GB2 Aug. 24
NC1 Aug. 27
NC2 Aug. 28
SS1 Sept. 16
0 2.73 0.55 0.19 246 5 2.07 0.52 0.18 181
10 2.42 0.54 0.18 176 15 2.01 0.50 0.18 204 25 2.07 0.62 0.23 201 35 2.32 0.50 0.18 174
0 2.06 0.60 0.20 207 5 2.29 0.53 0.18 157
10 1.53 0.57 0.21 158 15 1.70 0.52 0.19 204 28 2.26 0.55 0.19 206 40 1.91 0.60 0.22 246
0 2.07 0.63 0.22 217 10 2.20 0.55 0.21 155 20 2.95 0.62 0.22 236 45 1.83 0.56 0.19 221 70 0.51 0.59 0.19 132 90 0.50 0.62 0.17 96
0 2.90 0.55 0.20 235 10 3.23 0.58 0.20 222 25 2.39 0.62 0.25 174 50 0.46 0.60 0.22 74 75 0.34 0.63 0.23 54
100 0.22 0.61 0.20 69
0 0.42 0.53 0.19 40 25 0.40 0.52 0.14 76 50 0.45 0.57 0.22 77 72 0.49 0.56 0.24 61
125 0.20 0.52 0.19 67 150 0.13 0.65 0.22 40 175 0.12 0.62 0.20 26 200 0.14 0.63 0.24 66
3
2
2
1
1
0
0
3.0
o
5
0
5
0
5
0
0.0 0.4 0.8 1.2
GB2
10 m
' 1 ' '
NC2
2.0 --
I .0 --
0.5 --
0.0
0.0 3.0
0.4 0.8 1.2
50 m
c ss1
2o
125 m
20-
1 5 -
1 0-
05-
O0 , , • 0.0 0.4 0.8 1.2 1.6 2.0
Equivolent Sphericol Diometer (/zm)
Fig. 6. Bacterial size distribution (probability density function) of a selected sample in (a) Georges Bank, (b) Northeast Channel, and (c) Sargasso Sea. The solid lines correspond to gamma distributions fitted to the data.
The concentration is expressed in units of 1012 cells m -3 and the depth in meters. D is the mean equivalent spherical diameter in micrometers over N observations, and SD is the standard deviation of the mean.
1.8
reported by Fuhrman et al. [1989] for the Sargasso Sea. As 1.5 compared with marine bacteria in culture, they are within the range reported by Strataski and Kiefer [ 1990], but they are lower than those reported by Robertson and Button [1989] and in the lower '-•1.2 end of the range reported by Morel and Ahn [ 1990]. --•
A selected example of size distribution at each sampling location is shown in Figure 6. The observed distributions agree well with --co 0.9 those previously published [Fuhrman, 1981' Robertson and Button, E 1989], and are believed to be representative of natural assemblages. Gamma distributions fitted to the data are also shown. Our data were better represented by gamma distributions than by lognormal (• 0.6 distributions (according to the chi-square test). Figure 7 shows a plot of length of the major axis versus length of the minor axis for all the data (N -- 4698). The ratio of these two variables is a measure 0.3 of the shape. For a sphere this ratio is 1. The frequency distribution and the cumulative frequency for the ratio of major axis to minor axis show that most bacteria (> 95%) have a length to width ratio of _< 2, and that more than half of them have a ratio of < 1.25. These results give an estimate of how closely the shape of bacteria in nature approaches a sphere.
The optical characteristics of bacteria for two wavelengths, A - 440 and 550 nm, are given in Table 3. They were obtained by
i i
0 • - 1 2 3 4
Ratio
I
lOO
E
I I
N=4698
0 0.3 0.6 0.9 1.2 1.5 1.8
Length of major axis (ILtm)
Fig. 7. Plot of length of the minor axis versus length of the major axis. The frequency distribution and the cumulative frequency for the ratio (ma- jor/minor) are given in the inset. This ratio is 1 for a sphere.

9626 ULLOA ET AL..' LIGHT SCATTERING BY MARINE BACTERIA
TABLE 3. Optical Characteristics of Heterotrophic Bacteria in Georges Bank, Northeast Channel, and Sargasso Sea at 440 and 550 nm Obtained Through Mie Computations Applied to the Observed Size Distributions, and Using a Refractive Index of (1.05 -- 0.0001 i)
,X --440nm )• = 550nm
Station Depth
GB1 0 0.208 0.961 0.151 0.162 0.697 0.0046 0.131 0.923 0.095 0.103 0.669 0.0071 5 0.201 0.951 0.098 0.098 0.466 0.0047 0.127 0.925 0.062 0.062 0.453 0.0073
10 0.211 0.947 0.133 0.129 0.597 0.0045 0.133 0.927 0.084 0.081 0.584 0.0070 15 0.180 0.960 0.080 0.085 0.426 0.0053 0.113 0.914 0.050 0.054 0.405 0.0081 25 0.282 0.973 0.202 0.216 0.696 0.0034 0.180 0.933 0.129 0.138 0.667 0.0052 35 0.182 0.942 0.092 0.099 0.478 0.0052 0.114 0.914 0.058 0.062 0.469 0.0080
GB2 0 0.261 0.967 0.173 0.167 0.641 0.0037 0.166 0.937 0.110 0.106 0.621 0.0056 5 0.199 0.950 0.113 0.115 0.538 0.0048 0.125 0.909 0.071 0.073 0.515 0.0073
10 0.252 0.967 0.111 0.113 0.424 0.0038 0.161 0.942 0.070 0.072 0.413 0.0059 15 0.201 0.966 0.075 0.086 0.361 0.0048 0.126 0.931 0.053 0.055 0.387 0.0074 28 0.221 0.990 0.133 0.134 0.597 0.0045 0.140 0.940 0.084 0.085 0.567 0.0067 40 0.277 0.983 0.171 0.172 0.607 0.0036 0.176 0.936 0.109 0.110 0.578 0.0053
NC1 0 0.288 0.987 0.205 0.214 0.704 0.0034 0.183 0.947 0.131 0.137 0.676 0.0052 10 0.234 0.984 0.141 0.148 0.591 0.0042 0.148 0.930 0.089 0.094 0.558 0.0063 20 0.286 0.972 0.288 0.292 0.976 0.0034 0.182 0.949 0.183 0.186 0.953 0.0052 45 0.215 0.961 0.108 0.115 0.483 0.0045 0.136 0.924 0.068 0.073 0.464 0.0068 70 0.243 0.969 0.038 0.037 0.153 0.0040 0.154 0.935 0.024 0.024 0.148 0.0061 90 0.225 0.989 0.036 0.039 0.156 0.0044 0.142 0.903 0.022 0.025 0.143 0.0063
NC2 0 0.228 0.976 0.177 0.183 0.760 0.0043 0.144 0.916 0.112 0.116 0.714 0.0064 10 0.243 0.960 0.230 0.237 0.909 0.0039 0.154 0.957 0.146 0.151 0.906 0.0062 25 0.322 0.986 0.270 0.278 0.826 0.0031 0.207 0.942 0.173 0.178 0.790 0.0046 50 0.264 0.938 0.039 0.042 0.146 0.0037 0.168 0.926 0.025 0.026 0.138 0.0055 75 0.304 0.979 0.036 0.037 0.117 0.0032 0.194 0.935 0.023 0.024 0.111 0.0048
100 0.254 0.966 0.018 0.019 0.070 0.0038 0.161 0.959 0.012 0.012 0.069 0.0059
SS1 0 0.199 0.946 0.020 0.022 0.097 0.0047 0.126 0.924 0.013 0.014 0.095 0.0074 25 0.167 0.954 0.015 0.015 0.086 0.0057 0.105 0.913 0.009 0.009 0.082 0.0087 50 0.277 0.994 0.036 0.035 0.128 0.0036 0.177 0.945 0.023 0.023 0.122 0.0053 72 0.285 0.990 0.040 0.042 0.138 0.0035 0.182 0.948 0.025 0.027 0.132 0.0052
125 0.221 0.972 0.011 0.010 0.049 0.0044 0.140 0.912 0.007 0.006 0.046 0.0065 150 0.308 0.977 0.015 0.015 0.046 0.0032 0.197 0.947 0.009 0.009 0.045 0.0048 175 0.265 0.940 0.010 0.011 0.037 0.0035 0.169 0.948 0.007 0.007 0.037 0.0056 200 0.311 1.002 0.016 0.016 0.051 0.0032 0.199 0.948 0.010 0.010 0.048 0.0048
The scattering coefficients obtained from the derived analytical expression (b•) are also given. The depth is in meters, bh and b• in reciprocal meters, and bbh in units of 10 -3 m -• .
numerical computations applying the Mie equations to the observed bacterial size distribution, as explained in the theoretical section (m = 1.05 - 0.0001i). Values of bn obtained from the derived analytical expression, (12), agree well with those obtained from the complete Mie computations. We preferred to report the results for the comparison when the observed mean and standard deviations of the size (Table 2) at each sampling depth are used to derive t, and r/ (equations (1 la) and (11 b)) rather than using t, and r/fitted directly to the data. The rationale for this choice was that in practice, size data are usually available in the literature as mean and standard deviation.
Contribution of Bacteria to Total Scattering and Backscattering
Figures 8 and 9 show comparisons between the scattering and backscattering coefficients due to bacteria (bn and bbn) and the total scattering and backscattering coefficients (b and b•), respectively, as derived from the pigment data. The values of ba and b•h at each depth are from Table 3. The total scattering coefficient (in reciprocal meters) at 550 nm was obtained from the empirical relationship [Gordon and Morel, 1983]
b[550]: 0.30(70'62 (17)
where (7 is the phytoplankton pigment concentration (chlorophyll a + phaeopigments) in milligrams per cubic meter (Figure 8a)• The
total backscattering coefficient was calculated according to Morel [19881:
b•[550] = 0.30Cø'62(2x 10⁻³+5 x 10⁻³(2-1ogC))+b,•o (18) where b•w is the molecular backscattering coefficient due to pure seawater at 550 nm, and equal to half of its molecular scattering coefficient, b•o. The value of b•o = 0.0019 m -• was obtained from Morel [ 1974].
From these results, the contribution of bacteria to the total scat- tering b would be on average around 10% in Georges Bank (range 7-17%) and the Sargasso Sea (range 3-16%), and 30% in the North- east Channel (range 9-57%). With respect to the total backscat- tering coefficient, the bacterial contribution would be on average around 7% in Georges Bank (range 5-9%), 12% in the Northeast Channel (range 3-22%), and 3% in the Sargasso Sea (range 1-4%).
The apparent higher contribution to b and bb by bacteria in the Northeast Channel, as compared with the other locations, can be explained by the observed high bacterial abundance in the low- chlorophyll, summer-stratified, surface waters. In Georges Bank, the total scattering coefficient, and therefore the total backscat- tering coefficient, are probably underestimated, since resuspended sediments are expected to be present in the water column. Their contribution is not taken into account by (17) and (18), which were derived for case 1 waters, i.e., waters where phytoplankton and their derivative products are believed to be the predominant components

ULLOA ET AL.: LIGHT SCATTERING BY MARINE BACTERIA 9627
C (mcj m -5)
10-2 10 -1 0
40-
80-
120 -
160 -
200 ]
100 101
a v• []
•o= • OB
b[550] (m -1 )
10 -5 10-2 0 i
b
10 -
20-
40-
10 -1 0 o
b[550] (m -1 )
10 -3 10 -2 0
20-
40-
80-
100 i
10 -1
40-
80-
120 -
b[550] (m -1)
10 -3 10 -2 1 O-1 10 ø
160 -
100 - 200 -
I I I
ß
ß
ß
ß
ß
Fig. 8. (a) Average vertical profiles of phytoplankton pigment concentra- tion C (chlorophyll a + phaeopigments) in Georges Bank (GB), Northeast Channel (NC), and Sargasso Sea (SS), and comparison between the scatter- ing coefficient at 550 nm due to pure seawater (dotted line), heterotrophic bacteria (symbols; squares represent station 1 and diamonds station 2), and the total scattering coefficient at the same wavelength (solid line) derived from the pigment data in (b) Georges Bank, (c) Northeast Channel, and (d) Sargasso Sea.
influencing the optical properties of the water body [Morel and Prieur, 1977; Gordon and Morel, 1983; Morel, 1988].
Kopelevich et al. [ 1987] postulated that the relative contribution of bacteria to the scattering of light would be directly related to their absolute concentration and that in oligotrophic waters their
contribution would be negligible. Strataski and Kiefer [ 1990], on the contrary, suggested that the contribution of bacteria would be more significant in oligotrophic waters, owing to their larger total cross section, as compared with phytoplankton. Morel and Ahn [ 1990], on the other hand, argued that their contribution would be independent of the trophic state, providing that there is a correlation between bacterial numbers and phytoplankton pigment concentra- tion.
Our results show that bacteria could contribute significantly to the total scattering coefficient in any of the three different environ- ments studied. However, their contribution would depend not so much on the trophic status of the ecosystem as on the local relative abundance (and optical properties) of each of the major components influencing the optical properties of the seawater. The stations that showed the highest contribution from bacteria to the total scattering were those in the Northeast Channel, which represent an interme- diate case between the phytoplankton-rich waters of Georges Bank and the oligotrophic waters of Sargasso Sea.
With respect to backscattering, the bacterial contribution to the total backscattering coefficient seems to be somewhat lower than for the total scattering coefficient, but nevertheless significant. How- ever, contrary to the case for (17), no empirical evidence has yet been given in support of (18), and therefore results from the compar- ison between bacterial backscattering and total backscattering are less certain. Moreover, theoretical and laboratory results [Morel and Bricaud, 1981b; Bricaud et al., 1983] show that phytoplank- ton have a very low backscattering ratio (•b < 0.1%), even lower than bacteria (see Table 3), which would weaken any relationship between total backscattering and pigment concentration. Notice, however, that in some cases (for example surface waters of the Northeast Channel) the backscattering due to bacteria is commen- surate with that due to pure seawater, which in turn has been shown to make a significant contribution to the total backscattering coef- ficient [Morel and Prieur, 1977].
Bacterial Scattering as a Function of Pigment Concentration
Several authors [Linley et al., 1983; Bird and Kalff, 1984; Cole et al., 1988; Cho and Azam, 1990] have found a significant pos- itive relationship between bacterial abundance and phytoplankton chlorophyll concentration in the euphotic zone of different aquatic ecosystems. These results have been combined with (17) and (18) to predict the bacterial scattering and backscattering coefficients from pigment concentration [Morel and Ahn, 1990, 1991].
However, new results, including some from the same cruise that yielded the bacterial data presented here [Li et al., 1992], show
bb[550] (m -1)
10 -4 10-3
10 -
20-
50-
40-
0-2 10-5
bb[550] (m -1 ) bb[550] (m -1 )
4O
10 -4 10 -3 10-2 i •1 _
i
ß
ß
'
8O
120
160
10-5
O
_
_
_
50 - 100 - 200 ß
10 -4 10-3 10 -2 • J I
ß
ß
ß
Fig. 9. Vertical profiles of the backscattering coefficients at 550 nm in (a) Georges Bank, (b) Northeast Channel, and (c) Sargasso Sea, derived from the pigment data in Figure 8a. Symbols and line types as in Figure 8 but for backscattering.

9628 ULLOA ET AL.: LIGHT SCATTERING BY MARINE BACTERIA
a high degree of scatter in the relation between bacteria and pig- ments within regions. For Georges Bank a regression of bacte- rial abundance on chlorophyll concentration gave an r 2 of 0.362 (N = 100), while for the Sargasso Sea the same procedure gave an r 2 of 0.194 (N = 62). When data from different cruises were com- bined (N = 364), only 29% of the variance in bacterial abundance could be explained by pigments (Figure 10). Other authors [e.g., Ducklow, 1986; McManus and Peterson, 1988; Karl et al., 1991] have also found correlations between bacterial abundance and pig- ment concentration to be weak. If bacteria contribute significantly to the total scattering, as the present evidence suggests, their lack of, or low correlation with, pigments would account for some of the variability observed for the relationship between total scattering and pigments [Gordon and Morel, 1983, Figure 5a].
CONCLUDING REMARKS
With the assumption that the scattering of light by heterotrophic bacteria obeys Mie theory and that marine bacteria can be char- acterized by a gamma size distribution, we have derived a simple expression for the scattering coefficient of bacterial assemblages as a function of size, concentration, and refractive index.
The concentration and size distribution of natural bacterial as-
semblages can be measured directly, but it is still a time-consuming procedure. Particularly promising in this respect is the application of automated techniques such as flow cytometry [Robertson and Button, 1989; Frankel et al., 1990], which allows the optical char- acterization and sizing of a large number of cells in a relatively short time. On the other hand, when the full bacterial size distribution is not available, the distribution can be modeled, as is shown here, using just the mean and the standard deviation. The simple expres- sion presented here for the bacterial scattering coefficient is easy to compute and provides results that are very close to the complete Mie solution for the range of a: values relevant to studies of bacteria.
The refractive index of marine bacteria has not yet been measured directly, but only deduced from optical measurements on laboratory cultures [Morel and Ahn, 1990; Strataski and Kiefer, 1990], an approach which in turn is subject to some error, as was shown
1013
•.-. 1012 E
• 011 rn I
y=7.67x 10 TM X 0'400 r2=0.29 N=364
101o t I I 10 -2 10 -1 10 o 101 102
Chlorophyll (mg m '3) Fig. 10. Bacterial abundance versus chlorophyll concentration from dif- ferent cruises in the western North Atlantic. The straight dashed line cor- responds to the geometric mean model II regression. Data from Li et al. [1992].
in the theoretical section. Flow cytometry has also been used to derive the refractive index of marine particulates [Ackleson and Spinrad, 1988] and could be used in the case of marine bacteria. This approach, however, also relies a priori on the Mie theory. We admit that assigning a single refractive index to bacteria in nature, as was done in this study, may be an oversimplification. Note, however, that the application of Mie theory is not limited to a single refractive index and that the approach presented here is easily applicable to the case of bacterial assemblages with multiple refractive indices.
From a theoretical point of view, we have shown that van de Hulst [ 1957] approximations cannot always be used to describe the scattering of light by natural bacterial assemblages, because their characteristic size-parameter range lies, in part, outside the range for which the approximation is valid. Modem computers allow the application of the more complete and strict Mie theory, which has been shown to explain well the experimental observations on light scattering by bacterial suspensions [e.g., Petukhov, 1965; Shirnizu and Ishimaru, 1978].
By examining new data on bacterial abundance versus pigment concentration, we conclude that although a positive relationship may exist sometimes between bacterial abundance and pigment concentration when comparisons are made across ecosystems [Bird and Kalff, 1984], this is not always the case. Moreover, looking at the relationship within ecosystems, it seems difficult to predict bacterial numbers from pigment data, and thus to derive the optical properties of bacteria relying on pigment data. This conclusion emphasizes the utility of using field data on bacterial abundance, as we have done here, to calculate their contribution to scattering.
The results presented here can be applied to a variety of prob- lems such as modeling light penetration in the ocean [e.g., Morel, 1988; Sathyendranath and Platt, 1988], interpretation and mod- eling of ocean color for remote sensing [e.g., Gordon and Morel, 1983; Gordon et al., 1988], and the assessment of primary pro- duction by remote sensing [Platt and Sathyendranath, 1988] or by measurements of in situ optical properties such as the attenuation coefficient [Siegel et al., 1989]. In none of these subjects, so far, has the independent role of heterotrophic bacteria been taken into account.
Acknowledgments. The work presented in this paper was supported by the Office of Naval Research, the National Aeronautics and Space Admin- istration, and the Department of Fisheries and Oceans, Canada. Additional support was provided by the International Development Research Centre (Canada) to O.U. and R.Q., and by the Natural Sciences and Engineer- ing Research Council through operating grants to S.S. and T.P. We thank W.K.W. Li for the data on the relationship between bacteria and chlorophyll and D. Strumski, C.S. Yentsch, G.N. White III, and O.T. Brown for helpful comments on the original manuscript.
REFERENCES
Ackleson, S. G., and R. W. Spintad, Size and refractive index of individual marine particulates: A flow cytometric approach, Appl. Opt., 27, 1270- 1277, 1988.
Bateman, J. B., J. Wagman, and E. L. Carstensen, Refraction and absorption of light in bacterial suspensions, Kolloid Z. Z. Polym., 208, 44-58, 1966.
Bird, D. F., and J. Kalff, Empirical relationships between bacterial abun- dance and chlorophyll concentration in fresh and marine waters, Can. J. Fish. Aquat. Scœ, 41, 1015-1023, 1984.
Bohren, C. F., and D. R. Huffman, Absorption and Scattering of Light by Small Particles, 530 pp., John Wiley, New York, 1983.
Bricaud, A., and A. Morel, Light attenuation and scattering by phytoplank- tonic cells: a theoretical modeling, Appl. Opt., 25, 571-580, 1986.
Bricaud, A., A. Morel, and L. Prieur, Optical efficiency factors of some phytoplankters, Limnol. Oceanogr., 28, 816-832, 1983.
Brown, O. T., and H. R. Gordon, Two component Mie scattering models of Sargasso Sea particles, Appl. Opt., 12, 2461-2465, 1973.
Brown, O. T., and H. R. Gordon, Size-refractive index distribution of clear

ULLOA ET AL.: LIGHT SCATTERING BY MARINE BACTERIA 9629
coastal water particulates from light scattering, Appl. Opt., 13, 2874- 2881, 1974.
Bryant, F. D., B. A. Seiber, and P. Latimer, Absolute optical cross sections of cells and chloroplasts, Arch. Bitchera. Bitphys., 135, 97-108, 1969.
Campana, S. E., Image analysis for microscope-based observations: An inexpensive configuration, Can. Tech. Rep. Fish. Aquat. Sci., 1569, iv+20 pp., 1987.
Cho, B.C., and F. Azam, Bitgeochemical significance of bacterial biomass in the ocean's euphotic zone, Mar. Ecol. Prog. Ser., 63, 253-259, 1990.
Ch•lek, P., Mie scattering in the backward hemisphere, J. Opt. Soc. Am., 63, 1467-1471, 1973.
Cole, J. J., S. Findlay, and M. L. Pace, Bacterial production in fresh and salt water ecosystem: A cross-system overview, Mar. Ecol. Prog. Ser., 43, 1-10, 1988.
Deirmendjian, D., Electromagnetic Scattering on Spherical Polydispersions, Elsevier, New York, 1969.
Ducklow, H., Bacterial biomass in warm-core Gulf Stream ring 2-B: Mesoscale distribution, temporal changes and production, Deep Sea Res., 33, 1789-1812, 1986.
Duysens, L. N.M., The flattening of the absorption spectrum of suspensions, as compared to that of solutions, Bitchira. Bitphys. Acta, 19, 1-12,1956.
Frankel, S. L., B. J. Binder, S. W. Chisholm, and H. M. Shapiro, A high- sensitivity flow cytometer for studying pictplankton, Linlnol. Oceanogr., 35, 1164-1169, 1990.
Fuhrman, J. A., Influence of method on the apparent size distribution of bac- terioplankton cells: Epiflurescence microscopy compared to scanning electron microscopy, Mar Ecol. Prog. Ser. 5, 103-106, 1981.
Fuhrman, J. A., T. D. Sleeter, D. A. Carlson, and L. M. Proctor, Dominance of bacterial biomass in the Sargasso Sea and its ecological implications. Mar. Ecol. Prog. Ser., 57, 207-217, 1989.
Gordon, H. R., and O. T. Brown, A theoretical model of light scattering by Sargasso Sea particulates, Limnol. Oceanogr., 17, 826-832, 1972.
Gordon, H. R., and A. Y. Morel, Remote Assessment of Ocean Color for Interpretation of Satellite Visible Imagery: A Review, 114 pp., Springer- Verlag, New York, 1983.
Gordon, H. R., O. B. Brown, R. H. Evans, J. W. Brown, R. C. Smith, K. S. Baker, and D. K. Clark, A semianalytic radiance model of ocean color, J. Getphys. Res., 93, 10,909-10,924, 1988.
GLide, H., The role of grazing on bacteria in plankton succession, in Plankton Ecology: Succession in Plankton Communities, edited by U. Sommer, pp. 337-364, Springer-Verlag, New York, 1989.
Irwin, B., J. Anning, C. Caverhill, M. Hodgson, A. Macdonald, and T. Platt, Primary production on Georges Bank--August 1988, Can. Data Rep. Fish. Aquat. Sci., 785, iv+197 pp., 1990a.
Irwin, B., J. Anning, C. Caverhill, M. Hodgson, A. Macdonald, and T. Platt, Primary production in the northern Sargasso Sea in September 1988, Can. Data Rep. Fish. Aquat. Sci., 798, iv+93 pp., 1990b.
Jerlov, N. G., Marine Optics, Elsevier, New York, 1976. Karl, D. M., O. Holm-Hansen, G. T. Taylor, G. Tien, and D. F. Bird,
Microbial biomass and productivity in the western Bransfield Strait, Antarctica during the 1986-87 austral summer, Deep SeaRes., 38, 1029- 1055, 1991.
Kirk, J. T. O., Light and Photosynthesis in Aquatic Ecosystems, Cambridge University Press, New York, 1983.
Koch, A. L., Theory of the angular dependance of light scattered by bacteria and similar-sized objects, J. Theor. Biol., 18, 133-156, 1968.
Kogure, K., and I. Koike, Particle counter determination of bacterial biomass in seawater, Appl. Environ. Microbiol., 53, 274-277, 1987.
Kopelevich, O. V., V. V. Rodionov, and T. P. Stupakova, Effect of bacteria on optical characteristics of ocean water, Oceanology, Engl. Trans., 27, 696-700, 1987.
Li, W. K. W., P.M. Dickie, B. D. Irwin, and A.M. Wood, Biomass of bacteria, cyanobacteria, prochlorophytes and photosynthetic eukaryotes in the Sargasso Sea, Deep Sea Res., 39, 501-519, 1992.
Linley, E. A. S., R. C. Newell, and M. I. Lucas, Quantitative relationships between phytoplankton, bacteria and heterotrophic microflagellates in shelf waters, Mar. Ecol. Prog. Ser., 12, 77-89, 1983.
McManus, G. B., and W. T. Peterson, Bacterioplankton production in the nearshore zone during upwelling off central Chile, Mar. Ecol. Prog. Ser., 43, 11-17, 1988.
Mie, G., Beitrage zur Optik trtiber Medien, Speziell kolloidalen Met- al10sungen, Ann. Phys., 25, 377-445, 1908.
Moore, D. M., F. D. Bryant, and P. Latimer, Total scattering and absorption by spheres where m -- 1. J. Opt. Soc. Ant., 58, 281-283, 1968.
Morel, A., Diffusion de la lumii•re par les eaux de mer, Rtsultats exptrimentaux et approche th6orique, in Optics of the Sea, AGARD Lect. Ser., vol. 61, pp. 3.1.01-3.1.76, Advisory Group for Aeronautical Research and Development, NATO, Brussels, 1973.
Morel, A., Optical properties of pure water and pure sea water, in Optical Aspects of Oceanography, edited by N. G. Jerlov and E. Steemann Nielsen, pp. 1-24, Academic, San Diego, Calif., 1974.
Morel, A., Optical modelling in the upper ocean in relation to its biogeneus matter content (Case I waters), J. Getphys., Res. 93, 10,749-10,768, 1988.
Morel, A., and Y.-H. Ahn, Optical efficiency factors of free-living marine bacteria: Influence of bacterioplankton upon the optical properties and particulate organic carbon in oceanic waters, J. Mar. Res., 48, 145-175, 1990.
Morel, A., and Y.-H. Ahn, Optics of heterotrophic nanoflagellates and ciliates: A tentative assessment of their scattering role in oceanic waters compared to those of bacteria and algal cells, J. Mar. Res., 49, 177-202, 1991.
Morel A., and A. Bricaud, Theoretical results concerning light absorption in a discrete medium, and application to specific absorption of phyto- plankton, Deep Sea Res., 28, 1375-1393, 1981a.
Morel, A., and A. Bricaud, Theoretical results concerning the optics of phytoplankton, with special reference to remote sensing applications, in Oceanography From Space, edited by J. F. R. Gower, pp. 313-327, Plenum, New York, 1981b.
Morel, A., and A. Bricaud, Inherent optical properties of algal cells including picoplankton: Theoretical and experimental results, Can. Bull Fish. Aquat. ScL, 214, 521-559, 1986.
Morel, A., and L. Prieur, Analysis of variations in ocean color, Limnol. Oceanogr., 22, 709-722, 1977.
Petukhov, V.G., The feasibility of using the Mie theory for the scattering of light from suspensions of spherical bacteria (in Russian), Biofizika, 10, 993-999, 1965.
Platt, T., and S. Sathyendranath, Oceanic primary production: Estimation by remote sensing at local and regional scales, Science, 241, 1613-1620, 1988.
Porter, K. G., and Y. S. Feig, The use of DAPI for identifying and counting aquatic microflora, Limnol. Oceanogr., 25, 943-948, 1980.
Preisendorfer, R. W., Application of radiative transfer theory to light mea- surements in the sea, Monogr. 10, pp. 11-30, Int. Union. of Geod. and Getphys., Paris, 1961.
Robertson, B. R., and D. K. Button, Characterizing aquatic bacteria ac- cording to population, cell size, and apparent DNA content by flow cytometry, Cytometry, 10, 70-76, 1989.
Sathyendranath, S., and T. Platt, The spectral irradiance field at the surface of the ocean: A model for application in oceanography and remote sensing, J. Getphys. Res., 93, 9270-9280, 1988.
Shimizu, K., and A. Ishimaru, Scattering pattern analysis of bacteria, Opt. Eng., 17, 129-134, 1978.
Siegel, D. A., T. D. Dickey, L. Washburn, M. K. Hamilton, and G. G. Mitchel, Optical determination of particulate abundance and production variations in the oligotrophic ocean, Deep Sea Res. 36, 211-222, 1989.
Spintad, R. W., H. Glover, B. B. Ward, L. A. Codispoti, and G. Kullen- berg, Suspended particle and bacteria maxima in Peruvian coastal waters during a cold water anomaly, Deep Sea Res., 36, 715-733, 1989a.
Spintad, R. W., C. M. Yentsch, J. Brown, Q. Dortch, E. Haugen, N. Reve- lante, and L. Shapiro, The response of beam attenuation to heterotrophic growth in a natural population of plankton, Limnol. Oceanogr., 34, 1601- 1605, 1989b.
Stramski, D., and D. A. Kiefer, Optical properties of marine bacteria, Proc. Soc. Photo. Opt. Instrum. Eng., Ocean Opt. X, 1302, 250-268, 1990.
Stramski, D., and A. Morel, Optical properties of photosynthetic pictplank- ton in different physiological states as affected by growth irradiance, Deep Sea Res., 37, 245-266, 1990.
Stramski, D., A. Morel, and A. Bricaud, Modeling the light attenuation by spherical phytoplanktonic cells: A retrieval of the bulk refractive index, Appl. Opt., 27, 3954-3956, 1988.
van de Hulst, H. C., Light Scattering by Small Particles, 470 pp., John Wiley, New York, 1957.
Yentsch, C. S., Measurements of visible light absorption by particulate matter in the ocean, Limnol. Oceanogr., 7, 207-217, 1962.
T. Platt, Biological Oceanography Division, Bedford Institute of Oceanography, P.O. Box 1006, Dartmouth, Nova Scotia, Canada B2Y 4A2.
R. A. Quifiones, Department of Biology, Dalhousie University, Halifax, Nova Scotia, Canada B3H 4J1.
S. Sathyendranath and O. Ulloa, Department of Oceanography, Dal- housie University, Halifax, Nova Scotia, Canada B3H 4J1.
(Received September 4, 1991; revised March 27, 1992; accepted April 7, 1992.)