Multiple-Scattering Suppression by Cross Correlation
9
Cleveland State University EngagedScholarship@CSU Physics Faculty Publications Physics Department 10-20-1997 Multiple-Scaering Suppression by Cross Correlation William V. Meyer David S. Cannell Anthony E. Smart omas W. Taylor Cleveland State University, [email protected] Padetha Tin Publisher's Statement is paper was published in Applied Optics and is made available as an electronic reprint with the permission of OSA. e paper can be found at the following URL on the OSA website: hp://www.opticsinfobase.org/ao/ abstract.cfm?URI=ao-36-30-7551. Systematic or multiple reproduction or distribution to multiple locations via electronic or other means is prohibited and is subject to penalties under law. Repository Citation Meyer, William V.; Cannell, David S.; Smart, Anthony E.; Taylor, omas W.; and Tin, Padetha, "Multiple-Scaering Suppression by Cross Correlation" (1997). Physics Faculty Publications. Paper 107. hp://engagedscholarship.csuohio.edu/sciphysics_facpub/107 is Article is brought to you for free and open access by the Physics Department at EngagedScholarship@CSU. It has been accepted for inclusion in Physics Faculty Publications by an authorized administrator of EngagedScholarship@CSU. For more information, please contact [email protected]. Original Citation Meyer, William V., David S. Cannell, Anthony E. Smart, omas W. Taylor, and Padetha Tin. "Multiple-Scaering Suppression by Cross Correlation." Applied Optics 36 (1997): 7551-7558.
-
Upload
independent -
Category
Documents
-
view
5 -
download
0
Transcript of Multiple-Scattering Suppression by Cross Correlation
Cleveland State UniversityEngagedScholarship@CSU
Physics Faculty Publications Physics Department
10-20-1997
Multiple-Scattering Suppression by CrossCorrelationWilliam V. Meyer
David S. Cannell
Anthony E. Smart
Thomas W. TaylorCleveland State University, [email protected]
Padetha Tin
Publisher's StatementThis paper was published in Applied Optics and is made available as an electronic reprint with the permission of OSA.The paper can be found at the following URL on the OSA website: http://www.opticsinfobase.org/ao/abstract.cfm?URI=ao-36-30-7551. Systematic or multiple reproduction or distribution to multiple locations viaelectronic or other means is prohibited and is subject to penalties under law.
Repository CitationMeyer, William V.; Cannell, David S.; Smart, Anthony E.; Taylor, Thomas W.; and Tin, Padetha, "Multiple-Scattering Suppression by Cross Correlation"(1997). Physics Faculty Publications. Paper 107.http://engagedscholarship.csuohio.edu/sciphysics_facpub/107
This Article is brought to you for free and open access by the Physics Department at EngagedScholarship@CSU. It has been accepted for inclusion inPhysics Faculty Publications by an authorized administrator of EngagedScholarship@CSU. For more information, please [email protected].
Original CitationMeyer, William V., David S. Cannell, Anthony E. Smart, Thomas W. Taylor, and Padetha Tin. "Multiple-Scattering Suppression byCross Correlation." Applied Optics 36 (1997): 7551-7558.

Multiple-scattering suppression by cross correlation
William V. Meyer, David S. Cannell, Anthony E. Smart, Thomas W. Taylor, andPadetha Tin
We describe a new method for characterizing particles in turbid media by cross correlating the scatteredintensity fluctuations at two nearby points in the far field. The cross-correlation function selectivelyemphasizes single scattering over multiple scattering. The usual dynamic light-scattering capability ofinferring particle size from decay rate is thus extended to samples that are so turbid as to be visuallyopaque. The method relies on single-scattering speckle being physically larger than multiple-scatteringspeckle. With a suitable optical geometry to select nearby points in the far field or equivalently slightlydifferent scattering wave vectors ~of the same magnitude!, the multiple-scattering contribution to thecross-correlation function may be reduced and in some cases rendered insignificant. Experimentalresults demonstrating the feasibility of this approach are presented. © 1997 Optical Society of America
Key words: Particle sizing, dynamic light scattering, cross correlation, multiple-scattering suppres-sion, static light scattering.
1. Introduction
Dynamic light scattering is a powerful experimentaltechnique for characterizing small particles sus-pended in a fluid. For example, light scattered froma collection of colloidal particles and detected at apoint in the far field fluctuates in time as the sus-pended particles diffuse. The intensity autocorrela-tion function is determined by the diffusioncoefficient of the particles, which in turn depends ontheir diameter. In practice, measurement of the au-tocorrelation function is the most accurate and reli-able method for determining the diffusion coefficientand hence the diameter of particles in suspension.The accuracy available in a reasonable measurementtime is typically ;1% or a little better. This tech-nique may be applied to particle sizes extending froma few tens of angstroms typical of small proteins up tomicrometers typical of large colloids.
In colloidal suspensions that are sufficiently con-
centrated to appear opaque and in some cases trans-lucent, significant light is multiply scattered,severely distorting the correlation function and com-promising the applicability of this technique. Thisdifficulty can be overcome with the two-beam cross-correlation technique invented by Phillies1,2 and ex-tended by others.3–5 This technique relies on therelationship ks 2 ki 5 q that connects the wavevectors ki of the incident light and ks of the scatteredlight with the wave vector q of the fluctuation respon-sible for the scattering. The outputs of two opticalsystems, each consisting of a laser beam, a detector,and the necessary optics, which are arranged to col-lect light scattered by fluctuations of wave vectors qand 2q, are strongly correlated with regard to onlysingle scattering. The multiply scattered light ismuch less strongly cross correlated. Consequently,if one measures the temporal cross-correlation func-tion ^iA~t 1 t!iB~t!& of the two detector outputs iA~t!and iB~t!, the result contains the same information aswould normally be obtained by a measurement of theautocorrelation function of singly scattered light.Alternatively, in the strong scattering limit, one maydeduce useful information directly from the autocor-relation function of the multiply scattered light.6–8
Despite its appeal, Phillies’ technique has not beenextensively used in practice. Believing this to berelated to the difficulty and the expense of themethod, we have been motivated to explore a new andsimpler cross-correlation geometry.9,10 Our basicidea is simple. Single scattering can be arranged tocome from a tightly focused incident beam, whereas
W. V. Meyer and P. Tin are with the Ohio Aerospace Institute,NASA Lewis Research Center, M.S. 105-1, 21000 Brookpark Road,Cleveland, Ohio 44135-3191. D. S. Cannell is with the Depart-ment of Physics, University of California Santa Barbara, SantaBarbara, California 93106-9530. A. E. Smart’s permanent ad-dress is 2854 Europa Drive, Costa Mesa, California 92626-3525.T. W. Taylor is with the Department of Physics, Cleveland StateUniversity, Cleveland, Ohio 44115-2440.
Received 26 March 1997; revised manuscript received 28 May1997.
0003-6935y97y307551-08$10.00y0© 1997 Optical Society of America
20 October 1997 y Vol. 36, No. 30 y APPLIED OPTICS 7551

multiple scattering tends to arise from a larger fuzzysort of halo around the incident beam. Thus we ex-pect the time-dependent speckle field correspondingto single scattering to have high spatial coherenceover a larger region than does the speckle field ofmultiply scattered light. More specifically, if atightly collimated beam of diameter d passes througha sample, the resulting speckle is correlated in thedirection transverse to the beam over an angularrange of the order of ~lyd! and thus over a distance ofthe order of ~lyd!R, a distance R from the beam.Because multiple scattering originates from a sourceof larger diameter, it is correlated over only a smallerdistance transverse to the beam direction. By col-lecting light from two locations slightly separated inthe direction transverse to the beam, we have shownthat it is possible to strongly favor single scatteringover multiple scattering by cross correlating the twodetector outputs. A simple physical interpretationis that the singly scattered light produces specklelarger than the separation of the two points fromwhich the light is collected, whereas the speckle frommultiple scattering is much smaller than the separa-tion. Equivalently, one may view the two collectionpoints as being separated by a small angle du in thedirection transverse to the beam. When du is keptless than or comparable with ~lyd!, strong preferen-tial cross correlation of single scattering is achieved.
We have demonstrated this effect with two opticalfibers whose cores were separated by ;0.25 mm at170 mm from the sample ~du 5 1.5 mrad! to collectlight and convey it to two separate detectors. Wefind that the cross-correlation function measured un-der these conditions gives useful information aboutthe particle diameter, even for suspensions that scat-ter so strongly as to be visually opaque.9,10
A theoretical analysis is provided as the subject ofanother paper in this volume.11
2. Experimental Method
Our experimental arrangement is shown schemati-cally in Fig. 1. The cylindrical sample cells were10.1-mm inner-diameter glass test tubes of 11.6-mmouter diameter held rigidly on the axis of a cylindricalglass vat containing either water or decalin as the
index-matching fluid. The vat had an inner diame-ter of 80 mm and an outer diameter of 84.6 mm.Light from an argon-ion laser of vacuum wavelengthl0 5 514.5 nm was brought to a focus near the axis,with a 1ye2 diameter of ;88 mm by a lens of 100-mmfocal length. The beam entered the vat through asmall polished flat area ~not shown in Fig. 1!. Be-cause the samples were suspensions of colloidal par-ticles in water, some distortion of the focus occurredon the beam’s entering the sample cell when decalin~refractive index 1.48! was used as the matchingfluid, but this had no observable effect on the results.Better optics may be envisaged with a square cuvettebut do not affect the conclusions reported here.
To collect scattered light from two nearby points inthe far field, we arranged the polished ends of twooptical fibers, which are single mode for 633 nm sothat the cores were 0.25 mm apart. We placed theend of this fiber pair 170 mm from the system axis,just above the horizontal plane containing the inci-dent beam. This distance was chosen to minimize qspreading. At this position all light scattered at agiven angle is mapped by refraction at the cell andvat surfaces to a thin vertical line. Thus, despitetheir wide field of view, the fibers each accept lightthat corresponds to a well-defined scattering angle.The fibers were oriented one above the other, that is,separated in the direction transverse to the beam, thedirection in which the single-scattering speckle islarge. Being slightly above the plane reduced theflare effects of multiple internal reflections for thisgeometric configuration. Flare effects are more se-rious at the lower concentrations but they are oflesser interest here. Given a beam diameter of 88mm, the vertical extent of the single-scatteringspeckle should be of the order of ~l0yd!R > 1.0 mm ata distance of 170 mm. Consequently the two fibers,separated by only 0.25 mm, should collect light that iswell correlated, provided it originates only within theincident focused beam. For our geometry, the scat-tered light consists of small speckles that are muchtaller than they are wide. We may estimate the hor-izontal extent of the speckle as equal to thediffraction-limited spot size of the 13-cm focal-lengthcylindrical vat illuminated by a 1-cm-wide beam.This results in speckle widths comparable with thefiber core diameter of 5 mm.
The scattered intensity at a given point varies con-tinually in time as the particles diffuse. Because thetwo fibers often lie within a single speckle, the opticalpowers they each collect tend to be correlated. Care-ful visual observation of samples that exhibit multi-ple scattering reveals an apparent bright line~scattered light emerging directly from the beam it-self ! lying within a much larger and more diffuseregion. This diffuse source is light that has beenscattered out of the illuminating beam and has sub-sequently been rescattered one or more times, withthe final scattering event directing it into the eye.Because this source appears larger than the beam, weexpect it to produce speckle that is much shortervertically than the 0.25-mm separation of the fibers
Fig. 1. Optical geometry used to verify the concept of multiple-scattering suppression by spatial cross correlation. APD’s, ava-lanche photodiodes.
7552 APPLIED OPTICS y Vol. 36, No. 30 y 20 October 1997

and thus to contribute little to the cross correlation ofoptical powers collected by the two fibers. Becauseboth the single- and the multiple-scattering sourceshave approximately the same dimension parallel tothe incident beam, we would not expect to discrimi-nate single scattering were the fibers separated hor-izontally rather than vertically.
We have not yet attempted to optimize the fiberspacing chosen by using the rough criteria describedabove. No single optimum spacing ~angular separa-tion! may exist that is independent of the sample.The multiple-scattering speckle size is determined bythe intensity distribution of the multiple-scatteringsource by means of the van Cittert–Zernike theo-rem.12 This source dimension in turn depends onnot only the optical geometry, but also on the mag-nitude and the angular dependence of the sample’sscattering cross-section. Thus from a practical pointof view optimization will also probably depend on thenature and the concentration of the sample. See,however, the paper by Nobbmann et al.13 in this fea-ture that reports results obtained with this methodbut with variable fiber spacing.
The light collected by each fiber was delivered to anactively quenched silicon avalanche photodiode~EG&G Optoelectronics Canada, Model SPCM-AQ-141-FL! capable of single photon counting. Thesedetectors produce ;10-ns transistor–transistor logiclevel pulses at rates proportional to the instanta-neous optical power reaching each detector. The re-sulting pulse streams nA~t! and nB~t! were fed to aBrookhaven Instruments Model BI-9000AT digitalcorrelator that can compute either the temporal au-tocorrelation function
G~t! 5 ^n~t 1 t!n~t!& (1)
for either pulse stream or the temporal cross-correlation function
GAB~t! 5 ^nA~t 1 t!nB~t!& 5 ^nB~t 1 t!nA~t!& (2)
for both.The correlator determines the number of counts
received during each interval ~t, t 1 T!, which wehave denoted by n~t! in Eqs. ~1! and ~2!. By simul-taneously forming the products of the current n valueand the n values corresponding to 256 different delaytimes t and accumulating these products for a suffi-cient time, we can form an acceptably accurate mea-surement of either G~t! or GAB~t!.
The nominally 107- or 204-nm-diameter particlesamples obtained from Bangs Laboratories were sus-pensions of polystyrene latex spheres in distilled wa-ter. We show data with concentrations that rangefrom 0.0017 wt. % to as high as 5 wt. % in some cases.We initially measured particle diameters for dilutesuspensions that were essentially free from multiplescattering by using conventional optics at a 90° scat-tering angle. The extremely dilute samples scat-tered so little light compared with residual flare thatmore consistent measurements were obtained from0.01-wt. % samples that were still essentially trans-
parent. Samples of different concentrations wereprepared by the dilution of a suspension of polysty-rene latex spheres, supplied at a nominal concentra-tion of 10 wt. %, determined by the manufacturer byevaporation to dryness and stated to vary by as muchas 610%. The diluent was distilled water filteredwith a pore size of 0.22 mm to remove dust. It wasnot found necessary to filter the samples further afterdilution. The specimen tubes were rinsed with sim-ilarly filtered water before charging and sealing withpolyethylene stopper plugs or parafilm.
3. Results
To quantify the way multiple scattering affects theautocorrelation function, we measured G~t! for anumber of suspensions of the nominally 107-nm-diameter spheres with concentrations ranging from0.0017 wt. % initially up to 1 wt. %. The measure-ments were made at a 90° scattering angle with oneof the two optical fibers to collect the scattered light.Results for the normalized autocorrelation functions@G~t!yB 2 1# versus correlator delay time t are shownon a semilog plot in Fig. 2 for six different concentra-tions. Figure 2 was prepared with baseline values Bdetermined by the fitting of a single exponential inwhich intercept, baseline, and exponential coefficientwere all allowed to float. Typically the fitted base-line and the baseline calculated within the correlatorfrom the sample time and actual number of pulsesreceived agreed to within a few tenths of a percent orbetter. As we see below, this difference should notbe ignored for the later cross-correlation functionsfrom which it is possible to extract good size mea-surements even when the zero-delay time interceptbecomes extremely small.
For monodisperse samples of sufficiently low con-centration such that they are free from multiple scat-tering, plots such as those shown in Fig. 2 should belinear, and indeed those corresponding to the twolowest concentrations appear nearly so. Examining
Fig. 2. Normalized autocorrelation functions for increasing con-centrations of nominally 107-nm-diameter polystyrene latexspheres in aqueous suspension.
20 October 1997 y Vol. 36, No. 30 y APPLIED OPTICS 7553

the autocorrelation functions of the higher concentra-tion samples reveals that G~t! becomes increasinglynonexponential. The rapid initial decay evident forthe 0.5- and 1.0-wt. % samples is characteristic ofstrong multiple scattering,6–8 supported by the obvi-ous visual opacity of the samples.
Cross-correlation functions GAB~t! for the samesamples were measured with each of the fibers tocollect the scattered light at points separated verti-cally by 0.25, 0.50, and 0.75 mm. No significant de-pendence of decay time on fiber spacing was observed.All the results presented in this paper were obtainedwith a 0.25-mm fiber spacing. Some of these mea-surements are presented in Fig. 3, which shows@GAB~t!yB 2 1# versus correlator delay time t on asemilog plot. Because the decaying portion of GAB~t!is only a small fraction of the baseline B for the cross-correlation data, especially for the higher-concentration samples, we determined B for eachdata set by fitting to a single exponential decay plusa baseline. That the curves of @GAB~t!yB 2 1# pre-sented in Fig. 3 are linear to within experimentalaccuracy shows that the cross-correlation data for allthe concentrations studied are consistent with singleexponential decay. This is in marked contrast withthe results for the autocorrelation measurementsshown in Fig. 2, which clearly contain a broad spec-trum of decay rates for the higher concentration sam-ples.
Quantitative analysis of the data was performed onthe measured cross-correlation and autocorrelationfunctions by the two-cumulant expansion,
GAB~t! 5 A expF22SK1t 2K2
2t2DG 1 B, (3)
where A, B, K1, and K2 are adjustable. This methodof analysis is commonly used for polydisperse sam-ples that exhibit a range of decay rates, as do our
autocorrelation functions. We related the first cu-mulant to an effective diffusion coefficient14 D by
K1 5 Dq2, (4)
where q is the magnitude of the scattering wave vec-tor given by
q 54pnl0
sinSu
2D . (5)
Here n is the refractive index of the suspension and uis the scattering angle. We obtained an apparentparticle diameter from
D 5kBT
6pha, (6)
where kB is Boltzmann’s constant, T is the absolutetemperature, h is the viscosity, and a is the apparentparticle radius. The results of this analysis aresummarized in Fig. 4, which presents the apparentparticle diameter versus sample concentration derivedfrom both the autocorrelation and cross-correlationfunctions. The results from autocorrelation and crosscorrelation agree reasonably well at the lowest con-centrations, but disagree seriously for the higher-concentration samples. Two main conclusions canbe drawn from Fig. 4. First, multiple scattering canso severely distort autocorrelation function data as toresult in apparent particle diameters more than anorder of magnitude smaller than the true diameter.Second, the simple artifice of cross correlating thescattered intensity at two nearby points virtuallyeliminates this effect.
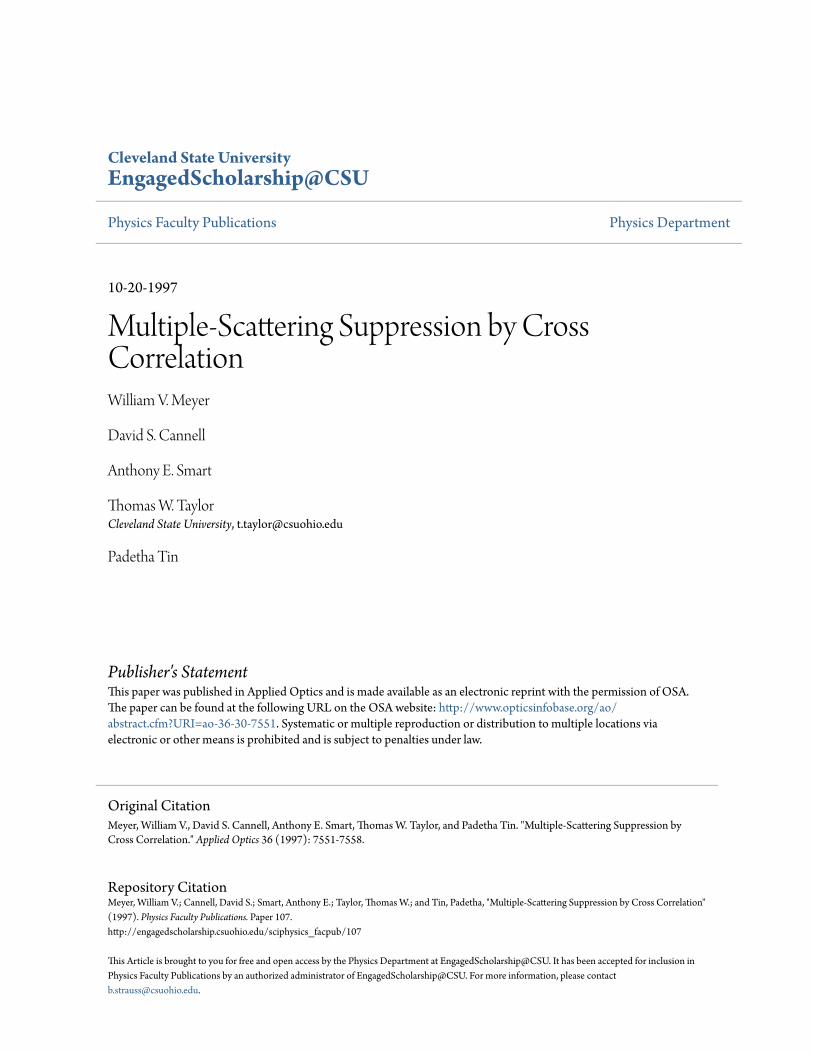
Further results from the data analysis are shownin Fig. 5, which displays the zero-delay time interceptfor each correlation function analyzed to produce theresults already shown in Fig. 4. Here we see that,while the autocorrelation intercept changes little forthe more concentrated samples, the intercept forcross correlation falls steeply. This occurs because a
Fig. 3. Normalized cross-correlation functions for increasing con-centrations of nominally 107-nm-diameter polystyrene latexspheres in aqueous suspension.
Fig. 4. Particle diameter inferred from autocorrelation and cross-correlation functions by a two-cumulant fit.
7554 APPLIED OPTICS y Vol. 36, No. 30 y 20 October 1997
smaller fraction of the detected light is correlated forthe more turbid samples as the ratio of multiply scat-tered light to singly scattered light increases. Wefind that excellent estimates of particle diameter areobtainable from cross-correlation functions acquiredin times not significantly longer than those conven-tionally used for autocorrelation and dilute suspen-sions. This is the case even for the cross-correlatedsignal for the more concentrated samples, which havean extremely small signal amplitude. Both theoryand our experience with samples that have an evenhigher concentration than those shown in Fig. 4 haveshown that for the case of even higher concentrationseither a longer run time or a smaller-diameter sam-ple cell may be required. Note that because of therapid initial decay of the autocorrelation functions forthe more concentrated samples, the near constancy ofthe zero-delay time intercept is not apparent whenthe data are displayed as they are in Fig. 2.
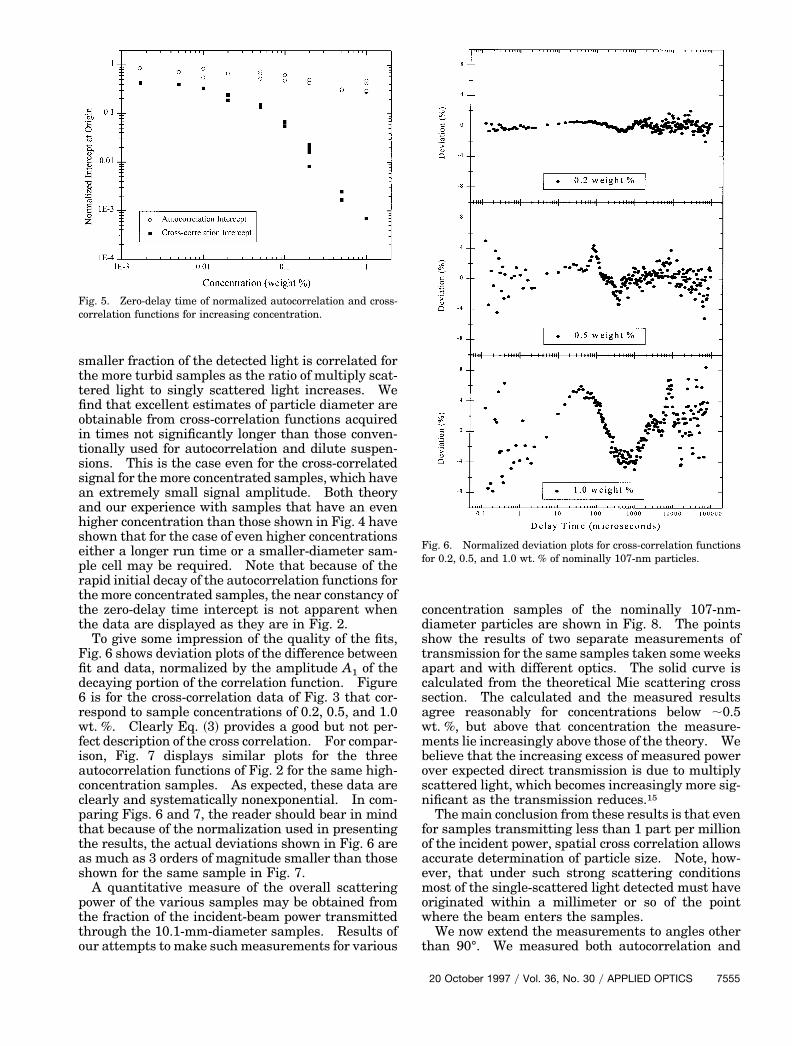
To give some impression of the quality of the fits,Fig. 6 shows deviation plots of the difference betweenfit and data, normalized by the amplitude A1 of thedecaying portion of the correlation function. Figure6 is for the cross-correlation data of Fig. 3 that cor-respond to sample concentrations of 0.2, 0.5, and 1.0wt. %. Clearly Eq. ~3! provides a good but not per-fect description of the cross correlation. For compar-ison, Fig. 7 displays similar plots for the threeautocorrelation functions of Fig. 2 for the same high-concentration samples. As expected, these data areclearly and systematically nonexponential. In com-paring Figs. 6 and 7, the reader should bear in mindthat because of the normalization used in presentingthe results, the actual deviations shown in Fig. 6 areas much as 3 orders of magnitude smaller than thoseshown for the same sample in Fig. 7.
A quantitative measure of the overall scatteringpower of the various samples may be obtained fromthe fraction of the incident-beam power transmittedthrough the 10.1-mm-diameter samples. Results ofour attempts to make such measurements for various
concentration samples of the nominally 107-nm-diameter particles are shown in Fig. 8. The pointsshow the results of two separate measurements oftransmission for the same samples taken some weeksapart and with different optics. The solid curve iscalculated from the theoretical Mie scattering crosssection. The calculated and the measured resultsagree reasonably for concentrations below ;0.5wt. %, but above that concentration the measure-ments lie increasingly above those of the theory. Webelieve that the increasing excess of measured powerover expected direct transmission is due to multiplyscattered light, which becomes increasingly more sig-nificant as the transmission reduces.15
The main conclusion from these results is that evenfor samples transmitting less than 1 part per millionof the incident power, spatial cross correlation allowsaccurate determination of particle size. Note, how-ever, that under such strong scattering conditionsmost of the single-scattered light detected must haveoriginated within a millimeter or so of the pointwhere the beam enters the samples.
We now extend the measurements to angles otherthan 90°. We measured both autocorrelation and
Fig. 5. Zero-delay time of normalized autocorrelation and cross-correlation functions for increasing concentration.
Fig. 6. Normalized deviation plots for cross-correlation functionsfor 0.2, 0.5, and 1.0 wt. % of nominally 107-nm particles.
20 October 1997 y Vol. 36, No. 30 y APPLIED OPTICS 7555

cross-correlation functions for the same set of variousconcentration samples of the nominally 107-nmspheres at scattering angles of 60°, 90°, 120°, and135°. We analyzed these data by fitting the corre-lation function by using Eq. ~3! as above, with A, B,K1, and K2 adjustable. The apparent particle diam-eters are presented in Fig. 9. The values of diameterinferred from the autocorrelation functions are se-verely influenced by multiple scattering for thehigher-concentration samples. They are also depen-dent on the scattering angle, yielding a systematicunderestimate of the particle size that gets worse asthe angle is moved more to the forward direction. Incontrast, the values of diameter inferred from thecross-correlation functions show no systematic de-pendence on the scattering angle. However, thevalues of the diameter estimated from the cross-correlation functions do show a progressive decreaseat concentrations of 1 wt. % and above. This effectcould arise from repulsive interactions among theparticles or it might be an artifact of our optical ge-ometry.
To verify the applicability of the method to parti-cles of a different diameter we present results in Fig.
10 for 90° scattering from particles of a similar ma-terial but with a nominal diameter of 204 nm. Thestability of the first cumulant from the cross-correlation function and hence the inferred particlediameter, as the suspension concentration increasesto opacity, is encouraging. The rapid increase invalue of the first cumulant from the autocorrelationfunctions shows the usual particle-size underesti-mate from the autocorrelation function when multi-ple scattering is significant. The cross-correlationresults correspond to a diameter of 214 nm in rea-sonable agreement with the nominal value.
4. Discussion
Our experimental results demonstrate the promise ofthis new method of spatial cross correlation.9,10 Theability to make reliable, easily interpretable, dy-namic light-scattering measurements on stronglyscattering samples is valuable in both basic research
Fig. 8. Measured and calculated transmissions for 10.1-mm-diameter samples of nominally 107-nm particles.
Fig. 9. Particle diameter inferred from autocorrelation and cross-correlation functions by use of a two-cumulant fit for measure-ments made at scattering angles of 60°, 90°, 120°, and 135°.
Fig. 7. Normalized deviation plots for autocorrelation functionsfor 0.2, 0.5, and 1.0 wt. % of nominally 107-nm particles.
7556 APPLIED OPTICS y Vol. 36, No. 30 y 20 October 1997

and in industrial applications. Examples of re-search areas in which multiple scattering is signifi-cant and measurements currently difficult includethe study of particle dynamics in strongly interactingsystems, critical-point phenomena, and in vivo bio-logical and medical studies. Examples of the manyindustrial applications include characterization ofvarious slurries used for grinding and polishing,paint-particle studies, sizing of particles in concen-trated suspensions, and quality control of productsthat may involve colloidal intermediate stages.
In this paper we have emphasized and demon-strated the feasibility and the reliability of themethod as applied only to colloidal suspensions. Wehave used simple collection optics consisting of adja-cent bare fibers without collimation lenses. Eachfiber collects light from along the entire sample,which is not the most effective way to discriminateselectively against multiply scattered light. A bet-ter method might be to use collimating lenses to re-strict the accepted light to that originating in alocalized portion of the sample. Using bare fibershas the advantage, however, of being extremely easy.We calculated and confirmed experimentally that thedistance of the fibers from the focus formed by thesample cell or the sample cell and its accompanyingindex-matching vat is rather forgiving. The onlycritical alignment is the vertical alignment of thefibers so that the line joining the centers of theirexposed faces is perpendicular to the beam. In prac-tice we achieved this by rotating the fiber pair aboutan axis parallel to the fiber axes to maximize theamplitude of the cross-correlation function measuredfor a single-scattering sample. No other alignmentwas necessary, and the fibers remained aligned formany months.
For isotropic particles, single scattering is highlypolarized, contributing nothing to IVH. Becausemultiple scattering is not highly polarized, it contrib-utes significantly to IVH. An analyzer that allowsthe fibers to accept only IVH results in a cross-
correlation function sensitive only to multiple scat-tering. This rather simple test was used to confirmthat the chosen fiber spacing was adequate to sup-press the multiple-scattering contribution to thecross-correlation function. For our fiber spacing,corresponding to an angular separation of 1.5 mrad,the multiple-scattering contribution was immeasur-ably small. By making such measurements as afunction of the fiber spacing or, equivalently, the an-gular separation of the two fibers, one can quantifyexactly how the multiple-scattering contribution tothe cross-correlation function reduces with increas-ing fiber separation. Such measurements have beenmade both for IVV and IVH by Nobbmann et al.,13 whoused an arrangement nearly identical with ours, butwith each fiber terminated by a collimating lens.Their results are reported in this feature and clearlydemonstrate the correctness of the physical ideasthat underlie this technique, specifically the rela-tively much greater extent of single-scatteringspeckle as opposed to multiple-scattering speckle inthe direction transverse to the beam.
As our results show, the amplitude of the cross-correlation function relative to the baseline falls dra-matically as multiple scattering increases ~see Fig. 5!.This is because the baseline is proportional to thesquare of the detected total intensity, whereas theamplitude of the decaying portion is proportional tothe square of the detected intensity from single scat-tering alone. This observation leads to the possibil-ity of using the measured zero-delay time interceptfor cross correlation to deduce the fraction of the totalscattered intensity arising from single scattering.Specifically, the ratio of the measured intercept to itsvalue for single-scattering from dilute samples isequal to the square of the ratio of the detected single-scattered intensity to the total intensity.
Applying this reasoning to the data for the 1-wt. %sample, for example, suggests that only ;4% of thelight reaching the detectors was singly scattered. Ifthis sort of analysis proves robust in practice, spatialcross correlation may make static light-scatteringmeasurements usefully quantitative even forstrongly scattering samples.
The authors thank James A. Lock of ClevelandState University for providing a theoretical analysisof the phenomena described here. His analysis isthe subject of another paper in this feature.11 Wealso thank Joanne C. Walton for assistance in theobservations. This research was supported by theMicrogravity Research Division of NASA.
References1. G. D. J. Phillies, “Suppression of multiple-scattering effects in
quasielastic-light-scattering spectroscopy by homodyne cross-correlation techniques,” J. Chem. Phys. 74, 260–262 ~1981!.
2. G. D. J. Phillies, “Experimental demonstration of multiple-scattering suppression in quasielastic-light-scattering spec-troscopy by homodyne coincidence techniques,” Phys. Rev. A24, 1939–1943 ~1981!.
3. J. K. G. Dhont and C. G. de Kruif, “Scattered light intensity
Fig. 10. Measured first cumulant K1 ~in inverse seconds! for nom-inally 204-nm particles by use of both autocorrelation and crosscorrelation.
20 October 1997 y Vol. 36, No. 30 y APPLIED OPTICS 7557

cross correlation. I. Theory,” J. Chem. Phys. 79, 1658–1563~1983!.
4. H. J. Mos, C. Pathmamanoharan, J. K. G. Dhont, and C. G. deKruif, “Scattered light intensity cross correlation. II. Ex-perimental,” J. Chem. Phys. 84, 45–49 ~1986!.
5. K. Schatzel, “Suppression of multiple scattering by photoncross-correlation techniques,” J. Mod. Opt. 38, 1849–1865~1991!.
6. D. Y. Ivanov and A. F. Kostko, “Spectrum of multiply quasi-elastically scattered light,” Opt. Spektrosk. 55, 950–953~1983!.
7. G. Maret and P. E. Wolf, “Multiple light scattering from dis-ordered media. The effect of Brownian motion of scatterers,”Z. Phys. B 65, 409–413 ~1987!.
8. D. J. Pine, D. A. Weitz, P. M. Chaikin, and E. Herbolzheimer,“Diffusing wave spectroscopy,” Phys. Rev. Lett. 60, 1134~1988!.
9. W. V. Meyer, J. A. Lock, D. S. Cannell, T. W. Taylor, P. Tin,A. E. Smart, J. X. Zhu, H. M. Cheung, and J. A. Mann Jr., “Asingle wavelength cross-correlation technique which sup-presses multiple scattering,” in Photon Correlation and Scat-tering, Vol. 14 of 1996 OSA Technical Digest Series ~OpticalSociety of America, Washington, D.C., 1996!, pp. 104–107 ~pre-
sented at the Optical Society of America’s Photon Correlationand Scattering Topical Meeting, Capri, Italy, 21–24 August1996!.
10. W. V. Meyer, D. S. Cannell, A. E. Smart, T. W. Taylor, and P.Tin, “Suppression of multiple scattering using a single beamcross-correlation method,” in Light Scattering and Photon Cor-relation Spectroscopy, E. R. Pike and J. B. Abbiss, eds., NATOASI Series, ~Kluwer, Dordrecht, The Netherlands, 1997!, pp.39–50.
11. J. A. Lock, “Role of multiple scattering in cross-correlated lightscattering with a single laser beam,” Appl. Opt. 36, 7559–7570~1997!.
12. See, for example, M. Born and E. Wolf, Principles of Optics, 6thed. ~Pergamon, London, 1980!, pp. 508–516.
13. U. Nobbmann, S. W. Jones, and B. J. Ackerson, “Multiple-scattering suppression: cross correlation with tilted single-mode fibers,” Appl. Opt. 36, 7571–7576 ~1997!.
14. See, for example, B. J. Berne and R. Pecora, Dynamic LightScattering ~Wiley, New York, 1976!.
15. C. Konak, J. Jakes, P. Stepanek, F. Petras, M. Karska, J.Krepelka, and J. Perina, “Effect of multiple scattering ontransmitted and scattered light,” Appl. Opt. 30, 4865–4867~1991!.
7558 APPLIED OPTICS y Vol. 36, No. 30 y 20 October 1997