pathogenicity of rigidoporus microporus and phellinus noxius ...
Upload
independentCategory
view
0download
0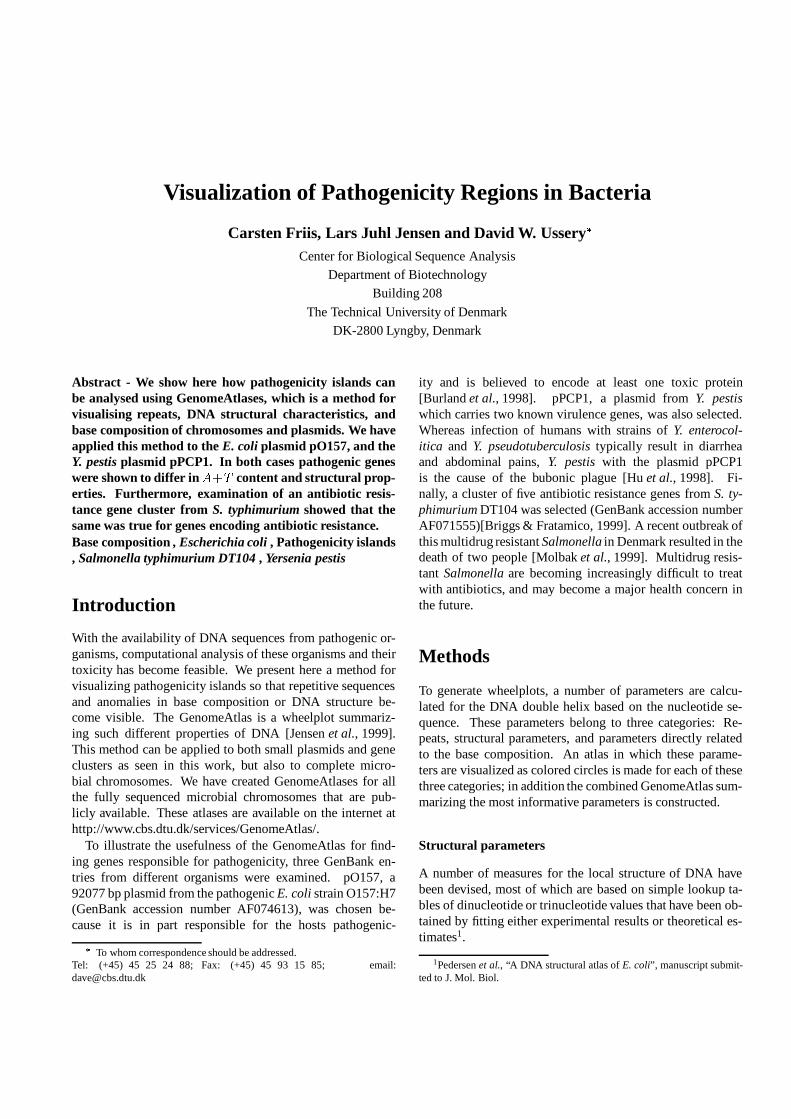
Visualization of Pathogenicity Regions in Bacteria
Carsten Friis, Lars Juhl Jensen and David W. Ussery�
Center for Biological Sequence AnalysisDepartment of Biotechnology
Building 208
The Technical University of DenmarkDK-2800 Lyngby, Denmark
Abstract - We show here how pathogenicity islands canbe analysed using GenomeAtlases, which is a method forvisualising repeats, DNA structural characteristics, andbase composition of chromosomes and plasmids. We haveapplied this method to the E. coli plasmid pO157, and theY. pestis plasmid pPCP1. In both cases pathogenic geneswere shown to differ in
�����content and structural prop-
erties. Furthermore, examination of an antibiotic resis-tance gene cluster from S. typhimurium showed that thesame was true for genes encoding antibiotic resistance.Base composition , Escherichia coli , Pathogenicity islands, Salmonella typhimurium DT104 , Yersenia pestis
Introduction
With the availability of DNA sequences from pathogenic or-ganisms, computational analysis of these organisms and theirtoxicity has become feasible. We present here a method forvisualizing pathogenicity islands so that repetitive sequencesand anomalies in base composition or DNA structure be-come visible. The GenomeAtlas is a wheelplot summariz-ing such different properties of DNA [Jensen et al., 1999].This method can be applied to both small plasmids and geneclusters as seen in this work, but also to complete micro-bial chromosomes. We have created GenomeAtlases for allthe fully sequenced microbial chromosomes that are pub-licly available. These atlases are available on the internet athttp://www.cbs.dtu.dk/services/GenomeAtlas/.
To illustrate the usefulness of the GenomeAtlas for find-ing genes responsible for pathogenicity, three GenBank en-tries from different organisms were examined. pO157, a92077 bp plasmid from the pathogenic E. coli strain O157:H7(GenBank accession number AF074613), was chosen be-cause it is in part responsible for the hosts pathogenic-
�To whom correspondence should be addressed.
Tel: (+45) 45 25 24 88; Fax: (+45) 45 93 15 85; email:[email protected]
ity and is believed to encode at least one toxic protein[Burland et al., 1998]. pPCP1, a plasmid from Y. pestiswhich carries two known virulence genes, was also selected.Whereas infection of humans with strains of Y. enterocol-itica and Y. pseudotuberculosis typically result in diarrheaand abdominal pains, Y. pestis with the plasmid pPCP1is the cause of the bubonic plague [Hu et al., 1998]. Fi-nally, a cluster of five antibiotic resistance genes from S. ty-phimurium DT104 was selected (GenBank accession numberAF071555)[Briggs & Fratamico, 1999]. A recent outbreak ofthis multidrug resistant Salmonella in Denmark resulted in thedeath of two people [Molbak et al., 1999]. Multidrug resis-tant Salmonella are becoming increasingly difficult to treatwith antibiotics, and may become a major health concern inthe future.
Methods
To generate wheelplots, a number of parameters are calcu-lated for the DNA double helix based on the nucleotide se-quence. These parameters belong to three categories: Re-peats, structural parameters, and parameters directly relatedto the base composition. An atlas in which these parame-ters are visualized as colored circles is made for each of thesethree categories; in addition the combined GenomeAtlas sum-marizing the most informative parameters is constructed.
Structural parameters
A number of measures for the local structure of DNA havebeen devised, most of which are based on simple lookup ta-bles of dinucleotide or trinucleotide values that have been ob-tained by fitting either experimental results or theoretical es-timates1.
1Pedersen et al., “A DNA structural atlas of E. coli”, manuscript submit-ted to J. Mol. Biol.
Intrinsic curvature is a property of DNA that is closelyrelated to anomalous gel mobility, as DNA fragmentswith high intrinsic curvature will migrate slower on poly-acrylamide gels than markers with the same length. Inthis work we have used the CURVATURE programme[Shpigelman et al., 1993], which is based on a wedge model[Trifonov & Sussman, 1980, Ulanovsky et al., 1986], for pre-diction of intrinsic curvature. From a set of dinucleotidevalues for the twist, wedge, and direction angles the three-dimensional path of a 21 bp fragment is calculated. Curva-ture profiles for longer sequences can thus be calculated us-ing a 21 bp running window. Curves are often encounteredupstream of highly expressed genes such as the toxin genes inpathogenicity islands [Bracco et al., 1989].
Next is the stacking energy, which relates to the inter-action energy between adjacent basepairs in the DNA dou-ble helix. The total stacking energy of a DNA segmentcan be estimated from the set of dinucleotide values deter-mined by quantum mechanical calculations on crystal struc-tures [Ornstein et al., 1978]. All stacking energies are nega-tive since base stacking is an energetically favourable interac-tion that serves to stabilise the double helix. This means thatregions with large stacking energies are strongly stabilisedand therefore less likely to destack or melt than regions withless negative stacking energies.
The position preference is a measure of helix flexibilitybased on a set of 32 trinucleotide values giving the log-oddsof the minor groove facing outwards when wrapped arounda nucleosome core [Satchwell et al., 1986]. On this scale avalue of zero represents no preference of the trinucleotidefor specific positions in the nucleosomes, while large abso-lute values means that the trinucleotide has strong prefer-ence. Because large absolute values thereby implies that thesequence is inflexible, a measure of flexibility is obtainedby removing the sign from the original trinucleotide values[Pedersen et al., 1998]. On that scale low values correspondto high bendability.
Base composition
The trivial way to parameterise the base composition is tosimply use the G-, A-, T-, and C-content. A drawback of thisrepresentation is that the four parameters are mutually corre-lated as they sum to 1. An alternative parameterisation for thebase composition is ��� , � �� , and ����� . In additionto being mutually independent measures, they also have theadvantage of being easier to interpret in a biological context.
The ��� content is strongly correlated to the structuralparameters described above — especially the stacking energy.���� rich regions usually destack more readily, have a higherintrinsic curvature, and are less flexible. Since the parameters���� and ����� have almost no correlation to the structuralproperties of DNA, the ���� content contains nearly all the
structural information arising from the mono-nucleotide com-position. Pathogenic islands can often be detected from theirdifferent ���� content alone, which also influence almost allthe structural properties of DNA.
Repeat elements
Repeats are multiple copies of the same sequence at differ-ent locations on a piece of DNA. We divide repeats into threemajor categories: Simple repeats, symmetry elements (alsotermed local repeats), and global repeats. All the differenttypes of repeats are found using the same basic algorithmwhich finds the highest degree of homology for an � bp re-peat within a window of length � .
Here we will only focus on repeats on the global scale,where a direct repeat is a sequence that is present in at leasttwo copies on the same strand, whilst two copies located onopposite strands will give rise to an inverted repeat. Globalrepeats can arise from duplicated genes as well as from ISelements which are often seen flanking pathogenic islands[Hacker et al., 1997].
Results and discussion
The plasmid pO157
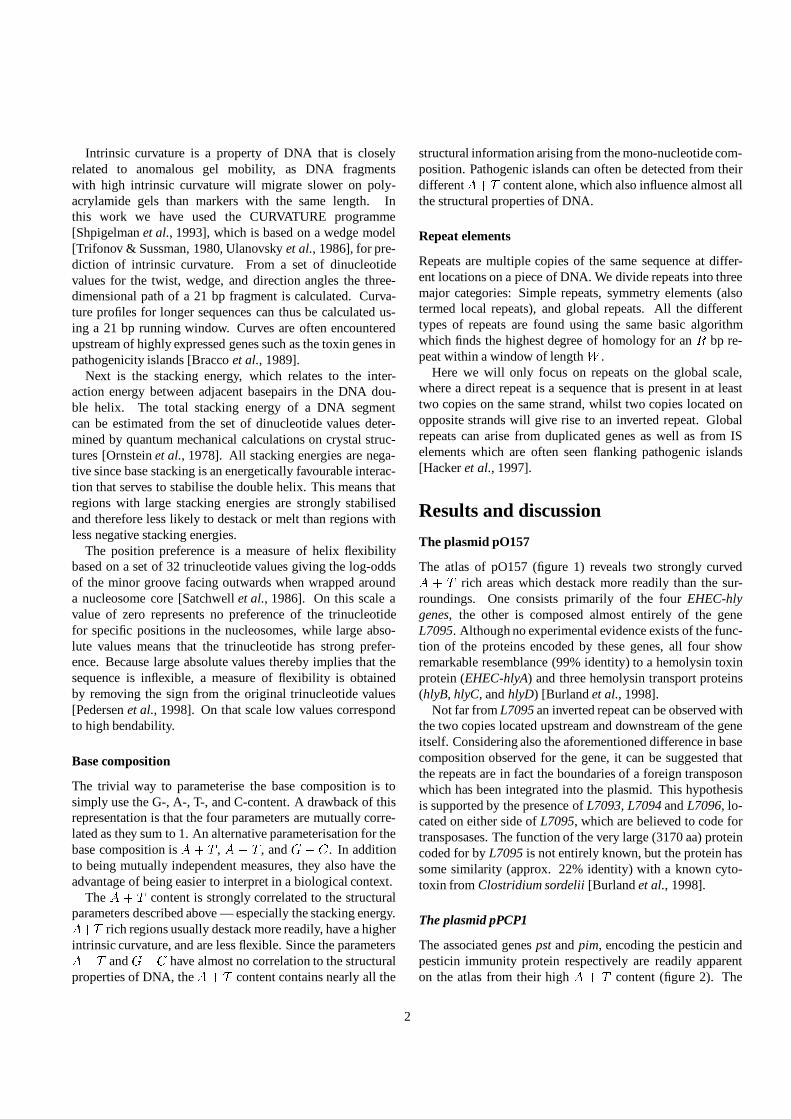
The atlas of pO157 (figure 1) reveals two strongly curved���� rich areas which destack more readily than the sur-roundings. One consists primarily of the four EHEC-hlygenes, the other is composed almost entirely of the geneL7095. Although no experimental evidence exists of the func-tion of the proteins encoded by these genes, all four showremarkable resemblance (99% identity) to a hemolysin toxinprotein (EHEC-hlyA) and three hemolysin transport proteins(hlyB, hlyC, and hlyD) [Burland et al., 1998].
Not far from L7095 an inverted repeat can be observed withthe two copies located upstream and downstream of the geneitself. Considering also the aforementioned difference in basecomposition observed for the gene, it can be suggested thatthe repeats are in fact the boundaries of a foreign transposonwhich has been integrated into the plasmid. This hypothesisis supported by the presence of L7093, L7094 and L7096, lo-cated on either side of L7095, which are believed to code fortransposases. The function of the very large (3170 aa) proteincoded for by L7095 is not entirely known, but the protein hassome similarity (approx. 22% identity) with a known cyto-toxin from Clostridium sordelii [Burland et al., 1998].
The plasmid pPCP1
The associated genes pst and pim, encoding the pesticin andpesticin immunity protein respectively are readily apparenton the atlas from their high ���� content (figure 2). The
2
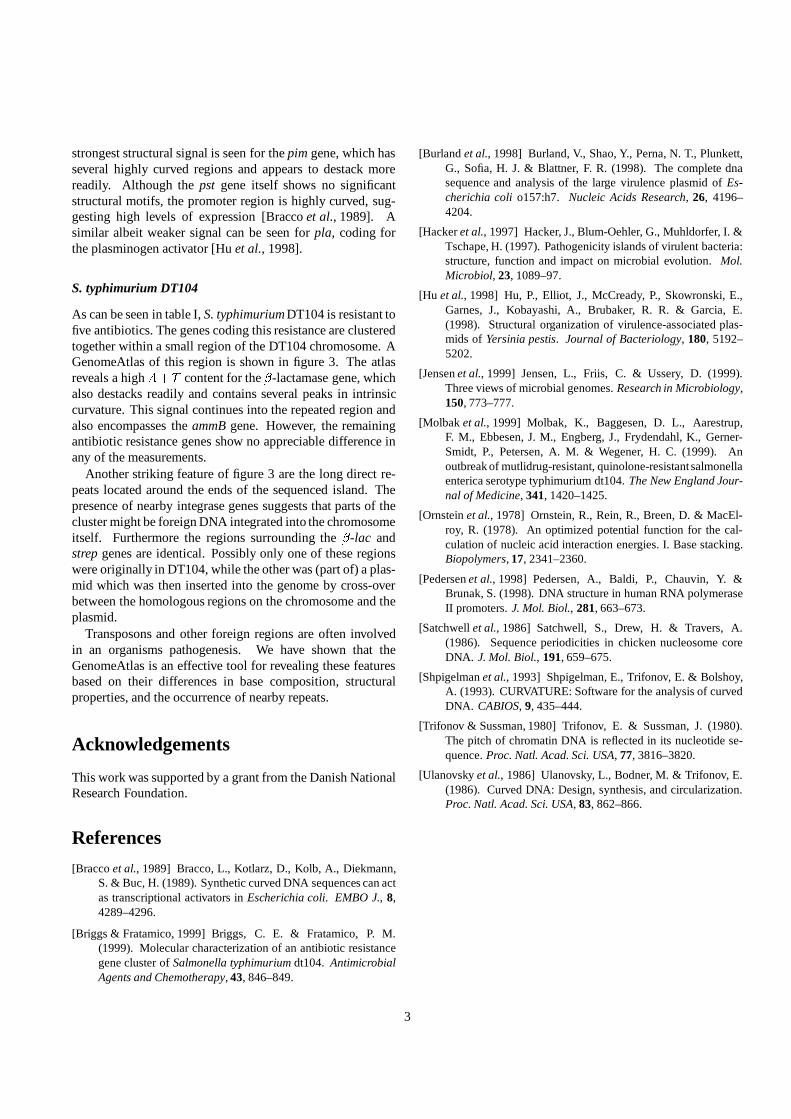
strongest structural signal is seen for the pim gene, which hasseveral highly curved regions and appears to destack morereadily. Although the pst gene itself shows no significantstructural motifs, the promoter region is highly curved, sug-gesting high levels of expression [Bracco et al., 1989]. Asimilar albeit weaker signal can be seen for pla, coding forthe plasminogen activator [Hu et al., 1998].
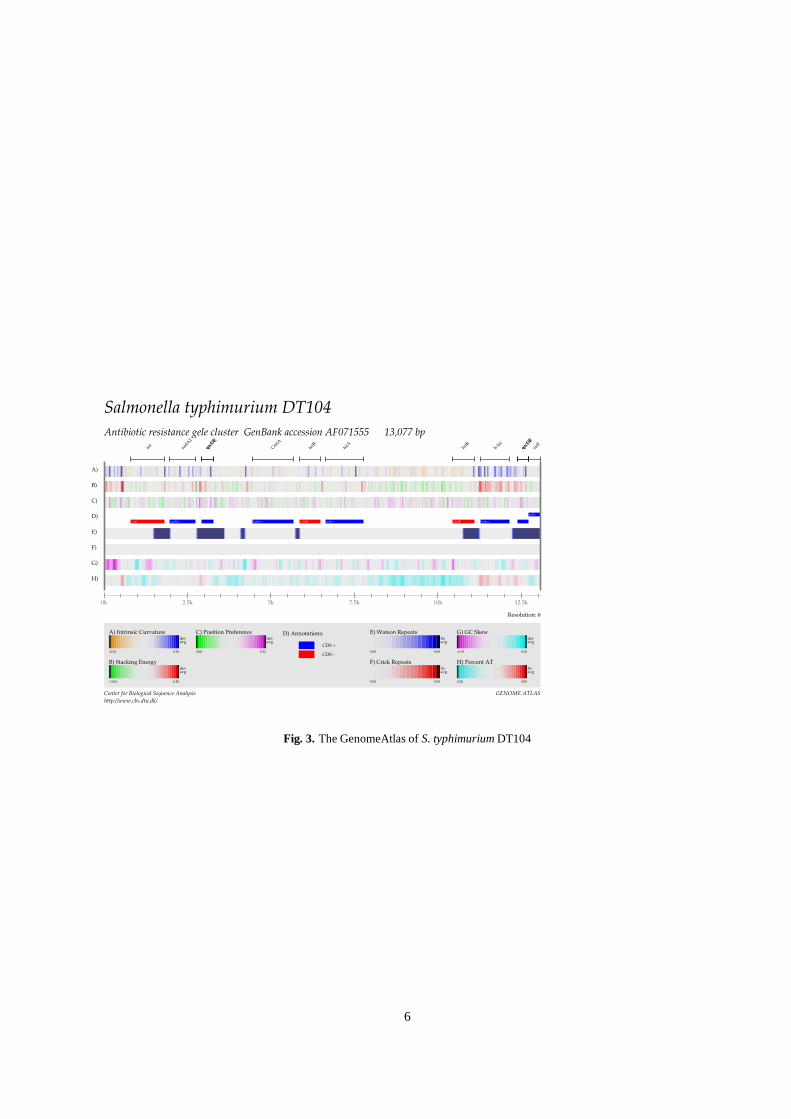
S. typhimurium DT104
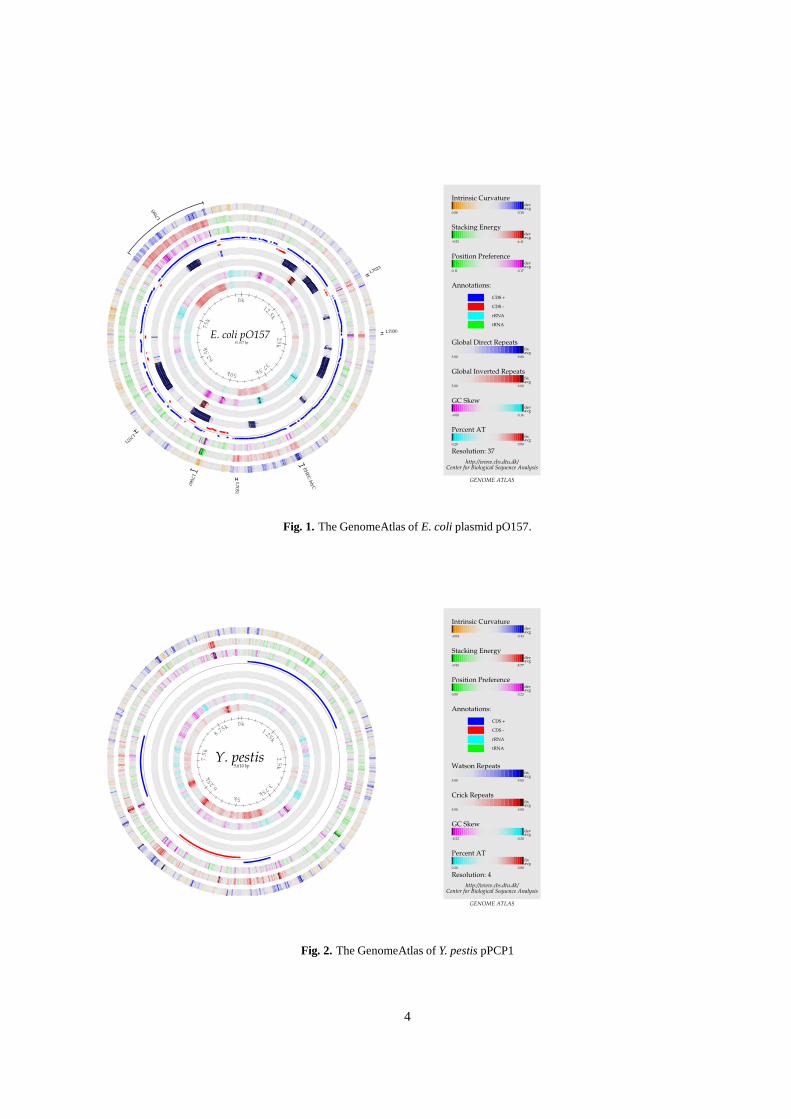
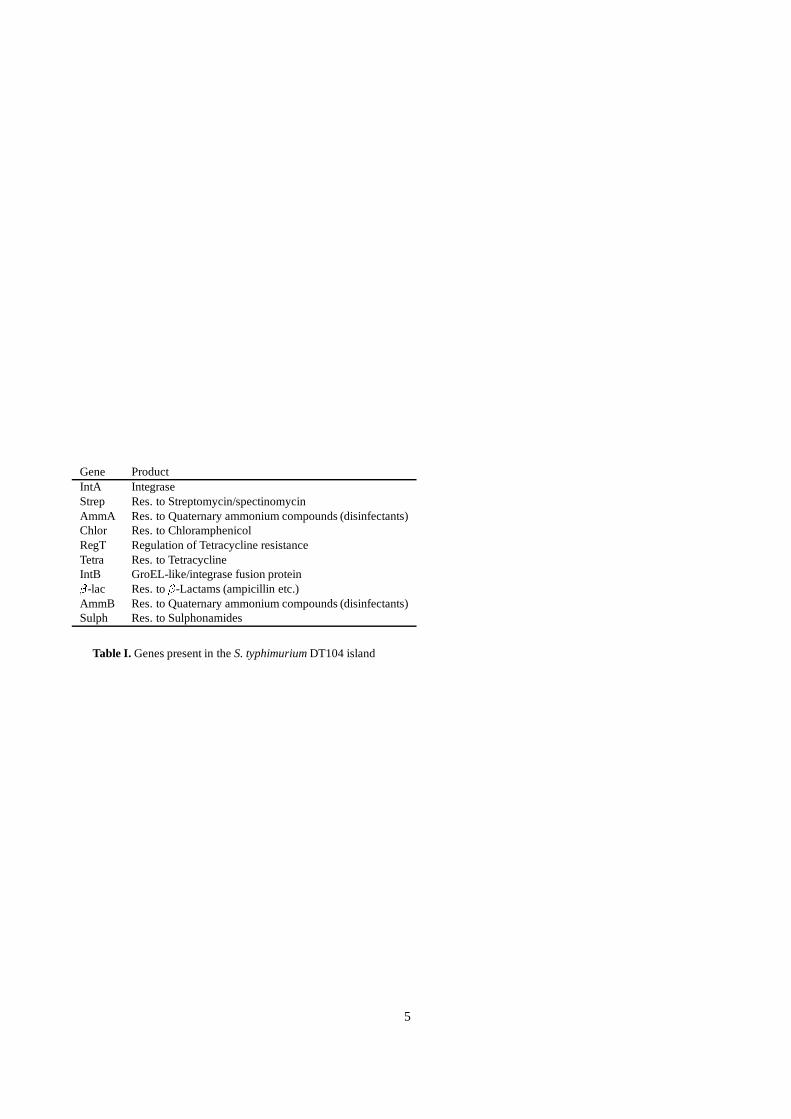
As can be seen in table I, S. typhimurium DT104 is resistant tofive antibiotics. The genes coding this resistance are clusteredtogether within a small region of the DT104 chromosome. AGenomeAtlas of this region is shown in figure 3. The atlasreveals a high ���� content for the ! -lactamase gene, whichalso destacks readily and contains several peaks in intrinsiccurvature. This signal continues into the repeated region andalso encompasses the ammB gene. However, the remainingantibiotic resistance genes show no appreciable difference inany of the measurements.
Another striking feature of figure 3 are the long direct re-peats located around the ends of the sequenced island. Thepresence of nearby integrase genes suggests that parts of thecluster might be foreign DNA integrated into the chromosomeitself. Furthermore the regions surrounding the ! -lac andstrep genes are identical. Possibly only one of these regionswere originally in DT104, while the other was (part of) a plas-mid which was then inserted into the genome by cross-overbetween the homologous regions on the chromosome and theplasmid.
Transposons and other foreign regions are often involvedin an organisms pathogenesis. We have shown that theGenomeAtlas is an effective tool for revealing these featuresbased on their differences in base composition, structuralproperties, and the occurrence of nearby repeats.
Acknowledgements
This work was supported by a grant from the Danish NationalResearch Foundation.
References
[Bracco et al., 1989] Bracco, L., Kotlarz, D., Kolb, A., Diekmann,S. & Buc, H. (1989). Synthetic curved DNA sequences can actas transcriptional activators in Escherichia coli. EMBO J., 8,4289–4296.
[Briggs & Fratamico, 1999] Briggs, C. E. & Fratamico, P. M.(1999). Molecular characterization of an antibiotic resistancegene cluster of Salmonella typhimurium dt104. AntimicrobialAgents and Chemotherapy, 43, 846–849.
[Burland et al., 1998] Burland, V., Shao, Y., Perna, N. T., Plunkett,G., Sofia, H. J. & Blattner, F. R. (1998). The complete dnasequence and analysis of the large virulence plasmid of Es-cherichia coli o157:h7. Nucleic Acids Research, 26, 4196–4204.
[Hacker et al., 1997] Hacker, J., Blum-Oehler, G., Muhldorfer, I. &Tschape, H. (1997). Pathogenicity islands of virulent bacteria:structure, function and impact on microbial evolution. Mol.Microbiol, 23, 1089–97.
[Hu et al., 1998] Hu, P., Elliot, J., McCready, P., Skowronski, E.,Garnes, J., Kobayashi, A., Brubaker, R. R. & Garcia, E.(1998). Structural organization of virulence-associated plas-mids of Yersinia pestis. Journal of Bacteriology, 180, 5192–5202.
[Jensen et al., 1999] Jensen, L., Friis, C. & Ussery, D. (1999).Three views of microbial genomes. Research in Microbiology,150, 773–777.
[Molbak et al., 1999] Molbak, K., Baggesen, D. L., Aarestrup,F. M., Ebbesen, J. M., Engberg, J., Frydendahl, K., Gerner-Smidt, P., Petersen, A. M. & Wegener, H. C. (1999). Anoutbreak of mutlidrug-resistant, quinolone-resistant salmonellaenterica serotype typhimurium dt104. The New England Jour-nal of Medicine, 341, 1420–1425.
[Ornstein et al., 1978] Ornstein, R., Rein, R., Breen, D. & MacEl-roy, R. (1978). An optimized potential function for the cal-culation of nucleic acid interaction energies. I. Base stacking.Biopolymers, 17, 2341–2360.
[Pedersen et al., 1998] Pedersen, A., Baldi, P., Chauvin, Y. &Brunak, S. (1998). DNA structure in human RNA polymeraseII promoters. J. Mol. Biol., 281, 663–673.
[Satchwell et al., 1986] Satchwell, S., Drew, H. & Travers, A.(1986). Sequence periodicities in chicken nucleosome coreDNA. J. Mol. Biol., 191, 659–675.
[Shpigelman et al., 1993] Shpigelman, E., Trifonov, E. & Bolshoy,A. (1993). CURVATURE: Software for the analysis of curvedDNA. CABIOS, 9, 435–444.
[Trifonov & Sussman, 1980] Trifonov, E. & Sussman, J. (1980).The pitch of chromatin DNA is reflected in its nucleotide se-quence. Proc. Natl. Acad. Sci. USA, 77, 3816–3820.
[Ulanovsky et al., 1986] Ulanovsky, L., Bodner, M. & Trifonov, E.(1986). Curved DNA: Design, synthesis, and circularization.Proc. Natl. Acad. Sci. USA, 83, 862–866.
3
katP >
espP >
L7028 >
L7031 >
etpD
>
etpE
>
etpF >
etpL >
EHEC-hlyA >
EHEC-hlyB >
sopA >
L7072
>
L70
81 >
L70
86 >
L70
91 >
L7095
>
traI >
L7051
L7023
EHEC
-hlyC
L709
5
L7030
L7071
L7060
0k12.5k
25k
37.5k50k
62.5
k75
k
GENOME ATLAS
Center for Biological Sequence Analysishttp://www.cbs.dtu.dk/
Intrinsic Curvaturedevavg
0.08 0.30
Stacking Energydevavg
-9.52 -6.41
Position Preferencedevavg
0.11 0.17
Annotations:
CDS +
CDS -
rRNA
tRNA
Global Direct Repeatsfixavg
5.00 9.00
Global Inverted Repeatsfixavg
5.00 9.00
GC Skewdevavg
-0.08 0.16
Percent ATfixavg
0.20 0.80
Resolution: 37
E. coli pO157 92,077 bp
Fig. 1. The GenomeAtlas of E. coli plasmid pO157.
CD S >
CDS >
pim >
pla
>
< pst
0k1.25k
2.5k3.75k
5k
6.25k
7 .5k
8 .75k
GENOME ATLAS
Center for Biological Sequence Analysishttp://www.cbs.dtu.dk/
Intrinsic Curvaturedevavg
-0.04 0.44
Stacking Energydevavg
-9.95 -5.77
Position Preferencedevavg
0.05 0.23
Annotations:
CDS +
CDS -
rRNA
tRNA
Watson Repeatsfixavg
5.00 9.00
Crick Repeatsfixavg
5.00 9.00
GC Skewdevavg
-0.23 0.20
Percent ATfixavg
0.20 0.80
Resolution: 4
Y. pestis 9,610 bp
Fig. 2. The GenomeAtlas of Y. pestis pPCP1
4
Gene ProductIntA IntegraseStrep Res. to Streptomycin/spectinomycinAmmA Res. to Quaternary ammonium compounds (disinfectants)Chlor Res. to ChloramphenicolRegT Regulation of Tetracycline resistanceTetra Res. to TetracyclineIntB GroEL-like/integrase fusion protein"
-lac Res. to"
-Lactams (ampicillin etc.)AmmB Res. to Quaternary ammonium compounds (disinfectants)Sulph Res. to Sulphonamides
Table I. Genes present in the S. typhimurium DT104 island
5
H)
G)
F)
E)
aadA2 > CmlA > tetA > b-lac >
sulI >
< int < tetR < IntB
D)
C)
B)
A)
int
aadA2
qacDE
qacDE
CmlA
tetR
tetA
IntB
b-lac
qacDE
qacDE
sulI
0k 2.5k 5k 7.5k 10k 12.5k
Center for Biological Sequence Analysishttp://www.cbs.dtu.dk/
GENOME ATLAS
A) Intrinsic Curvaturedevavg
-0.03 0.36
B) Stacking Energydevavg
-10.61 -6.50
C) Position Preferencedevavg
0.08 0.22
D) Annotations:
CDS +
CDS -
E) Watson Repeatsfixavg
5.00 9.00
F) Crick Repeatsfixavg
5.00 9.00
G) GC Skewdevavg
-0.19 0.20
H) Percent ATfixavg
0.20 0.80
Resolution: 6
Salmonella typhimurium DT104Antibiotic resistance gele cluster GenBank accession AF071555 13,077 bp
Fig. 3. The GenomeAtlas of S. typhimurium DT104
6
Copyright © 2022 FDOKUMEN