Comparison between the findings of electrical resistivity methods and microtremor array measurement...
11
1 | Page Comparison between the findings of electrical resistivity methods and microtremor array measurement (MAM) at two locations in Kathmandu Valley Surendra Raj Pant Engineer-Geophysicist Geophysical Research & Consultancy Service (P) Ltd Lalitpur, Tel: +977 1 5553617; E-mail: [email protected] Introduction In recent years electrical resistivity methods have gained wide acceptance in geological and engineering community of Nepal. Electrical resistivity methods have been applied not only for groundwater and mineral exploration (conventional application) but also for geotechnical site investigation. However, interpretation of the electrical methods in engineering projects is not always appreciated by engineers and geologists. Experience and care are needed for the interpretation of the electrical results applied for geotechnical site investigations. Furthermore, results are highly dependent on the lithological types, their thickness and electrical conductivities. Principle of equivalence (several models for the same data set) has strong effect in electrical methods than in other methods of geophysical investigation. Moreover, it fails to provide mechanical properties which are so important for geotechnical site characterization. At the same time there is impression created by site investigation guidelines of Government of Nepal that electrical method is panacea for every problem related with subsurface investigation. In long run this misconception will degrade our capacity to understand the limitations and advantages of the methods and finally a message will be sent to the international community of geoscientists and engineers that in Nepal there is no reliable source of geophysical service. However, application of geophysical methods by knowing its limitations and advantages and supplementing with other geophysical methods that can provide geotechnical parameters helps to improve the final product of geophysical mission in site characterization. By using seismic shear wave techniques one can calculate geotechnical parameters of the subsurface. Among several methods of data acquisition for shear wave velocity (SWV) passive source methods (recordings of microtremors) are widely accepted and applied for site
-
Upload
independent -
Category
Documents
-
view
0 -
download
0
Transcript of Comparison between the findings of electrical resistivity methods and microtremor array measurement...
1 | P a g e
Comparison between the findings of electrical resistivity methods and
microtremor array measurement (MAM) at two locations in Kathmandu
Valley
Surendra Raj Pant
Engineer-Geophysicist
Geophysical Research & Consultancy Service (P) Ltd
Lalitpur, Tel: +977 1 5553617; E-mail: [email protected]
Introduction
In recent years electrical resistivity methods have gained wide acceptance in geological and
engineering community of Nepal. Electrical resistivity methods have been applied not only for
groundwater and mineral exploration (conventional application) but also for geotechnical site
investigation. However, interpretation of the electrical methods in engineering projects is not always
appreciated by engineers and geologists. Experience and care are needed for the interpretation of the
electrical results applied for geotechnical site investigations. Furthermore, results are highly
dependent on the lithological types, their thickness and electrical conductivities. Principle of
equivalence (several models for the same data set) has strong effect in electrical methods than in
other methods of geophysical investigation. Moreover, it fails to provide mechanical properties
which are so important for geotechnical site characterization. At the same time there is impression
created by site investigation guidelines of Government of Nepal that electrical method is panacea for
every problem related with subsurface investigation. In long run this misconception will degrade our
capacity to understand the limitations and advantages of the methods and finally a message will be
sent to the international community of geoscientists and engineers that in Nepal there is no reliable
source of geophysical service. However, application of geophysical methods by knowing its
limitations and advantages and supplementing with other geophysical methods that can provide
geotechnical parameters helps to improve the final product of geophysical mission in site
characterization. By using seismic shear wave techniques one can calculate geotechnical parameters
of the subsurface. Among several methods of data acquisition for shear wave velocity (SWV)
passive source methods (recordings of microtremors) are widely accepted and applied for site

2 | P a g e
investigation by international community of geoscientists and engineers. The reason behind this
acceptance is the low cost for data acquisition.
Comparison between electrical resistivity tomography (ERT) and microtremor array
measurement (MAM) results in Sano Khokana, Lalitpur
Initially electrical resistivity tomography (ERT) survey has been carried out to test subsurface for the
feasibility study of groundwater to fulfill the daily requirement of water for orphanage (Children’s
Home) in Sano Khokana. ERT survey was carried out in March 2010. The area was also previously
studied by vertical electrical soundings (VES) by Water Supply & Sewerage Corporation. In 2012
water well has been drilled in the premises of Children’s Home. The exact depth of drilling was not
documented because of the disputes with the locals the contractor left the site without completion of
the whole procedure. Verbally it was informed that they found some harder formation to be potential
for groundwater exploration related with the high resistivity zone at depth around 90 m. In April
2013 active source MASW and passive source MAM tests have been conducted. Active source has
limited depth of penetration whereas passive source has greater depth of penetration. The area under
investigation is calm so only low frequency microtremors that carry information from depth are
expected to be recorded. The site of MAM test was about 50 m towards the east from Children’s
Home. Since the geological setup of the area is not highly variable (no high lateral heterogeneity is
expected) the investigations carried out within this short distances can be compared. Here are the
interpretations of ERT and MAM results.
Electrical Resistivity tomography(ERT) in Sanokhokana (near Children’s Home)
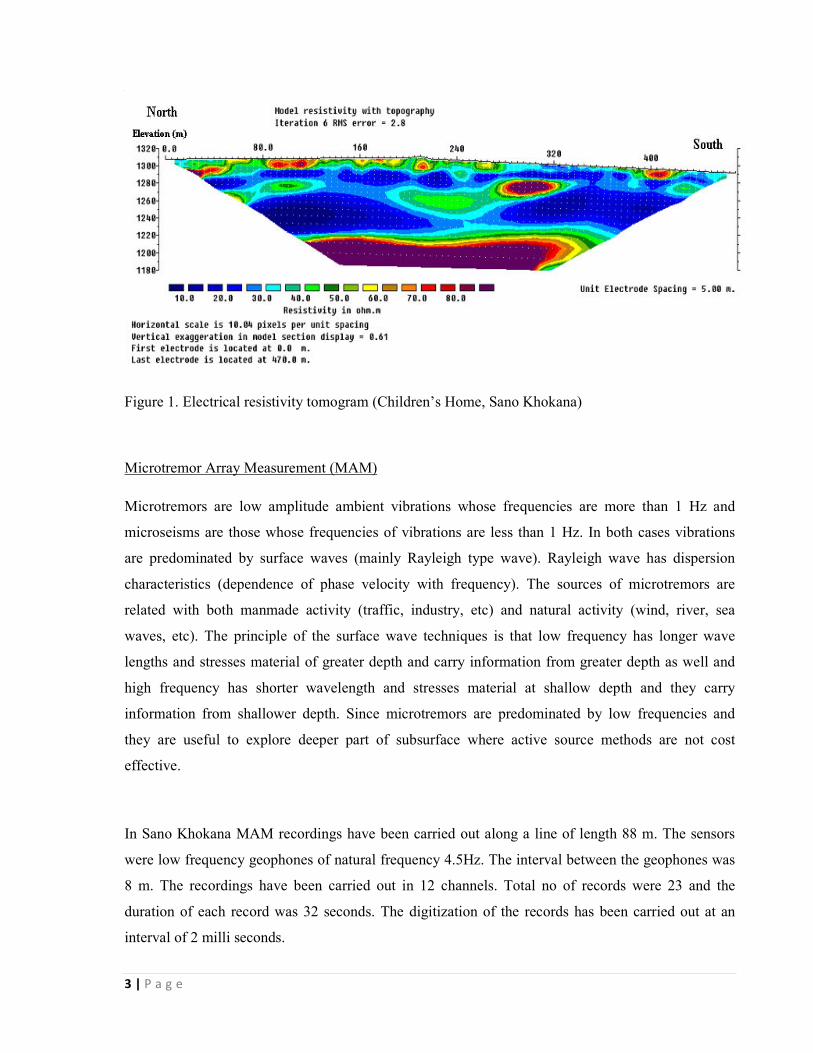
Figure 1 show that near surface higher resistivity zone is related with the loose and less moist surface
layer. Its thickness varies between 10 m to 20 m along the profile. The variation of resistivity in
depth in this area is related with the variation of lithology. Higher resistivity zone in the intermediate
depth (depth to the top varies between 30 m to 40 m along the profile) is related with the onset of
coarser material. High resistivity zone which is continuous at deeper part (varies between depths 80
m to 90 m) is highly karstified bedrock (voids likely to be filled with mud).
3 | P a g e
Figure 1. Electrical resistivity tomogram (Children’s Home, Sano Khokana)
Microtremor Array Measurement (MAM)
Microtremors are low amplitude ambient vibrations whose frequencies are more than 1 Hz and
microseisms are those whose frequencies of vibrations are less than 1 Hz. In both cases vibrations
are predominated by surface waves (mainly Rayleigh type wave). Rayleigh wave has dispersion
characteristics (dependence of phase velocity with frequency). The sources of microtremors are
related with both manmade activity (traffic, industry, etc) and natural activity (wind, river, sea
waves, etc). The principle of the surface wave techniques is that low frequency has longer wave
lengths and stresses material of greater depth and carry information from greater depth as well and
high frequency has shorter wavelength and stresses material at shallow depth and they carry
information from shallower depth. Since microtremors are predominated by low frequencies and
they are useful to explore deeper part of subsurface where active source methods are not cost
effective.
In Sano Khokana MAM recordings have been carried out along a line of length 88 m. The sensors
were low frequency geophones of natural frequency 4.5Hz. The interval between the geophones was
8 m. The recordings have been carried out in 12 channels. Total no of records were 23 and the
duration of each record was 32 seconds. The digitization of the records has been carried out at an
interval of 2 milli seconds.

4 | P a g e
Figure 2. Dispersion image of microtremor array measurement (MAM) survey near Children’s
Home, Sano Khokana Site, geophone interval 8 m
The SPAC (SPatial Auto Correlation) function has been executed to extract the fundamental mode
from dispersion image (see Figure 2). Dispersion image shows that dispersion curve related with
fundamental mode, as low as 2 Hz can be extracted. The blue straight lines in the dispersion image
are the limiting boundaries. The lower line is the limit of aliasing effect and the upper line is for the
resolution of array used. Extracted dispersion curve (see Figure 3) were modeled to derive the
subsurface model of the SWV (see Figure 4).
0.0
0.5
1.0
1.5
2.0
2.5
3.0
3.5
4.0
4.5
5.0
5.5
6.0
6.5
7.0
7.5
8.0
8.5
9.0
Fre
qu
enc
y (H
z)
0 200 400 600 800 1000
Phase velocity (m/sec) Source= 0.0m
Dispersion curve : 123.dat-145.dat

5 | P a g e
Figure 3. Dispersion curve extracted from dispersion image in Figure 2 at Sano Khokana Site.
Circles are the data and solid line is the theoretically calculated curve for the inverted model.
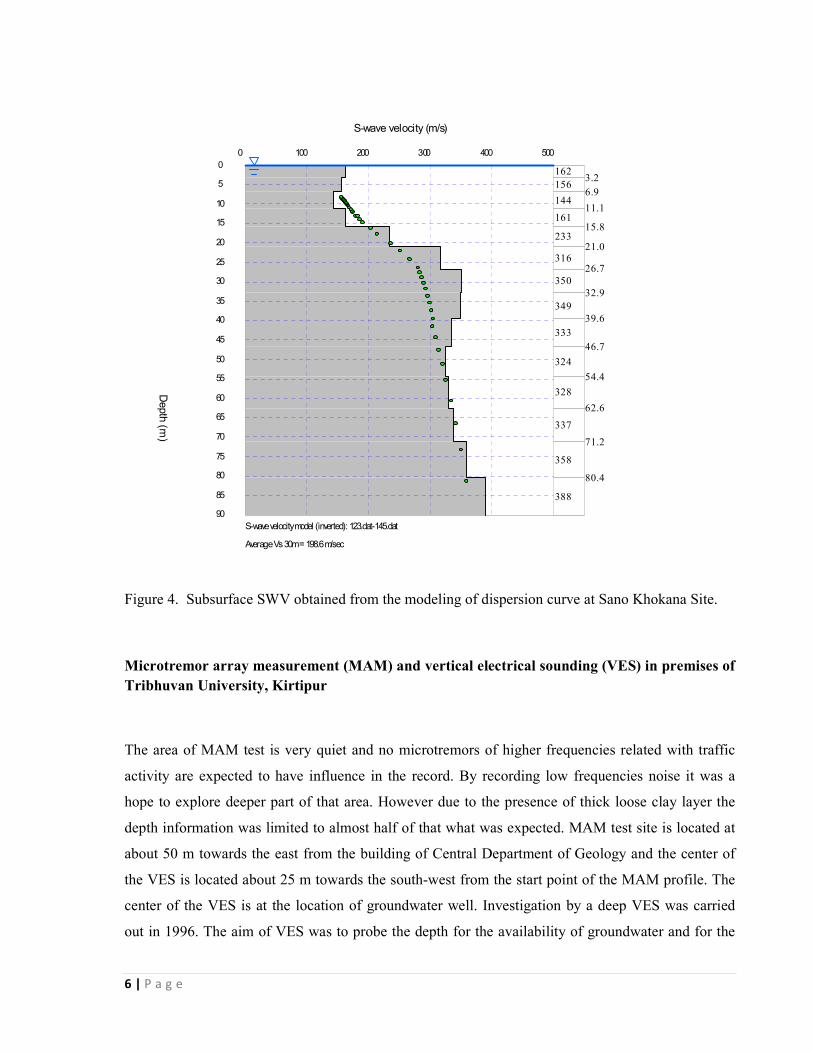
Similar to ERT model interpretation MAM model (see Figure 4) also indicate a four-layered
subsurface. First layer which extends between 0 m to 16 m is very loose clay and silt dominated
layer. The second layer which has higher SWV (300 m/s -350 m/s) is the indication of the
lithological change from clay domination to sand/gravel domination. This zone is indicated by
intermediate to high resistivity zone in ERT section. The third zone is SWV inversion zone (low
SWV zone which drops from 350 m/s to 325 m/s)) related with the change in lithology. In ERT
section the third SWV zone identified in MAM is indicated by low resistivity zone. The depth to the
top of the low resistivity zone varies between 40 m to 60 m and continues to the depths of 85 m to 90
m depths. The model obtained from MAM indicates that the possibility of the onset of high SWV
zone which is likely to be related with the high resistivity zone in the bottom part of the ERT section
stats at depth of about 80 m.
600
550
500
450
400
350
300
250
200
150
100
50
0
Ph
as
e v
elo
city
(m/s
ec
)
0 2 4 6 8 10
Frequency (Hz)
Dispersion curve : 123.dat-145.dat
6 | P a g e
Figure 4. Subsurface SWV obtained from the modeling of dispersion curve at Sano Khokana Site.
Microtremor array measurement (MAM) and vertical electrical sounding (VES) in premises of
Tribhuvan University, Kirtipur
The area of MAM test is very quiet and no microtremors of higher frequencies related with traffic
activity are expected to have influence in the record. By recording low frequencies noise it was a
hope to explore deeper part of that area. However due to the presence of thick loose clay layer the
depth information was limited to almost half of that what was expected. MAM test site is located at
about 50 m towards the east from the building of Central Department of Geology and the center of
the VES is located about 25 m towards the south-west from the start point of the MAM profile. The
center of the VES is at the location of groundwater well. Investigation by a deep VES was carried
out in 1996. The aim of VES was to probe the depth for the availability of groundwater and for the
0
5
10
15
20
25
30
35
40
45
50
55
60
65
70
75
80
85
90
De
pth
(m)
0 100 200 300 400 500
S-wave velocity (m/s)
S-wave velocity model (inverted): 123.dat-145.dat
Average Vs 30m = 198.6 m/sec
1623.2
1566.9
14411.1
16115.8
23321.0
31626.7
350
32.9
349
39.6
333
46.7
324
54.4
328
62.6
337
71.2
358
80.4
388

7 | P a g e
recommendation of the drilling depth. Field data with modeled theoretical curve are presented on the
left and inverted model is presented on the right of Figure 5. The layers parameters are presented in
Table 1. The result indicates that the lake clay extends to the depth of 153 m. This depth is the top of
the river deposits (aquifer) predominated by sand. And it is expected to be hard or more competent
formation of the area. In 1997 a borehole for groundwater development was drilled. The borehole log
shows that the onset of the silt dominated layer is at depth of 155 m and the sand dominated layer
starts at depth of 165 m. Close to the surface few meters of silt and silty clay was found and below
this all the way was lake clay down to the depth of 155 m. Very low resistivity of the lake deposit
indicates that the lake clay is likely to be loose.
Figure 5. Vertical electrical sounding that has been carried out in the premises of Tribhuvan
University for location of deep groundwater well (south east of Chemistry Department and South of
Environmental Study Department) at Kirtipur Site
Table 1. Layer’s parameters derived from the modeling of vertical electrical sounding (VES) at the
premises of Tribhuvan University, Kirtipur
Layer No. 1 2 3
Resistivity, Ohm.m 23 (silty clay) 7 (lake clay) 275 (predominantly sand )
Depth, m 9.5 153
1 10 100 1000
1
10
100
1000
4
10
S1
AP
PA
RE
NT
RE
SIS
TIV
ITY
(o
hm
-m)
AB/2 (m)
1 10 100 10004
10
1
10
100
1000
De
pth
(m
)
RESISTIVITY (ohm-m)
8 | P a g e
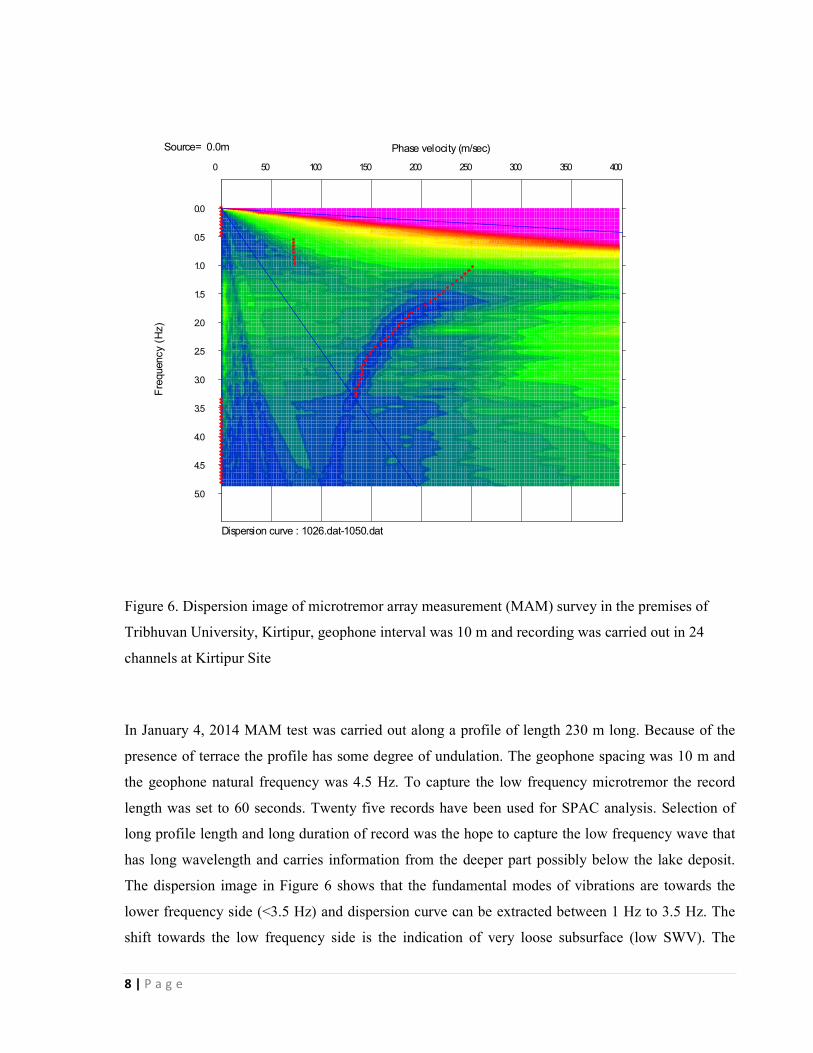
Figure 6. Dispersion image of microtremor array measurement (MAM) survey in the premises of
Tribhuvan University, Kirtipur, geophone interval was 10 m and recording was carried out in 24
channels at Kirtipur Site
In January 4, 2014 MAM test was carried out along a profile of length 230 m long. Because of the
presence of terrace the profile has some degree of undulation. The geophone spacing was 10 m and
the geophone natural frequency was 4.5 Hz. To capture the low frequency microtremor the record
length was set to 60 seconds. Twenty five records have been used for SPAC analysis. Selection of
long profile length and long duration of record was the hope to capture the low frequency wave that
has long wavelength and carries information from the deeper part possibly below the lake deposit.
The dispersion image in Figure 6 shows that the fundamental modes of vibrations are towards the
lower frequency side (<3.5 Hz) and dispersion curve can be extracted between 1 Hz to 3.5 Hz. The
shift towards the low frequency side is the indication of very loose subsurface (low SWV). The
0.0
0.5
1.0
1.5
2.0
2.5
3.0
3.5
4.0
4.5
5.0
Fre
qu
en
cy
(H
z)
0 50 100 150 200 250 300 350 400
Phase velocity (m/sec) Source= 0.0m
Dispersion curve : 1026.dat-1050.dat
9 | P a g e
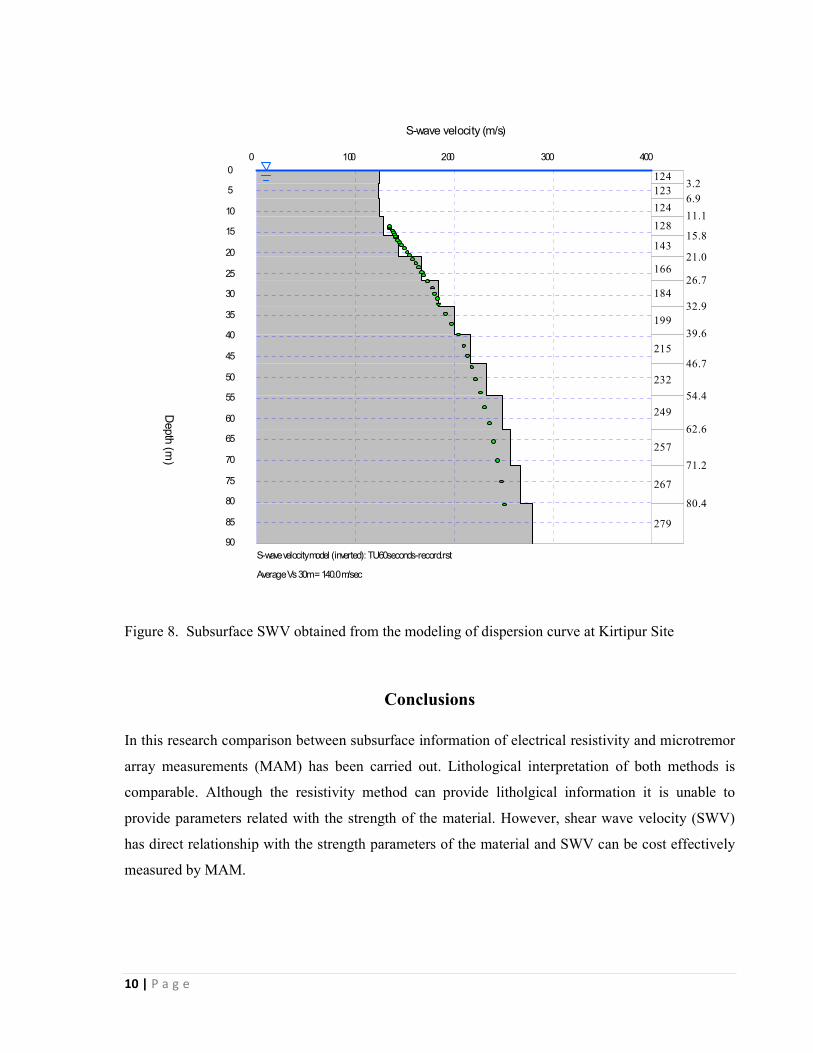
dispersion curve was modeled (see Figure 7) and the inverted model (see Figure 8) indicates that the
SWV of the subsurface is less than 300 m/s throughout the investigation. The maximum SWV
observed is 279 m/s and the minimum observed SWV is about 125 m/s. The model also indicates
that as the depth increases the consolidation of the lake clay also increases to some degree. This
smooth increase in SWV with depth is also the indication that there is no change in lithology within
the investigated depth. Compared to Sano Khokana the depth of penetration in this site with profile
length 230 m is considered to be much lower. Equivalent depth information was attained by 88 m
long profile in Sano Khokana whereas in Kirtipur site it was attained by 230 m long profile. In both
sites the depth information is controlled by wavelength which in turn is related with the SWV of
subsurface material.
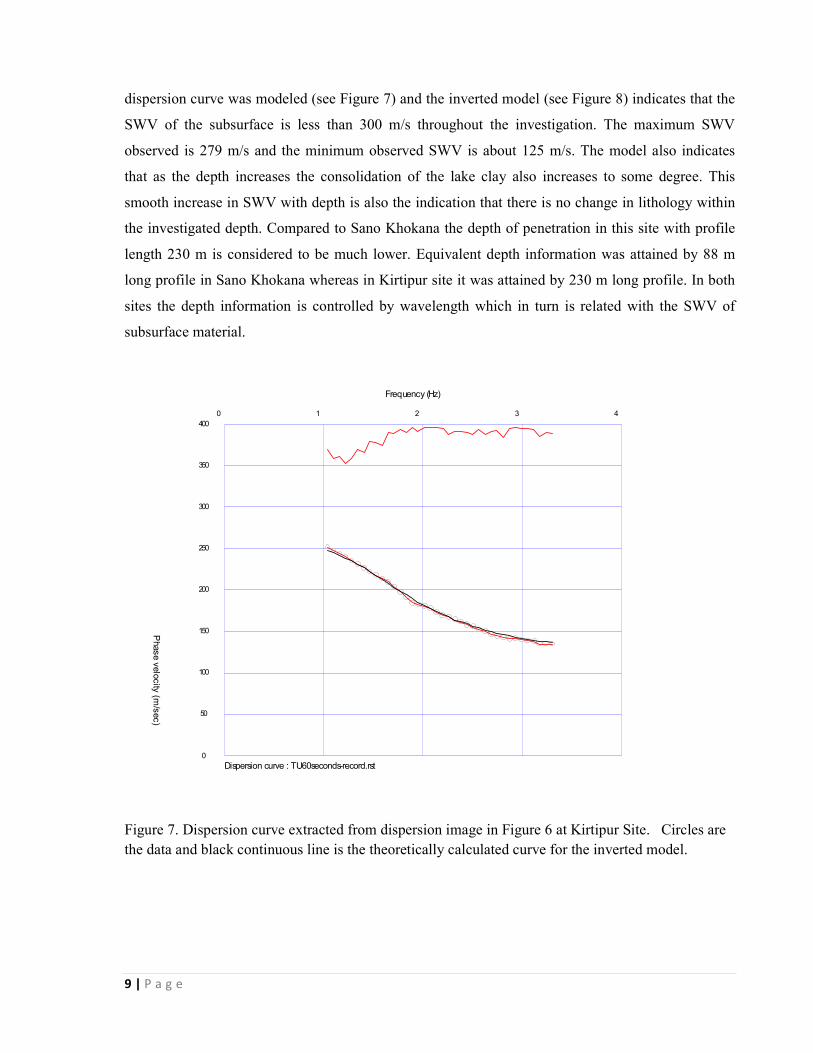
Figure 7. Dispersion curve extracted from dispersion image in Figure 6 at Kirtipur Site. Circles are
the data and black continuous line is the theoretically calculated curve for the inverted model.
400
350
300
250
200
150
100
50
0
Ph
as
e v
elo
city
(m/s
ec
)
0 1 2 3 4
Frequency (Hz)
Dispersion curve : TU60seconds-record.rst
10 | P a g e
Figure 8. Subsurface SWV obtained from the modeling of dispersion curve at Kirtipur Site
Conclusions
In this research comparison between subsurface information of electrical resistivity and microtremor
array measurements (MAM) has been carried out. Lithological interpretation of both methods is
comparable. Although the resistivity method can provide litholgical information it is unable to
provide parameters related with the strength of the material. However, shear wave velocity (SWV)
has direct relationship with the strength parameters of the material and SWV can be cost effectively
measured by MAM.
0
5
10
15
20
25
30
35
40
45
50
55
60
65
70
75
80
85
90
De
pth
(m)
0 100 200 300 400
S-wave velocity (m/s)
S-wave velocity model (inverted): TU60seconds-record.rst
Average Vs 30m = 140.0 m/sec
1243.2
1236.9
12411.1
12815.8
14321.0
16626.7
184
32.9
199
39.6
215
46.7
232
54.4
249
62.6
257
71.2
267
80.4
279

11 | P a g e
Comparison of the results of VES and MAM in Kirtipur Site have revealed that VES has mapped the
lake clay as a single layer whereas MAM indicates progressive increase in SWV which is likely to be
related with the increase in consolidation with depth.
Depth information attained by MAM is highly site dependent. Comparison of results of Sano
Khokana Site and Kirtipur Site reveal that the depth of information obtained in both sites were
equivalent despite much longer layout of the profile (almost three times in Kirtipur Site than in Sano
Khokana Site). This fact helps to make useful conclusion that the controlling factor for the depth of
information in MAM mainly depends on SWV of the material and to lesser extent the length of the
profile. Length of the profile is important for the determination of effects of aliasing and maximum
depth of resolution of the array used in the measurement.