Seasonal PM 10 dynamics in Kathmandu Valley
11
Seasonal PM 10 dynamics in Kathmandu Valley Rupak Kumar Aryal a , Byeong-Kyu Lee b, * , Rahul Karki c , Anup Gurung c , Jaya Kandasamy a , Bipin Kumar Pathak a , Suman Sharma d , Nirita Giri e a Institute for Water and Environmental Resource Management, Faculty of Engineering, University of Technology, Sydney, Australia b Department of Civil and Environmental Engineering, University of Ulsan, San 29, Mugeo2-dong, Nam-gu, Ulsan 680-749, Ulsan, Republic of Korea c Department of Environmental Science and Engineering, Kathmandu University, Kavre, Nepal d Ministry of Population and Environment, Kathmandu, Nepal e Environment and Public Health Organization, Kathmandu, Nepal article info Article history: Received 7 June 2007 Received in revised form 23 May 2008 Accepted 13 August 2008 Keywords: Kathmandu valley PM 10 Seasons Correlation abstract Data on ambient PM 10 levels from six locations in the Kathmandu Valley recorded by means of continuous sampling using low volume air samplers from October 2002 to March 2007 were used to investigate PM 10 concentration dynamics in the valley. Monthly average data of the urban areas, which have much higher concentrations than the rural areas, even exceeded the daily standard level of PM 10 , in Nepal, 120 mmm 3 . Repetitive peaks and troughs each year indicated annual patterns. Monthly average showed seasonal patterns are different between rural area and urban sites. The highest monthly average concen- tration was observed in February, the end of winter in urban areas where as in rural found in spring, and the lowest concentration was observed in July (monsoon period). The continuous increase in PM 10 concentration from December to February in urban areas showed accumulation of PM 10 in the ambient air during the wintertime. Rainfall in June and September, during the monsoon period, caused a PM 10 concentration decrease, demonstrating that precipitation is effective in removing PM 10 from the valley. Cross correlation analyses among the PM 10 levels measured simultaneously at the sampling stations showed a poor relationship in winter; however, there were good relationships in the monsoon and post-monsoon seasons. Both the PM 10 concentration and the air-mixing environment in the valley were closely associated with the temperature and wind speed. Ó 2008 Published by Elsevier Ltd. 1. Introduction Thoracic ambient particulate matter (PM 10 ) is defined as particles less than 10 mm in aerodynamic diameter. It is well-documented that increased exposure to thoracic PM is associated with various adverse health effects, such as respiratory diseases, cardiovascular mortality, morbidity, and probably, malignant lung diseases (Donaldson and MacNee, 2001; Kan and Chen, 2003; Chang et al., 2005; Goldberg et al., 2006; Ostro et al., 2006). Ambient PM 10 represents a complex mixture of anthropogenic and natu- rally occurring airborne particles. There is increased evidence that most of the harmful components in PM 10 are particles formed from incomplete combustion of fossil fuels and pyrolysis of organic materials. A plethora of chemicals has been identified in contaminated ambient air, including polycyclic aromatic hydrocarbons (PAHs) and their nitro- and oxy-derivatives, strong acids and toxic metals (Fang et al., 2000; Lin et al., 2005). There have been many studies of the association between the prevalence of different air pollutants and adverse human health outcomes. PM 10 appears to be one of the most useful single measures of air pollution in a given area (US EPA, 1996; Kunzli et al., 2000; Schwartz, 2001). Most PM 10 studies have been conducted * Corresponding author. Tel.: þ82 52 259 2864; fax: þ82 52 259 2629. E-mail address: [email protected] (B.-K. Lee). Contents lists available at ScienceDirect Atmospheric Environment journal homepage: www.elsevier.com/locate/atmosenv 1352-2310/$ – see front matter Ó 2008 Published by Elsevier Ltd. doi:10.1016/j.atmosenv.2008.08.016 Atmospheric Environment 42 (2008) 8623–8633
Transcript of Seasonal PM 10 dynamics in Kathmandu Valley

ilable at ScienceDirect
Atmospheric Environment 42 (2008) 8623–8633
Contents lists ava
Atmospheric Environment
journal homepage: www.elsevier .com/locate/atmosenv
Seasonal PM10 dynamics in Kathmandu Valley
Rupak Kumar Aryal a, Byeong-Kyu Lee b,*, Rahul Karki c, Anup Gurung c, Jaya Kandasamy a,Bipin Kumar Pathak a, Suman Sharma d, Nirita Giri e
a Institute for Water and Environmental Resource Management, Faculty of Engineering, University of Technology, Sydney, Australiab Department of Civil and Environmental Engineering, University of Ulsan, San 29, Mugeo2-dong, Nam-gu, Ulsan 680-749, Ulsan, Republic of Koreac Department of Environmental Science and Engineering, Kathmandu University, Kavre, Nepald Ministry of Population and Environment, Kathmandu, Nepale Environment and Public Health Organization, Kathmandu, Nepal
a r t i c l e i n f o
Article history:Received 7 June 2007Received in revised form 23 May 2008Accepted 13 August 2008
Keywords:Kathmandu valleyPM10
SeasonsCorrelation
* Corresponding author. Tel.: þ82 52 259 2864; faE-mail address: [email protected] (B.-K. Lee).
1352-2310/$ – see front matter � 2008 Published bdoi:10.1016/j.atmosenv.2008.08.016
a b s t r a c t
Data on ambient PM10 levels from six locations in the Kathmandu Valley recorded bymeans of continuous sampling using low volume air samplers from October 2002 to March2007 were used to investigate PM10 concentration dynamics in the valley. Monthly averagedata of the urban areas, which have much higher concentrations than the rural areas, evenexceeded the daily standard level of PM10, in Nepal, 120 mm m�3. Repetitive peaks andtroughs each year indicated annual patterns. Monthly average showed seasonal patternsare different between rural area and urban sites. The highest monthly average concen-tration was observed in February, the end of winter in urban areas where as in rural foundin spring, and the lowest concentration was observed in July (monsoon period). Thecontinuous increase in PM10 concentration from December to February in urban areasshowed accumulation of PM10 in the ambient air during the wintertime. Rainfall in Juneand September, during the monsoon period, caused a PM10 concentration decrease,demonstrating that precipitation is effective in removing PM10 from the valley. Crosscorrelation analyses among the PM10 levels measured simultaneously at the samplingstations showed a poor relationship in winter; however, there were good relationships inthe monsoon and post-monsoon seasons. Both the PM10 concentration and the air-mixingenvironment in the valley were closely associated with the temperature and wind speed.
� 2008 Published by Elsevier Ltd.
1. Introduction
Thoracic ambient particulate matter (PM10) is defined asparticles less than 10 mm in aerodynamic diameter. It iswell-documented that increased exposure to thoracic PM isassociated with various adverse health effects, such asrespiratory diseases, cardiovascular mortality, morbidity,and probably, malignant lung diseases (Donaldson andMacNee, 2001; Kan and Chen, 2003; Chang et al., 2005;Goldberg et al., 2006; Ostro et al., 2006). Ambient PM10
x: þ82 52 259 2629.
y Elsevier Ltd.
represents a complex mixture of anthropogenic and natu-rally occurring airborne particles. There is increasedevidence that most of the harmful components in PM10 areparticles formed from incomplete combustion of fossil fuelsand pyrolysis of organic materials. A plethora of chemicalshas been identified in contaminated ambient air, includingpolycyclic aromatic hydrocarbons (PAHs) and their nitro-and oxy-derivatives, strong acids and toxic metals (Fanget al., 2000; Lin et al., 2005). There have been many studiesof the association between the prevalence of different airpollutants and adverse human health outcomes. PM10
appears to be one of the most useful single measures of airpollution in a given area (US EPA, 1996; Kunzli et al., 2000;Schwartz, 2001). Most PM10 studies have been conducted
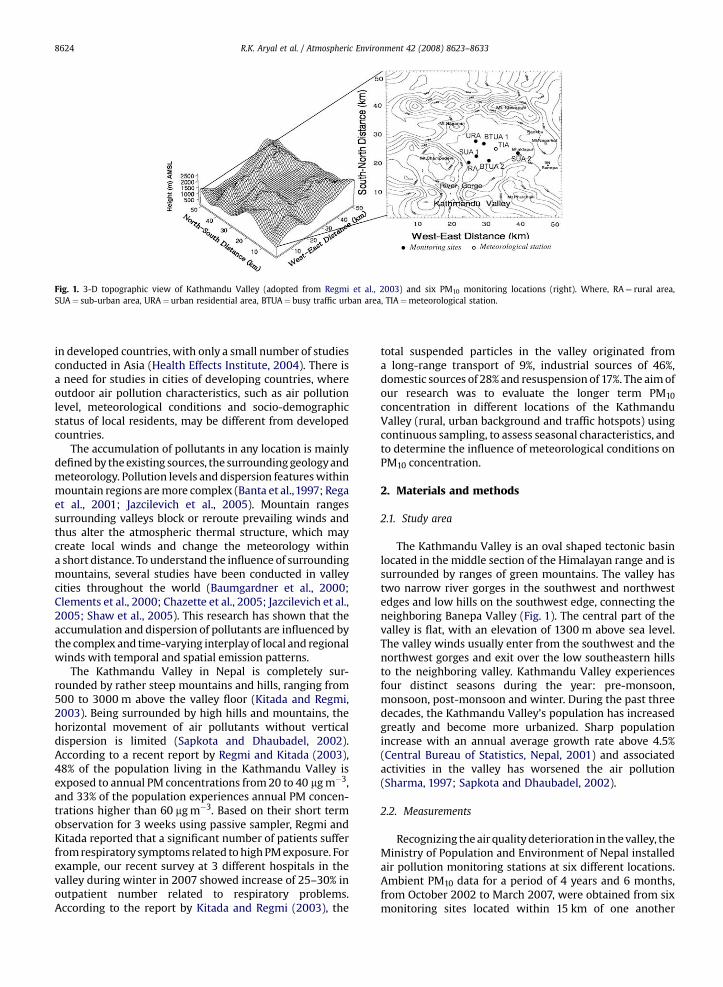
Fig. 1. 3-D topographic view of Kathmandu Valley (adopted from Regmi et al., 2003) and six PM10 monitoring locations (right). Where, RA¼ rural area,SUA¼ sub-urban area, URA¼ urban residential area, BTUA¼ busy traffic urban area, TIA¼meteorological station.
R.K. Aryal et al. / Atmospheric Environment 42 (2008) 8623–86338624
in developed countries, with only a small number of studiesconducted in Asia (Health Effects Institute, 2004). There isa need for studies in cities of developing countries, whereoutdoor air pollution characteristics, such as air pollutionlevel, meteorological conditions and socio-demographicstatus of local residents, may be different from developedcountries.
The accumulation of pollutants in any location is mainlydefined by the existing sources, the surrounding geology andmeteorology. Pollution levels and dispersion features withinmountain regions are more complex (Banta et al.,1997; Regaet al., 2001; Jazcilevich et al., 2005). Mountain rangessurrounding valleys block or reroute prevailing winds andthus alter the atmospheric thermal structure, which maycreate local winds and change the meteorology withina short distance. To understand the influence of surroundingmountains, several studies have been conducted in valleycities throughout the world (Baumgardner et al., 2000;Clements et al., 2000; Chazette et al., 2005; Jazcilevich et al.,2005; Shaw et al., 2005). This research has shown that theaccumulation and dispersion of pollutants are influenced bythe complex and time-varying interplay of local and regionalwinds with temporal and spatial emission patterns.
The Kathmandu Valley in Nepal is completely sur-rounded by rather steep mountains and hills, ranging from500 to 3000 m above the valley floor (Kitada and Regmi,2003). Being surrounded by high hills and mountains, thehorizontal movement of air pollutants without verticaldispersion is limited (Sapkota and Dhaubadel, 2002).According to a recent report by Regmi and Kitada (2003),48% of the population living in the Kathmandu Valley isexposed to annual PM concentrations from 20 to 40 mg m�3,and 33% of the population experiences annual PM concen-trations higher than 60 mg m�3. Based on their short termobservation for 3 weeks using passive sampler, Regmi andKitada reported that a significant number of patients sufferfrom respiratory symptoms related to high PM exposure. Forexample, our recent survey at 3 different hospitals in thevalley during winter in 2007 showed increase of 25–30% inoutpatient number related to respiratory problems.According to the report by Kitada and Regmi (2003), the
total suspended particles in the valley originated froma long-range transport of 9%, industrial sources of 46%,domestic sources of 28% and resuspension of 17%. The aim ofour research was to evaluate the longer term PM10
concentration in different locations of the KathmanduValley (rural, urban background and traffic hotspots) usingcontinuous sampling, to assess seasonal characteristics, andto determine the influence of meteorological conditions onPM10 concentration.
2. Materials and methods
2.1. Study area
The Kathmandu Valley is an oval shaped tectonic basinlocated in the middle section of the Himalayan range and issurrounded by ranges of green mountains. The valley hastwo narrow river gorges in the southwest and northwestedges and low hills on the southwest edge, connecting theneighboring Banepa Valley (Fig. 1). The central part of thevalley is flat, with an elevation of 1300 m above sea level.The valley winds usually enter from the southwest and thenorthwest gorges and exit over the low southeastern hillsto the neighboring valley. Kathmandu Valley experiencesfour distinct seasons during the year: pre-monsoon,monsoon, post-monsoon and winter. During the past threedecades, the Kathmandu Valley’s population has increasedgreatly and become more urbanized. Sharp populationincrease with an annual average growth rate above 4.5%(Central Bureau of Statistics, Nepal, 2001) and associatedactivities in the valley has worsened the air pollution(Sharma, 1997; Sapkota and Dhaubadel, 2002).
2.2. Measurements
Recognizing the air quality deterioration in the valley, theMinistry of Population and Environment of Nepal installedair pollution monitoring stations at six different locations.Ambient PM10 data for a period of 4 years and 6 months,from October 2002 to March 2007, were obtained from sixmonitoring sites located within 15 km of one another

R.K. Aryal et al. / Atmospheric Environment 42 (2008) 8623–8633 8625
(Fig.1). The six sampling sites include two busy traffic urbanareas (traffic hotspot), one residential area (urban back-ground), two semi-urban areas, and one rural area. The twourban traffic hotspots (BTUA1 and BTUA2) are characterizedby core commercial areas with higher traffic density. Theurban residential area (URA) is located at the heart of thecity, which is characterized by a commercial area withtourist attractions, where vehicles are restricted. Two semi-urban areas (SUA1 and SUA2) are located outside of the cityand thus have relatively low traffic. The land near the semi-urban areas is mostly covered with agricultural fields. Therural area (RA) is largely agricultural with negligible trafficactivities. The rural area also serves as a background of PM10
in the valley. Daily PM10 data, with some missing days, weremeasured by continuous sampling using low volume airsamplers (Instrumatic, Denmark, 85-02) with flow rate of2.3 m3 h�1. The PM10 air-monitors, which fulfilled allrequirements of EN12341, were custom designed specifi-cally for use in the Kathmandu Air Quality Monitoring
Fig. 2. Wind speed and direction observed
Program. The designed PM10 monitors used a reference inletaccording to the European Directive 1999/30/EG. Thesampler was adjusted from 760 (sea level) to 645 Torr(Kathmandu Valley) for mass flow meter (MFM) adjustmentbefore sampling. GF/F Whatman Microfibre QMA filterswere used for daily PM10 sample collection. The samplingfilters were kept in desiccators for 48 h at laboratorytemperature (22 �C) to minimize the effect of moisture onfilters before and after taking air samples. The measuringdevice contained 8 sampling heads containing the protec-tive roof with an impactor for pre-separation of particleslarger than 10 mm. Each holder contained sample filters.Magnetic valves regulated the opening and closing thesuction flow. Only one valve is open at a time and after a userdefined time interval (24 h), the open valve closed and thenext value in the series 1–8 opened. The valve collected airsamples for 24 h to get daily PM10 samples. After the 8thvalve, the cycle restarted again. The flow meter was regu-larly calibrated by means of the ABB flow meter every 3
in four seasons in Kathmandu Valley.
0
2
4
6
8
0:00:00 12:00:00 18:00:00 0:00:00
Day
Win
d sp
eed
(m/s
)
0
5
10
15
20
25
30
Tem
pera
ture
( º
C)
6:00:00
0:00:00 12:00:00 18:00:00 0:00:00
Day6:00:00
monsoon pre-monsoonwinter post-monsoon
monsoon pre-monsoonwinter post-monsoon
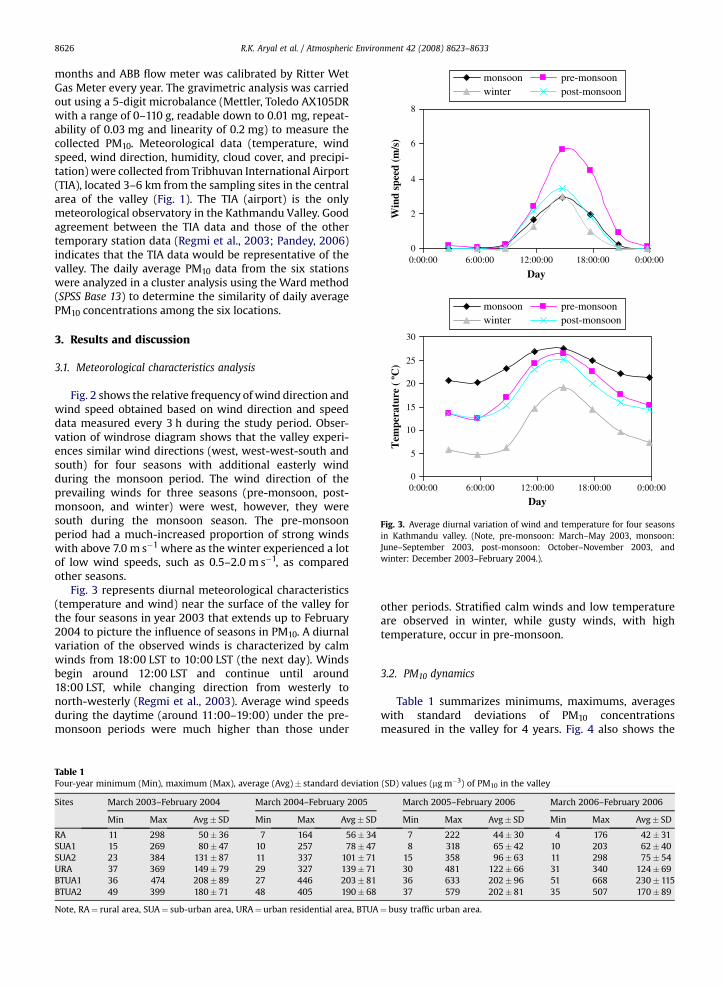
Fig. 3. Average diurnal variation of wind and temperature for four seasonsin Kathmandu valley. (Note, pre-monsoon: March–May 2003, monsoon:June–September 2003, post-monsoon: October–November 2003, andwinter: December 2003–February 2004.).
R.K. Aryal et al. / Atmospheric Environment 42 (2008) 8623–86338626
months and ABB flow meter was calibrated by Ritter WetGas Meter every year. The gravimetric analysis was carriedout using a 5-digit microbalance (Mettler, Toledo AX105DRwith a range of 0–110 g, readable down to 0.01 mg, repeat-ability of 0.03 mg and linearity of 0.2 mg) to measure thecollected PM10. Meteorological data (temperature, windspeed, wind direction, humidity, cloud cover, and precipi-tation) were collected from Tribhuvan International Airport(TIA), located 3–6 km from the sampling sites in the centralarea of the valley (Fig. 1). The TIA (airport) is the onlymeteorological observatory in the Kathmandu Valley. Goodagreement between the TIA data and those of the othertemporary station data (Regmi et al., 2003; Pandey, 2006)indicates that the TIA data would be representative of thevalley. The daily average PM10 data from the six stationswere analyzed in a cluster analysis using the Ward method(SPSS Base 13) to determine the similarity of daily averagePM10 concentrations among the six locations.
3. Results and discussion
3.1. Meteorological characteristics analysis
Fig. 2 shows the relative frequency of wind direction andwind speed obtained based on wind direction and speeddata measured every 3 h during the study period. Obser-vation of windrose diagram shows that the valley experi-ences similar wind directions (west, west-west-south andsouth) for four seasons with additional easterly windduring the monsoon period. The wind direction of theprevailing winds for three seasons (pre-monsoon, post-monsoon, and winter) were west, however, they weresouth during the monsoon season. The pre-monsoonperiod had a much-increased proportion of strong windswith above 7.0 m s�1 where as the winter experienced a lotof low wind speeds, such as 0.5–2.0 m s�1, as comparedother seasons.
Fig. 3 represents diurnal meteorological characteristics(temperature and wind) near the surface of the valley forthe four seasons in year 2003 that extends up to February2004 to picture the influence of seasons in PM10. A diurnalvariation of the observed winds is characterized by calmwinds from 18:00 LST to 10:00 LST (the next day). Windsbegin around 12:00 LST and continue until around18:00 LST, while changing direction from westerly tonorth-westerly (Regmi et al., 2003). Average wind speedsduring the daytime (around 11:00–19:00) under the pre-monsoon periods were much higher than those under
Table 1Four-year minimum (Min), maximum (Max), average (Avg)� standard deviation
Sites March 2003–February 2004 March 2004–February 2005
Min Max Avg� SD Min Max Avg� SD
RA 11 298 50� 36 7 164 56� 34SUA1 15 269 80� 47 10 257 78� 47SUA2 23 384 131� 87 11 337 101� 71URA 37 369 149� 79 29 327 139� 71BTUA1 36 474 208� 89 27 446 203� 81BTUA2 49 399 180� 71 48 405 190� 68
Note, RA¼ rural area, SUA¼ sub-urban area, URA¼ urban residential area, BTUA
other periods. Stratified calm winds and low temperatureare observed in winter, while gusty winds, with hightemperature, occur in pre-monsoon.
3.2. PM10 dynamics
Table 1 summarizes minimums, maximums, averageswith standard deviations of PM10 concentrationsmeasured in the valley for 4 years. Fig. 4 also shows the
(SD) values (mg m�3) of PM10 in the valley
March 2005–February 2006 March 2006–February 2006
Min Max Avg� SD Min Max Avg� SD
7 222 44� 30 4 176 42� 318 318 65� 42 10 203 62� 40
15 358 96� 63 11 298 75� 5430 481 122� 66 31 340 124� 6936 633 202� 96 51 668 230� 11537 579 202� 81 35 507 170� 89
¼ busy traffic urban area.
RA
0
50
100
150
200
250
0
50
100
150
200
250
0
50
100
150
200
250
0
50
100
150
200
250
0
50
100
150
200
250
SUA1 SUA2
BTUA2
URABTUA1
0
50
100
150
200
250
2003
2004
2005
2006
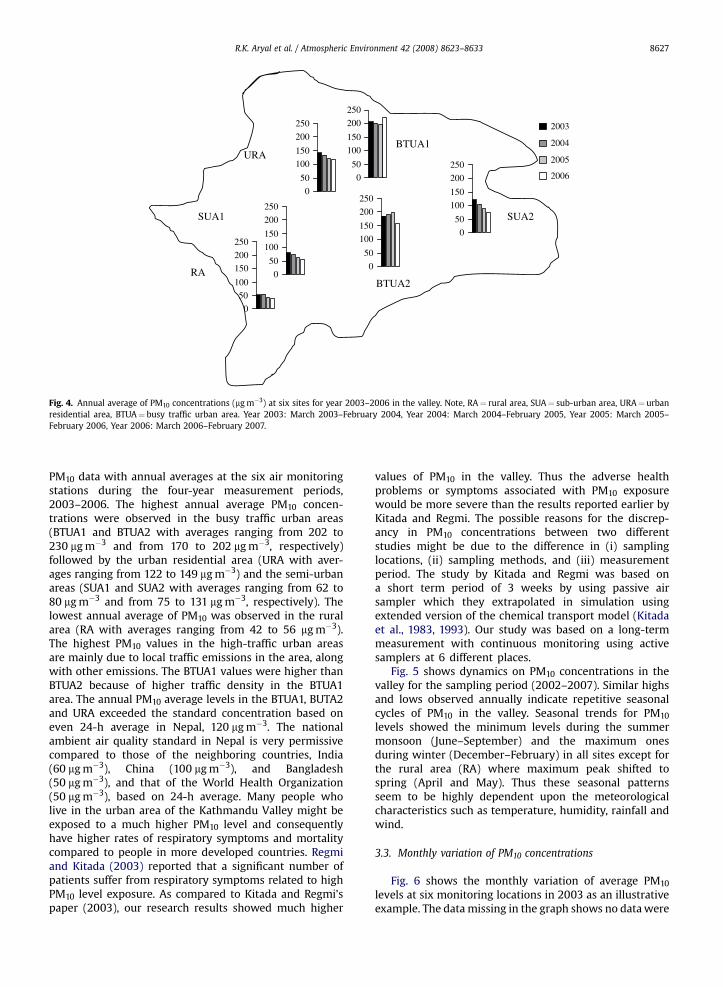
Fig. 4. Annual average of PM10 concentrations (mg m�3) at six sites for year 2003–2006 in the valley. Note, RA¼ rural area, SUA¼ sub-urban area, URA¼ urbanresidential area, BTUA¼ busy traffic urban area. Year 2003: March 2003–February 2004, Year 2004: March 2004–February 2005, Year 2005: March 2005–February 2006, Year 2006: March 2006–February 2007.
R.K. Aryal et al. / Atmospheric Environment 42 (2008) 8623–8633 8627
PM10 data with annual averages at the six air monitoringstations during the four-year measurement periods,2003–2006. The highest annual average PM10 concen-trations were observed in the busy traffic urban areas(BTUA1 and BTUA2 with averages ranging from 202 to230 mg m�3 and from 170 to 202 mg m�3, respectively)followed by the urban residential area (URA with aver-ages ranging from 122 to 149 mg m�3) and the semi-urbanareas (SUA1 and SUA2 with averages ranging from 62 to80 mg m�3 and from 75 to 131 mg m�3, respectively). Thelowest annual average of PM10 was observed in the ruralarea (RA with averages ranging from 42 to 56 mg m�3).The highest PM10 values in the high-traffic urban areasare mainly due to local traffic emissions in the area, alongwith other emissions. The BTUA1 values were higher thanBTUA2 because of higher traffic density in the BTUA1area. The annual PM10 average levels in the BTUA1, BUTA2and URA exceeded the standard concentration based oneven 24-h average in Nepal, 120 mg m�3. The nationalambient air quality standard in Nepal is very permissivecompared to those of the neighboring countries, India(60 mg m�3), China (100 mg m�3), and Bangladesh(50 mg m�3), and that of the World Health Organization(50 mg m�3), based on 24-h average. Many people wholive in the urban area of the Kathmandu Valley might beexposed to a much higher PM10 level and consequentlyhave higher rates of respiratory symptoms and mortalitycompared to people in more developed countries. Regmiand Kitada (2003) reported that a significant number ofpatients suffer from respiratory symptoms related to highPM10 level exposure. As compared to Kitada and Regmi’spaper (2003), our research results showed much higher
values of PM10 in the valley. Thus the adverse healthproblems or symptoms associated with PM10 exposurewould be more severe than the results reported earlier byKitada and Regmi. The possible reasons for the discrep-ancy in PM10 concentrations between two differentstudies might be due to the difference in (i) samplinglocations, (ii) sampling methods, and (iii) measurementperiod. The study by Kitada and Regmi was based ona short term period of 3 weeks by using passive airsampler which they extrapolated in simulation usingextended version of the chemical transport model (Kitadaet al., 1983, 1993). Our study was based on a long-termmeasurement with continuous monitoring using activesamplers at 6 different places.
Fig. 5 shows dynamics on PM10 concentrations in thevalley for the sampling period (2002–2007). Similar highsand lows observed annually indicate repetitive seasonalcycles of PM10 in the valley. Seasonal trends for PM10
levels showed the minimum levels during the summermonsoon (June–September) and the maximum onesduring winter (December–February) in all sites except forthe rural area (RA) where maximum peak shifted tospring (April and May). Thus these seasonal patternsseem to be highly dependent upon the meteorologicalcharacteristics such as temperature, humidity, rainfall andwind.
3.3. Monthly variation of PM10 concentrations
Fig. 6 shows the monthly variation of average PM10
levels at six monitoring locations in 2003 as an illustrativeexample. The data missing in the graph shows no data were

RA
0
100
200
300
400
500
600
700
10/1
5/02
4/13
/03
10/1
0/03
4/7/
04
10/4
/04
4/2/
05
9/29
/05
3/28
/06
9/24
/06
3/23
/07
Year
10/1
5/02
4/13
/03
10/1
0/03
4/7/
04
10/4
/04
4/2/
05
9/29
/05
3/28
/06
9/24
/06
3/23
/07
Year
10/1
5/02
4/13
/03
10/1
0/03
4/7/
04
10/4
/04
4/2/
05
9/29
/05
3/28
/06
9/24
/06
3/23
/07
Year
10/1
5/02
4/13
/03
10/1
0/03
4/7/
04
10/4
/04
4/2/
05
9/29
/05
3/28
/06
9/24
/06
3/23
/07
Year
10/1
5/02
4/13
/03
10/1
0/03
4/7/
04
10/4
/04
4/2/
05
9/29
/05
3/28
/06
9/24
/06
3/23
/07
Year
10/1
5/02
4/13
/03
10/1
0/03
4/7/
04
10/4
/04
4/2/
05
9/29
/05
3/28
/06
9/24
/06
3/23
/07
Year
PM
10 (
µg/m
3 )
0
100
200
300
400
500
600
700
PM
10 (
µg/m
3 )
0
100
200
300
400
500
600
700
PM
10 (
µg/m
3 )
0
100
200
300
400
500
600
700
PM
10 (
µg/m
3 )0
100
200
300
400
500
600
700
PM
10 (
µg/m
3 )
0
100
200
300
400
500
600
700
PM
10 (
µg/m
3 )
SUA1
SUA2 URA
BTUA1 BTUA2
Fig. 5. Daily PM10 concentrations in October 2002–March 2007 measured at the six monitoring sites. Note, RA¼ rural area, SUA¼ sub-urban area, URA¼ urbanresidential area, BTUA¼ busy traffic urban area.
R.K. Aryal et al. / Atmospheric Environment 42 (2008) 8623–86338628
available during the month due to instrumental problems.The PM10 average levels changes greatly with month. Themonthly variation of PM10 levels showed similar seasonalpatterns in most study locations (SUA2, URA, BTUA1 andBTUA2) except in RA. Much higher PM10 values wereidentified in all locations (except RA) in winter periods(December–February). However, the average PM10 valuesin spring were higher those in winter periods in RA. ThePM10 concentration reached a minimum in monsoonperiods (July–September) in all locations and started toincrease again in the post-monsoon periods (October–November). The high and low PM10 values indicate a strongseasonal influence. During winter, energy uses increasewith decreasing air temperature, leading to more airpollutants, such as PM10, NOx and SOx, which could form
secondary particulate matter. Low air temperature,combined with calm winds during the winter, reducesambient ventilation (Figs. 2 and 3). The increased airemissions and reduced ambient ventilations could causeincreased PM10 concentrations in the valley air duringwinter.
Even though the energy uses decreases with increasingair temperature during the transition from winter to spring,the PM10 concentrations do not change greatly. This isprobably because (i) the ambient ventilation may not besufficient to sweep out the PM10 from the valley in thebeginning of spring and (ii) the dry spring weatherproduces more fugitive emissions and pollens in April andMay that also contribute to PM10 levels. The two months(April and May) also experience strong gusty winds. Such

BTUA2 (2003)
RA (2003)
Jan
Feb
Mar
Apr
May
June
July
Aug Se
p
Oct
Nov
Dec Jan
Feb
Mar
Apr
May
June
July
Aug Se
p
Oct
Nov
Dec
Jan
Feb
Mar
Apr
May
June
July
Aug Se
p
Oct
Nov
Dec
Jan
Feb
Mar
Apr
May
June
July
Aug Se
p
Oct
Nov
Dec
Jan
Feb
Mar
Apr
May
June
July
Aug Se
p
Oct
Nov
Dec
Jan
Feb
Mar
Apr
May
June
July
Aug Se
p
Oct
Nov
Dec
0
100
200
300
400
500
PM
10 c
once
ntra
tion
(µg
/m3 )
0
100
200
300
400
500
PM
10 c
once
ntra
tion
(µg
/m3 )
0
100
200
300
400
500
PM
10 c
once
ntra
tion
(µg
/m3 )
0
100
200
300
400
500
PM
10 c
once
ntra
tion
(µg
/m3
)
0
100
200
300
400
500
PM
10 c
once
ntra
tion
(µg
/m3 )
0
100
200
300
400
500
PM
10 c
once
ntra
tion
(µg
/m3 )
BTUA1 (2003)
SUA1 (2003)
SUA2 (2003) URA (2003)
Fig. 6. Monthly variation of PM10 concentrations in year 2003. Note, RA¼ rural area, SUA¼ sub-urban area, URA¼ urban residential area, BTUA¼ busy trafficurban area.
R.K. Aryal et al. / Atmospheric Environment 42 (2008) 8623–8633 8629
winds may lift surface particles in the atmosphere, andthen add PM10 components to the air emissions. The lattereffect could be clearly seen in the RA and the SUA1compared to other highly urbanized areas, where thegreenery and open space areas are much higher comparedto the other measuring sites. As summer develops, the airtemperature increases, resulting in lower energy uses andthus lower air emissions. Summer also includes monsoonperiods which have lots of rainfall. Eighty percent of thetotal annual precipitation occurs during monsoon season.The increase in average air temperature during summerperiods generates upward movement of the air in thevalley, resulting in an increase of the ambient ventilation inthe valley. Furthermore, large amounts of PM10 compo-nents are removed by rainfall activities during monsoon
periods and are diluted by the increased ambient ventila-tion during summer.
Fig. 7 shows the relationship between daily averagePM10 levels and daily precipitation (mm) from pre-monsoon to monsoon periods (total number of dataN¼ 152). With every precipitation, the concentration ofPM10 largely reduced in the atmosphere. Dotted arrows(vertical) show the rainfall and its effect on PM10
concentration (only few are shown). Sharp dropping ofthe PM10 concentration, from about 400 to 100 mg m�3 inBTUA1 and 300 to 100 mg m�3 in BTUA2, was observed inthe monsoon period (June–September). In conclusion, lowair emissions combined with the removal mechanismminimized the PM10 concentration during the summer. Asthe temperature starts to drop again (following late

0
100
200
300
400
500
PM
10
(µg/
m3 )
0
50
100
150
Rainfall (m
m)
Pre-monsoon MonsoonTime
9/4/03
24/4/
03
9/5/03
24/5/
03
8/6/03
23/6/
03
8/7/03
23/7/
03
7/8/03
22/8/
03
6/9/03
21/9/
03
BUTA1 BUTA2 Rainfall
Fig. 7. Effect of rainfall (mm) on daily average PM10 concentration in two traffic hotspots (BTUA1 and BTUA2) in Kathmandu Valley (N¼ 152). Note, Dotted arrows(vertical) show the rainfall and its reduction effect on PM10 concentration (only few are shown).
R.K. Aryal et al. / Atmospheric Environment 42 (2008) 8623–86338630
September), energy use increases and PM10 values start torise.
3.4. Correlation
Fig. 8 shows the dendrogram plot obtained from dailyaverage PM10 concentrations at six stations for 2003–2004,using the cluster analysis with Z-score normalization. Z-score normalization changes the rate of attributes, and thusthey have same mean and variance [Z¼ (s�m)/s where: ‘z’refers to the z-score, ‘m’ is the estimate of the sample’smean, ‘s’ is the estimate of the sample’s standard deviation,and ‘s’ is an individual score within the distribution havingmean m and variance s]. Among the six stations, the ruralarea (RA) had the lowest PM10, likely due to the lowinfluence of traffic activities compared to other stations.Among the remaining, URA and BTUA1 were similar due tothe short distance between them (1.5 km). The close rela-tionship among the SUA1 and SUA2 and BTUA2 cannot beexplained at this moment.
Fig. 8. Relationship of PM10 concentrations
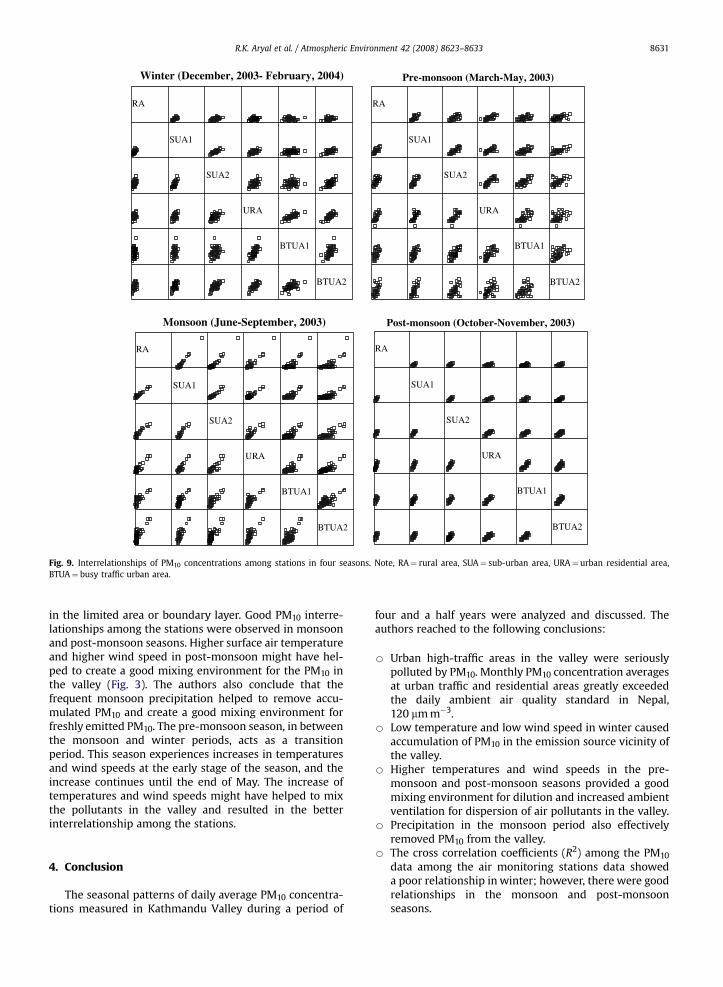
Fig. 9 shows the interrelationships among seasonalPM10 concentrations in 2003–2004. Table 2 also shows thecross correlation coefficient (R2) among the PM10 levelsmeasured at the stations in seasons 2003–2004. The rela-tionship between the stations is considered a good corre-lation if R2> 0.5. The coefficient of determination (R2)among the stations for PM10 data showed a poor relation-ship in winter; however, there were good relationships inthe monsoon and post-monsoon seasons. During winter,the Kathmandu Valley experiences a strongly stable andstratified cold air pond. The air in the valley becomesstagnant or temperature inversion occurs at night. Thetemperature inversion extends almost down to the ground,suggesting that the vertical mixing is strongly suppressedat the elevation where the pollution was emitted (Regmiet al., 2003). Small temperature and wind speed increasesfor relatively short periods in the afternoon helped to mixpollutants generated during the day. It is estimated thatsuch increase of temperatures and wind speeds is notsufficient to greatly disperse and mix the localized pollut-ants, and thus resulting in restriction of PM10 components
among the six monitoring stations.
RA
SUA1
SUA2
URA
BTUA1
BTUA2
Pre-monsoon (March-May, 2003)
RA
SUA1
SUA2
URA
BTUA1
BTUA2
Post-monsoon (October-November, 2003)
RA
SUA1
SUA2
URA
BTUA1
BTUA2
Winter (December, 2003- February, 2004)
RA
SUA1
SUA2
URA
BTUA1
BTUA2
Monsoon (June-September, 2003)
Fig. 9. Interrelationships of PM10 concentrations among stations in four seasons. Note, RA¼ rural area, SUA¼ sub-urban area, URA¼ urban residential area,BTUA¼ busy traffic urban area.
R.K. Aryal et al. / Atmospheric Environment 42 (2008) 8623–8633 8631
in the limited area or boundary layer. Good PM10 interre-lationships among the stations were observed in monsoonand post-monsoon seasons. Higher surface air temperatureand higher wind speed in post-monsoon might have hel-ped to create a good mixing environment for the PM10 inthe valley (Fig. 3). The authors also conclude that thefrequent monsoon precipitation helped to remove accu-mulated PM10 and create a good mixing environment forfreshly emitted PM10. The pre-monsoon season, in betweenthe monsoon and winter periods, acts as a transitionperiod. This season experiences increases in temperaturesand wind speeds at the early stage of the season, and theincrease continues until the end of May. The increase oftemperatures and wind speeds might have helped to mixthe pollutants in the valley and resulted in the betterinterrelationship among the stations.
4. Conclusion
The seasonal patterns of daily average PM10 concentra-tions measured in Kathmandu Valley during a period of
four and a half years were analyzed and discussed. Theauthors reached to the following conclusions:
B Urban high-traffic areas in the valley were seriouslypolluted by PM10. Monthly PM10 concentration averagesat urban traffic and residential areas greatly exceededthe daily ambient air quality standard in Nepal,120 mm m�3.
B Low temperature and low wind speed in winter causedaccumulation of PM10 in the emission source vicinity ofthe valley.
B Higher temperatures and wind speeds in the pre-monsoon and post-monsoon seasons provided a goodmixing environment for dilution and increased ambientventilation for dispersion of air pollutants in the valley.
B Precipitation in the monsoon period also effectivelyremoved PM10 from the valley.
B The cross correlation coefficients (R2) among the PM10
data among the air monitoring stations data showeda poor relationship in winter; however, there were goodrelationships in the monsoon and post-monsoonseasons.
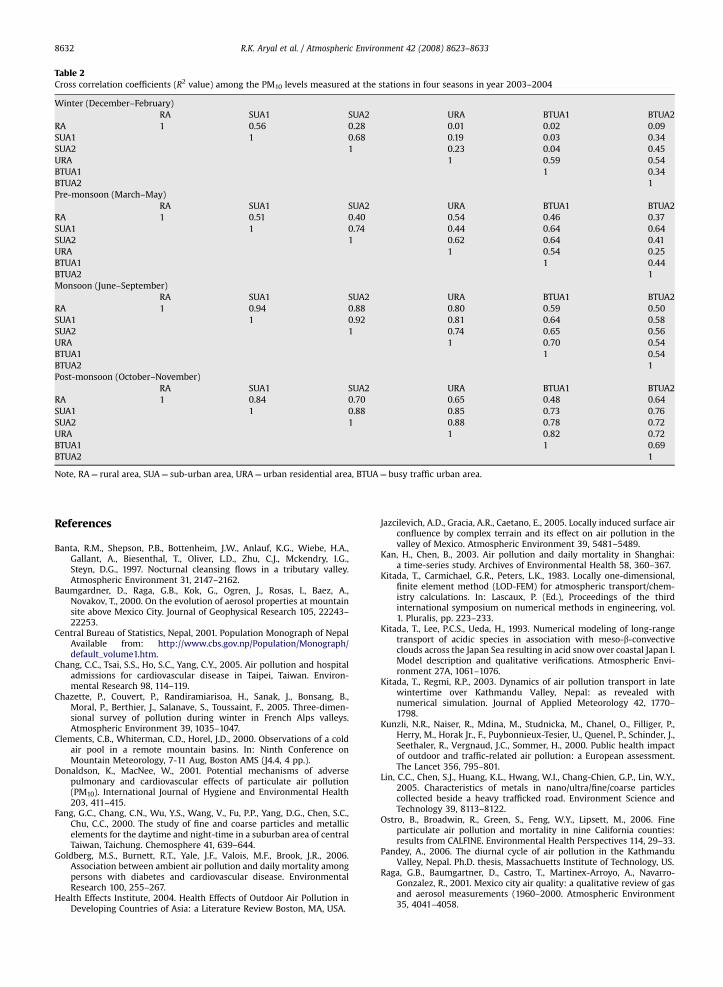
Table 2Cross correlation coefficients (R2 value) among the PM10 levels measured at the stations in four seasons in year 2003–2004
Winter (December–February)RA SUA1 SUA2 URA BTUA1 BTUA2
RA 1 0.56 0.28 0.01 0.02 0.09SUA1 1 0.68 0.19 0.03 0.34SUA2 1 0.23 0.04 0.45URA 1 0.59 0.54BTUA1 1 0.34BTUA2 1Pre-monsoon (March–May)
RA SUA1 SUA2 URA BTUA1 BTUA2RA 1 0.51 0.40 0.54 0.46 0.37SUA1 1 0.74 0.44 0.64 0.64SUA2 1 0.62 0.64 0.41URA 1 0.54 0.25BTUA1 1 0.44BTUA2 1Monsoon (June–September)
RA SUA1 SUA2 URA BTUA1 BTUA2RA 1 0.94 0.88 0.80 0.59 0.50SUA1 1 0.92 0.81 0.64 0.58SUA2 1 0.74 0.65 0.56URA 1 0.70 0.54BTUA1 1 0.54BTUA2 1Post-monsoon (October–November)
RA SUA1 SUA2 URA BTUA1 BTUA2RA 1 0.84 0.70 0.65 0.48 0.64SUA1 1 0.88 0.85 0.73 0.76SUA2 1 0.88 0.78 0.72URA 1 0.82 0.72BTUA1 1 0.69BTUA2 1
Note, RA¼ rural area, SUA¼ sub-urban area, URA¼ urban residential area, BTUA¼ busy traffic urban area.
R.K. Aryal et al. / Atmospheric Environment 42 (2008) 8623–86338632
References
Banta, R.M., Shepson, P.B., Bottenheim, J.W., Anlauf, K.G., Wiebe, H.A.,Gallant, A., Biesenthal, T., Oliver, L.D., Zhu, C.J., Mckendry, I.G.,Steyn, D.G., 1997. Nocturnal cleansing flows in a tributary valley.Atmospheric Environment 31, 2147–2162.
Baumgardner, D., Raga, G.B., Kok, G., Ogren, J., Rosas, I., Baez, A.,Novakov, T., 2000. On the evolution of aerosol properties at mountainsite above Mexico City. Journal of Geophysical Research 105, 22243–22253.
Central Bureau of Statistics, Nepal, 2001. Population Monograph of NepalAvailable from: http://www.cbs.gov.np/Population/Monograph/default_volume1.htm.
Chang, C.C., Tsai, S.S., Ho, S.C., Yang, C.Y., 2005. Air pollution and hospitaladmissions for cardiovascular disease in Taipei, Taiwan. Environ-mental Research 98, 114–119.
Chazette, P., Couvert, P., Randiramiarisoa, H., Sanak, J., Bonsang, B.,Moral, P., Berthier, J., Salanave, S., Toussaint, F., 2005. Three-dimen-sional survey of pollution during winter in French Alps valleys.Atmospheric Environment 39, 1035–1047.
Clements, C.B., Whiterman, C.D., Horel, J.D., 2000. Observations of a coldair pool in a remote mountain basins. In: Ninth Conference onMountain Meteorology, 7-11 Aug, Boston AMS (J4.4, 4 pp.).
Donaldson, K., MacNee, W., 2001. Potential mechanisms of adversepulmonary and cardiovascular effects of particulate air pollution(PM10). International Journal of Hygiene and Environmental Health203, 411–415.
Fang, G.C., Chang, C.N., Wu, Y.S., Wang, V., Fu, P.P., Yang, D.G., Chen, S.C.,Chu, C.C., 2000. The study of fine and coarse particles and metallicelements for the daytime and night-time in a suburban area of centralTaiwan, Taichung. Chemosphere 41, 639–644.
Goldberg, M.S., Burnett, R.T., Yale, J.F., Valois, M.F., Brook, J.R., 2006.Association between ambient air pollution and daily mortality amongpersons with diabetes and cardiovascular disease. EnvironmentalResearch 100, 255–267.
Health Effects Institute, 2004. Health Effects of Outdoor Air Pollution inDeveloping Countries of Asia: a Literature Review Boston, MA, USA.
Jazcilevich, A.D., Gracia, A.R., Caetano, E., 2005. Locally induced surface airconfluence by complex terrain and its effect on air pollution in thevalley of Mexico. Atmospheric Environment 39, 5481–5489.
Kan, H., Chen, B., 2003. Air pollution and daily mortality in Shanghai:a time-series study. Archives of Environmental Health 58, 360–367.
Kitada, T., Carmichael, G.R., Peters, L.K., 1983. Locally one-dimensional,finite element method (LOD-FEM) for atmospheric transport/chem-istry calculations. In: Lascaux, P. (Ed.), Proceedings of the thirdinternational symposium on numerical methods in engineering, vol.1. Pluralis, pp. 223–233.
Kitada, T., Lee, P.C.S., Ueda, H., 1993. Numerical modeling of long-rangetransport of acidic species in association with meso-b-convectiveclouds across the Japan Sea resulting in acid snow over coastal Japan I.Model description and qualitative verifications. Atmospheric Envi-ronment 27A, 1061–1076.
Kitada, T., Regmi, R.P., 2003. Dynamics of air pollution transport in latewintertime over Kathmandu Valley, Nepal: as revealed withnumerical simulation. Journal of Applied Meteorology 42, 1770–1798.
Kunzli, N.R., Naiser, R., Mdina, M., Studnicka, M., Chanel, O., Filliger, P.,Herry, M., Horak Jr., F., Puybonnieux-Tesier, U., Quenel, P., Schinder, J.,Seethaler, R., Vergnaud, J.C., Sommer, H., 2000. Public health impactof outdoor and traffic-related air pollution: a European assessment.The Lancet 356, 795–801.
Lin, C.C., Chen, S.J., Huang, K.L., Hwang, W.I., Chang-Chien, G.P., Lin, W.Y.,2005. Characteristics of metals in nano/ultra/fine/coarse particlescollected beside a heavy trafficked road. Environment Science andTechnology 39, 8113–8122.
Ostro, B., Broadwin, R., Green, S., Feng, W.Y., Lipsett, M., 2006. Fineparticulate air pollution and mortality in nine California counties:results from CALFINE. Environmental Health Perspectives 114, 29–33.
Pandey, A., 2006. The diurnal cycle of air pollution in the KathmanduValley, Nepal. Ph.D. thesis, Massachuetts Institute of Technology, US.
Raga, G.B., Baumgartner, D., Castro, T., Martinex-Arroyo, A., Navarro-Gonzalez, R., 2001. Mexico city air quality: a qualitative review of gasand aerosol measurements (1960–2000. Atmospheric Environment35, 4041–4058.

R.K. Aryal et al. / Atmospheric Environment 42 (2008) 8623–8633 8633
Regmi, R.P., Kitada, T., Kurata, G., 2003. Numerical simulation of latewintertime local flows in Kathmandu Valley, Nepal: implication forair pollution transport. Journal of Applied Meteorology 42,389–403.
Regmi, R.P., Kitada, T., 2003. Human-air pollution exposure map of theKathmandu Valley, Nepal: assessment based on chemical transportsimulation. Journal of Global Environmental Engineering 9, 89–109.
Sapkota, B., Dhaubadel, R., 2002. Atmospheric turbidity over KathmanduValley. Atmospheric Environment 36, 1249–1257.
Schwartz, J., 2001. Is there harvesting in the association of airborne particleswith daily death and hospital admissions? Epidemiology 12, 55–61.
Sharma, C.K., 1997. Urban air quality of Kathmandu Valley ‘‘Kingdom ofNepal’’. Atmospheric Environment 31, 2877–2883.
Shaw, W.J., Doran, J.C., Coulter, R.L., 2005. Boundary-layer evolution overPhoenix Arizona and the premature mixing of pollutants in the earlymorning. Atmospheric Environment 39, 773–786.
US EPA, 1996. Air Quality Criteria for Particulate Matter. Office of Researchand Development, Management Association, 47, pp. 551–581.