Comparison between 2D and 3D computed tomography evaluation of glenoid bone defect in unilateral...
10
Radiol med (2012) 117:102–111 DOI 10.1007/s11547-011-0712-7 Abstract Purpose. This study evaluated the agreement between 2D and 3D computed tomography (CT) measurements in identifying the size and type of glenoid-bone defect in anterior glenohumeral instability. Materials and methods. One hundred patients affected by unilateral anterior glenohumeral instability underwent a CT of both shoulders. Images were processed with both 2D [multiplanar reconstruction (MPR)] and 3D [volume- rendering (VR)] methods. The area of the missing glenoid was calculated in comparison with the healthy glenoid and expressed as a percentage. Agreement between the two measurements was assessed according to the Bland-Altman method; a 5% mean difference was considered as clinically relevant. Results. Analysis of agreement between MPR and VR measurements of the percentage of missing glenoid showed a mean difference equal to 0.62%±1.96%. Percent agreement between the two measurements in detecting the presence of bone defect was 97% (p<0.0001). Percent agreement between the two measurements in discriminating the type of bone defect was 97% (p<0.0001). Conclusions. Agreement between 2D (MPR) and 3D (VR) CT measurements to identify the size and type of glenoid-bone defect in anterior glenohumeral instability was so high that the two measurements can be considered interchangeable. Riassunto Obiettivo. Scopo del nostro lavoro è stato valutare la concordanza tra misurazioni bidimensionali (2D) e tridimensionali (3D) con tomografia computerizzata (TC) nella identificazione delle dimensioni e del tipo di difetto osseo di glena nell’instabilità gleno-omerale anteriore. Materiali e metodi. Cento pazienti con instabilità gleno- omerale anteriore monolaterale hanno eseguito esame TC delle spalle. Le immagini sono state riformate sia con il metodo 2D (multi-planar reconstruction, MPR) che 3D (volume rendering technique, VRT). L’area del difetto di glena è stata calcolata in confronto con la glena sana ed è stata espressa in percentuale. La concordanza tra le due misurazioni è stata valutata con il metodo Bland- Altman; una differenza media del 5% è stata considerata clinicamente significativa. Risultati. L’analisi della concordanza tra le misurazioni MPR e VRT della percentuale di glena mancante ha mostrato una differenza media di 0,62%±1,96%. La concordanza percentuale tra le due misurazioni nel valutare la grandezza del difetto osseo è stata del 97% (p<0,0001). La concordanza percentuale nel discriminare il tipo di difetto osseo è stata del 97% (p<0,0001). Conclusioni. La concordanza tra misurazioni TC 2D (MPR) e 3D (VRT) nell’identificare le dimensioni ed il tipo di difetto osseo di glena nell’instabilità gleno- omerale anteriore è stata così alta da poterle considerare intercambiabili. MUSCULOSKELETAL RADIOLOGY RADIOLOGIA MUSCOLOSCHELETRICA Comparison between 2D and 3D computed tomography evaluation of glenoid bone defect in unilateral anterior gleno-humeral instability Confronto tra ricostruzioni 2D e 3D nella valutazione mediante tomografia computerizzata del difetto osseo glenoideo nella instabilità gleno-omerale anteriore monolaterale N. Magarelli 1 • G. Milano 2 • P. Baudi 3 • D.A. Santagada 2 • P. Righi 4 • V. Spina 3 • A. Leone 1 R. Amelia 1 • C. Fabbriciani 2 • L. Bonomo 1 1 Dipartimento di Bioimmagini e Scienze Radiologiche, Università Cattolica del Sacro Cuore, Policlinico “A. Gemelli”, Largo A. Gemelli 8, 00168 Roma, Italy 2 Dipartimento di Ortopedia e Traumatologia, Università Cattolica del Sacro Cuore, Policlinico “A. Gemelli”, Roma, Italy 3 Dipartimento di Ortopedia, Ospedale “Ramazzini”, Carpi, Italy 4 Dipartimento di Ortopedia, Ospedale “San Camillo”, Forte dei Marmi, Italy Correspondence to: N. Magarelli, Tel.: +39-06-30155337, Fax: 06-35501928, e-mail: [email protected] Received: 10 December 2010 / Accepted: 28 January 2011 / Published online: 10 July 2011 © Springer-Verlag 2011
-
Upload
independent -
Category
Documents
-
view
8 -
download
0
Transcript of Comparison between 2D and 3D computed tomography evaluation of glenoid bone defect in unilateral...

Radiol med (2012) 117:102–111DOI 10.1007/s11547-011-0712-7
AbstractPurpose. This study evaluated the agreement between 2D and 3D computed tomography (CT) measurements in identifying the size and type of glenoid-bone defect in anterior glenohumeral instability.Materials and methods. One hundred patients affected by unilateral anterior glenohumeral instability underwent a CT of both shoulders. Images were processed with both 2D [multiplanar reconstruction (MPR)] and 3D [volume-rendering (VR)] methods. The area of the missing glenoid was calculated in comparison with the healthy glenoid and expressed as a percentage. Agreement between the two measurements was assessed according to the Bland-Altman method; a 5% mean difference was considered as clinically relevant.Results. Analysis of agreement between MPR and VR measurements of the percentage of missing glenoid showed a mean difference equal to 0.62%±1.96%. Percent agreement between the two measurements in detecting the presence of bone defect was 97% (p<0.0001). Percent agreement between the two measurements in discriminating the type of bone defect was 97% (p<0.0001).Conclusions. Agreement between 2D (MPR) and 3D (VR) CT measurements to identify the size and type of glenoid-bone defect in anterior glenohumeral instability was so high that the two measurements can be considered interchangeable.
RiassuntoObiettivo. Scopo del nostro lavoro è stato valutare la concordanza tra misurazioni bidimensionali (2D) e tridimensionali (3D) con tomografia computerizzata (TC) nella identificazione delle dimensioni e del tipo di difetto osseo di glena nell’instabilità gleno-omerale anteriore.Materiali e metodi. Cento pazienti con instabilità gleno-omerale anteriore monolaterale hanno eseguito esame TC delle spalle. Le immagini sono state riformate sia con il metodo 2D (multi-planar reconstruction, MPR) che 3D (volume rendering technique, VRT). L’area del difetto di glena è stata calcolata in confronto con la glena sana ed è stata espressa in percentuale. La concordanza tra le due misurazioni è stata valutata con il metodo Bland-Altman; una differenza media del 5% è stata considerata clinicamente significativa.Risultati. L’analisi della concordanza tra le misurazioni MPR e VRT della percentuale di glena mancante ha mostrato una differenza media di 0,62%±1,96%. La concordanza percentuale tra le due misurazioni nel valutare la grandezza del difetto osseo è stata del 97% (p<0,0001). La concordanza percentuale nel discriminare il tipo di difetto osseo è stata del 97% (p<0,0001).Conclusioni. La concordanza tra misurazioni TC 2D (MPR) e 3D (VRT) nell’identificare le dimensioni ed il tipo di difetto osseo di glena nell’instabilità gleno-omerale anteriore è stata così alta da poterle considerare intercambiabili.
MUSCULOSKELETAL RADIOLOGYRADIOLOGIA MUSCOLOSCHELETRICA
Comparison between 2D and 3D computed tomography evaluation of glenoid bone defect in unilateral anterior gleno-humeral instability
Confronto tra ricostruzioni 2D e 3D nella valutazione mediante tomografia computerizzata del difetto osseo glenoideo nella instabilità gleno-omerale anteriore monolaterale
N. Magarelli1 • G. Milano2 • P. Baudi3 • D.A. Santagada2 • P. Righi4 • V. Spina3 • A. Leone1 R. Amelia1 • C. Fabbriciani2 • L. Bonomo1
1Dipartimento di Bioimmagini e Scienze Radiologiche, Università Cattolica del Sacro Cuore, Policlinico “A. Gemelli”, Largo A. Gemelli 8, 00168 Roma, Italy2Dipartimento di Ortopedia e Traumatologia, Università Cattolica del Sacro Cuore, Policlinico “A. Gemelli”, Roma, Italy3Dipartimento di Ortopedia, Ospedale “Ramazzini”, Carpi, Italy4Dipartimento di Ortopedia, Ospedale “San Camillo”, Forte dei Marmi, ItalyCorrespondence to: N. Magarelli, Tel.: +39-06-30155337, Fax: 06-35501928, e-mail: [email protected]
Received: 10 December 2010 / Accepted: 28 January 2011 / Published online: 10 July 2011© Springer-Verlag 2011

Radiol med (2012) 117:102–111 103
Parole chiave Spalla · Instabilità · Glena · Difetto osseo · Tomografia computerizzata
Introduzione
Il difetto osseo glenoideo è attualmente considerato uno dei principali fattori che inficiano la stabilità gleno-omerale [1–5]. Diversi studi clinici hanno riportato che la dislo-cazione ricorrente di spalla dopo trattamento chirurgico è frequentemente associata con il difetto osseo glenoideo e che la correlazione tra entità di recidiva e percentuale del difetto osseo è clinicamente rilevante [6–10]. Sulla ba- se di questi risultati, le più recenti linee guida sul tratta-mento dell’instabilità di spalla considerano la capsulo-plastica artroscopica controindicata e raccomandano le tecniche a cielo aperto attraverso la ricostruzione ossea o l’aumento della superficie ossea in caso di difetti maggiori [11, 12].
Differenti modalità di imaging impiegate per misurare la presenza e la dimensione del difetto osseo sono state descrit-te in letteratura [13–19]. In particolare, molti autori hanno riportato l’uso della tomografia computerizzata (TC) al fine di stabilire dimensioni, sede e tipo (frattura o erosione) del difetto glenoideo associato con l’instabilità gleno-omerale utilizzando ricostruzioni tridimensionali (3D) volume ren-dering technique (VRT) [15, 19–23], o bidimensionali (2D) multi-planar reconstruction (MPR) [14, 24–27]. La por-zione mancante della glena misurata sulle acquisizioni TC può essere calcolata come percentuale dell’area della glena inferiore (metodo del cerchio) [15, 19, 24], o percentuale dell’ampiezza massima della glena [14, 21, 25, 26]. Sebbe-ne la TC sia considerata attualmente lo standard di riferi-mento per la valutazione del difetto glenoideo, le differenze nelle tecniche di imaging e nei metodi di misurazione rendo-no il confronto dei risultati riportati in letteratura alquanto inaffidabile.
Lo scopo del presente lavoro è stato valutare la concor-danza tra le misurazioni TC VRT e MPR utilizzando il meto-do del cerchio per stimare la presenza, dimensione e tipo di difetto glenoideo in pazienti con instabilità gleno-omerale anteriore.
Materiali e metodi
Il presente lavoro è stato condotto come studio osservazio-nale trasversale. Il protocollo ed il consenso informato sono stati approvati dal comitato di revisione istituzionale. Scopo principale dello studio è stato valutare la concordanza tra le misurazioni MPR e VRT nel quantificare il difetto osseo glenoideo. Scopi secondari sono stati stabilire la concor-
Keywords Shoulder · Instability · Glenoid · Bone defect · Computed tomography
Introduction
Glenoid-bone defect is considered one of the factors that most affect glenohumeral stability [1–5]. Several clinical studies have reported that recurrence of shoulder disloca-tion after surgical treatment is frequently associated with glenoid-bone defects and that the correlation between re-currence rate and percentage of glenoid-bone loss is clini-cally relevant [6–10]. Based on these results, the most recent guidelines for treating shoulder instability consider arthro-scopic capsular repair as contraindicated and recommend open procedures, with bone reconstruction or augmentation when major glenoid-bone loss is present [11, 12].
Several imaging techniques to measure the presence and size of a glenoid defect are described in the literature [13–19]. In particular, many authors report on the use of computed tomography (CT) to identify size, location and type (fracture or erosion) of glenoid defect associated with glenohumeral instability using 3D volume-rendering (VR) scans [19–23] or 2D multiplanar reconstruction (MPR) [14, 24–27]. The missing portion of the glenoid on CT scans can be calculated as a percentage of the area of the inferior gle-noid (circle method) [15, 19, 24] or as a percentage of the maximum width of the glenoid [14, 21, 25, 26]. Although CT is considered the reference standard for evaluating gle-noid-bone defect, differences in imaging techniques and measurement methods make comparison of results reported in the literature rather unreliable.
The purpose of this study was to evaluate the agreement between VR and MPR CT measurements using the circle method to assess presence, size and type of glenoid-bone de-fect in patients affected by anterior glenohumeral instability.
Materials and methods
This was a cross-sectional observational study. The protocol and informed consent process were approved by the local In-stitutional Review Board. The primary outcome was agree-ment between MPR and VR CT measurements to quantify glenoid-bone loss. Secondary outcomes included agreement between the two measurements for assessing the presence of a glenoid defect and discriminating the type of bone defect (erosion or fracture).
Patient selection
One hundred patients who accepted our invitation to enter

104 Radiol med (2012) 117:102–111
danza tra le due misurazioni nel valutare la presenza del difetto glenoideo e nel discriminare il tipo di difetto osseo (erosione o frattura).
Selezione dei pazienti
Per il presente studio sono stati arruolati 100 pazienti, pre-vio consenso informato. Lo studio ha incluso 83 maschi e 17 femmine. L’età media (±deviazione standard, SD) dei pa-zienti era 30,8±9,5 anni (range: 15–49 anni). Il principale criterio di inclusione è stato l’instabilità anteriore monola-terale di spalla con almeno un episodio di dislocazione. I criteri di esclusione sono stati: soggetti che presentavano instabilità di spalla controlaterale e precedenti fratture e/o interventi chirurgici ad entrambe le spalle.
Tecnica TC
Tutti i pazienti sono stati sottoposti ad esame TC delle spal-le in comparativa utilizzando apparecchio TC spirale mul-tidetettore (LightSpeed Pro16, GE Healthcare, Milwaukee, WI), usando filtro bone, strati dello spessore di 1,25 mm, con intervallo di ricostruzione di 0,6 mm, 200–300 mA, 120 kV, campo di vista (FOV) di 30 cm e matrice di 512×512 pixel. Il piano di scansione è stato esteso dall’articolazione acromion-claveare sino subito al di sotto della glena. Le immagini sono state rielaborate con workstation (Advan-tage, version 4.2, GE Healthcare) in MPR secondo piani sagittali obliqui mantenendo l’asse parallelo alla superfi-cie glenoidea, in modo da ottenere immagini sagittali della superficie articolare della glena (en face view). In questa ricostruzione frontale della glena controlaterale sana, se-condo il metodo Pico descritto da Baudi et al. [24], è stata tracciata un’area circonferenziale sulla porzione inferiore della glena utilizzando il software di analisi digitale della workstation. È stato utilizzato il cerchio che meglio si adat-tava alla porzione inferiore della glena, utilizzando come repere la corticale esterna. Successivamente, un’area cir-conferenziale identica è stata tracciata sulla glena affetta. La porzione mancante del cerchio corrispondente al difetto osseo è stata tracciata manualmente e sono state misurate l’area dell’intera circonferenza (A) e della porzione man-cante del cerchio (D) utilizzando il software di analisi di-gitale della workstation (Fig. 1). Le dimensioni del difetto sono state espresse come percentuale dell’intero cerchio secondo la seguente formula, già riportata nei precedenti studi [15, 19, 24]:
[(Area D/Area A)×100]Le stesse acquisizioni sono state poi elaborate secondo
ricostruzioni VRT 3D della glena. Dopo aver eliminato la testa omerale durante la rielaborazione dell’immagine, sono state ottenute le proiezioni en face di entrambe le gle-ne ed è stata calcolata la dimensione del difetto osseo uti-
the study and who signed an informed consent form were prospectively enlisted. The study included 83 men and 17 women. Mean age [± standard deviation (SD)] was 30.8±9.5 (range 15–49) years. The primary inclusion criterion was unilateral anterior shoulder instability with at least one epi-sode of dislocation. Patients meeting the following criteria were excluded from the study: contralateral shoulder insta-bility, previous fractures and/or surgery to both shoulders.
CT examination technique
All patients underwent a CT scan of both shoulders with a spiral multislice CT (LightSpeed Pro16; GE Healthcare, Milwaukee, WI, USA) using filter for bone, 1.25-mm slice thickness with reconstruction interval 0.6 mm, 200–300 mA, 120 kV, field of view (FOV) 30 cm and matrix 512×512 pix-els. The scanning plane extended from the acromion-clavic-ular joint to just below the glenoid. Images were processed on a commercially available workstation (Advantage, ver-sion 4.2; GE Healthcare) in MPR according to oblique sag-ittal planes and maintaining working axes parallel to the gle-noid surface to obtain oblique sagittal images of the glenoid articular surface (en face view). On this frontal image of the contralateral healthy glenoid, according to the Pico method described by Baudi et al. [24], a circumferential area was drawn on the inferior part of the glenoid using the digital analysis software of the workstation. The best fitting circle on the inferior glenoid was used by selecting the outer cor-tex of the inferior glenoid as a landmark. Therefore, an iden-tical circumferential area was drawn on the affected glenoid. The missing part of the circle corresponding to the glenoid defect was manually drawn, and the area of the entire circle (A) and the missing part of the circle (D) were measured using the digital analysis software of the workstation (Fig. 1). The size of the defect was expressed as a percentage of the entire circle, according to the following formula, already reported in previous studies [15, 19, 24]:
[(Area D / Area A)×100]The same scans were then processed using VR for 3D
reconstruction of the glenoid. After eliminating the humeral head during the 3D image-creation process, en face views of both glenoids were obtained, and the size of the bone defect was calculated using the above-described method for quantification of glenoid defect on 2D images (Fig. 2). Each data set was acquired by one of two radiologists well-ex-perienced in musculoskeletal imaging. Each examiner was blind to the results of the other measurement series.
Data analysis
Sample size calculation was based on the primary outcome (agreement between the two measurements for quantifica-tion of glenoid-bone loss). According to estimates provided

Radiol med (2012) 117:102–111 105
lizzando il sopradescritto metodo per la quantificazione del difetto osseo usato sulle immagini 2D (Fig. 2). I dati sono stati raccolti da uno dei due radiologi esperti nell’imaging muscolo-scheletrico. Ogni esaminatore era all’oscuro dei risultati delle altre misurazioni.
by Bland [28], a sample size of 100 gives a 95% confi-dence interval (CI) of limits of agreement about ±0.34 s, (s=standard deviation of the differences between the two measurements). Data analysis was performed with statisti-cal software (SPSS v13; SPSS Inc, Chicago, IL, USA). The
Fig. 1a,b Patient with right glenohumeral instability. a MPR in the oblique sagittal plane (en face view) of the unaffected left glenoid. A fitting circle on the inferior glenoid, by selecting the outer cortex as a landmark, was drawn. b An identical circle was drawn on the affected glenoid (right shoulder). Bone defect was considered as the missing part of the circle. The areas of the entire circle (A) and the bone defect (D) were measured.
Fig. 1a,b Paziente affetto da instabilità gleno-omerale destra. a MPR su un piano sagittale obliquo (en face view) della glena sinistra sana. È stata dise-gnata una circonferenza sulla porzione inferiore della glena, utilizzando come repere la corticale esterna. b Una circonferenza identica è stata disegnata sulla glena affetta (spalla destra). Il difetto osseo è stato considerato equivalente alla porzione mancante della circonferenza. Sono state misurate le aree dell’intera circonferenza (A) e del difetto osseo (D).
a b
Fig. 2a,b Quantification of glenoid-bone defect using the circle method on volume-rendering technique scans. a En face view of the left unaffected shoulder. b Measurement of the missing part of the glenoid on the right affected shoulder.
Fig. 2a,b Quantificazione del difetto osseo di glena utilizzando il metodo della circonferenza su immagini VRT. a En face view della glena sinistra sana. b Misurazione della porzione mancante della glena sulla spalla destra affetta.
a b

106 Radiol med (2012) 117:102–111
Analisi dei dati
Il calcolo delle dimensioni del campione è stato basato sullo scopo principale (concordanza tra le due misurazioni nel-la quantificazione della perdita ossea glenoidea). Secondo le stime stabilite da Bland [28], una numerosità di 100 del campione dà un 95% dell’intervallo di confidenza (CI) dei limiti di concordanza di circa ±0,34 s (dove s=deviazione standard di differenze tra due misurazioni). L’analisi dei dati è stata eseguita mediante software statistico (SPSS v13, SPSS Inc, Chicago, IL). Il metodo Bland-Altman è stato usato per valutare la concordanza tra le misurazioni ottenute con le ri-costruzioni MPR e VRT per la quantificazione del difetto os-seo di glena [29]. Secondo questo metodo, noi abbiamo cal-colato per ogni paziente la differenza tra le misurazioni del difetto osseo di glena ottenute con i due metodi e la media delle due misure; poi abbiamo calcolato media (d) e devia-zione standard (s) delle differenze. I dati sono stati riportati in uno scatter plot delle differenze (asse y) sulle medie (asse x), dove il limite superiore ed inferiore della concordanza è stato considerato come d±2s. Sono stati calcolati l’errore standard e il 95% CI per d e limiti di concordanza, per ot-tenere una maggiore precisione dei limiti stimati di concor-danza. Secondo questo metodo, i due metodi di misurazione possono essere considerati intercambiabili quando i limiti di concordanza sono entro differenze non clinicamente impor-tanti [29]. Per il presente studio abbiamo considerato come clinicamente importante una differenza tra le due misurazio-ni maggiore del 5%. La concordanza tra le due misurazioni nello stabilire la presenza di difetto osseo è stata stimata cal-colando la percentuale di concordanza. La significatività di concordanza tra le due misurazioni è stata analizzata con il χ2 test. La forza di concordanza è stata valutata mediante il coefficiente kappa. La valutazione di concordanza tra i due metodi nel discriminare il tipo di difetto osseo è stata ese-guita considerando tre categorie (assenza di difetto, lesione bony Bankart ed erosione ossea) e calcolando la percentuale di concordanza. La lesione bony Bankart è stata identificata osservando la presenza di frattura della glena anteriore, con frammento osseo libero adiacente alla rima glenoidea o ri-attaccato medialmente sul collo glenoideo. L’erosione ossea è stata considerata quando la perdita ossea è stata osservata in assenza di frammento osseo distaccato [25]. La significa-tività di concordanza tra i due metodi è stata analizzata con χ2 test. La forza di concordanza è stata valutata calcolando il coefficiente κ pesato secondo il metodo di pesatura qua-dratica.
Risultati
L’analisi della concordanza tra le misurazioni MPR e VRT della percentuale di perdita ossea di glena (Fig. 3) ha mostrato una
Bland–Altman method was used to assess agreement be-tween MPR and VR CT measurements for quantifying gle-noid-bone defect [29]. According to this method, we calcu-lated the difference between measurements of glenoid-bone defect obtained with the two methods and the mean of the two measurements; we then calculated mean (d) and stand-ard deviation (s) of the differences. Data were reported in a scatter plot of differences (y-axis) against means (x-axis), where upper and lower limits of agreement were considered as d±2 s. Standard error and 95% CI were calculated for d and limits of agreement to obtain a greater precision of es-timated limits of agreement. According to this method, the two measurement methods can be considered interchangea-ble when limits of agreement are within differences that are not clinically important [29]. We considered a clinically im-portant difference as >5% between the two measurements. Agreement between the two measurements in detecting the presence of glenoid-bone defect was assessed by calculating percent agreement. Significance of agreement between the two measurements was analysed with the χ2 test. Strength of agreement was assessed by calculating the kappa coefficient. Evaluation of agreement between the two methods in dis-criminating the type of glenoid-bone defect was performed considering three categories (defect absent, bony Bankart lesion and bone erosion) and calculating percent agreement. Bony Bankart lesion was determined by observing the pres-ence of anterior glenoid fracture, with a free bone fragment adjacent to the glenoid rim or reattached medially on the glenoid neck. Bone erosion was considered when glenoid bone loss was observed in the absence of a detached bone fragment [25]. Significance of agreement between the two methods was analysed with the χ2 test. Strength of agree-ment was assessed by calculating the weighted kappa coef-ficient according to the quadratic weighting method.
Results
Analysis of agreement between MPR and VR CT measure-ments of percentage of glenoid bone loss (Fig. 3) showed a mean difference equal to 0.62%±1.96%, with 95% CI of mean ranging between 0.29% and 0.92%. Limits of agree-ment ranged between 4.54% (upper limit) and –3.30% (low-er limit), with 95% CI of limits of agreement between 5.1% and 3.98% and between –3.86% and –2.74% for the upper and lower limits, respectively.
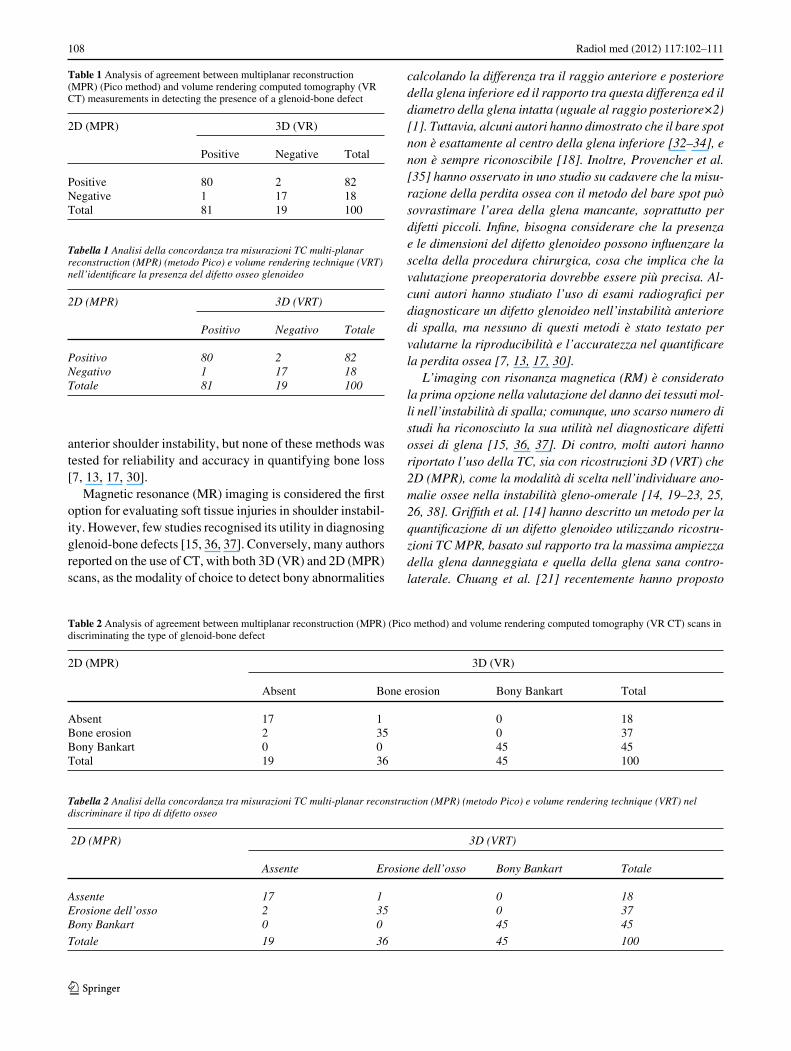
Analysis of agreement between MPR and VR CT meas-urements to detect the presence of a glenoid-bone defect (Table 1) showed a highly significant association between the two methods (p<0.0001), with a percent agreement of 97%, and a κ coefficient equal to 0.90. Analysis of agree-ment between the two measurements in discriminating the type of glenoid-bone defect (Table 2) showed a highly sig-

Radiol med (2012) 117:102–111 107
differenza media uguale a 0,62%±1,96%. Il 95% CI della me-dia era compreso tra 0,29% e 0,92%. I limiti della concordanza erano compresi tra 4,54% (limite superiore) e -3,30% (limite in-feriore). Il 95% CI dei limiti di concordanza erano compresi tra 5,1% e 3,98% e tra -3,86% e -2,74% per il limite superiore ed inferiore, rispettivamente.
L’analisi della concordanza tra le misurazioni MPR e VRT nell’identificare la presenza del difetto osseo glenoi-deo (Tabella 1) ha mostrato una associazione altamente significativa tra i due metodi (p<0,0001), con una concor-danza percentuale del 97%, ed un coefficiente κ uguale a 0,90. L’analisi della concordanza tra le due misurazioni nella discriminazione del tipo di difetto glenoideo (Tabel-la 2) ha mostrato una associazione altamente significativa (p<0,0001), con una concordanza percentuale del 97%, ed un coefficiente κ pesato uguale a 0,97.
Discussione
Differenti metodi per identificare e misurare le dimensioni del difetto osseo di glena sono stati descritti in letteratura, utilizzando metodiche di imaging preoperatorio o metodi ar-troscopici intraoperatori [1, 13–17, 19, 30]. La misurazione artroscopica del difetto osseo di glena è basata sull’uso del bare spot glenoideo come riferimento del centro della gle-na inferiore [1, 31]. La quantificazione del difetto è stabilita
nificant association (p<0.0001), with a percent agreement of 97%, and weighted κ coefficient equal to 0.97.
Discussion
Different ways of identifying and measuring glenoid-bone defect have been described in the literature by using preop-erative imaging techniques or intraoperative arthroscopic methods [1, 13–17, 19, 30]. Arthroscopic measurement of the glenoid bone defect is based on the use of the glenoid “bare spot” as a landmark of the centre of the inferior gle-noid [1, 31]. Quantification of the defect is achieved by calculating the difference between posterior and anterior radius of the inferior glenoid and the ratio between this dif-ference and the diameter of the intact glenoid (equal to pos-terior radius ×2) [1]. However, some authors have shown that the bare spot is not exactly in the centre of the inferior glenoid [32–34] and is not always recognisable [18]. More-over, Provencher et al. [35] observed in a cadaver study that bone loss measurement with the bare-spot method can overestimate the area of the missing glenoid, especially for small defects. Finally, it must be considered that the pres-ence and size of a glenoid defect can influence the choice of surgical procedure, so that a preoperative assessment would be more valuable. Some authors focused on the use radiographic examinations to diagnose a glenoid defect in
Fig. 3 Bland-Altman plot of differences between MPR (Pico method) and VR CT scan measure-ments (percentage of glenoid-bone defect: MPR-VR) compared with means of the two measure-ments. The mean difference was 0.62 % (middle dotted line); 95% limits of agreement ranged from 4.54% to –3.30% (upper and lower dotted lines), indicating a very good agreement between the two measurements.
Fig. 3 Diagramma Bland-Altman delle differen-ze tra misurazioni TC MPR (metodo Pico) e VRT (percentuale del difetto osseo di glena: MPR-VRT) confrontate con le medie delle due misu-razioni. La differenza media è stata dello 0,62% (linea tratteggiata centrale); i limiti della concor-danza erano entro il 95% e compresi tra 4,54% e –3,30% (linee tratteggiate superiore ed inferiore), indicando un’ottima concordanza tra le due mi-surazioni.
108 Radiol med (2012) 117:102–111
calcolando la differenza tra il raggio anteriore e posteriore della glena inferiore ed il rapporto tra questa differenza ed il diametro della glena intatta (uguale al raggio posteriore×2) [1]. Tuttavia, alcuni autori hanno dimostrato che il bare spot non è esattamente al centro della glena inferiore [32–34], e non è sempre riconoscibile [18]. Inoltre, Provencher et al. [35] hanno osservato in uno studio su cadavere che la misu-razione della perdita ossea con il metodo del bare spot può sovrastimare l’area della glena mancante, soprattutto per difetti piccoli. Infine, bisogna considerare che la presenza e le dimensioni del difetto glenoideo possono influenzare la scelta della procedura chirurgica, cosa che implica che la valutazione preoperatoria dovrebbe essere più precisa. Al-cuni autori hanno studiato l’uso di esami radiografici per diagnosticare un difetto glenoideo nell’instabilità anteriore di spalla, ma nessuno di questi metodi è stato testato per valutarne la riproducibilità e l’accuratezza nel quantificare la perdita ossea [7, 13, 17, 30].
L’imaging con risonanza magnetica (RM) è considerato la prima opzione nella valutazione del danno dei tessuti mol-li nell’instabilità di spalla; comunque, uno scarso numero di studi ha riconosciuto la sua utilità nel diagnosticare difetti ossei di glena [15, 36, 37]. Di contro, molti autori hanno riportato l’uso della TC, sia con ricostruzioni 3D (VRT) che 2D (MPR), come la modalità di scelta nell’individuare ano-malie ossee nella instabilità gleno-omerale [14, 19–23, 25, 26, 38]. Griffith et al. [14] hanno descritto un metodo per la quantificazione di un difetto glenoideo utilizzando ricostru-zioni TC MPR, basato sul rapporto tra la massima ampiezza della glena danneggiata e quella della glena sana contro-laterale. Chuang et al. [21] recentemente hanno proposto
anterior shoulder instability, but none of these methods was tested for reliability and accuracy in quantifying bone loss [7, 13, 17, 30].
Magnetic resonance (MR) imaging is considered the first option for evaluating soft tissue injuries in shoulder instabil-ity. However, few studies recognised its utility in diagnosing glenoid-bone defects [15, 36, 37]. Conversely, many authors reported on the use of CT, with both 3D (VR) and 2D (MPR) scans, as the modality of choice to detect bony abnormalities
Table 1 Analysis of agreement between multiplanar reconstruction (MPR) (Pico method) and volume rendering computed tomography (VR CT) measurements in detecting the presence of a glenoid-bone defect
2D (MPR) 3D (VR) Positive Negative Total
Positive 80 2 82Negative 1 17 18Total 81 19 100
Tabella 1 Analisi della concordanza tra misurazioni TC multi-planar reconstruction (MPR) (metodo Pico) e volume rendering technique (VRT) nell’identificare la presenza del difetto osseo glenoideo
2D (MPR) 3D (VRT)
Positivo Negativo Totale
Positivo 80 2 82Negativo 1 17 18Totale 81 19 100
Table 2 Analysis of agreement between multiplanar reconstruction (MPR) (Pico method) and volume rendering computed tomography (VR CT) scans in discriminating the type of glenoid-bone defect
2D (MPR) 3D (VR)
Absent Bone erosion Bony Bankart Total
Absent 17 1 0 18Bone erosion 2 35 0 37Bony Bankart 0 0 45 45Total 19 36 45 100
Tabella 2 Analisi della concordanza tra misurazioni TC multi-planar reconstruction (MPR) (metodo Pico) e volume rendering technique (VRT) nel discriminare il tipo di difetto osseo
2D (MPR) 3D (VRT) Assente Erosione dell’osso Bony Bankart Totale
Assente 17 1 0 18Erosione dell’osso 2 35 0 37Bony Bankart 0 0 45 45
Totale 19 36 45 100

Radiol med (2012) 117:102–111 109
un metodo per la misurazione del difetto glenoideo osseo su ricostruzioni TC 3D simile a quello di Griffith et al. [14]. Hanno descritto l’indice glenoideo come il rapporto tra l’ampiezza della glena danneggiata e l’ampiezza della glena prima del danno (simile a quella della spalla sana controla-terale). Entrambi i metodi sono stati validati per accuratezza utilizzando la misurazione artroscopica come tecnica di ri-ferimento [21, 26]; tuttavia l’accuratezza della misurazione artroscopica non è stata mai stabilita in studi precedenti.
Il metodo del cerchio è un’opzione alternativa per la va-lutazione del difetto osseo di glena negli studi di imaging pre-operatori. Questo metodo è basato sull’osservazione che la parte inferiore della glena ha la forma di un cerchio, che può essere tracciato sulla immagine en face della gle-na [19, 33, 39]. Un potenziale vantaggio di questo metodo consiste nella misurazione diretta sulla glena affetta, senza necessità del confronto con la spalla sana controlaterale. Il metodo del cerchio è stato proposto per primo da Sugaya et al. [19] utilizzando immagini TC 3D; successivamente Huijsmans et al. [15] hanno validato il metodo studiando 14 spalle di cadaveri, mostrando un’ottima riproducibilità intra-osservatore ed inter-osservatore ed un’ottima accu-ratezza, sebbene il limitato numero di campioni analizzati indeboliva la rilevanza clinica dei risultati. Il metodo Pico, proposto da Baudi et al. [24], unisce i vantaggi del meto-do del cerchio (misurazione dell’area mancante della gle-na come percentuale dell’intera glena inferiore) con quelli della tecnica MPR (non sono richieste ricostruzioni 3D, né sottrazioni di immagini). Inoltre la VRT implica un rischio di artefatti maggiore rispetto alle ricostruzioni MPR, cosa che può inficiare l’interpretazione dell’esame [14]. Il meto-do Pico è stato recentemente validato per la precisione, mo-strando un’ottima riproducibilità intra-osservatore ed inter-osservatore [27]. In verità, il principale limite di questo metodo, così come quello descritto da Griffith et al. [14, 25, 26], è il confronto con la spalla controlaterale, così che non può essere applicato a pazienti con instabilità bilaterale.
I risultati del presente studio hanno dimostrato un’ottima concordanza tra le misurazioni 2D (metodo Pico) e 3D per la quantificazione, l’identificazione e la discriminazione del tipo di difetto (erosione ossea o frattura). Abbiamo osser-vato una differenza sistematica tra le due misurazioni per la quantificazione del difetto osseo. In particolare, la dif-ferenza media tra le 2D e le 3D è stata positiva, così che è sembrato che le 2D sovrastimassero le dimensioni del difet-to osseo in confronto con le 3D. Tuttavia, questa differenza (inferiore all’ 1%) non può essere considerata clinicamente rilevante. Inoltre le statistiche κ hanno mostrato una concor-danza pressoché assoluta tra i due metodi nello stabilire la presenza ed il tipo di difetto osseo. Sulla base di questi risul-tati, abbiamo considerato le 2D sovrapponibili alle 3D.
Nonostante ciò, questo studio ha alcuni limiti. Prima di tutto, non abbiamo provveduto ad un’analisi dell’accuratez-
in glenohumeral instability [14, 19, 20–23, 25, 26, 38]. Grif-fith et al. [14] described a method for quantifying a glenoid defect using MPR CT images based on the ratio between the maximum width of the affected glenoid and that of the contralateral healthy glenoid. Chuang et al. [21] recently proposed a method for measuring glenoid-bone defect on 3D CT images similar to that of Griffith et al. [14]. They de-scribed the glenoid index as the ratio between the width of the injured glenoid and preinjury glenoid width (similar to that of contralateral healthy shoulder). Both methods were validated for accuracy using the arthroscopic measurement as the reference technique [21, 26]. However, the accuracy of arthroscopic measurements has not been assessed in pre-vious studies.
The circle method is an alternative option for evaluating glenoid-bone defects and is used in preoperative imaging studies. It is based on the observation that the inferior part of the glenoid has the shape of a true circle, which can be drawn on the sagittal en face view of the glenoid [19, 33, 39]. A potential advantage of this method is direct measurement on the affected glenoid without comparison with the contralat-eral healthy glenoid. The circle method was first proposed by Sugaya et al. [19] using 3D CT images. Subsequently, Huijsmans et al. [15] validated the method on 14 cadaver shoulders, showing a very good intraobserver and interob-server reliability and accuracy, although the limited number of samples analysed weakened the clinical relevance of the results. The Pico method, proposed by Baudi et al. [24], combines the advantages of the circle method (measurement of the missing area of the glenoid as percentage of the entire inferior glenoid) with those of the MPR technique (neither 3D reconstructions nor subtractions of images are required). Furthermore, VR implies a greater risk of artefacts than the MPR technique, which can impair interpretation of the ex-amination [14]. The Pico method was recently validated for precision and showed very good intra- and interobserver re-liability [27]. Indeed, the main limitation of this method, similar to that described by Griffith et al. [14, 25, 26], is the comparison with the contralateral shoulder, so that it cannot be applied to patients with bilateral instability.
Results of our study showed very good agreement be-tween 2D (Pico method) and 3D measurements for quantify-ing, identifying and discriminating the type of defect (bone erosion or fracture). We observed a systematic difference between the two measurements for quantifying bone defect. In particular, the mean difference between 2D and 3D was positive, so that 2D seemed to overestimate the size of bone loss in comparison with 3D. However, this difference (<1%) cannot be considered clinically relevant. Furthermore, ka-ppa statistics showed an almost absolute agreement between the two methods in assessing the presence and type of bone defect. Based on these results, we considered 2D superim-posable to 3D scans.

110 Radiol med (2012) 117:102–111
za delle misurazioni TC, poiché non avevamo un reale gold standard. In secondo luogo, sebbene le acquisizioni TC po-tessero consentire una valutazione della sede e delle misure (lunghezza e larghezza) del difetto, questa valutazione non è stata effettuata, poiché il principale obiettivo del presente studio è stato stabilire la concordanza tra le misurazioni 2D e 3D nel valutare le dimensioni del difetto misurando l’area della glena mancante in accordo con il metodo del cerchio, come precedentemente riportato da altri autori [15, 19, 24, 27]. Di conseguenza, misurare le dimensioni del difetto os-seo con un metodo differente è oltre lo scopo del presente studio, e inficerebbe la comparabilità dei nostri risultati con quelli della letteratura precedente. Infine, il metodo Pico potrebbe teoricamente essere usato senza il confronto con la spalla controlaterale, come descritto in altri studi basati sul metodo del cerchio [15, 19], sebbene questa ipotesi non sia stata testata nel presente studio.
Conclusioni
In conclusione, la concordanza tra le misurazioni TC 2D (MPR) e 3D (VRT) secondo il metodo del cerchio per l’iden-tificazione di dimensioni, presenza e tipo del difetto osseo glenoideo nell’instabilità anteriore gleno-omerale è stata così alta che le due misurazioni possono essere considerate intercambiabili.
Nevertheless, this study has some limitations. First, we did not provide accuracy analysis of CT measurements, as we did not have a real gold standard. Second, although CT scans would allow for the assessment of location and size (length and width) of the bone defect, this evaluation was not performed, because the main objective of the study was to assess agreement between 2D and 3D measurements in evaluating the size of the defect by measuring the area of the missing glenoid according to the circle method, as previously reported by other authors [15, 19, 24, 27]. Therefore, measuring the size of bone defect by using a different method lies beyond the scope of our study and would impair data comparability with those from previ-ous reports. Finally, the Pico method could be theoretically used without comparison with the contralateral shoulder, as described in other studies based on the circle method [15, 19], although this hypothesis was not tested in the study presented here.
Conclusions
In conclusion, agreement between 2D (MPR) and 3D (VR) CT measurements according to the circle method to identify size, presence and type of glenoid-bone defect in anterior glenohumeral instability was so high that the two measure-ments can be considered interchangeable.
Conflict of interest None
References/Bibliografia
1. Burkhart SS, De Beer JF, Tehrany AM, Parten PM (2002) Quantifying glenoid bone loss arthroscopically in shoulder instability. Arthroscopy 18:488–491. DOI 10.1053/jars.2002.32212
2. Gerber C, Nyffeler RW (2002) Classification of glenohumeral joint instability. Clin Orthop Rel Res 400:65–78
3. Greis PE, Scuderi MG, Mohr A et al (2002) Glenohumeral articular contact areas and pressures following labral and osseous injury to the anteroinferior quadrant of the glenoid. J Shoulder Elbow Surg 11:442–451. DOI 10.1067/mse.2002.124526
4. Itoi E, Lee SB, Berglund LJ et al (2000) The effect of a glenoid defect on anteroinferior stability of the shoulder after Bankart repair: a cadaveric study. J Bone Joint Surg Am 82:35–46
5. Montgomery WH Jr, Wahl M, Hettrich C et al (2005) Antero-inferior bone-grafting can restore stability in osseous glenoid defects. J Bone Joint Surg Am 87:1972–1977. DOI 10.2106/JBJS.D.02573
6. Balg F, Boileau P (2007) The instability severity index score. A simple pre-operative score to select patients for arthroscopic or open shoulder stabilisation. J Bone Joint Surg Br 89:1470–1477. DOI 10.1302/0301-620X.89B11.18962
7. Bigliani LU, Newton PM, Steinmann SP et al (1998) Glenoid rim lesions associated with recurrent anterior dislocation of the shoulder. Am J Sports Med 26:41–45
8. Boileau P, Villalba M, Henry JY et al (2006) Risk factors for recurrence of shoulder instability after arthroscopic Bankart repair. J Bone Joint Surg Am 88:1755–1763. DOI 10.2106/JBJS.E.00817
9. Burkhart SS, De Beer JF (2000) Traumatic glenohumeral bone defects and their relationship to failure of arthroscopic Bankart repairs: significance of the inverted-pear glenoid and the humeral engaging Hill-Sachs lesion. Arthroscopy 16:677–694. DOI 10.1053/jars.2000.17715
10. Tauber M., Resch H (2004) Reason for failure after surgical repair of anterior shoulder instability. J Shoulder Elbow Surg 13:278–285. DOI 10.1016/j.jse.2004.01.008

Radiol med (2012) 117:102–111 111
11. Bushnell BD, Creighton RA, Herring MM (2008) Bony instability of the shoulder. Arthroscopy 24:1061–1073. DOI 10.1016/j.arthro.2008.05.015
12. Chen AL, Hunt SA, Hawkins RJ, Zuckerman JD (2005) Management of bone loss associated with recurrent anterior glenohumeral instability. Am J Sports Med 33:912–925. DOI 10.1177/0363546505277074
13. Edwards TB, Boulahia A, Walch G (2003) Radiographic analysis of bone defects in chronic anterior shoulder instability. Arthroscopy 19:732–739. DOI 10.1016/S0749-8063(03)00684-4
14. Griffith JF, Antonio GE, Tong CW, Ming CK (2003) Anterior shoulder dislocation: quantification of glenoid bone loss with CT. AJR Am J Roentgenol 180:1423–1430
15. Huijsmans PE, Haen PS, Kidd M et al (2007) Quantification of a glenoid defect with three-dimensional computed tomography and magnetic resonance imaging: a cadaveric study. J Shoulder Elbow Surg 16:803–809. DOI 10.1016/j.jse.2007.02.115
16. Itoi E, Lee SB, Amrami KK et al (2003) Quantitative assessment of classic anteroinferior bony Bankart lesions by radiography and computed tomography. Am J Sports Med 31:112–118
17. Pavlov H, Warren RF, Weiss CB Jr (1985) The roentgenographic evaluation of anterior shoulder instability. Clin Orthop Rel Res 194:153–158
18. Saintmard B, Lecouvet F, Rubini A, Dubuc JE (2009) Is the bare spot a valid landmark for glenoid evaluation in arthroscopic Bankart surgery? Acta Orthop Belg 75:736–742
19. Sugaya H, Moriishi J, Dohi M et al (2003) Glenoid rim morphology in recurrent anterior glenohumeral instability. J Bone Joint Surg Am 85:878–884
20. Barchilon VS, Kotz E, Barchilon Ben-Av M et al (2008) A simple method for quantitative evaluation of the missing area of the anterior glenoid in anterior instability of the glenohumeral joint. Skeletal Radiol 37:731–736. DOI 10.1007/s00256-008-0506-8
21. Chuang TY, Adams CR, Burkhart SS (2008) Use of preoperative three-dimensional computed tomography to quantify glenoid bone loss in shoulder instability. Arthroscopy 24:376–382. DOI 10.1016/j.arthro.2007.10.008
22. Saito H, Itoi E, Sugaya H et al (2005) Location of the glenoid defect in shoulders with recurrent anterior dislocation. Am J Sports Med 33:889–893. DOI 10.1177/0363546504271521
23. Stevens KJ, Preston BJ, Wallace WA, Kerslake RW (1999) CT and 3D reconstructions of shoulders with anterior glenohumeral instability. Clin Anat 12:326–336
24. Baudi P, Righi P, Bolognesi D et al (2005) How to identify and calculate glenoid bone deficit. Chir Organi Mov 90:145–152
25. Griffith JF, Antonio GE, Yung PS et al (2008) Prevalence, pattern, and spectrum of glenoid bone loss in anterior shoulder dislocation: CT analysis of 218 patients. AJR Am J Roentgenol 190:1247–1254. DOI 10.2214/AJR.07.3009
26. Griffith JF, Yung PS, Antonio GE et al (2007) CT compared with arthroscopy in quantifying glenoid bone loss. AJR Am J Roentgenol 189:1490–1493. DOI 10.2214/AJR.07.2473
27. Magarelli N, Milano G, Sergio P et al (2009) Intra-observer and interobserver reliability of the ‘Pico’ computed tomography method for quantification of glenoid bone defect in anterior shoulder instability. Skeletal Radiol 38:1071–1075. DOI 10.1007/s00256-009-0719-5
28. Bland JM (2003) How can I decide the sample size for a study of agreement between two methods of measurement? http://www users.york.ac.uk/~mb55/meas/sizemeth.htm. Accessed April 2011
29. Bland JM, Altman DG (1986) Statistical methods for assessing agreement between two methods of clinical measurement. Lancet 8:307–310
30. Jankauskas L, Rüdiger HA, Pfirrmann CW et al (2010) Loss of the sclerotic line of the glenoid on anteroposterior radiographs of the shoulder: a diagnostic sign for an osseous defect of the anterior glenoid rim. J Shoulder Elbow Surg 19:151–156. DOI 10.1016/j.jse.2009.04.013
31. De Wilde LF, Berghs BM, Audenaert E et al (2004) About the variability of the shape of the glenoid cavity. Surg Radiol Anat 26:54–59. DOI 10.1007/s00276-003-0167-1
32. Aigner F, Longato S, Fritsch H, Kralinger F (2004) Anatomical considerations regarding the “bare spot” of the glenoid cavity. Surg Radiol Anat 26:308–311. DOI 10.1007/s00276-003-0217-8
33. Huysmans PE, Haen PS, Kidd M et al (2006) The shape of the inferior part of the glenoid: a cadaveric study. J Shoulder Elbow Surg 15:759–763. DOI 10.1016/j.jse.2005.09.001
34. Kralinger F, Aigner F, Longato S et al (2006) Is the bare spot a consistent landmark for shoulder arthroscopy? A study of 20 embalmed glenoids with 3-dimensional computed tomographic reconstruction. Arthroscopy 22:428–432. DOI 10.1016/j.arthro.2005.12.006
35. Provencher MT, Detterline AJ, Ghodadra N et al (2008) Measurement of glenoid bone loss: a comparison of measurement error between 45 degrees and 0 degrees bone loss models and with different posterior arthroscopy portal locations. Am J Sports Med 36:1132–1138. DOI 10.1177/0363546508316041
36. Stoller D, Shellock FG,Crues JV (1996) MRI of the shoulder: a rational approach to the reporting of findings. J Magn Reson Imaging 6:268–270
37. Willemsen UF, Wiedemann E, Brunner U et al (1998) Prospective evaluation of MR arthrography performed with high-volume intraarticular saline enhancement in patients with recurrent anterior dislocations of the shoulder. AJR Am J Roentgenol 170:79–84
38. Diederichs G, Seim H, Meyer H et al (2008) CT-based patient-specific modeling of glenoid rim defects: a feasibility study. AJR Am J Roentgenol 191:1406–1411. DOI 10.2214/AJR.08.1091
39. Jeske HC, Oberthaler M, Klingensmith M et al (2009) Normal glenoid rim anatomy and the reliability of shoulder instability measurements based on intrasite correlation. Surg Radiol Anat 31:623–625. DOI 10.1007/s00276-009-0492-0