Stress test of the banks' lending to commercial real estate firms

Comparative Study on Financial Performance of Some Selected Private
Commercial Banks of Bangladesh
Sk. Mukitul Islam Abstract: Evaluation of bank performance is important for all parties: depositors, bank managers,
and regulators. The aim of this paper is to rank some of the commercial banks in Bangladesh on
the basis of their financial characteristics revealed by different financial ratios. The study also
tries to investigate the impact of operational efficiency and asset utilization on the financial
performance of these banks. A total of ten commercial banks are financially analyzed. The study
finds that the bank with higher total assets, deposits and credits does not always ensure better
profitability performance and operational efficiency and asset utilization but all these have
significant influence on financial performance of the commercial banks.
Key Words: Financial Performance; Depositors; Regulators; Financial Ratios; Operational Efficiency; Asset Utilization. 1. Introduction: Banking system plays an important role in the economic development of a country. Bangladesh, as a
developing country, is no exception to this. In Bangladesh, the banking sector dominates the financial
sector and the macro-economic management largely depends on the performance of the banking
sector. The country’s banking sector comprises of Bangladesh Bank, Nationalized Commercial Banks,
Private Commercial Banks, Foreign Banks, Specialized Banks and other Financial Institutions. Generally, the financial performance of banks and other financial institutions has been measured using a combination of financial ratio analysis, benchmarking, measuring performance against budget or a mix of these methodologies. Much of the current banking performance literature describes the relationship between risk and return and focus too much on asset and liability management. There is a generally accepted relationship between risk and return, that is, the higher the risk the higher the expected return. Therefore, traditional measures of bank performance have measured both risk and return. Chien Ho and Song Zhu (2004), have shown in their study that most previous studies concerning company performance evaluation focus merely on operational efficiency and operational effectiveness which might directly influence the survival of a company. The empirical result of this study is that a company with better efficiency in terms of profitability does not always mean that it has better effectiveness in term of management. It is often argued that there are three principal factors to improve financial performance for financial
institutions; the institution size, its asset management and the operational efficiency. There have been
little published studies to explore the impact of these factors on the financial performance especially
the commercial banks. Medhat Tarawnch (2006), has opined in his study that there are measurable
linkages among bank’s size, asset management, operational efficiency and financial performance of
the bank. The purpose of this paper is to analyze the financial data of Bangladeshi commercial banks
to examine the impact of operational efficiency and asset utilization on the bank’s financial
performance.
2. Objectives of the study: The study focuses on the following specific objectives.
1. Examining and comparing the composition of total deposits, total credits, total assets and total shareholders’ equity of the sample banks during the period from 2003 to 2013.
2. Measuring and comparing the profitability and performance of the sample banks during the
period under study.
3. Ranking the sample banks on the basis of their financial Strengths as revealed in different financial ratios.
4. To investigate the impact of operational efficiency and asset utilization on the financial
performance of the sample banks.
3. Methodology: The scope of the study is limited to the Private Commercial Banks considering time constraint of the
researchers. Out of thirty one conventional private commercial banks, ten banks are selected for the
study purpose. Private commercial banks based on Islamic Shariah are ignored purposively in this
study. In order to meet the objectives of the study data were collected from the secondary sources
mainly from annual reports of the selected banks. This study has used Correlation Analyses along with
necessary ratio analysis. The period of the study is eleven years from 01.01.03 to 31.12.13.
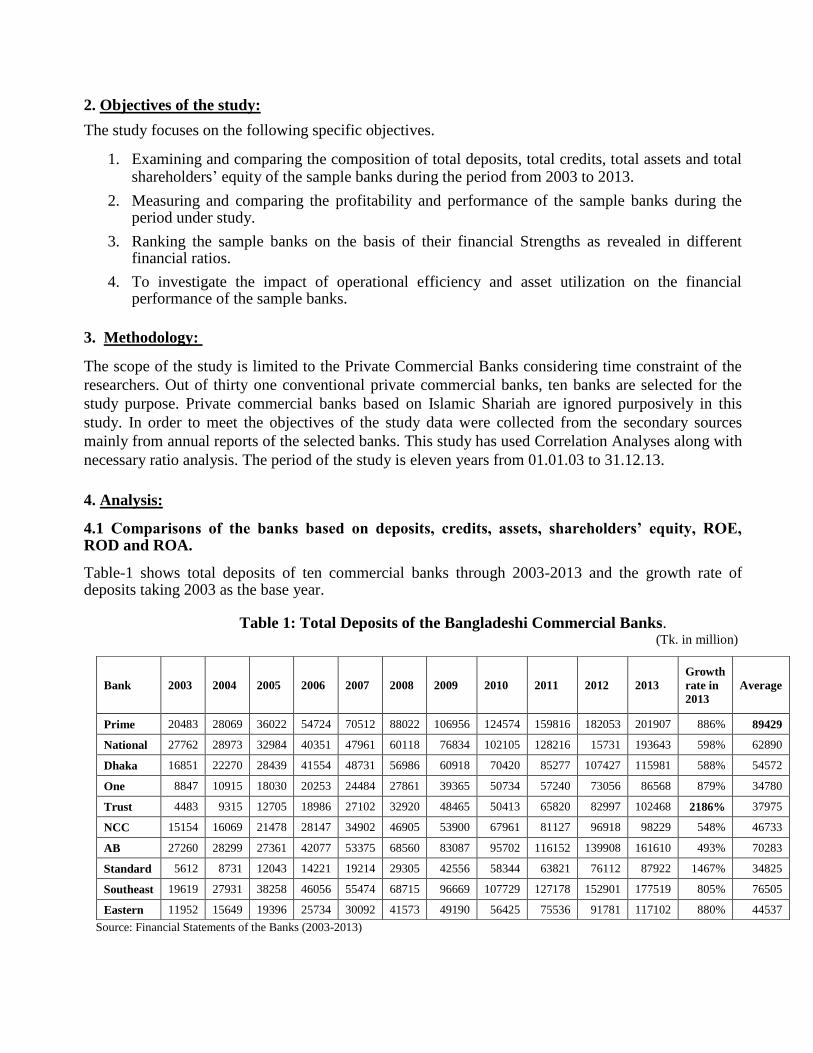
4. Analysis: 4.1 Comparisons of the banks based on deposits, credits, assets, shareholders’ equity, ROE, ROD and ROA. Table-1 shows total deposits of ten commercial banks through 2003-2013 and the growth rate of deposits taking 2003 as the base year.
Table 1: Total Deposits of the Bangladeshi Commercial Banks. (Tk. in million)
Source: Financial Statements of the Banks (2003-2013)
Bank 2003 2004 2005 2006 2007 2008 2009 2010 2011 2012 2013
Growth
rate in
2013
Average
Prime 20483 28069 36022 54724 70512 88022 106956 124574 159816 182053 201907 886% 89429
National 27762 28973 32984 40351 47961 60118 76834 102105 128216 15731 193643 598% 62890
Dhaka 16851 22270 28439 41554 48731 56986 60918 70420 85277 107427 115981 588% 54572
One 8847 10915 18030 20253 24484 27861 39365 50734 57240 73056 86568 879% 34780
Trust 4483 9315 12705 18986 27102 32920 48465 50413 65820 82997 102468 2186% 37975
NCC 15154 16069 21478 28147 34902 46905 53900 67961 81127 96918 98229 548% 46733
AB 27260 28299 27361 42077 53375 68560 83087 95702 116152 139908 161610 493% 70283
Standard 5612 8731 12043 14221 19214 29305 42556 58344 63821 76112 87922 1467% 34825
Southeast 19619 27931 38258 46056 55474 68715 96669 107729 127178 152901 177519 805% 76505
Eastern 11952 15649 19396 25734 30092 41573 49190 56425 75536 91781 117102 880% 44537

It is revealed from the above table that the highest average of total deposits is of Prime bank and it is Tk. 89429 million with growth rate of 886% in the year 2013 in comparing with the year of 2003 but Trust Bank having lower deposits in the year of 2003 which has risen its deposits at a rapid rate perhaps due to operational efficiency. The average total deposits of remaining Banks have been shown in like manner. The growth rate is highest (2186%) for Trust Bank with average total deposits of Tk. 37975 million and lowest (493%) for AB Bank with average total deposits of Tk. 70283 million. To rank the Banks on their average total deposits, Prime Bank is considered to be the number one, Southeast Bank is number two and AB Bank, National Bank, and Dhaka Bank are number three, four, and five respectively as shown in table-1. Table-2 shows total credits, growth rate of credits taking 2003 as the base year and the average of total credits during 2003-2013 for each sample bank.
Table 2: Total Credits of the Bangladeshi Commercial Banks. (Tk. in million)
Bank 2003 2004 2005 2006 2007 2008 2009 2010 2011 2012 2013
Growth
rate in
2013
Average
Prime 16492 23220 31916 45010 57683 75156 89252 116057 138848 160890 153589 831% 75677
National 22257 23129 27020 32710 36476 50665 65129 92004 115389 126170 151099 579% 61838
Dhaka 12887 16539 23372 34049 39972 49698 52910 63591 75983 90140 99596 673% 46562
One 6051 9613 13851 15681 19709 23287 32533 42190 47927 60216 76573 1165% 28970
Trust 4358 6804 9738 13188 18682 27528 32663 39800 50802 54616 79280 1719% 28123
NCC 12851 15211 20533 24678 32688 46333 50388 63230 72734 79948 88147 586% 42229
AB 20435 17009 21385 31289 40915 56709 70880 88299 94638 113663 147129 620% 58530
Standard 4952 7801 10184 12634 17311 27190 38056 51758 55332 61528 74050 1395% 30067
Southeast 15542 22002 32551 41147 48165 60281 77498 92453 107289 126969 134864 768% 63231
Eastern 11288 14973 17758 26008 30962 39662 47668 58607 81774 96720 102910 812% 44028
Source: Financial Statements of the Banks (2003-2013)
The above table shows that the growth rate of credits is highest (1719%) for Trust Bank and lowest (579%) for National Bank in 2013 comparing with credits in 2003. To rank the banks on their average credits, Prime Bank is considered to be number one, southeast Bank in number two and national bank is number three. Trust bank has the lowest average of total credits (28123 million Tk). It is to be noted that the bank with highest growth rate of total credits during the period does not always mean that it has high average of total credits as shown in table 2.
Table 3 shows total assets for all the sample commercial banks through 2003-2013 and provide the growth rate of assets on 2003 as base year.

Table 3: Total assets of the Bangladeshi Commercial Banks ( Tk. in million)
Bank 2003 2004 2005 2006 2007 2008 2009 2010 2011 2012 2013
Growth
rate in
2013
Average
Prime 24249 32362 41506 60899 79588 110437 124806 154342 199950 236833 243869 906% 109071
National 35670 35127 38400 46796 56527 72206 91932 134732 169037 205207 235174 559% 93401
Dhaka 20816 28178 33072 47594 57443 71137 77767 90139 104726 133142 114409 450% 64869
One 9975 13419 20105 23143 27475 31744 45163 58736 67619 85618 102691 929% 40475
Trust 7859 12060 14782 21061 30382 38476 54207 58276 76215 95261 116740 1385% 43778
NCC 18093 21469 26114 32615 42523 57366 65938 83554 103511 125842 124027 585% 58421
AB 32969 32513 33065 47989 63550 84050 106912 132988 152963 175517 209749 536% 89356
Standard 7174 11071 14442 16861 22949 34210 49001 66596 74953 94370 108574 1413% 41685
Southeast 23136 33745 43295 53706 65371 81182 112677 131943 158079 191276 220931 855% 92946
Eastern 18716 23048 27400 35971 42579 54598 69871 82098 117601 147148 157882 744% 64743
Source: Financial Statements of the Banks (2003-2013)
From the above table it is notable that average of total assets for Prime bank is 109071 million Tk. with growth rate of 906% in the year 2013 as compared to 2003. The growth rate is highest (1413%) for Standard bank with average total assets of tk 41685 million and lowest (450%) for Dhaka bank with average total assets of Tk. 64869 million. To rank the banks on their average total assets, Prime bank is considered to be number one, National Bank is number two and Southeast Bank is number three. Almost every Bank has more assets as against the deposit liabilities shown in the table 1. Undoubtedly, it is a good sign of healthy growth of a bank.
Table-4 shows total shareholders’ equity, growth rate of shareholders equity and the average shareholders’ equity during the period of 2003-2013 for each sample banks.
Table 4: Total shareholders’ equity of the Bangladeshi Commercial Banks ( Tk. in million)
Source: Financial Statements of the Banks (2003-2013) It is revealed from the above table that the growth rate of shareholders’ equity is highest (1643%) for
Southeast Bank and lowest (695%) for Eastern Bank in 2013 comparing in 2003. To rank the Banks
on their average shareholders’ equity, Southeast Bank is considered to be number one, National Bank
Bank 2003 2004 2005 2006 2007 2008 2009 2010 2011 2012 2013
Growth
rate in
2013
Average
Prime 1782 2240 2808 3860 5273 6697 11745 16908 19095 20787 23030 1192% 9520
National 1701 1862 2735 3274 4568 6126 8917 19106 21523 22340 23816 1300% 9665
Dhaka 1210 1488 2216 2551 3125 4000 4966 6580 9217 9683 11887 882% 4744
One 789 984 1286 1519 1833 2315 3573 5965 7700 8438 12070 1430% 3874
Trust 454 871 992 1155 2154 3120 3755 5025 5527 6513 6866 1412% 3037
NCC 944 1230 1657 2135 2959 4621 6034 9357 11331 12136 13261 1305% 5473
AB 1136 1244 1527 2583 4512 6723 10158 13867 14853 16223 17309 1424% 7512
Standard 857 1100 1412 1764 2767 3426 4222 5625 6871 8228 9181 971% 3789
Southeast 1258 1429 2037 5059 6144 11329 17145 17196 19001 19784 21929 1643% 10194
Eastern 2321 2631 3071 3315 3712 4733 8429 12084 14407 17109 18450 695% 7522

is number two and Prime Bank is number three. Among all the sample banks, Trust Bank has the
lowest average of shareholders’ equity (3037 million). Table 5 shows return on equity (ROE) ratios of all the sample commercial banks from the year of 2003 to 2013.
Table 5: Return on Equity ratio of the Bangladeshi Commercial Banks
Source: Financial Statements of the Banks (2003-2013) The return on equity (ROE) is considered to be one of the indicators of measuring efficiency of management. It is calculated through dividing the net profit by total shareholders’ equity. It reflects the bank management’s ability to generate net profit from using the shareholders’ equity as one of the financial sources. Based on this ratio Prime Bank holds the first position with an average of 21.54% and Trust Bank holds the last position with an average of 15.00%.
Table –6 shows Return on Deposits (ROD) ratios of all the sample commercial banks through 2003-2013.
Table 6: Return on Deposits ratio of the Bangladeshi Commercial Banks
Bank 2003 2004 2005 2006 2007 2008 2009 2010 2011 2012 2013 Average
Prime 1.83% 2.18% 1.58% 1.92% 1.99% 1.40% 2.60% 2.49% 2.27% 1.48% 0.91% 1.88%
National 0.32% 0.59% 0.82% 1.26% 2.58% 2.21% 2.14% 6.37% 4.79% 0.97% 1.20% 2.11%
Dhaka 1.60% 1.61% 1.63% 1.40% 1.44% 1.22% 1.15% 1.75% 1.86% 0.50% 1.19% 1.40%
One 1.03% 1.79% 1.67% 1.71% 1.65% 0.70% 0.95% 1.85% 1.13% 6.71% 0.70% 1.81%
Trust 1.52% 1.89% 0.95% 1.39% 0.88% 1.55% 2.82% 3.37% 2.28% 1.33% 0.98% 1.72%
NCC 0.52% 1.77% 1.64% 1.70% 1.94% 0.99% 1.13% 0.95% 0.76% 0.19% 0.33% 1.08%
AB 0.06% 0.32% 0.59% 1.26% 3.57% 5.53% 6.84% 6.55% 1.76% 1.57% 0.86% 2.63%
Standard 2.69% 2.78% 2.60% 2.48% 1.81% 2.69% 1.58% 2.72% 1.97% 1.61% 0.99% 2.17%
Southeast 1.30% 1.06% 0.98% 1.98% 2.20% 2.72% 4.39% 4.74% 3.00% 2.17% 3.84% 2.58%
Eastern 3.00% 3.09% 2.82% 1.99% 1.39% 0.00% 3.70% 4.78% 4.40% 3.11% 2.97% 2.84%
Source: Financial Statements of the Banks (2003-2013)
Bank 2003 2004 2005 2006 2007 2008 2009 2010 2011 2012 2013 Average
Prime 21.04% 27.32% 20.23% 27.25% 26.57% 20.58% 30.19% 21.65% 20.19% 13.53% 8.35% 21.54%
National 5.18% 9.13% 9.95% 15.49% 27.10% 28.38% 27.53% 48.96% 29.96% 6.78% 9.14% 19.78%
Dhaka 22.23% 24.03% 20.89% 22.74% 22.53% 20.97% 19.32% 25.52% 23.49% 7.24% 16.21% 20.47%
One 11.53% 19.82% 23.48% 22.84% 22.09% 18.23% 20.34% 31.68% 18.82% 12.50% 11.18% 19.32%
Trust 15% 20.21% 12.23% 22.76% 11.10% 17.56% 17.59% 29.04% 11.68% 3.02% 4.85% 15.00%
NCC 8.37% 23.17% 21.24% 22.45% 22.88% 21.76% 28.49% 25.35% 18.98% 11.81% 8.58% 19.37%
AB 1.53% 7.24% 10.64% 20.61% 42.19% 40.96% 39.84% 39.77% 9.25% 6.35% 9.02% 20.67%
Standard 17.62% 22.09% 22.17% 19.95% 12.54% 21.22% 20.01% 27.83% 20.75% 17.65% 10.14% 19.27%
Southeast 20.35% 20.68% 18.36% 17.99% 19.90% 12.06% 16.51% 19.41% 10.47% 8.42% 16.20% 16.40%
Eastern 15.42% 18.35% 17.78% 15.48% 11.29% 18.64% 22.10% 23.64% 19.03% 14.44% 14.44% 17.33%

The return on deposits (ROD) is considered to be one of the profitability performance ratios. To most financial analysts, ROD is considered as one of the best measures of bank profitability. It is calculated through dividing net profits by total deposits. This ratio reflects the bank management ability to utilize the customers’ deposits in order to generate profits. Based on this ratio the Eastern Bank holds the first position with an average of 2.84% and NCC Bank is the last one with average of 1.08%.
Table – 7 shows return on asset (ROA) ratios of each sample commercial bank during the period 2003-2013.
Table 7: Return on asset ratio of the Bangladeshi Commercial Banks
Bank 2003 2004 2005 2006 2007 2008 2009 2010 2011 2012 2013 Average
Prime 1.55% 1.89% 1.37% 1.73% 1.76% 1.30% 2.37% 2.22% 2.05% 1.24% 0.76% 1.66%
National 0.25% 0.48% 0.71% 1.08% 2.19% 2.36% 2.52% 6.05% 4.01% 0.80% 0.96% 1.95%
Dhaka 1.29% 1.27% 1.40% 1.22% 1.23% 1.18% 1.29% 2.00% 2.22% 0.59% 1.39% 1.37%
One 0.91% 1.45% 1.50% 1.50% 1.47% 3.74% 4.37% 3.63% 2.29% 1.38% 1.43% 2.15%
Trust 0.87% 1.79% 0.82% 1.24% 0.79% 1.20% 1.32% 2.27% 0.92% 0.21% 0.31% 1.07%
NCC 0.44% 1.33% 1.35% 1.47% 1.59% 1.54% 2.61% 2.84% 2.12% 1.14% 0.92% 1.58%
AB 0.05% 0.28% 0.49% 1.11% 2.99% 3.12% 3.52% 3.08% 0.93% 0.52% 0.83% 1.54%
Standard 2.10% 2.19% 2.16% 2.09% 1.51% 2.30% 1.84% 2.37% 1.83% 1.57% 0.79% 1.89%
Southeast 1.11% 1% 0.86% 1.66% 1.90% 1.09% 1.66% 2.26% 1.32% 0.95% 1.64% 1.40%
Eastern 1.91% 2.10% 1.99% 1.43% 0.98% 1.68% 2.34% 3.19% 2.52% 1.72% 1.68% 1.96% Source: Financial Statements of the Banks (2003-2013)
The return on asset (ROA) is considered to be one of the indicators of measuring managerial efficiency. ROA is net earning per unit of a given asset. It is calculated through dividing net profits by total assets. It shows how a bank can convert its asset into net earnings. The higher ratio indicates higher ability and therefore, is an indicator of better performance. Based on this ratio One Bank holds the first position with an average of 2.15%, Eastern Bank and National Bank hold second and third position with an average of 1.96% and 1.95% respectively. The last position belongs to Trust Bank with an average of only 1.07%.
Table-8 shows rank of positions of all the sample banks based on their deposits, credits, assets, shareholders equity, and financial ratios.
Table 8: Ranks of Bangladeshi Commercial Banks based on financial indicators
Deposits Credits Assets Shareholders' equity ROE ROD ROA Operational
Efficiency
Asset
Utilization
Prime 1 1 1 3 1 6 5 6 7
National 4 3 2 2 4 5 3 9 5
Dhaka 5 5 5 7 3 9 9 3 2
One 10 9 10 8 6 7 1 5 4
Trust 8 10 8 10 10 8 10 7 10
NCC 6 7 7 6 5 10 6 10 1
AB 3 4 4 5 2 2 7 8 6
Standard 9 8 9 9 7 4 4 1 3
Southeast 2 2 3 1 9 3 8 4 9
Eastern 7 6 6 4 8 1 2 2 6
It is revealed from the above table that according to the ranking Prime Bank holds the first position in
terms of total deposits, total credits, total assets and ROE but it goes to the 3rd
position among other

banks in terms of its total shareholders’ equity and 5th
position in terms of ROA. Southeast Bank holds 1
st position in terms of Shareholders’ equity, Eastern Bank holds 1
st position on terms of ROD and One
bank holds 1st position in terms of ROA. Thus, from the above table, it might be concluded that the
bank with higher total assets, deposits, credits and shareholders’ equity does not always ensure its better profitability performance. The main causes behind it are the increase in operating expenses leading to lower net income, the decrease in credit interest and income in volume of assets. All these factors will sharply lower down profitability.
5. Correlation Analysis: To identify whether any correlation exist between operational efficiency and financial performance (measured by ROA and ROD) and between asset utilization (asset management) and financial performance (measured by ROA and ROD) of the commercial banks in Bangladesh I have undertaken correlation analysis. Ere, the two independent variables are operational efficiency and asset utilization and two dependent variables are ROA and ROD. Operational efficiency has been measured by the operating efficiency ratio (total operating expenses divided by net interest income) and asset utilization (asset management) has been measured by the asset utilization ratio (Operational income divided by total assets). The analysis is done based on the data from the following table:
Table-9: Key average data (2003-13) of Bangladeshi Commercial Banks (In %)
Variable * ROA * ROD ** Operational Efficiency ** Asset Utilization
Prime 1.66% 1.88% 91.74% 5.40%
National 1.95% 2.11% 166.17% 6.74%
Dhaka 1.37% 1.40% 81.08% 9.21%
One 2.15% 1.81% 90.95% 8.46%
Trust 1.07% 1.72% 107.53% 4.04%
NCC 1.58% 1.08% 398.31% 12.45%
AB 1.54% 2.63% 146.03% 5.78%
Standard 1.89% 2.17% 58.10% 8.97%
Southeast 1.40% 2.58% 85.15% 4.94%
Eastern 1.96% 2.84% 75.84% 6.31% * Table 6 and table 7
** Appendix A and Appendix B The result of the correlation analysis is shown in table below:
Return on Assets Return on Deposits
Operational Efficiency -.0865 0.6089
Asset Utilization 0.2974 -0.6193
6. Conclusion:
This paper makes a comparative analysis of performance in terms of total deposits, credits, assets, shareholders’ equity and the three profitability ratios like ROA, ROE and ROD of ten private commercial banks in Bangladesh and ranks them accordingly. It has been observed in the present study that different banks have different combinations of deposits, credits, assets, and shareholders’ equity which cause them to hold different positions in ranking in each aspect. Based on the reported ranking it can be concluded that the bank with higher amount of total assets, credits, deposits or shareholders’ equity does not always ensure better profitability performance. Moreover, not sufficient correlation is found between operational efficiency, asset utilization and financial performance of the banks. So we can also infer that a bank’s financial performance depends more on its effective management rather than on its size (total assets, total deposits etc).

References:
1. Ahmed, F. (1995) Performance of Commercial Banks in Bangladesh-A Note on Current trends.
Journal of the Institute of Bankers, Bangladesh. Vol. 36-41, December 1992-June 1995.
2. Allen, A.M., Cope, S R., Dark, L J H., Whiteridge, H J. (1938) Commercial Banking,
3. Bangladesh Bank, Annual Report: 2003-06. Bangladesh Bank (Statistics Department): Economic
Trends.
4. Bayes, A. (1987) Banking in Bangladesh: Growth, Structure and Performance. Bank Parikrama, Vol.
XII (June), No. 2.
5. Meinster, David and Elyasian, Elyas (1994) An Empirical test of Test of Association between
Production and Financial Performance: The case of Commercial banking industry, Applied Financial
Economics, Vol.4, Pages 55-56.
6. Mishkin, Frederic S. (1998) The Economics of Money, Banking and Financial Markets, 5th edition,
Addison and Wesley Publication.
7. Ritter L and Silber L. (1996) Principle of Money and Banking and Financial Market, 9th edition,
Adison and Wesley Publication.
8. Ross, Peter S. (1991) Commercial Bank Management, IRWIN Publication.
9. Tarawneh, M (2006) A Comparison of Financial Performance in the Banking Sector: Some Evidence
from Omani Commercial Banks, International Research Journal of Finance and Economics, Issue 3.

Appendix-A
Operational Efficiency ratio of the Bangladeshi Commercial Banks
Bank 2003 2004 2005 2006 2007 2008 2009 2010 2011 2012 2013 Average
Prime 78.70% 80.39% 75.49% 73.40% 81.92% 98.02% 119.63% 83.69% 101.75% 91.31% 124.86% 91.74%
National 161.92% 207.26% 236.64% 174.12% 146.67% 182.38% 142.18% 98.91% 60.06% 153.34% 264.34% 166.17%
Dhaka 111.86% 84.08% 79.28% 92.10% 73.03% 69.10% 66.75% 69.69% 83.30% 80.61% 82.13% 81.08%
One 88.55% 60.78% 98.41% 113.57% 93.73% 104.73% 91.79% 77.71% 90.05% 82.96% 98.16% 90.95%
NCC 390.00% 358.49% 314.00% 274.00% 311.00% 374.37% 405.70% 243.55% 584.12% 516.50% 609.66% 398.31%
Trust 156.00% 125.00% 129.00% 76.00% 71.00% 64.33% 121.33% 89.45% 108.85% 128.08% 113.80% 107.53%
AB 223.00% 213.00% 119.00% 315.00% 92.00% 91.15% 84.80% 100.23% 143.32% 111.98% 112.83% 146.03%
Standard 51.00% 43.00% 47.00% 58.00% 87.00% 45.48% 61.31% 52.09% 54.80% 60.45% 78.93% 58.10%
Southeast 76.00% 86.00% 62.00% 62.00% 58.00% 77.73% 88.55% 64.87% 98.12% 111.72% 151.70% 85.15%
Eastern 65.00% 58.00% 77.00% 112.00% 73.00% 84.98% 71.21% 68.99% 80.99% 67.78% 75.25% 75.84%
Appendix-B
Asset Utilization ratio of the Bangladeshi Commercial Banks
Bank 2003 2004 2005 2006 2007 2008 2009 2010 2011 2012 2013 Average
Prime 6.57% 6.09% 5.80% 5.11% 6.05% 5.27% 6.57% 6.35% 0.58% 5.70% 5.28% 5.40%
National 5.11% 5.59% 6% 7.01% 7.69% 7.37% 7.12% 9.72% 7.73% 6.03% 4.76% 6.74%
Dhaka 4.53% 4.51% 4.50% 4.33% 5.52% 12.79% 12.40% 11.65% 13.21% 11.97% 15.94% 9.21%
One 2.62% 3.73% 3.11% 2.91% 3.38% 13.52% 12.90% 13.04% 13.56% 12.16% 12.17% 8.46%
NCC 12.51% 10.63% 11.23% 12% 12.39% 12.93% 14.15% 12.16% 13.45% 12.40% 13.08% 12.45%
Trust 2.68% 3.54% 3.46% 4.05% 4.37% 5.21% 4.55% 6.25% 4.01% 3.15% 3.19% 4.04%
AB 3.92% 4.49% 4.77% 5.52% 7.13% 7.32% 7.73% 8.19% 5.06% 4.81% 4.65% 5.78%
Standard 5.96% 6.13% 5.88% 6.26% 4.59% 8.15% 11.32% 11.70% 13.45% 12.43% 12.78% 8.97%
Southeast 4.51% 3.83% 4.73% 5.07% 5.93% 4.98% 5.20% 6.45% 5.17% 4.09% 4.38% 4.94%
Eastern 5.64% 5.61% 5.81% 5.87% 6.63% 6.78% 6.63% 7.87% 6.62% 5.93% 6.00% 6.31%

Copyright © 2022 FDOKUMEN