Financial deregulation and total factor productivity change: An empirical study of Turkish...
31
Financial deregulation and total factor productivity change: An empirical study of Turkish commercial banks Ihsan Isik a,1 , M. Kabir Hassan b, * a Department of Accounting and Finance, Rowan University, Glassboro, NJ 08028, USA b Department of Economics and Finance, University of New Orleans, New Orleans, LA 70148, USA Received 17 July 2000; accepted 15 November 2001 Abstract In January 1980, a new liberal economic policy was adopted in Turkey to promote financial market development and increase the efficiency and productivity of the financial sector by fostering competition among banks. As a result of this policy, the Turkish banking system wit- nessed a series of legal, structural and institutional changes throughout the 1980s. To enhance their competitive viability, Turkish banks responded by streamlining their operations and in- vesting in new technology. Utilizing a DEA-type Malmquist Total Factor Productivity Change Index, we examine productivity growth, efficiency change, and technical progress in Turkish commercial banks during the deregulation of financial markets in Turkey. We found that all forms of Turkish banks, although in different magnitudes, have recorded significant productivity gains driven mostly by efficiency increases rather than technical progress. Effi- ciency increases, however, were mostly owing to improved resource management practices rather than improved scales. Our results also indicate that private banks began to close their performance gap with public banks in the new environment. Ó 2003 Elsevier Science B.V. All rights reserved. JEL classification: G21; G28 Keywords: Efficiency; Technology; Productivity; Turkish banks; Deregulation; Liberalization; DEA * Corresponding author. Tel.: +1-504-280-6163; fax: +1-504-280-6397. E-mail addresses: [email protected] (I. Isik), [email protected] (M.K. Hassan). 1 Tel.: +1-856-256-4500x3486; fax: +1-856-256-4439. 0378-4266/03/$ - see front matter Ó 2003 Elsevier Science B.V. All rights reserved. doi:10.1016/S0378-4266(02)00288-1 www.elsevier.com/locate/econbase Journal of Banking & Finance 27 (2003) 1455–1485
-
Upload
independent -
Category
Documents
-
view
0 -
download
0
Transcript of Financial deregulation and total factor productivity change: An empirical study of Turkish...

www.elsevier.com/locate/econbase
Journal of Banking & Finance 27 (2003) 1455–1485
Financial deregulation and totalfactor productivity change: An empirical study
of Turkish commercial banks
Ihsan Isik a,1, M. Kabir Hassan b,*
a Department of Accounting and Finance, Rowan University, Glassboro, NJ 08028, USAb Department of Economics and Finance, University of New Orleans, New Orleans, LA 70148, USA
Received 17 July 2000; accepted 15 November 2001
Abstract
In January 1980, a new liberal economic policy was adopted in Turkey to promote financial
market development and increase the efficiency and productivity of the financial sector by
fostering competition among banks. As a result of this policy, the Turkish banking system wit-
nessed a series of legal, structural and institutional changes throughout the 1980s. To enhance
their competitive viability, Turkish banks responded by streamlining their operations and in-
vesting in new technology. Utilizing a DEA-type Malmquist Total Factor Productivity
Change Index, we examine productivity growth, efficiency change, and technical progress in
Turkish commercial banks during the deregulation of financial markets in Turkey. We found
that all forms of Turkish banks, although in different magnitudes, have recorded significant
productivity gains driven mostly by efficiency increases rather than technical progress. Effi-
ciency increases, however, were mostly owing to improved resource management practices
rather than improved scales. Our results also indicate that private banks began to close their
performance gap with public banks in the new environment.
� 2003 Elsevier Science B.V. All rights reserved.
JEL classification: G21; G28
Keywords: Efficiency; Technology; Productivity; Turkish banks; Deregulation; Liberalization; DEA
*Corresponding author. Tel.: +1-504-280-6163; fax: +1-504-280-6397.
E-mail addresses: [email protected] (I. Isik), [email protected] (M.K. Hassan).1 Tel.: +1-856-256-4500x3486; fax: +1-856-256-4439.
0378-4266/03/$ - see front matter � 2003 Elsevier Science B.V. All rights reserved.
doi:10.1016/S0378-4266(02)00288-1

1456 I. Isik, M.K. Hassan / Journal of Banking & Finance 27 (2003) 1455–1485
1. Introduction
Almost all financial transactions taking place in both money and capital markets
in Turkey are conducted by banks, which have been the key instrument of the gov-
ernment-orchestrated economic development policy for years. As anywhere else inthe world, banking in Turkey has been a highly regulated industry, commensurate
with its importance in the financial system. Market entry and exit, capital adequacy,
reserve and liquidity requirements, asset portfolio allocation, number of branches,
deposit insurance, interest rates on deposits and loans have been heavily regu-
lated by the state. With these restrictions, the regulators tried to prevent ‘‘excessive
competition’’ for funds, and thereby providing rents to banks. The rationale was ar-
guably to enhance the safety and soundness of banks by increasing their profitability.
Under such strong patronage and protection, Turkish banking has been traditionallyand until recently a closed system, characterized and controlled by a few giant banks,
immune to the disciplinary forces of competition, sluggish and careless in terms of
innovations, and yet very profitable.
However, the Turkish financial system has undergone strong legal, structural and
institutional changes in recent years. Throughout the 1980s, a series of financial re-
forms were introduced, whose main objectives were to boost the efficiency and pro-
ductivity of banks by limiting state interventions and enhancing the role of market
forces. Also, Turkey�s determination to be a permanent member of the EuropeanUnion (EU) has motivated its banking authorities to ensure that their regulations
are in harmony with those in the union. In this context, interest and foreign exchange
rates were freed. Starting in 1984, foreign exchange deposits could be opened by res-
idents and non-residents, providing extra business for banks. New entrants to the
banking system and new types of financial institutions and products were permit-
ted. 2 The first attempt to sell treasury securities through periodic auctions started
in 1985. The Istanbul Stock Exchange (ISE) and Interbank Money Market were es-
tablished in 1986 to provide liquidity in the financial system. Most directed creditprograms and preferential rates were eliminated, contributing to more efficient re-
source allocation (Denizer, 1997). The Turkish Privatization Law was enacted in
1986 to undertake the privatization of state economic enterprises in priority order
(Altunbas et al., 1994). Open market operations, auditing of banks by independent
external auditors, unified accounting principles and a standard reporting system
were adopted in 1987. Foreign Exchange and Foreign Banknote Markets were estab-
lished in April 1989. Banks enriched their service portfolios by asset-backed securi-
ties, mutual funds, interest and currency rate forwards and swaps, trading ingovernment and private securities, repo transactions, consumer credits and financial
consultation. Turkish banks also took an interest in doing business abroad either by
purchasing foreign banks or opening branches and representative offices. 3
2 Special finance houses, doing business according to Islamic banking principles, were also welcomed to
the system beginning in 1984.3 As of 1996, Turkish banks have individual or joint equity participations in 48 banks and/or other
financial institutions in different parts of the world.
I. Isik, M.K. Hassan / Journal of Banking & Finance 27 (2003) 1455–1485 1457
The changes in both internal and external conditions of banking have altered the
way in which Turkish banks do business and put the spotlight on input saving. The
most obvious external change in the past two decades is the liberalization of the fi-
nancial markets, while the most apparent internal change is the heavy investment in
technology. Most certainly, Turkish financial institutions today operate under moreliberal conditions than they did before the 1980s (Akkurt et al., 1992; Atiyas and
Ersel, 1994; Zaim, 1995; Denizer, 1997). Product and territorial competition has in-
creased as the domestic market opened up. In response, Turkish banks have taken
measures to reduce their branches and personnel and terminate their unprofitable
ventures. Also, advances in communication and processing technology have reduced
the franchise value of operating extensive branching networks, which have decreased
the minimum efficient size for potential entries to compete effectively with established
banks. Thus, we expect that heavy investment in automation and computerizationprojects, substantial entries from inside and outside of the country and increased
bank costs following deregulation have stimulated banks to use their resources more
rationally and/or expand their products and services more eagerly. Accordingly, we
hypothesize that heightened competitive pressures created strong incentives for Turk-
ish banks to streamline their operations, which improved their ratio of outputs to
inputs, thereby increasing their efficiency and productivity.
Berger et al. (1993), and Berger and Humphrey (1997) caution that although sig-
nificant financial changes were taking place all around the globe, efficiency and pro-ductivity studies have not kept pace with these changes because most of them were
related to the institutions of the industrialized countries (mostly US). Very few pro-
ductive efficiency studies have been conducted regarding the financial institutions of
emerging and mixed economies (Beim and Calomiris, 2001). As Benston (1972)
points out, to explore the impact of environmental changes on bank performance,
it is essential to determine the production (cost) function in banking, which is esti-
mated by assuming constant technology. However, banking technology is subject
to shifts owing to such factors as experience, increased knowledge, new innovationsand better production techniques and heightened competition (Hunter and Timme,
1986). In this context, no empirical work has studied the impact of the new liberal
policies put into effect in the 1980s on the productivity, technology and efficiency
growth of Turkish banks. Thus, one empirical question to address is whether tech-
nology, as well as efficiency, of the Turkish banks has improved following the relaxed
regulation.
In this study, we purport to investigate the performance of the Turkish banks in a
dynamic setting, with a particular emphasis on how such regulatory transformationinfluenced the technological progress, efficiency change and productivity growth in
the banking sector. Thus, this study considers both productivity growth at the fron-
tier and spread of the productivity levels as well as the diffusion of technology across
the banking industry. To detect any improvement in bank performance after deregu-
lation, estimation over longer time periods is needed but this has not yet been dem-
onstrated (Berger and Humphrey, 1997). Thus, the first contribution of this paper is
to use an unprecedented long chain of ex-post performance indices. Secondly, un-
like earlier efficiency studies on Turkish banking, we take into account certain bank

1458 I. Isik, M.K. Hassan / Journal of Banking & Finance 27 (2003) 1455–1485
outputs such as off-balance sheet activities, loans to special sectors, inter-bank funds,
and investment securities, which consume a large portion of bank resources to pro-
duce. Thirdly, employing a data envelopment analysis (DEA)-type Malmquist Index,
this study examines total factor productivity change in Turkish banking during the
deregulation episode, along with its mutually exclusive and exhaustive components:Change in efficiency (catching-up or falling behind) and change in technology (inno-
vation or shock). Also, we elaborate efficiency change in Turkish banking further by
studying its sources: Pure technical efficiency change (improvement in management)
and scale efficiency change (improvement towards optimal size). Fourthly, we study
the changes in the returns to scale of Turkish banks over time by ownership. Finally,
we explore the likely impact of omitting non-traditional financial services on bank
performance.
Berger et al. (1995), Bhattacharya et al. (1997), and Wheelock and Wilson (1999)maintain that deregulation and technical change could result in differential impacts
on banks of different forms. Supporting their proposition, our results indicate that
all types of commercial banks operating in Turkey experienced a gain in their pro-
ductivity on average but in notably varying magnitudes. Also, the productivity gains
were lower in the beginning, but in parallel with the acceleration of the reforms, pro-
ductivity has substantially improved. The dominant source driving productivity was
efficiency increases, i.e., efforts of the inefficient banks to catch up with the efficient
ones. Moreover, efficiency increases were due to improved managerial practicesrather than improved scales.
The paper is structured as follows. Following the literature review, we discuss the
liberalization of markets in Turkey in Section 3. We explain the methodology in Sec-
tion 4 and present the empirical setting and data in Section 5. In Section 6, we an-
alyze the managerial efficiency of the Turkish banks. We examine the impact of
the reforms on the productivity change of the sector in Section 7 and conclude in
Section 8.
2. Literature review
The theory of the firm considers a production environment in which managers,
operating in the most efficient manner possible, try to maximize firm profits and con-
sequently shareholder wealth. In an increasingly competitive environment, efficiency
and productivity of financial institutions has become critically important. The com-
petitive model posits that capital markets will penalize an under-performing firm bydepressing its share price and subjecting it to takeover. In a perfectly competitive and
contestable environment, inefficient firms will be either acquired or eventually driven
out of the market by efficient ones. However, inefficient firms may continue to sur-
vive or even prosper if entry barriers or regulations weaken competitive forces. Ac-
cordingly, the market discipline hypothesis implies that weakening competitive
pressures may induce deviations from the profit maximization goal as managers find
that they do not need to operate very efficiently to stay in business or as they seek to
maximize their own wealth (Evanoff and Israilevich, 1991).

I. Isik, M.K. Hassan / Journal of Banking & Finance 27 (2003) 1455–1485 1459
Bank regulators are responsible for the well-functioning and competitive viability
of the banking system along with its soundness and security. In fact, these goals are
not mutually exclusive, provided that banks are run efficiently. Enhanced efficiency
in banking can result in better resource allocation, which will benefit society by lead-
ing to greater and more appropriate innovations, improved profitability, greateramounts of funds intermediated, better prices and service quality for consumers,
and greater safety and soundness in the financial system. Financial services industries
have been deregulated in many parts of the world, such as the removal of interest
rate ceilings in the US in the 1980s and the harmonization and unification of banking
markets in Europe in the 1990s (Molyneux et al., 1994). Deregulatory policies are
typically aimed at increasing competition in the markets and in turn boosting effi-
ciency and productivity of institutions by disciplining them in resource management
and putting them in a case where their survival and success will depend on their abil-ity to adapt and operate efficiently in the new environment. Despite the expectations,
however, empirical studies to date have presented mixed results.
Shyu (1998) reported upgraded operating efficiency in the Taiwanese banking sys-
tem after deregulation, as did Leightner and Lovell (1998) for Thai banks in a more
liberal financial environment. Liberalization in India has resulted in higher efficiency
in the entire banking system but foreign banks have prospered the most in the new
environment (Bhattacharya et al., 1997). Norwegian banks� productivity and effi-ciency first declined but eventually improved following deregulation (Berg et al.,1992). Gilbert and Wilson (1998) found that along with privatization, deregulation
of interest rates improved potential output as well as productivity among Korean
banks. On the contrary, banking efficiency in the US has remained relatively un-
changed after the deregulation of the early 1980s (Bauer et al., 1993; Elyasiani
and Mehdian, 1995). In fact, bank productivity declined during the post-deregulation
era in the US (Humphrey, 1993; Grabowski et al., 1994; Humphrey and Pulley,
1997). Although not focused explicitly on the impact of the deregulatory changes,
a recent study by Wheelock and Wilson (1999) also reported declining productivityamong US banks between 1984 and 1993, a trend that was associated more with
small banks than large banks. Most probably deregulation of the scale and scope
of banking benefited larger banks more than small banks. Similarly, efficiency and
productivity in Spanish banking has diminished in the deregulated environment
(Grifell-Tatje and Lovell, 1997; Lozano, 1995). A recent study by Khumbakar
et al. (2001) also reported declining efficiency among Spanish saving banks after
deregulation.
Apparently deregulation resulted in a reduction in measured performance ratherthan an improvement in some episodes, indicating that short-run impacts of financial
deregulation may be discouraging. According to Berger and Humphrey (1997), in-
dustry conditions prior to deregulation, such as prevailing excess loan demand in
Norway, intense competition for rapidly expanding market share in Spain, or com-
petitive scramble to pay higher deposit interest rates in the US, may explain these
unexpected consequences. However, it appears that more recent geographical dere-
gulation and consolidation in the US seem to have improved bank efficiency (Hughes
et al., 1996; Berger and Mester, 1997; DeYoung et al., 1998).

1460 I. Isik, M.K. Hassan / Journal of Banking & Finance 27 (2003) 1455–1485
Employing a non-stochastic approach, Zaim (1995) analyzed the efficiency of
Turkish commercial banks at two points in time, one in 1981 (pre-liberalization)
and the other in 1990 (post-liberalization). He found that efficiency in 1990 was
higher than that in 1981. However, he did not address if the production frontier
has expanded or contracted (technological progress or regress); if the average Turk-ish bank has become able to produce more or less outputs from the same amount of
inputs (productivity growth or fall); or if the proximity of the banks to the current as
well as past frontiers has increased or decreased (efficiency increase or decrease)
within the more liberal environment. Moreover, he used only one year after deregu-
lation to assess the impact of the reforms on bank efficiency, which is insufficient to
capture the long-term trends in bank performance (Berger and Humphrey, 1997).
Using the structure–conduct–performance paradigm, Denizer (1997) investigated
the effects of financial liberalization and new bank entry on market structure andcompetition in Turkey. His results suggest that market structure is an important fac-
tor in explaining bank profitability in the Turkish banking market. In a recent paper,
Isik and Hassan (2002) examine the correlates of input/output efficiency in Turkish
banks in the post-liberalization era. They report that efficient banks are riskier, pub-
licly traded, relatively small, highly engaged in international operations and run as
joint ventures between Turkish and foreign investors. Moreover, they find that effi-
cient banks operate under the umbrella of a holding company structure, have a
board where the chairman of the board is not also the CEO of the operations,and produce more loans relative to inefficient banks.
3. Descriptive statistics of the Turkish banking industry
Financial deregulation in Turkey began in the early 1980s and accelerated after-
wards as Turkish banking has moved towards the model of a free-market business.
The main goal of the policy makers was to increase the efficiency and productivity ofthe financial system by fostering competition among the banks. This was to be ac-
complished through deregulation and promoting entry into the system. We con-
structed Table 1 to provide a synopsis of the changes in banking behavior after
deregulation. It appears that the reforms realized one of their major targets, to at-
tract new banks into the system. While there were no new entries into the system be-
tween 1975 and 1980, the number of banks operating in Turkey has increased
noticeably afterwards. For instance, as there were only four foreign banks operating
in the market between 1977 and 1980, the number jumped to 23 in 1990. The existingtraditional banks seem to have found themselves in a heightened competition not
only with recently established domestic banks, but also with foreign banks. To in-
crease the speed, quality and efficiency of their services and in turn strengthen their
competitive viability, Turkish banks began to concentrate on expensive automation
and computerization projects in the early years of liberalization.
Before liberalization, there were interest rate ceilings on deposits paid by Turkish
banks and real interest rates were negative due to a high level of inflation. Driven by

Table 1
Descriptive statistics of the Turkish banking industry during the pre- and post-deregulation periods
All banks State banks Private banks Foreign banks
Market structure
Number of banks
1970 41 10 26 5
1975 37 10 22 5
1980 37 9 23 4
1985 44 8 20 15
1990 56 8 25 23
Average number of branches
1970 79 149 61 22
1975 126 183 120 23
1980 163 257 142 26
1985 142 307 166 8
1990 116 371 138 5
1993 107 500 96 5
Average number of employees
1970 1567 3158 1148 370
1975 2530 4263 1905 429
1980 3303 5977 2556 461
1985 3095 7892 3125 177
1990 2714 10,103 2726 131
1993 2444 12,759 1961 120
Share in total assets (TA)
1970 1.000 0.621 0.344 0.035
1975 1.000 0.522 0.443 0.035
1980 1.000 0.503 0.467 0.030
1985 1.000 0.509 0.453 0.037
1990 1.000 0.497 0.465 0.038
5-Bank concentration in TA
1970 0.66
1980 0.64
1989 0.58
1996 0.49
Cost structure
Total cost/TA
1970–1975 0.077 0.078 0.075 0.073
1976–1980 0.096 0.105 0.088 0.075
1981–1985 0.173 0.145 0.206 0.141
1986–1990 0.210 0.208 0.237 0.202
Interest expense/total cost
1970–1975 0.347 0.330 0.366 0.394
1976–1980 0.353 0.321 0.392 0.387
1981–1985 0.712 0.697 0.727 0.631
1986–1990 0.696 0.737 0.629 0.590
(continued on next page
I. Isik, M.K. Hassan / Journal of Banking & Finance 27 (2003) 1455–1485 1461
)

Table 1 (continued)
All banks State banks Private banks Foreign banks
Personnel expense/total cost
1970–1975 0.357 0.361 0.355 0.320
1976–1980 0.400 0.386 0.418 0.378
1981–1985 0.156 0.155 0.156 0.164
1986–1990 0.099 0.083 0.113 0.101
Income structure
ROA
1970–1975 0.006 0.005 0.008 0.010
1976–1980 0.008 0.009 0.008 0.013
1981–1985 0.015 0.016 0.012 0.040
1986–1990 0.022 0.017 0.025 0.040
ROE
1970–1975 0.083 0.045 0.219 0.301
1976–1980 0.167 0.117 0.302 0.512
1981–1985 0.209 0.171 0.244 0.787
1986–1990 0.378 0.322 0.376 0.566
Interest spread
1970–1975 0.044 0.013 0.071 0.081
1976–1980 0.043 �0.003 0.087 0.084
1981–1985 0.137 0.051 0.236 0.156
1986–1990 0.223 0.141 0.294 0.234
1462 I. Isik, M.K. Hassan / Journal of Banking & Finance 27 (2003) 1455–1485
these conditions, banks started a race to open branches all across the country. Evi-
dently, between 1970 and 1980, the average number of branches rose by 106% and
the average number of employees increased by 111%. The surge in expansionary ef-
forts by banks is more striking if one considers that the number of banks remained
practically unchanged during the 1970s. These efforts resulted in heavy investments
in costly human capital and brick-and-mortar branch offices and contributed to the
overwhelming overhead costs and scale problems whose adverse impacts on Turkish
banking have continued to the present. Apparently, when interest rates were regu-lated by the state, banks could compete with each other for scarce savings by increas-
ing convenience to customers, i.e., more bank offices or employees per capita or per
area. This resulted in an over-utilization of physical capital relative to other factor
inputs in Turkish banking. However, attractiveness and value of an extensive
branching network has declined in parallel with the structural changes in banking
and developments in the communication technology. To cope with deepening
over-branching and over-employment problems, banks have reversed their expan-
sionary plans, which resulted in substantial reductions in the average number ofbank branches and employees during the 1980s.
The evolution of competition in banking has primarily featured the de-concentra-
tion process in the market. There has been a steady decrease in the market share of
the five largest banks in total assets (e.g., 66% in 1970, 64% in 1980, and 49% in
1996). It seems as though the financial reforms, which reduced the barriers to the
I. Isik, M.K. Hassan / Journal of Banking & Finance 27 (2003) 1455–1485 1463
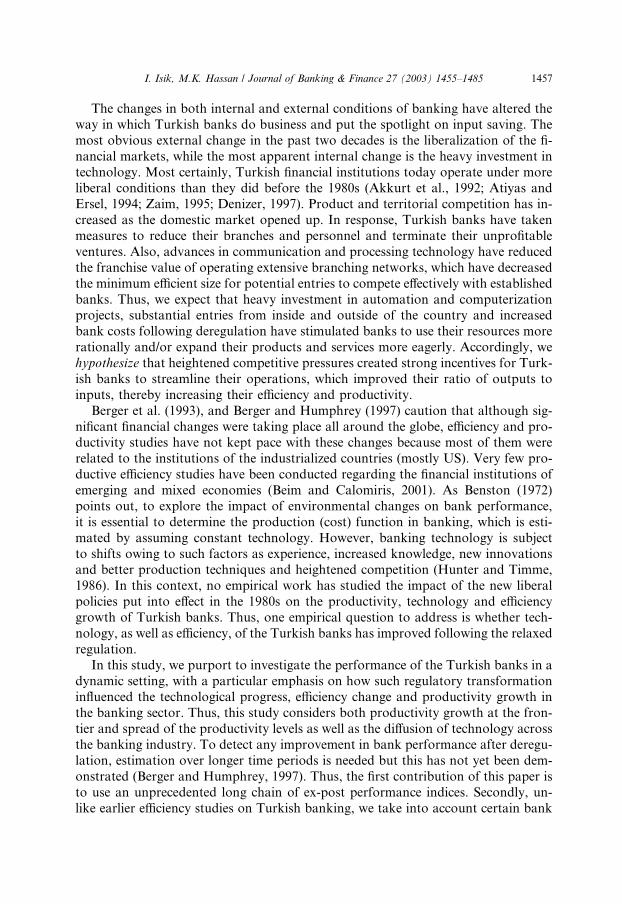
new entries, have constantly reduced concentration in the system. 4 However contin-
uous the fall is, the five largest banks still account for 50% of the industry�s assets. Asobserved in other countries, there were also sharp increases in interest rates in Tur-
key following deregulation. Interest expenses more than doubled in the early 1980s
with respect to the 1970s. The increased cost of funding along with expensive tech-nological build-up led to substantial increases in total banking costs. Turkish banks,
as mentioned above, responded swiftly to increased costs by trimming excess person-
nel and closing unprofitable branches. Consequently, the share of personnel expenses
in total costs on average declined tremendously, from 40% between 1976 and 1980 to
less than 10% between 1986 and 1990. Moreover, to keep interest costs low, large
banks entered into the so-called ‘‘gentlemen�s agreement’’, which is in reality an opencollusion (Denizer, 1997). Despite the increased costs, Turkish banks have been able
to record phenomenal profits during the 1980s owing to high interest spreads. 5 Dur-ing the deregulatory process, there was an increased volatility in interest rates, with
effects on the stability of the financial system. Concerns with the stability of the sys-
tem led to re-regulations, occasional setbacks, and partial reversal of the reforms.
Hence, it is a matter of empirical endeavor to see whether the reform agenda has
achieved its desired ends despite the counterbalancing forces.
4. Methodology
Following Berg et al. (1992), Elyasiani and Mehdian (1992), Fare et al. (1994),
Zaim (1995), Bhattacharya et al. (1997), Leightner and Lovell (1998), Wheelock
and Wilson (1999), among others, we use a non-parametric method, DEA, in mea-
suring bank performance. We adopt the DEA because of the expressed interest in the
Turkish banking industry to control costs in recent years after the liberal policies.
Through input-oriented DEA, we can dwell on the sources of input waste in Turkish
banking and draw some policy conclusions. Stochastic models necessitate a largesample size to make reliable estimations. However, the DEA is relatively less data
demanding, i.e., it works well with a small sample size and does not require know-
ledge of the proper functional form of the frontier, error and inefficiency structures
(Evanoff and Israilevich, 1991; Grifell-Tatje and Lovell, 1997; Bauer et al., 1998;
Wheelock and Wilson, 1999). Although our sample contains the universe of the
Turkish banks, the total number of banks in the sample is relatively small (e.g., 38
in 1981 and 56 in 1990), motivating the use of the DEA in this study.
4 The systematic fall in the share of large banks is also associated with the efforts of small and medium
size banks to grow by expanding their deposit base.5 The source of bank profits could be market power as suggested by Denizer (1997) or alternatively
some other market or regulatory distortions as suggested by Isik and Hassan (2002): Persistent state
budget deficits, along with a fast growing economy, create abundant profit opportunities for Turkish
banks, offsetting increases in banking costs and hence lessening the impact of competitive pressures on
banks.

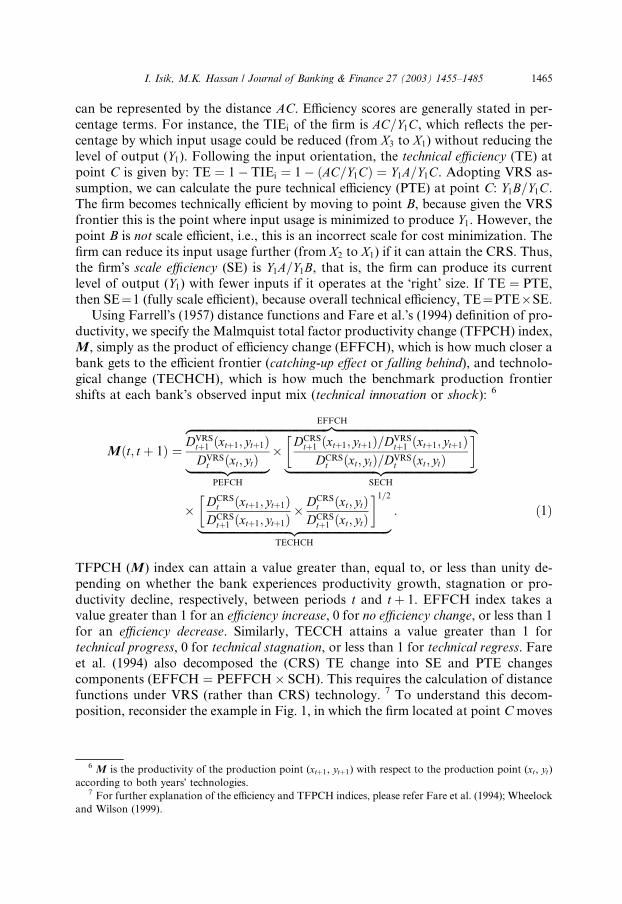
Fig. 1. Efficiency and productivity concepts.
1464 I. Isik, M.K. Hassan / Journal of Banking & Finance 27 (2003) 1455–1485
With a simple case of single-input (x) and single-output (y), Fig. 1 illustrates ef-ficiency and productivity concepts based on the DEA. Assuming that all firms are
operating at an optimal scale (i.e., one corresponding to the flat portion of the
long-run average cost curve), we obtain a constant returns to scale (CRS) frontier
(CRSt: 0ATFR or CRStþ1: 0GP). However, firms in practice might face either econ-
omies or diseconomies of scale because of imperfect competition, constraints on fi-
nance, etc. Relaxing the CRS assumption and introducing convexity restriction,
Banker et al. (1984) proposed a variable returns to scale (VRS) frontier (VRSt: LKB-
TES). The VRSt technology indicates increasing returns to scale (IRS) to the left ofpoint T, decreasing returns to scale (DRS) to the right of T and CRS at point T. The
frontiers constructed are, however, not static but subject to change over time due to
innovation (technological progress), shocks (financial crises), changes in market
structure (higher concentration due to M&As) and regulatory policies (financial
deregulation).
Assume the following: The technology is one of CRS, and has not changed from
year t to year t þ 1 and a bank was observed at point C in year t, (X3, Y1) and
at point D in year t þ 1, (X3, Y2). Both observations, C and D, represent feasiblebut technically inefficient production points because they are interior to the CRStfrontier. In Farrell (1957), output-oriented technical inefficiency (TIEo) is repre-
sented by the distance CF at time t (DF at time t þ 1). Thus, the TIEo at point Cis simply the amount by which output could be proportionally increased (from Y1to Y4) without a rise in input (X3). Alternatively, input-oriented TIEi at point C
I. Isik, M.K. Hassan / Journal of Banking & Finance 27 (2003) 1455–1485 1465
can be represented by the distance AC. Efficiency scores are generally stated in per-
centage terms. For instance, the TIEi of the firm is AC=Y1C, which reflects the per-centage by which input usage could be reduced (from X3 to X1) without reducing thelevel of output (Y1). Following the input orientation, the technical efficiency (TE) at
point C is given by: TE ¼ 1� TIEi ¼ 1� ðAC=Y1CÞ ¼ Y1A=Y1C. Adopting VRS as-sumption, we can calculate the pure technical efficiency (PTE) at point C: Y1B=Y1C.The firm becomes technically efficient by moving to point B, because given the VRS
frontier this is the point where input usage is minimized to produce Y1. However, thepoint B is not scale efficient, i.e., this is an incorrect scale for cost minimization. The
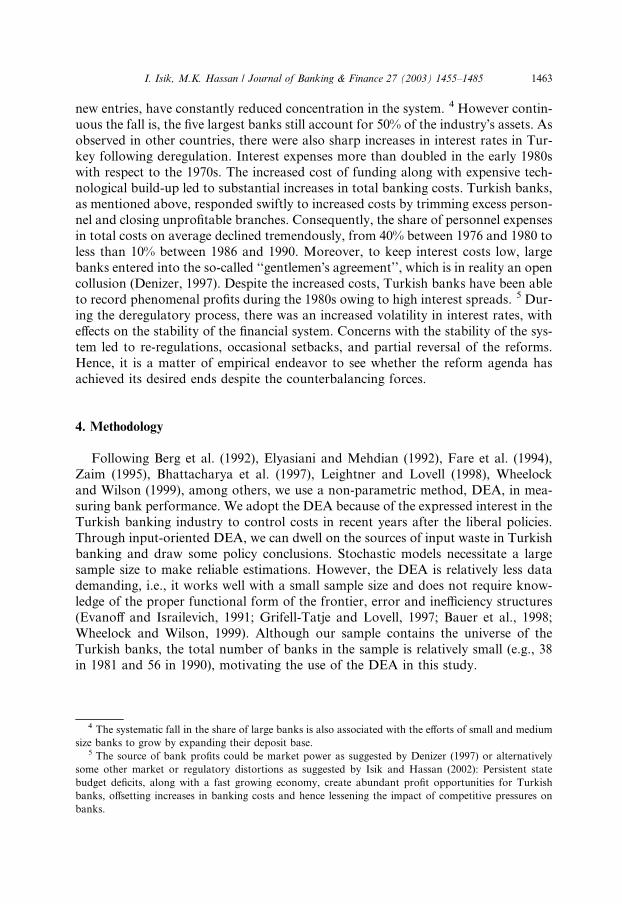
firm can reduce its input usage further (from X2 to X1) if it can attain the CRS. Thus,the firm�s scale efficiency (SE) is Y1A=Y1B, that is, the firm can produce its currentlevel of output (Y1) with fewer inputs if it operates at the �right� size. If TE ¼ PTE,then SE¼1 (fully scale efficient), because overall technical efficiency, TE¼PTE�SE.Using Farrell�s (1957) distance functions and Fare et al.�s (1994) definition of pro-
ductivity, we specify the Malmquist total factor productivity change (TFPCH) index,
M, simply as the product of efficiency change (EFFCH), which is how much closer abank gets to the efficient frontier (catching-up effect or falling behind), and technolo-
gical change (TECHCH), which is how much the benchmark production frontier
shifts at each bank�s observed input mix (technical innovation or shock): 6
6 M
accord7 Fo
and W
Mðt; t þ 1Þ ¼DVRStþ1 ðxtþ1; ytþ1ÞDVRSt ðxt; ytÞ|fflfflfflfflfflfflfflfflfflfflffl{zfflfflfflfflfflfflfflfflfflfflffl}
PEFCH
�DCRStþ1 ðxtþ1; ytþ1Þ=DVRStþ1 ðxtþ1; ytþ1Þ
DCRSt ðxt; ytÞ=DVRSt ðxt; ytÞ
� �|fflfflfflfflfflfflfflfflfflfflfflfflfflfflfflfflfflfflfflfflfflfflfflfflfflfflfflfflfflfflffl{zfflfflfflfflfflfflfflfflfflfflfflfflfflfflfflfflfflfflfflfflfflfflfflfflfflfflfflfflfflfflffl}
SECH
zfflfflfflfflfflfflfflfflfflfflfflfflfflfflfflfflfflfflfflfflfflfflfflfflfflfflfflfflfflfflfflfflfflfflfflfflfflfflfflfflfflfflfflfflfflfflfflfflffl}|fflfflfflfflfflfflfflfflfflfflfflfflfflfflfflfflfflfflfflfflfflfflfflfflfflfflfflfflfflfflfflfflfflfflfflfflfflfflfflfflfflfflfflfflfflfflfflfflffl{EFFCH
� DCRSt ðxtþ1; ytþ1ÞDCRStþ1 ðxtþ1; ytþ1Þ
� DCRSt ðxt; ytÞDCRStþ1 ðxt; ytÞ
� �1=2|fflfflfflfflfflfflfflfflfflfflfflfflfflfflfflfflfflfflfflfflfflfflfflfflfflfflfflfflfflfflffl{zfflfflfflfflfflfflfflfflfflfflfflfflfflfflfflfflfflfflfflfflfflfflfflfflfflfflfflfflfflfflffl}
TECHCH
: ð1Þ
TFPCH (M) index can attain a value greater than, equal to, or less than unity de-pending on whether the bank experiences productivity growth, stagnation or pro-
ductivity decline, respectively, between periods t and t þ 1. EFFCH index takes avalue greater than 1 for an efficiency increase, 0 for no efficiency change, or less than 1
for an efficiency decrease. Similarly, TECCH attains a value greater than 1 for
technical progress, 0 for technical stagnation, or less than 1 for technical regress. Fare
et al. (1994) also decomposed the (CRS) TE change into SE and PTE changes
components (EFFCH ¼ PEFFCH� SCH). This requires the calculation of distancefunctions under VRS (rather than CRS) technology. 7 To understand this decom-
position, reconsider the example in Fig. 1, in which the firm located at point Cmoves
is the productivity of the production point (xtþ1, ytþ1) with respect to the production point (xt, yt)ing to both years� technologies.r further explanation of the efficiency and TFPCH indices, please refer Fare et al. (1994); Wheelock
ilson (1999).
1466 I. Isik, M.K. Hassan / Journal of Banking & Finance 27 (2003) 1455–1485
to point D from year t to year t þ 1, but the estimated CRSt and VRSt frontiersremain the same. FromEq. (1), EFFCH ¼ ðX3D=X3F Þ=ðX3C=X3F Þ > 1 andTECCH ¼½ððX3D=X3F Þ=ðX3D=X3F ÞÞ � ððX3C=X3F Þ=ðX3C=X3F ÞÞ�1=2 ¼ 1, thus, TFPCH > 1, in-dicating productivity growth. In moving from point C to point D, not only does the
firm become more efficient but also more productive. In the new location, using thesame level of input (X3), the firm increases its output from Y1 to Y2. The cause ofthe productivity growth is the catching-up effort (EFFCH) of the firm rather than an
innovation in technology (TECCH). It seems that the efficiency increase (EFFCH >1) is driven by increases both in PTE (PEFCH ¼ ðX3D=X3EÞ=ðX3C=X3EÞ > 1) and SE(SECH ¼ ððX3D=X3F Þ=ðX3D=X3EÞÞ=ððX3C=X3F Þ=ðX3C=X3EÞÞ > 1).Efficiency by itself can bias the measurement of a production unit�s performance,
especially of those operating in an industry facing technological and regulatory
changes. Hence, efficiency studies based on cross-sectional data may not contributeto explaining productivity growth (Berg et al., 1992). A technological advance
adopted by a few banks, but not the average bank, could expand the estimated pro-
duction frontier. A bank that fails to take advantage of technological advances will
be increasingly inefficient relative to banks adopting the new technology (Wheelock
and Wilson, 1999). Thus, productivity growth does not always imply an efficiency
increase. To see this, consider once again the bank located at point C. By moving
to point D, we saw that the bank became more productive. If we say TFPCH ¼1:2, i.e., the firm became able to produce 20% more output with the same level ofinput (X3). Now assume that at the same time CRSt frontier shifted outward toCRStþ1; i.e., technical progress allowed banks to produce 30% more output from
the same amount of input (X3). Despite the increased productivity, the bank still ex-periences technical inefficiency (measured as proximity to the frontier) by 10%. 8
The hypothesis. We hypothesize in this study that due to the deregulatory policies
implemented throughout the 1980s to foster competitive pressures on banks to use
resources more rationally, Turkish banks will record improved TE (TEtþ1, PTEtþ1and SEtþ1 > TEt, PTEt and SEt), along with increased productivity over time afterliberalization [TFPCH > 1 because of TECCH > 1 (an upward shift in productionfrontier due to technological investments and advances) and/or EFFCH > 1 (clo-sure of the performance gap between the best- and worst-practice banks owing to
better resource management (PEFCH > 1) and/or movement toward optimal size(SECH > 1))].
5. Data and empirical setting for efficiency and productivity measurement
We obtained the data on Turkish banks from the Banks Association of Turkey
(BAT). Our sample contains the universe of Turkish commercial banks, i.e., all
banks operating in Turkey during the 1981–1990 period. However, we had to omit
8 Like Resti (1997), to estimate efficiency and productivity indices, we use the DEAP version 2.1,
developed by Tim Coelli of University of New England.
I. Isik, M.K. Hassan / Journal of Banking & Finance 27 (2003) 1455–1485 1467
six bank observations due to no report of outputs or inputs. One bank (Caybank/
Derbank), for an unknown reason, did not report to the BAT between 1988 and
1989. Consequently, our unbalanced panel data consist of 458 net observations
out of 465 total observations, which span the time horizon of 1981 through 1990.
We adopt an ‘‘intermediation approach’’ or ‘‘asset approach’’ to define bank inputsand outputs (Sealey and Lindley, 1977). Accordingly, we use three inputs: (1) labor:
The number of full-time employees on the payroll; (2) capital: The book value of pre-
mises and fixed assets and (3) loanable funds: The sum of deposit and non-deposit
funds. As for outputs, we use: (1) short-term, and (2) long-term loans: The loans with
less than and more than a year maturity, respectively; (3) risk-adjusted off-balance
sheet items: Guarantees and warranties (letters of guarantee, bank acceptance, letters
of credit, guaranteed pre-financing, endorsements and others), commitments, foreign
exchange and interest rate transactions as well as other off-balance sheet activities,and (4) other earning assets: Loans to special sectors (directed and specialized loans),
inter-bank funds sold and investment securities (treasury and other securities). Since
data limitations do not allow us to analyze managerial performance with using off-
balance sheet items as an output for the entire period, we present the efficiency re-
sults dichotomously, one based on a portfolio of three outputs, between 1981 and
1990 (short-and long-term loans, and other earning assets but without off-balance
sheet activities), and one based on a portfolio of four outputs between 1986 and
1990 (the three outputs above with off-balance sheet activities). 9
Most of the bank loans as well as deposits in Turkey�s high inflationary environ-ment lie in a short-term maturity class (BAT, 1990). This indicates that short- and
long-term loans are effective substitutes, i.e., economic units are not indifferent be-
tween them as issuing long-term loans is substantially riskier and costlier than issu-
ing short-term loans within this volatile environment, leading us to treat them as two
distinct bank outputs as done by Berg et al. (1992), Zaim (1995), Isik and Hassan
(2002). Repo transactions as well as other off-balance sheet activities rose substan-
tially during the more liberal environment of the 1980s. In notional values, Turkishbanks� off-balance sheet items began to exceed their on-balance sheet items at leastby a factor of three (BAT, 1996). We risk-adjusted off-balance sheet items using
the Basel Accord risk weights to obtain their on-balance sheet equivalents, i.e., to
provide conformity with other bank outputs in terms of credit risk. Ignoring off-
balance sheet items, as in most previous bank efficiency and productivity models,
does not reflect the changes in the marketplace as banks continuously embrace
non-traditional activities. Thus, omission of such items could affect derived efficiency
and productivity estimates statistically and economically to a great extent by seri-ously understating actual output (Siems and Clark, 1997).
9 The format of balance sheets and income statements has changed after 1980, disallowing us to extend
the study to the pre-1980 period. Also, Turkish banks began to report off-balance sheet activities to the
BAT in 1986. Thus, we are able to utilize such activities in our model only after 1986. Accordingly, we
report the results both with and without off-balance sheet activities between 1986 and 1990 to investigate
the impact of such activities on the estimates.

1468 I. Isik, M.K. Hassan / Journal of Banking & Finance 27 (2003) 1455–1485
To demonstrate the dynamics of productivity and efficiency change in Turkish
banking during the liberalization, we report the results for the full 10 years between
1981 and 1990. Although the New Economic Policy was launched in 1981, Denizer
(1997) chose 1986 as the beginning of the post-liberalization period while studying
the effects of financial liberalization and new bank entry on market structure andcompetition in Turkey. The transformation into full price competition was not effec-
tive and over until the mid-1980s, despite the fact that reforms started in the early
1980s (Celasun, 1998). In our analysis, we take these views into account and treat
1986 as an alternative reference year to 1981 for the beginning of the deregulation
era. 10 In this perspective, one could assume the 1981–1986 period as the adjustment
period for the banks to changes in the environment and for the reforms to exert their
impact on banking behavior, and the 1987–1990 period as the time to reap the ben-
efits of the reforms. Thus, we report the results for three periods, infancy phase
(1981–1986), maturity phase (1987–1990) and entire phase (1981–1990) of the deregu-
lation.
6. The impact of the deregulation on the managerial (technical) efficiency of Turkish
banks 11
In this part of the analysis, we examine managerial performance in Turkish bank-ing according to the results from the DEA linear programming problems solved for
each bank. In Table 2, we report the mean technical efficiency for all (Panel A), state
(Panel B), private (Panel C), and foreign banks (Panel D). The mean efficiency mea-
sures in Table 2 and mean productivity change indices in Table 4 (below) for each
year are compared to the mean of the beginning base year (81base for the measures
without off-balance sheet activities and 86base for the measures with such items) and
the average of the annual means for the 1987–1990 period is compared to that for
the 1981–1986 period to determine whether the increases or decreases in efficiencyand total factor productivity change scores across time are statistically significant. 12
Either with off-balance sheet activities (first section of each panel) or without (sec-
ond section of each panel), the results indicate that the average managerial efficiency
in Turkish banks has substantially improved after deregulation. Consequently,
10 Zaim (1995) chose 1981 and 1990 as the representative years of pre- and post-liberalization eras in his
analysis.11 Whether foreign and domestic commercial banks operating in Turkey posses the same banking
technology may be questionable. Using the parametric (ANOVA) and non-parametric (Mann–Whitney,
Kruskal–Wallis and Kolmogorov–Smirnov) tests outlined in Aly et al. (1990), Elyasiani and Mehdian
(1992), we tested the null hypothesis that domestic and foreign banks have identical technologies. We
failed to reject the null hypothesis, suggesting that it is appropriate to construct a common frontier by
pooling data. Thus, the rest of the study continues with the results computed relative to common frontier.12 It should be noted that in this section, we analyze managerial performance of all banks operating in
each year, whether they entered or exited from the population in any year between 1981 and 1990.
Therefore, for any specific year, the number of banks whose efficiency measures are summarized in Table 2
is greater than or equal at most to the number of banks whose productivity change measures are reported
in Table 5. Simply, a growth measure dictates the existence of a bank in each of the two years in question.

Table 2
Average managerial efficiency (TE) of Turkish commercial banks during financial deregulation (1981–1990)
Years Panel A: All banks Panel B: State banks Panel C: Private banks Panel D: Foreign banks
A.1 Without off_B/S activities B.1 Without off_B/S activities C.1 Without off_B/S activities D.1 Without off_B/S activities
# TE PTE SE # TE PTE SE # TE PTE SE # TE PTE SE
81base 38 0.664 0.754 0.881 9 0.821 0.843 0.974 23 0.636 0.718 0.886 6 0.537 0.756 0.710
1982 38 0.677 0.732 0.925 9 0.814 0.817 0.996 21 0.618 0.650 0.951 8 0.678 0.853 0.795
1983 38 0.644 0.775 0.831 9 0.760 0.851 0.893 19 0.617 0.717 0.861 10 0.592 0.818 0.724
1984 40 0.585 0.729 0.802 9 0.840 0.899 0.934 18 0.483b 0.581c 0.831 13 0.549 0.817 0.672
1985 44 0.605 0.775 0.781 9 0.773 0.850 0.909c 20 0.490b 0.703 0.697a 15 0.658 0.827 0.796
1986 49 0.574c 0.781 0.735 9 0.585a 0.904 0.647a 23 0.496b 0.717 0.692a 17 0.673 0.802 0.839
1987 50 0.605 0.816 0.741 9 0.626b 0.924 0.677a 24 0.431b 0.746 0.578a 17 0.768c 0.859 0.894c
1988 52 0.714 0.840 0.850 8 0.703 0.902 0.779a 25 0.622 0.732 0.850a 19 0.840b 0.891c 0.943b
1989 53 0.748c 0.859 0.871 8 0.783 0.933 0.839b 24 0.667 0.822c 0.812b 21 0.831b 0.873c 0.952a
1990 56 0.803a 0.876 0.917 8 0.725 0.852 0.851a 25 0.754b 0.857b 0.880 23 0.888a 0.906c 0.980a
Mean
81–86base 0.625 0.758 0.825 0.766 0.861 0.889 0.557 0.681 0.817 0.615 0.812 0.757
87–90 0.718a 0.848a 0.846 0.709c 0.903 0.786b 0.619a 0.789a 0.784b 0.832a 0.882b 0.943a
81–90 0.662 0.794 0.834 0.743 0.878 0.847 0.581 0.724 0.803 0.701 0.840 0.835
A.2 With off_B/S activities B.2 With off_B/S activities C.2 With off_B/S activities D.2 With off_B/S activities
86base 49 0.652 0.839 0.777 9 0.594 0.922 0.644 23 0.573 0.769 0.745 17 0.789 0.891 0.886
1987 50 0.629 0.848 0.742 9 0.629 0.934 0.673 24 0.497 0.772 0.644c 17 0.814 0.908 0.896
1988 52 0.755b 0.905c 0.834 8 0.704c 0.915 0.769c 25 0.682c 0.896b 0.761 19 0.873 0.914 0.955c
1989 53 0.768a 0.879 0.874b 8 0.783b 0.936 0.837a 24 0.681c 0.843 0.808 21 0.867 0.901 0.962c
1990 56 0.805a 0.890c 0.904a 8 0.725c 0.853 0.850a 25 0.755a 0.884b 0.854c 23 0.892c 0.912 0.978b
Mean
86base 0.652 0.839 0.777 0.594 0.922 0.644 0.573 0.769 0.745 0.789 0.891 0.886
87–90 0.739a 0.881 0.840c 0.710c 0.910 0.781b 0.654c 0.849c 0.770 0.861c 0.909 0.948c
86–90 0.722 0.872 0.828 0.687 0.912 0.753 0.638 0.833 0.766 0.847 0.905 0.936
TE measure indicates a proportional reduction in input usage that can be attained if the bank operates on the efficient frontier. The DEA also permits one to
decompose the TE further into its distinct components, PTE, a proportional reduction in input usage if inputs are not wasted, and SE, a proportional reduction
if the bank attains CRS. The TE, PTE and SE measures take values between 0 and 1 for the least and the most efficient units in the sample, respectively.
According to ANOVA tests, a,b,c indicate that the statistical difference between the means of the base year (period) and respective year (period) is significant at
1%, 5%, and 10% level, respectively. For example the difference between the average TE in 1986 and 1981 (base year) is statistically significant at 10% level.
Likewise, the mean annual efficiency for the 1987–1990 period is significantly different from the mean efficiency for the 1981–1986 period at 1% level.
I.Isik
,M.K.Hassa
n/JournalofBanking&
Finance
27(2003)1455–1485
1469
1470 I. Isik, M.K. Hassan / Journal of Banking & Finance 27 (2003) 1455–1485
average input waste in banking has declined strikingly from about 50% in 1981 to
about 24% in 1990. While the mean TE, PTE and SE scores were 63%, 76%, and
83% between 1981 and 1986, they increased to 72%, 85% and 85% between 1987
and 1990, respectively. The differences in efficiency estimates between the two periods
are also statistically significant. The results suggest that the TE initially declined asbanks try to adapt to the new environment. However, the TE of banks has eventually
gained momentum and improved impressively after 1987. Most of the technology in-
vestments have been made in the beginning of the era, which increased the capital
stock (fixed costs) of the banks substantially. In other words, the decrease in TE
from 1984 to 1987 occurred when output volumes were growing at historically nor-
mal rates. Therefore, the efficiency decrease of these years is mainly due to strong
increases in input volumes. It follows that the rapid productivity and efficiency
growth in later years is to some extent due to utilization of the idle capacity createdin the advent of deregulation. The lower efficiency levels during the relevant period
could be also attributed to the financial distress experienced because of some broker-
age house and bank failures between 1983 and 1984 as well as to the following re-
regulation of the interest rates from 1983 to 1987.
A close inspection of Panels B, C and D reveals that the impact of the deregula-
tion on different banking groups was not uniform. While the mean TE of the private
banks averaged 56% between 1981 and 1986, it climbed to 62% between 1987 and
1990. The mean TE of foreign banks demonstrated a striking jump from 62%(1981–1986) to 83% (1987–1990). In contrast, there is a notable decrease in the TE
of state banks (e.g., from 77% during 1981–1986 to 71% during 1987–1990). The re-
sults indicate that private banks, especially foreign ones, benefited the most from the
more liberal and competitive environment than state banks. It seems that foreign and
domestic private banks with their small, thus adaptive structure, more qualified per-
sonnel and advanced technology, benefited more from the new environment. In the
post-liberalization period, emergence of interest rate competition along with full in-
surance of deposits for all banks (not only for public banks) by the state allowed pri-vate banks to compete effectively with public banks. Hence, once the asymmetric
treatment, patronage, and protection of the state among banks are reduced, i.e., once
the playground has been relatively fair, the above results imply that efficiency differ-
entials between state and private banks tend to disappear.
Since the period of 1987–1990 is common to the results both with and without off-
balance sheet items and on the same banks, the comparison in this interval is per-
fectly fair. As we see from both grand averages for all banks (Panel A) and subgroup
banks (Panels B, C, and D), the efficiency estimates with such items are all muchgreater than those without. Moreover, the positive impact of such activities on effi-
ciency is uneven across groups. Improvements in the TE and PTE for state banks
were 0.1% and 0.7%; for private banks 3.5% and 6.0%; and for foreign banks
2.9% and 2.7%, respectively. Considering that private and foreign banks are more
involved in these activities, the greater impact of such items on their efficiency esti-
mates is evident. These results justify the concern that exclusion of off-balance sheet
activities may distort the results especially against the banks that are active in these
non-traditional transactions.

I. Isik, M.K. Hassan / Journal of Banking & Finance 27 (2003) 1455–1485 1471
The results also suggest that the source of total technical inefficiency in the initial
phase of liberalization was mostly scale-related for foreign banks. Scale problems
began to dominate the technical inefficiency of domestic banks in the later years
of the liberalization. This makes sense, if one considers that foreign banks were
new and too small initially to optimally utilize scale-related economics. However,as they got larger over time by expanding their business into the domestic market,
their scale has become almost fully optimal in terms of cost saving, as evidenced
from significant increases in their SE�s taking off from 76% between 1981 and
1986 to 94% between 1987 and 1990. As the demand for banking services increased
over time, domestic banks have also gained size, but this led to diseconomies of scale
given their already large size, as evidenced from the decreases in their scale efficien-
cies over the period. Table 3 presents the trend in the percentage of Turkish banks
(by group) that experience increasing returns (IRS), constant returns (CRS) or de-creasing returns (DRS) to scale during the study period. As 35% of the banks on av-
erage between 1981 and 1986 were suffering from DRS, the percentage of such banks
more than doubled between 1987 and 1990, reaching 71%, confirming the above ob-
servation that scale inefficiency in Turkish banking has resulted mostly from exces-
sive size, i.e., diseconomies of scale. While 37% saw IRS in their operations between
1981 and 1986, the percentage of such banks dropped dramatically to 9% between
1987 and 1990, again suggesting that there is a little room for economics of scale
in the already oversized Turkish banking industry. The subgroup results exhibit sim-ilar patterns. No state bank since 1983 and no private bank since 1988 has ever re-
corded IRS, while over 90% of them registered DRS between 1987 and 1990. Foreign
banks suffer the least from extreme size given their small structure and thus experi-
enced less DRS. In fact, increases in size fostered their efficiency as the number of SE
foreign banks rose by 16% between the two periods.
7. The impact of the deregulation on the total factor productivity growth of Turkishbanks
Mean annual values of the total factor productivity change (TFPCH) index and
its mutually exclusive and exhaustive components (EFFCH and TECCH) are pre-
sented in Tables 4 and 5 according to ownership type. The Malmquist Index cannot
be constructed without a reference technology, which could be the technology of any
year in a multi-period setting. To examine the significance of the choice of the refer-
ence technology, we report the results relative to the technology fixed at the initialyear, Table 4 (1981 for the estimates without off-balance sheet items and 1986 for
the estimates with off-balance sheet items) as well as relative to a succession of tech-
nologies (Table 5).
7.1. Total factor productivity growth relative to a fixed reference technology
In Table 4 (A.1), the reference frontier is fixed at 1981, and the results are based
on the output set without off-balance sheet activities. The data points in each year

Table 3
Developments in the returns to scale (RTS) of Turkish commercial banks during financial deregulation (1981–1990)
Years Panel A: All banks Panel B: State banks Panel C: Private banks Panel D: Foreign banks
A.1 Without off_B/S activities B.1 Without off_B/S activities C.1 Without off_B/S activities D.1 Without off_B/S activities
# IRS (%) CRS (%) DRS (%) # IRS (%) CRS (%) DRS (%) # IRS (%) CRS (%) DRS (%) # IRS (%) CRS (%) DRS (%)
1981 38 42 24 34 9 11 56 33 23 52 13 35 6 50 17 33
1982 38 32 50 18 9 0 89 11 21 33 38 29 8 63 37 0
1983 38 32 26 42 9 11 44 43 19 32 16 52 10 50 30 20
1984 40 50 27 23 9 0 67 33 18 56 11 33 13 77 23 0
1985 44 41 18 41 9 0 33 67 20 45 5 50 15 60 27 13
1986 49 24 24 52 9 0 0 100 23 17 26 57 17 47 35 18
1987 50 12 18 70 9 0 0 100 24 8 4 88 17 24 47 29
1988 52 12 21 67 8 0 12 88 25 4 4 92 19 26 48 26
1989 53 6 19 75 8 0 12 88 24 0 0 100 21 14 43 43
1990 56 5 21 74 8 0 0 100 25 0 12 88 23 13 39 48
Mean
81–86 37 28 35 4 48 48 39 18 43 58 28 14
87–90 9 20 71 0 6 94 3 5 92 19 44 37
81–90 25 25 50 2 31 67 25 13 62 42 35 23
A.2 With off_B/S activities B.2 With off_B/S activities C.2 With off_B/S activities D.2 With off_B/S activities
1986 49 22 24 54 9 0 0 100 23 17 22 61 17 41 41 18
1987 50 8 24 68 9 0 0 100 24 8 13 79 17 12 53 35
1988 52 8 29 63 8 0 12 88 25 0 12 88 19 21 58 21
1989 53 9 23 68 8 0 12 88 24 4 0 96 21 19 52 29
1990 56 9 28 63 8 0 0 100 25 0 16 84 23 22 52 26
Mean
86 22 24 54 0 0 100 17 22 61 41 41 18
87–90 9 26 65 0 6 94 3 10 87 18 54 28
86–90 11 26 63 0 5 95 6 12 82 23 51 26
The RTS is defined as the increases in output stemming from raising the level of all inputs by the same percentage. IRS arise when 1% increase in inputs
produces more than 1% increase in outputs, CRS occur when 1% increase in inputs results in exactly 1% increase in outputs, and DRS happen when 1%
increase in inputs leads to less than 1% increase in outputs. Both IRS and DRS represent non-optimal output levels, thus scale in efficiencies.
1472
I.Isik
,M.K.Hassa
n/JournalofBanking&
Finance
27(2003)1455–1485

Table 4
Average total factor productivity change in Turkish banking industry during financial deregulation (1981–
1990) (with respect to fixed reference frontier)
Period # EFFCH TECCH PEFCH SECH TFPCH
Panel A. All banks
A.1 Without off_B/S activities
81–81 – – – – – –
82–81bs 28 0.970 1.112 0.930 1.044 1.080
83–81 28 0.985 0.869a 1.042c 0.946b 0.857a
84–81 28 0.841b 0.903a 0.919 0.916a 0.759a
85–81 28 1.027 0.771a 1.069b 0.961a 0.792a
86–81 28 1.195a 0.656a 1.097b 1.090c 0.784a
87–81 28 1.242a 0.781a 1.114a 1.114c 0.970
88–81 28 1.182a 0.788a 1.100a 1.074 0.932
89–81 28 1.270a 0.891a 1.162a 1.093 1.132
90–81 28 1.201a 0.960b 1.134a 1.059 1.153c
Meanar
82– 86bs 1.004 0.862 1.011 0.991 0.854
87–90 1.224a 0.855c 1.127a 1.085a 1.047a
82–90 1.102 0.859 1.063 1.033 0.940
A.2 With off_B/S activities
86–86 – – – – – –
87–86bs 47 1.041 1.374 1.047 0.995 1.431
88–86 47 1.268a 1.001a 1.149c 1.104a 1.270
89–86 47 1.362a 1.029a 1.162b 1.172a 1.401
90–86 47 1.428a 1.063a 1.171c 1.219a 1.518
Meanar
87–90 1.275 1.117 1.132 1.122 1.405
Panel B. State banks
B.1 Without off_B/S activities
81–81 – – – – – –
82–81bs 8 0.939 1.044 0.960 0.978 0.980
83–81 8 0.954 0.873 1.061 0.899c 0.833
84–81 8 0.987 0.862 1.062c 0.930 0.851
85–81 8 1.048 0.799 1.106 0.948 0.838
86–81 8 1.126 0.701c 1.115 1.010 0.789
87–81 8 1.205 0.746c 1.174 1.027 0.899
88–81 8 1.145 0.764c 1.121 1.022 0.875
89–81 8 1.198 0.885 1.198 1.001 1.060
90–81 8 1.032 1.000 1.083 0.953 1.032
Meanar
82–86 1.011 0.856 1.061 0.953a 0.858
87–90 1.145c 0.849 1.144 1.000 0.967
82–90 1.071 0.853 1.098 0.974 0.906
B.2 With off_B/S activities
86–86 – – – – – –
87–86bs 8 1.085 1.064 1.055 1.028 1.154
88–86 8 1.189c 0.928c 1.022 1.164c 1.103
(continued on next page
I. Isik, M.K. Hassan / Journal of Banking & Finance 27 (2003) 1455–1485 1473
)

Table 4 (continued)
Period # EFFCH TECCH PEFCH SECH TFPCH
89–86 8 1.369b 0.847a 1.072 1.277a 1.159
90–86 8 1.211 0.835b 0.970c 1.249b 1.012
Meanar
87–90 1.213 0.918 1.030 1.179 1.107
Panel C. Private banks
C.1 Without off_B/S activities
81–81 – – – – – –
82–81bs 16 1.017 1.122 0.917 1.109 1.141
83–81 16 1.006 0.859a 1.060c 0.950a 0.864a
84–81 16 0.823b 0.852a 0.872 0.944a 0.701a
85–81 16 1.040 0.733a 1.056c 0.984a 0.762a
86–81 16 1.214c 0.624a 1.096c 1.109 0.758a
87–81 16 1.226c 0.772a 1.096c 1.119 0.947a
88–81 16 1.188c 0.763a 1.108b 1.072 0.907a
89–81 16 1.315a 0.897b 1.183a 1.112 1.180
90–81 16 1.302a 0.974c 1.199a 1.086 1.268c
Meanar
82–86bs 1.020 0.838 1.000 1.019 0.845
87–90 1.258a 0.852 1.147a 1.097a 1.075a
82–90 1.126 0.844 1.065 1.054 0.948
C.2 With off_B/S activities
86–86 – – – – – –
87–86bs 22 0.947 1.426 1.090 0.869 1.351
88–86 22 1.276a 0.959a 1.255b 1.017a 1.224
89–86 21 1.446a 0.968a 1.300a 1.112a 1.400
90–86 21 1.621a 1.015a 1.353b 1.198a 1.645a
Meanar
87–90 1.323 1.092 1.250 1.049 1.405
Panel D. Foreign banks
D.1 Without off_B/S activities
81–81 – – – – – –
82–81bs 4 0.842 1.210 0.921 0.915 1.019
83–81 4 0.955 0.905c 0.934 1.023 0.864c
84–81 4 0.636 1.187 0.821 0.775 0.755c
85–81 4 0.933 0.869 1.047 0.892 0.810
86–81 4 1.251c 0.691c 1.065 1.175c 0.864c
87–81 4 1.356c 0.888c 1.065 1.274c 1.204c
88–81 4 1.220c 0.938c 1.026 1.189c 1.144
89–81 4 1.213c 0.881a 1.005 1.207c 1.068
90–81 4 1.137c 0.825b 0.976 1.166c 0.938
Meanar
82–86bs 0.923 0.972 0.957 0.956 0.862
87–90 1.231a 0.883c 1.018c 1.209a 1.088b
82–90 1.060 0.933 0.984 1.068 0.963
1474 I. Isik, M.K. Hassan / Journal of Banking & Finance 27 (2003) 1455–1485
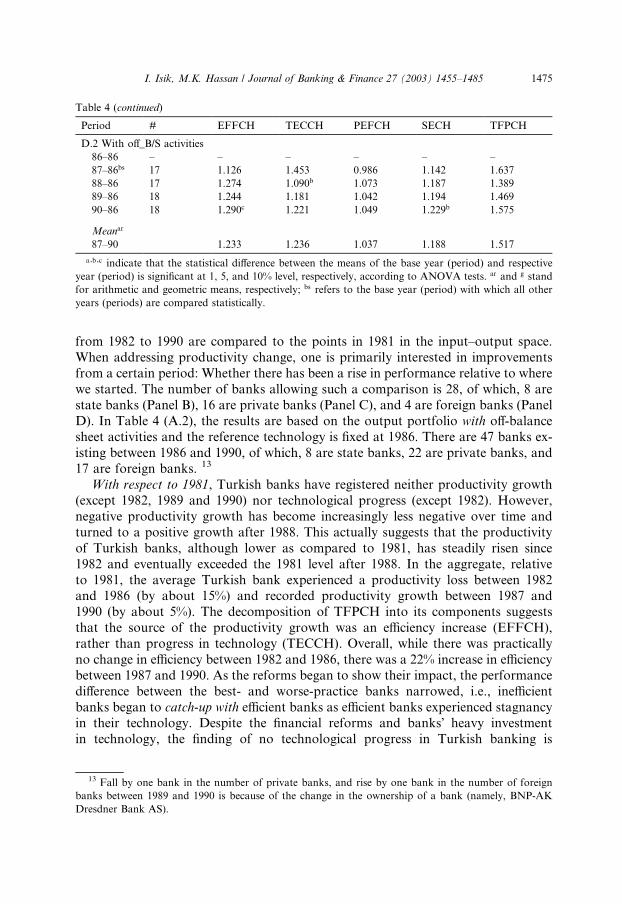
Table 4 (continued)
Period # EFFCH TECCH PEFCH SECH TFPCH
D.2 With off_B/S activities
86–86 – – – – – –
87–86bs 17 1.126 1.453 0.986 1.142 1.637
88–86 17 1.274 1.090b 1.073 1.187 1.389
89–86 18 1.244 1.181 1.042 1.194 1.469
90–86 18 1.290c 1.221 1.049 1.229b 1.575
Meanar
87–90 1.233 1.236 1.037 1.188 1.517
a,b,c indicate that the statistical difference between the means of the base year (period) and respective
year (period) is significant at 1, 5, and 10% level, respectively, according to ANOVA tests. ar and g stand
for arithmetic and geometric means, respectively; bs refers to the base year (period) with which all other
years (periods) are compared statistically.
I. Isik, M.K. Hassan / Journal of Banking & Finance 27 (2003) 1455–1485 1475
from 1982 to 1990 are compared to the points in 1981 in the input–output space.
When addressing productivity change, one is primarily interested in improvements
from a certain period: Whether there has been a rise in performance relative to where
we started. The number of banks allowing such a comparison is 28, of which, 8 are
state banks (Panel B), 16 are private banks (Panel C), and 4 are foreign banks (Panel
D). In Table 4 (A.2), the results are based on the output portfolio with off-balance
sheet activities and the reference technology is fixed at 1986. There are 47 banks ex-
isting between 1986 and 1990, of which, 8 are state banks, 22 are private banks, and17 are foreign banks. 13
With respect to 1981, Turkish banks have registered neither productivity growth
(except 1982, 1989 and 1990) nor technological progress (except 1982). However,
negative productivity growth has become increasingly less negative over time and
turned to a positive growth after 1988. This actually suggests that the productivity
of Turkish banks, although lower as compared to 1981, has steadily risen since
1982 and eventually exceeded the 1981 level after 1988. In the aggregate, relative
to 1981, the average Turkish bank experienced a productivity loss between 1982and 1986 (by about 15%) and recorded productivity growth between 1987 and
1990 (by about 5%). The decomposition of TFPCH into its components suggests
that the source of the productivity growth was an efficiency increase (EFFCH),
rather than progress in technology (TECCH). Overall, while there was practically
no change in efficiency between 1982 and 1986, there was a 22% increase in efficiency
between 1987 and 1990. As the reforms began to show their impact, the performance
difference between the best- and worse-practice banks narrowed, i.e., inefficient
banks began to catch-up with efficient banks as efficient banks experienced stagnancyin their technology. Despite the financial reforms and banks� heavy investmentin technology, the finding of no technological progress in Turkish banking is
13 Fall by one bank in the number of private banks, and rise by one bank in the number of foreign
banks between 1989 and 1990 is because of the change in the ownership of a bank (namely, BNP-AK
Dresdner Bank AS).

Table 5
Average total factor productivity change in Turkish banking industry during financial deregulation (1981–
1990) (with respect to changing (previous year) frontier)
Period # EFFCH TECCH PEFCH SECH TFPCH
Panel A. All banks
A.1 Without off_B/S activities
81–80 – – – – – –
82–81bs 33 0.993 1.074 0.971 1.023 1.067
83–82 36 1.058 0.936 1.091 0.969 0.990
84–83 37 1.028 0.953 0.988 1.040 0.980
85–84 39 1.143 0.963 1.168 0.978 1.100
86–85 43 1.369b 0.742b 1.136 1.205 1.016
87–86 49 1.094 1.163c 1.131 0.967 1.272b
88–87 48 1.252b 0.823c 1.092 1.147 1.030c
89–88 52 1.109 1.038 1.045 1.060 1.151
90–89 53 1.130c 0.940 1.028 1.099 1.062c
Meang
82–86bs 1.111 0.927 1.068 1.040 1.030
87–90 1.145c 0.983 1.074 1.066 1.125a
82–90 1.126 0.951 1.071 1.051 1.071
A.2 With off_B/S activities
86–85 – – – – – –
87–86bs 49 0.981 1.343 1.074 0.914 1.318
88–87 48 1.275a 0.778a 1.131 1.127a 0.992
89–88 52 1.061 1.042a 0.985c 1.077a 1.106
90–89 53 1.101b 0.959a 1.019 1.081a 1.056
Meang
87–90 1.100 1.011 1.051 1.046 1.112
Panel B. State banks
B.1 Without off_B/S activities
81–80 – – – – – –
82–81bs 9 0.984 0.949 1.008 0.977 0.934
83–82 9 1.017 1.060 1.132 0.898c 1.078
84–83 9 1.146 0.882 1.057 1.083c 1.010
85–84 9 0.960 1.100 0.991 0.969 1.056
86–85 9 1.163 0.784 1.070 1.087c 0.912
87–86 9 1.073c 1.057c 1.030 1.042 1.134c
88–87 8 1.109 0.853 0.969 1.145b 0.946
89–88 8 1.181 0.930 1.036 1.139c 1.099
90–89 8 1.098 0.875 0.924 1.189a 0.960
Meang
82–86bs 1.051 0.948 1.050 1.000 0.996
87–90 1.115 0.925 0.989 1.127a 1.032
82–90 1.079 0.938 1.022 1.055 1.012
B.2 With off_B/S activities
86–85 – – – – – –
87–86bs 9 1.056 1.066 1.019 1.037 1.126
88–87 8 1.106 0.854b 0.967 1.144 0.945b
1476 I. Isik, M.K. Hassan / Journal of Banking & Finance 27 (2003) 1455–1485

Table 5 (continued)
Period # EFFCH TECCH PEFCH SECH TFPCH
89–88 8 1.178 0.930 1.029 1.145 1.096
90–89 8 1.098 0.875a 0.919c 1.194c 0.960b
Meang
87–90 1.109 0.928 0.983 1.128 1.029
Panel C. Private banks
C.1 Without off_B/S activities
81–80 – – – – – –
82–81bs 20 1.028 1.108 0.962 1.069 1.139
83–82 19 1.085 0.879c 1.244c 0.872a 0.953c
84–83 18 0.849 0.965 0.814 1.042 0.820a
85–84 18 1.122 0.933 1.311 0.856a 1.047
86–85 21 1.368a 0.700a 1.147c 1.193c 0.958c
87–86 23 1.029 1.174 1.186 0.868a 1.208
88–87 23 1.353b 0.730a 1.103 1.226b 0.988c
89–88 24 1.147 1.024c 1.074 1.068 1.174
90–89 24 1.177c 0.961a 1.047 1.124 1.132
Meang
82–86bs 1.078 0.907 1.079 0.999 0.977
87–90 1.171 0.958 1.101 1.063c 1.122b
82–90 1.118 0.929 1.089 1.027 1.039
C.2 With off_B/S activities
86–85 – – – – – –
87–86bs 23 0.884 1.369 1.127 0.784 1.210
88–87 23 1.413a 0.680a 1.207 1.170a 0.961c
89–88 24 1.063c 1.018a 0.961 1.106a 1.082
90–89 24 1.159a 0.984a 1.057 1.096a 1.140
Meang
87–90 1.114 0.983 1.084 1.027 1.095
Panel D. Foreign banks
D.1 Without off_B/S activities
81–80 – – – – – –
82–81bs 4 0.839 1.195 0.939 0.893 1.002
83–82 8 1.040b 0.943c 0.812 1.281 0.980
84–83 10 1.244a 0.998 1.247 0.997 1.241b
85–84 12 1.310 0.926c 1.123 1.167 1.213c
86–85 13 1.511a 0.782a 1.157 1.306 1.181c
87–86 17 1.194b 1.200 1.124b 1.062c 1.432a
88–87 17 1.182b 0.952 1.138b 1.039c 1.126c
89–88 20 1.034c 1.107c 1.013c 1.020c 1.144b
90–89 21 1.089b 0.939 1.051c 1.036c 1.022c
Meang
82–86bs 1.165 0.959 1.043 1.117 1.118
87–90 1.123b 1.044c 1.080c 1.039 1.172a
82–90 1.146 0.996 1.060 1.082 1.142
(continued on next page
I. Isik, M.K. Hassan / Journal of Banking & Finance 27 (2003) 1455–1485 1477
)

Table 5 (continued)
Period # EFFCH TECCH PEFCH SECH TFPCH
D.2 With off_B/S activities
86–85 – – – – – –
87–86bs 17 1.074 1.459 1.048 1.024 1.566
88–87 17 1.167 0.905a 1.101 1.060 1.056b
89–88 20 1.011 1.125b 0.998 1.013 1.138b
90–89 21 1.037 0.962a 1.015 1.022 0.998a
Meang
87–90 1.071 1.093 1.040 1.030 1.170
a,b,c indicate that the statistical difference between the means of the base year (period) and respective
year (period) is significant at 1, 5, and 10% level, respectively, according to ANOVA tests. ar and g stand
for arithmetic and geometric means, respectively; bs refers to the base year (period) with which all other
years (periods) are compared statistically.
1478 I. Isik, M.K. Hassan / Journal of Banking & Finance 27 (2003) 1455–1485
unexpected. Taking into account the long-term (L-T) nature of technology invest-
ments, the lag in technology may be attributed to the idle capacity created by banks
in the beginning of the deregulation on the expectation that the new environment
would soon allow them to utilize this capacity. The introduction of the ‘‘Golden
Points’’ by some private banks to share their ATMs is a good example of the idle
capacity created in Turkish banks. Hence, more time might be needed to collect
the benefits of the L-T technology investments. However, the results based on off-
balance sheet activities in Table 4 ( Panel A, A.2) indicate that with respect to
1986, all banks recorded productivity growth each year. On average, productivity
grew by an impressive 41% during the period. Over this time, banks displayed tech-
nical progress on average, by 12%, as well. However, the efficiency increase was
again stunning during the period, 28%, confirming again the predominance of the
efficiency increase in driving the productivity growth. Unlike the results without
off-balance sheet items, the results with such items suggest technical progress in
Turkish banking. It may be that the measures based only on traditional on-balance
sheet activities may not have captured an accurate picture of technical change asTurkish banks embraced non-traditional activities within the more liberal environ-
ment.
According to the results without off-balance sheet activities, private and foreign
banks, except for state banks, experienced increasing productivity mainly owing to
increasing efficiency. While private domestic banks have registered 7.5% productivity
growth, foreign banks have shown 8.8% productivity growth between 1987–90. State
banks lost productivity by about 4% in the same period mainly due to the regress in
their technology. Efficiency increases in each type of banks seem to be driven by theimprovement in PTE rather than SE, implying that the management of banking op-
erations has improved for these banks. With respect to the results with off-balance
sheet items, each group�s productivity grew between 1987 and 1990 relative to
1986. The growth again was mostly due to the catching-up effect (EFFCH) rather
than innovation (TECHCH).

I. Isik, M.K. Hassan / Journal of Banking & Finance 27 (2003) 1455–1485 1479
7.2. Total factor productivity growth relative to successive reference technologies
To account for a possible survivorship bias, Table 5 reports the geometric means
of the annual productivity change index (i.e., marginal productivity between two suc-
cessive years) and its components relative to successively changing reference techno-logies. In doing so, we are also able to study the performance of more banks each
year. The prior analysis relative to the fixed technology helped us understand the
change in productivity by studying the behavior of the same banks during dere-
gulation, i.e., the banks were the same, but the periods were different. However, this
method reduced the number of banks in our analysis. Moreover, the year chosen as a
reference could be an extremely good or bad year. Although this would not inhibit
the detection of either an upward or downward trend in productivity, it would ob-
scure the absolute levels of productivity and its components.The results in Table 5 (Panel A, A.1) suggest that over the entire period, 1982–
1990, the productivity of Turkish banks grew by 7.1% on average. The mean effi-
ciency increase in the system was 12.6%, with a pure efficiency increase of 7.1%,
and a SE increase of 5.1%. However, there was technical regress by 4.9% on average
between 1982–1990, although in a few years (e.g., 1982, 1987 and 1989) the Turkish
commercial banks demonstrated technical progress. Overall, the average productiv-
ity change for the two successive years was constantly positive throughout the period
(except for 1982 and 1983). In addition, the magnitude of productivity growth hasclimbed over time, implying a level of shift in marginal productivity as reforms began
to show their impact on Turkish banking. 14 Between 1987 and 1990, the average
productivity growth for the sector amounted to 13%, while it was a mild 3% between
1982 and 1986. Likewise, the efficiency increase rose to 15% between 1987 and 1990,
whereas it was 11% between 1982 and 1986. These results conform to the results ac-
cording to fixed technology summarized above (Table 4). However, average produc-
tivity and efficiency growth became acute and salient once we included the new banks
into the analysis (Table 5). This implies that new entries benefited the banking indus-try notably despite their small share in the market because these banks mostly came
from more advanced countries and were equipped with new technology, more qual-
ified manpower and professional management, along with access to international
markets. The inclusion of off-balance sheet items yields similar results for the period
of 1987–1990. 15 Either with or without off-balance sheet activities, the results in-
dicate that all types of banks benefited from the liberal policies as evidenced by
14 To control for the adverse impact of extreme observations on our results, we exclude four
observations (2 from 1982, 1 from 1985 and 1 from 1986) whose TFPCH indices were two and half
standard deviations away from the average of the respective year. Furthermore, we also extend our
analysis with using the number of banks rather than averages (in Tables 6 and 7). The results based on the
number of banks are less sensitive to extreme observations by construction.15 However, on average, such activities did not change the productivity results as they did in the
managerial efficiency results (Table 2). For example, for the entire period, the productivity change of all
banks without off-balance sheet items was 12.5%, and 11.2% with such items. Moreover, incorporation of
off-balance sheet activities resulted in technical progress of 1.1% rather than 1.7% regress in their absence.

1480 I. Isik, M.K. Hassan / Journal of Banking & Finance 27 (2003) 1455–1485
the increases in their productivity and efficiency. Foreign banks flourished the
most in this environment followed by domestic private banks. During the entire
period, without off-balance sheet items, the average productivity growth was 1.2%
for state banks (Table 5, Panel B, B.1), 3.9% for private banks (Table 5, Panel C,
C.1), and 14.2% for foreign banks (Table 5, Panel D, D.1). 16 The measures withoff-balance sheet items give similar results and the levels of the indices are compara-
ble.
In order to control for possible extreme observations, we constructed Table 6,
which presents the trend in the number of Turkish banks that experienced a produc-
tivity gain or loss during the deregulation period, relative to successively changing
reference technologies. 17 Looking at Table 6, we see that only 41% of the all banks
experienced productivity growth, while the majority, 59%, experienced productivity
loss in the early phase of the liberalization (1982–1986). However, in the maturityphase (1987–1990), the percentage of banks with productivity growth increased sub-
stantially, reaching 61%, while the percentage of banks with productivity loss de-
creased notably to 39%. The results also show that the percentage of banks that
recorded technical progress (regress), efficiency increase (decrease), pure efficiency in-
crease (decrease), and SE increase (decrease) has notably risen (fallen) between 1987
and 1990 with respect to that between 1982 and 1986, suggesting that deregulation
indeed improved the performance of the average Turkish bank. The results, with
and without off-balance sheet activities, are comparable for the period, 1987–1990.The subgroup results indicate that the percentage of all types of banks that experi-
ence improvement (worsening) in productivity, technology, and efficiency has tre-
mendously increased (decreased) over time. 18 The bank group with the highest
percentage of banks that experienced productivity growth between 1987 and 1990
is private banks (63%), followed by foreign banks (60%), and then by state banks
(57%). Based on changing reference technologies, Table 7 displays the main sources
of productivity and efficiency change for the industry. 19 The percentage of banks
with productivity growth mainly due to an efficiency increase accounted for 25%(1982–1986), 39% (1987–1990), and 31% (1982–1990) of all banks in the sample,
whereas the banks with productivity growth mainly due to technical progress
accounted for 15% (1982–1986), 22% (1987–1990), and 18% (1982–1990). As shown,
the dominant source of the productivity growth in Turkish banking is an efficiency
increase rather than technical progress according to the results without off-balance
sheet items. Over the entire period and sub-periods, the major source of a productiv-
ity loss was technical regress rather than an efficiency decrease. On the other hand,
the banks with an efficiency increase mainly due to a PTE increase accounted for29% (1982–1986), 22% (1987–1990), and 26% (1982–1990) of all the banks, while
the banks with an efficiency increase mainly due to SE increase accounted for 16%
(1982–1986), 35% (1987–1990), and 25% (1982–1990). As observed, the dominant
16 Foreign banks are the only banks that record technical progress without off-balance sheet activities.17 The results according to fixed reference technology are available upon request.18 The results for subgroup banks are available upon request from the authors.19 The results based on the fixed reference technology and subgroup banks are available upon request.

Table 6
Development in the percentage of Turkish banks with productivity gain or loss/efficiency increase or decrease during deregulation (1981–1990) all banks (with
respect to changing (previous year) frontier)
Period # Productivity change
(TFPCH)
Technology change
(TECHCH)
Efficiency change
(EFFCH)
Pure efficiency change
(PEFFCH)
Scale efficiency change
(SCH)
Growth
(%)
Loss
(%)
No D(%)
Progress
(%)
Regress
(%)
No D(%)
Increase
(%)
Decrease
(%)
No D(%)
Increase
(%)
Decrease
(%)
No D(%)
Increase
(%)
Decrease
(%)
No D(%)
A.1 Without off_B/S activities (1981–1990)
82–81 33 36 64 0 61 39 0 39 42 18 33 45 21 39 33 27
83–82 36 36 64 0 42 58 0 31 47 22 39 31 31 19 58 22
84–83 37 27 73 0 46 54 0 30 54 16 19 54 27 49 35 16
85–84 39 59 38 3 46 54 0 54 31 15 51 21 28 26 56 18
86–85 43 44 56 0 7 93 0 70 16 14 47 23 30 74 12 14
87–86 49 65 35 0 76 24 0 43 47 10 43 29 29 35 55 10
88–87 48 40 60 0 13 88 0 67 19 15 33 40 27 65 21 15
89–88 52 73 27 0 79 21 0 52 37 12 38 37 25 60 29 12
90–89 53 66 34 0 25 75 0 70 21 9 42 28 30 74 17 9
Mean
82–86 41 59 1 40 60 0 45 38 17 38 35 27 42 39 20
87–90 61 39 0 48 52 0 58 31 11 39 33 28 58 30 11
82–90 50 50 0 44 56 0 51 35 15 38 34 28 49 35 16
A.2 With off_B/S activities (1986–1990)
87–86 49 76 24 0 84 16 0 29 57 14 35 33 33 24 61 14
88–86 48 33 67 0 10 90 0 69 15 17 42 27 31 65 19 17
89–86 52 67 33 0 71 29 0 44 40 15 25 40 35 58 27 15
90–86 53 62 38 0 28 72 0 64 23 13 38 21 42 68 19 13
Mean
87–90 60 40 0 48 52 0 51 34 15 35 30 35 54 31 15
Banks are categorized according to the following: Productivity growth: Malmquist Index ðTFPCHÞ > 1, productivity loss: TFPCH < 1, productivity stag-
nation: TFPCH ¼ 1; technical progress: TECCH > 1, technical regress: TECCH < 1, technical stagnation: TECCH ¼ 1; efficiency, pure and scale efficiencyincrease: EFFCH, PEFFCH, and SCH > 1; efficiency, pure and scale efficiency decrease: EFFCH, PEFFCH, and SCH < 1, no change in efficiency, pure and
scale efficiency: EFFCH, PEFFCH, and SCH ¼ 0.
I.Isik
,M.K.Hassa
n/JournalofBanking&
Finance
27(2003)1455–1485
1481

Table 7
Major source of productivity growth or loss/efficiency increase or decrease in Turkish commercial banking during financial deregulation (with respect to changing fron-
tiers)
Period # Productivity growth mainly
due to:
Productivity loss mainly due
to:No produc-
tivity DEfficiency increase
mainly due to:
Efficiency decrease mainly
due to:No efficiency
D
Efficiency
increase
(%)
Technological
progress
(%)
Efficiency
decrease
(%)
Technological
regress
(%)
PTE
increase
(%)
SE
increase
(%)
PTE
decrease
(%)
SE
decrease
(%)
A.1 Without off_B/S items
82–81 33 16 21 30 33 0 27 13 33 9 18
83–82 36 17 19 33 31 0 28 3 22 25 22
84–83 37 14 13 43 30 0 11 19 43 11 16
85–84 39 36 22 13 26 3 44 10 16 15 15
86–85 43 42 2 7 49 0 33 37 14 2 14
87–86 49 23 43 22 12 0 24 16 13 37 10
88–87 48 31 8 13 48 0 19 47 13 6 15
89–88 52 46 27 23 4 0 21 31 21 15 12
90–89 53 55 11 6 28 0 25 45 15 6 9
Mean
82–86 25 15 25 34 1 29 16 26 12 17
87–90 39 22 16 23 0 22 35 16 16 12
82–90 31 18 21 29 0 26 25 21 14 15
A.2 With off_B/S items
87–86 49 14 61 20 4 0 14 14 12 45 14
88–87 48 25 8 8 58 0 23 46 10 4 17
89–88 52 31 37 21 12 0 13 31 25 15 15
90–89 53 47 15 8 30 0 21 43 15 8 13
Mean
87–90 29 30 14 26 0 18 34 16 18 15
Table presents the major sources of the developments in the productivity and efficiency of the Turkish banks. Definition of the sources is as follows:
Productivity growth because of technological progress: TFPCH > 1, and TECCH > 1 and EFFCH; productivity growth because of efficiency increase:
TFPCH > 1, and EFFCH > 1 and TECCH; productivity loss because of technological regress: TFPCH < 1 and TECCH < 1 and EFFCH; productivity loss
because of efficiency decrease: TFPCH < 1, and EFFCH < 1 and TECCH; efficiency increase because of PTE increase: EFFCH > 1, and PEFFCH > 1 and
SCH, efficiency increase because of SE Increase: EFFCH > 1, and SCH > 1 and PEFFCH; efficiency decrease because of PTE decrease: EFFCH < 1 and
PEFFCH < 1 and SCH, efficiency decrease because of SE decrease: EFFCH < 1, and SCH < 1 and PEFFCH.
1482
I.Isik
,M.K.Hassa
n/JournalofBanking&
Finance
27(2003)1455–1485

I. Isik, M.K. Hassan / Journal of Banking & Finance 27 (2003) 1455–1485 1483
source of an efficiency increase in Turkish banking was a PTE increase rather than a
SE increase over the entire period.
8. Conclusion
Employing a DEA-type Malmquist Total Factor Productivity Change Index ap-
proach, we investigated the impact of financial reforms introduced in the 1980s on
the productivity, efficiency and technology of Turkish commercial banks between
1981 and 1990. We hypothesized that bank performance measured by various effi-
ciency and productivity scores will rise during the more liberal and competitive en-
vironment. Our results suggest that the performance of all types of banks recorded
significant improvements after deregulation, whereas their technology has not ad-vanced as expected. Productivity growth in Turkish banking was mainly driven by
efficiency increases, i.e., the inefficient banks� efforts to catch up with the best-prac-tice banks rather than technical progress. However, accounting for non-traditional
banking activities such as off-balance sheet items produced some evidence of techni-
cal progress.
Improvement in the productivity and efficiency of the Turkish banks was low in
the early years of liberalization, which may be attributed to the idle capacity created
in the advent of deregulation. This suggests that while the performance gap betweenthe worst- and best-practice banks diminished in Turkey, more time might be needed
to reap all potential benefits of the long-term technological investments. Efficiency
increases recorded were mainly due to better management practices rather than im-
provements in scale. Based on this finding, we also studied the returns to scale in
Turkish banking. The results indicate that most of the domestic banks in recent years
have experienced scale inefficiency mainly due to diseconomies of scale, i.e., excessive
production. The demand for banking services and products has surged recently
because of the growing Turkish economy and large funding needs of the state.Although there were several bank entries during liberalization, they mostly concen-
trated on trade and corporate financing. Thus, the excess demand for banking services
has been absorbed mostly by the existent banks, which seems to have exacerbated
the scale problems of these already large banks. More reforms such as privatization
of state enterprises, taxation reforms and an end to state subsidies that will allow the
government to end its fiscal reliance on the financial sector can augment bank per-
formance further.
As a side analysis, we also investigated the effect of the off-balance sheet activitieson the efficiency and productivity measures. We found that exclusion of off-balance
sheet items significantly deteriorated the average efficiency and productivity scores of
the entire industry. However, the extent of the bias was uneven across different bank-
ing groups. The private banks, which are more active in these types of non-tradi-
tional activities, experienced much more deterioration in their scores than the less
active public banks. This observation justifies the importance of appropriate defini-
tion of inputs and outputs in measuring bank performance.

1484 I. Isik, M.K. Hassan / Journal of Banking & Finance 27 (2003) 1455–1485
Acknowledgements
We would like to thank Ugur Meleke and Ebru Isik for their great work in col-
lecting and arranging the data. Also, our special thanks go to the two anonymous
referees as well as Iftekhar Hasan, Bruce Kirchhoff, Gulser Meric, Tulin Sener, Rob-ert Prichard, Carol Welsh, Larissa Kyj, Berth Smoluk and Maosen Zhong for their
useful comments that improved the quality of the paper substantially. However, all
errors are solely ours.
References
Akkurt, A., Hakioglu, D., Karayalcin, A., 1992. Developments in the Turkish banking sector: 1980–1990.
In: Aydogan, K., Ersel, H. (Eds.), Issues in Banking Structure and Competition in a Changing World,
Conference Proceedings. Central Bank of the Republic of Turkey, Ankara, Turkey.
Altunbas, Y., Molyneux, P., Murphy, N., 1994. Privatization, efficiency and public ownership in Turkey––
An analysis of the banking industry 1991–1993. Institute of European Finance, unpublished working
paper.
Aly, H.Y., Grabowski, R., Pasurka, C., Rangan, N., 1990. Technical, scale, and allocative efficiencies in
U.S. banking: An empirical investigation. Review of Economics and Statistics 72, 211–218.
Atiyas, I., Ersel, H., 1994. The impact of financial reform: Turkish experience. In: Caprio, G., Atiyas, I.,
Hanson, J. (Eds.), Financial Reform: Theory and Experience. Cambridge University Press, UK.
Banker, R.D., Charnes, A., Cooper, W.W., 1984. Some models for estimating technical and scale
inefficiencies in data envelopment analysis. Management Science 30, 1078–1092.
Banks in Turkey 1980–1990. Banks Association of Turkey (BAT), Istanbul, Turkey.
Bauer, P.W., Berger, A.N., Ferrier, G.D., Humphrey, D.B., 1998. Consistency conditions for regulatory
analysis of financial institutions: A comparison of frontier efficiency methods. Journal of Economics
and Business 50, 85–114.
Beim, D.O., Calomiris, C.W., 2001. Emerging Financial Markets. McGraw-Hill/Irwin, New York, NY.
Benston, G.J., 1972. Economies of scale of financial institutions. Journal of Money, Credit, and Banking
14, 435–456.
Bauer, P.W., Berger, A.N., Humphrey, D.B., 1993. Efficiency and productivity growth in U.S. banking.
In: Fried, H.O., Lovell, C.A.K., Schmidt, S.S. (Eds.), The Measurement of Productive Efficiency:
Techniques and Applications. Oxford University Press, UK, pp. 386–413.
Berg, S.A., Forsund, F.R., Jansen, E.S., 1992. Malmquist indices of productivity growth during the
deregulation of Norwegian banking, 1980–89. Scandinavian Journal of Economics 94, S211–S228.
Berger, A.N., Hunter, W.C., Timme, S.G., 1993. The efficiency of financial institutions: A review and
preview of research past, present, and future. Journal of Banking and Finance 17, 221–249.
Berger, A.N., Humphrey, D.B., 1997. Efficiency of financial institutions: International survey and
directions for future research. European Journal of Operational Research 98, 175–212.
Berger, A.N., Kashyap, A.K., Scalise, J.M., 1995. The transformation of the U.S. banking industry: What
a long, strange trip it�s been. Brooking Papers on Economic Activity 2, 55–218.Berger, A.N., Mester, L.J., 1997. Inside the black box: What explains differences in the efficiencies of
financial institutions? Journal of Banking and Finance 21, 895–947.
Bhattacharya, A., Lovell, C.A.K., Sahay, P., 1997. The impact of liberalization on the productive
efficiency of Indian commercial banks. European Journal of Operational Research 98, 332–345.
Celasun, O., April 1998. The 1994 currency crisis in Turkey. World Bank Development Research Group,
Working Paper no. 1913.
Denizer, C., November 1997. The effects of financial liberalization and new bank entry on market
structure and competition in Turkey. World Bank Development Research Group, Working Paper no.
1839.

I. Isik, M.K. Hassan / Journal of Banking & Finance 27 (2003) 1455–1485 1485
DeYoung, R., Hasan, I., Kirchhoff, B., 1998. The impact of out-of-state entry on the cost efficiencies of
local commercial banks. Journal of Economics and Business 50, 191–203.
Elyasiani, E., Mehdian, S., 1992. Productive efficiency performance of minority and nonminority-owned
banks: A nonparametric approach. Journal of Banking and Finance 16, 933–948.
Elyasiani, E., Mehdian, S., 1995. The comparative efficiency performance of small and large U.S.
commercial banks in the pre- and post-deregulation eras. Applied Economics 27, 1069–1079.
Evanoff, D.D., Israilevich, P.R., 1991. Productive efficiency in banking. Federal Reserve Bank of Chicago
Economic Perspectives, 11–32.
Fare, R., Grosskopf, S., Norris, M., Zhang, Z., 1994. Productivity growth, technical progress, and
efficiency change in industrialized countries. The American Economic Review 84, 66–83.
Farrell, M.J., 1957. The measurement of production efficiency. Journal of the Royal Statistical Society,
Series A, General 120, 253–281.
Gilbert, R.A., Wilson, P.W., 1998. Effects of deregulation on the productivity of Korean banks. Journal of
Economics and Business 50, 133–155.
Grabowski, R., Rangan, N., Rezvanian, R., 1994. The effect of deregulation on the efficiency of U.S.
banking firms. Journal of Economics and Business 46, 39–64.
Grifell-Tatje, E., Lovell, C.A.K., 1997. Deregulation and productivity decline: The case of Spanish savings
banks. European Economic Review 40, 1281–1303.
Hughes, J.P., Lang, W., Mester, L.J., Moon, C.G., 1996. Efficient banking under interstate branching.
Journal of Money, Credit, and Banking 28, 1045–1071.
Humphrey, D.B., 1993. Cost and technical change: Effects from bank deregulation. Journal of
Productivity Analysis 4, 5–34.
Humphrey, D.B., Pulley, L.B., 1997. Banks� responses to deregulation: Profits, technology, and efficiency.Journal of Money, Credit, and Banking 29, 73–93.
Hunter, W.C., Timme, S.G., 1986. Technical change, organizational form and the structure of bank
production. Journal of Money, Credit, and Banking 18, 152–166.
Isik, I., Hassan, M.K., 2002. Technical, scale and allocative efficiencies of Turkish banking industry.
Journal of Banking and Finance 26, 719–766.
Khumbakar, S.C., Lozana-Vivas, A., Lovell, C.A.K., Hasan, I., 2001. The effects of deregulation on the
performance of financial institutions: The case of Spanish savings banks. Journal of Money, Credit,
and Banking 33, 101–121.
Leightner, J.E., Lovell, C.A.K., 1998. The impact of financial liberalization on the performance of Thai
banks. Journal of Economics and Business 50, 115–131.
Lozano, A., 1995. Efficiency and technical change for Spanish banks. Applied Financial Economics 8,
289–300.
Molyneux, P., Altunbas, Y., Gardener, E., 1994. Efficiency in European Banking. John Wiley & Sons,
New York.
Resti, A., 1997. Evaluating the cost-efficiency of the Italian Banking System: What can be learned from the
joint application of parametric and non-parametric techniques? Journal of Banking and Finance 21,
221–250.
Sealey, C., Lindley, J., 1977. Inputs, outputs, and a theory of production and cost at depository financial
institutions. Journal of Finance 32, 1251–1266.
Shyu, J., 1998. Deregulation and bank operating efficiency: An empirical study of Taiwan�s banks. Journalof Emerging Markets 3 (Spring), 27–46.
Siems, T.F., Clark, J.A., 1997. Rethinking bank efficiency and regulation: How off-balance-sheet activities
make a difference. Financial Industry Studies, Federal Reserve Bank of Dallas, 1–11.
Wheelock, D.C., Wilson, P.W., 1999. Technical progress, inefficiency, and productivity change in U.S.
banking, 1984–1993. Journal of Money, Credit, and Banking 31, 212–234.
Zaim, O., 1995. The effect of financial liberalization on the efficiency of Turkish commercial banks.
Applied Financial Economics 5, 257–264.