Comparative study of different matrix/solvent systems for the analysis of crude lyophilized...
9
Comparative study of different matrix/solvent systems for the analysis of crude lyophilized microalgal preparations using matrix-assisted laser desorption/ionization time-of-flight mass spectrometry L. M. Andrade 1 * , M. A. Mendes 1 , P. Kowalski 2 and C. A. O. Nascimento 1 1 Chemical Engineering Department of Polytechnic School of University of São Paulo, Av Prof Lineu Prestes 580, Bloco 21, térreo, 05508-900 São Paulo, SP, Brazil 2 Bruker Daltonics, 40 Manning Road, Billerica, MA 01821, USA RATIONALE: Due to increases in greenhouse gas emissions, it is necessary to explore renewable sources of energy. Interesting alternatives are biofuels derived from microalgae. One challenge is the development of a detailed microalgae database compiling species identifications and characterizations that would facilitate microalgae selection for biomass production. Mass spectrometric (MS) analysis using a matrix-assisted laser desorption/ionization (MALDI) source is an advanced technique that enables advancement in this biological area. In this work a MALDI time-of-flight (TOF) MS method for the rapid identification of proteins in whole cells of selected microalgae species was studied. Furthermore, the efficiency of different matrix and solvent systems was tested. MS analyses were performed using an UltrafleXtreme MALDI-TOF mass spectrometer operating in linear positive ion mode. METHODS: Mass spectra were acquired in a mass range from 4000 to 20,000 Da with ions generated from Smartbeam laser irradiation using a frequency of 2000 Hz, a PIE 100 ns and a lens 7 kV. The voltage was 25 kV for the first ion source and 23 kV for the second. Each spectrum was generated by averaging of 10,000 laser shots and the laser irradiance was set at 95–100%. RESULTS: Similar mass spectra were obtained for all matrices (SA, HCCA, DHB and sDHB); however, the use of the sDHB matrix resulted in spectrum profiles with a greater amount number of proteins, a better signal/noise (S/N) ratio and higher intensities for the majority of microalgae analyzed. Trifluoroacetic acid (TFA) content was also studied and the best results in terms of S/N ratio, number of proteins and signal intensities were obtained with 0.1% TFA in the matrix solvent. The addition of isopropanol did not produce improvement in the quality of spectrum profiles. CONCLUSIONS: Therefore, the optimal matrix for the analysis of protein from intact microalgae cells is sDHB with TA50 as the matrix solvent and without isopropanol. These conditions allow the acquisition of high quality spectrum profiles. Copyright © 2014 John Wiley & Sons, Ltd. Climate change is associated with human activities and affects the melting of polar ice caps and global temperature. Global warming results from an increase in greenhouse gas emissions in the atmosphere, especially as a result of burning fossil fuels (including coal, oil and gas). [1] The replacement of these fossil fuels with renewable sources of energy is an important step for avoiding greenhouse effects. Among the current alternatives are biofuels derived from microalgae. [2] Microalgae can produce proteins, carbohydrates, and lipids that can be converted into petroleum-like compounds. Moreover, besides being used as energy sources themselves, microalgae can capture CO 2 . One of the main challenges in the use of microalgae as biofuels is the development of detailed databases cataloging microalgae collections and allowing rapid species identification. [3] The accurate determination of microorganism species is a challenge, and current techniques are time-consuming and expensive. Currently, several assays and analytical methods exist for the detection and determination of proteins in microorganisms, typically purified by using two-dimensional (2-D) gel electrophoresis and digestion in-gel with trypsin. Most of these methods involve several steps such as extraction, purification and separation and frequently involve complex morphological, phenotypic and molecular characteristics. These methods are time-consuming and do not provide an insight into the physiological properties of the microorganism. [4–6] Koichi Tanaka, the winner of the Nobel Prize in Chemistry in 2002, developed a method using matrix-assisted laser desorption/ionization time-of-flight mass spectrometry * Correspondence to: L. M. Andrade, Chemical Engineering Departament of Polytechnic School of University of São Paulo, Av Prof Lineu Prestes 580, Bloco 21, térreo, 05508- 900 São Paulo, SP, Brazil. E-mail: [email protected] Copyright © 2014 John Wiley & Sons, Ltd. Rapid Commun. Mass Spectrom. 2015, 29, 295–303 Research Article Received: 17 July 2014 Revised: 2 October 2014 Accepted: 30 November 2014 Published online in Wiley Online Library Rapid Commun. Mass Spectrom. 2015, 29, 295–303 (wileyonlinelibrary.com) DOI: 10.1002/rcm.7110 295
-
Upload
independent -
Category
Documents
-
view
1 -
download
0
Transcript of Comparative study of different matrix/solvent systems for the analysis of crude lyophilized...

Research Article
Received: 17 July 2014 Revised: 2 October 2014 Accepted: 30 November 2014 Published online in Wiley Online Library
Rapid Commun. Mass Spectrom. 2015, 29, 295–303
Comparative study of different matrix/solvent systems for theanalysis of crude lyophilized microalgal preparations usingmatrix-assisted laser desorption/ionization time-of-flight massspectrometry
L. M. Andrade1*, M. A. Mendes1, P. Kowalski2 and C. A. O. Nascimento1
1Chemical Engineering Department of Polytechnic School of University of São Paulo, Av Prof Lineu Prestes 580, Bloco 21,térreo, 05508-900 São Paulo, SP, Brazil2Bruker Daltonics, 40 Manning Road, Billerica, MA 01821, USA
RATIONALE: Due to increases in greenhouse gas emissions, it is necessary to explore renewable sources of energy.Interesting alternatives are biofuels derived from microalgae. One challenge is the development of a detailed microalgaedatabase compiling species identifications and characterizations that would facilitate microalgae selection for biomassproduction. Mass spectrometric (MS) analysis using a matrix-assisted laser desorption/ionization (MALDI) source isan advanced technique that enables advancement in this biological area. In this work a MALDI time-of-flight (TOF)MS method for the rapid identification of proteins in whole cells of selected microalgae species was studied.Furthermore, the efficiency of different matrix and solvent systems was tested. MS analyses were performed using anUltrafleXtreme MALDI-TOF mass spectrometer operating in linear positive ion mode.METHODS: Mass spectra were acquired in a mass range from 4000 to 20,000 Da with ions generated from Smartbeamlaser irradiation using a frequency of 2000 Hz, a PIE 100 ns and a lens 7 kV. The voltage was 25 kV for the first ion sourceand 23 kV for the second. Each spectrum was generated by averaging of 10,000 laser shots and the laser irradiance wasset at 95–100%.RESULTS: Similar mass spectra were obtained for all matrices (SA, HCCA, DHB and sDHB); however, the use of thesDHB matrix resulted in spectrum profiles with a greater amount number of proteins, a better signal/noise (S/N) ratioand higher intensities for the majority of microalgae analyzed. Trifluoroacetic acid (TFA) content was also studied andthe best results in terms of S/N ratio, number of proteins and signal intensities were obtained with 0.1% TFA in thematrix solvent. The addition of isopropanol did not produce improvement in the quality of spectrum profiles.CONCLUSIONS: Therefore, the optimal matrix for the analysis of protein from intact microalgae cells is sDHB with TA50as the matrix solvent and without isopropanol. These conditions allow the acquisition of high quality spectrum profiles.Copyright © 2014 John Wiley & Sons, Ltd.
(wileyonlinelibrary.com) DOI: 10.1002/rcm.7110
Climate change is associated with human activities andaffects the melting of polar ice caps and global temperature.Global warming results from an increase in greenhouse gasemissions in the atmosphere, especially as a result of burningfossil fuels (including coal, oil and gas).[1] The replacement ofthese fossil fuels with renewable sources of energy is animportant step for avoiding greenhouse effects. Among thecurrent alternatives are biofuels derived from microalgae.[2]
Microalgae can produce proteins, carbohydrates, and lipidsthat can be converted into petroleum-like compounds.Moreover, besides being used as energy sources themselves,microalgae can capture CO2.
* Correspondence to: L. M. Andrade, Chemical EngineeringDepartament of Polytechnic School of University of SãoPaulo, Av Prof Lineu Prestes 580, Bloco 21, térreo, 05508-900 São Paulo, SP, Brazil.E-mail: [email protected]
Rapid Commun. Mass Spectrom. 2015, 29, 295–303
2
One of the main challenges in the use of microalgaeas biofuels is the development of detailed databasescataloging microalgae collections and allowing rapidspecies identification.[3] The accurate determination ofmicroorganism species is a challenge, and currenttechniques are time-consuming and expensive.
Currently, several assays and analytical methods exist forthe detection and determination of proteins in microorganisms,typically purified by using two-dimensional (2-D) gelelectrophoresis and digestion in-gel with trypsin. Mostof these methods involve several steps such as extraction,purification and separation and frequently involve complexmorphological, phenotypic and molecular characteristics.These methods are time-consuming and do not providean insight into the physiological properties of themicroorganism.[4–6]
Koichi Tanaka, the winner of the Nobel Prize in Chemistryin 2002, developed a method using matrix-assisted laserdesorption/ionization time-of-flight mass spectrometry
Copyright © 2014 John Wiley & Sons, Ltd.
95

L. M. Andrade et al.
296
(MALDI-TOFMS) to analyze proteins from microorganisms.MALDI-TOFMS was shown to be an efficient tool for rapidlyidentifying microorganisms.[7]
Proteins from intact microorganism cells are used toproduce a unique spectrum which is compared with thestandard fingerprint from the database. Then, the identity ofthe microorganism and any available genomic informationcan be determined using its proteins fingerprint and a proteinmass fingerprint database.Among the existing commercially packaged databases are
Samaris (Shimadzu), MicrobeLynx (Waters) and BioTyper(Bruker). The latter presents a library of microorganisms,encompassing approximately 5627 fungal and bacterialspecies.[8] For microalgae, no such library currently exists forthe identification of species. Several studies have been reportedon determining the best matrices for identification ofmicroorganisms byMALDI-TOFMS. Kemptner et al. evaluateddifferent preparation techniques for surface characterization ofintact Fusarium spores by MALDI and they concluded thebest combination is ferulic acid (FA) as matrix in 0.1% oftrifluoroacetic acid/acetonitrile (TFA/ACN) (3:7 v/v) solvent.[5]
Seng et al. developed a routine identification of 1660 bacteriaisolates by MALDI-TOFMS and 95.4% were correctlyidentified at the species level, spending 6 min for each speciesand 22%–32% cost of current methods for identification,showing that this analysis may replace Gram staining andbiochemical identification in the future.[9]
Padliya et al. studied a matrix system (α-cyano-4-hydroxycinnamic acid (HCCA) and 2,5-dihydroxybenzoicacid (DHB)) with five different solvents to analyze proteindigests and they concluded that DHB is amore suitable matrixfor peptide mass fingerprinting than HCCA.[6]
Stein prepared a protocol of Bacillus cells for whole-cellMALDI-TOFMS using sinapinic acid (SA), FA, DHB andsDHB as matrix and the best results in terms of signalintensities were obtained using sDHB, which is known to beefficient for proteins above 25 kDa in terms of sensitivityand resolution.[10]
The importance of the matrix was also studied by Demeureet al. They correlated the hydrogen-donating abilities ofdifferent matrix preparations with their in-source decay(ISD) efficiency, and they concluded that the optimal ISDmatrix preparation was a mix of picolinic acid (PA) and 1,5-diaminonaphthalene (DAN).[11]
A few studies found in the literature have used thistechnique with microalgae. Murugayian et al.[7] establishedand validated a methodology for identifying the genusPrototheca by generating a library of six main protein spectrafor Prototheca species to facilitate its identification byMALDI-TOFMS. Vieler et al.[12] used MALDI-TOFMScombined with thin-layer chromatography to identify lipidsfrom Chlamydomonas reinhardtii and Cyclotella meneghiniana.The authors noted that the microalgae studied differ in lipidclass, relative contribution of individual lipids and acylcomposition. Paz et al.,[13] in work towards the rapididentification of phycotoxins in whole microalgae cells, usedMALDI-TOFMS with different matrices and solvents, andfound 10 μg/μL of DHB in 0.1% of TFA/ACN (3:7 v/v) tobe the best matrix composition for toxin detection.Protein profile identification is an important tool for species
identification, because it provides the "protein massfingerprint". The aim of this work was to develop a MALDI-
wileyonlinelibrary.com/journal/rcm Copyright © 2014 John Wi
TOFMSmethod for rapidly identifying proteins in whole cellsof selected microalgae species by testing different types ofmatrices and solvent compositions. The main objective wasto test different types of matrices and solvent compositionsto generate high-quality mass spectrum profiles to constructa library of these spectra. This method would be analternative to classical methods and would provide a rapidtool primarily for the analysis of complex microalgae fieldsamples, which pose difficulties due to morphological andtaxonomic interpretations.
EXPERIMENTAL
Chemicals and standards
The MALDI-TOFMS matrices 2,5-dihydroxybenzoic acid(DHB) and sinapinic acid (SA) were purchased from FlukaBioChemika (Germany) α-Cyano-4-hydroxycinnamic acid(HCCA) and sDHB (a mixture of DHB and 2-hydroxy-5-methoxybenzoic acid) were purchased from Bruker Daltonics(Bremen, Germany). Acetonitrile (ACN), trifluoroacetic acid(TFA) and 2-propanol (ISO) were purchased from SigmaAldrich (USA). Protein calibration standard I was obtainedfrom Bruker Daltonics. The microalgae Chlorella vulgaris (Cv)was donated by the Botanic Institute of the São Carlos FederalUniversity and the microalgae Chlorella sp. (Csp),Desmodesmussp. (Dsp) andMonoraphidium sp. (Msp) were donated by AlgaeCompany (São Paulo, Brazil).
Microalgae cultivation
Microalgae were previously adapted to growth conditions. Thisprocess was called pre-inoculum. Cultivation was performedusing an artificial medium; microalgae were cultivated at 30°Cin Erlenmeyer flasks containing 100mL ofWCmedium,[14] witha light intensity of 23–24 μmolphotons m–2 s–1 (cultivation inErlenmeyer flasks),[15] an initial pH of 6.0 and initial DO750nm =0.1 using an orbital shaker (Ethik Technologic, Brazil) rotatingat 150 rpm. After the adaptation period of 96 h, microalgae inexponential growth phase were used as inoculums.
To obtain the growth curve, 2 mL of sample was analyzedevery 2 days using a UV 2600 spectrophotometer (Shimadzu,Japan). After 12 days of growth, the microalgae suspensionwas collected and centrifuged for 5 min at 3000 rpm (Model5840 R centrifuge, Eppendorf, USA). The supernatant wasremoved, and the microalgae cell samples were driedcompletely in a liofilyser (liofilyser model Freezone 4.5,LabConco, USA).
Sample preparation for MALDI-TOFMS analysis
During the optimization of MALDI-TOFMS conditions, fourdifferent types of matrix compounds were tested in differentsolvent solutions. Details are shown in Table 1. Initially, theexternal mass calibration was performed by using proteinmixture calibration standard I in a mass range from 4 to 20kDa (insulin [M+H]+, cytochrome C [M+2H]2+, myoglobin[M+2H]2+, ubiquitin I [M+H]+, cytochrome C [M+H]+,myoglobin [M+H]+). TA50 solvent (125 μL) was added tothe protein samples (contents of tubes). Several seconds ofagitation were used to dissolve the sample, which was thenapplied to the MALDI target.
ley & Sons, Ltd. Rapid Commun. Mass Spectrom. 2015, 29, 295–303

Table 1. Different combinations of matrix compounds andsolvent solutions tested for optimizing the MALDI analysisconditions
Matrix Matrix solvent solutionSolvent
abbreviation
SA 0.1% of TFA/ACN (50:50 v/v) TA50HCCADHBsDHBsDHB 1.0% of TFA/ACN (50:50 v/v) 1TA50
2.5% of TFA/ACN (50:50 v/v) 2.5TA500.1% of TFA/ISO/ACN
(35:15:50 v/v/v)ISOTA50
Study of matrix/solvent systems for the analysis of intact microalgae
The samples were resuspended using a TA50 solvent solution(see Table 1). The dried-droplet sample preparation techniquewas used to directly spot approximately 1 μL of sample directlyonto a polished steel MALDI target (model MTP 384, BrukerDaltonics). After drying the sample, 1 μL of matrix solutionwas added and allowed to air dry at room temperature. Threespots were prepared on the MALDI target for each sample. Theanalysis were performed and the spectra obtained from eachspot were evaluated using Flex Analysis Software according tothe following parameters: signal-to-noise (S/N) threshold as 2,minimum signal intensity threshold as 600 and peak resolutionhigher than 400. Analyzing the mass spectra obtained nosignificant difference were observed.
Preparation of matrix solutions
The matrix solutions were prepared as follows: SA – sinapinicacid – (M= 225.08Da) andHCCA – α-cyano-4-hydroxycinnamicacid – (M = 189.17 Da) – These matrices were dissolved in
Figure 1. Growth curves for Chlorella vulgaris (A), Chlorsp. (D) microalgae.
Rapid Commun. Mass Spectrom. 2015, 29, 295–303 Copyright © 2014 J
TA50 to saturation at room temperature. Excess matrixwas decanted using a mini centrifuge (5 min, 10,000 g).DHB – 2,5-dihydroxybenzoic acid – (M = 154.12 Da) – Thismatrix was dissolved in TA50 at a concentration of 20 μg/mLat room temperature. sDHB – 2,5-dihydroxybenzoic acid(M = 154.12 Da) + 2-hydroxy-5-methoxybenzoic acid(M = 168.15 Da) (90:10 v/v) – This matrix was dissolved inTA50 at a concentration of 50 μg/mL at room temperature.
MALDI-TOFMS analysis
Mass spectrometric analyses were performed using anUltrafleXtreme MALDI-TOF mass spectrometer (BrukerDaltonics) operating in linear positive ion mode. Mass spectrawere acquired in amass range from 4000 to 20,000 Dawith ionsgenerated from Smartbeam™ laser irradiation using afrequency of 2000 Hz, a PIE of 100 ns, and a lens voltage of 7kV. The voltage was 25 kV for the first ion source and 23 kVfor the second. Each spectrum was generated by averaging10,000 laser shots, and the laser irradiance was set to 95–100%. Ion gating was set to 1000 Da to exclude ions below thisvalue, including matrix aggregates and other contaminants.
RESULTS
Growth curve
Microalgae growth curve experiments were performed induplicate. Each experiment lasted 12 days. Averaged growthcurves, including standard deviations for Cv, Csp, Dsp andMsp, are shown in Figs. 1(A), 1(B), 1(C) and 1(D), respectively.
Next, exponential growth phase kinetics and themaximum specific growth rates (μmax) were determinedfor each microalgae species studied. These results are
ella sp. (B), Desmodesmus sp. (C) and Monoraphidium
ohn Wiley & Sons, Ltd. wileyonlinelibrary.com/journal/rcm
297

L. M. Andrade et al.
298
shown for Cv, Csp, Dsp and Msp in Figs. 2(A), 2(B), 2(C)and 2(D), respectively. The exponential growth phase wasobserved to end approximately on the eighth day. Thiswas observed for all microalgae species studied. The μmax
values for Cv, Csp and Dsp species were determined to beapproximately around 0.29 day–1; Msp showed a μmax of0.25 day–1.
Figure 3. MALDI-TOFMS of Chlorella vulgari
Figure 2. Kinetic curves for Chlorella vulgaris (A), Chlorel(D) microalgae.
wileyonlinelibrary.com/journal/rcm Copyright © 2014 John Wi
MALDI-TOFMS analysis
To achieve the goal of developing a MALDI-TOFMS methodfor the rapid identification of proteins in whole microalgaecells, an improved sample preparation method wasinvestigated. Four of the most commonly used matrices inMALDI analysis were tested: SA, HCCA, DHB and sDHB.
s microalgae species in different matrices.
la sp. (B),Desmodesmus sp. (C) andMonoraphidium sp.
ley & Sons, Ltd. Rapid Commun. Mass Spectrom. 2015, 29, 295–303

Study of matrix/solvent systems for the analysis of intact microalgae
The first method tested involved dissolving the matrices inTA50 solvent (see Table 1), as described in the Experimentalsection. The results are shown in Figs. 3, 4, 5 and 6 (Cv, Csp,Dsp and Msp, respectively).Similar mass spectra were obtained for all tested matrices
(SA, HCCA, DHB and sDHB); however, the highestsensitivity was obtained using the DHB and sDHB matrices,corroborating the results in terms of signal intensitiesfounded by Stein using Bacillus cells.[10]
Figure 4. MALDI-TOFMS of Chlorella mi
Figure 5. MALDI-TOFMS of Desmodesmus
Rapid Commun. Mass Spectrom. 2015, 29, 295–303 Copyright © 2014 J
For example, under these conditions, MALDI-TOFMSanalysis of Csp samples showed a spectrum profile with thesignal intensity two times higher and better resolution, as shownin Table 2. In terms of ion detection, the use of the sDHB matrixresulted in a greater quantity of proteins and a better S/N ratio.This result was similar for all species of microalgae studied.
Based on these results, sDHB was determined to be the bestmatrix for analysis of microalgae. To confirm these results,three parameters were considered: number of proteins (P1),
croalgae species in different matrices.
microalgae species in different matrices.
ohn Wiley & Sons, Ltd. wileyonlinelibrary.com/journal/rcm
299

Figure 6. MALDI-TOFMS of Monoraphidium microalgae species in different matrices.
Table 2. Statistical analysis for study of comparison of matrices
Comparison of matrices
Microalgaespecies
MatrixNumber ofproteins Range of S/N Range of intensity
SumAS HCCA DHB sDHB P1 Classification P2 Classification P3 Classification
Cv + 0 0 0 52 1 4-175 4 609-10321 1 60 + 0 0 166 2 2-37 1 638-45246 3 60 0 + 0 173 3 2-42 2 619-19377 2 70 0 0 + 246 4 2-159 3 606-78600 4 11
Csp + 0 0 0 1 1 11 1 738 1 30 + 0 0 61 2 2-43 3 600-22400 2 70 0 + 0 64 3 2-30 2 603-25349 3 80 0 0 + 80 4 2-71 4 624-52428 4 12
Dsp + 0 0 0 2 1 8-10 2 647-780 1 40 + 0 0 9 2 2-10 2 623-3448 2 60 0 + 0 39 3 2-16 3 610-10191 3 90 0 0 + 84 4 2-37 4 602-36667 4 12
Msp + 0 0 0 8 1 2-60 4 602-15693 1 60 + 0 0 192 4 2-29 1 621-26262 2 70 0 + 0 186 3 2-46 2 604-30534 3 80 0 0 + 153 2 2-52 3 604-34722 4 9
L. M. Andrade et al.
300
S/N ratio (P2) and ion signal intensity (P3) for the highestintensity peak. The plus symbol (+) indicates the microalgaespecies and the matrix used for evaluation.The highest arbitrary score considered for all parameters
was 4 and the lowest score was 1. If a spectrum presentedno peaks (proteins), zero was used as a standard score. Thesum of these scores was used to classify the matrices.As observed in Table 2, the highest sumswere obtained using
the sDHB matrix for Cv, Csp and Dsp species. The HCCA andsDHBmatrices yielded similar results for only the Msp species.
wileyonlinelibrary.com/journal/rcm Copyright © 2014 John Wi
According to the results, sDHB was shown to be the bestmatrix for microalgae sample analysis. This result iscorroborated by a study performed by researchers at BrukerDaltonics.[16] In this study, severalmatrices such asDHB,HCCA,SA, sDHB, DAN, MSA (5-methoxysalicylic acid), DHAP(5-dihydroxyacetophenone) and a combination of sDHB andDAN were tested. The sDHB, DAN, DHB and MSA matriceswere found to be effective, and sDHB was found to be the mosteffective by far. Notably, sDHB and DHB commonly crystallizein a ring, which makes data collection more challenging.
ley & Sons, Ltd. Rapid Commun. Mass Spectrom. 2015, 29, 295–303

Study of matrix/solvent systems for the analysis of intact microalgae
After determining that the sDHB matrix yielded the bestresults, the next step was to study the effect of differentconcentrations of TFA on intact microalgae protein analysis.All samples were prepared with the same initial
concentration. The concentration of TFA was increased in thematrix solution to verify the influence of this parameter onmass spectrum profiles. Matrix solutions were named asfollows for simplicity: TA50 (0.1% TFA), 1TA50 (1% TFA) and2.5TA50 (2.5% TFA). The mass spectra for Cv, Csp, Dsp andMsp are shown in Figs. 7(A), 7(B), 7(C) and 7(D), respectively.
Figure 7. MALDI-TOFMS of Chlorella vulgaris (A), Chlorellamicroalgae species in different concentrations of TFA using sD
Table 3. Statistical analysis for studying the increase in TFA co
Increase in TF
Microalgaespecies
TFA content Number of proteins
0.1 1 2.5 P1 Classification P2
Cv + 0 0 63 3 2-80 + 0 51 1 2-40 0 + 57 2 2-7
Csp + 0 0 5 3 7-10 + 0 3 2 17-80 0 + 3 2 14-5
Dsp + 0 0 11 3 4-10 + 0 6 1 5-80 0 + 9 2 5-7
Msp + 0 0 30 2 5-70 + 0 40 3 3-50 0 + 28 1 5-4
Rapid Commun. Mass Spectrom. 2015, 29, 295–303 Copyright © 2014 J
Increased numbers of proteins and higher intensities ofthese peaks were obtained using TA50 as the matrix solventfor the analysis of Csp species, demonstrating that increasingthe concentration of TFA in the matrix solvent does notimprove ionization.
The results of the Cv species analysis showed that anincrease in the concentration of TFA in the matrix solventcaused a decrease in the intensity of output signals. This effectcan be observed in the intensity of the protein at m/z 4339,which has higher intensity when acquired with the TA50
sp. (B), Desmodesmus sp. (C) and Monoraphidium sp. (D)HB as matrix.
ntent in the matrix solvent
A content
Range of S/N Range of intensity
SumClassification P3 Classification
6 3 615-28143 3 93 1 618-12219 2 45 2 605-10383 1 512 3 645-10698 3 96 2 600-7509 2 69 1 600-4154 1 520 3 683-16967 3 92 2 659-10342 1 48 1 670-10584 2 56 3 605-9105 2 72 2 616-11363 1 63 1 605-6698 3 5
ohn Wiley & Sons, Ltd. wileyonlinelibrary.com/journal/rcm
301
L. M. Andrade et al.
302
matrix solvent. The use of TA50 as the matrix solvent for theMsp species also showed higher signal intensity and a greaternumber of proteins.The same procedures used to select the best matrix were
applied to determine the optimal TFA content of the matrixsolvent. In this study, the highest arbitrary value adoptedfor all parameters was 3, and the lowest was 1.For most of the microalgae species studied, the highest sum
was achieved with a TFA content of 0.1%. The results fromthe study of variation in the concentration of TFA aresummarized in Table 3.
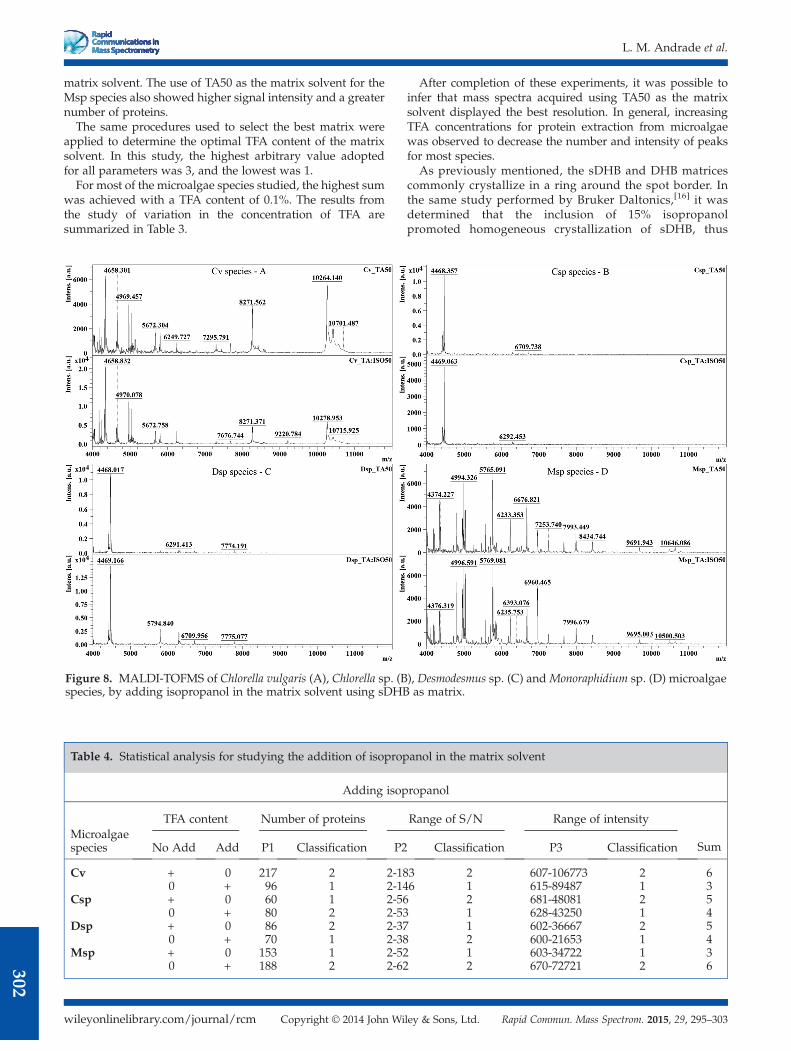
Figure 8. MALDI-TOFMS of Chlorella vulgaris (A), Chlorella sp. (Bspecies, by adding isopropanol in the matrix solvent using sDHB
Table 4. Statistical analysis for studying the addition of isoprop
Adding isop
Microalgaespecies
TFA content Number of proteins
No Add Add P1 Classification P2
Cv + 0 217 2 2-180 + 96 1 2-14
Csp + 0 60 1 2-560 + 80 2 2-53
Dsp + 0 86 2 2-370 + 70 1 2-38
Msp + 0 153 1 2-520 + 188 2 2-62
wileyonlinelibrary.com/journal/rcm Copyright © 2014 John Wi
After completion of these experiments, it was possible toinfer that mass spectra acquired using TA50 as the matrixsolvent displayed the best resolution. In general, increasingTFA concentrations for protein extraction from microalgaewas observed to decrease the number and intensity of peaksfor most species.
As previously mentioned, the sDHB and DHB matricescommonly crystallize in a ring around the spot border. Inthe same study performed by Bruker Daltonics,[16] it wasdetermined that the inclusion of 15% isopropanolpromoted homogeneous crystallization of sDHB, thus
), Desmodesmus sp. (C) and Monoraphidium sp. (D) microalgaeas matrix.
anol in the matrix solvent
ropanol
Range of S/N Range of intensity
SumClassification P3 Classification
3 2 607-106773 2 66 1 615-89487 1 3
2 681-48081 2 51 628-43250 1 41 602-36667 2 52 600-21653 1 41 603-34722 1 32 670-72721 2 6
ley & Sons, Ltd. Rapid Commun. Mass Spectrom. 2015, 29, 295–303

Study of matrix/solvent systems for the analysis of intact microalgae
improving data collection. Based on this result, theaddition of isopropanol was tested at concentration of15% in the solvent for the sDBH matrix. The results forCv, Csp, Dsp and Msp are shown in Figs. 8(A), 8(B), 8(C) and 8(D), respectively. A slight increase in peakintensities was observed for the Csp and Cv samples,and no changes were observed for Dsp and Msp samples.Once more, the procedure was used to choose the matrix
composition, and TFA content was applied to determine theeffects of isopropanol addition. In this case, the highest scorearbitrarily adopted for all parameters was 2, and the lowestscore was 1.As shown in Table 4, no differences were observed for Cv,
Csp, Dsp and Msp when isopropanol was added to thematrix solvent. In the analysis of Csp, all parametersevaluated showed better results in the absence ofisopropanol. In conclusion, the addition of isopropanolshowed no significant improvement in the parametersanalyzed in this study compared to results obtained withoutthe addition of this solvent.
CONCLUSIONS
In this study, it was observed that similar mass spectra wereobtained using all matrices (SA, HCCA, DHB and sDHB).The best compound to use as a matrix for the analysis ofprotein from intact microalgae cells is the sDHB compound.The results showed that for most of the microalgaeanalyzed, the sDHBmatrix presented spectrum profiles witha greater number of proteins of higher intensities, and betterS/N ratios.Regarding the addition of TFA, the concentration that
produced the best results in terms of S/N ratio, numberof proteins and signal intensity was 0.1% TFA. Althoughin some cases the highest concentration of TFA resultedin a slight improvement in the spectrum profile, thisimprovement does not justify the use of a larger amountof TFA.The addition of isopropanol showed no improvement in
the quality of spectrum profiles. After the analysis of all ofthe variables, it is possible to conclude that the best matrixfor the analysis of protein from intact microalgae cells issDHB with a matrix solvent containing TA50 and lackingisopropanol. These conditions promote the acquisition ofhigh-quality spectrum profiles.
REFERENCES
[1] S. Cavallaro, N.Mondello, S. Freni. Hydrogen producedfrom ethanol reforming molten carbonate fuel cell. J. PowerSources 2001, 102, 198.
[2] Y. Chisti. Biodiesel fromMicroalgae beats bioethanol. TrendsBiotechnol. 2008, 26, 126.
Rapid Commun. Mass Spectrom. 2015, 29, 295–303 Copyright © 2014 J
[3] U.S. DOE. 2010. National Algal Biofuels TechnologyRoadmap. U.S. Department of Energy, Office of EnergyEfficiency and Renewable Energy, Biomass Program.Available: http://biomass.energy.gov.
[4] K. Tae-Woon, Y. H. Kim, S. E. Kim, J. H. Lee, C. S. Park,H. Y. Kim. Identification and distribution of Baccilus speciesin Doenjang by whole-cell protein patterns and 16S rRNAgene sequence analysis. J. Microb. Biotechnol. 2010, 20, 1210.
[5] J. Kemptner, M. Marchetti-Deschamann, R. March,I. S. Druzhinina, C. P. Kubicek, G. Allmaier. Evaluation ofmatrix-assisted laser desorption/ionization (MALDI)preparation techniques for surface characterization of intactFusarium spores by MALDI linear time-of-flight massspectrometry. Rapid Commun. Mass Spectrom. 2009, 23, 877.
[6] N. D. Padliya, T. D. Wood. A strategy to improve peptidemass fingerprinting matches through the optimization ofmatrix-assisted laser desorption/ionization matrix selectionand formulation. Proteomics 2004, 4, 466.
[7] J. Murugaiyan, J. Ahrloldt, V. Kowbel, U. Roesler.Establishment of a matrix-assisted laser desorptionionization time-of flight mass spectrometry database forrapid identification of infectious achlorophyllous greenmicro-algae of the genus Prototheca. Clin. Microbiol. Infect.2012, 18, 461.
[8] A. Bizzini, C. Durussel, J. Bille, G. Greub, G. Prod’hom.Performance of matrix-assisted laser desorption/Ionizationtime-of-flight mass spectrometry for the identification ofbacterial strains routinely isolated in a clinical microbiologylaboratory. Clin. Microbiol. Infect. 2010, 48, 1549.
[9] P. Seng, M. Drancourt, F. Gouriet, B. La Scola, P. E. Fournier,J. M. Rolain, D. Raoult. Ongoing revolution in bacteriology:routine identification of bacteria by matrix-assisted laserdesorption ionization time-of-flight mass spectrometry. Clin.Infec. Infect. Dis. 2009, 49, 543.
[10] T. Stein. Whole-cell matrix-assisted laser desorption/ionization mass spectrometry for rapid identification ofbacteriocin/lantibiotic-producing bacteria. Rapid Commun.Mass Spectrom. 2008, 22, 1146.
[11] K. Demeure, L. Quinton, V. Gabelica, E. D. Pauw. Rationalselection of the optimum MALDI matrix for top-downproteomics by in-source decay. Anal. Chem. 2007, 79, 8678.
[12] A. Vieler, C. Wilhelm, R. Goss, R. Süss, J. Schiller. The lipidcomposition of the unicellular green alga Chlamydomonasreinhardtii and the diatom Cyclotella meneghinianainvestigated by MALDI-TOF MS and TLC. Chem Phys.Lipids. 2007, 150.
[13] B. Paz, P. Riobó, J. M. Franco. Preliminary study for rapiddetermination of phycotoxins in microalgae whole cellsusing matrix-assisted laser desorption/ ionization time-of-flight mass spectrometry. Rapid Commun. Mass Spectrom.2011, 25, 3627.
[14] R. A. Andersen. Algal Culturing Technique. Elsevier, SanDiego, 2005, p. 596.
[15] P. Coutteau. Microalgae, inManual on the Production and Useof Live Food for Aquaculture. Fao Fisheries Technical Paper,Rome, 1996. p. 13.
[16] J. McDaniel, A. Bullman. Optimization of MALDI-TOF-ISD(Ion-Source-Decay) for protein profile. SciX 2013: 40th
Annual Analytical Chemistry Meeting of Federation ofAnalytical Chemistry and Spectroscopy Societies,Milwaukee, WI, September 29–October 4, 2013.
ohn Wiley & Sons, Ltd. wileyonlinelibrary.com/journal/rcm
303
![Matrix floating[1]](https://static.fdokumen.com/doc/165x107/63234342078ed8e56c0ac6f9/matrix-floating1.jpg)