Cavin1; a Regulator of Lung Function and Macrophage Phenotype
Upload
independentCategory
view
4download
0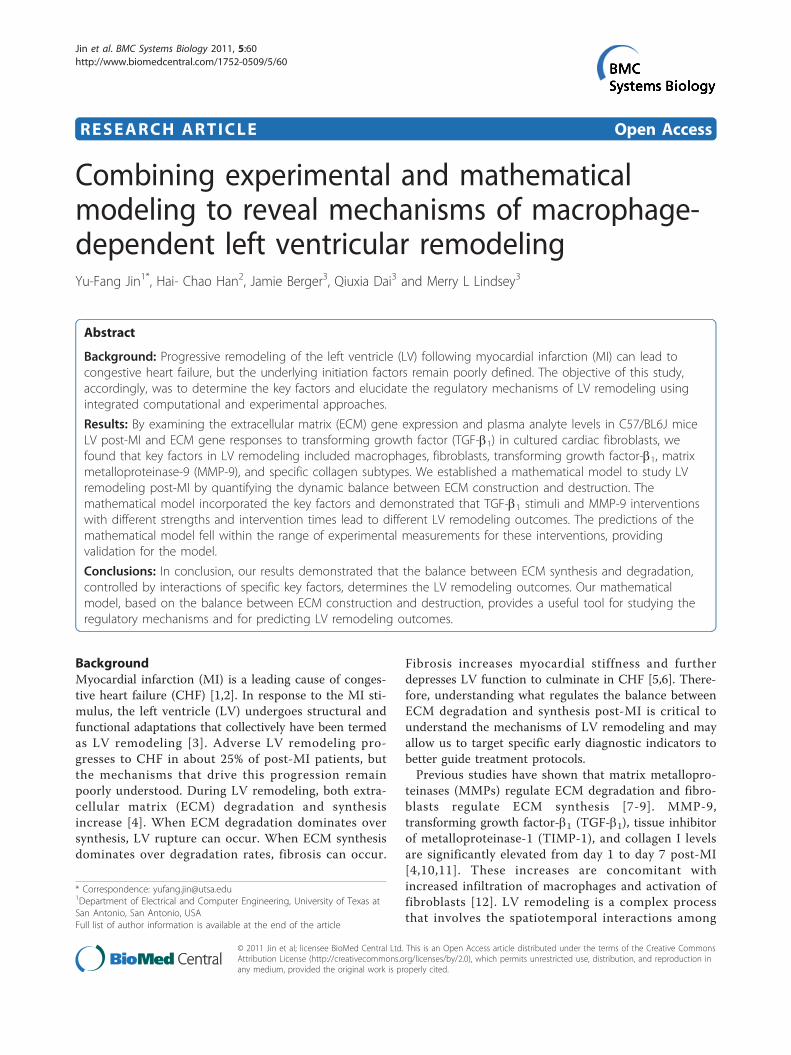
RESEARCH ARTICLE Open Access
Combining experimental and mathematicalmodeling to reveal mechanisms of macrophage-dependent left ventricular remodelingYu-Fang Jin1*, Hai- Chao Han2, Jamie Berger3, Qiuxia Dai3 and Merry L Lindsey3
Abstract
Background: Progressive remodeling of the left ventricle (LV) following myocardial infarction (MI) can lead tocongestive heart failure, but the underlying initiation factors remain poorly defined. The objective of this study,accordingly, was to determine the key factors and elucidate the regulatory mechanisms of LV remodeling usingintegrated computational and experimental approaches.
Results: By examining the extracellular matrix (ECM) gene expression and plasma analyte levels in C57/BL6J miceLV post-MI and ECM gene responses to transforming growth factor (TGF-b1) in cultured cardiac fibroblasts, wefound that key factors in LV remodeling included macrophages, fibroblasts, transforming growth factor-b1, matrixmetalloproteinase-9 (MMP-9), and specific collagen subtypes. We established a mathematical model to study LVremodeling post-MI by quantifying the dynamic balance between ECM construction and destruction. Themathematical model incorporated the key factors and demonstrated that TGF-b1 stimuli and MMP-9 interventionswith different strengths and intervention times lead to different LV remodeling outcomes. The predictions of themathematical model fell within the range of experimental measurements for these interventions, providingvalidation for the model.
Conclusions: In conclusion, our results demonstrated that the balance between ECM synthesis and degradation,controlled by interactions of specific key factors, determines the LV remodeling outcomes. Our mathematicalmodel, based on the balance between ECM construction and destruction, provides a useful tool for studying theregulatory mechanisms and for predicting LV remodeling outcomes.
BackgroundMyocardial infarction (MI) is a leading cause of conges-tive heart failure (CHF) [1,2]. In response to the MI sti-mulus, the left ventricle (LV) undergoes structural andfunctional adaptations that collectively have been termedas LV remodeling [3]. Adverse LV remodeling pro-gresses to CHF in about 25% of post-MI patients, butthe mechanisms that drive this progression remainpoorly understood. During LV remodeling, both extra-cellular matrix (ECM) degradation and synthesisincrease [4]. When ECM degradation dominates oversynthesis, LV rupture can occur. When ECM synthesisdominates over degradation rates, fibrosis can occur.
Fibrosis increases myocardial stiffness and furtherdepresses LV function to culminate in CHF [5,6]. There-fore, understanding what regulates the balance betweenECM degradation and synthesis post-MI is critical tounderstand the mechanisms of LV remodeling and mayallow us to target specific early diagnostic indicators tobetter guide treatment protocols.Previous studies have shown that matrix metallopro-
teinases (MMPs) regulate ECM degradation and fibro-blasts regulate ECM synthesis [7-9]. MMP-9,transforming growth factor-b1 (TGF-b1), tissue inhibitorof metalloproteinase-1 (TIMP-1), and collagen I levelsare significantly elevated from day 1 to day 7 post-MI[4,10,11]. These increases are concomitant withincreased infiltration of macrophages and activation offibroblasts [12]. LV remodeling is a complex processthat involves the spatiotemporal interactions among
* Correspondence: [email protected] of Electrical and Computer Engineering, University of Texas atSan Antonio, San Antonio, USAFull list of author information is available at the end of the article
Jin et al. BMC Systems Biology 2011, 5:60http://www.biomedcentral.com/1752-0509/5/60
© 2011 Jin et al; licensee BioMed Central Ltd. This is an Open Access article distributed under the terms of the Creative CommonsAttribution License (http://creativecommons.org/licenses/by/2.0), which permits unrestricted use, distribution, and reproduction inany medium, provided the original work is properly cited.
many biological components that remains poorly under-stood, in part due to the lack of complete sets of experi-mental data and computational models. Therefore, theobjectives of this study were to 1) identify candidate bio-markers of LV remodeling post-MI from ECM geneexpression and plasma analyte analyses, and 2) establisha mathematical model that incorporates experimentalresults to predict LV remodeling outcomes followingdifferent interventions. This model would provide a toolto elucidate LV regulatory mechanisms, estimate un-measurable variables, and predict outcomes followingmultiple therapeutic scenarios.
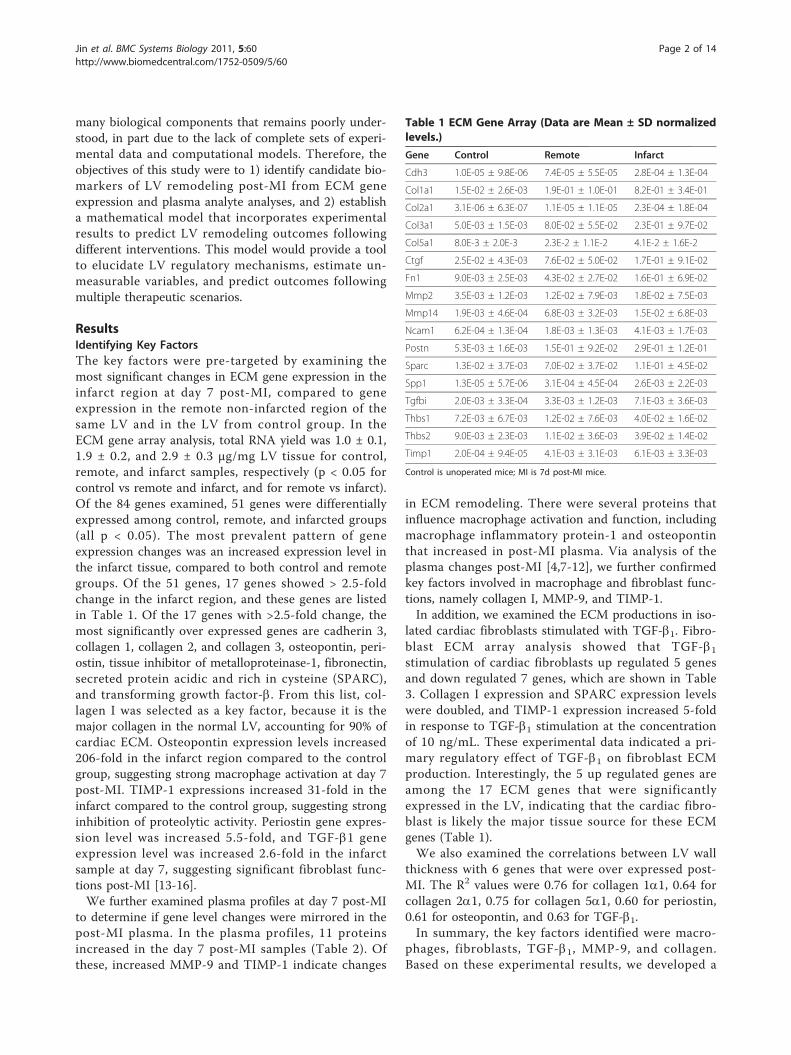
ResultsIdentifying Key FactorsThe key factors were pre-targeted by examining themost significant changes in ECM gene expression in theinfarct region at day 7 post-MI, compared to geneexpression in the remote non-infarcted region of thesame LV and in the LV from control group. In theECM gene array analysis, total RNA yield was 1.0 ± 0.1,1.9 ± 0.2, and 2.9 ± 0.3 μg/mg LV tissue for control,remote, and infarct samples, respectively (p < 0.05 forcontrol vs remote and infarct, and for remote vs infarct).Of the 84 genes examined, 51 genes were differentiallyexpressed among control, remote, and infarcted groups(all p < 0.05). The most prevalent pattern of geneexpression changes was an increased expression level inthe infarct tissue, compared to both control and remotegroups. Of the 51 genes, 17 genes showed > 2.5-foldchange in the infarct region, and these genes are listedin Table 1. Of the 17 genes with >2.5-fold change, themost significantly over expressed genes are cadherin 3,collagen 1, collagen 2, and collagen 3, osteopontin, peri-ostin, tissue inhibitor of metalloproteinase-1, fibronectin,secreted protein acidic and rich in cysteine (SPARC),and transforming growth factor-b. From this list, col-lagen I was selected as a key factor, because it is themajor collagen in the normal LV, accounting for 90% ofcardiac ECM. Osteopontin expression levels increased206-fold in the infarct region compared to the controlgroup, suggesting strong macrophage activation at day 7post-MI. TIMP-1 expressions increased 31-fold in theinfarct compared to the control group, suggesting stronginhibition of proteolytic activity. Periostin gene expres-sion level was increased 5.5-fold, and TGF-b1 geneexpression level was increased 2.6-fold in the infarctsample at day 7, suggesting significant fibroblast func-tions post-MI [13-16].We further examined plasma profiles at day 7 post-MI
to determine if gene level changes were mirrored in thepost-MI plasma. In the plasma profiles, 11 proteinsincreased in the day 7 post-MI samples (Table 2). Ofthese, increased MMP-9 and TIMP-1 indicate changes
in ECM remodeling. There were several proteins thatinfluence macrophage activation and function, includingmacrophage inflammatory protein-1 and osteopontinthat increased in post-MI plasma. Via analysis of theplasma changes post-MI [4,7-12], we further confirmedkey factors involved in macrophage and fibroblast func-tions, namely collagen I, MMP-9, and TIMP-1.In addition, we examined the ECM productions in iso-
lated cardiac fibroblasts stimulated with TGF-b1. Fibro-blast ECM array analysis showed that TGF-b1stimulation of cardiac fibroblasts up regulated 5 genesand down regulated 7 genes, which are shown in Table3. Collagen I expression and SPARC expression levelswere doubled, and TIMP-1 expression increased 5-foldin response to TGF-b1 stimulation at the concentrationof 10 ng/mL. These experimental data indicated a pri-mary regulatory effect of TGF-b1 on fibroblast ECMproduction. Interestingly, the 5 up regulated genes areamong the 17 ECM genes that were significantlyexpressed in the LV, indicating that the cardiac fibro-blast is likely the major tissue source for these ECMgenes (Table 1).We also examined the correlations between LV wall
thickness with 6 genes that were over expressed post-MI. The R2 values were 0.76 for collagen 1a1, 0.64 forcollagen 2a1, 0.75 for collagen 5a1, 0.60 for periostin,0.61 for osteopontin, and 0.63 for TGF-b1.In summary, the key factors identified were macro-
phages, fibroblasts, TGF-b1, MMP-9, and collagen.Based on these experimental results, we developed a
Table 1 ECM Gene Array (Data are Mean ± SD normalizedlevels.)
Gene Control Remote Infarct
Cdh3 1.0E-05 ± 9.8E-06 7.4E-05 ± 5.5E-05 2.8E-04 ± 1.3E-04
Col1a1 1.5E-02 ± 2.6E-03 1.9E-01 ± 1.0E-01 8.2E-01 ± 3.4E-01
Col2a1 3.1E-06 ± 6.3E-07 1.1E-05 ± 1.1E-05 2.3E-04 ± 1.8E-04
Col3a1 5.0E-03 ± 1.5E-03 8.0E-02 ± 5.5E-02 2.3E-01 ± 9.7E-02
Col5a1 8.0E-3 ± 2.0E-3 2.3E-2 ± 1.1E-2 4.1E-2 ± 1.6E-2
Ctgf 2.5E-02 ± 4.3E-03 7.6E-02 ± 5.0E-02 1.7E-01 ± 9.1E-02
Fn1 9.0E-03 ± 2.5E-03 4.3E-02 ± 2.7E-02 1.6E-01 ± 6.9E-02
Mmp2 3.5E-03 ± 1.2E-03 1.2E-02 ± 7.9E-03 1.8E-02 ± 7.5E-03
Mmp14 1.9E-03 ± 4.6E-04 6.8E-03 ± 3.2E-03 1.5E-02 ± 6.8E-03
Ncam1 6.2E-04 ± 1.3E-04 1.8E-03 ± 1.3E-03 4.1E-03 ± 1.7E-03
Postn 5.3E-03 ± 1.6E-03 1.5E-01 ± 9.2E-02 2.9E-01 ± 1.2E-01
Sparc 1.3E-02 ± 3.7E-03 7.0E-02 ± 3.7E-02 1.1E-01 ± 4.5E-02
Spp1 1.3E-05 ± 5.7E-06 3.1E-04 ± 4.5E-04 2.6E-03 ± 2.2E-03
Tgfbi 2.0E-03 ± 3.3E-04 3.3E-03 ± 1.2E-03 7.1E-03 ± 3.6E-03
Thbs1 7.2E-03 ± 6.7E-03 1.2E-02 ± 7.6E-03 4.0E-02 ± 1.6E-02
Thbs2 9.0E-03 ± 2.3E-03 1.1E-02 ± 3.6E-03 3.9E-02 ± 1.4E-02
Timp1 2.0E-04 ± 9.4E-05 4.1E-03 ± 3.1E-03 6.1E-03 ± 3.3E-03
Control is unoperated mice; MI is 7d post-MI mice.
Jin et al. BMC Systems Biology 2011, 5:60http://www.biomedcentral.com/1752-0509/5/60
Page 2 of 14

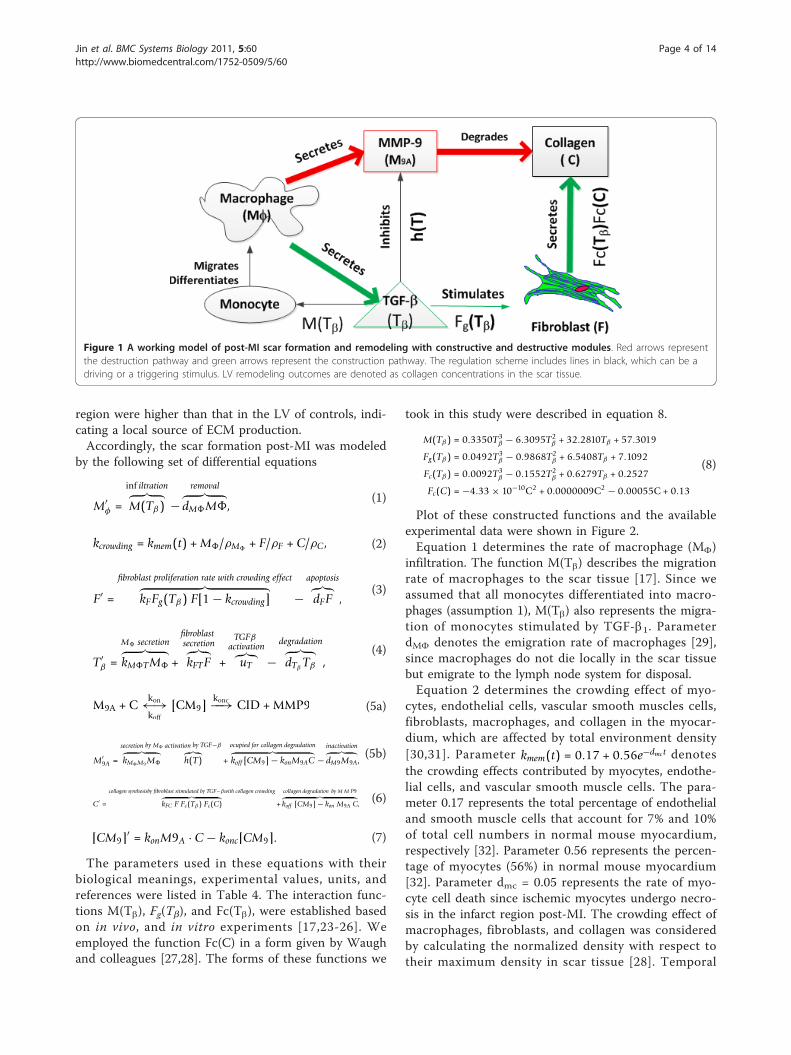
framework of the interaction loops among the identifiedkey factors (Figure 1).
Linking Experimental Results to Mathematical ModelingFrameworkIn the ECM construction pathway, collagen is secretedby fibroblasts. Growth and secretion of fibroblasts arestimulated by TGF-b1 (Table 3). In ECM destructionpathway, MMP-9 is a key factor by cleaving collagen.The major source of MMP-9 is the macrophage, whichinfiltrates into the infarct region post-MI. The majorityof macrophages in the LV post-MI are differentiatedfrom peripheral blood monocytes stimulated by che-moattractants including TGF-b1 [17]. The major sourceof TGF-b1 is the macrophage. Meanwhile, there are
interactions between the ECM construction and destruc-tion pathways: a) MMP-9 regulates ECM constructionby activating TGF-b1 which stimulates collagen synth-esis; b) TGF-b1 induces TIMP-1, which inhibits collagendegradation by blocking MMP-9 activity. Linking thesekey factors with their sources and effects allows us todevelop the mathematical model for quantitativeanalysis.
Mathematical ModelingWe established a set of nonlinear differential equationsto model the temporal interactions among the key fac-tors identified by our experimental results. The modelincorporated the following variables: macrophage celldensity (MF, cells/mm3), fibroblast cell density (F, cells/mm3), collagen concentration (C, μg/μL), TGF-b1 con-centration (Tb, pg/μL), and activated MMP-9 concentra-tion (M9A, pg/μL). Rates of cell number change weredetermined by the summation of constructive effects(migration rate or proliferation rate) and destructiveeffects (death rate or removal rate). Rates of chemicalfactors (TGF-b1, MMP-9, collagen, etc) change weredetermined by the net difference between the synthesisrate and degradation rate.Four assumptions were used based on experimental
results: 1) All monocytes that migrate to the infarctregion are differentiated to macrophages [18]; all acti-vated macrophages are differentiated from peripheralblood monocytes since previous studies have shown that<5% of macrophages undergo mitotic division [19]; 2)The major source of fibroblasts is the resident cell andthe contribution of circulating fibroblasts is ignored[20]; 3) The majority (80%) of TGF-b1 secreted at theinjured site becomes activated [21,22]; 4) ECM proteinsin the infarct region are secreted by local cells. Ourexperimental data showed that ECM gene expressionwas higher in the infarct region than the expression inthe remote region, and ECM gene levels in the remote
Table 2 Multi-analyte Profiling of Control and 7 day Post-MI Plasma
Control n = 6 7 d MI n = 7 P value
Clusterin (μg/mL) 330 ± 40 510 ± 200 0.046
Cystatin-C (ng/mL) 360 ± 20 530 ± 100 0.008
Eotaxin (pg/mL) 1500 ± 200 1900 ± 400 0.049
Fibrinogen (mg/mL) 12 ± 2 19 ± 5 0.012
Haptoglobin (μg/mL) 83 ± 30 180 ± 50 0.002
Macrophage Inflammatory Protein-1 gamma (ng/mL) 24 ± 4 33 ± 9 0.042
Matrix Metalloproteinase-9 (ng/mL) 71 ± 9 96 ± 20 0.009
Myeloperoxidase (ng/(mL) 58 ± 10 100 ± 30 0.006
Osteopontin (ng/mL) 250 ± 60 390 ± 100 0.041
Serum Amyloid Protein (μg/mL) 21 ± 3 33 ± 9 0.013
TIMP-1 (ng/mL) 0.8 ± 0.1 3.7 ± 2.0 0.002
Table 3 Fibroblast ECM array in serum free control and10 ng/ml TGF-b stimulated fibroblasts
Serum Free TGF-b p Value
ECM/Growth Factors
Col1a1 4.842 ± 1.399 9.614 ± 3.324 0.028
Col5a1 0.301 ± 0.085 0.605 ± 0.230 0.038
Fbln1 0.012 ± 0.005 0.008 ± 0.004 0.032
Sparc 2.709 ± 0.204 4.932 ± 0.379 <0.001
Tgfbi 0.022 ± 0.016 0.013 ± 0.015 0.009
Cell Adhesion Molecules
Ncam1 0.043 ± 0.016 0.169 ± 0.054 0.011
Pecam1 0.000060 ± 0.000012 0.000022 ± 0.000011 0.015
Sgce 0.187 ± 0.035 0.146 ± 0.018 0.030
Vcam1 0.301 ± 0.136 0.161 ± 0.088 0.031
MMPs/TIMPs
Mmp7 0.0000075 ± 0.0000011 0.0000056 ± 0.0000004 0.026
Timp1 0.052 ± 0.022 0.272 ± 0.136 0.035
Timp2 0.326 ± 0.109 0.188 ± 0.050 0.027
Data are Avg ± SEM levels (2-ΔCT) normalized to 5 housekeeping genes for n =4 paired fibroblast sets.
Jin et al. BMC Systems Biology 2011, 5:60http://www.biomedcentral.com/1752-0509/5/60
Page 3 of 14
region were higher than that in the LV of controls, indi-cating a local source of ECM production.Accordingly, the scar formation post-MI was modeled
by the following set of differential equations
M′φ =
inf iltration︷ ︸︸ ︷
M(Tβ) −removal
︷ ︸︸ ︷
dM�M�,(1)
kcrowding = kmem(t) + M�/ρM�+ F/ρF + C/ρC, (2)
F′ =
fibroblast proliferation rate with crowding effect︷ ︸︸ ︷
kFFg(Tβ) F[1 − kcrowding] −apoptosis︷︸︸︷
dFF ,(3)
T′β =
M� secretion︷ ︸︸ ︷
kM�TM� +
fibroblastsecretion︷︸︸︷
kFTF +
TGFβactivation︷︸︸︷
uT −degradation︷ ︸︸ ︷
dTβTβ ,
(4)
M9A + Ckon←→koff
[CM9]konc−−→ CID + MMP9 (5a)
M′9A =
secretion by M�
︷ ︸︸ ︷
kM�M9M�
activation by TGF−β︷︸︸︷
h(T) +
ocupied for collagen degradation︷ ︸︸ ︷
koff [CM9] − konM9AC −inactivation︷ ︸︸ ︷
dM9M9A,(5b)
C′ =
collagen synthesisby fibroblast sitmulated by TGF−βwith collagen crowding︷ ︸︸ ︷
kFC F Fc(Tβ) Fc(C) +
collagen degradation by M M P9︷ ︸︸ ︷
koff [CM9] − kon M9A C, (6)
[CM9]′ = konM9A · C − konc[CM9]. (7)
The parameters used in these equations with theirbiological meanings, experimental values, units, andreferences were listed in Table 4. The interaction func-tions M(Tb), Fg(Tb), and Fc(Tb), were established basedon in vivo, and in vitro experiments [17,23-26]. Weemployed the function Fc(C) in a form given by Waughand colleagues [27,28]. The forms of these functions we
took in this study were described in equation 8.
M(Tβ) = 0.3350T3β − 6.3095T2
β + 32.2810Tβ + 57.3019
Fg(Tβ) = 0.0492T3β − 0.9868T2
β + 6.5408Tβ + 7.1092
Fc(Tβ) = 0.0092T3β − 0.1552T2
β + 0.6279Tβ + 0.2527
Fc(C) = −4.33 × 10⁻¹⁰C2 + 0.0000009C2 − 0.00055C + 0.13
(8)
Plot of these constructed functions and the availableexperimental data were shown in Figure 2.Equation 1 determines the rate of macrophage (MF)
infiltration. The function M(Tb) describes the migrationrate of macrophages to the scar tissue [17]. Since weassumed that all monocytes differentiated into macro-phages (assumption 1), M(Tb) also represents the migra-tion of monocytes stimulated by TGF-b1. ParameterdMF denotes the emigration rate of macrophages [29],since macrophages do not die locally in the scar tissuebut emigrate to the lymph node system for disposal.Equation 2 determines the crowding effect of myo-
cytes, endothelial cells, vascular smooth muscles cells,fibroblasts, macrophages, and collagen in the myocar-dium, which are affected by total environment density[30,31]. Parameter kmem(t) = 0.17 + 0.56e−dmct denotesthe crowding effects contributed by myocytes, endothe-lial cells, and vascular smooth muscle cells. The para-meter 0.17 represents the total percentage of endothelialand smooth muscle cells that account for 7% and 10%of total cell numbers in normal mouse myocardium,respectively [32]. Parameter 0.56 represents the percen-tage of myocytes (56%) in normal mouse myocardium[32]. Parameter dmc = 0.05 represents the rate of myo-cyte cell death since ischemic myocytes undergo necro-sis in the infarct region post-MI. The crowding effect ofmacrophages, fibroblasts, and collagen was consideredby calculating the normalized density with respect totheir maximum density in scar tissue [28]. Temporal
Figure 1 A working model of post-MI scar formation and remodeling with constructive and destructive modules. Red arrows representthe destruction pathway and green arrows represent the construction pathway. The regulation scheme includes lines in black, which can be adriving or a triggering stimulus. LV remodeling outcomes are denoted as collagen concentrations in the scar tissue.
Jin et al. BMC Systems Biology 2011, 5:60http://www.biomedcentral.com/1752-0509/5/60
Page 4 of 14

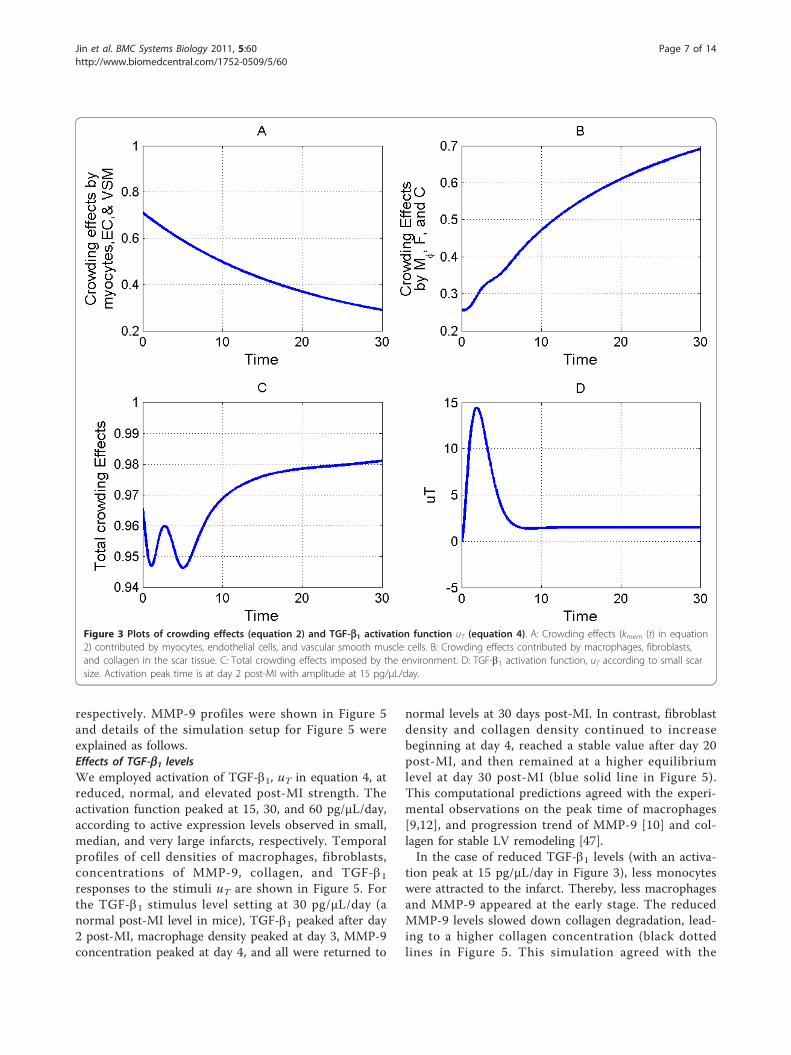
profiles of total crowding effects, crowding effects con-tributed by macrophages, fibroblasts, and collagen, andthe parameter kmem (t) were shown in Figure 3.Equation 3 determines the rate of fibroblast (F) den-
sity changes based on the assumption that majority offibroblasts come from the proliferation of resident cells(assumption 2). The function Fg(Tb) denotes the stimu-lating effects of TGF-b1 on the growth rate of fibroblasts[17]. Parameter dF represents the apoptosis rate of thefibroblast [33].Equation 4 determines the rate of TGF-b1 concentra-
tion change, wherein kFT denotes the TGF-b1 secretionrate of fibroblasts [34] and kMFT denotes the TGF-b1secretion rate of macrophages [35] since a major sourceof TGF-b1 in the scar tissue is the activated macro-phage. Parameter dTb represents the degradation rate ofTGF-b1, which can be calculated from the half life data[36].TGF-b1 gene levels demonstrated temporal progres-
sion at the early stage post-MI. Gene expression profileof TGF-b1 increased post-MI, peaked at day 2, andreturned to normal levels after day 7 in mice post-MI[37]. Since majority of TGF-b1 secreted in the infarct isactivated (Assumption 3), gene expression profile can beused as an activation pattern of TGF-b1. The function,ut denotes temporal profile of TGF-b1 activation post-MI [38-40] and works as the input in the simulation. It’sworth to mention that TGF-b1 activation levels weredifferent with respect to different scar size. A temporal
profile of ut representing small scar was shown in Fig-ure 3.Equation 5 determines the rate of activated MMP-9
concentration change. Proteolytic collagen degradationwith activated MMP-9 is described in equation 5a,where M9A, C, CM9, and CID denote activated MMP-9,collagen, binding of MMP-9 and collagen, and degradedcollagen peptide concentration, respectively. MMP-9 isinhibited primarily by TIMP-1, and TIMP-1 is inducedby TGF-b1. Thus, we established an inhibition functionh(T) = 1/(1+Tb/TbN) with TbN = 6.0 pg/μL to representthe inhibition effect.Equation 6 determines the rate of collagen concentra-
tion changes. Collagen secretion rate by fibroblasts wasdenoted by parameterKFC. Meanwhile, the function, Fc(Tb), characterizes effects of TGF-b1 on collagen secre-tion rate by fibroblasts [23,41]. Function, Fc(c), denotesthe effect of collagen density on fibroblast secretion rate[27,28].Equation 7 determines the concentration change of
CM9, based on the theoretical model for collagen degra-dation by MMPs proposed by Popel’s group [42,43].
Computational simulationsComputational simulations of scar formation (collagendeposition) were carried out by solving the nonlineardifferential equations with MATLAB. Initial conditionsof the fibroblast and macrophage densities were chosenas F(0) = 20 cells/mm3 and MF(0) = 5 cells/mm3.
Table 4 Pre-determined parameters in the mathematical model
Symbol Biological meaning Value Units Ref
dMF Macrophage removal rate**(eqn 1) 0.6 day-1 [29]
rMF maximal macrophage density (eqn 2) 2500 cells/mm3 [28]
rF maximal fibroblast density(eqn 2) 1250 cells/mm3 [28]
rC maximal collagen density (eqn 2) 3300 μg/mm3 [28]
kF Fibroblast growth rate* (eqn 3) 0.924 day-1 [62]
dF Fibroblast apoptosis rate (eqn 3) 0.12 day-1 [33]
kMFT Macrophage TGF-b production rate (eqn 4) 0.07 pg/cell/day [34]
kFT Fibroblast TGF-b production rate (eqn 4) 0.004 pg/cell/day [35]
dTb TGF-b degradation rate¥(eqn 4) 15 day-1 [36]
KM�M9 Macrophage secretion MMP9 rate (eqn 5) 3 pg/cell/day estimated
dM9 MMP-9 degradation rate(eqn 5) 0.875 day-1 [63-65]
kon Kinetic reaction speed (eqn 5) 3 × 10⁻⁴ 1/(μg/mm3)s-1 [42,66,67]
koff Kinetic reaction speed (eqn 5) 4 × 10⁻⁴ s-1 [42,66,67]
konc Kinetic reaction speed (eqn 6) 0.004 s-1 [42,66,67]
kFC Fibroblast collagen production rate (eqn 6) 20 μg/cell/day [41]
*The growth rate of cells was determined by the population doubling time (T2) via equation k = ln 2/T2 [68].
** Since macrophages emigrate from the scar tissue to lymph node system instead of dying locally in the scar tissue, the removal rate of macrophage, dMA, wasused in our model.
¥ The decaying rate of chemical factors was calculated from their half-life (T1/2) via the equation d = ln 2/T1/2 [68].
Jin et al. BMC Systems Biology 2011, 5:60http://www.biomedcentral.com/1752-0509/5/60
Page 5 of 14

Accordingly, Tb(0) = 0.21 pg/μL, M9A(0) = 7.1 pg/μL, C(0) = 839.5 μg/μL, CM9(0) = 447.6 μg/μL were calcu-lated by the equilibriums of equations 1-7 for normalLV. All the simulations shown in this study used thesame initial conditions. The initial conditions were cho-sen based on measurements in the normal LV for boththe control and MI groups (MI induced at day 0). Thesimulations covered the LV remodeling process fromday 0 to day 30 post-MI.
Model validationTo validate our mathematical model, we compared oursimulation results to experimental data from our lab orreported in the literature [9,12,44]. We normalizedmacrophage and fibroblast cell densities and MMP-9concentrations to the corresponding measurements inthe normal LV and plot the experimental data (Mean ±
SD) in Figure 4. Our computational simulation resultswere also normalized to the corresponding initial condi-tions. This normalization will give us the relative foldchanges of macrophage and fibroblast cell densities andMMP-9 concentration. The simulation results showedsimilar progression trend of cell densities and MMP-9concentration profiles, peak values, and stable values asthe experimental results (Figure 4).In addition, our simulations correctly predicted MMP-
9 responses to three TGF-b1 stimuli corresponding toreduced, normal, and elevated post-MI activationstrength. Others have reported an early increase ofMMP-9 levels of 78 ± 19 pg/μL for small infarcts and195 ± 63 pg/μL for large infarcts [45,46]. These experi-mental results agreed with the MMP-9 predictions byour mathematical model, which peak at 80 pg/μL forsmall infarcts, and 220 pg/μL for large infarcts,
Figure 2 Macrophage migration rate M(Tb) [17], fibroblast growth rate Fg(Tb) [17], and fibroblast secretion rate Fc(Tb) [23,41]plotted asfunctions of TGF-b1 concentration. The original experimental data (x, Mean ± SD) are shown for comparison. The function Fc(C) was providedby Waugh et al [27,28].
Jin et al. BMC Systems Biology 2011, 5:60http://www.biomedcentral.com/1752-0509/5/60
Page 6 of 14
respectively. MMP-9 profiles were shown in Figure 5and details of the simulation setup for Figure 5 wereexplained as follows.Effects of TGF-b1 levelsWe employed activation of TGF-b1, uT in equation 4, atreduced, normal, and elevated post-MI strength. Theactivation function peaked at 15, 30, and 60 pg/μL/day,according to active expression levels observed in small,median, and very large infarcts, respectively. Temporalprofiles of cell densities of macrophages, fibroblasts,concentrations of MMP-9, collagen, and TGF-b1responses to the stimuli uT are shown in Figure 5. Forthe TGF-b1 stimulus level setting at 30 pg/μL/day (anormal post-MI level in mice), TGF-b1 peaked after day2 post-MI, macrophage density peaked at day 3, MMP-9concentration peaked at day 4, and all were returned to
normal levels at 30 days post-MI. In contrast, fibroblastdensity and collagen density continued to increasebeginning at day 4, reached a stable value after day 20post-MI, and then remained at a higher equilibriumlevel at day 30 post-MI (blue solid line in Figure 5).This computational predictions agreed with the experi-mental observations on the peak time of macrophages[9,12], and progression trend of MMP-9 [10] and col-lagen for stable LV remodeling [47].In the case of reduced TGF-b1 levels (with an activa-
tion peak at 15 pg/μL/day in Figure 3), less monocyteswere attracted to the infarct. Thereby, less macrophagesand MMP-9 appeared at the early stage. The reducedMMP-9 levels slowed down collagen degradation, lead-ing to a higher collagen concentration (black dottedlines in Figure 5. This simulation agreed with the
Figure 3 Plots of crowding effects (equation 2) and TGF-b1 activation function uT (equation 4). A: Crowding effects (kmem (t) in equation2) contributed by myocytes, endothelial cells, and vascular smooth muscle cells. B: Crowding effects contributed by macrophages, fibroblasts,and collagen in the scar tissue. C: Total crowding effects imposed by the environment. D: TGF-b1 activation function, uT according to small scarsize. Activation peak time is at day 2 post-MI with amplitude at 15 pg/μL/day.
Jin et al. BMC Systems Biology 2011, 5:60http://www.biomedcentral.com/1752-0509/5/60
Page 7 of 14

Figure 4 The relative ratio changes of fibroblast density, macrophage density, and MMP-9 concentrations. Computational results werenormalized to initial conditions and are shown in solid lines. Previously published experimental results were normalized to the correspondingmeasurements in control group and are shown as x (Mean ± SD). All experiments were carried out in mice with MI induced by coronary arteryligation. The fibroblast and macrophage densities were collected from C57BL/6J mice [12]. MMP-9 profile was collected from 129SV mice [45,46].
Figure 5 Temporal profiles of TGF-b1, macrophages, MMP-9, fibroblasts, collagen, and collagen peptides from days 0 to 30 post-MI inresponse to low (····), median (blue line), and elevated (red dash) TGF-b1 stimuli. The initial conditions were set to F(0) = 20 cells/mm3 andMF(0) = 5 cells/mm3, Tb(0) = 0.21 pg/μL, M9A(0) = 7.1 pg/μL, C(0) = 839.5 μg/μL, CM9(0) = 447.6 μg/μL, according to measurements in normalmyocardium. The symbol ↑ indicates the peak time of TGF-b1 stimulus.
Jin et al. BMC Systems Biology 2011, 5:60http://www.biomedcentral.com/1752-0509/5/60
Page 8 of 14
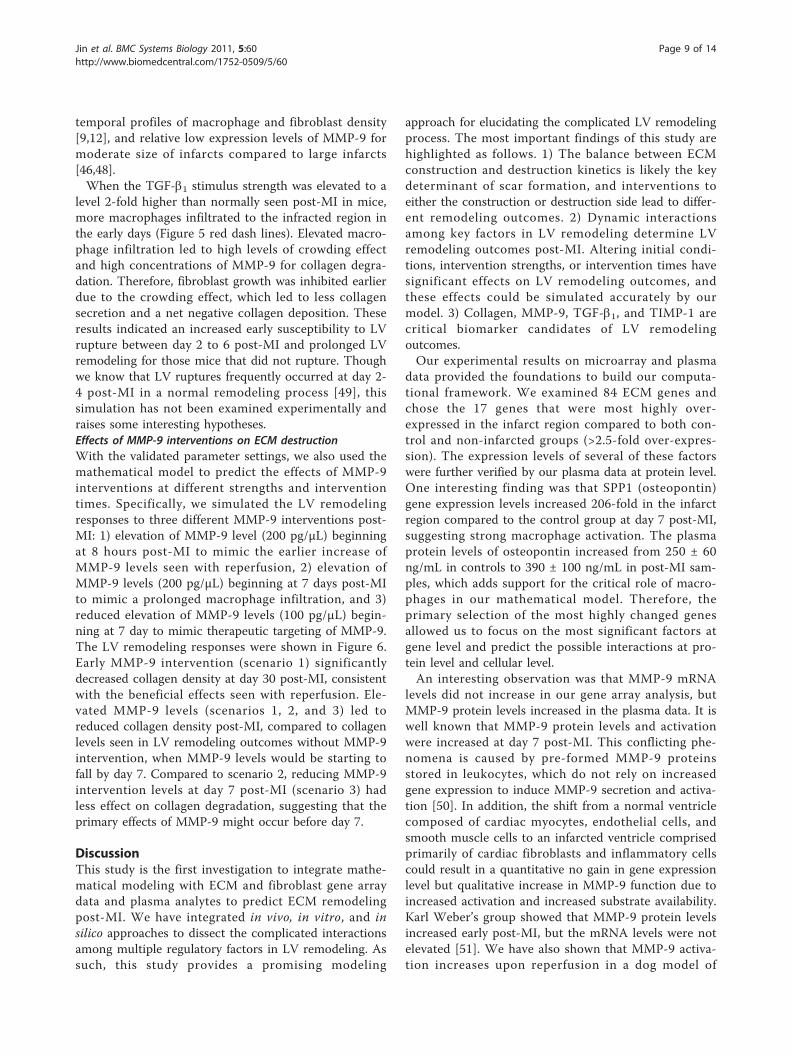
temporal profiles of macrophage and fibroblast density[9,12], and relative low expression levels of MMP-9 formoderate size of infarcts compared to large infarcts[46,48].When the TGF-b1 stimulus strength was elevated to a
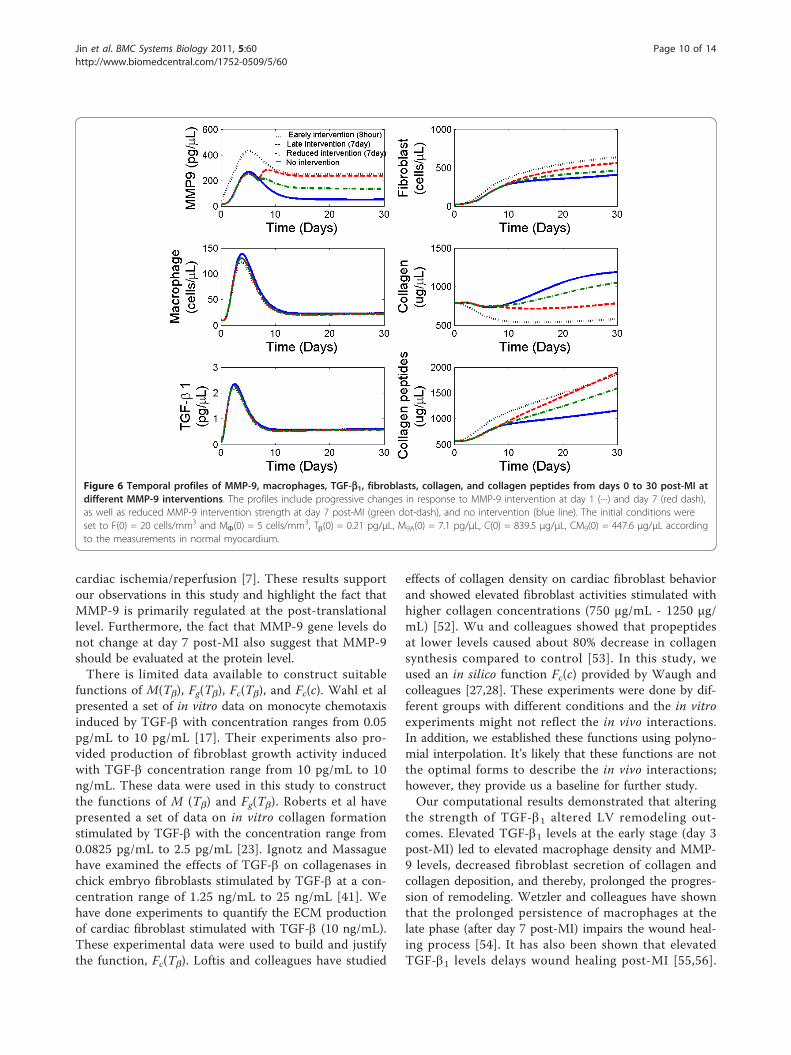
level 2-fold higher than normally seen post-MI in mice,more macrophages infiltrated to the infracted region inthe early days (Figure 5 red dash lines). Elevated macro-phage infiltration led to high levels of crowding effectand high concentrations of MMP-9 for collagen degra-dation. Therefore, fibroblast growth was inhibited earlierdue to the crowding effect, which led to less collagensecretion and a net negative collagen deposition. Theseresults indicated an increased early susceptibility to LVrupture between day 2 to 6 post-MI and prolonged LVremodeling for those mice that did not rupture. Thoughwe know that LV ruptures frequently occurred at day 2-4 post-MI in a normal remodeling process [49], thissimulation has not been examined experimentally andraises some interesting hypotheses.Effects of MMP-9 interventions on ECM destructionWith the validated parameter settings, we also used themathematical model to predict the effects of MMP-9interventions at different strengths and interventiontimes. Specifically, we simulated the LV remodelingresponses to three different MMP-9 interventions post-MI: 1) elevation of MMP-9 level (200 pg/μL) beginningat 8 hours post-MI to mimic the earlier increase ofMMP-9 levels seen with reperfusion, 2) elevation ofMMP-9 levels (200 pg/μL) beginning at 7 days post-MIto mimic a prolonged macrophage infiltration, and 3)reduced elevation of MMP-9 levels (100 pg/μL) begin-ning at 7 day to mimic therapeutic targeting of MMP-9.The LV remodeling responses were shown in Figure 6.Early MMP-9 intervention (scenario 1) significantlydecreased collagen density at day 30 post-MI, consistentwith the beneficial effects seen with reperfusion. Ele-vated MMP-9 levels (scenarios 1, 2, and 3) led toreduced collagen density post-MI, compared to collagenlevels seen in LV remodeling outcomes without MMP-9intervention, when MMP-9 levels would be starting tofall by day 7. Compared to scenario 2, reducing MMP-9intervention levels at day 7 post-MI (scenario 3) hadless effect on collagen degradation, suggesting that theprimary effects of MMP-9 might occur before day 7.
DiscussionThis study is the first investigation to integrate mathe-matical modeling with ECM and fibroblast gene arraydata and plasma analytes to predict ECM remodelingpost-MI. We have integrated in vivo, in vitro, and insilico approaches to dissect the complicated interactionsamong multiple regulatory factors in LV remodeling. Assuch, this study provides a promising modeling
approach for elucidating the complicated LV remodelingprocess. The most important findings of this study arehighlighted as follows. 1) The balance between ECMconstruction and destruction kinetics is likely the keydeterminant of scar formation, and interventions toeither the construction or destruction side lead to differ-ent remodeling outcomes. 2) Dynamic interactionsamong key factors in LV remodeling determine LVremodeling outcomes post-MI. Altering initial condi-tions, intervention strengths, or intervention times havesignificant effects on LV remodeling outcomes, andthese effects could be simulated accurately by ourmodel. 3) Collagen, MMP-9, TGF-b1, and TIMP-1 arecritical biomarker candidates of LV remodelingoutcomes.Our experimental results on microarray and plasma
data provided the foundations to build our computa-tional framework. We examined 84 ECM genes andchose the 17 genes that were most highly over-expressed in the infarct region compared to both con-trol and non-infarcted groups (>2.5-fold over-expres-sion). The expression levels of several of these factorswere further verified by our plasma data at protein level.One interesting finding was that SPP1 (osteopontin)gene expression levels increased 206-fold in the infarctregion compared to the control group at day 7 post-MI,suggesting strong macrophage activation. The plasmaprotein levels of osteopontin increased from 250 ± 60ng/mL in controls to 390 ± 100 ng/mL in post-MI sam-ples, which adds support for the critical role of macro-phages in our mathematical model. Therefore, theprimary selection of the most highly changed genesallowed us to focus on the most significant factors atgene level and predict the possible interactions at pro-tein level and cellular level.An interesting observation was that MMP-9 mRNA
levels did not increase in our gene array analysis, butMMP-9 protein levels increased in the plasma data. It iswell known that MMP-9 protein levels and activationwere increased at day 7 post-MI. This conflicting phe-nomena is caused by pre-formed MMP-9 proteinsstored in leukocytes, which do not rely on increasedgene expression to induce MMP-9 secretion and activa-tion [50]. In addition, the shift from a normal ventriclecomposed of cardiac myocytes, endothelial cells, andsmooth muscle cells to an infarcted ventricle comprisedprimarily of cardiac fibroblasts and inflammatory cellscould result in a quantitative no gain in gene expressionlevel but qualitative increase in MMP-9 function due toincreased activation and increased substrate availability.Karl Weber’s group showed that MMP-9 protein levelsincreased early post-MI, but the mRNA levels were notelevated [51]. We have also shown that MMP-9 activa-tion increases upon reperfusion in a dog model of
Jin et al. BMC Systems Biology 2011, 5:60http://www.biomedcentral.com/1752-0509/5/60
Page 9 of 14
cardiac ischemia/reperfusion [7]. These results supportour observations in this study and highlight the fact thatMMP-9 is primarily regulated at the post-translationallevel. Furthermore, the fact that MMP-9 gene levels donot change at day 7 post-MI also suggest that MMP-9should be evaluated at the protein level.There is limited data available to construct suitable
functions of M(Tb), Fg(Tb), Fc(Tb), and Fc(c). Wahl et alpresented a set of in vitro data on monocyte chemotaxisinduced by TGF-b with concentration ranges from 0.05pg/mL to 10 pg/mL [17]. Their experiments also pro-vided production of fibroblast growth activity inducedwith TGF-b concentration range from 10 pg/mL to 10ng/mL. These data were used in this study to constructthe functions of M (Tb) and Fg(Tb). Roberts et al havepresented a set of data on in vitro collagen formationstimulated by TGF-b with the concentration range from0.0825 pg/mL to 2.5 pg/mL [23]. Ignotz and Massaguehave examined the effects of TGF-b on collagenases inchick embryo fibroblasts stimulated by TGF-b at a con-centration range of 1.25 ng/mL to 25 ng/mL [41]. Wehave done experiments to quantify the ECM productionof cardiac fibroblast stimulated with TGF-b (10 ng/mL).These experimental data were used to build and justifythe function, Fc(Tb). Loftis and colleagues have studied
effects of collagen density on cardiac fibroblast behaviorand showed elevated fibroblast activities stimulated withhigher collagen concentrations (750 μg/mL - 1250 μg/mL) [52]. Wu and colleagues showed that propeptidesat lower levels caused about 80% decrease in collagensynthesis compared to control [53]. In this study, weused an in silico function Fc(c) provided by Waugh andcolleagues [27,28]. These experiments were done by dif-ferent groups with different conditions and the in vitroexperiments might not reflect the in vivo interactions.In addition, we established these functions using polyno-mial interpolation. It’s likely that these functions are notthe optimal forms to describe the in vivo interactions;however, they provide us a baseline for further study.Our computational results demonstrated that altering
the strength of TGF-b1 altered LV remodeling out-comes. Elevated TGF-b1 levels at the early stage (day 3post-MI) led to elevated macrophage density and MMP-9 levels, decreased fibroblast secretion of collagen andcollagen deposition, and thereby, prolonged the progres-sion of remodeling. Wetzler and colleagues have shownthat the prolonged persistence of macrophages at thelate phase (after day 7 post-MI) impairs the wound heal-ing process [54]. It has also been shown that elevatedTGF-b1 levels delays wound healing post-MI [55,56].
Figure 6 Temporal profiles of MMP-9, macrophages, TGF-b1, fibroblasts, collagen, and collagen peptides from days 0 to 30 post-MI atdifferent MMP-9 interventions. The profiles include progressive changes in response to MMP-9 intervention at day 1 (····) and day 7 (red dash),as well as reduced MMP-9 intervention strength at day 7 post-MI (green dot-dash), and no intervention (blue line). The initial conditions wereset to F(0) = 20 cells/mm3 and MF(0) = 5 cells/mm3, Tb(0) = 0.21 pg/μL, M9A(0) = 7.1 pg/μL, C(0) = 839.5 μg/μL, CM9(0) = 447.6 μg/μL accordingto the measurements in normal myocardium.
Jin et al. BMC Systems Biology 2011, 5:60http://www.biomedcentral.com/1752-0509/5/60
Page 10 of 14

Our simulation results are in agreement with these pre-viously published studies.Simulations of different TGF-b1 strengths also shed
light on the regulation scheme of ECM constructionand destruction. For ECM construction regulation,active TGF-b1 stimulated fibroblast proliferation andcollagen secretion, which increased the crowdingeffect. The increased crowding coefficient rampeddown fibroblast proliferation and TGF-b1 secretion(negative feedback), which slowed down the stimulusfor monocytes to migrate into the infarct region. Thedecrease of monocytes number led to less macrophageinfiltration, which then reduced the crowding coeffi-cient. Meanwhile, reduced macrophages lead to lessTGF-b1 secretion by macrophage, which further slo-wed down collagen synthesis. For collagen destructionregulation, TGF-b1 induced macrophage infiltration,which lead to elevated MMP-9 secretion, elevated col-lagen degradation, and thereby reduced crowding coef-ficients. Smaller crowding coefficients lead to elevatedfibroblast proliferation and collagen secretion. Notably,there are two types of negative feedback schemes inthe mathematical model: degradation (apoptosis oremigration) rates associated with proteins (cells) andthe crowding effects. Degradation rates are constantsand determine how fast the proteins (cells) canrespond to stimuli. Crowding effects are time varyingimpacts imposed by the environment. Through theseregulation schemes, a dynamic balance of collagenconstruction and destruction can be maintained togenerate a stable scar. Furthermore, profiles of crowd-ing effects elucidated the transition from the normalLV to scar tissue with respect to cell types and col-lagen concentrations (Figure 3).It is worth mentioning that there exist biological nega-
tive feedbacks in our mathematical model. For macro-phage density regulation, there was a positive feedbackloop containing macrophage and TGF-b1: TGF-b1 sti-mulated monocytes migration, leading to macrophageinfiltration; macrophages secreted TGF-b1 which mightattract more macrophages to the infarct site. Weobserved elevated macrophage density and MMP-9 con-centrations corresponding to increased TGF-b1 levels(Figure 5). This positive feedback loop was inhibited byemigration of macrophages and degradation of TGF-b1.In addition, Wahl et al pointed out that the monocytechemotactic activity increased in response to low con-centrations of TGF-b1 stimuli, while the chemotacticactivity decreased in response to higher concentrationsof TGF-b1 [17]. Therefore, as TGF-b1 levels continu-ously increased, infiltration speed of macrophagesdecreased as shown in figure 2 (M(Tb)), suggesting asecondary biological inhibition scheme of the TGF-b1 –macrophage positive feedback loop.
There are a few limitations of the mathematical modelthat resulted to a large degree from the model assump-tions. More research is needed to address these limita-tions and further enhance the models. First, our modelcalls for accurate determination of MMP-9 activationand inhibition functions. Complete time-course mea-surements of TIMP-1 and the other three TIMPs (forMMP-9 inhibition) and MMP-3 (for MMP-9 activation)would provide additional details on the regulators ofMMP-9 function. Second, the large differences betweensimulation results and experimental measurement ofMMP-9 concentrations before day 4 post-MI in Figure4 is likely due to the effect of neutrophils, an earlysource of MMP-9, indicating the need to investigate therole of neutrophils in the early stage (days 1-5) post-MI[7]. This inconsistency of the simulated MMP-9 concen-trations and measurements from experimental results isone of the approaches for us to employ more biomar-kers and key factors in model development. Third,Interleukin IL-1, IL-6, IL-10, and tumor necrosis factor-a profiles need to be included to better study macro-phage activation phenotypes [57]. Fourth, the effects ofother chemoattractants on monocyte migration on theLV remodeling need further investigation. The predictedfibroblast density at days 14-30 post-MI was lower thanexperimental measurements. This might be caused byassumption 2, that the increase of fibroblast numberspost-MI was contributed solely by proliferation of localcells. We will investigate the migration rates of fibro-blasts in the future to refine our mathematical model.Regardless of the above limitations, we were able to useour model to compute the progression of macrophages,fibroblasts, and collagen density, MMP-9 and TGF-b1concentrations post-MI.This systems biology study for LV remodeling can be
expanded to include proteomics and cardiac functionsin future studies. We employed plasma data in thisstudy since plasma proteins reflect the process of LVremodeling and plasma data are more directly translata-ble to the clinic. However, we are well aware that mea-suring tissue protein levels will provide a more directevaluation of LV remodeling. Further investigation onthe ECM proteomics in cardiac samples has beenplanned in our future research to establish a more com-plete mathematical model for LV remodeling. Though itis beyond the scope of the current paper, we have pre-viously reported some data on cardiac function [58-60]and our future study will integrate cardiac function intothe mathematical model.The computational model for post-MI LV remodeling
developed here illustrated the dynamic interactionsamong critical factors in LV remodeling. This is the firstmathematical model focusing on the protein and cellularinteractions post-MI. Thus, this model provides a strong
Jin et al. BMC Systems Biology 2011, 5:60http://www.biomedcentral.com/1752-0509/5/60
Page 11 of 14
foundation for future studies to build a more compre-hensive model that takes into account a more completeset of parameters. The model also provides a tool toguide experimental designs by identifying candidate fac-tors to intervene, the proper intervention time, anddoses for effective interventions to achieve the mostbeneficial outcomes. As an example, we have shown theeffects of MMP-9 intervention time and doses on LVremodeling outcomes in this study. Though this modelwas established based on in vitro data and in vivo datafrom mice, the modeling approach can be used todevelop models for other scenarios such as the LVremodeling of human MI and LV remodeling underreperfusion conditions.
ConclusionsIn conclusion, we developed a set of differential equa-tions to quantitatively model the dynamic interactionsand temporal changes of the key components identifiedfrom our experimental results. Predictions of the mathe-matical model fell well within experimental measure-ments, particularly with regard to macrophageinfiltration and matrix remodeling. This mathematicalmodel provides a powerful tool to better understandhow the dynamic balance between ECM constructionand ECM destruction influences LV remodelingoutcomes.
MethodsMiceAll animal procedures were conducted in accordancewith the Guide for the Care and Use of Laboratory Ani-mals (National Research Council, 1996) and wereapproved by the Institutional Animal Care and UseCommittee at the University of Texas Health ScienceCenter at San Antonio. Male C57BL/6J wild type adultmice (n = 13) at age 8.0 ± 0.5 months were used. Onegroup (n = 6) served as unoperated controls, while theother group (n = 7) underwent coronary artery ligationfor 7 days as described previously [9] and were sacri-ficed at day 7 post-myocardial infarction.
In Vivo ProceduresBlood was collected from the jugular vein and placed ina heparinized tube for plasma collection. Tissue was col-lected for the gene array analysis as described previously[9].
Microarray and Plasma AnalysisTotal RNA was isolated using the TRIzol plus TotalRNA purification kit (Invitrogen). The RT2 qPCR Pri-mer Array for Extracellular Matrix and Adhesion Mole-cules (SuperArray catalog APMM-013A) was used forthe gene array. Results were analyzed based on the
ΔΔCt method with normalization of raw data to theGAPDH housekeeper gene. Data are presented as aver-age 2-ΔCT levels.For the fibroblast ECM microarray analysis, cardiac
fibroblasts were isolated from adult C57BL/6J mice andstimulated with or without 10 ng/ml TGF-b1 for 24hours[61]. Plasma samples (80 μL) were analyzed for 67antigens using the quantitative immunoassay panel formice provided by Rules Based Medicine in Austin, TX(http://www.rulesbasedmedicine.com).
Statistical AnalysisControl, remote, and infarct LV groups were analyzedby ANOVA, with the Bonferroni post hoc test. Controland MI plasma was analyzed by Students t-test. Unsti-mulated and TGF-b1 stimulated fibroblast groups wereanalyzed by paired t-test. A p < 0.05 was considered sta-tistically significant.
AcknowledgementsThe authors acknowledge grants support from NIH 1R03EB009496, NIHSC2HL101430, NSF 0649172, and AT&T foundation (to YFJ), from NSF0644646, and NSF 0602834 (to HCH), and NHLBI HHSN268201000036C (N01-HV-00244), NIH R01 HL75360, AHA Grant-in-Aid 0855119F, and the MorrisonFund (to MLL).
Author details1Department of Electrical and Computer Engineering, University of Texas atSan Antonio, San Antonio, USA. 2Department of Mechanical Engineering,University of Texas at San Antonio, USA. 3Department of Medicine, Universityof Texas Health Science Center at San Antonio, San Antonio, USA.
Authors’ contributionsYFJ, HCH, and MLL designed the research; JB, and QD performed animalexperiments. YFJ performed the computational experiments. YFJ, HCH, andMLL analyzed the results and wrote the manuscript. All authors have readand approved the final manuscript.
Received: 19 March 2010 Accepted: 5 May 2011 Published: 5 May 2011
References1. Hellermann JP, Jacobsen SJ, Redfield MM, Reeder GS, Weston SA, Roger VL:
Heart failure after myocardial infarction: clinical presentation andsurvival. Eur J Heart Fail 2005, 7:119-125.
2. Anavekar NS, McMurray JJV, Velazquez EJ, Solomon SD, Kober L, Rouleau JL,White HD, Nordlander R, Maggioni A, Dickstein K, et al: Relation betweenRenal Dysfunction and Cardiovascular Outcomes after MyocardialInfarction. N Engl J Med 2004, 351:1285-1295.
3. Cohn JN, Ferrari R, Sharpe N: Cardiac remodeling–concepts and clinicalimplications: a consensus paper from an international forum on cardiacremodeling. Behalf of an International Forum on Cardiac Remodeling. JAm Coll Cardiol 2000, 35:569-582.
4. Whittaker P: Collagen and ventricular remodeling after acute myocardialinfarction: concepts and hypotheses. Basic Res Cardiol 1997, 92:79-81.
5. Zhang M, Shah MA: Role of reactive oxygen species in myocardialremodeling. Current Heart Failure Reports 2007, 4:26-30.
6. Rumberger JA: Ventricular Dilatation and Remodeling After MyocardialInfarction. Mayo Clin Proc 1994, 69:664-674.
7. Lindsey M, Wedin K, Brown MD, Keller C, Evans AJ, Smolen J, Burns AR,Rossen RD, Michael L, Entman M: Matrix-Dependent Mechanism ofNeutrophil-Mediated Release and Activation of Matrix Metalloproteinase9 in Myocardial Ischemia/Reperfusion. Circulation 2001, 103:2181-2187.
8. Rohde LE, Ducharme A, Arroyo LH, Aikawa M, Sukhova GH, Lopez-Anaya A,McClure KF, Mitchell PG, Libby P, Lee RT: Matrix metalloproteinase
Jin et al. BMC Systems Biology 2011, 5:60http://www.biomedcentral.com/1752-0509/5/60
Page 12 of 14

inhibition attenuates early left ventricular enlargement afterexperimental myocardial infarction in mice. Circulation 1999,15:3063-3070.
9. Lindsey ML, Escobar GP, Dobrucki LW, Goshorn DK, Bouges S, Mingoia JT,McClister DM Jr, Su H, Gannon J, MacGillivray C, et al: Matrixmetalloproteinase-9 gene deletion facilitates angiogenesis aftermyocardial infarction. Am J Physiol Heart Circ Physiol 2006, 290:H232-239.
10. Webb CS, Bonnema DD, Ahmed SH, Leonardi AH, McClure CD, Clark LL,Stroud RE, Corn WC, Finklea L, Zile MR, Spinale FG: Specific TemporalProfile of Matrix Metalloproteinase Release Occurs in Patients AfterMyocardial Infarction: Relation to Left Ventricular Remodeling. Circulation2006, 114:1020-1027.
11. Vanhoutte D, Schellings M, Pinto Y, Heymans S: Relevance of matrixmetalloproteinases and their inhibitors after myocardial infarction: Atemporal and spatial window. Cardiovasc Res 2006, 69:604-613.
12. Yang F, Liu YH, Yang XP, Xu J, Kapke A, Carretero OA: Myocardialinfarction and cardiac remodelling in mice. Exp Physiol 2002, 87:547-555.
13. N Ashizawa KG, Do YS, Nunohiro T, Giachelli CM, Meehan WP, Tuan TL,Hsueh WA: Osteopontin is produced by rat cardiac fibroblasts andmediates A(II)-induced DNA synthesis and collagen gel contraction. JClin Invest 1996, 98:2218-2227.
14. Lenga Y, Koh A, Perera AS, McCulloch CA, Sodek J, Zohar R: OsteopontinExpression Is Required for Myofibroblast Differentiation. Circ Res 2008,102:319-327.
15. Zahradka P: Novel Role for Osteopontin in Cardiac Fibrosis. Circ Res 2008,102:270-272.
16. Borg TK, Markwald R: Periostin: More Than Just an Adhesion Molecule.Circ Res 2007, 101:230-231.
17. Wahl SM, Hunt DA, Wakefield LM, McCartney-Francis N, Wahl LM,Roberts AB, Sporn MB: Transforming growth factor type beta inducesmonocyte chemotaxis and growth factor production. Proceedings of theNational Academy of Sciences of the United States of America 1987,84:5788-5792.
18. Krause SW, Rehli M, Kreutz M, Schwarzfischer L, Paulauskis JD, Andreesen R:Differential screening identifies genetic markers of monocyte tomacrophage maturation. J Leuko Biol 1996, 60:510-545.
19. Burke B LC: The Macrophage. 2 edition. Oxford: Oxford University Press;2002.
20. Quan TE, Cowper S, Wu SP, Bockenstedt LK, Bucala R: Circulatingfibrocytes: collagen-secreting cells of the peripheral blood. TheInternational Journal of Biochemistry & Cell Biology 2004, 36:598-606.
21. Yehualaeshet T, O’Connor R, Green-Johnson J, Mai S, Silverstein Roy,Murphy-Ullrich JE, Khalil N: Activation of Rat Alveolar Macrophage-Derived Latent Transforming Growth Factor β-1 by Plasmin RequiresInteraction with Thrombospondin-1 and its Cell Surface Receptor, CD36.Am J Pathol 1999, 155:841-851.
22. Khalil N, Whitman C, Zuo L, Danielpour D, Greenberg A: Regulation ofalveolar macrophage transforming growth factor-beta secretion bycorticosteroids in bleomycin-induced pulmonary inflammation in the rat.JClin Invest 1993, 92:1812-1818.
23. Roberts AB, Sporn MB, Assoian RK, Smith JM, Roche NS, Wakefield LM,Heine UI, Liotta LA, Falanga V, Kehrl JH: Transforming growth factor typebeta: rapid induction of fibrosis and angiogenesis in vivo andstimulation of collagen formation in vitro. Proceedings of the NationalAcademy of Sciences of the United States of America 1986, 83:4167-4171.
24. Ignotz RA, Massagué J: Transforming growth factor-beta stimulates theexpression of fibronectin and collagen and their incorporation into theextracellular matrix. Journal of Biological Chemistry 1986, 261:4337-4345.
25. Leroy EC: Increased Collagen Synthesis by Scleroderma Skin FibroblastsIn Vitro: a possibledefect in the regulation or activation of thescleroderma fibroblast. J Clin Invest 1974, 54:880-889.
26. Naugle JE OE, Zhang X, Mase SE, Pilati CF, Maron MB, Folkesson HG,Horne WI, Doane KJ, Meszaros JG: Type VI collagen induces cardiacmyofibroblast differentiation: implications for postinfarction remodeling.Am J Physiol Heart Circ Physiol 2006, 290:H323-330.
27. Waugh H, Sherratt J: Macrophage Dynamics in Diabetic Wound Dealing.Bulletin of Mathematical Biology 2006, 68:197-207.
28. Helen V, Waugh JAS: Modeling the effects of treating diabetic woundswith engineered skin substitutes. Wound Repair and Regeneration 2007,15:556-565.
29. Bellingan GJ, Caldwell H, Howie SE, Dransfield I, Haslett C: In vivo fate ofthe inflammatory macrophage during the resolution of inflammation:inflammatory macrophages do not die locally, but emigrate to thedraining lymph nodes. J Immunol 1996, 157:2577-2585.
30. Olsen L, Sherratt JA, Maini PK: A mathematical model for fibro-proliferative wound healing disorders. Bull Math Biol 1996, 58:787-808.
31. Munoz-Alicea RN-MP, Marcano-Velazquez M: A mathematical model formacrophage, T-cell and mycobacterium tuberculosis interactions. Book Amathematical model for macrophage, T-cell and mycobacterium tuberculosisinteractions City: University of Puerto Rico; 1999, Editor ed.^eds.
32. Banerjee I, Fuseler JW, Price RL, Borg TK, Baudino TA: Determination of celltypes and numbers during cardiac development in the neonatal andadult rat and mouse. Am J Physiol Heart Circ Physiol 2007, 293:H1883-1891.
33. Darby IA, Bisucci T, Hewitson TD, MacLellan DG: Apoptosis is increased ina model of diabetes-impaired wound healing in genetically diabeticmice. The International Journal of Biochemistry & Cell Biology 1997,29:191-200.
34. Huang M, Sharma S, Zhu L, Keane M, Luo J, Zhang L, Burdick M, Lin Y,Dohadwala M, Gardner B, et al: IL-7 inhibits fibroblast TGF-betaproduction and signaling in pulmonary fibrosis. J Clin Invest 2002,109:931-937.
35. Cobbold CA, Sherratt JA: Mathematical Modelling of Nitric Oxide Activityin Wound Healing can explain Keloid and Hypertrophic Scarring. Journalof Theoretical Biology 2000, 204:257-288.
36. Zhang H, Ahmad M, Gronowicz G: Effects of transforming growth factor-beta 1 (TGF-[beta]1) on in vitro mineralization of human osteoblasts onimplant materials. Biomaterials 2003, 24:2013-2020.
37. Vandervelde S, van Luyn MJA, Rozenbaum MH, Petersen AH, Tio RA,Harmsen MC: Stem cell-related cardiac gene expression early aftermurine myocardial infarction. Cardiovasc Res 2007, 73:783-793.
38. Sun Y, Weber KT: Cardiac remodeling by fibrous tissue: role of localfactors and circulating hormones. Ann Med 1998, 30:3-8.
39. Czarkowska-P¸czek B, Przybylski J, Marciniak A, Pawłowska M, Juskowa J,Foroncewicz B, Mucha K: Proteolytic Enzymes Activities in Patients AfterMyocardial Infarction Correlate with Serum Concentration of TGF-β.Inflammation 2004, 28:279-284.
40. Schaan B, Quadros A, Sarmento-Leite R, De Lucca G, Bender A, Bertoluci M:’Correction:’ Serum transforming growth factor beta-1 (TGF-beta-1)levels in diabetic patients are not associated with pre-existent coronaryartery disease. Cardiovascular Diabetology 2007, 6:19.
41. Ignotz R, Massague J: Transforming growth factor-beta stimulates theexpression of fibronectin and collagen and their incorporation into theextracellular matrix. J Biol Chem 1986, 261:4337-4345.
42. Karagiannis ED, Popel AS: A Theoretical Model of Type I CollagenProteolysis by Matrix Metalloproteinase (MMP) 2 and Membrane Type 1MMP in the Presence of Tissue Inhibitor of Metalloproteinase 2. J BiolChem 2004, 279:39105-39114.
43. Vempati P, Karagiannis ED, Popel AS: A Biochemical Model of MatrixMetalloproteinase 9 Activation and Inhibition. J Biol Chem 2007,282:37585-37596.
44. Fang L, Gao XM, Moore XL, Kiriazis H, Su Y, Ming Z, Lim YL, Dart AM, Du XJ:Differences in inflammation, MMP activation and collagen damageaccount for gender difference in murine cardiac rupture followingmyocardial infarction. Journal of Molecular and Cellular Cardiology 2007,43:535-544.
45. Kelly D, Cockerill G, Ng LL, Thompson M, Khan S, Samani NJ, Squire IB:Plasma matrix metalloproteinase-9 and left ventricular remodelling afteracute myocardial infarction in man: a prospective cohort study. Eur HeartJ 2007, 28:711-718.
46. Kaden JJ, Dempfle CE, Sueselbeck T, Brueckmann M, Poerner TC, Haghi D,Haase KK, Borggrefe M: Time-Dependent Changes in the PlasmaConcentration of Matrix Metalloproteinase 9 after Acute MyocardialInfarction. Cardiology 2003, 99:140-144.
47. Sumitra M, Manikandan P, Nayeem M, Manohar BM, Lokanadam B,Vairamuthu S, Subramaniam S, Puvanakrishnan R: Time course studies onthe initiation of complement activation in acute myocardial infarctioninduced by coronary artery ligation in rats. Molecular and cellularbiochemistry 2005, 268:149-158.
48. Xiao-Ming G, Ziqiu M, Yidan S, Lu F, Helen K, Qi X, Anthony MD, Xiao-Jun D: Infarct size and post-infarct inflammation determine the risk ofcardiac rupture in mice. International journal of cardiology 2010, 143:20-28.
Jin et al. BMC Systems Biology 2011, 5:60http://www.biomedcentral.com/1752-0509/5/60
Page 13 of 14

49. Gao XM, Xu Q, Kiriazis H, Dart AM, Du XJ: Mouse model of post-infarctventricular rupture: time course, strain- and gender-dependency, tensilestrength, and histopathology. Cardiovascular Research 2005, 65:469-477.
50. Kjeldsen L, Sengelov H, Lollike K, Nielsen MH, Borregaard N: Isolation andCharacterization of Gelatinase Granules from Human Neutrophils. Blood1994, 83:1640-1649.
51. Cleutjens JP, Kandala JC, Guarda E, Guntaka RV, Weber KT: Regulation ofcollagen degradation in the rat myocardium after infarction. Journal ofmolecular and cellular cardiology 1995, 27:1281-1292.
52. Loftis MJ, Sexton D, Carver W: Effects of collagen density on cardiacfibroblast behavior and gene expression. Journal of Cellular Physiology2003, 196:504-511.
53. Wu CH, Donovan CB, Wu GY: Evidence for pretranslational regulation ofcollagen synthesis by procollagen propeptides. Journal of BiologicalChemistry 1986, 261:10482-10484.
54. Wetzler C, Kampfer H, Stallmeyer B, Pfeilschifter J, Frank S: Large andSustained Induction of Chemokines during Impaired Wound Healing inthe Genetically Diabetic Mouse: Prolonged Persistence of Neutrophilsand Macrophages during the Late Phase of Repair. 2000, 115:245-253.
55. Ertl G, Frantz S: Healing after myocardial infarction. Cardiovasc Res 2005,66:22-32.
56. Nakajima H, Nakajima HO, Salcher O, Dittie AS, Dembowsky K, Jing S,Field LJ: Atrial but Not Ventricular Fibrosis in Mice Expressing a MutantTransforming Growth Factor-{beta}1 Transgene in the Heart. Circ Res2000, 86:571-579.
57. Day J, Friedman A, Schlesinger LS: Modeling the immune rheostat ofmacrophages in the lung in response to infection. Proceedings of theNational Academy of Sciences 2009, 106(27):11246-51.
58. Lin J, Lopez EF, Jin Y, Van Remmen H, Bauch T, Han HC, Lindsey ML: Age-related cardiac muscle sarcopenia: Combining experimental andmathematical modeling to identify mechanisms. Exp Gerontol 2008,43:296-306.
59. Lindsey ML, Goshorn DK, Squires CE, Escobar GP, Hendrick JW, Mingoia JT,Sweterlitsch SE, Spinale FG: Age-dependent changes in myocardial matrixmetalloproteinase/tissue inhibitor of metalloproteinase profiles andfibroblast function. Cardiovasc Res 2005, 66:410-419.
60. Zamilpa R, Lopez EF, Chiao YA, Dai Q, Escobar GP, Hakala K, Weintraub ST,Lindsey ML: Proteomic analysis identifies in vivo candidate matrixmetalloproteinase-9 substrates in the left ventricle post-myocardialinfarction. PROTEOMICS 2010, 10:2214-2223.
61. Squires CE, Escobar GP, Payne JF, Leonardi RA, Goshorn DK, Sheats NJ,Mains IM, Mingoia JT, Flack EC, Lindsey ML: Altered fibroblast functionfollowing myocardial infarction. Journal of Molecular and CellularCardiology 2005, 39:699-707.
62. Johan D, Heilborn KBAH: Inhibited proliferation of fibroblasts derivedfrom chronic diabetic wounds and normal dermal fibroblasts treatedwith high glucose is associated with increased formation of L-lactate.Wound Repair and Regeneration 1998, 6:135-141.
63. Loredana Moro AAAJLYPAdSAEMMG: Loss of BRCA2 promotes prostatecancer cell invasion through up-regulation of matrix metalloproteinase-9. Cancer Science 2008, 99:553-563.
64. Eberhardt W, Akool ELS, Rebhan J, Frank S, Beck KF, Franzen R,Hamada FMA, Pfeilschifter J: Inhibition of cytokine-induced MMP-9expression by PPARalpha agpnists is indirect and is due to a no-mediated reduction of mRNA stability. J Biol Chem 2002, M202008200.
65. Eberhardt W, Akool ELS, Rebhan J, Frank S, Beck KF, Franzen R,Hamada FMA, Pfeilschifter J: Inhibition of Cytokine-induced MatrixMetalloproteinase 9 Expression by Peroxisome Proliferator-activatedReceptor alpha Agonists Is Indirect and Due to a NO-mediatedReduction of mRNA Stability. J Biol Chem 2002, 277:33518-33528.
66. Monaco S, Sparano V, Gioia M, Sbardella D, Pierro DD, Marini S, Coletta M:Enzymatic processing of collagen IV by MMP-2 (gelatinase A) affectsneutrophil migration and it is modulated by extracatalytic domains.Protein Sci 2006, 15:2805-2815.
67. Iris Metzmacher PR, Abel Martin, Friess Wolfgang: In vitro binding ofmatrix metalloproteinase-2 (MMP-2), MMP-9, and bacterial collagenaseon collagenous wound dressings. Wound Repair and Regeneration 2007,15:549-555.
68. Atkins P: Physical Chemistry for the Life Sciences Oxford, Oxford UniversityPress; 2006.
doi:10.1186/1752-0509-5-60Cite this article as: Jin et al.: Combining experimental and mathematicalmodeling to reveal mechanisms of macrophage-dependent leftventricular remodeling. BMC Systems Biology 2011 5:60.
Submit your next manuscript to BioMed Centraland take full advantage of:
• Convenient online submission
• Thorough peer review
• No space constraints or color figure charges
• Immediate publication on acceptance
• Inclusion in PubMed, CAS, Scopus and Google Scholar
• Research which is freely available for redistribution
Submit your manuscript at www.biomedcentral.com/submit
Jin et al. BMC Systems Biology 2011, 5:60http://www.biomedcentral.com/1752-0509/5/60
Page 14 of 14
Copyright © 2022 FDOKUMEN