
Combined Use of Electrical Resistivity Tomography and Hydrochemical Data to Assess Anthropogenic...
15
ORIGINAL ARTICLE Combined Use of Electrical Resistivity Tomography and Hydrochemical Data to Assess Anthropogenic Impacts on Water Quality of a Karstic Region: A Case Study from Querença-Silves, South Portugal Teresa E. Leitão & Rogério Mota & Maria Emília Novo & João Paulo Lobo-Ferreira Received: 7 November 2013 /Accepted: 13 December 2013 /Published online: 24 April 2014 # Springer International Publishing Switzerland 2014 Abstract The presence of highly vulnerable karstic systems in areas of intense human activities often results in the degradation of existing surface- and groundwater quality status. Water quality protection and improvement, as required by the Water Frame- work Directive (WFD), depends on correct identification and prioritisation of the most relevant pollution sources within complex multi-stressor conditions. This paper pre- sents a methodology that combines the use of hydrogeology, water quality and quantity data, and electrical resistivity tomography methods to access different anthro- pogenic impacts upon the water cycle, focusing on the water quality of a section of the Portuguese karstic Querença-Silves aquifer. During this study an interpretation of the possible interconnections between pollutant sources, their pathways and local surface-groundwater connections was made, based on data obtained from field cam- paigns. As a result of this study, the areas with more interconnection between surface- and groundwater were identified, namely the influent sites from the local stream into the aquifer. The impact of the diffuse pollution sources was verified at the monitoring points, especially those located downstream of large farming plots. Pollution in this karst aquifer results from seepage through agricultural areas and infiltration at the influent points of the stream. This aspect of stream influence upon the aquifer means that pollution sources located upstream of the area of the aquifer (e.g., a WWTP— Wastewater Treatment Plant) can also contribute to the aquifer pollution. Environ. Process. (2014) 1:43–57 DOI 10.1007/s40710-014-0002-1 T. E. Leitão (*) : R. Mota : M. E. Novo : J. P. Lobo-Ferreira National Laboratory for Civil Engineering (LNEC), Av. do Brasil 101, 1700-066 Lisbon, Portugal e-mail: [email protected] R. Mota e-mail: [email protected] M. E. Novo e-mail: [email protected] J. P. Lobo-Ferreira e-mail: [email protected]
-
Upload
independent -
Category
Documents
-
view
4 -
download
0
Transcript of Combined Use of Electrical Resistivity Tomography and Hydrochemical Data to Assess Anthropogenic...

ORIGINAL ARTICLE
Combined Use of Electrical Resistivity Tomographyand Hydrochemical Data to Assess Anthropogenic Impactson Water Quality of a Karstic Region: A Case Studyfrom Querença-Silves, South Portugal
Teresa E. Leitão & Rogério Mota & Maria Emília Novo &
João Paulo Lobo-Ferreira
Received: 7 November 2013 /Accepted: 13 December 2013 /Published online: 24 April 2014# Springer International Publishing Switzerland 2014
Abstract The presence of highly vulnerable karstic systems in areas of intense humanactivities often results in the degradation of existing surface- and groundwater qualitystatus. Water quality protection and improvement, as required by the Water Frame-work Directive (WFD), depends on correct identification and prioritisation of the mostrelevant pollution sources within complex multi-stressor conditions. This paper pre-sents a methodology that combines the use of hydrogeology, water quality andquantity data, and electrical resistivity tomography methods to access different anthro-pogenic impacts upon the water cycle, focusing on the water quality of a section ofthe Portuguese karstic Querença-Silves aquifer. During this study an interpretation ofthe possible interconnections between pollutant sources, their pathways and localsurface-groundwater connections was made, based on data obtained from field cam-paigns. As a result of this study, the areas with more interconnection between surface-and groundwater were identified, namely the influent sites from the local stream intothe aquifer. The impact of the diffuse pollution sources was verified at the monitoringpoints, especially those located downstream of large farming plots. Pollution in thiskarst aquifer results from seepage through agricultural areas and infiltration at theinfluent points of the stream. This aspect of stream influence upon the aquifer meansthat pollution sources located upstream of the area of the aquifer (e.g., a WWTP—Wastewater Treatment Plant) can also contribute to the aquifer pollution.
Environ. Process. (2014) 1:43–57DOI 10.1007/s40710-014-0002-1
T. E. Leitão (*) : R. Mota :M. E. Novo : J. P. Lobo-FerreiraNational Laboratory for Civil Engineering (LNEC), Av. do Brasil 101, 1700-066 Lisbon, Portugale-mail: [email protected]
R. Motae-mail: [email protected]
M. E. Novoe-mail: [email protected]
J. P. Lobo-Ferreirae-mail: [email protected]

Keywords Water quality . Impacts . Human activities . Geophysical methods andwaterinformation
1 Introduction
In contrast to sedimentary terrains where groundwater occurs in the pores of horizon-tal rocks, like sandstone or in the interstitial spaces of deposits, in hard-rock terrainsgroundwater occurs in fractures, fissures, crushed zones and joints. In karstic forma-tions, like those present in the Ribeiro Meirinho case study, which is the focus of thiswork, water pathways carved within the rock formation play an important role ingroundwater circulation.
The use of non-intrusive geophysical methods, e.g., electrical resistivity tomogra-phy, is a common approach to complement discrete water quantity and quality fielddata and information (e.g., Gemail et al. 2011; Sainato et al. 2012). These methodsare, however, less commonly applied to karstic areas. Electrical resistivity measure-ments are a function of the type of soil or rock, its porosity, and the conductivity ofthe fluids that fill the pore spaces. Electrical resistivity values are inversely correlatedto electrical conductivity. In a resistivity survey, a direct current of intensity is passedinto the ground through a pair of current electrodes and the resulting potential dropΔV is measured across a pair of potential electrodes. Therefore, more saturatedgeological formations, containing high water content and more dissolved salts orpollutants, will lead to lower electrical resistivity profiles due to the ease at whichelectrical current crosses the high electrical conductivity media. Also, the determina-tion of the water table position by the resistivity method is based on the fact that thesaturated materials will have lower resistivity than the unsaturated materials.
With geophysical surveys, one can identify the most saturated areas (lowerresistivity spots) and assess the subsurface areas more favourable to aquifer re-charge and, simultaneously, which need protection in order to guarantee ground-water quality.
In this study, the impact that different stressors have on the quality of water was assessedbased on the knowledge gathered from previous works in the region (Monteiro et al. 2006;Reis et al. 2007) and several water monitoring campaigns, complemented by geophysicalprofiles. The areas downstream of the main pollution sources were monitored both for surfaceand groundwater. The negative influence of surface water quality in locations where theRibeiro Meirinho stream can contribute to the aquifer recharge was confirmed with thegeophysical survey.
2 Site Description
2.1 Location and Characteristics
The Ribeiro Meirinho case study area is located northeast of Silves, Algarve region,Portugal (Fig. 1). The hydrogeological setting is the Querença-Silves karstic aquifer,with a complex compartmented structure, with two distinct domains: a westerndomain and an eastern domain. Its western domain has a well-developed karst,westward flow direction, with the main discharge areas along the Arade river, withparticular relevance to Estômbar springs (westmost point). Its eastern domain has
44 T. E. Leitão et al.

more random flow directions, less regular piezometric surfaces (Fig. 1) and a lowerkarst development. The tectonic activity of this region results in its widespreadfracturing, defining a significant number of semi-independent aquifer blocks, withmore or less constrained and restricted hydraulic links between them. Such hydraulicrestrictions are more expressive in the eastern domain, because in the western domainthe pervasive karstic network largely obliterates such tectonic setting (Mendonça andAlmeida 2003; Monteiro et al. 2006).
The Ribeiro Meirinho stream is located in the central-western area of Querença-Silves aquifer and its upper reaches are located outside the aquifer, in SerraAlgarvia. The latter are Palaeozoic terrains, composed mainly of schist and graywakes, essentially impervious lithologies, being therefore, the main source of waterfor this stream until it reaches the Jurassic limestones, dolomites, dolomitic lime-stones and other, less important, calcareous formations composing the karst aquiferof Querença-Silves.
Water availability in the region is low, and therefore, the importance of itspreservation is clear. According to Costa et al. (1985), the average annual rainfallof the area where the Querença-Silves Aquifer System is located ranges from about550 mm/year at the southwestern tip of the aquifer system, increasing to E and NE,with 800 mm/year of rainfall at its SE boundary, and above 800 mm/year across theremaining eastern sector. There is evidence of a drought recurrence trend of 10 yearsfor the most intense droughts. The average annual recharge of Querença-Silvesaquifer, for the period 1941–1991, was estimated as 314 mm/year, i.e., 100×106 m3/year (Oliveira et al. 2008). For the period 1979–2009, an average annualrecharge value of 294 mm/year was estimated (Oliveira 2011), equivalent to 94×106 m3/year.
Due to its karstic properties, there is a strong relationship between the aquifer andthe streams with some influent sections that can significantly contribute to its recharge(Monteiro et al. 2006; Reis et al. 2007). This is the case of Ribeiro Meirinho, whichundergoes a sharp reduction of the flow rate when it reaches the calcareous forma-tions, having several sinks in its bed. It is estimated that besides direct recharge, anextra amount of 62×106 m3/year, originating from surface flow produced in thedrainage area outside the aquifer, infiltrates when the rivers reach the aquifer system(Oliveira and Oliveira 2012).
Ribeiro Meirinho
Fig. 1 Site location along Ribeiro Meirinho stream and central-western area of Querença-Silves aquifer and itspiezometry (upper right: modelled; lower right: measured)
Combined Use of Resistivity Tomography and Hydrochemistry 45
2.2 Main Stressors
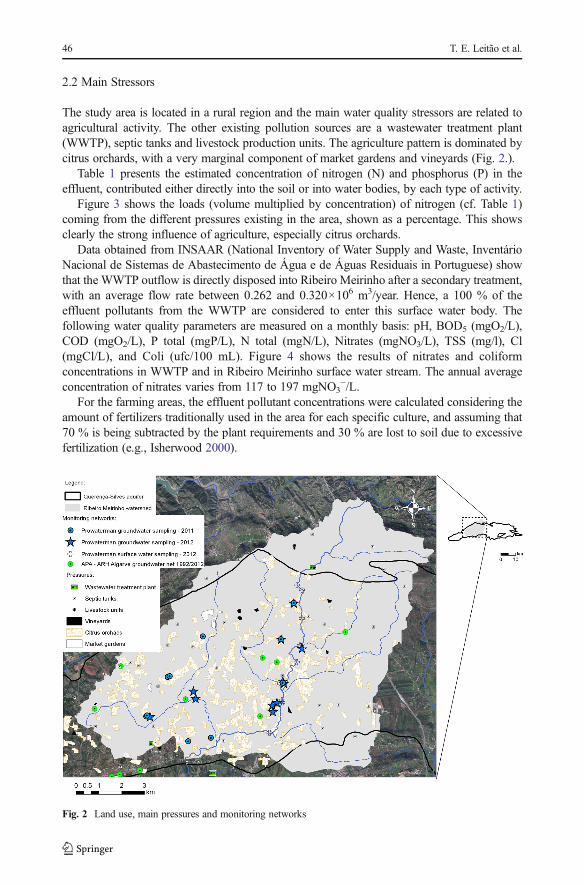
The study area is located in a rural region and the main water quality stressors are related toagricultural activity. The other existing pollution sources are a wastewater treatment plant(WWTP), septic tanks and livestock production units. The agriculture pattern is dominated bycitrus orchards, with a very marginal component of market gardens and vineyards (Fig. 2.).
Table 1 presents the estimated concentration of nitrogen (N) and phosphorus (P) in theeffluent, contributed either directly into the soil or into water bodies, by each type of activity.
Figure 3 shows the loads (volume multiplied by concentration) of nitrogen (cf. Table 1)coming from the different pressures existing in the area, shown as a percentage. This showsclearly the strong influence of agriculture, especially citrus orchards.
Data obtained from INSAAR (National Inventory of Water Supply and Waste, InventárioNacional de Sistemas de Abastecimento de Água e de Águas Residuais in Portuguese) showthat the WWTP outflow is directly disposed into Ribeiro Meirinho after a secondary treatment,with an average flow rate between 0.262 and 0.320×10⁶ m3/year. Hence, a 100 % of theeffluent pollutants from the WWTP are considered to enter this surface water body. Thefollowing water quality parameters are measured on a monthly basis: pH, BOD5 (mgO2/L),COD (mgO2/L), P total (mgP/L), N total (mgN/L), Nitrates (mgNO3/L), TSS (mg/l), Cl(mgCl/L), and Coli (ufc/100 mL). Figure 4 shows the results of nitrates and coliformconcentrations in WWTP and in Ribeiro Meirinho surface water stream. The annual averageconcentration of nitrates varies from 117 to 197 mgNO3
−/L.For the farming areas, the effluent pollutant concentrations were calculated considering the
amount of fertilizers traditionally used in the area for each specific culture, and assuming that70 % is being subtracted by the plant requirements and 30 % are lost to soil due to excessivefertilization (e.g., Isherwood 2000).
Fig. 2 Land use, main pressures and monitoring networks
46 T. E. Leitão et al.

For the septic tanks, the pollution load of N and P per unit was calculated by evaluating theaverage population in each human settlement (village) connected to such structures, multipliedby the pollution load by person-equivalent. Due to the differences in population density,average population by village will be different from one county to another, and this wasaccounted for in the calculations made by the authors. The pollutant removal capacity of theseptic tanks was also considered, assuming that they are running in perfect conditions,therefore, having a removal capacity of 80 % of the pollution load produced. The remaining
Table 1 Pollutant rejections by type of activity
Origin Flow rate (m3/y)or applicationarea (ha)
Rejected pollutantconcentrations
% of rejection lostinto soil/water
Loads (ton/y)
WWTP 0.262(a) ×106 m3/y 157(b) mgNO3−/L 100 % 9.31 N
to 11.37
0.32(a) 5.5(b) mgP/L 1.44 P
1.76
Agriculture
Citrus orchards 1,358.530 ha 160 kgN/ha/y 30 % 65.21 N
80 kgP/ha/y 32.60 P
Vineyards 15.830 20 kgN/ha/y 0.095 N
13.5 kgP/ha/y 0.064 P
Market gardens 30.570 48 kgN/ha/y 0.44 N
21.6 kgP/ha/y 0.20 P
Septic tanks Point source 5783.5 kgN/y 20 % 1.16 N
1499.8 kgP/y 0.30 P
Livestock production Point source 1594.2 kgN/y 100 % 1.59 N
531.4 kgP/y 0.53 P
(a) INSAAR data http://www.google.pt/url?sa=t&rct=j&q=&esrc=s&source=web&cd=7&ved=0CGQQFjAG&url=http%3A%2F%2Finsaar.inag.pt%2Fbo%2Fcontents%2Fresultadostabelasdados%2 F 1 2 6 8 1 3 6 7 5 7 7 8 9 6 . x l s & e i = p w r T U M K e G Y a X h Q e s v Y G A B g & u s g =AFQjCNFTwsRf1bC1PHLXOQtdvoe5IvyxUQ&bvm=bv.1355534169,d.ZG(b) Data from: http://www.aguasdoalgarve.pt/qualidadeefluente.php
Fig. 3 Nitrogen loads originating from the different pressures in the study area
Combined Use of Resistivity Tomography and Hydrochemistry 47

20 % should be lost to the soil, but this figure can be higher, depending on the efficiency of theseptic tank.
Livestock production units are pig production for meat, and are located outside theaquifer, in the upper reaches of Ribeiro Meirinho. It was considered that 100 % of itsdischarge enters Ribeiro Meirinho, since the soil outside the area is impervious until itreaches the aquifer terrains, where part of its flow is assumed to infiltrate. Thelivestock pollution loads/unit was calculated as the average of the total value consid-ered to be point source discharged by the livestock units in the study area. The datawere gathered from the recent watershed planning reports (Nemus, Ecossistema andAgro.ges 2011).
Having in mind the annual recharge value (Oliveira and Oliveira 2012) and the annual loadscalculated, we can estimate that the recharge of water in the cultivated areas has an averageconcentration of 28.65 mgNO3
−/L, which corresponds to 65.7 t N (sum of agriculture inTable 1) converted to NO3
− and divided by 19.25×10⁶ m3 annual recharge value in the areaswith cultivated outcrops.
3 Materials and Methods
3.1 Water Quality Monitoring
Based on the two main pressures in the watershed (Fig. 2), a general assessment ofthe water quality was initially made, followed by a focus on a specific area wheresome sections of the stream bed are recharging the aquifer. Water quality wasmonitored for both surface- and groundwater. The first campaign was carried out inMay 2011 (Fig. 2) and aimed at a global characterization of water status, identifying
0
100000
200000
300000
400000
500000
600000
0
50
100
150
200
250
300
350
400
jan-09 abr-09 jul-09 out-09 jan-10 abr-10 jul-10 out-10 jan-11 abr-11 jul-11 out-11 jan-12 abr-12 jun-12
ufc/
100
mL
mgN
O3/
L
NO3 (mg/L) (Entrance WWTP)
NO3 (mg/L) (WWTP outflow)
NO3 (mg/L) (Ponte Mesquita)
NO3 (mg/L) RM7
NO3 (mg/L) RM9
Coli (ufc/100 mL) (WWTP outflow)
Fig. 4 Concentration in nitrates and coliforms in the WWTP and in the surface water stream (Ribeiro Meirinho)
48 T. E. Leitão et al.
areas with poorer status. The following chemical parameters were analysed: Na+,Ca2+, K+, Mg2+, Cl−, HCO3
−, SO42−, NO3
−, NH4+, NO2
−, PO43−, Al, As, Be, Ba,
Cd, Cr, Zn, Cu, Fe, S, Cu, Pb, Zn, organic matter, total hydrocarbons, detergents, andtotal coliforms. As a result of the data obtained, the case study area was focused onRibeiro Meirinho stream and the surrounding groundwater, during the second moni-toring period carried out in May 2012. In all campaigns, representative samples weretaken after the stabilization of electrical conductivity and pH, or after a significantvolume of water withdrawal.
The local water authority (APA-ARH Algarve) has also carried out a monitoring programsince 1992, with historical information.
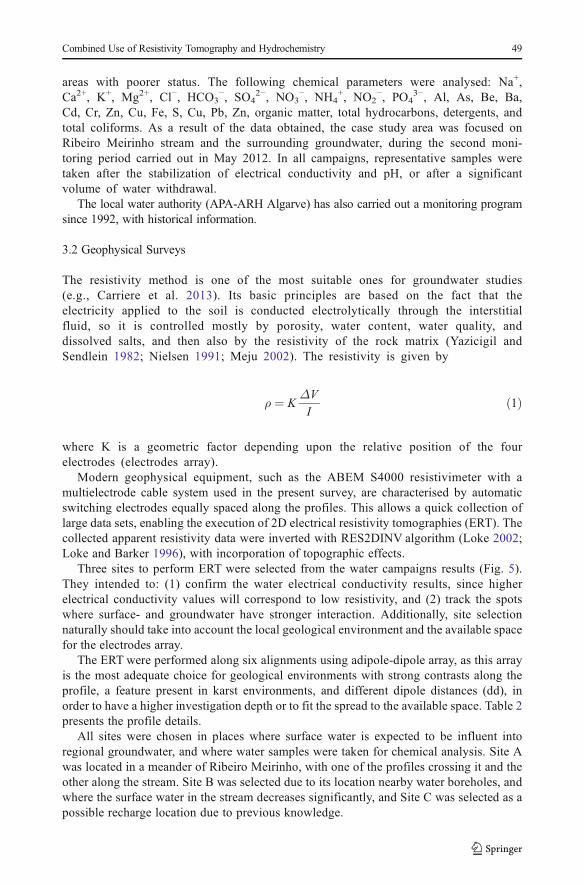
3.2 Geophysical Surveys
The resistivity method is one of the most suitable ones for groundwater studies(e.g., Carriere et al. 2013). Its basic principles are based on the fact that theelectricity applied to the soil is conducted electrolytically through the interstitialfluid, so it is controlled mostly by porosity, water content, water quality, anddissolved salts, and then also by the resistivity of the rock matrix (Yazicigil andSendlein 1982; Nielsen 1991; Meju 2002). The resistivity is given by
ρ ¼ KΔV
Ið1Þ
where K is a geometric factor depending upon the relative position of the fourelectrodes (electrodes array).
Modern geophysical equipment, such as the ABEM S4000 resistivimeter with amultielectrode cable system used in the present survey, are characterised by automaticswitching electrodes equally spaced along the profiles. This allows a quick collection oflarge data sets, enabling the execution of 2D electrical resistivity tomographies (ERT). Thecollected apparent resistivity data were inverted with RES2DINV algorithm (Loke 2002;Loke and Barker 1996), with incorporation of topographic effects.
Three sites to perform ERT were selected from the water campaigns results (Fig. 5).They intended to: (1) confirm the water electrical conductivity results, since higherelectrical conductivity values will correspond to low resistivity, and (2) track the spotswhere surface- and groundwater have stronger interaction. Additionally, site selectionnaturally should take into account the local geological environment and the available spacefor the electrodes array.
The ERT were performed along six alignments using adipole-dipole array, as this arrayis the most adequate choice for geological environments with strong contrasts along theprofile, a feature present in karst environments, and different dipole distances (dd), inorder to have a higher investigation depth or to fit the spread to the available space. Table 2presents the profile details.
All sites were chosen in places where surface water is expected to be influent intoregional groundwater, and where water samples were taken for chemical analysis. Site Awas located in a meander of Ribeiro Meirinho, with one of the profiles crossing it and theother along the stream. Site B was selected due to its location nearby water boreholes, andwhere the surface water in the stream decreases significantly, and Site C was selected as apossible recharge location due to previous knowledge.
Combined Use of Resistivity Tomography and Hydrochemistry 49

4 Results
4.1 Water Quality
Year 2011 results lead to the conclusion that groundwater has a bicarbonate calcicfacies, typical of karstic areas. Only the groundwater from Alg13 (large well) seemsto have a direct input from surface water, showing higher chloride content (Fig. 6). Itwas also possible to identify areas with strong influence from pollutant sources,recognized by concentrations of nitrates, phosphorus, boron, barium, and copper notpresent in background values for karstic areas (Fig. 6). These last three are probably
Fig. 5 Location of profiles (from Google earth): top left—Site A (Algoz1 and Algoz2); top right—Site B(Algoz3 and Algoz4); bottom left—Site C (Algoz5 and Algoz6). Thewhite circle depicts the large wells at sites Aand C and the water supply borehole at site B
Table 2 Geophysical profiledetails Identification Dipole distance (m) Total length (m)
Site A Algoz 1 6 240
Algoz 2 6 240
Site B Algoz 3 10 390
Algoz 4 10 390
Site C Algoz 5 8 312
Algoz 6 10 390
50 T. E. Leitão et al.
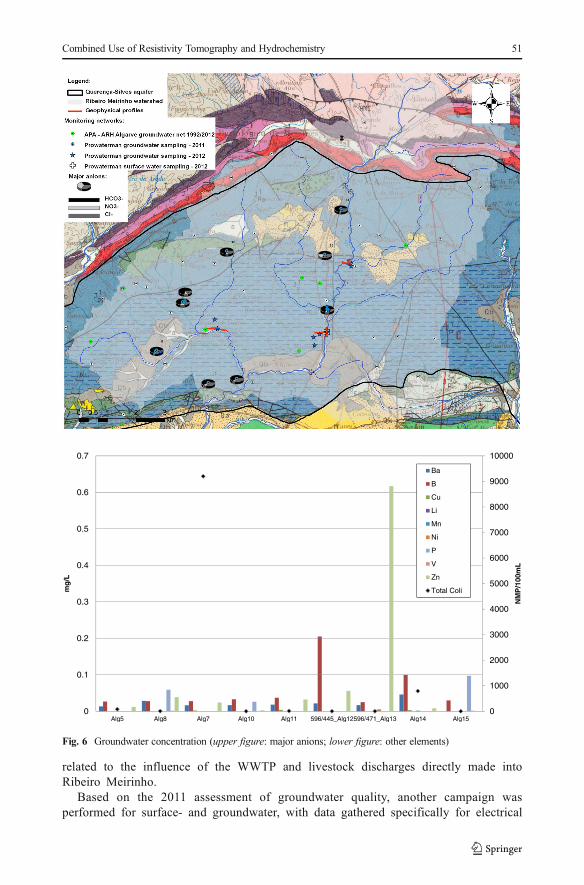
related to the influence of the WWTP and livestock discharges directly made intoRibeiro Meirinho.
Based on the 2011 assessment of groundwater quality, another campaign wasperformed for surface- and groundwater, with data gathered specifically for electrical
0
1000
2000
3000
4000
5000
6000
7000
8000
9000
10000
0
0.1
0.2
0.3
0.4
0.5
0.6
0.7
Alg5 Alg8 Alg7 Alg10 Alg11 596/445_Alg12596/471_Alg13 Alg14 Alg15
NM
P/1
00m
L
mg
/L
Ba
B
Cu
Li
Mn
Ni
P
V
Zn
Total Coli
Fig. 6 Groundwater concentration (upper figure: major anions; lower figure: other elements)
Combined Use of Resistivity Tomography and Hydrochemistry 51

conductivity (Fig. 7) and nitrates (Fig. 8), as two representatives of the impact causedby the existing pressures.
0
200
400
600
800
1000
1200
mai-90 jan-93 out-95 jul-98 abr-01 jan-04 out-06 jul-09 abr-12
EC
(m
icro
S/c
m)
595/171595/209595/287595/95595/97596/143596/145596/330596/332
Fig. 7 Electrical conductivity values (upper figure: in surface- and groundwater; lower figure: evolution ingroundwater)
52 T. E. Leitão et al.

From Fig. 7, it is possible to see the negative influence of the WWTP on surface waterquality, as well as some contribution into groundwater, in places near this stream where surface
0
10
20
30
40
50
60
70
80
90
100
mai-90 jan-93 out-95 jul-98 abr-01 jan-04 out-06 jul-09 abr-12
mgN
O3/
L
595/171
595/209
595/287
596/143
Fig. 8 Nitrate values (upper figure: in surface- and groundwater; lower figure: evolution in groundwater)
Combined Use of Resistivity Tomography and Hydrochemistry 53
water infiltrates to the aquifer. The EC values have been stable along the years, with a smallupward trend and an increase of the variance.
For nitrate concentration in water, it is possible to see that the agricultural land usehas a stronger impact than Ribeiro Meirinho (Fig. 8). In fact, as previously stated,agricultural practices contribute with loads around six times higher than those fromthe WWTP (Fig. 3). In the long term values, a seasonal effect (due to fertilizationinput) is clear in most wells, with higher standard deviation. This confirms the highrecharge rates of this aquifer, which allow for the input of cleaner water in periods oflow fertilization, decreasing the nitrates concentrations, but also the effect of irrigationcharged with excess of nitrates (Fig. 8).
The water quality and the influence of surface water quality on regional groundwaterquality is further analysed with the geophysical interpretation.
4.2 Geophysics: Interpretation
The geophysical data collected were of good quality, which is expressed in the inverted sectionsby a low RMS error (cf. in the upper left text of each profile) – although dipole-dipole is a highRMS error array. Coordinates on the horizontal axis of each resistivity model are distances fromthe beginning of the profile, always considering observer’s vision in the south–north direction.The resistivity range is 35–6,336Ω.m for all sites, with lower values in white.
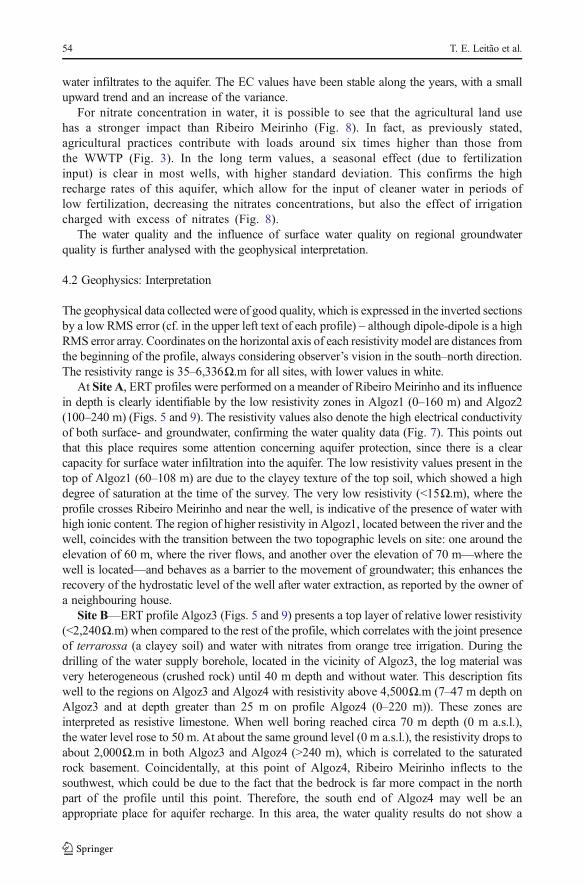
At Site A, ERT profiles were performed on a meander of Ribeiro Meirinho and its influencein depth is clearly identifiable by the low resistivity zones in Algoz1 (0–160 m) and Algoz2(100–240 m) (Figs. 5 and 9). The resistivity values also denote the high electrical conductivityof both surface- and groundwater, confirming the water quality data (Fig. 7). This points outthat this place requires some attention concerning aquifer protection, since there is a clearcapacity for surface water infiltration into the aquifer. The low resistivity values present in thetop of Algoz1 (60–108 m) are due to the clayey texture of the top soil, which showed a highdegree of saturation at the time of the survey. The very low resistivity (<15Ω.m), where theprofile crosses Ribeiro Meirinho and near the well, is indicative of the presence of water withhigh ionic content. The region of higher resistivity in Algoz1, located between the river and thewell, coincides with the transition between the two topographic levels on site: one around theelevation of 60 m, where the river flows, and another over the elevation of 70 m—where thewell is located—and behaves as a barrier to the movement of groundwater; this enhances therecovery of the hydrostatic level of the well after water extraction, as reported by the owner ofa neighbouring house.
Site B—ERT profile Algoz3 (Figs. 5 and 9) presents a top layer of relative lower resistivity(<2,240Ω.m) when compared to the rest of the profile, which correlates with the joint presenceof terrarossa (a clayey soil) and water with nitrates from orange tree irrigation. During thedrilling of the water supply borehole, located in the vicinity of Algoz3, the log material wasvery heterogeneous (crushed rock) until 40 m depth and without water. This description fitswell to the regions on Algoz3 and Algoz4 with resistivity above 4,500Ω.m (7–47 m depth onAlgoz3 and at depth greater than 25 m on profile Algoz4 (0–220 m)). These zones areinterpreted as resistive limestone. When well boring reached circa 70 m depth (0 m a.s.l.),the water level rose to 50 m. At about the same ground level (0 m a.s.l.), the resistivity drops toabout 2,000Ω.m in both Algoz3 and Algoz4 (>240 m), which is correlated to the saturatedrock basement. Coincidentally, at this point of Algoz4, Ribeiro Meirinho inflects to thesouthwest, which could be due to the fact that the bedrock is far more compact in the northpart of the profile until this point. Therefore, the south end of Algoz4 may well be anappropriate place for aquifer recharge. In this area, the water quality results do not show a
54 T. E. Leitão et al.

relationship between surface- and groundwater, possibly due to a thick non-saturated zone thatthe pollutants need to cross from the surface to the water table.
Site C—The resistivity model for ERTAlgoz5 (Figs. 5 and 9) shows a high resistivity valuecloser to the well (presented in Algoz6 profile) at a higher topographic level. This leads to theconclusion that the topsoil at this location has a higher permeability than in the surroundingarea, since water is being drained into the well, where the hydrostatic level (h.l.) is about 25 mdeep. This means that the place is good for aquifer recharge, requiring its protection to prevent
W
E
SwellRibeiro MeirinhoNW
road
road
Ewater supply boreholeW
N Ss.z.
well
sinks
dike
h.l.
Fig. 9 Resistivity model profiles (upper-site A: Algoz1 (top) and Algoz2 (bottom); middle-site B: Algoz3 (top)and Algoz4 (bottom) (s.z.—top of saturated zone); bottom-site C: Algoz5 (top) and Algoz6 (bottom))
Combined Use of Resistivity Tomography and Hydrochemistry 55

entry of polluted water into the aquifer. A dike was built for retaining river waters (see profileAlgoz6), given the large amount of water that is drained by several sinks existing along itsbanks and bed, some of which were identified in the course of this survey, on the right bank,between the well and the dike. From Algoz6 stands out the thicker low resistivity top layer,located upstream of the dike, showing the highest infiltration capacity of the upstream area.This may also be due to the presence of the dike, which holds water that may have circulated inthe stream during the previous week. Basement rock has resistivity values in the same order ofmagnitude as those from Site B, showing the same characteristics at both sites.
5 Conclusions
From water quality and geophysical surveys performed in the Querença-Silves case study, themain impacts of the existing stressors on the water quality pattern were identified, as well as thesites where surface- and groundwater are interconnected and favourable to both aquifer rechargeand the entrance of pollutants into the aquifer (several areas of Algoz1, 2, 4, 5 and 6 profiles).
A general increase in resistivity of the top layers is observed from the upstream (site A) tothe downstream (site B) profiles taken in Ribeiro Meirinho river bed (Algoz1, 2 and 4). Sincethe geologic environment is similar between sites A and B, and the resistivity rises from A toB, resistivity models confirm the chemical results whereas surface water quality is poorer, andtherefore, have higher electrical conductivity in the north (site A) when compared to the south(site B). The WWTP plant was identified as the main reason for the degradation of the surfacewater quality of Ribeiro Meirinho, which in turn impacts the groundwater quality. On the otherhand, agricultural practices have contributed with diffuse nitrate loads around six times higherthan those from the WWTP. In the long term values, a seasonal effect (due to fertilizationinput) is clear in most wells. This confirms the high recharge rates of this aquifer, which allowfor the input of cleaner water in periods of low fertilization, decreasing the nitrates concen-trations, but also the effect of irrigation charged with excess of nitrates.
Finally, the combined analysis of geophysical and water quality surveys leads to theconclusion that in several profiles, the top soil acts like a filter, retaining the contaminantsfrom the WWTP and agriculture activities (e.g., site B, Algoz3 profile).
Acknowledgments The work was financed by the Portuguese Foundation for Science and Technology underPROWATERMAN project PTDC/AAC-AMB/105061/2008 (http://www.lnec.pt/organizacao/dha/organizacao/dha/nas/estudos_id/PROWATERMAN). We thank Águas do Algarve (AdA) and Agência Portuguesa doAmbiente (APA-ARH Algarve) for their support during this project, including the chemical analysis done inAdA. The help of Prof. Jeff Camkin, from the University of Western Australia, in reviewing and correcting thetext is gratefully acknowledged. The authors are indebted to two anonymous reviewers for their usefulsuggestions to improve this paper. An initial version of this paper was presented at the 8th InternationalConference of the EWRA in Porto, Portugal, June 26–29, 2013.
References
Carriere SD, Chalikakis K, Senechal G, Danquigny C, Emblanch C (2013) Combining electrical resistivitytomography and ground penetrating radar to study geological structuring of karst unsaturated zone. J ApplGeophys. doi:10.1016/j.jappgeo.2013.03.014
Costa FE, Brites JA, Pedrosa MY, Silva AV (1985) Hydrogeological map of the Algarve region, Scale 1:100 000.Serviços Geológicos de Portugal, Lisboa, In Portuguese: Carta hidrogeológica da Orla Algarvia
56 T. E. Leitão et al.

Gemail KS, El-Shishtawy AM, El-Alfy M, Ghoneim MF, Abd El-Bary MH (2011) Assessment of aquifervulnerability to industrial waste water using resistivity measurements. A case study, along El-Gharbyia MainDrain, Nile Delta, Egypt. J Appl Geophys. doi:10.1016/j.jappgeo.2011.06.026
Isherwood KF (2000) Fertilizer use and the environment. International Fertilizer Industry Association, ParisLoke MH (2002) RES2DINV, Ver. 3.50, Rapid 2-D resistivity & IP inversion using the least-squares method.
Geotomo Software, PenangLoke MH, Barker RD (1996) Rapid least-squares inversion of apparent resistivity pseudosections using a quasi-
Newton method. Geophys Prospect 44:131152Meju M (2002) Environmental geophysics: conceptual models, challenges, and the way forward. Lead Edge 21:
460–464Mendonça L, Almeida C (2003) Exploitation of groundwater resources: the example of aquifer systemQuerença-
Silves. Recur Hídr J 24(3):53–61, In: e-geo.ineti.pt/edicoes_online/obras/costa_almeida/tp067.pdf. (inPortuguese: A Exploração de Recursos Hídricos Subterrâneos: O Exemplo do Sistema AquíferoQuerença-Silves)
Monteiro JP, Guerreiro P, Martins J, Matos Silva J, Reis E (2006) Algibre Stream and the aquifers of AlgarveCentral: relationships between surface- and groundwater. Project POCI/AMB/57432/2004 GroundwaterFlow Modelling and Optimisation of Groundwater Monitoring Networks at the Regional Scale in CoastalAquifers: The Algarve Case-study. In:http://www.cvrm.ualg.pt/projectos/malgar/publ_archive/7_rel-sub-sup-V0_ok.pdf. In Portuguese: A Ribeira do Algibre e os Aquíferos do Algarve Central: Relações entreÁguas Superficiais e Subterrâneas
NEMUS, ECOSSISTEMA, AGRO.GES (2011) Watershed management plans integrated in hydrographicregions 6 and 7. Technical Report for Public Discussion, Lisbon. In Portuguese: Planos de gestão das baciashidrográficas integradas nas regiões hidrográficas 6 e 7. Região Hidrográfica 6. Relatório técnico para efeitosde participação pública, pp 386
Nielsen DM (1991) Practical handbook of groundwater monitoring. Lewis Publishers, Chelsea, 717Oliveira MM (2011) Conceptualization of recharge processes and water budgets of aquifer systems in water-
shed’s water resources management framework. 8th Seminar on Groundwater, Lisbon. In Portuguese:Conceptualização do processo de recarga e do balanço hídrico de sistemas aquíferos no planeamento derecursos hídricos por sub-bacias hidrográficas
Oliveira MM, Oliveira LS (2012) Water, aquatic ecosystems and human activity project PROWATERMAN. 5thThematic Report. Recharge and direct runoff assessment of Querença-Silves aquifer system catchment area.Repor 180/2012-NAS. LNEC, pp. 108. In Portuguese: Água, Ecossistemas Aquáticos e Atividade HumanaProjeto PROWATERMAN. Quinto Relatório Temático - Estimativa da recarga e do escoamento direto naárea de drenagem do sistema aquífero Querença-Silves
Oliveira MM, Oliveira L, Lobo Ferreira JP (2008) Evaluation of natural recharge of Querença-Silves aquifersystem (Algarve). 9th Water Congress, Cascais, 15 pp. In Portuguese: Estimativa da Recarga Natural noSistema Aquífero de Querença-Silves (Algarve) Pela Aplicação do Modelo BALSEQ_MOD
Reis E, Gago C, Borges G, Matos M, Cláudio A, Mendes E, Silva A, Serafim J, Rodrigues A, Correia S (2007)Contribution to water budget evaluation of the main aquifer systems of Algarve. Ministry of Environmentand Regional Development. CCDR, pp 41. In Portuguese: Contribuição para o cálculo do balanço hídricodos principais sistemas aquíferos do Algarve
Sainato CM, Losinno BN, Malleville HJ (2012) Assessment of contamination by intensive cattle activity throughelectrical resistivity tomography. J Appl Geophys 76:82–91
Yazicigil H, Sendlein LVA (1982) Surface geophysical techniques in groundwater monitoring - Part II,Groundwater Monitoring Revue, winter 2(1):56–62
Combined Use of Resistivity Tomography and Hydrochemistry 57