An ecohydrological modelling approach for assessing long-term recharge rates in semiarid karstic...
16
An ecohydrological modelling approach for assessing long-term recharge rates in semiarid karstic landscapes Sergio Contreras a, * , Matthias M. Boer b , Francisco J. Alcala ´ c , Francisco Domingo a , Mo ´nica Garcı ´a a , Antonio Pulido-Bosch d , Juan Puigdefa ´bregas a a Departamento de Desertificacio ´n y Geoecologı ´a, Estacio ´n Experimental de Zonas A ´ ridas, Consejo Superior de Investigaciones Cientı ´ficas, C/Gral. Segura 1, 04001 Almerı ´a, Spain b Ecosystems Research Group, School of Plant Biology, The University of Western Australia, 35 Stirling Highway, Crawley 6009, WA, Australia c Departamento de Fı ´sica Aplicada, Universidad de Almerı ´a, Carretera Sacramento s/n, 04120 Almerı ´a, Spain d Departamento de Hidrogeologı ´a y Quı ´mica Analı ´tica, Universidad de Almerı ´a, Carretera Sacramento s/n, 04120 Almerı ´a, Spain Received 12 April 2007; received in revised form 4 October 2007; accepted 16 November 2007 KEYWORDS Annual water balance; Recharge; Semiarid region; NDVI; Hydrological equilibrium hypothesis Summary An ecohydrological water balance method based on the hydrological equilib- rium hypothesis was developed to estimate long-term annual recharge rates in semiarid karstic landscapes. Recharge was predicted from the difference between long-term annual precipitation and evapotranspiration rates. A multiple regression interpolation approach was used to compute precipitation. Evapotranspiration was quantified from the deviations between the observed local value of the normalised difference vegetation index (NDVI) and, the predicted minimum and maximum NDVI values for two hydrologi- cally-well defined reference conditions representing the minimum and maximum vegeta- tion density given a local long-term water availability index. NDVI values for the reference conditions (NDVI min and NDVI max ) were estimated from an empirically-based boundary analysis. Evapotranspiration rates for the reference conditions were estimated using a monthly water budget model that integrates the roles of the soil water holding capacity and a climate-driven evaporative coefficient (k) representing the mean annual conduc- tance of the vegetation canopy. The methodology was tested in Sierra de Ga´dor (SE 0022-1694/$ - see front matter ª 2007 Elsevier B.V. All rights reserved. doi:10.1016/j.jhydrol.2007.11.039 * Corresponding author. Present address: Grupo de Estudios Ambientales – IMASL, Universidad Nacional de San Luis and CONICET, Avda. Eje ´rcito de los Andes, 950. 5700 San Luis, Argentina. Tel./fax: +54 2652 424740. E-mail address: [email protected] (S. Contreras). Journal of Hydrology (2008) 351, 42– 57 available at www.sciencedirect.com journal homepage: www.elsevier.com/locate/jhydrol
-
Upload
independent -
Category
Documents
-
view
1 -
download
0
Transcript of An ecohydrological modelling approach for assessing long-term recharge rates in semiarid karstic...

Journal of Hydrology (2008) 351, 42–57
ava i lab le at www.sc iencedi rec t . com
journal homepage: www.elsevier .com/ locate / jhydro l
An ecohydrological modelling approach for assessinglong-term recharge rates in semiarid karsticlandscapes
Sergio Contreras a,*, Matthias M. Boer b, Francisco J. Alcala c,Francisco Domingo a, Monica Garcıa a, Antonio Pulido-Bosch d,Juan Puigdefabregas a
a Departamento de Desertificacion y Geoecologıa, Estacion Experimental de Zonas Aridas, Consejo Superior deInvestigaciones Cientıficas, C/Gral. Segura 1, 04001 Almerıa, Spainb Ecosystems Research Group, School of Plant Biology, The University of Western Australia, 35 Stirling Highway,Crawley 6009, WA, Australiac Departamento de Fısica Aplicada, Universidad de Almerıa, Carretera Sacramento s/n, 04120 Almerıa, Spaind Departamento de Hidrogeologıa y Quımica Analıtica, Universidad de Almerıa, Carretera Sacramento s/n,04120 Almerıa, Spain
Received 12 April 2007; received in revised form 4 October 2007; accepted 16 November 2007
00do
Ej
KEYWORDSAnnual water balance;Recharge;Semiarid region;NDVI;Hydrological equilibriumhypothesis
22-1694/$ - see front mattei:10.1016/j.jhydrol.2007.11
* Corresponding author. Preercito de los Andes, 950. 57E-mail address: sergio@ee
r ª 200.039
sent add00 San Lza.csic.e
Summary An ecohydrological water balance method based on the hydrological equilib-rium hypothesis was developed to estimate long-term annual recharge rates in semiaridkarstic landscapes. Recharge was predicted from the difference between long-termannual precipitation and evapotranspiration rates. A multiple regression interpolationapproach was used to compute precipitation. Evapotranspiration was quantified fromthe deviations between the observed local value of the normalised difference vegetationindex (NDVI) and, the predicted minimum and maximum NDVI values for two hydrologi-cally-well defined reference conditions representing the minimum and maximum vegeta-tion density given a local long-term water availability index. NDVI values for the referenceconditions (NDVImin and NDVImax) were estimated from an empirically-based boundaryanalysis. Evapotranspiration rates for the reference conditions were estimated using amonthly water budget model that integrates the roles of the soil water holding capacityand a climate-driven evaporative coefficient (k) representing the mean annual conduc-tance of the vegetation canopy. The methodology was tested in Sierra de Gador (SE
7 Elsevier B.V. All rights reserved.
ress: Grupo de Estudios Ambientales – IMASL, Universidad Nacional de San Luis and CONICET, Avda.uis, Argentina. Tel./fax: +54 2652 424740.s (S. Contreras).

An ecohydrological modelling approach for assessing long-term recharge rates in semiarid karstic landscapes 43
Spain), where predicted evapotranspiration and recharge rates compared well with localand regional scale estimates obtained from independent methods. A sensitivity analysisshowed that NDVImax and k are the parameters that mostly affect our model’s evapotrans-piration and recharge estimates.
ª 2007 Elsevier B.V. All rights reserved.
Introduction
A quantification of available water resources is a requisite forany water management plan. In semiarid regions where pre-cipitation is typically highly variable in space and time, thisquantification is difficult andmay be amajor source of uncer-tainty in the regional water balance. A primary goal of watermanagement plans is maintaining a long-term balancebetween groundwater consumption and recharge rates. Thisis particularly critical in those semiarid regions where keysocio-economic activities heavily rely on groundwater re-sources, such as in south-eastern Spain and other dry zonesof the Mediterranean Region (European Commision, 2000;Scanlon et al., 2006). Where groundwater resources areover-exploited, enhancing recharge rates may be one of aset of measures to re-establish sustainable water use.
The semiarid zones of the Mediterranean Basin are oftencharacterised by rugged topography. Favourable conditionsfor enhancing recharge in those landscapes are most likelymet in the mountainous headwater areas of the catchments(Wilson and Guan, 2004) where precipitation and diffuse re-charge rates are usually higher than in the lowlands. How-ever, quantification of recharge rates in headwater areasis difficult due to the high spatial and temporal variabilityof precipitation, the heterogeneity of terrain, soil and sur-face cover conditions, and a general scarcity of spatially ex-plicit data (Wilson and Guan, 2004). In spite of the fact thatthe vegetation is known to have strong control over localand regional water balances in dryland environments (Eagle-son, 2002; Scanlon et al., 2005) and the existence of well-established methodologies to quantify a range of vegetationattributes through remote sensing, the vegetation cover hasnot received enough attention in the regional hydrologicalmodelling exercises undertaken to underpin water manage-ment plans.
For its apparent simplicity, many of the existing methodsto estimate long-term recharge rates in semiarid mountain-ous regions are based on the soil water balance (e.g. Scanlonet al., 2002; Carter and Driscoll, 2006). In semiarid karsticlandscapes, where long-term surface runoff can be consid-ered negligible, recharge from infiltration of precipitation,also termed diffuse recharge, is essentially the residual be-tween precipitation (P) and evapotranspiration (E). Spatialestimates of P are usually computed from point measure-ments and well established spatial interpolation techniques(Tabios and Salas, 1985; Marquınez et al., 2003). However,the spatially-distributed estimation of E, which can be ashigh as 95% of P in semiarid regions (Wilcox et al., 2003), isdifficult and therefore subject to a high uncertainty.
Several models have been developed to estimate evapo-transpiration ranging from empirical or semi-empirical equa-tions (see review by Arora, 2002) to theoretical models basedon the Bouchet’s complementary relationship (Hobbins et al.,
2001) or ecohydrological equilibrium criteria (Eagleson, 1982;Neilson, 1995). Empirical models typically explain up to about70% of the evapotranspiration ratio (E/P), but uncertainty ofestimated evapotranspiration estimates tends to increasewith aridity (Milly, 1994; Zhang et al., 2001). Potential causesfor relatively poor performance of these models in arid envi-ronments include the assumed independence between actualand potential evapotranspiration (Hobbins et al., 2001) orfailure to take important climate or terrain attributes into ac-count (Potter et al., 2005). Physically-based water balancemodels (Eagleson, 1978; Milly, 1994) can be attractive touse in ungauged basins or in regions with scarcity of data,but often the complexity of the analytical solutions or exces-sive parameterization advises against their use. For example,attempts by Eagleson (1982) to simplify the complexity of hisphysically-based model (Eagleson, 1978) by incorporating theecological optimality hypothesis have been severely criti-cized in ecological terms by Kerkhoff et al. (2004).
The goal of the present study is to develop an ecohydro-logical modelling framework for assessing annual rechargerates across semiarid karstic mountainous landscapes. Theecohydrological water balance (EWB) model developed hereestimates recharge in an indirect way as the difference be-tween precipitation and evapotranspiration. Based on thehydrological equilibrium hypothesis (Nemani and Running,1989), which suggest that vegetation adjusts to maximizeits growth while minimizing water stress, the model uses aregionalized vegetation density index and basic climate attri-butes to drive a simple monthly water budget model. TheEWB model improves upon the empirical or semi-empiricalapproaches to estimating evapotranspiration based on theBudyko’s curve by incorporating the role of the vegetation,the soil, and the seasonality of the climate variables in thewater balance while avoiding the complexity that character-izes physically-based water balance models. The EWB modelwas developed and tested in a mountain range of SoutheastSpain (Sierra de Gador, Almerıa) over three years of contrast-ing annual precipitation (average, dry and wet). Predictedevapotranspiration and recharge rates were verified at dif-ferent spatial scales (plot and regional) using independentand complementary approaches. A sensitivity analysis wasperformed to assess the model’s sensitivity to variation inparameter values.
Theoretical framework
Rationale
Long-term water balance methods are based on the meanannual water balance equation which for a given soil volumecan be written as
P ¼ E þ R ð1Þ

Figure 1 Flow diagram of the methodological approach usedto estimate long-term annual evapotranspiration rates.
44 S. Contreras et al.
where P is the precipitation, E is the evapotranspiration andR represents the recharge, all in mm yr�1. This formulationassumes that long-term surface runoff and changes in thesoil water store are negligible, which is considered reason-able in semiarid karstic landscapes (Carter and Driscoll,2006). R is the fraction of precipitation available for waterproduction; it can be computed indirectly as the residual ofP and E.
In semiarid regions, where by definition the annual poten-tial evapotranspiration (Ep) exceeds the annual precipitation(P), the hydrological equilibrium hypothesis (Nemani andRunning, 1989) assumes a linear relationship between E,and the leaf area index (LAI) for values below 4–5 m2 m�2:
E ¼ aLAIþ b ð2Þ
where a and b are parameters that define two boundary orreference conditions. The parameter b corresponds to theevaporation from a site with no vegetation cover (LAI = 0)whereas the parameter a represents the rate of change ofE with respect to LAI. Both, a and b, are local parametersthat depend on climate and soil properties (e.g. soil waterholding capacity).
Eq. (2) has been found to hold by other authors for exper-imental and simulated data (Greenwood et al., 1985;Nemani and Running, 1989; Hoff and Rambal, 2003; Contre-ras, 2006); it constitutes the cornerstone of our EWB model.From the hydrological equilibrium hypothesis, it followsthat the mean long-term water balance can be assessedby quantifying the deviation of observed LAI values fromtwo boundary LAI values that correspond to hydrologically-defined reference conditions, namely
E ¼ Emax � Emin
LAImaxLAIþ Emin ð3Þ
where Emax and Emin are the long-term evapotranspirationrates in mm yr�1 for a site with a maximum leaf areaindex, LAImax, and for a site with no vegetation (LAI = 0),respectively.
As ground-based measurements of LAI are unaffordablefor areas of regional extent, remote sensing is the preferredmethod to quantify vegetation density. The normalized dif-ference vegetation index (NDVI) is one of the most commonlyused spectral vegetation indices; it has a demonstratedcapacity as an indicator of physiological and structural vege-tation properties including LAI (Pettorelli et al., 2005). Sev-eral authors have demonstrated that the relationshipbetween LAI and NDVI can be considered linear for ecosys-tems with low LAI values (Turner et al., 1999; Soudaniet al., 2006) such as those found in semiarid Mediterraneanlandscapes with typical LAI values of 1.0–1.5 m2 m�2 or less(Myneni et al., 2002). According to those results, we can sub-stitute the linear relationship between LAI and NDVI for LAI inEq. (3)
E ¼ ðEmax � EminÞNDVI� NDVImin
NDVImax � NDVIminþ Emin ð4Þ
where the paired values (NDVImin, Emin) and (NDVImax, Emax)correspond to NDVI and E values for the two boundary/ref-erence conditions defined above.
Modelling procedure
To apply Eq. (4) over a study area we take a four-step ap-proach (Fig. 1): (i) firstly, an index of long-term water avail-ability is computed that represents the averaged localclimate conditions for plant growth; (ii) using the local soilmoisture availability index as a predictor variable, vegeta-tion density values representing two reference conditions,NDVImax and NDVImin, are estimated for each grid cell; (iii)in the next step, reference values of annual evapotranspira-tion rates, Emax and Emin, are estimated and associated toeach simulated reference vegetation cover condition and;(iv) finally, the long-term evapotranspiration rate is com-puted for every grid cell as the deviation between theobserved local vegetation density (NDVI) and the two setsof reference values (NDVImax, Emax) and (NDVImin, Emin)defined in steps (i) and (ii).
To estimate NDVImax and NDVImin values, we follow Boerand Puigdefabregas’ (2003) empirical approach based on aregional boundary analysis between observed NDVI valuesand Specht’s evaporative coefficient, k (Specht, 1972; Spechtand Specht, 1989), which is in our case used as the long-termwater availability index. The evaporative coefficient k isdefined (Specht, 1972) to set the maximum monthly evapo-transpiration rate that allows an evergreen perennial vegeta-tion cover to thoroughly use the local water resourceswithout ever completely depleting the soil moisture store.In ecophysiological terms, k can be interpreted as an indica-tor of the maximum long-term canopy conductance, gc, andcan therefore be expected to be closely related to LAI (Jones,1992). Specht and Specht (1989) showed k to be strongly cor-related to LAI of evergreen perennial vegetation communi-ties in Australia, while Boer and Puigdefabregas (2003,2005) demonstrated its suitability as a predictor of potentialvegetation density in semiarid Mediterranean environments.An additional advantage of using k as a long-termwater avail-ability index, rather than for example the aridity index Ep/P,is the fact that the evaporative coefficient incorporates theseasonality of P and Ep. Specht’s k is computed from monthlyprecipitation and potential evapotranspiration records usinga simple water budget model (Fig. 2A) and two simplifyingassumptions: (i) a non-limiting water holding capacity, suchthat all local rainfall is stored in the soil and losses due to

Figure 2 (A) Specht (1972) hydrological budget model to calculate the evaporative coefficient k; (B) modified Specht’shydrological budget model to calculate annual evapotranspiration for the boundary/reference conditions. P: precipitation; Ep:potential evapotranspiration; E: evapotranspiration; W and S represent the soil moisture content at the initial and final monthlyperiod. S0: initial soil moisture content, in mm. Smin: minimum soil moisture content required in the root zone to guarantee thesurvival of the vegetation, in mm.
An ecohydrological modelling approach for assessing long-term recharge rates in semiarid karstic landscapes 45
lateral or deep drainage are neglected, (ii) an evergreenperennial vegetation cover that ‘aims’ at optimising meanannual rather than short-term water uptake (i.e. conserva-tive water-use). By assuming a non-limiting soil water holdingcapacity we use the evaporative coefficient as a climateindex (Boer and Puigdefabregas, (2003, 2005)) and deviatefrom Specht’s original approach (Specht, 1972). The parame-ter Smin in Fig. 2A represents the minimum soil moisture con-tent required in the root zone to guarantee the survival of thevegetation. The computation of k starts by assuming a smallinitial value for k and increasing that value until the waterbalance shows the soil moisture content in the driest monthto be equal to Smin, which we arbitrarily set at 1 mm. Boerand Puigdefabregas (2003, 2005) estimated the NDVI refer-ence values (NDVImax, NDVImin) from two functions fitted tothe boundaries of the data envelop formed by the computedvalues of Specht’s evaporative coefficient k and the percen-tile NDVI values observed for a large sample of grid cells with-out water inputs by irrigation, runon or groundwaterinfluence. Based on these considerations, we are confident
that the grid cells from which the NDVI reference valuesare derived correspond to sites where vegetation cover isnear the maximum or minimum density given the long-termlocal P and Ep.
Conventional simple monthly soil water budget modelscan be employed to calculate Emax and Emin values usingprecipitation, potential evapotranspiration and soil waterholding capacity as input variables. These bucket modelshave shown their efficiency in reproducing the seasonaland interannual water balance in semiarid regions and areconsidered suitable for estimating long-term mean annualevapotranspiration rates (Milly, 1994; Farmer et al., 2003).In this study, we modified the procedure schematized inFig. 2A by assigning particular values of the soil water hold-ing capacity (SWHC) to the two reference conditions(Fig. 2B). In this second step, we limit the plant-availablesoil water by specifying a value for the SWHC, which is com-puted as the difference between the volumetric watercontents at matrix potentials of �33 kPa and �1.5 MPa inte-grated over the soil profile depth.

46 S. Contreras et al.
Material and methods
Study area
The study area is located in the South East of the IberianPeninsula (Fig. 3). It is characterized by strong relief withelevations ranging from sea level up to 3342 m.a.s.l. inSierra Nevada. The rugged topography is responsible forstrongly contrasting precipitation and temperature regimes.Annual precipitation is lowest in the Tabernas desert(i.e. <200 mm yr�1) and highest in the mountains (i.e.400–700 mm yr�1), where it sustains forest growth. Twogeological complexes belonging to the Betic Domain arerepresented in the study area: the Alpujarride Complexand the Nevado–Filabride Complex. In the former, whichcomprises Sierra de Gador and Sierra de las Estancias, thepermeable lithologies (limestones and dolomites) are betterrepresented than in the latter (mainly micaschists) whichappears in Sierra Nevada and Sierra de los Filabres. Thesemountain ranges are deeply dissected by three permanentrivers (Rıo Andarax, R. Adra and R. Guadalfeo from East toWest) and other ephemeral rivers or ramblas (e.g. Ramblade Tabernas, Rambla de Nacimiento). Perennial streamsare sparse in the region and are associated with snowmeltin the high elevations of Sierra Nevada or the discharge frompermanent springs. The groundwater flow system can becompartmentalized into local and regional flow systemsdepending on tectonic and lithologic features. Usually theregional carbonate rock aquifers belonging to the Alpujar-ride Complex present a regional system of groundwater flow
Figure 3 Study area showing the Sierra de Gador contour (reddistribution of the totalising raingauges used to calculate the totasample sites (circles with arrows). Data pairs inside the dashed yelNumbers in boxes are in accordance with the number identificatioshown with a star.
with deeper phreatic levels and long residence times. How-ever, metapelitic lithologies are usually associated with lo-cal systems of groundwater flow controlled by a shallowrecharge–discharge interaction and shorter residencetimes.
Sierra de Gador is located in the centre of the study areajust west of the city of Almerıa (Fig. 3). It is a mountain rangereaching 2246 m.a.s.l. and consisting of a thick series of Tri-assic carbonate rocks (limestones and dolomites) that arehighly permeable and fractured with intercalated calcschistsof low permeability underlain by impermeable metapelites ofPermian age (Pulido-Bosch et al., 2000). The southern edgeof this mountain range is potentially the main source ofrecharge for the deep Triassic aquifers of Campo de Dalıas(Vallejos et al., 1997), a coastal plain with a highly profitablehorticulture and tourist industry (Pulido-Bosch et al., 2000).The current total groundwater extraction rate in Campo deDalıas is 130 hm3 yr�1, of which 110–115 hm3 yr�1 is ex-tracted from the deep Triassic aquifers (Pulido-Boschet al., 2000). The northern and eastern edges of Sierra deGador drain to the Andarax river basin while the westernedge drains to the Adra river basin.
Sierra de Gador and the surrounding area have a Mediter-ranean climate characterized by dry-hot summers andwet-mild springs, autumns and winters. There are strongaltitudinal gradients in annual precipitation and tempera-ture. Mean annual precipitation is 260 mm in Alhama deAlmerıa (520 m.a.s.l.) and approximately 650 mm near thesummit (2246 m.a.s.l.). Mean annual precipitation increasesby about 23 mm for every 100 m increase in elevation. Mean
line) and the main hydrological basins (white lines). Spatiall deposition of Cl (triangles) and of the non-modified rechargelow boxes are used jointly to estimate average recharge rates.n site in Table 2. The Llano de los Juanes experimental site is

An ecohydrological modelling approach for assessing long-term recharge rates in semiarid karstic landscapes 47
annual temperatures are 9 �C near the summit and 18 �Cat the foot of the range. The thermal gradient is about�0.4 �C/100 m.
Historically, especially during the 18th and 19th centu-ries, Sierra de Gador was subjected to an intense and wide-spread deforestation for ship construction and lead mining.As a consequence, the current vegetation cover is mostlysparse and soils are very thin and rocky. The main land cover(73% of Sierra de Gador) is a sparse perennial shrubland witha vegetation cover of less than 50% mixed with grasses, rockor bare soil. Agriculture, mostly in the form of rainfed treecrops, represents 9% of the area. The rest of the area is cov-ered with reforested pine woodlands (1%), shrublands withpines (15.5%) and other land cover uses (2.5%) (Junta deAndalucıa, 1999).
NDVI reference values
NDVI values were calculated from four Landsat7 ETM+images acquired for different seasonal periods representingboth maximum and minimum vegetation density (autumn,winter, spring and summer): path/row 199/34 and 200/34for 20/01/2000, 12/04/2001, 02/06/2002 and 06/09/2002.Images were rectified using (GPS-based) ground controlpoints, and topographically and atmospherically correctedusing a 30 m resolution digital elevation model (DEM) as de-scribed by Gonima and Alados (2003). The mean NDVI valuecomputed from the four images was used as indicator of theaverage vegetation density (Fig. 4A).
To compute continuous surfaces of k, Emax and Emin forthe study area we required input data layers of meanmonthly precipitation and potential evapotranspiration(Ep). The twelve monthly Ep surfaces were computed usingthe Hargreaves–Samani equation (Hargreaves and Samani,1982), which has been found to perform well in othersemiarid environments where meteorological informationis scarce (Gavilan et al., 2006). According to this method,Ep is calculated as
Ep ¼ nRa ðTavg þmÞ ðTmax � TminÞ0:5 ð5Þ
where Ra is the monthly solar radiation in equivalent evap-orated water-depth (mm month�1), Tavg is the monthlyaverage temperature (�C), Tmax and Tmin are the monthlymaximum and minimum average temperatures (�C) and mand n are regionally-calibrated parameters.
Different techniques were evaluated (multiple regres-sion, ordinary kriging, modified residual kriging, a minimumcurvature – spline interpolator and, multiple regressionwith interpolation of residuals with the spline interpolator)were used to generate mean monthly precipitation and tem-perature surfaces. Monthly rainfall and temperature seriesfrom a total of 35 and 16 meteorological stations close toSierra de Gador respectively, were selected in order toinvestigate spatial precipitation and temperature patterns.Additionally, an independent set of 10 additional meteoro-logical stations with short monthly data series were usedto test the accuracy of the methods employed. From allthe techniques tested, multiple regression yielded the bestoverall accuracy as quantified by smaller errors. Some geo-graphical and independent variables computed from the30 m DEM were tested in developing the multiple regressionequations used to estimate the monthly maps of precipita-
tion and temperature (Marquınez et al., 2003). Altitudeand, longitude in winter and distance to the coast or conti-nentality in summer, were the variables that explained thegreatest proportion of the observed variance in monthlyrainfall. Latitude and local aspect did not significantly in-crease the predictive power of the final regression equa-tions employed. Altitude was the only variable used togenerate the monthly surfaces of temperature. Surfacesfor monthly potential short wave radiation were computedfrom the DEM using POTRAD5 (van Dam, 2000).
Calibration of the Hargreaves–Samani equation wasbased on monthly Penman–Monteith reference evapotrans-piration values measured at 6 meteorological stations closeto Sierra de Gador over three years (i.e. January 2003–December 2005). The non-linear fitting procedure was basedon the least-squares criterion, resulting in values ofn = 0.00317 and m = 36.45 (R2 = 0.97, p < 0.001; standard er-ror = 8.6 mm). For detailed descriptions of the meanmonthly climate surfaces for Sierra de Gador, see Contreras(2006).
Finally, to identify the NDVI reference values the meanNDVI values were plotted against the evaporative coeffi-cient k for a large sample of grid cells (n = 140807), all inpositions that exclude water inputs by irrigation or by runonfrom areas upslope. The influence of regional groundwateron the productivity of the vegetation on the slopes is negli-gible because levels are too deep (Pulido-Bosch et al.,1991). To derive equations for the upper and lower bound-ary, interpreted as the maximum and minimum NDVI refer-ence values, the sample of 140807 grid cells was groupedinto 46 equal range intervals according to the k valuewith the exception of the first and the last interval. Wedefined the upper and lower boundaries of the data envelopby the 95th and 5th percentiles of the median NDVI and themiddle of the k interval for each sub-sample (Contreras,2006). Those percentile values are reasonable approxima-tions of the boundaries of the data envelop and make itpossible to minimize the influence of those ‘outlier’ gridcells, where our assumptions regarding vegetation-climaterelations may not hold.
The form of the two boundary functions consisted of asecond-order polynomial equation with a maximumthreshold
NDVIref ¼a k2 þ b k – c k 6 k
d k > k
(ð6Þ
where a, b and c are fitted parameters and d is the maxi-mum NDVIref value expected for each reference condition(NDVImin and NDVImax) once a k threshold, represented ask, is reached.
Evapotranspiration reference values
Reference evapotranspiration rates corresponding to theNDVI reference conditions were estimated for three hydro-logical years, representing dry, average and wet conditions,using the modified monthly water budget model initiallyproposed by Specht (1972) (Fig. 2B).
In order to choose the SWHC values corresponding to thereference conditions in Sierra de Gador, we used soil depthand water retention measurements extracted from an

Figure 4 (A) Mean annual NDVI; (B) evaporative coefficient, in mm�1; and (C) estimated mean annual evapotranspiration, inmm yr�1 for the Sierra de Gador study area.
48 S. Contreras et al.
existing database with more than 100 soil profiles describingtextural, chemical and hydraulic parameters and a digitisedsoil map representing different soil cartographic units(Oyonarte, 1992). No spatial correlation was found between
the characteristic SWHC values of the soil map units and thecorresponding average values of terrain attributes such aselevation, slope gradient or slope aspect. We thereforeassigned SWHC values to the reference situations that are

Table 1 Model parameters, range and reference values (‘standard condition’) for Sierra de Gador study area as used in thesensitivity analysis
Parameter value range Reference value Change in evapotranspiration
Min Max ±1% ±5%
Soil parametersSmin 1 25 1 +20.1 (�) +61.1 (�)SWHCmin (mm) 5 25 10 +13.6 (+) +78.3 (+)SWHCmax (mm) 60 150 75 +9.4 (+) +50.0 (+)
Climate parametersk (mm�1) 0.0027 0.0071 0.0050 +2.7 (+) +11.2 (+)
Vegetation parametersNDVImin 0.135 0.225 0.180 �5.9 (+) �25.7 (+)NDVImax 0.310 0.520 0.415 �1.3 (+) �8.0 (+)
Percentage changes in the model parameters that produces changes of 1% and 5% in the mean-averaged annual evapotranspiration fromthe ‘standard condition’. The sign of the change in the parameter is between parentheses.
An ecohydrological modelling approach for assessing long-term recharge rates in semiarid karstic landscapes 49
consistent with the generally degraded status of Sierra deGador and correspond to the most common soils in thearea, i.e. Typic Haploxerolls and Lithic Haploxerolls, withtypical depths of 40–50 cm (SWHC = 75 mm) and 10 cm(SWHC = 10 mm), respectively.
It should be noted that the evaporative coefficient k is anindicator of long-term bioclimatic conditions, in particularthe amount of climatically available moisture to evergreenplants (Specht, 1972; Specht and Specht, 1989). Therefore,k was assumed to remain constant while estimating Emax andEmin for the dry and wet hydrological years. To guarantee asteady state condition for the soil moisture content at thebeginning of the hydrological year the model was run for36 months (Fig. 2B).
To compute mean monthly precipitation surfaces charac-terizing dry and wet hydrological years, we proceeded inthree steps: (i) from the annual precipitation series for eachmeteorological station, we calculated the 25% and 75% val-ues as representative values for the dry and wet conditions;(ii) annual precipitation surfaces for those conditions werecomputed using a multiple regression model with the alti-tude, longitude and/or distance to the coast as independentvariables; (iii) finally, annual precipitation values were dis-tributed over the twelve months of the year according tothe mean fractions recorded in a particular meteorologicalstation during either dry (annual precipitation less thanthe 25% value) or wet (annual precipitation greater thanthe 75% value) hydrological years. We assume that monthlypotential evapotranspiration values for dry and wet hydro-logical years do not differ from those computed for long-term average conditions.
Sensitivity analysis
A sensitivity analysis was performed to assess the effects ofvariation in parameter values on model predictions of meanannual evapotranspiration rates. Following Finch (1998),these impacts are assessed relative to a ‘baseline’ outputvalue (Eref). In our study, Eref is computed as the spatially-averaged mean annual evapotranspiration rate calculatedfrom the same population sample of grid cells (n = 140807)used to estimate the NDVI in the reference conditions. Dur-
ing the assessment, one parameter is varied at a time. Sen-sitivity to a given parameter is assessed by plotting thechanges in the parameter versus the ratio between the mod-el output normalized by the ‘baseline’ value, Eref. Addition-ally, the percentage change in a parameter from theirreference value required to produce a 1% and 5% variationover the ‘baseline’ output value is calculated to allow fora simple comparison between the parameters. Although aone-at-a-time design does not allow assessment of the dis-tribution of possible output values, due to interactions be-tween the parameters, this approach was preferred overthe more complex and computationally more demandingglobal sensitivity analysis based on random sampling meth-ods (e.g. Monte-Carlo simulations). The model parameters,their reference values and the values ranges tested in thesensitivity analysis are listed in Table 1.
Verification procedures
The main result of the EWB model consists of long-term an-nual evapotranspiration rates. Assuming surface runoff isnegligible, recharge rates can be estimated in an indirectway as the difference between precipitation and evapo-transpiration. In order to assess the reliability of the model,the evapotranspiration or recharge rates were verified atdifferent spatial scales (plot and regional) using indepen-dent and complementary approaches. In complex arid andsemiarid landscapes, where quantifying recharge is difficultdue to scarcity of data, using more than one verificationtechnique is common and advisable (Scanlon et al., 2002).
Plot scale – the annual water balance at Llano de losJuanesModel predictions were compared with direct observationsof precipitation and evapotranspiration at the plot scale(i.e. 101–102 m). The instrumented site was located atLlano de los Juanes (Fig. 2), a relatively flat area at about1660 m.a.s.l., which is part of a much larger well-developedand dissected karstic plateau between 1400 and 1800 m.a.s.l.According to previous isotopic studies this morpho-struc-tural domain constitutes the main source of recharge tothe deep aquifers of Campo de Dalıas (Vallejos et al.,
50 S. Contreras et al.
1997). This makes Llano de los Juanes an adequate site forthe collection of hydrological observations and verificationof our model’s predictions. Annual precipitation and actualevapotranspiration were measured for two hydrologicalyears (2003/2004 and 2004/2005) in a flat area where sur-face runoff is negligible. Since March 2003, rainfall has beenmeasured with a normalized raingauge (Davis, model7852M) while actual evapotranspiration has been measuredby the Eddy covariance method. The measurement systemsconsists of a three-dimensional sonic anemometer (CSAT3,Campbell Scientific Inc., USA) for measuring the three com-ponents of the wind speed and a krypton hygrometer KH20(CSAT3, Campbell Scientific Inc., USA) for measuring thewater vapour concentration. Both devices are located on atower at 3 m above the ground surface. Eddy flux correc-tions for density perturbations (Webb et al., 1980) and coor-dinate rotation (Kowalski et al., 1997) were carried out inpost-processing. Hygrometer measurements were correctedfor absorption of radiation by oxygen, according to Tanneret al. (1993). Measurements were stored at 20 Hz in a Camp-bell CR23X data logger and averaged every 30 min. Accord-ing to the historical monthly precipitation data collected atthe nearby meteorological station of La Zarba (at 10.4 kmfrom the Llano de los Juanes field site), the hydrologicalyear 2003/2004 can be considered as an average year interms of total precipitation while 2004/2005 was a dry year.
Regional scale – estimating recharge using the chloridemass balance methodChloride is the most appropriate environmental tracer toestimate the recharge rate per unit area under a wide rangeof climatic conditions, especially in arid and semi-arid land-scapes (Wood and Sanford, 1995; Scanlon et al., 2006). Insteady state conditions and assuming that surface runofffrom recharge areas is negligible, the chloride-mass balancemethod assumes the conservation of mass between the in-put of atmospheric chloride to the soil profile, P Æ Cp, andthe output chloride flux through the upper part of the satu-rated zone in a regional or local system of groundwaterflow, R Æ Cr, for an annual period
P Cp ¼ R Cr; R ¼ Ap
Crð7Þ
Table 2 Bulk deposition of chloride (Ap, in g m�2 yr�1) and saturaannual recharge rate (R, in mm yr�1) using the chloride mass bala
Id Site Reference elevation (m.a.s.l.) Precip
Sampl
1 Adra (1) 5 Dec 02 Adra (2) 180 Aug 03 Almerıa 510 Feb 014 La Parra 840 Aug 05 Albunol 1200 Aug 06 Orgiva 1650 Feb 907 Celın 1950 Aug 08 Las Yeguas 2400 Mar 04
Location of sites appears in Fig. 3.a Data from Alcala (2006).
where R and P are the rates of recharge and precipitation,respectively, both inmm yr�1,Cp, andCr are theaverage chlo-ride concentrations in atmospheric bulk deposition (wet anddry) and groundwater recharge. Ap is the annual rate of atmo-spheric bulk deposition of chloride, in g m�2 yr�1, obtainedby cumulative samples of deposition over a specific intervalof time.
The knowledge of the enrichment chloride gradient withaltitude observed from precipitation and recharge waterslinked to a local system of groundwater flow allows estab-lishing a regional relationship between recharge andaltitude in the study area. Similar to Minor et al. (2007)an elevation-dependent chloride mass-balance approach(EDCMB) is established to obtain a spatially-distributed esti-mate of the altitude-dependent recharge rate for the studyarea that can be compared with the estimated rechargesurface derived from the EWB method.
To estimate Ap in Eq. (7), (5) totalising raingauges wereinstalled in the study region (Fig. 3). Total rainfall andatmospheric dust were sampled in time intervals of 2–3months from December 2002 to September 2006 (Table 2)and the chloride concentration of each sample was deter-mined using the high pressure liquid chromatography tech-nique. To complete the database three more Ap valueswere derived from a bibliographic review by Alcala (2006)(Table 2).
As for Ap, two data sources were used for the quantifica-tion of Cr. A set of groundwater samples was collected fromfour sites during the period March 2002–August 2004 andanother four appropriate Cr were found in the literature (Al-cala 2006) (Table 2). In order to minimise the modificationof the chloride local signature as a consequence of the mix-ing of recharge water coming from other altitudes, allthe groundwater samples were collected in springs with awell-defined recharge area and with discharges associatedto local systems of groundwater flow. Finally, correspondingAp and Cr values were found following criteria of proximityand similar altitude, geological setting, and effective con-nectivity between recharge and discharge areas. Using thepaired Ap–Cr values, Eq. (7) could be used to calculate an-nual recharge rates along a wide range of elevations.
The accuracy of the regional scale recharge rates pre-dicted by the EWB model was assessed by comparing them
ted zone chloride concentration (Cr, in mg L�1), and estimatednce method
itation Groundwater R
ing date Ap Sampling date Cr
2–Jan 04 7.91 Jun 02 697.0 11.34–Sep 06 5.00 Nov 03 249.4 20.1–Aug 02 5.30 Sep 92ª 135.0 39.34–Sep 06ª 2.13 Aug 04 27.4 77.74–Sep 06 1.59 Mar 99ª 17.0 93.5–Mar 91a 1.47 Jun 92ª 9.0 163.34–Sep 06 0.65 May 01ª 3.3 197.0–Sep 04ª 0.27 Mar 02 1.0 270.0

Table 3 Parameter values and statistics for the NDVIreference conditions
Parameter Upper boundary(NDVImax)
Lower boundary(NDVImin)
Value ± Error Std. Value ± Error Std.
An ecohydrological modelling approach for assessing long-term recharge rates in semiarid karstic landscapes 51
with the rates obtained from the EDCBM method. We usedthe altitude (or annual precipitation) as a common predictorfor both methods. Averaged annual recharge rates by rangesof altitude were calculated for both methods. Finally,stepwise linear regression models were fitted to the datain order to obtain empirical equations for the relationshipbetween altitude and estimated recharge rate.
a �71999.0 ± 7652.9 �44237.7 ± 5947.61b 867.514 ± 83.07 528.242 ± 64.56c �2.13265 ± 0.22 �1.34838 ± 0.17d 0.4805 0.2285k 0.00602 0.00597
No samples 46 46R2 0.90 0.84Error Std. 0.022 0.017MAE 0.015 0.014
MAE: mean absolute error.
Table 4 Spatially-averaged evapotranspiration values esti-mated in Sierra de Gador for three characteristic precipita-tion periods
Precipitationyear condition
Evapotranspiration(mm yr�1)
Evapotranspirationratio
Dry 231 ± 61 0.71 ± 0.13Average 284 ± 75 0.69 ± 0.13Wet 320 ± 84 0.65 ± 0.12
Evapotranspiration ratio is computed dividing the long-termannual evapotranspiration by the long-term annualprecipitation.
Results and discussion
Water balance and vegetation density
Fig. 4B shows the spatially distributed value of Specht’sevaporative coefficient, k. The values range from 0.0041mm�1 for the drier areas located in the north-eastern sectorto 0.0073 mm�1 on some north-facing slopes at higherelevations. The spatially-averaged value of k for Sierra deGador study area is 0.0050 mm�1. The mean annual NDVIvalues in Sierra de Gador range from 0.09 to 0.20 in areasof sparse vegetation or bare soil/rock to 0.40–0.50 in areasof dense vegetation. The highest values are frequent inreforested areas with values between 0.45 and 0.55 and,in irrigated fields where NDVI values were close to 0.70.Note that in this paper the evaporative coefficient k hasthe dimension of mm�1 rather than cm�1 as in previous workby Specht (1972) and Boer and Puigdefabregas (2003, 2005).
The scattergram of the observed mean annual NDVIvalues against the evaporative coefficient in Sierra de Gadoris shown in Fig. 5, while the values and statistics for all theparameters in Eq. (6) are presented in Table 3. The NDVImax
values estimated for the upper boundary range from 0.20 in
Figure 5 Scatterplot of k-NDVI values and boundary limits for the vegetation density reference conditions. Dashed lines representthe 95% predictions intervals.

52 S. Contreras et al.
the drier sites to a maximum value of 0.48 for sites with kvalues greater than 0.006 mm�1. These relatively lowNDVImax values fitted for the upper boundary are character-istic of the degraded low vegetation cover resulting fromwidespread deforestation for mining activities in the middleof 19th century. Another explanation for the relatively lowNDVImax values could be the predominantly karstified nature
Figure 6 Variation in normalised mean annual evapotranspiratNDVImax) and climate parameters (k). Data for the graphs are from
of the landscape which favours deep percolation throughdissolution cracks or fractures limiting the water availabilityto plants.
The NDVI values of the lower boundary (i.e. NDVImin, bareareas) range from 0.08 in the drier sites to 0.23 in the wet-ter ones, being similar to bare soil values reported by otherauthors (e.g. Kustas et al. 2000). The non-linearity observed
ion with soil (Smin, SWHCmin, SWHCmax), vegetation (NDVImin,the sensitivity analysis.
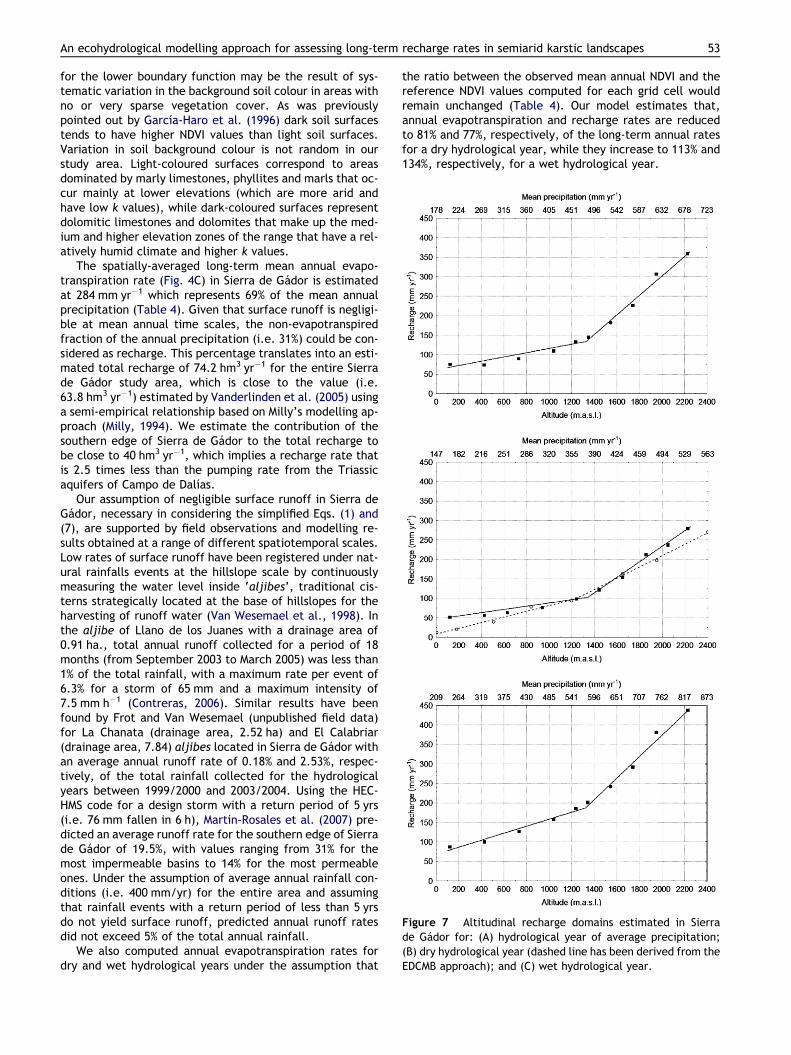
Figure 7 Altitudinal recharge domains estimated in Sierrade Gador for: (A) hydrological year of average precipitation;(B) dry hydrological year (dashed line has been derived from theEDCMB approach); and (C) wet hydrological year.
An ecohydrological modelling approach for assessing long-term recharge rates in semiarid karstic landscapes 53
for the lower boundary function may be the result of sys-tematic variation in the background soil colour in areas withno or very sparse vegetation cover. As was previouslypointed out by Garcıa-Haro et al. (1996) dark soil surfacestends to have higher NDVI values than light soil surfaces.Variation in soil background colour is not random in ourstudy area. Light-coloured surfaces correspond to areasdominated by marly limestones, phyllites and marls that oc-cur mainly at lower elevations (which are more arid andhave low k values), while dark-coloured surfaces representdolomitic limestones and dolomites that make up the med-ium and higher elevation zones of the range that have a rel-atively humid climate and higher k values.
The spatially-averaged long-term mean annual evapo-transpiration rate (Fig. 4C) in Sierra de Gador is estimatedat 284 mm yr�1 which represents 69% of the mean annualprecipitation (Table 4). Given that surface runoff is negligi-ble at mean annual time scales, the non-evapotranspiredfraction of the annual precipitation (i.e. 31%) could be con-sidered as recharge. This percentage translates into an esti-mated total recharge of 74.2 hm3 yr�1 for the entire Sierrade Gador study area, which is close to the value (i.e.63.8 hm3 yr�1) estimated by Vanderlinden et al. (2005) usinga semi-empirical relationship based on Milly’s modelling ap-proach (Milly, 1994). We estimate the contribution of thesouthern edge of Sierra de Gador to the total recharge tobe close to 40 hm3 yr�1, which implies a recharge rate thatis 2.5 times less than the pumping rate from the Triassicaquifers of Campo de Dalıas.
Our assumption of negligible surface runoff in Sierra deGador, necessary in considering the simplified Eqs. (1) and(7), are supported by field observations and modelling re-sults obtained at a range of different spatiotemporal scales.Low rates of surface runoff have been registered under nat-ural rainfalls events at the hillslope scale by continuouslymeasuring the water level inside ‘aljibes’, traditional cis-terns strategically located at the base of hillslopes for theharvesting of runoff water (Van Wesemael et al., 1998). Inthe aljibe of Llano de los Juanes with a drainage area of0.91 ha., total annual runoff collected for a period of 18months (from September 2003 to March 2005) was less than1% of the total rainfall, with a maximum rate per event of6.3% for a storm of 65 mm and a maximum intensity of7.5 mm h�1 (Contreras, 2006). Similar results have beenfound by Frot and Van Wesemael (unpublished field data)for La Chanata (drainage area, 2.52 ha) and El Calabriar(drainage area, 7.84) aljibes located in Sierra de Gador withan average annual runoff rate of 0.18% and 2.53%, respec-tively, of the total rainfall collected for the hydrologicalyears between 1999/2000 and 2003/2004. Using the HEC-HMS code for a design storm with a return period of 5 yrs(i.e. 76 mm fallen in 6 h), Martın-Rosales et al. (2007) pre-dicted an average runoff rate for the southern edge of Sierrade Gador of 19.5%, with values ranging from 31% for themost impermeable basins to 14% for the most permeableones. Under the assumption of average annual rainfall con-ditions (i.e. 400 mm/yr) for the entire area and assumingthat rainfall events with a return period of less than 5 yrsdo not yield surface runoff, predicted annual runoff ratesdid not exceed 5% of the total annual rainfall.
We also computed annual evapotranspiration rates fordry and wet hydrological years under the assumption that
the ratio between the observed mean annual NDVI and thereference NDVI values computed for each grid cell wouldremain unchanged (Table 4). Our model estimates that,annual evapotranspiration and recharge rates are reducedto 81% and 77%, respectively, of the long-term annual ratesfor a dry hydrological year, while they increase to 113% and134%, respectively, for a wet hydrological year.

54 S. Contreras et al.
Sensitivity analysis
Results of the sensitivity analysis are shown in Fig. 6. Modelparameters exerting most influence on the estimated meanannual evapotranspiration rates are NDVImax and k (Table 1).Model results are affected in a non-linear fashion by varia-tion in these parameters. The results of the sensitivity anal-ysis show, that in general model predictions are likely tohave greater uncertainty in the drier sectors of the studyarea (i.e. lower k and NDVImax). This result is consistent withthe conclusions drawn previously by Arora (2002) who statedthat the drier the site, the more sensitive its water balanceto variation in climate conditions.
Verification of model predictions
At the plot scale in Llano de los Juanes, our model estimateda mean annual evapotranspiration rate of 315 mm yr�1 whilethe actual evapotranspiration measured with the eddy corre-lation technique during the hydrological year 2003/2004 was307 mm yr�1, which is only 3% lower than the estimated va-lue. The observed evapotranspiration for the relatively dryyear 2004/2005 was 194 mm yr�1 while the estimated valuefrom the EWB model is 248 mm yr�1. The greater deviationbetween estimated and measured evapotranspiration ratesare probably due the extremely dry conditions prevailingduring that year. The total precipitation recorded duringthe 2004/2005 was only 210 mm yr�1, while we computedour evapotranspiration estimate for a dry year on the basisof an annual precipitation of 421 mm yr�1, correspondingto the 25% value of the average annual precipitation at Llanode los Juanes.
The regional altitude-recharge relationship for the studyarea using the EDCMB method is derived from the eight localrecharge estimates presented in Table 2 and is shown inFig. 7 jointly with the relationships extracted for Sierra deGador using the EWB method. Although non-linear relation-ships between annual recharge and altitude (or annual pre-cipitation) have been described and used as empiricalmethods by other authors in arid and semiarid landscapes(e.g. Hevesi et al., 2002) we only extract these regionalrelationships in Sierra de Gador for comparative purposesto assess the consistency of the EWB method. Table 5 showsthe total recharge rates estimated for Sierra de Gador usingboth methods as well as the different linear domains of an-nual recharge with altitude or annual precipitation. In bothcases there is a breakpoint in the recharge rate at about1200–1300 m.a.s.l. A preliminary assessment based on deu-
Table 5 Recharge-altitudinal gradients (Rg1 and Rg2, in mm/10different methods and for periods with different amount of preci
Method Precipitation year type Rg1 Rg2 Altitudinam.a.s.l.
EWB Dry 4.2 20.0 1340Average 5.5 25.0 1320Wet 9.0 27.5 1320
EDCMB Dry 7.3 14.5 1230a Estimated from the relationship found between annual precipitatio
terium excess values measured in composite bi-monthlyrainfall samples and recharge water collected in springs rep-resenting local recharge systems, suggests that this break-point might be associated with the origin of the frontal airmasses from which the precipitation falls (data not shown).The samples collected at altitudes greater than 1100–1200 m.a.s.l. show a isotopic composition that is typicalfor Mediterranean air masses as opposed to the samples col-lected at altitudes of less than 1100 m.a.s.l. which show thetypical isotopic signal of precipitation falling from Atlanticair masses. In addition to the higher mean annual precipita-tion rates at high altitudes and the generally greater rainfallintensities during rainfall events associated with Mediterra-nean air masses, the geomorphological and ecological con-ditions at higher altitudes (i.e. a relatively flat topographyassociated with the Sierra de Gador plateau and relativelylow vegetation cover due to deforestation practices duringthe XIX century) may also contribute to the observed altitu-dinal change in the mean annual recharge rate. A moreintensive field measurement campaign was initiated twoyears ago in order to confirm this hypothesis and to obtaina better understanding of the contribution of precipitationfrom Mediterranean and Atlantic air masses on the rechargeprocesses in the region.
Results from the application of the EDCBM approach areshown in Table 5. Total recharge estimated for Sierra de Ga-dor using the EWB approach is 57.6, 74.9 and 99.4 hm3 yr�1
for dry, average and wet hydrological years, respectively.The recharge rate computed using the EDCMB approach is53.6 hm3 yr�1, which is close to the recharge rate estimatedfor a dry hydrological year using the EWB method. The sim-ilarity between estimates suggests that the measured massfluxes of chloride in precipitation and groundwater sampleswere characteristic of dry conditions. This statement is con-sistent with the regional drought that the area is sufferingfrom 2002 until now (data not shown).
It is important to note that all Ap–Rc data pairs appliedto estimate recharge using the EDCMB approach were ob-tained from sites near to but outside the Sierra de Gadorstudy area. This is because the carbonated lithology domi-nating in Sierra de Gador favours deep phreatic levels andthe mixing of infiltration water recharged at different alti-tudes, which makes it difficult to find springs with dis-charges that are representative of local ground water flowsystems. For that reason, we have only used this methodas a first attempt to assess the reliability of our predictionsat the regional scale and the results should thus be inter-preted with caution. Currently, efforts are being made in
0 m) and total recharge estimated in Sierra de Gador usingpitation
l threshold Precipitationthreshold (mm yr�1)
Total recharge Sierrade Gador (hm3 yr�1)
379 54.7478 74.2574 99.9
360ª 53.6
n and altitude for a dry hydrological period.

An ecohydrological modelling approach for assessing long-term recharge rates in semiarid karstic landscapes 55
Sierra de Gador to identify suitable sites for expanding thesampling network of precipitation and local springs at dif-ferent altitudes.
Conclusions
This paper develops an ecohydrological approach based onthe hydrological equilibrium hypothesis to estimate spa-tially-distributed mean annual recharge rates in semiaridkarstic landscapes. Recharge (R) is quantified in an indirectway as the difference between precipitation (P) and evapo-transpiration (E). The model was tested in Sierra de Gador,a semiarid mountainous region located in south-easternSpain. Results are in agreement with annual evapotranspira-tion rates measured at the local scale with an eddy covari-ance system, and at the regional scale with recharge ratesderived from the application of the elevation-dependentchloride mass balance method.
Results from a sensitivity analysis show that model pre-dictions of mean annual evapotranspiration and rechargeare most sensitive to the NDVImax values that characterisethe reference condition of maximum vegetation density,and to the evaporative coefficient, k. There was also a gen-eral tendency for increasing sensitivity of model predictionswith increasing aridity. In Sierra de Gador, evapotranspira-tion was found to represent �69% of the long-term averageannual precipitation. The remaining fraction, correspondingto 74.2 hm3 yr�1, can be considered recharge. The annualrecharge rate is reduced by 23% relative to the mean annualrate for dry years and is increased by 34% for wet hydrolog-ical years. The long-term annual recharge rate estimatedfor the southern edge of Sierra de Gador represents abouthalf the pumping rate of ground water from the Triassicaquifers of Campo de Dalıas.
The EWB modelling framework has potential applicationsin other environments where: (i) mean annual potentialevapotranspiration exceeds mean annual precipitation (i.e.drylands), (ii) LAI is less than 4–5 m2 m�2, so that we can as-sume a linear relationship between NDVI and LAI, (iii) thevegetation largely consists of evergreen perennial vegeta-tion in agreement with assumptions underlying the evapora-tive coefficient k, and (iv) surface runoff represents a verysmall fraction of the mean annual water balance. However,estimating long-term recharge rates in non-karstic land-scapes may require quantification of surface runoff to closethe annual water balance. In general, our results with theEWB model are promising, but further research is nonethe-less required to verify and increase the predictive capacityof the model. Priorities for further work include: (a) compar-ing EWB estimates with other complementary and indepen-dent water balance approaches and; (b) increasing thetemporal resolution of the model, for example using a top-down approach (from long-term annual scale to daily tempo-ral scale) (e.g. Farmer et al., 2003).
Acknowledgments
The core of this research was performed thanks to a pre-doctoral FPU fellowship (AP2001-1357) awarded to the firstauthor and was developed in the framework of the RECLISE
(REN2002-04517-CO2), CANOA (CGL2004-04919-CO2-01/HID) and PROBASE (CGL2006-11619/HID), projects fundedby the Spanish Ministry of Education and Science, and IRA-SEM research contract signed with Agencia Andaluza delAgua – Junta de Andalucıa. Luis Villagarcıa, Alfredo Duran,Montserrat Guerrero and Miguel Angel Domene are acknowl-edged for their field assistance. We also acknowledge con-structive comments from Esteban Jobbagy and threeanonymous reviewers.
References
Alcala, F.J., 2006. Recharge to the Spanish aquifers using hydrog-eochemical balances. Ph.D thesis, Universidad Politecnica deCataluna. Available online from http://www.tesisenxarxa.net/TDX-0607106-104930/ (in Spanish).
Arora, V.K., 2002. The use of the aridity index to assess climatechange effect on annual runoff. Journal of Hydrology 265, 164–177.
Boer, M.M., Puigdefabregas, J., 2003. Predicting potential vegeta-tion index values as a reference for the assessment andmonitoring of dryland condition. International Journal ofRemote Sensing 24, 1135–1141.
Boer, M.M., Puigdefabregas, J., 2005. Assessment of drylanddegradation condition using spatial anomalies of vegetationindex values. International Journal of Remote Sensing 26, 4045–4065.
Carter, J.M., Driscoll, D.G., 2006. Estimating recharge usingrelations between precipitation and yield in a mountainous areawith large variability in precipitation. Journal of Hydrology 316,71–83.
Contreras, S., 2006. Spatial distribution of the annual water balancein semiarid mountainous regions. Application to Sierra de Gador(Almerıa, SE Spain). Ph.D thesis, Universidad de Almerıa (inSpanish).
Eagleson, P.S., 1978. Climate, soil, and vegetation. WaterResources Research 14 (5), 705–775.
Eagleson, P.S., 1982. Ecological optimality in water-limited naturalsoil-vegetation systems. 1. Theory and hypothesis. WaterResources Research 18, 325–340.
Eagleson, P.S., 2002. Ecohydrology: Darwinian Expression of ForestForm and Function. Cambridge University Press, Cambridge.
European Commission, 2000. Directive 2000/60/EC the waterframework directive. Official Journal of the European Commu-nities, L 327/1.
Farmer, D.L., Sivapalan, M., Jothityangkoon, C., 2003. Climate, soiland vegetation controls upon the variability of water balance intemperate and semiarid landscapes: downward approach towater balance analysis. Water Resources Research 38 (2), 1035.doi:10.1029/2001WR000328.
Finch, J.W., 1998. Estimating direct groundwater recharge using asimple water balance model – sensitivity to land surfaceparameters. Journal of Hydrology 211, 112–125.
Garcıa-Haro, F.J., Gilabert, M.A., Melia, J., 1996. Linear spectralmixture modelling to estimate vegetation amount from opticaldata. International Journal of Remote Sensing 17, 3373–3400.
Gavilan, P., Lorite, I.J., Tomero, S., Berenjena, J., 2006. Regionalcalibration of Hargreaves equation for estimating reference ETin a semiarid environment. Agricultural Water Management 81(3), 257–281.
Gonima, L., Alados, L., 2003. Calculo de la reflectancia a partir dedatos de satelite: version alternativa. In: Garcıa Garcıa, F.,Berne Valero J.L. (Eds.), III Asamblea Hispano-Lusa de Geodesiay Geofısica, Editorial UPV, Valencia.
Greenwood, E.A.N., Klein, L., Beresford, J.D., Watson, G.D., 1985.Differences in annual evaporation between grazed pasture and

56 S. Contreras et al.
Eucalyptus species in plantations on a saline farm catchment.Journal of Hydrology 78, 261–278.
Hargreaves, G.H., Samani, Z.A., 1982. Estimating potential evapo-transpiration. ASCE Journal of Irrigation and Drainage Engineer-ing 108, 225–230.
Hevesi, J.A., Flint, A.L., Flint, L.E., 2002. Preliminary estimates ofspatially distributed net infiltration and recharge for the DeathValley region, Nevada-California. US Geological Survey Water-Resources Investigations Report 02-4010.
Hobbins, M.T., Ramırez, J.A., Brown, T.C., Claessens, L.H.J.M.,2001. The complementary relationship in estimation of regionalevapotranspiration: the complementary relationship arealevapotranspiration and advection-aridity models. WaterResources Research 37, 1367–1387.
Hoff, C., Rambal, S., 2003. An examination of the interactionbetween climates, soil and leaf area index in a Quercus ilexecosystem. Annals of Forest Science 60, 153–161.
Jones, H.G., 1992. Plants and Microclimate. A QuantitativeApproach to Environmental Plant Physiology. Cambridge Univer-sity Press, Cambridge.
Junta de Andalucıa, 1999. Usos y coberturas vegetales del suelo.CD-Rom.
Kerkhoff, A.J., Martens, S.N., Milne, B.T., 2004. An ecologicalevaluation of Eagleson’s optimality hypothesis. Functional Ecol-ogy 18, 404–413.
Kowalski, A.S., Anthoni, P.M., Vong, R.J., Delany, A.C., Maclean,G.D., 1997. Deployment and evaluation of a system for ground-based measurements of cloud liquid water turbulent fluxes.Journal of Atmospheric and Oceanic Technology 14, 468–479.
Kustas,W.P., Norman, J.M., Schumugge, T.J., Anderson, M.C., 2000.Mapping surface energy fluxes with radiometric temperature. In:Quattrochi, D.A., Luvall, J.C. (Eds.), Thermal Remote Sensing inLand Surface Processes. CRC Press, Florida, pp. 205–253.
Marquınez, J., Lastra, J., Garcıa, P., 2003. Estimation models forprecipitation in mountainous regions: the use of GIS andmultivariate analysis. Journal of Hydrology 270 (1–2), 1–11.
Martın-Rosales, W., Gisbert, J., Pulido-Bosch, A., Vallejos, A.,Fernandez-Cortes, A., 2007. Estimating groundwater rechargeinduced by engineering systems in a semiarid area (southeasternSpain). Environmental Geology 52, 985–995.
Milly, P.C.D., 1994. Climate, soil water storage, and the averageannual water balance. Water Resources Research 30, 2143–2156.
Minor, T.B., Russell, C.E., Mizell, S.A., 2007. Development of a GIS-based model for extrapolating mesoscale groundwater rechargeestimates using integrated geospatial data sets. HydrogeologyJournal 15, 183–195.
Myneni, R.B., Hoffman, S., Knyazikhin, Y., Privette, J.L., Glassy, J.,Tian, Y., Wang, Y., Song, X., Zhang, Y., Smith, G.R., 2002.Global products of vegetation leaf area and fraction absorbedPAR from year one of MODIS data. Remote Sensing of Environ-ment 83, 2–14.
Neilson, R.P., 1995. A model for predicting continental-scalevegetation distribution and water balance. Ecological Applica-tions 5, 362–385.
Nemani, R.R., Running, S.W., 1989. Testing a theoretical climate-soil-leaf area hydrologic equilibrium of forests using satellitedata and ecosystem simulation. Agricultural and Forest Meteo-rology 44, 245–260.
Oyonarte, C. 1992. Pedological study in Sierra de Gador (Almerıa).Assessment for forestry uses. Ph.D thesis, Universidad deGranada (in Spanish).
Pettorelli, N., Vik, J.O., Mysterud, A., Gaillard, J.M., Tucker, C.J.,Stenseth, N.C., 2005. Using the satellite-derived NDVI to assessecological responses to environmental change. Trends in Ecologyand Evolution 20, 503–510.
Potter, N.J., Zhang, L., Milly, P.C.D., McMahon, T.A., Jakeman,A.J., 2005. Effects of rainfall seasonality and soil moisture
capacity on mean annual water balance for Australian catch-ments. Water Resources Research 41, W06007. doi:10.1029/2004WR003697.
Pulido-Bosch, A., Navarrete, F., Molina, L., Martınez Vidal, J.L.,1991. Quantity and quality of groundwater in the Campo deDalıas (Almerıa, SE Spain). Water Science and Technology 14,87–96.
Pulido-Bosch, A., Pulido-Lebouf, P., Molina-Sanchez, L., Vallejos,A., Martın-Rosales, W., 2000. Intensive agriculture, wetlands,quarries and water management. A case study (Campo de Dalias,SE Spain). Environmental Geology 40 (1–2), 163–168.
Scanlon, B.R., Healy, R.W., Cook, P.G., 2002. Choosing appropriatetechniques for quantifying groundwater recharge. HydrogeologyJournal 10 (1), 18–39.
Scanlon, B.R., Levitt, D.G., Keese, K.E., Reedy, R.C., Sully, M.J.,2005. Ecological controls on water-cycle response to climatevariability in deserts. Proceedings of the National Academy ofScience 102, 2033–6038.
Scanlon, B.R., Keese, K.E., Flint, A.L., Flint, L.E., Gaye, C.B.,Edmunds, W.M., Simmers, I., 2006. Global synthesis of ground-water recharge in semiarid and arid regions. HydrologicalProcesses 20, 3335–3370.
Soudani, K., Francois, C., le Maire, G., Le Dantec, V., Dufrene, E.,2006. Comparative analysis of IKONOS, SPOT, and ETM+ data forleaf area index estimation in temperate coniferous and decid-uous forest stands. Remote Sensing of Environment 102, 161–175.
Specht, R.L., 1972. Water use by perennial evergreen plantcommunities in Australia and Papua New Guinea. AustralianJournal of Botany 20, 273–299.
Specht, R.L., Specht, A., 1989. Canopy structure in Eucalyptus-dominated communities in Australia along climatic gradients.Oecologica Plantarum 10, 191–202.
Tabios, G.Q., Salas, J.D., 1985. A comparative analysis of tech-niques for spatial interpolation of precipitation. WaterResources Bulletin 21, 365–380.
Tanner, B.D., Swiatek, E., Green, J.P., 1993. Density fluctuationsand use of the krypton hygrometer in surface flux measure-ments. In: Neale, C.M.U., Allen, R.G. (Eds.), Management ofIrrigation and Drainage Systems. ASCE, NY, USA, pp. 105–112.
Turner, D.P., Cohen, W.B., Kennedy, R.E., Fassnacht, K.S., Briggs,J.M., 1999. Relationship between leaf area index and Landsat TMspectral vegetation indices across three temperate zone sites.Remote Sensing of Environment 70, 52–68.
Vallejos, A., Pulido-Bosch, A., Martın-Rosales, W., Calvache, M.L.,1997. Contribution of environmental isotopes to the knowledgeof complex hydrologic systems. A case study: Sierra de Gador (SESpain). Earth Surface Processes and Landforms 22, 1157–1168.
van Dam, O., 2000. Modelling incoming potential radiation on a landsurface with PCRaster: POTRAD5.MOD manual. Utrech Centrefor Environment and Landscape Dynamics, Utrecht University.
Van Wesemael, B., Poesen, J., Sole-Benet, A., Cara Barrionuevo,L., Puigdefabregas, J., 1998. Collection and storage of runofffrom hillslopes in a semi-arid environment: geomorphic andhydrologic aspects of the aljibe system in Almeria Province,Spain. Journal of Arid Environments 40, 1–14.
Vanderlinden, K., Giraldez, J.V., van Meirvenne, M., 2005. Elbalance medio anual de agua en Andalucıa. In: Lopez Geta, J.A.,Rubio, J.C., Martın Machuca, M. (Eds.), V Simposio del Agua enAndalucıa, vol. I. IGME, Sevilla, pp. 259–269.
Webb, E.K., Rearman, G.I., Leuning, R., 1980. Correction of fluxmeasurements for density effects due to heat and water vapourtransfer. Quarterly Journal of the Royal Meteorological Society106, 85–100.
Wilcox, B.P., Seyfried, M.S., Breshears, D.D., 2003. The waterbalance on rangelands. In: Stewart, B.A., Howell, T.A. (Eds.),Encyclopedia of Water Science. Marcel Dekker, New York, pp.791–794.

An ecohydrological modelling approach for assessing long-term recharge rates in semiarid karstic landscapes 57
Wilson, J.L., Guan, H., 2004. Mountain-block hydrology andmountain-front recharge. In: Phillips, F.M., Hogan, J., Scanlon,B. (Eds.), Groundwater recharge in a desert environment: theSouthwestern United States, Water Science and ApplicationSeries, vol. 9. American Geophysical Union, Washington, D.C,pp. 113–137.
Wood, W.W., Sanford, W.E., 1995. Chemical and isotopic methodsfor quantifying ground-water recharge in arid and semi-aridenvironment. Ground Water 33 (3), 458–468.
Zhang, L., Dawes, W.R., Walker, G.R., 2001. Response of meanannual evapotranspiration to vegetation changes at catchmentscale. Water Resources Research 37, 701–708.