Climate Change and the Past, Present, and Future of Biotic Interactions
Upload
independentCategory
view
2download
0
This article was downloaded by: [Central Inland Fisheries Research Inst ]On: 15 January 2014, At: 22:34Publisher: Taylor & FrancisInforma Ltd Registered in England and Wales Registered Number: 1072954 Registeredoffice: Mortimer House, 37-41 Mortimer Street, London W1T 3JH, UK
Aquatic Ecosystem Health & ManagementPublication details, including instructions for authors andsubscription information:http://www.tandfonline.com/loi/uaem20
Spatio-temporal changes of hydro-chemical parameters in the estuarinepart of the River Ganges under alteredhydrological regime and its impact onbiotic communitiesR. K. Manna a , B. B. Satpathy a , C. M. Roshith a , M. Naskar a , UtpalBhaumik a & A. P. Sharma aa Central Inland Fisheries Research Institute , Barrackpore, Kolkata ,West Bengal , 700120 , IndiaPublished online: 11 Dec 2013.
To cite this article: R. K. Manna , B. B. Satpathy , C. M. Roshith , M. Naskar , Utpal Bhaumik & A.P. Sharma (2013) Spatio-temporal changes of hydro-chemical parameters in the estuarine part ofthe River Ganges under altered hydrological regime and its impact on biotic communities, AquaticEcosystem Health & Management, 16:4, 433-444
To link to this article: http://dx.doi.org/10.1080/14634988.2013.853596
PLEASE SCROLL DOWN FOR ARTICLE
Taylor & Francis makes every effort to ensure the accuracy of all the information (the“Content”) contained in the publications on our platform. However, Taylor & Francis,our agents, and our licensors make no representations or warranties whatsoever as tothe accuracy, completeness, or suitability for any purpose of the Content. Any opinionsand views expressed in this publication are the opinions and views of the authors,and are not the views of or endorsed by Taylor & Francis. The accuracy of the Contentshould not be relied upon and should be independently verified with primary sourcesof information. Taylor and Francis shall not be liable for any losses, actions, claims,proceedings, demands, costs, expenses, damages, and other liabilities whatsoever orhowsoever caused arising directly or indirectly in connection with, in relation to or arisingout of the use of the Content.
This article may be used for research, teaching, and private study purposes. Anysubstantial or systematic reproduction, redistribution, reselling, loan, sub-licensing,systematic supply, or distribution in any form to anyone is expressly forbidden. Terms &

Conditions of access and use can be found at http://www.tandfonline.com/page/terms-and-conditions
Dow
nloa
ded
by [
Cen
tral
Inl
and
Fish
erie
s R
esea
rch
Inst
] a
t 22:
34 1
5 Ja
nuar
y 20
14

Spatio-temporal changes of hydro-chemical parametersin the estuarine part of the River Ganges under altered
hydrological regime and its impact on biotic communitiesR. K. Manna,∗ B. B. Satpathy, C. M. Roshith, M. Naskar,
Utpal Bhaumik, and A. P. SharmaCentral Inland Fisheries Research Institute, Barrackpore, Kolkata, West Bengal 700120, India
∗Corresponding author: [email protected]
Hooghly estuary, the lowermost part of River Ganges in India, following the construction of Farakkabarrage in 1975, witnessed improved freshwater inflow in the estuarine stretch of the river with significantimpact on the salinity regime, water transparency, suspended sediments and nutrient load leading toalternations in the distribution and abundance of fish and other biotic organisms like plankton andbenthos. A detailed seasonal study was conducted in Hooghly estuary during 2010–2012 to evaluate thespatio-temporal changes in selected physico-chemical parameters like temperature, transparency, pH, freeCO2, dissolved oxygen, specific conductivity, total alkalinity, total hardness, salinity, available nutrientslike nitrate, phosphate and silicate under the present hydrological regime in determining the distributionof fish and other aquatic organisms. The salinity based zonation during pre-Farakka period apparentlystands modified with a downward shift of freshwater zone. Accordingly, distribution and abundance ofbiotic communities like plankton and fish now present a completely different scenario from the past.
Keywords: estuary, Ganga, Hooghly, hydrology, water parameters, Farakka barrage, fish species shift
[Supplementary materials are available for this article. Go to the publisher’s online edition of AquaticEcosystem Health and Management to view the free supplementary files.]
Introduction
Hooghly estuary, formed by Bhagirathi River, thefirst off-shoot of the River Ganga, lies approximately21◦31′ - 23◦20′N and 87◦45′ - 88◦45′E in West Ben-gal, India. This longest (∼295 km) estuary of Indiawas subjected to major human induced modifica-tion in 1975 through the construction of Farakkabarrage to divert a sufficient portion of Ganga wa-ter through Bhagirathi for keeping Kolkata portfunctional. The Farakka barrage on Ganga feedsBhagirathi-Hooghly River system through a 42 kmlong feeder canal, starting from Farakka joining
River Bhagirathi at Jangipur. On its way to sea,Hooghly estuary receives water from five major trib-utaries viz. Jalangi, Churni, Damodar, Rupnarayanaand Haldi. The estuary always attracted the atten-tion of researchers, especially during the last hun-dred years, who have contributed significantly to thefields of physical, chemical (including pollution),biological, and other important aspects related to theestuarine ecology. Important reports in the field ofhydrological parameters of selected centre(s) of theHooghly estuary are both pre- and post-Farakka bar-rage period (Bose, 1956; Basu et al., 1970; Nandyet al., 1983; Chakrabarti and Chattopadhyay, 1989;
433
Aquatic Ecosystem Health & Management, 16(4):433–444, 2013. Copyright C© 2013 AEHMS. ISSN: 1463-4988 print / 1539-4077 onlineDOI: 10.1080/14634988.2013.853596
Dow
nloa
ded
by [
Cen
tral
Inl
and
Fish
erie
s R
esea
rch
Inst
] a
t 22:
34 1
5 Ja
nuar
y 20
14

434 Manna et al. / Aquatic Ecosystem Health and Management 16 (2013) 433–444
Ghosh et al., 1989; Lal, 1990; Sen et al., 1994;Nath and De, 1996, 1998; Nath et al., 2004). Also,many published papers related to biology had a sig-nificant role in dealing with water parameters of aparticular centre or stretch (Roy, 1955; Shetty et.al., 1963; Saha et al., 1975; Mukhopadhyay andSaigal, 1986; Chakraborty et al., 1995; Mukhopad-hyay et al., 1995; Sinha et al., 1996, 1998; Das andSamanta, 2006, Nath and Banerjee, 2009; Choud-hury and Pal, 2011). The hydrological influencesdue to increased freshwater inflow from Farakkabarrage into the Hooghly estuary, induced signif-icant changes in the salinity regime, water trans-parency, suspended sediments and nutrient load etc.causing major alterations in the estuarine conditionsand the distribution and abundance of fish and otherbiotic organisms like plankton, benthos etc. Fewstudies have reported the impact of Farakka bar-rage on physico-chemical and biological aspects ofthe selected stretch or centres of the estuary anddetailed spatio-temporal studies of the water pa-rameters in the entire stretch of Hooghly estuaryare lacking. A detailed study was conducted in theestuary during 2010–2012 to evaluate the spatio-temporal changes in selected physico-chemical pa-rameters under the present hydrological regime.The variability of water parameters like salinity,temperature, transparency, pH, free CO2, dissolvedoxygen, specific conductivity, total alkalinity, totalhardness, biochemical oxygen demand, dissolvednutrients like nitrate, phosphate and silicate are de-scribed in the present article. Discussions have alsobeen made on the impact of changed hydrologicalregimes on plankton, fish and fisheries of Hooghlyestuary.
Material and Methods
Surveys were performed at eleven selectedsampling centers during 2010–2011 and twelvesampling centers (Nischintapur, a gradient zonesampling center was added) during 2011–2012 inpre-monsoon, monsoon and post-monsoon to un-derstand the present ecological status of Hooghlyestuary and its spatio-temporal variation (Figure 1).Water samples were collected at peak high tide(flood tide) and peak low tide (ebb tide) from thesurface and bottom. Analysis of water parameterswas performed using standard methods (APHA,1998). About a six hour tidal cycle was observed atFraserganj, a sea-mouth sampling centre, whereas at
Dakhineswar (Kolkata City sampling centre), floodtide was about 4 h and ebb tide was about 8 h.
Data on biotic communities viz. plankton, fishand fisheries in pre- and post-Farakka barrage pe-riod was collected from published literature and an-alyzed based on salinity distribution in pre- andpost-Farakka barrage period to understand impactof salinity on fish and fisheries.
For each parameter, one-way analysis of vari-ance (ANOVA) was conducted using SAS softwareto examine statistical significance of data acrosssites, zones and seasons. Hierarchical clusteringtechniques using Primer software was employed tounderstand present zonation in Hooghly estuary.
Results and Discussions
List of sampling centres in Hooghly estuary,their latitude, longitude, distance from sea, and riverwidth are given in Table S1. Data generated on se-lected parameters in sampling stations of Hooghlyestuary during 2010–2012 are analyzed to under-stand spatio-temporal changes which are describedbelow. Graphs are plotted using average data of fourvalues collected in a station in a particular day i.e.high tide surface, high tide bottom, low tide surfaceand low tide bottom. Salinity related parameters arereported to vary significantly between spring tideand neap tide especially at marine zone and gradi-ent zone sampling centres (Fraserganj to DiamondHarbour) (Nath and De, 1996, 1998). Also, diurnalvariation of those parameters is also significant onmany occasions (Basu and Ghosh, 1970). Averagedata along with standard deviation are presentedhere for all the parameters to explain the changebetween observations. Selected previous publisheddata of both pre- and post-Farakka barrage periodare also considered for discussion to understandtime scale changes and impact of human inducedmodification.
Water depth
Higher water depth (14–16 m) was recorded dur-ing our study at Diamond Harbour, probably due tothe impact of a tributary, River Rupnarayana, justupstream of the sampling centre (Figures S1 and S2in the online supplemental information). Low wa-ter depth at Kadwip and Fraserganj in marine zoneindicated that the significant part of estuary mouthis shallow in nature due to sedimentation. Due to
Dow
nloa
ded
by [
Cen
tral
Inl
and
Fish
erie
s R
esea
rch
Inst
] a
t 22:
34 1
5 Ja
nuar
y 20
14
Manna et al. / Aquatic Ecosystem Health and Management 16 (2013) 433–444 435
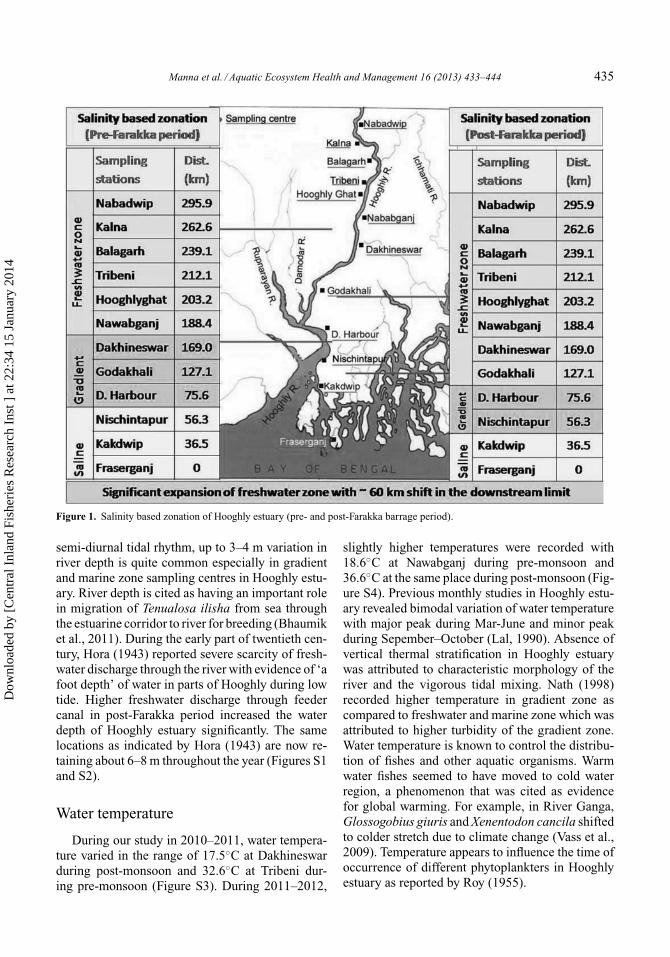
Figure 1. Salinity based zonation of Hooghly estuary (pre- and post-Farakka barrage period).
semi-diurnal tidal rhythm, up to 3–4 m variation inriver depth is quite common especially in gradientand marine zone sampling centres in Hooghly estu-ary. River depth is cited as having an important rolein migration of Tenualosa ilisha from sea throughthe estuarine corridor to river for breeding (Bhaumiket al., 2011). During the early part of twentieth cen-tury, Hora (1943) reported severe scarcity of fresh-water discharge through the river with evidence of ‘afoot depth’ of water in parts of Hooghly during lowtide. Higher freshwater discharge through feedercanal in post-Farakka period increased the waterdepth of Hooghly estuary significantly. The samelocations as indicated by Hora (1943) are now re-taining about 6–8 m throughout the year (Figures S1and S2).
Water temperature
During our study in 2010–2011, water tempera-ture varied in the range of 17.5◦C at Dakhineswarduring post-monsoon and 32.6◦C at Tribeni dur-ing pre-monsoon (Figure S3). During 2011–2012,
slightly higher temperatures were recorded with18.6◦C at Nawabganj during pre-monsoon and36.6◦C at the same place during post-monsoon (Fig-ure S4). Previous monthly studies in Hooghly estu-ary revealed bimodal variation of water temperaturewith major peak during Mar-June and minor peakduring Sepember–October (Lal, 1990). Absence ofvertical thermal stratification in Hooghly estuarywas attributed to characteristic morphology of theriver and the vigorous tidal mixing. Nath (1998)recorded higher temperature in gradient zone ascompared to freshwater and marine zone which wasattributed to higher turbidity of the gradient zone.Water temperature is known to control the distribu-tion of fishes and other aquatic organisms. Warmwater fishes seemed to have moved to cold waterregion, a phenomenon that was cited as evidencefor global warming. For example, in River Ganga,Glossogobius giuris and Xenentodon cancila shiftedto colder stretch due to climate change (Vass et al.,2009). Temperature appears to influence the time ofoccurrence of different phytoplankters in Hooghlyestuary as reported by Roy (1955).
Dow
nloa
ded
by [
Cen
tral
Inl
and
Fish
erie
s R
esea
rch
Inst
] a
t 22:
34 1
5 Ja
nuar
y 20
14

436 Manna et al. / Aquatic Ecosystem Health and Management 16 (2013) 433–444
Transparency/turbidity
During 2010–2011, pre-monsoon and monsoonsampling indicated high turbidity of water withSechhi depth at less than 20 cm in most sites;whereas during post-monsoon improvement in wa-ter transparency was noticed, especially in freshwa-ter zone and at Fraserganj in estuary mouth (Fig-ures S5 and S6). Similar higher transparency duringpost-monsoon i.e. winter months was recorded byearlier workers also (Gopalkrishnan, 1971; Nath,1998). During post-monsoon, transparency of gra-dient zone sampling centres like Diamond Har-bour and Nischintapur was lower as compared tofreshwater or marine zone. Similar observation oflower transparency in gradient zone was reportedby Nath (1998).Transparency/turbidity exerts influ-ence on prey-predator relationship of various groupsof fishes, thereby influencing the fish species as-semblage structure in natural aquatic ecosystems.Turbidity appeared to be inversely correlated withphytoplankton abundance in Hooghly estuary as re-ported by Roy (1955). Hooghly estuary is predomi-nantly turbid almost in all seasons, due to the natureof bottom sediment formed mainly by depositionof suspended silt carried by the river runoff fromlarge catchment areas and also due to the influenceof strong tidal action.
Water pH
Water pH was consistently alkaline in nature inHooghly estuary during our studies ranging from7.5 to 8.8, indicative of being congenial for survivaland growth of aquatic organism (Figures S7 andS8). Hooghly estuary was known to provide a goodbuffering environment by earlier workers (Nandyet al., 1983). The freshwater stretch showed higherpH during post-monsoon marking a relatively stableenvironment that promoted higher photosyntheticrate and thereby higher pH. Similar higher pH wasreported in freshwater zone of the Hooghly estuaryby Nath (1998). Previous reports also highlightedabout constant alkaline environment of Hooghlyestuary (Bose, 1956; Ray, 1981; Lal, 1990; Nath,1998). Lal (1990) was unable to find any impact ofFarakka barrage on water pH of Hooghly estuaryduring post-Farakka barrage period.
Free CO2
Trend of free CO2 was similar in both the yearswith higher values during monsoon and mostly ab-
sent during post-monsoon (Figures S9 and S10).Absence of free CO2 in post-monsoon during boththe years signifies the relatively stable environmentfor increased phytoplankton activity and thereby uti-lization of free CO2 from river water. On the otherhand, free CO2 was mostly present at all the sam-pling stations during monsoon. Overall, city stretchof Nawabganj to Diamond Harbour observed higherfree CO2 as compared to other zones showing theimpact of city effluents on Hooghly estuary. Nath(1998) recorded higher free CO2 in marine zone ascompared to gradient or freshwater zone in Hooghlyestuary, contrary to our observation.
Dissolved oxygen
During our study, dissolved oxygen of >5 mg l−1
was recorded in most of the occasions in Hooghly es-tuary to support survival and growth of aquatic biota(Figure S11 and S12). Significant improvement ofdissolved oxygen (4.7–10.6 mg l−1) in Hooghly es-tuary during post-Farakka barrage period was men-tioned by Nandy et al. (1983) as compared to thatin pre-Farakka barrage period (3.4–5.1 mg l−1) asreported by Bose (1956). Higher dissolved oxygen(8.5–11.5 mg l−1) in post-Farakka barrage period ascompared to pre-Farakka barrage period was alsoobserved by Lal (1990).
This may be attributed to high flow regime andlarge volume of freshwater discharge sufficient tooffset the impact of anoxic sewage loading fromcities and towns along its course. Violent tidal flowand mixing of large volume of water due to windand wave action may have induced sufficient dis-solved oxygen in Hooghly estuary. Post-monsoonwas characterized by significantly higher dissolvedoxygen especially in the freshwater zone. Similarobservation of higher dissolved oxygen in post-monsoon was reported by Kundu et al. (1996).Oxygen deficiency in Hooghly estuary during mon-soon was reported by Ghosh et al. (1991). Lower dis-solved oxygen was also recorded during monsoon.Higher dissolved oxygen was recorded in freshwa-ter zone as compared to gradient or marine zonesduring our study. Similar observation of higher dis-solved oxygen in freshwater zone was reported byNath (1998).
Specific conductivity (μS cm−1)
During our study, freshwater zone was charac-terized by significantly higher specific conductivity
Dow
nloa
ded
by [
Cen
tral
Inl
and
Fish
erie
s R
esea
rch
Inst
] a
t 22:
34 1
5 Ja
nuar
y 20
14

Manna et al. / Aquatic Ecosystem Health and Management 16 (2013) 433–444 437
during post-monsoon in both the years as com-pared to that in pre-monsoon and monsoon (Fig-ures S13 and S14). Higher freshwater dischargeduring monsoon reduced specific conductivity sig-nificantly in the entire estuary. During 2010–11,recorded specific conductivity range in Hooghly es-tuary was 177–40,000 μS cm−1, whereas slightlyhigher range of 205–43,300 μS cm−1 was recordedduring 2011–2012. Specific conductivity, an indica-tor of dissolved ions in water, signifies the mixingprocess influenced by tides and the magnitude ofintrusion of saline water vis-a-vis freshwater influxinto the estuary. Reduction of specific conductivityof water with monsoon rain was reported in large In-dian rivers like R. Brahmaputra (Manna and Sarkar,2008). Nandy et al. (1983) reported a sp. conductiv-ity range of 143–43,538 μS cm−1 in Hooghly estu-ary. Similar specific conductivity value of 40,400 μScm−1 was reported by Nath (1998) from Fraserganj.
Total alkalinity
Lower range of alkalinity (66–140 mg l−1 dur-ing 2010–2011 and 80–174 mg l−1 in 2011–2012)was recorded during our study in Hooghly estu-ary (Figures S15 and S16). As in our observation,Nath (1998) noted higher total alkalinity in fresh-water and gradient zone and recorded a range of103–139 mg l−1. As salinity increased, total alka-linity was observed to decrease (Ray, 1981). Post-monsoon was characterized by significantly highertotal alkalinity values especially in freshwater andgradient zones in our study. Before construction ofFarakka barrage, Basu (1965) reported a total al-kalinity range of 176–232 mg l−1 in Hooghly es-tuary. A significant decrease in total alkalinity inpost-Farakka barrage period (40–195 mg l−1) wasreported by Nandy et al. (1983) as compared tothat in pre-Farakka barrage period (102–357 mg l−1)as reported by Bose (1956). Lal (1990) also notedsimilar results during post-Farakka barrage period(75.85–146.66 mg l−1).
Total hardness
A wide range of 60–5000 mg l−1 of totalhardness during 2010–2011 and 70–5300 mg l−1
in 2011–2012 was recorded during our study inHooghly estuary (Figures S17 and S18). Hardnessof estuarine waters is the result of the mixing be-tween hard saline water from sea and softer fresh-water discharge from upstream. The measured val-
ues of hardness marked a sharp increase in gradientand marine zones from the values registered in thefreshwater zone. Pre-Farakka status of total hard-ness of Hooghly estuary was not available in theliterature. However, post-Farakka scenario of totalhardness along with calcium and magnesium wasreported by Nath (1998) and Nath et al. (2004).Calcium–magnesium ratio was observed to be re-versed, then progressing from freshwater to marinezone and may also be used to understand salinitypattern of Hooghly estuary.
Salinity
Significantly different values of salinities aregenerally observed at gradient and marine zonesampling centres between flood tide and ebb tidein a single day (Basu and Ghosh, 1970). Hence,graphs of spatio-temporal variation of salinity ob-served during 2010–2012 were plotted using meansalinity value along with standard deviation (Fig-ures 2 and 3). Salinity is the most important pa-rameter effectively controlling distribution of fishesand other aquatic organism in Hooghly estuary.Based on salinity, Hooghly estuary was demar-cated into zones both in pre- and post-Farakkabarrage period by researchers. During pre-Farakkabarrage period, due to lack of freshwater dis-charge, freshwater zone was small, stretching about110 km from Nabadwip to Nawabganj-Barrackpore.A salinity value 0.004–0.20 ppt (sometimes evenup to 1.16 ppt) was recorded at Barrackpore byDavid (1954) during pre-Farakka barrage period.However, increased freshwater inflow by water di-version through Farakka barrage changed the en-tire salinity scenario of the Hooghly estuary. Sim-ilar range of salinity that was observed by David(1954) at Barrackpore–Nawabganj region may nowbe found beyond Godakhali–Uluberia region, about60 km downstream. Nandy et al. (1983) suggestedthe need for redefining of zones in Hooghly estuaryconsidering the effect of Farakka barrage discharge.Lal (1990) mentioned about 45 km shifting offreshwater zone limit from Konnagar (22◦41′58′′N,88◦21′41′′E) to Uluberia (22◦28′02′′N, 88◦07′10′′E)in his study of the impact of Farakka barrage fresh-water discharge.
Again, there are difference of salinity betweenspring tide and neap tide in a lunar cycle of 15 days.An intensive study was conducted by Nath and De(1998) at Falta (a gradient zone sampling centre,80 km from sea mouth, between Godakhali and
Dow
nloa
ded
by [
Cen
tral
Inl
and
Fish
erie
s R
esea
rch
Inst
] a
t 22:
34 1
5 Ja
nuar
y 20
14

438 Manna et al. / Aquatic Ecosystem Health and Management 16 (2013) 433–444
Tab
le1.
Sal
init
y(p
pt)
ofse
lect
edsa
mpl
ing
stat
ions
inpr
e-an
dpo
st-F
arak
kaba
rrag
epe
riod
.
Dis
tanc
e(k
m)
036
.556
.375
.695
.712
7.1
169
188.
421
2.1
295.
9
Yea
rof
stud
yFr
aser
ganj
Kak
dwip
Kul
pi/
Nis
chin
tapu
rD
iam
ond
Har
bour
Falt
a/G
eokh
ali
Ulu
beri
a/G
odak
hali
Cal
cutt
a/D
akhi
nesw
arB
arra
ckpo
re/
Naw
abga
njT
ribe
niN
abad
wip
Ref
eren
ce
Pre
-Far
akka
barr
age
peri
od
Mar
ine
zone
Gra
dien
tzon
eFr
eshw
ater
zone
1953
–55
—1.
6–30
230.
5–19
0.5–
190.
5–5
Tra
ce-2
Tra
ceT
race
Bos
e,19
5619
60–6
1—
1.5–
32.8
—20
.212
.0—
0.2
——
She
tty
etal
.,19
63—
——
——
—7.
01.
00.
20.
2—
Bas
uet
al.,
1970
Fara
kka
barr
age
com
mis
sion
ing
on21
Apr
il19
75
Post
-Far
akka
barr
age
peri
od
Mar
ine
zone
Gra
dien
tzon
eFr
eshw
ater
zone
1975
–76
3.2–
29.2
4—
10.2
10.
379
—T
race
s—
—N
andy
etal
.,19
8319
76–7
72.
5–18
.0—
0.97
50.
118
—T
race
s—
—19
86–8
718
.63.
840.
040.
03C
hakr
abar
tian
dC
hat-
topa
dhya
y,19
8919
8619
.79–
28.5
7—
0.02
–1.8
5L
al,1
990
1993
–94
0.18
–4.0
80.
01–0
.06
Cha
krab
orty
etal
.,19
9519
93–9
721
.1–2
5.4
0.15
–1.4
20.
06–0
.13
0.04
–0.0
6N
ath,
1998
;N
ath
and
De,
1998
2010
–11
17.5
4–28
.07
5.43
–25
.54
—0.
38–1
.60
—0.
05–0
.06
0.06
0.05
0.05
0.05
Pre
sent
stud
y
2011
–12
9.12
–30
.38
0.77
–15
.09
0.19
–8.7
10.
19–2
.86
—0.
05–0
.07
0.06
0.05
0.05
0.05
Pre
sent
stud
y
Dow
nloa
ded
by [
Cen
tral
Inl
and
Fish
erie
s R
esea
rch
Inst
] a
t 22:
34 1
5 Ja
nuar
y 20
14

Manna et al. / Aquatic Ecosystem Health and Management 16 (2013) 433–444 439
Figure 2. Salinity (ppt) during 2010–2011.
Diamond Harbour) to see the impact of springtide (bore tide) and neap tide on different physico-chemical parameters. Previous studies in Hooghlyestuary indicated only one salinity peak dur-ing pre-monsoon months of March–June both inpre- and post-Farakka barrage period (Lal, 1990).
Mukhopadhyay and Saigal (1986) demonstrated thatthe distribution of a diatom, Coscinodiscus graniicould serve as a bioindicator for trends in the salin-ity regime in Hooghly estuary. Change in zonationbased on salinity in pre- and post-Farakka barrageperiod are given in Table 1.
Figure 3. Salinity (ppt) during 2011–2012.
Dow
nloa
ded
by [
Cen
tral
Inl
and
Fish
erie
s R
esea
rch
Inst
] a
t 22:
34 1
5 Ja
nuar
y 20
14
440 Manna et al. / Aquatic Ecosystem Health and Management 16 (2013) 433–444
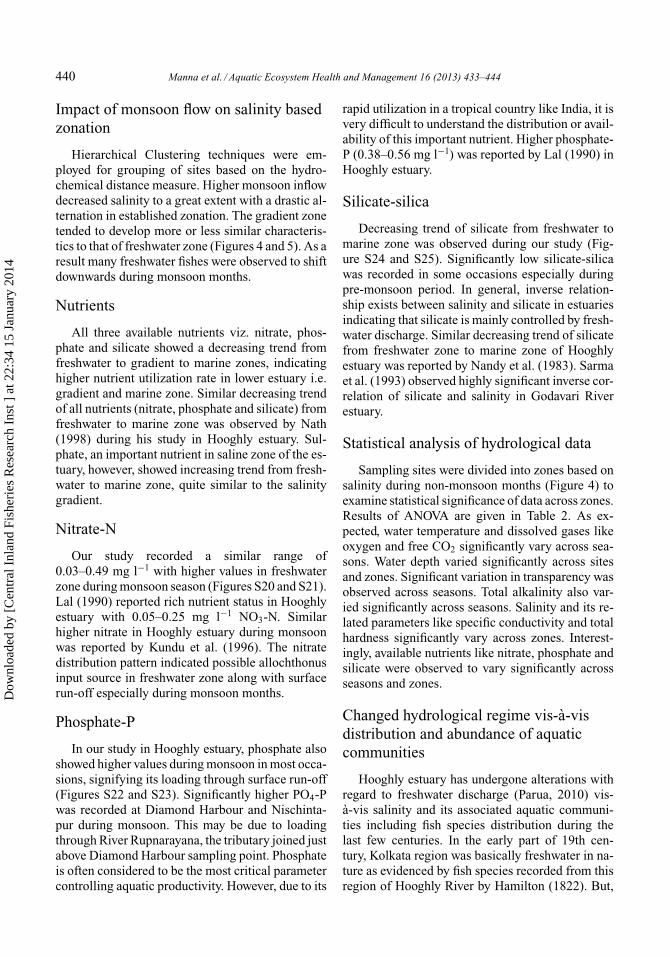
Impact of monsoon flow on salinity basedzonation
Hierarchical Clustering techniques were em-ployed for grouping of sites based on the hydro-chemical distance measure. Higher monsoon inflowdecreased salinity to a great extent with a drastic al-ternation in established zonation. The gradient zonetended to develop more or less similar characteris-tics to that of freshwater zone (Figures 4 and 5). As aresult many freshwater fishes were observed to shiftdownwards during monsoon months.
Nutrients
All three available nutrients viz. nitrate, phos-phate and silicate showed a decreasing trend fromfreshwater to gradient to marine zones, indicatinghigher nutrient utilization rate in lower estuary i.e.gradient and marine zone. Similar decreasing trendof all nutrients (nitrate, phosphate and silicate) fromfreshwater to marine zone was observed by Nath(1998) during his study in Hooghly estuary. Sul-phate, an important nutrient in saline zone of the es-tuary, however, showed increasing trend from fresh-water to marine zone, quite similar to the salinitygradient.
Nitrate-N
Our study recorded a similar range of0.03–0.49 mg l−1 with higher values in freshwaterzone during monsoon season (Figures S20 and S21).Lal (1990) reported rich nutrient status in Hooghlyestuary with 0.05–0.25 mg l−1 NO3-N. Similarhigher nitrate in Hooghly estuary during monsoonwas reported by Kundu et al. (1996). The nitratedistribution pattern indicated possible allochthonusinput source in freshwater zone along with surfacerun-off especially during monsoon months.
Phosphate-P
In our study in Hooghly estuary, phosphate alsoshowed higher values during monsoon in most occa-sions, signifying its loading through surface run-off(Figures S22 and S23). Significantly higher PO4-Pwas recorded at Diamond Harbour and Nischinta-pur during monsoon. This may be due to loadingthrough River Rupnarayana, the tributary joined justabove Diamond Harbour sampling point. Phosphateis often considered to be the most critical parametercontrolling aquatic productivity. However, due to its
rapid utilization in a tropical country like India, it isvery difficult to understand the distribution or avail-ability of this important nutrient. Higher phosphate-P (0.38–0.56 mg l−1) was reported by Lal (1990) inHooghly estuary.
Silicate-silica
Decreasing trend of silicate from freshwater tomarine zone was observed during our study (Fig-ure S24 and S25). Significantly low silicate-silicawas recorded in some occasions especially duringpre-monsoon period. In general, inverse relation-ship exists between salinity and silicate in estuariesindicating that silicate is mainly controlled by fresh-water discharge. Similar decreasing trend of silicatefrom freshwater zone to marine zone of Hooghlyestuary was reported by Nandy et al. (1983). Sarmaet al. (1993) observed highly significant inverse cor-relation of silicate and salinity in Godavari Riverestuary.
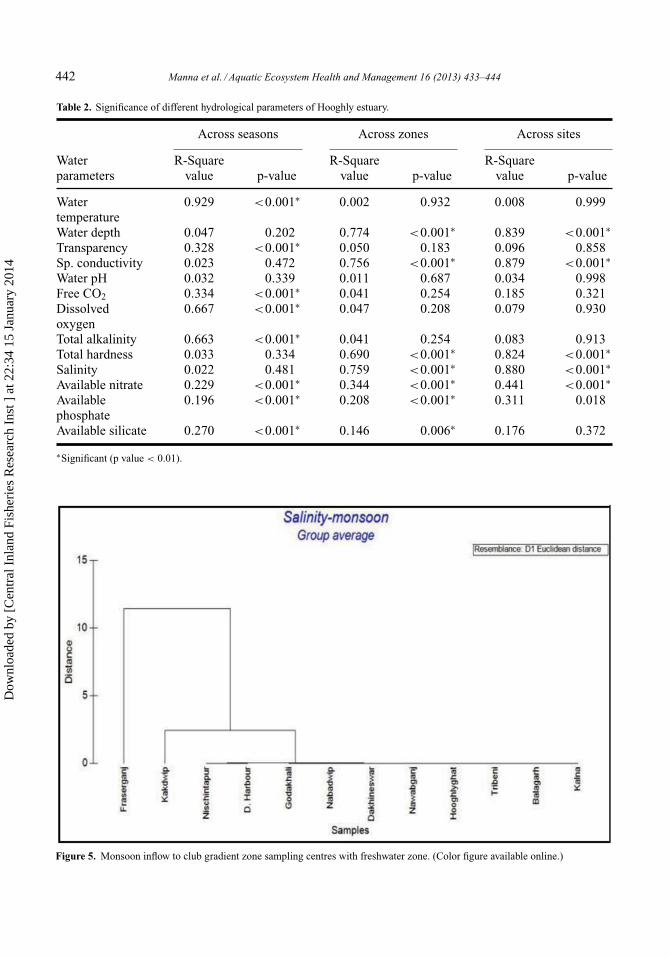
Statistical analysis of hydrological data
Sampling sites were divided into zones based onsalinity during non-monsoon months (Figure 4) toexamine statistical significance of data across zones.Results of ANOVA are given in Table 2. As ex-pected, water temperature and dissolved gases likeoxygen and free CO2 significantly vary across sea-sons. Water depth varied significantly across sitesand zones. Significant variation in transparency wasobserved across seasons. Total alkalinity also var-ied significantly across seasons. Salinity and its re-lated parameters like specific conductivity and totalhardness significantly vary across zones. Interest-ingly, available nutrients like nitrate, phosphate andsilicate were observed to vary significantly acrossseasons and zones.
Changed hydrological regime vis-a-visdistribution and abundance of aquaticcommunities
Hooghly estuary has undergone alterations withregard to freshwater discharge (Parua, 2010) vis-a-vis salinity and its associated aquatic communi-ties including fish species distribution during thelast few centuries. In the early part of 19th cen-tury, Kolkata region was basically freshwater in na-ture as evidenced by fish species recorded from thisregion of Hooghly River by Hamilton (1822). But,
Dow
nloa
ded
by [
Cen
tral
Inl
and
Fish
erie
s R
esea
rch
Inst
] a
t 22:
34 1
5 Ja
nuar
y 20
14

Manna et al. / Aquatic Ecosystem Health and Management 16 (2013) 433–444 441
Figure 4. Distinct cluster of freshwater, gradient and marine zone during pre-monsoon. (Color figure available online.)
due to rapid siltation and severely reduced fresh-water inflow during early part of the 20th cen-tury, the Calcutta region was totally brackish wa-ter in nature as indicated in the publications ofHora (1943) and Prashad (1937) and others. Hora(1943) mentioned about a probable bottom saltwedge in Hooghly estuary that may be responsi-ble for supporting of euryhaline fish species in zoneI (Barrackpore region) in pre-Farakka barrage pe-riod. However, intensive studies by David (1954)and Ghosh (2008) around Barrackpore area providean insight in understanding the impact of Farakkabarrage discharge. Just before the start of Farakkabarrage, Menon et al. (1972) predicted the replace-ment of estuarine forms by freshwater forms espe-cially in zone I (Nabadwip to Barrackpore) due todischarge from Farakka barrage. Shifting of salinitybased zonation can also be verified by the avail-ability of fish species. Increased freshwater inflowchanged fish assemblage pattern to a great extentin the entire estuary, especially in freshwater re-gion resulted in shifting of saline-water fish speciescloser to mouth. Previous studies are very few todelineate large scale changes of fish availability ordistribution pattern in entire Hooghly estuary. De-tailed stationwise distribution of fish species is notavailable in entire stretch in pre- or post-Farakkabarrage period. Only zone wise fish species avail-
ability is reported from time to time. Hence, it isdifficult to understand the distance of shifting of aparticular fish species in Hooghly estuary due toFarakka barrage discharge. Many euryhaline fishspecies which were recorded in upper estuarine zone(Nabadwip to Barrackpore) in pre-Farakka barrageperiod have now shifted downwards to an extentof at least 60–100 km. Some species like Polyne-mus paradiseus are still encountered in freshwa-ter zone but with highly reduced abundance. TableS2 and S3 depicts the post-Farakka barrage periodproduction of selected euryhaline fish as comparedto pre-Farakka period to understand the impact ofFarakka barrage. From a study in 12 km stretchin Barrackpore-Nawabganj area, Ghosh (2008) re-ported that as many as 29 fish species out of 82 fishspecies reported by David (1954) from the same areaof Barrackpore-Nawabganj stretch were affected bychanged hydrological regime. Just before initiationof Farakka barrage, Menon et al. (1972) prepareda list of 57 estuarine fish species predictably mostlikely to be disturbed due to altered hydrologicalregime with higher freshwater inflow. Again, inchanged hydrological regime, many of those eu-ryhaline species with distinct decline on catch inzone I and II, tended to increase significantly inthe marine zone catch (Nandy et al., 1983). Forexample, production of Polynemus paradiseus, a
Dow
nloa
ded
by [
Cen
tral
Inl
and
Fish
erie
s R
esea
rch
Inst
] a
t 22:
34 1
5 Ja
nuar
y 20
14
442 Manna et al. / Aquatic Ecosystem Health and Management 16 (2013) 433–444
Table 2. Significance of different hydrological parameters of Hooghly estuary.
Across seasons Across zones Across sites
Waterparameters
R-Squarevalue p-value
R-Squarevalue p-value
R-Squarevalue p-value
Watertemperature
0.929 <0.001∗ 0.002 0.932 0.008 0.999
Water depth 0.047 0.202 0.774 <0.001∗ 0.839 <0.001∗Transparency 0.328 <0.001∗ 0.050 0.183 0.096 0.858Sp. conductivity 0.023 0.472 0.756 <0.001∗ 0.879 <0.001∗Water pH 0.032 0.339 0.011 0.687 0.034 0.998Free CO2 0.334 <0.001∗ 0.041 0.254 0.185 0.321Dissolvedoxygen
0.667 <0.001∗ 0.047 0.208 0.079 0.930
Total alkalinity 0.663 <0.001∗ 0.041 0.254 0.083 0.913Total hardness 0.033 0.334 0.690 <0.001∗ 0.824 <0.001∗Salinity 0.022 0.481 0.759 <0.001∗ 0.880 <0.001∗Available nitrate 0.229 <0.001∗ 0.344 <0.001∗ 0.441 <0.001∗Availablephosphate
0.196 <0.001∗ 0.208 <0.001∗ 0.311 0.018
Available silicate 0.270 <0.001∗ 0.146 0.006∗ 0.176 0.372
∗Significant (p value < 0.01).
Figure 5. Monsoon inflow to club gradient zone sampling centres with freshwater zone. (Color figure available online.)
Dow
nloa
ded
by [
Cen
tral
Inl
and
Fish
erie
s R
esea
rch
Inst
] a
t 22:
34 1
5 Ja
nuar
y 20
14

Manna et al. / Aquatic Ecosystem Health and Management 16 (2013) 433–444 443
prized fish in Hooghly estuary, though decreased inzone I (from 5.7 t in 1966–1974 to 3.8 t 1984–1994),increased significantly in gradient and marine zones(Mukhopadhyay et al., 1995).
Some other euryhaline fish species which seemto have disappeared from zone I are Plotosus can-nius, Mystus gulio, Thryssa sp. (hamiltonii, purava),Caranx sp. etc. as reported by David (1954) fromBarrackpore region in pre-Farakka barrage period.Many freshwater fish species which were reportedonly from zone I during pre-Farakka barrage pe-riod are now available in much lower areas ofthe estuary. For example, species like Apocryptesbato, Goniolosa manminna, Labeo sp., Notopterusnotopterus, Nundus nandus, Puntius sp., etc. areavailable in Godakhali-Uluberia region signifyingat least 60 km shifting of freshwater zone towardsestuary mouth. A detailed account of distribution offish species in different sampling centres in freshwa-ter zone of Hooghly estuary is described by Roshithet al. (submitted).
Change in salinity regime has a visible impact ondistribution and abundance of aquatic communitieslike plankton. Plankton population apparently im-proved 3–5 times immediately after construction ofFarakka barrage as reported by Nandy et al. (1983).Gopalakrishnan (1971) reported on the ubiquity ofbrackishwater diatom, Coscinodiscus granii in en-tire Hooghly estuary during pre-Farakka barrageperiod, whereas their distribution was significantlyshifted downstream during post-Farakka barrage pe-riod (Mukhopadhyay and Saigal, 1986).
Conclusions
This study builds up a clear scenario aboutthe present ecosystem health status of the entireHooghly estuary with respect to fisheries under thepresent hydrological regime. Distribution of aquaticorganisms in the estuary may be better analyzedand interpreted based on the vital information fromthe present study. Knowledge about the time scalechanges of water quality, especially salinity, in theentire Hooghly estuary and its associated fishes willbe helpful in formulating future management strate-gies for this important estuary.
Acknowledgments
The authors are extremely grateful to technicalofficers and support staff viz., Mr. R. C. Mandi, C. N.
Mukherjee, D. Sanfui, A. Roy Choudhury, A. Mitra,A. Sengupta, B. N. Das, D. Saha, A. Barui, S. Man-dal, A. Prasad and D. Das for their help in samplingand analysis of samples collected from the estuary.Financial help from Indian Council of AgriculturalResearch, New Delhi is gratefully acknowledged.
ReferencesAPHA, 1998. Standard methods for the examination of water
and wastewater. 20th Edition. Jointly published by AmericanPublic Health Association, American Water Works Associa-tion and Water Environment Federation.
Basu, A. K., 1965. Observations on the probable effects of pollu-tion on the primary productivity of the Hooghly and Matlahestuaries. Hydrobiologia 25, 302–316.
Basu, A. K. and Ghosh, B. B., 1970. Observations on diurnal vari-ations in some selected stretch of Hooghly Estuary (India).Schweiz Z Hydrol. 32(1), 271–283.
Basu, A. K., Ghosh, B. B., Pal, R. N., 1970. Comparison ofthe Polluted Hooghly Estuary with the Unpolluted MatlahEstuary, India. Journal (Water Pollution Control Federation).42(10), 1771–1781.
Bhaumik, Utpal, Srivastava, N. P., Satpathy, B. B., Mukhopad-hyay, M. K. and Sharma, A. P., 2011. Impact of hydro-ecologyon fish migration in selected east coast estuaries. J. InlandFish. Soc. India. 43(1), 1–9.
Bose, B. B., 1956. Observations on the hydrology of the HooghlyEstuary. Indian Journal of Fisheries. 3, 101–118.
Chakrabarti, P. K. and Chattopadhyay, G. N., 1989. Impact ofFarakka barrage on the estuarine ecology of the Hooghly-Matlah system. In: A. G. Jhingran and V. V. Sugunan (Eds.),Conservation and management of Inland Capture FisheriesResources of India. pp. 189–196. Inland Fisheries Society ofIndia, Barrackpore.
Chakraborty, N., Chakrabarti, P. K., Vinci, G. K. and Sugunan,V. V., 1995. Spatiotemporal distribution pattern of certainplankton of river Hooghly. J. Inland Fish. Soc. India. 27(1),6–12.
Choudhury, A. K. and Pal, R., 2011. Variations in seasonal phyto-plankton assemblages as a response to environmental changesin the surface waters of a hypo saline coastal station alongthe Bhagirathi–Hooghly Estuary. Environ Monit Assess. 179,531–553.
Das, M. K. and Samanta, S., 2006. Application of an index of bi-otic integrity (IBI) to fish assemblage of the tropical HooghlyEstuary. Indian J. Fish. 53(1), 47–57.
David, A., 1954. A preliminary survey of the fish and fisheries ofa five mile stretch of Hooghly river near Barrackpore. IndianJ. Fish. 1(1 and 2), 231–255.
Ghosh, A., 2008. Present status of fish diversity in a 12 km stretchof the freshwater zone of the Hooghly Estuary. J. Inland Fish.Soc. India. 40 (Spl. 1), 60–66.
Ghosh, P. B., Kundu, S. K. and Choudhury, A., 1989. Physico-chemical characteristics of waters in the lower stretch ofthe Hooghly Estuary. J. Indian Soc. Coastal Agri Res. 7(1),41–48.
Dow
nloa
ded
by [
Cen
tral
Inl
and
Fish
erie
s R
esea
rch
Inst
] a
t 22:
34 1
5 Ja
nuar
y 20
14

444 Manna et al. / Aquatic Ecosystem Health and Management 16 (2013) 433–444
Ghosh, S. K., De, T. K., Choudhury, A. and Jana, T. K., 1991.Oxygen deficiency in Hooghly Estuary, east coast of India.Indian J. Mar. Sci. 20(3), 216–217.
Gopalakrishnan, V., 1971. The biology of the Hooghly-Matlahestuarine system (West Bengal, India) with special referenceto its fisheries. J. Mar. Biol. Ass., India. 13(2), 182–194.
Hamilton, F., 1822. An account of the fishes found in the riverGanges and its branches. Edinburgh Publishing Co., Edin-burgh.
Hora, S. L., 1943. Evidence of distribution of fishes regarding risein salinity of the river Hooghly. Current Science 3, 89–90.
Kundu, S. K., Lahiri, P. and Choudhury, A. 1996. A survey ofenvironmental features in a section of the Hooghly-Matlahestuarine system, West Bengal, India. Ecol. Env. Cons. 2,129–132.
Lal, B., 1990. Impact of Farakka barrage on the hydrologicalchanges and productivity potential of Hooghly Estuary. J.Inland Fish Soc. India. 22(1 and 2), 38–42.
Manna, R. K. and Sarkar, A., 2008. Seasonal variation in se-lected physico-chemical parameters of river Brahmaputra atGuwahati. J. Inland Fish Soc. India. 40 (Spl. 1), 99–108.
Mukhopadhyay, M. K. and Saigal, B. N., 1986. Distribution ofCoscinodiscus granii and its possible use as bioindicator fordemarcating salinity regime in the Hooghly Estuary. J. InlandFish Soc. India. 18(1), 24–28.
Mukhopadhyay, M. K., Vass, K. K., Bagchi, M. M. and Mitra,P. M., 1995. Environmental impact on breeding biology andfisheries of Polynemus paradiseus in Hooghly-Matlah estu-arine system. Environ. Ecol. 13(2), 395–399.
Nandy, A. C., Bagchi, M. M. and Majumder, S. K., 1983. Eco-logical changes in the Hooghly Estuary due to water releasefrom Farakka barrage. Mahasagar. 16(2), 209–220.
Nath A. and Banerjee, S., 2009. Studies on the bottom faunaldiversity of Ganga river system in relation to water qualityadjacent to Serampore area, West Bengal. Asian FisheriesScience. 22, 21–26.
Nath, D., 1998. Zonal distribution of nutrients and their bearingon primary production in Hooghly Estuary. J. Inland Fish.Soc. India. 30(2), 64–74.
Nath, D. and De, D. K., 1996. Changes in the environmen-tal feature at the Hooghly Estuary in relation to bore tide.J. Inland Fish Soc. India. 28(2), 85–90.
Nath, D. and De, D. K., 1998. Preliminary studies on the changesin the physico-chemical characteristics of Hooghly Estuaryin relation to tides. J. Inland Fish. Soc. India. 30(2), 29–36.
Nath, D., Misra, R. N. and Karmakar, H. C., 2004. The Hooghlyestuarine system – ecological flux, fishery resources and pro-duction potential. Bulletin no. 130. Central Inland FisheriesResearch Institute, Barrackpore, India.
Parua, P. K., 2010. Decline of Bhagirathi-Hooghly channel. WaterScience and Technology. Library 64, 61–77.
Prashad, B., 1937. Biological investigation at the Pulta waterworks. Cal. Mun. Gaz. 1937 August 21st. 26, 537–542.
Ray, P., 1981. Impact of man on the Hooghly Estuary. In: C. K.Varshney (Ed.), Water pollution and management review, pp.79–120. Jawaharlal Nehru University, New Delhi.
Roy, H. K., 1955. Plankton ecology of the river Hooghly at Palta.Ecology 36(2), 169–175.
Saha, S. B., Ghosh, B. B. and Gopalkrishnan, B., 1975. Planktonof the Hooghly Estuary with special reference to salinity andtemperature. J. Mar. Biol. Ass. India., 17(1), 107–120.
Sarma, V. V., Sudhakar, U. and Varaprasad, S. J. D., 1993. Be-haviour of fluoride and dissolved silicon in Goutami Godavariestuarine environment. Mahasagar 26(2), 105–113.
Sen, M., Chakrabarty, A. K., Ghosh, A. K. and Bandyopadhyay,K. K., 1994. Water quality of the Hooghly: some aspects. SeaExplorers 1, 14–22.
Shetty, H.P.C., Saha, S.B. and Ghosh, B.B., 1963. Observa-tions on the distribution and fluctuations of plankton in theHooghly-Matlah estuarine system, with notes on their rela-tion to commercial fish landings. Indian Journal of Fisheries.8(2), 326–363.
Sinha, M., De, D. K. and Jha, B. C., 1998. The Ganga environ-ment and fishery. Central Inland Fisheries Research Institute,Barrackpore.
Sinha, M., Mukhopadhyay, M. K., Mitra, P. M., Bagchi, M. M.,Karamkar, H. C., 1996. Impact of Farakka barrage on thehydrology and fishery of Hooghly Estuary. Estuaries. 19(3),710–722.
Vass, K. K., Das, M. K., Srivastava, P. K. and Dey, S., 2009.Assessing the impact of climate change on inland fisheriesin river Ganga and its plains in India. Aquat. Ecosyst. HealthMgmt. 12(2), 138–151.
Dow
nloa
ded
by [
Cen
tral
Inl
and
Fish
erie
s R
esea
rch
Inst
] a
t 22:
34 1
5 Ja
nuar
y 20
14
Copyright © 2022 FDOKUMEN