Quantitative sub-surface and non-contact imaging using Scanning Microwave Microscopy
Upload
khangminh22Category
view
0download
0
Combined scanning probe microscopy and X-ray scattering instrument for in situ
catalysis investigations
Willem G. Onderwaater,1, 2 Peter C. van der Tuijn,1, 3 Rik V. Mom,1 Matthijs A.
van Spronsen,1, 4 Sander B. Roobol,1, 5 Amirmehdi Saedi,1 Jakub Drnec,2 Helena
Isern,2 Francesco Carla,2 Thomas Dufrane,2 Raymond Koehler,1 Bert Crama,1 I. M. N.
Groot,6, 1, a) Roberto Felici,2 and J. W. M. Frenken1, 7
1)Huygens-Kamerlingh Onnes Laboratory, Leiden University, P.O. Box 9504,
2300 RA Leiden, the Netherlands
2)European Synchrotron Radiation Facility, BP 220, F-38043 Grenoble Cedex 9,
France
3)Current address: Leiden Probe Microscopy B.V., J.H. Oortweg 19,
2333 CH Leiden, the Netherlands
4)Current address: Department of Chemistry and Chemical Biology,
Harvard University, Cambridge, Massachusetts 02138, United States
5)Current address: ASML Netherlands B.V., De Run 6501, 5504 DR Veldhoven,
the Netherlands
6)Gorlaeus Laboratories, Leiden University, P.O. Box 9502, 2300 RA Leiden,
the Netherlands
7)Current address: Advanced Research Center for Nanolithography, P.O. Box 93019,
1090 BA Amsterdam, the Netherlands
(Dated: 7 November 2016)
We have developed a new instrument combining a scanning probe microscope (SPM)
and an X-ray scattering platform for ambient-pressure catalysis studies. The two
instruments are integrated with a flow reactor and an ultra-high vacuum system that
can be mounted easily on the diffractometer at a synchrotron end station. This makes
it possible to perform SPM and X-ray scattering experiments in the same instrument
under identical conditions that are relevant for catalysis.
a)Electronic mail: [email protected]
1
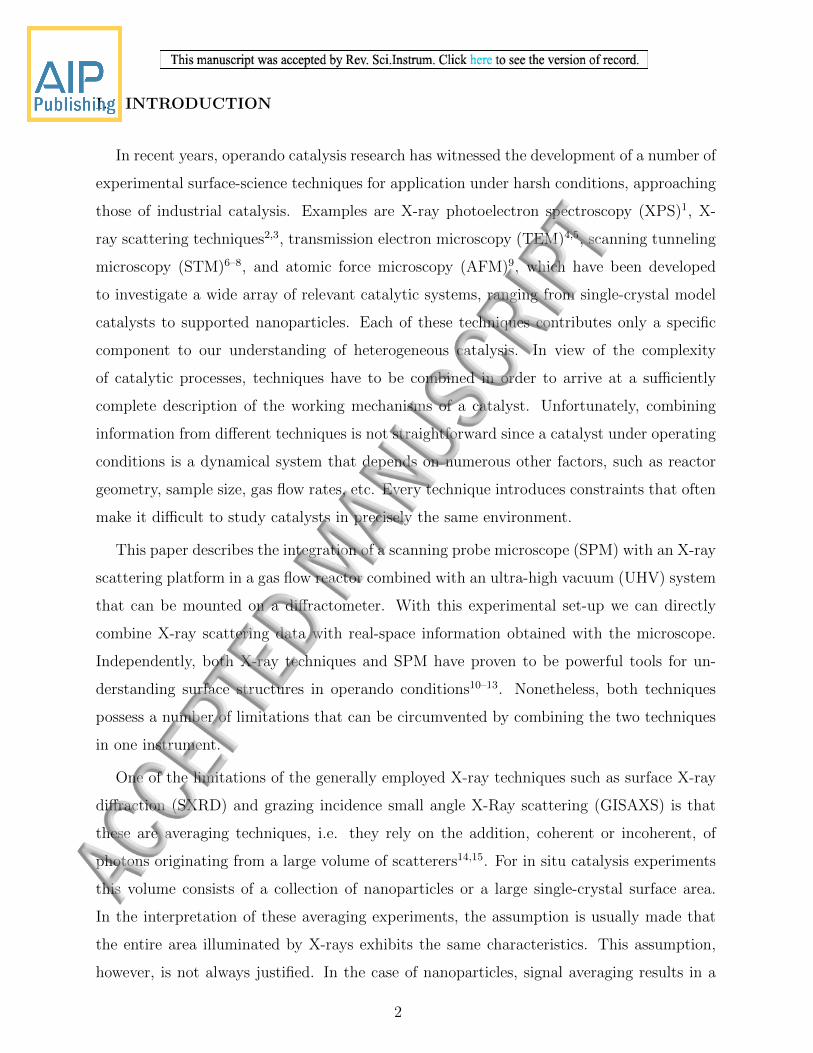
I. INTRODUCTION
In recent years, operando catalysis research has witnessed the development of a number of
experimental surface-science techniques for application under harsh conditions, approaching
those of industrial catalysis. Examples are X-ray photoelectron spectroscopy (XPS)1, X-
ray scattering techniques2,3, transmission electron microscopy (TEM)4,5, scanning tunneling
microscopy (STM)6–8, and atomic force microscopy (AFM)9, which have been developed
to investigate a wide array of relevant catalytic systems, ranging from single-crystal model
catalysts to supported nanoparticles. Each of these techniques contributes only a specific
component to our understanding of heterogeneous catalysis. In view of the complexity
of catalytic processes, techniques have to be combined in order to arrive at a sufficiently
complete description of the working mechanisms of a catalyst. Unfortunately, combining
information from different techniques is not straightforward since a catalyst under operating
conditions is a dynamical system that depends on numerous other factors, such as reactor
geometry, sample size, gas flow rates, etc. Every technique introduces constraints that often
make it difficult to study catalysts in precisely the same environment.
This paper describes the integration of a scanning probe microscope (SPM) with an X-ray
scattering platform in a gas flow reactor combined with an ultra-high vacuum (UHV) system
that can be mounted on a diffractometer. With this experimental set-up we can directly
combine X-ray scattering data with real-space information obtained with the microscope.
Independently, both X-ray techniques and SPM have proven to be powerful tools for un-
derstanding surface structures in operando conditions10–13. Nonetheless, both techniques
possess a number of limitations that can be circumvented by combining the two techniques
in one instrument.
One of the limitations of the generally employed X-ray techniques such as surface X-ray
diffraction (SXRD) and grazing incidence small angle X-Ray scattering (GISAXS) is that
these are averaging techniques, i.e. they rely on the addition, coherent or incoherent, of
photons originating from a large volume of scatterers14,15. For in situ catalysis experiments
this volume consists of a collection of nanoparticles or a large single-crystal surface area.
In the interpretation of these averaging experiments, the assumption is usually made that
the entire area illuminated by X-rays exhibits the same characteristics. This assumption,
however, is not always justified. In the case of nanoparticles, signal averaging results in a
2
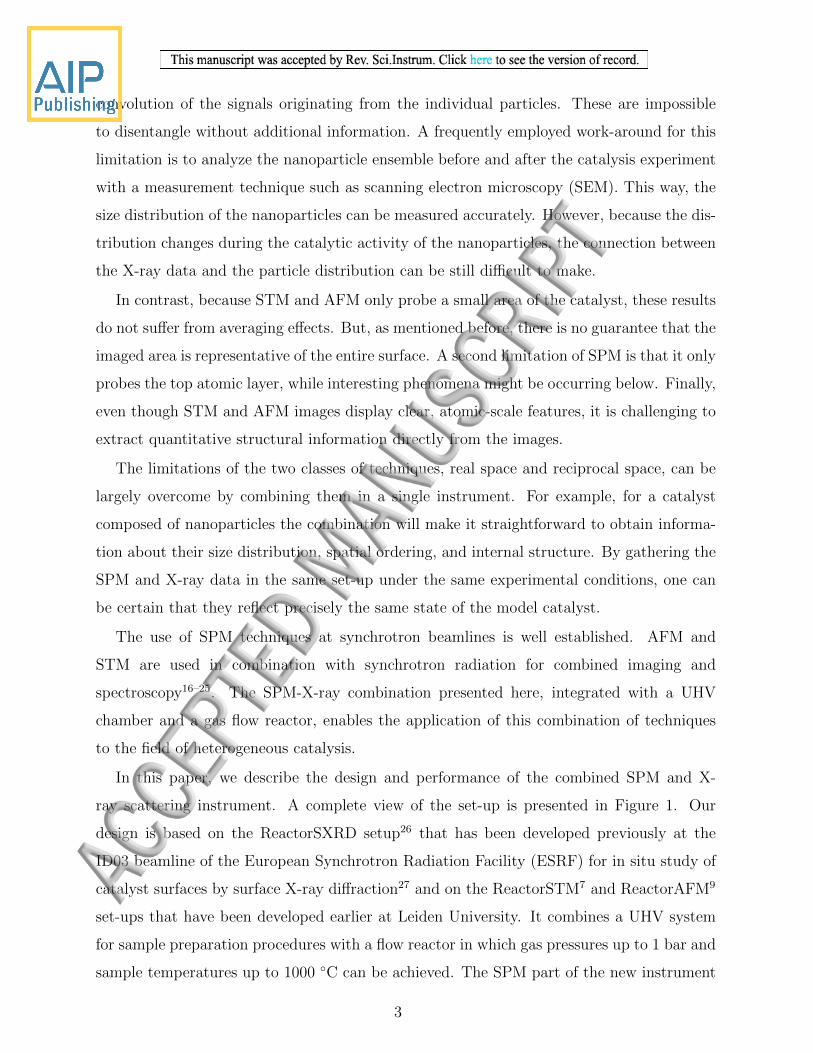
convolution of the signals originating from the individual particles. These are impossible
to disentangle without additional information. A frequently employed work-around for this
limitation is to analyze the nanoparticle ensemble before and after the catalysis experiment
with a measurement technique such as scanning electron microscopy (SEM). This way, the
size distribution of the nanoparticles can be measured accurately. However, because the dis-
tribution changes during the catalytic activity of the nanoparticles, the connection between
the X-ray data and the particle distribution can be still difficult to make.
In contrast, because STM and AFM only probe a small area of the catalyst, these results
do not suffer from averaging effects. But, as mentioned before, there is no guarantee that the
imaged area is representative of the entire surface. A second limitation of SPM is that it only
probes the top atomic layer, while interesting phenomena might be occurring below. Finally,
even though STM and AFM images display clear, atomic-scale features, it is challenging to
extract quantitative structural information directly from the images.
The limitations of the two classes of techniques, real space and reciprocal space, can be
largely overcome by combining them in a single instrument. For example, for a catalyst
composed of nanoparticles the combination will make it straightforward to obtain informa-
tion about their size distribution, spatial ordering, and internal structure. By gathering the
SPM and X-ray data in the same set-up under the same experimental conditions, one can
be certain that they reflect precisely the same state of the model catalyst.
The use of SPM techniques at synchrotron beamlines is well established. AFM and
STM are used in combination with synchrotron radiation for combined imaging and
spectroscopy16–25. The SPM-X-ray combination presented here, integrated with a UHV
chamber and a gas flow reactor, enables the application of this combination of techniques
to the field of heterogeneous catalysis.
In this paper, we describe the design and performance of the combined SPM and X-
ray scattering instrument. A complete view of the set-up is presented in Figure 1. Our
design is based on the ReactorSXRD setup26 that has been developed previously at the
ID03 beamline of the European Synchrotron Radiation Facility (ESRF) for in situ study of
catalyst surfaces by surface X-ray diffraction27 and on the ReactorSTM7 and ReactorAFM9
set-ups that have been developed earlier at Leiden University. It combines a UHV system
for sample preparation procedures with a flow reactor in which gas pressures up to 1 bar and
sample temperatures up to 1000 ◦C can be achieved. The SPM part of the new instrument
3
is integrated with the flow reactor. This enables us to image catalytically active systems in
situ, in real space with the SPM, and in reciprocal space using the X-rays.
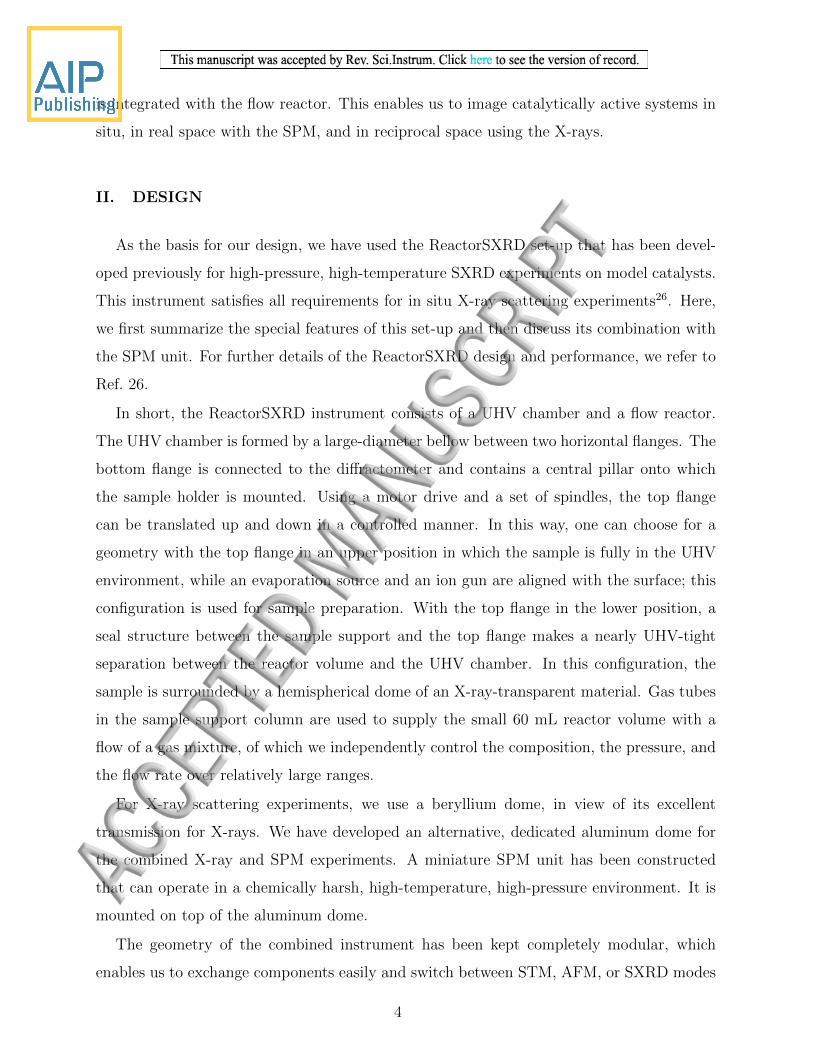
II. DESIGN
As the basis for our design, we have used the ReactorSXRD set-up that has been devel-
oped previously for high-pressure, high-temperature SXRD experiments on model catalysts.
This instrument satisfies all requirements for in situ X-ray scattering experiments26. Here,
we first summarize the special features of this set-up and then discuss its combination with
the SPM unit. For further details of the ReactorSXRD design and performance, we refer to
Ref. 26.
In short, the ReactorSXRD instrument consists of a UHV chamber and a flow reactor.
The UHV chamber is formed by a large-diameter bellow between two horizontal flanges. The
bottom flange is connected to the diffractometer and contains a central pillar onto which
the sample holder is mounted. Using a motor drive and a set of spindles, the top flange
can be translated up and down in a controlled manner. In this way, one can choose for a
geometry with the top flange in an upper position in which the sample is fully in the UHV
environment, while an evaporation source and an ion gun are aligned with the surface; this
configuration is used for sample preparation. With the top flange in the lower position, a
seal structure between the sample support and the top flange makes a nearly UHV-tight
separation between the reactor volume and the UHV chamber. In this configuration, the
sample is surrounded by a hemispherical dome of an X-ray-transparent material. Gas tubes
in the sample support column are used to supply the small 60 mL reactor volume with a
flow of a gas mixture, of which we independently control the composition, the pressure, and
the flow rate over relatively large ranges.
For X-ray scattering experiments, we use a beryllium dome, in view of its excellent
transmission for X-rays. We have developed an alternative, dedicated aluminum dome for
the combined X-ray and SPM experiments. A miniature SPM unit has been constructed
that can operate in a chemically harsh, high-temperature, high-pressure environment. It is
mounted on top of the aluminum dome.
The geometry of the combined instrument has been kept completely modular, which
enables us to exchange components easily and switch between STM, AFM, or SXRD modes
4

of operation.
In the remainder of this section, we will provide a more detailed description of the part
of the set-up that is shown in Figure 2, which contains the essential new elements, such as
the aluminum dome and the SPM part.
A. X-ray-transparent dome
The dome is made by 3D printing of aluminum. The wall thickness is 1 mm, which
results in a transmission coefficient of 0.6 at 24 keV. The dome thickness currently restricts
the X-ray experiments to hard X-rays with energies above 18 keV. Construction of a thinner
beryllium dome would allow one to also use lower-energy X-rays. The SPM part of the
instrument is mounted on top of the dome and reaches in towards the sample surface along
the central axis of the dome and the sample. The shape of the SPM part is kept as slender
as possible so that scattered X-rays can reflect off the surface without being blocked by SPM
components up to an angle of 40◦ with respect to the sample surface, and over a 130◦-range
of azimuthal angles. The dome serves as the reactor and has a volume of 60 mL. The SPM
part that sticks into the dome reduces the effective reactor volume to 40 mL.
B. Mechanical design of the scanning probe microscope
The basic configuration of the SPM part of the system is the same as that of the Reac-
torSTM and the ReactorAFM that have been described in detail in Refs.7,9. Central to the
design is a cylindrical piezo element that is used for the X-, Y-, and Z-motion. The same
piezo element serves as the actuator of a stick-slip translation stage for the coarse approach
of the tip or the quartz tuning fork with tip to the surface. This motion is performed by a
compact slider that moves inside a polyetherimide (PEI) tube and is pulled against isolated
contact rails embedded in the inner wall of that tube, by a CoSm magnet. In this way, the
slider provides the required electrical connections to the tip or the tuning fork with tip. The
system is configured such, that the piezo element is not in contact with the gas atmosphere
inside the dome. Only the PEI tube with the slider and the tip or tuning fork with tip
is exposed to the dome’s atmosphere (see Figure 2). The piezo element and the wiring of
the microscope remain in a separate housing that is evacuated prior to the experiment to
5
a moderate vacuum. Feedthroughs in the top of this housing connect the wiring of the
microscope to external cables that are guided away in order not to block the in- or outgoing
X-rays (indicated by red arrows in Figure 2).
The complete SPM unit including the aluminum dome has a height of 20 cm (see Figure
2). This compact SPM design naturally leads to high mechanical resonance frequencies,
which is beneficial for making the instrument minimally sensitive to external vibrations.
Switching between STM and AFM modes is straightforward, as it merely requires replacing
the slider carrying the probe — either the tip or the quartz tuning fork with tip — and the
electronics that connect to the probe.
The mechanical loop that determines the sensitivity of the microscope to external vi-
brations includes the sample, the sample holder, the holder’s supporting structure, the top
flange of the UHV chamber, the aluminum dome, the base plate on which the piezo tube
is mounted, the piezo element itself, the aluminum tube, the slider and, finally, the tip or
combination of tuning fork with tip. In order to eliminate all flexibility in this loop, the top
flange of the UHV chamber has to be maximally lowered26. Unfortunately, this reduces the
leak from the reactor volume to the UHV chamber effectively to zero, so that we cannot use
the mass spectrometer on that chamber for gas analysis simultaneously with SPM imaging.
We have solved this by attaching an additional UHV chamber with residual gas analyzer to
the exhaust gas line of the reactor.
In order to isolate the microscope as much as possible from external, mechanical, and
acoustical vibrations, the pumps connected to the reactor exhaust, the turbomolecular pump
of the UHV chamber, and of the gas manifold are all placed outside the experimental hutch.
The roughing pumps backing up the turbomolecular pump and pumping the gas flow from
the reactor exhaust are connected with 10 m long, plastic bellows via a lead mass, separating
most of the pump vibrations. The other pumps also have 10 m plastic bellows, but are
directly connected to the gas manifold and the connector plate.
C. Control electronics
The microscope is controlled by SPM electronics from Leiden Probe Microscopy BV28,
which features a digitally controlled fast analog scan generator and a high-bandwidth analog
feedback system for high-speed imaging. As a complicating factor, the feedback settings of
6

this system are controlled by several analog potentiometers, requiring direct access to the
electronics. Therefore, it was necessary to place the entire SPM control system inside the
control room, at a distance of 20 m from the microscope in the experimental hutch. One of
the consequences of this large distance is the extra capacitance of 1 nF per electrode on the
piezo element, introduced by the long cables to the high-voltage amplifiers. In STM mode,
the bias voltage is applied to the sample via the thermocouple wires. We use a differential
cable to bridge the 20 m to a separate amplifier, close to the diffractometer. This amplifier
is designed to reject the common noise on the differential cable, which results in a low-noise
bias voltage on the sample. The use of the thermocouple wires eliminates the possibility of
measuring the temperature during imaging. This should not be a problem since we avoid
changing temperature during STM or AFM imaging, as the sample would otherwise drift
out of the range of the piezo element. In STM mode, we use a preamplifier close to the
microscope to convert the tunneling current into a voltage. Again, differential cabling is
used to connect this voltage over the 20 m to the SPM electronics in the control room.
For the AFM mode, we use the same electrical read-out circuit as the ReactorAFM9. A
Zurich Instruments HF2LI lock-in amplifier is placed in the experimental hutch, close to
the microscope. It is connected to the LPM control system via four 20 m long BNC cables
carrying the relevant signals from the force sensor.
III. PERFORMANCE
The modularity of this system works well. With the top flange of the UHV system in
the lower position, the UHV side is sealed off from the reactor volume, which can be opened
readily to change tips and samples or to change from STM to AFM mode or vice versa. This
can be done on a timescale of minutes. Via the gas lines, the reactor volume can be pumped
down to a moderate vacuum, prior to raising the top flange and connecting the reactor
with the UHV chamber. The complete assembly fits well on the diffractometer and can be
rotated easily around all diffractometer axes, without problematic situations arising from
the connecting cables and capillaries. As will be demonstrated below, the X-ray scattering
performance of the instrument is not compromised by the combination with the SPM part.
As expected, the SPM resolution is modest but atomic steps are imaged routinely with the
instrument. So far, we have only used the instrument in the STM mode. The performance
7

of the AFM will be the subject of future work.
The performance of the SPM scanner was tested in air at room temperature on a table
top catalysis chamber. This chamber has the same type of sample holder and mechanical
loop as the ReactorSXRD chamber, but it was supported by a vibration isolation system,
so that it was only exposed to a low level of vibrational noise. Therefore, this configuration
results in a better SPM performance compared to mounted in the ReactorSXRD chamber.
Under these favorable conditions, the STM images of Au(111) showed clear step resolution
and structures can be distinguished on the terraces (left-hand panel of Figure 3). The holes
observed in the terraces are caused by the presence of sulfur on the surface. As the right-
hand panel of Figure 3 shows, when the vibration isolation system is removed and the set-up
is mounted on the diffractometer, the SPM images still exhibit step resolution. Some of the
vibrational eigenmodes of the mechanical loop of the SPM, in particular the one at 370 Hz,
provide a dominant contribution to the images. These mechanical resonances are excited
mainly by the vibrations of the floor of the ESRF laboratory building.
The first full test of the system on the diffractometer under catalytic conditions was
performed in STM mode with a PtIr tip using a Pd(100) surface. We cleaned the surface in
the UHV chamber by repeated cycles of 1000 eV argon ion bombardment and annealing at
1150 K. After this we lowered the top flange to seal off the reactor volume from the UHV
chamber. We then used four different techniques to inspect the sample, namely STM (Figure
4), X-Ray Reflectivity (XRR) (Figure 5), SXRD (Figure 5), and GISAXS (Figure 6). For
the X-ray measurements the photon energy was set to 24 keV. We show measurements at
three stages in the exposure of the Pd surface to different mixtures of CO and O2, all at a
total gas pressure of 1.1 bar and a sample temperature of 300 ◦C; (i) under initial, reducing
conditions in a flow of 30 ml/min CO and 40 ml/min O2, (ii) after oxidation of the surface
in 3 ml/min CO and 55 ml/min O2, and (iii) after subsequent reduction in 20 ml/min CO
and 38 ml/min O2.
In the initial mixture of CO and O2 with flows of 30 ml/min CO and 40 ml/min O2, the
Pd(100) surface is flat as illustrated by the reflectivity curve and the crystal truncation rod
(red curves) in both panels of Figure 5 (the intensity between the crystal truncation rods
scales with smoothness). We proceeded by exposing the surface to a mixture of CO and
O2 with flows of 3 ml/min CO and 55 ml/min O2. In this environment the surface became
oxidized and developed significant roughness, as is illustrated by the STM image in the
8
left-hand panel of Figure 4. The two blue curves in Figure 5 show the presence of roughness
by the steep decay of the intensity away from the Bragg peaks and the negligible intensity
between the Bragg peaks12,29,30. A similar effect can be recognized in the GISAXS pattern
in the left-hand panel of Figure 6 and the blue curve in the right-hand panel of Figure 6 (a
wide pattern means a rough surface). The gas mixture was changed again, now with flows of
20 ml/min CO and 38 ml/min O2. Under these conditions the STM image shows a different
surface topography than in the previous conditions which we ascribe to a reduction of the
surface. This was confirmed by the disappearance of the diffraction signal of the oxide (not
shown). Both the reflectivity curve and the [1 0 l] rod recover their initial shape as can be
seen in Figure 5. The GISAXS pattern for this gas mixture shows a smoothening of the
surface as can be seen from the decrease in scattered intensity at high values of q‖ in the
right-hand panel of Figure 6. Summarizing, from the STM images shown in Figure 4b we
see that the roughening of the surface is inhomogeneous. This is information one cannot
obtain from X-ray data. However, the X-ray data supply more information on the average
roughness, as cannot be obtained from a local surface probe as is STM.
In Figure 6, we show two GISAXS patterns of the Pd(100) surface. The right-hand
panel in Figure 6 shows two cuts through these patterns with the intensity against parallel
momentum transfer q‖ at a fixed qz value, corresponding to the Yoneda peak. For the
reduced surface, with flows of 20 ml/min CO and 38 ml/min O2, the intensity decays more
slowly with q‖. This can be interpreted as the result of the smoothening of the metallic
surface12,29,30, enabled by the increased surface mobility after the removal of the oxide31.
Like most SPM instruments, our SPM is sensitive to thermal drift. To a large extent,
this is due to the construction of the sample holder, which has not been designed to expand
symmetrically and with a fixed height of the surface plane when the temperature is increased.
The typical timescale for the system to reach steady imaging conditions with a drift rate
below 50 nm/min, after a large, e.g. 100◦ C, change in sample temperature, is 3 hours.
Changes in temperature distribution induced by gas-composition changes are within the
thermal window of the microscope, provided that the heat capacity of the gas mixture does
not change too much.
The time it takes to switch from X-ray measurements to SPM operation is mainly de-
termined by the speed of the coarse approach mechanism of the tip. The approach can be
time consuming since the initial distance between the sample and the tip apex is unknown,
9
so that the entire approach trajectory has to be traversed in small, sub-micrometer steps.
After each approach step, a sensing procedure is performed to establish whether the tip is
already close enough to the surface. Alternatively, we can use the X-ray beam to accurately
measure the distance between the tip and the sample, reducing the approach time from hours
to minutes. After the SPM measurements have been completed, the slider can be retracted
and X-ray measurements can recommence. Since the sample remains aligned during SPM
measurements, no realignment has to be performed.
We have performed preliminary simultaneous STM and X-ray reflectivity measurements
that have demonstrated that the combination of the two measurements is really possible
at the same time. However, the photoelectrons generated by the incident X-rays provide a
significant contribution to the current measured by the STM tip. When the X-ray beam
intensity is increased, as is necessary for SXRD measurements, this current contribution
becomes dominant with respect to the tunneling current and makes it difficult to use the
measured current as the control signal for the STM imaging. This difficulty can be reduced
greatly by replacing the STM tip by a tailor-made, coaxial tip configuration, in which most
of the photoelectron current is captured by a separate outer electrode (shield). This forms a
rather involved addition to the experimental set-up but it opens completely new experimental
possibilities, which we have explored recently and will report in a future publication.
IV. CONCLUSION AND OUTLOOK
We have developed an instrument for combined synchrotron X-ray scattering and scan-
ning probe experiments for in situ catalysis studies. This new instrument allows us to
perform a real-space characterization of the surface topography and a determination of
the surface structure under identical high-pressure, high-temperature catalytic conditions.
Both scanning tunneling microscopy and atomic force microscopy can be performed. This
instrument contributes to the understanding of fundamental reaction processes by making it
possible to follow the evolution of the structure and morphology of active catalytic systems
in response to the temperature and gas environment to which they are exposed.
We have constructed the instrument in a modular fashion, combining the previously
developed ReactorSXRD system for synchrotron X-ray studies with the technology of our
ReactorSTM and ReactorAFM systems previously developed for SPM studies under cat-
10
alytic conditions, in a very compact fashion. The ”bolt-on” SPM unit developed here can
be combined also with other reactor configurations, such as the table-top catalysis chamber,
used in some of the SPM performance tests.
REFERENCES
1H. Bluhm, M. Havecker, A. Knop-Gericke, M. Kiskinova, R. Schlogl, and M. Salmeron,
MRS bulletin 32, 1022 (2007).
2S. Ferrer, M. D. Ackermann, and E. Lundgren, MRS bulletin 32, 1010 (2007).
3D. D. Fong, C. A. Lucas, M. I. Richard, and M. F. Toney, MRS bulletin 35, 504 (2010).
4P. L. Gai, E. D. Boyes, S. Helveg, P. L. Hansen, S. Giorgio, and C. R. Henry, MRS bulletin
32, 1044 (2007).
5J. F. Creemer, S. Helveg, G. H. Hoveling, S. Ullmann, A. M. Molenbroek, P. M. Sarro,
and H. W. Zandbergen, Ultramicroscopy 108, 993 (2008).
6J. Frenken and B. Hendriksen, MRS bulletin 32, 1015 (2007).
7C. T. Herbschleb, P. C. van der Tuijn, S. B. Roobol, V. Navarro, J. W. Bakker, Q. Liu,
D. Stoltz, M. E. Canas-Ventura, G. Verdoes, M. A. van Spronsen, M. Bergman, L. Crama,
I. Taminiau, A. Ofitserov, G. J. C. van Baarle, and J. W. M. Frenken, Review of Scientific
Instruments 85, 083703 (2014).
8M. A. van Spronsen, G. J. C. van Baarle, C. T. Herbschleb, J. W. M. Frenken, and
I. M. N. Groot, Catalysis Today 244, 85 (2015).
9S. B. Roobol, M. E. Canas-Ventura, M. Bergman, M. A. van Spronsen, W. G. Onderwaater,
P. C. van der Tuijn, R. Koehler, A. Ofitserov, G. J. C. van Baarle, and J. W. M. Frenken,
Review of Scientific Instruments 86, 033706 (2015).
10M. D. Ackermann, T. Pedersen, B. Hendriksen, O. Robach, S. Bobaru, I. Popa, C. Quiros,
H. Kim, B. Hammer, S. Ferrer, and J. W. M. Frenken, Physical Review Letters 95 (2005).
11B. L. M. Hendriksen, S. C. Bobaru, and J. W. M. Frenken, Surface Science 552, 229
(2004).
12B. L. M. Hendriksen, M. D. Ackermann, R. van Rijn, D. Stoltz, I. Popa, O. Balmes,
A. Resta, D. Wermeille, R. Felici, S. Ferrer, and J. W. M. Frenken, Nature Chemistry 2,
730 (2010).
13J. Gustafson, M. Shipilin, C. Zhang, A. Stierle, U. Hejral, U. Ruett, O. Gutowski, P. A.
11
Carlsson, M. Skoglundh, and E. Lundgren, Science 343, 758 (2014).
14I. K. Robinson and D. J. Tweet, Reports on Progress in Physics 55, 599 (1992).
15G. Renaud, R. Lazzari, and F. Leroy, Surface Science Reports 64, 255 (2009).
16T. Matsushima, T. Okuda, T. Eguchi, M. Ono, A. Harasawa, T. Wakita, A. Kataoka,
M. Hamada, A. Kamoshida, Y. Hasegawa, and T. Kinoshita, Review of Scientific Instru-
ments 75, 2149 (2004).
17M. S. Rodrigues, O. Dhez, S. L. Denmat, J. Chevrier, R. Felici, and F. Comin, Journal
of Instrumentation 3, P12004 (2008).
18M. L. Cummings, T. Y. Chien, C. Preissner, V. Madhavan, D. Diesing, M. Bode, J. W.
Freeland, and V. Rose, Ultramicroscopy 112, 22 (2012).
19S. Rackwitz, I. Faus, B. Lagel, J. Linden, J. Marx, E. Oesterschulze, K. Schlage, H.-C.
Wille, S. Wolff, A. J. Wolny, and V. Schunemann, Hyperfine Interactions 226, 667 (2014).
20T. Slobodskyy, A. V. Zozulya, R. Tholapi, L. Liefeith, M. Fester, M. Sprung, and
W. Hansen, Review of Scientific Instruments 86, 065104 (2015).
21B. Gumı-Audenis, F. Carla, M. V. Vitorino, A. Panzarella, L. Porcar, M. Boilot, S. Guer-
ber, P. Bernard, M. S. Rodrigues, F. Sanz, M. I. Giannotti, and L. Costa, Journal of
Synchrotron Radiation 22, 1364 (2015).
22I. Schmid, J. Raabe, B. Sarafimov, C. Quitmann, S. Vranjkovic, Y. Pellmont, and H. Hug,
Ultramicroscopy 110, 1267 (2010).
23Z. Ren, F. Mastropietro, A. Davydok, S. Langlais, M.-I. Richard, J.-J. Furter, O. Thomas,
M. Dupraz, M. Verdier, G. Beutier, P. Boesecke, and T. W. Cornelius, Journal of Syn-
chrotron Radiation 21, 1128 (2014).
24A. Saito, J. Maruyama, K. Manabe, K. Kitamoto, K. Takahashi, K. Takami, M. Yabashi,
Y. Tanaka, D. Miwa, M. Ishii, Y. Takagi, M. Akai-Kasaya, S. Shin, T. Ishikawa, Y. Kuwa-
hara, and M. Aono, Journal of Synchrotron Radiation 13, 216 (2006).
25K. Tsuji, K. Wagatsuma, K. Sugiyama, K. Hiraga, and Y. Waseda, Surface and interface
analysis 27, 132 (1999).
26R. van Rijn, M. D. Ackermann, O. Balmes, T. Dufrane, A. Geluk, H. Gonzalez, H. Isern,
E. de Kuyper, L. Petit, V. A. Sole, D. Wermeille, R. Felici, and J. W. M. Frenken, Review
of Scientific Instruments 81, 014101 (2010).
27O. Balmes, R. van Rijn, D. Wermeille, A. Resta, L. Petit, H. Isern, T. Dufrane, and
R. Felici, Catalysis Today 145, 220 (2009).
12
28M. J. Rost, L. Crama, P. Schakel, E. V. Tol, G. B. E. M. V. Velzen-Williams, C. F.
Overgauw, H. T. Horst, H. Dekker, B. Okhuijsen, M. Seynen, A. Vijftigschild, P. Han,
A. J. Katan, K. Schoots, R. Schumm, W. V. Loo, T. H. Oosterkamp, and J. W. M.
Frenken, Review of Scientific Instruments 76, 053710 (2005).
29R. van Rijn, O. Balmes, A. Resta, D. Wermeille, R. Westerstrom, J. Gustafson, R. Felici,
E. Lundgren, and J. W. M. Frenken, Phys. Chem. Chem. Phys. 13, 13167 (2011).
30W. G. Onderwaater, CO oxidation catalysis at multiple length scales, Ph.D. thesis, Leiden
University (2016).
31B. L. M. Hendriksen and J. W. M. Frenken, Physical Review Letters 89, 046101 (2002).
32S. B. Roobol, W. G. Onderwaater, J. Drnec, R. Felici, and J. W. M. Frenken, Journal of
Applied Crystallography , 1 (2015).
13
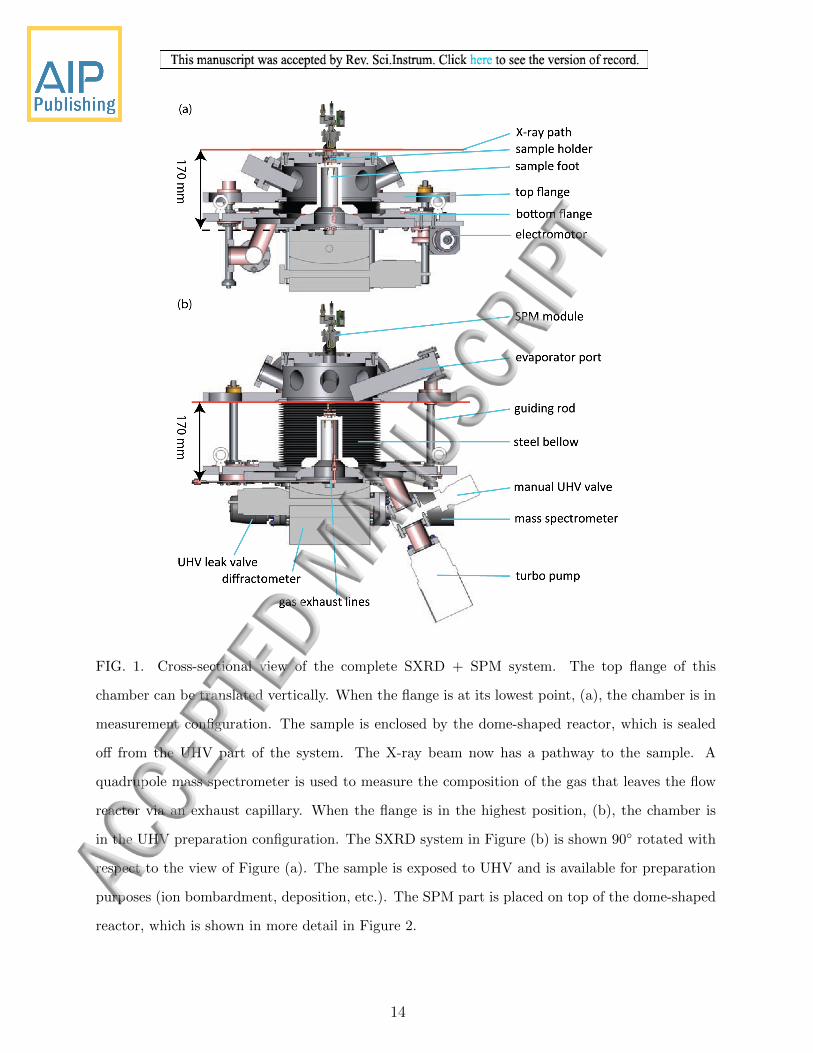
FIG. 1. Cross-sectional view of the complete SXRD + SPM system. The top flange of this
chamber can be translated vertically. When the flange is at its lowest point, (a), the chamber is in
measurement configuration. The sample is enclosed by the dome-shaped reactor, which is sealed
off from the UHV part of the system. The X-ray beam now has a pathway to the sample. A
quadrupole mass spectrometer is used to measure the composition of the gas that leaves the flow
reactor via an exhaust capillary. When the flange is in the highest position, (b), the chamber is
in the UHV preparation configuration. The SXRD system in Figure (b) is shown 90◦ rotated with
respect to the view of Figure (a). The sample is exposed to UHV and is available for preparation
purposes (ion bombardment, deposition, etc.). The SPM part is placed on top of the dome-shaped
reactor, which is shown in more detail in Figure 2.
14
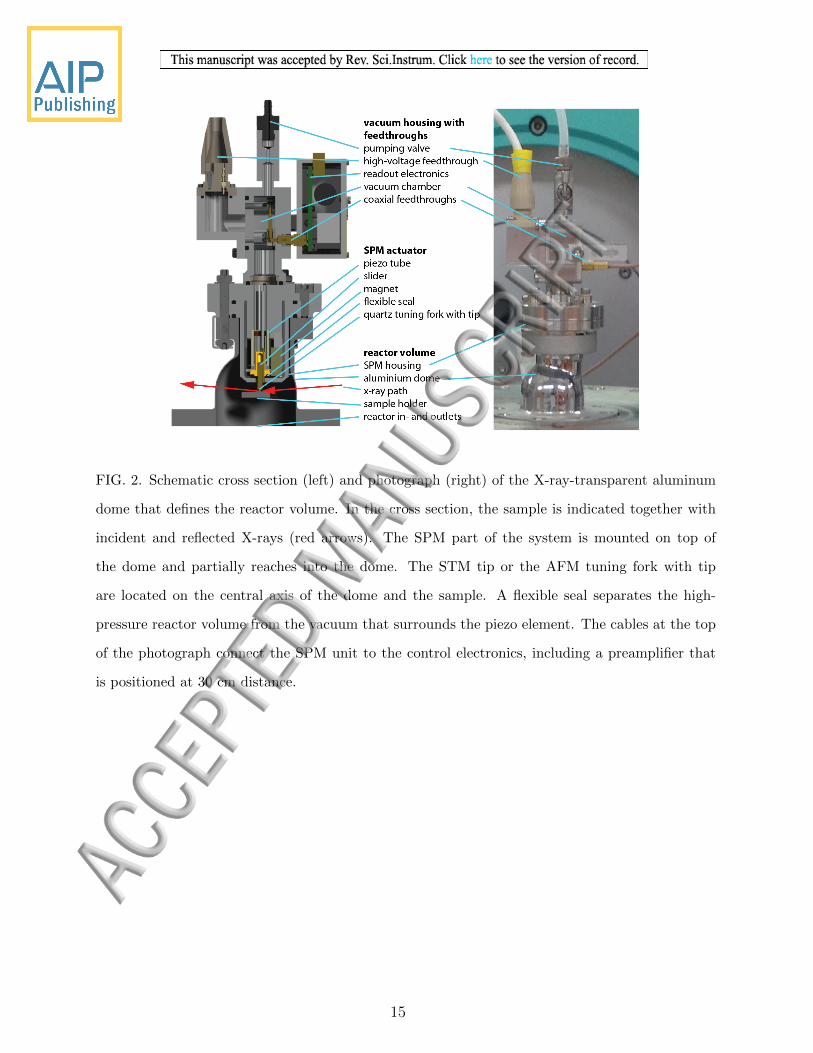
FIG. 2. Schematic cross section (left) and photograph (right) of the X-ray-transparent aluminum
dome that defines the reactor volume. In the cross section, the sample is indicated together with
incident and reflected X-rays (red arrows). The SPM part of the system is mounted on top of
the dome and partially reaches into the dome. The STM tip or the AFM tuning fork with tip
are located on the central axis of the dome and the sample. A flexible seal separates the high-
pressure reactor volume from the vacuum that surrounds the piezo element. The cables at the top
of the photograph connect the SPM unit to the control electronics, including a preamplifier that
is positioned at 30 cm distance.
15
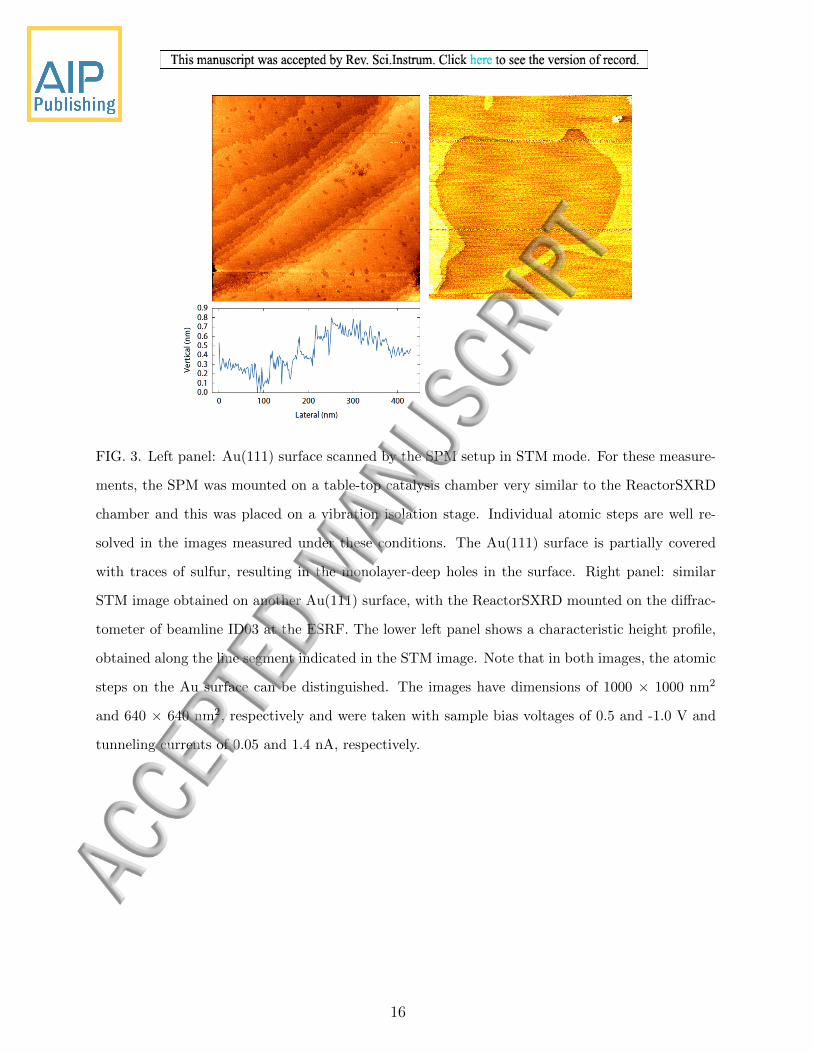
FIG. 3. Left panel: Au(111) surface scanned by the SPM setup in STM mode. For these measure-
ments, the SPM was mounted on a table-top catalysis chamber very similar to the ReactorSXRD
chamber and this was placed on a vibration isolation stage. Individual atomic steps are well re-
solved in the images measured under these conditions. The Au(111) surface is partially covered
with traces of sulfur, resulting in the monolayer-deep holes in the surface. Right panel: similar
STM image obtained on another Au(111) surface, with the ReactorSXRD mounted on the diffrac-
tometer of beamline ID03 at the ESRF. The lower left panel shows a characteristic height profile,
obtained along the line segment indicated in the STM image. Note that in both images, the atomic
steps on the Au surface can be distinguished. The images have dimensions of 1000 × 1000 nm2
and 640 × 640 nm2, respectively and were taken with sample bias voltages of 0.5 and -1.0 V and
tunneling currents of 0.05 and 1.4 nA, respectively.
16
0 50 100 150
Lateral (nm)
0.00.51.01.52.02.53.03.54.0
Vert
ical
(nm
)
0 50 100 150
Lateral (nm)
0.00.51.01.52.02.53.03.54.0
Vert
ical
(nm
)
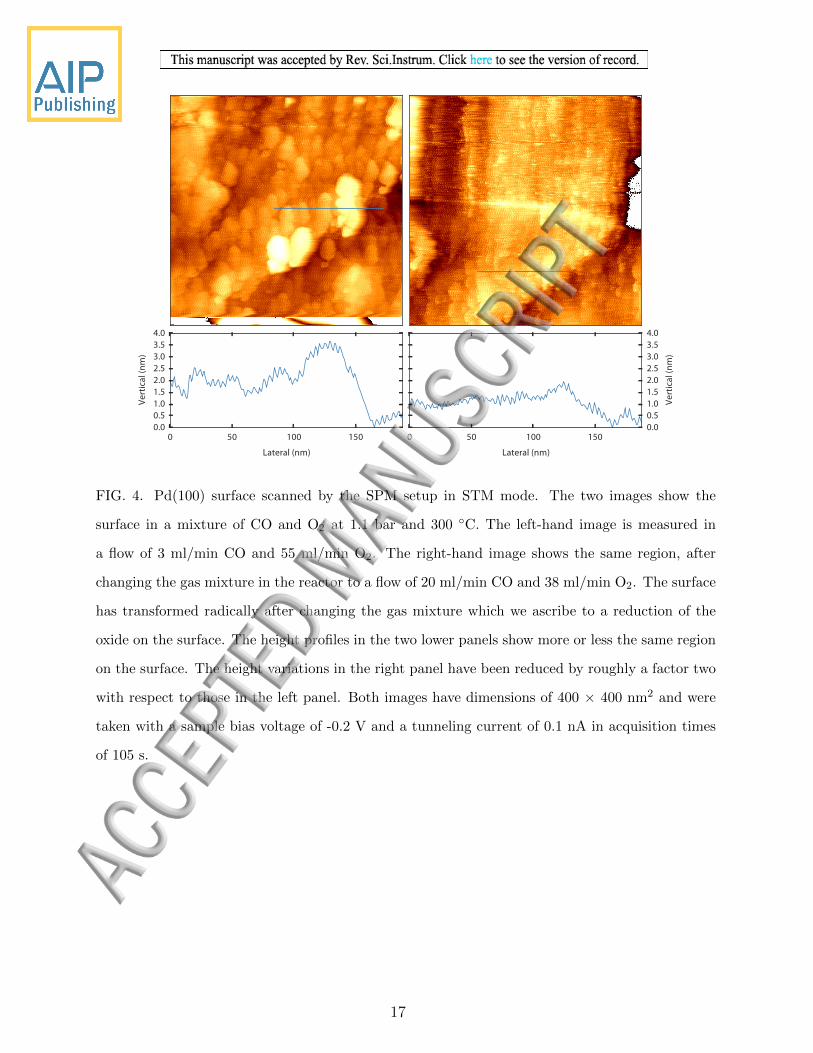
FIG. 4. Pd(100) surface scanned by the SPM setup in STM mode. The two images show the
surface in a mixture of CO and O2 at 1.1 bar and 300 ◦C. The left-hand image is measured in
a flow of 3 ml/min CO and 55 ml/min O2. The right-hand image shows the same region, after
changing the gas mixture in the reactor to a flow of 20 ml/min CO and 38 ml/min O2. The surface
has transformed radically after changing the gas mixture which we ascribe to a reduction of the
oxide on the surface. The height profiles in the two lower panels show more or less the same region
on the surface. The height variations in the right panel have been reduced by roughly a factor two
with respect to those in the left panel. Both images have dimensions of 400 × 400 nm2 and were
taken with a sample bias voltage of -0.2 V and a tunneling current of 0.1 nA in acquisition times
of 105 s.
17
0.5 1.0 1.5 2.0 2.5
L (r.l.u.)
10−410−310−210−1100101102103104
Inte
nsity
(a.u
.)
3:4 CO:O2
3:55 CO:O2
10:19 CO:O2
0.5 1.0 1.5 2.0 2.5 3.0 3.5
L (r.l.u.)
10−410−310−210−1100101102103104
Inte
nsity
(a.u
.)
3:4 CO:O2
3:55 CO:O2
10:19 CO:O2
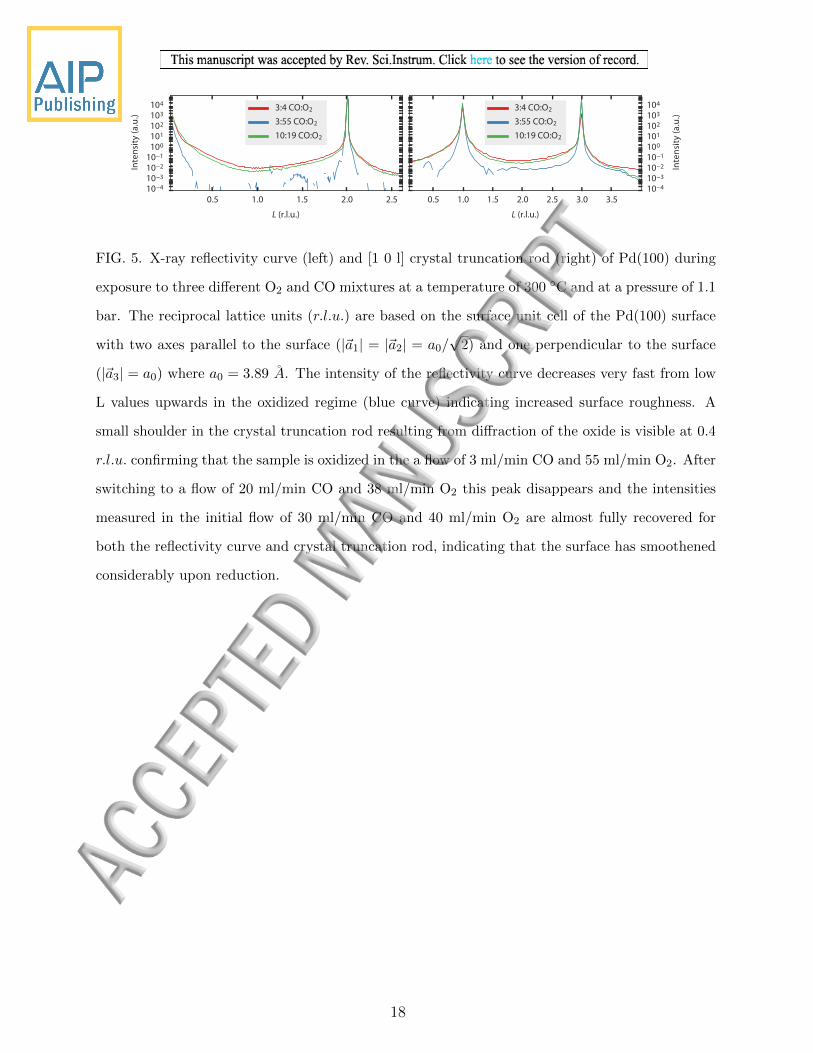
FIG. 5. X-ray reflectivity curve (left) and [1 0 l] crystal truncation rod (right) of Pd(100) during
exposure to three different O2 and CO mixtures at a temperature of 300 ◦C and at a pressure of 1.1
bar. The reciprocal lattice units (r.l.u.) are based on the surface unit cell of the Pd(100) surface
with two axes parallel to the surface (|~a1| = |~a2| = a0/√
2) and one perpendicular to the surface
(|~a3| = a0) where a0 = 3.89 A. The intensity of the reflectivity curve decreases very fast from low
L values upwards in the oxidized regime (blue curve) indicating increased surface roughness. A
small shoulder in the crystal truncation rod resulting from diffraction of the oxide is visible at 0.4
r.l.u. confirming that the sample is oxidized in the a flow of 3 ml/min CO and 55 ml/min O2. After
switching to a flow of 20 ml/min CO and 38 ml/min O2 this peak disappears and the intensities
measured in the initial flow of 30 ml/min CO and 40 ml/min O2 are almost fully recovered for
both the reflectivity curve and crystal truncation rod, indicating that the surface has smoothened
considerably upon reduction.
18
0.05 0.10 0.15 0.20 0.25q (Å −1)
0.06
0.08
0.10
0.12
0.14
q z (Å
−1)
0.05 0.10 0.15 0.20 0.25q (Å −1)
0.05 0.10 0.15 0.20 0.25q (Å −1)
10−5
10−4
10−3
10−2
10−1
Inte
nsity
(a.u
.)
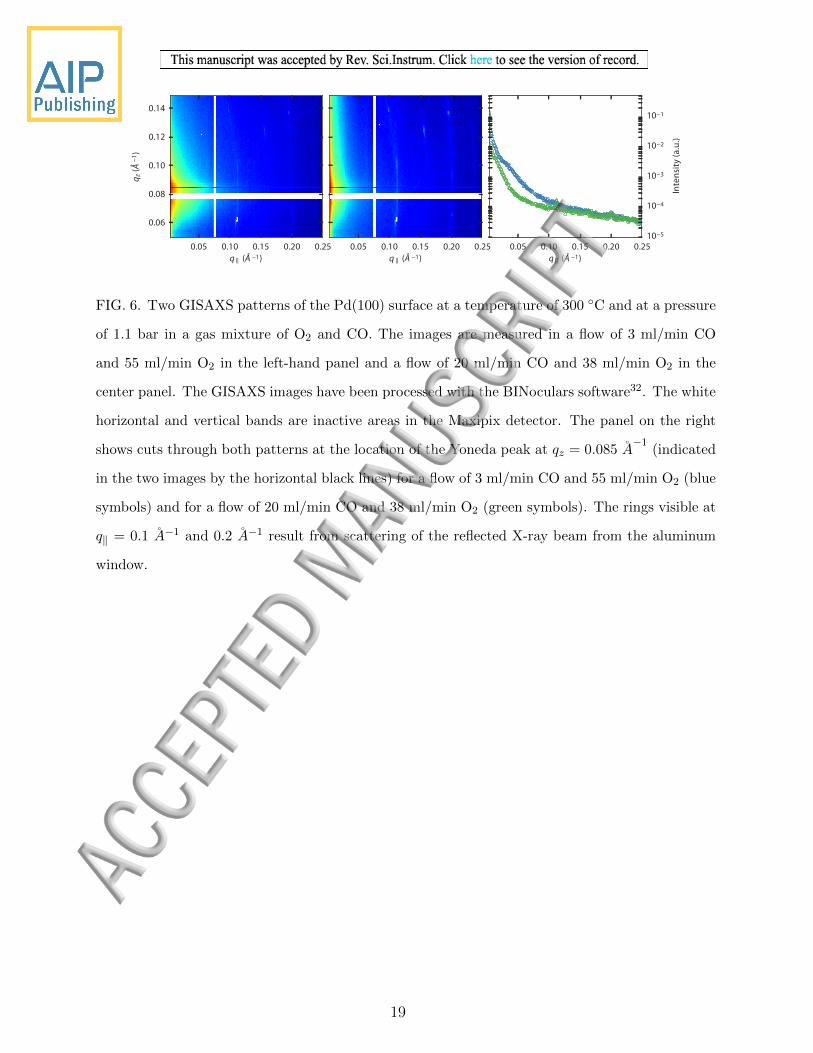
FIG. 6. Two GISAXS patterns of the Pd(100) surface at a temperature of 300 ◦C and at a pressure
of 1.1 bar in a gas mixture of O2 and CO. The images are measured in a flow of 3 ml/min CO
and 55 ml/min O2 in the left-hand panel and a flow of 20 ml/min CO and 38 ml/min O2 in the
center panel. The GISAXS images have been processed with the BINoculars software32. The white
horizontal and vertical bands are inactive areas in the Maxipix detector. The panel on the right
shows cuts through both patterns at the location of the Yoneda peak at qz = 0.085 A−1
(indicated
in the two images by the horizontal black lines) for a flow of 3 ml/min CO and 55 ml/min O2 (blue
symbols) and for a flow of 20 ml/min CO and 38 ml/min O2 (green symbols). The rings visible at
q‖ = 0.1 A−1 and 0.2 A−1 result from scattering of the reflected X-ray beam from the aluminum
window.
19
Copyright © 2022 FDOKUMEN