
A feedback-based implementation scheme for batch process optimization
Upload
independentCategory
view
1download
0
Combination of statistical process control (SPC)
methods and classification strategies for situation
assessment of batch process
Magda Ruiz, Joan Colomer, Joaquim Melendez
Dept.de Electronica, Informatica i Automatica
Universitat de Girona
Campus Montilivi, Edifici PIV
17071 Girona - Spain
{mlruizo,colomer,quimmel}@eia.udg.es
Abstract
The paper focuses on the development of a classification strategy to identify critic situation in batch processcontrol. Data acquired from a batch execution is reduced by means of multiway principal component analysisin order to be assessed according to the statistical model of the process. Multiple situations have beencategorized by a classification algorithm applied to the principal components in order to identify misbehaviourcauses.
Palabras clave: Multiway Principal Component Analysis (MPCA), situation assessment, Batch Processes.
1. Introduction
Many strategies for fault detection and diagnosisare referenced in the bibliography. According to[18], fault diagnosis methods can been classify inthree general categories: quantitative model ba-sed methods, qualitative model based methodsand process history based methods, illustrated byfigure 1.
Figure 1. Classification of diagnostic
algorithms, according to [18]
The solution proposed in this work falls in thethird category; and particularly in the subgroupof statistical methods. A biological batch processfor the treatment of wastewater has been used todevelop and test the supervision method.
Multivariate Statistic Process Control (MSPC)methods have shown to be effective in detec-ting and diagnosing events that cause a signifi-cant change in the dynamic correlation structureamong the process variables [3] some examplesare: polymerization reactor process [12], pharma-ceutical process [7], the elaboration at industrialscale of the polymer polypropylene oxide [20],WasteWater Treatment Plant [6] among others.These variables utilize the information directlyand systematically and scientifically recognize the
Inteligencia Artificial, Revista Iberoamericana de Inteligencia Artificial. No 29 (2006), pp. 99-107.ISSN: 1137-3601. c©AEPIA (http://www.aepia.org/revista)
ARTÍCULO

normal operation behavior of the process. Diffe-rent applications have been proposed in the lite-rature according to this principle. In [2] a strategyto isolate sensors that are affected by nonconfor-ming operation is described. It allows to distin-guish between failed sensors and process upsets.In [4] MSPC is combined with wavelet properties,in this way was created adaptive multiscale MP-CA in order to detect abnormal behaviors and toidentify the major sources of process disturban-ces.
In this work a combination between MSPC and aclassification tool is proposed. The combination ofboth methods improves the rsults obtained usingonly MSPC. The paper describes the operationof the SBR process in section 2. Then, section 3is focused on those MSPC extensions for processmonitoring. Section 4, the classification methodis presented. And finally in section 5 and subse-quent a example is presented and evaluated usingdata acquired from the real plant.
2. Biological batch process
A WasteWater Treatment Pilot Plant has beenused in this work. The plant operates as a Bat-ch Reactor (SBR) as Figure 2 depicts. In a SBRwastewater treatment plant nitrogen removal andelimination of organic matter is done with sludge.Sludge is responsible for the organic matter de-gradation and nitrogen removal. SBR Pilot plantis composed of a metal square reactor with a ca-pacity of 200 liters of water to process. Wastewa-ter is taken directly from a real station sited inGirona (Spain). Next, the wastewater is pumpedto the reactor where the treatment is performed.
Figure 2. Real SBR pilot plant
In SBR pilot plant the nitrogen and organic mat-ter are removed after a 8 hours cycle in whichanoxic and aerobic stages are alternated. In anaerobic stage the ammonia is converted to nitrateand under anoxic condition nitrate is converted tonitrogen gas. Four process variables are monito-red: pH, Oxidation Potential Reduction (ORP),Oxygen Dissolved (OD) and Temperature. Theprocess is highly nonlinear, time-varying and sub-ject to significant disturbances such as atmosp-heric changes, variation in the composition of in-fluent. The process has been characterized statis-tically by its covariance matrix in order to studythe correlation structure between variables andstreams of them.
3. MSPC for batch processes
MSPC is a reduction technique based on classicalstatistical process control (SPC) theory extend tooperate with multiple variables. Nowadays, it hasalso been adapted to characterise batch proces-ses by considering as an additional dimension thenumber of batches (execution of a process accor-ding to a recipe) assuming the same length (samenumber of samples). The bases of MSPC for batchprocesses are the extensions of Principal Compo-nent Analysis (PCA) and Partial Least Squares(PLS) [11][6][10][5]. Extensions of principal com-ponent analysis are described in the next section.
3.1. Multiway principal componentanalysis (MPCA)
Consider a typical batch run in which j=1,2,...,Jvariables are measured at k=1,2,...,K time ins-tants throughout the batch. Similar data willexist on a number of such batch runs i=1,2,...,I.All the data has been summarized in the X (I x Jx K) array illustrated in figure 3, where differentbatches are organized along the vertical side, themeasurement variables along the horizontal side,and their time evolution occupant the third di-mension. Each horizontal slice through this arrayis a (J x K) data matrix representing the timehistories or trajectories for all variables of a sin-gle batch (i). Each vertical slice is an (I x J)matrix representing the values of all the variablesfor all batches at a common time interval (k) [10][19].
100 Inteligencia Artificial Vol. 10 No 29 (2006)
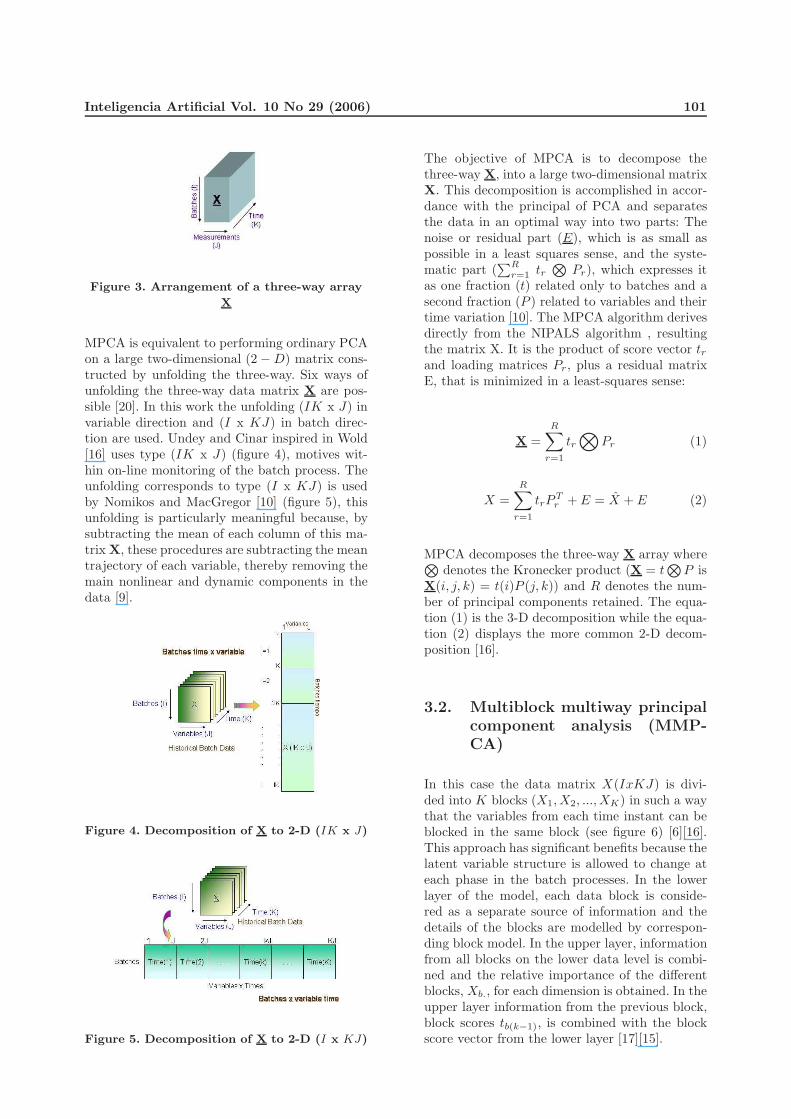
Figure 3. Arrangement of a three-way array
X
MPCA is equivalent to performing ordinary PCAon a large two-dimensional (2 − D) matrix cons-tructed by unfolding the three-way. Six ways ofunfolding the three-way data matrix X are pos-sible [20]. In this work the unfolding (IK x J) invariable direction and (I x KJ) in batch direc-tion are used. Undey and Cinar inspired in Wold[16] uses type (IK x J) (figure 4), motives wit-hin on-line monitoring of the batch process. Theunfolding corresponds to type (I x KJ) is usedby Nomikos and MacGregor [10] (figure 5), thisunfolding is particularly meaningful because, bysubtracting the mean of each column of this ma-trix X, these procedures are subtracting the meantrajectory of each variable, thereby removing themain nonlinear and dynamic components in thedata [9].
Figure 4. Decomposition of X to 2-D (IK x J)
Figure 5. Decomposition of X to 2-D (I x KJ)
The objective of MPCA is to decompose thethree-way X, into a large two-dimensional matrixX. This decomposition is accomplished in accor-dance with the principal of PCA and separatesthe data in an optimal way into two parts: Thenoise or residual part (E), which is as small aspossible in a least squares sense, and the syste-matic part (
∑Rr=1 tr
⊗Pr), which expresses it
as one fraction (t) related only to batches and asecond fraction (P ) related to variables and theirtime variation [10]. The MPCA algorithm derivesdirectly from the NIPALS algorithm , resultingthe matrix X. It is the product of score vector trand loading matrices Pr, plus a residual matrixE, that is minimized in a least-squares sense:
X =
R∑
r=1
tr⊗
Pr (1)
X =
R∑
r=1
trPTr + E = X + E (2)
MPCA decomposes the three-way X array where⊗denotes the Kronecker product (X = t
⊗P is
X(i, j, k) = t(i)P (j, k)) and R denotes the num-ber of principal components retained. The equa-tion (1) is the 3-D decomposition while the equa-tion (2) displays the more common 2-D decom-position [16].
3.2. Multiblock multiway principalcomponent analysis (MMP-CA)
In this case the data matrix X(IxKJ) is divi-ded into K blocks (X1, X2, ..., XK) in such a waythat the variables from each time instant can beblocked in the same block (see figure 6) [6][16].This approach has significant benefits because thelatent variable structure is allowed to change ateach phase in the batch processes. In the lowerlayer of the model, each data block is conside-red as a separate source of information and thedetails of the blocks are modelled by correspon-ding block model. In the upper layer, informationfrom all blocks on the lower data level is combi-ned and the relative importance of the differentblocks, Xb., for each dimension is obtained. In theupper layer information from the previous block,block scores tb(k−1), is combined with the blockscore vector from the lower layer [17][15].
Inteligencia Artificial Vol. 10 No 29 (2006) 101

Figure 6. Dividing batch data into different
phases
3.3. Control charts
Abnormal behavior of batch can be identifiedby projecting the batch onto the model. Controlcharts that are used in monitoring batch proces-ses are generally based on the the Q-statistic andD-statistic, in which control limits are used to de-termine whether the process is in control or not.
The Q -statistic is a measure of the lack of fit withthe established model. For batch number i, Qi iscalculated as:
Qi =
J∑
j=1
K∑
k=1
(ejk)2 ∼ gx2(h) (3)
where ejk are the elements of E. Qi indicates thedistance between the actual values of the batchand the projected values onto the reduced space.
The D -statistic or Hotelling T 2 statistic, measu-res the degree to which data fit the calibrationmodel:
Di = tTi S−1ti ∼I(I − R)
R(I2 − 1)FR,I−R (4)
where S is the estimated covariance matrix ofthe scores. The D -statistic gives a measure of theMahalanobis distance in the reduced space be-tween of batch and the origin that designates thepoint with average batch process behavior.
4. Classification method
For classification, the Learning Algorithm forMultivariate Data Analysis (LAMDA) has been
used [1]. This method takes advantage of hybridlogical connectives to perform a soft boundedclassification.
LAMDA is proposed as a classification techniqueto apply to principal components selected for mo-nitoring. The goal is to assess the actual situationaccording to profiles previously learned [1][8].
Figure 7. Basic LAMDA recognition
methodology
Input data is presented to LAMDA as a set of ob-servations or individuals characterized by its des-criptors or attributes and recorded as rows. Prin-cipal components obtained in the MPCA step areused as input variables to be classified. Once, thedescriptors are loaded, every individual is proces-sed individually according to the desired goal [1]:
1. To classify the individuals according to aknown and fixed set of classes.
2. To learn and adapt from a previous givenset classes which can be modified accordingto the new individuals.
3. To discover and learn representative parti-tions in the training set.
The basic assignment of an individual to a classfollows the procedure represented by figure 7. Inthis, MAD and GAD stand for Marginal (it takesinto account only one attribute) and Global Ade-quacy Degree (obtained from the hybrid logicalcombination of the previously obtained MADs)respectively, of an individual to a given class.Equations (5) and (6) are used to calculate them.This classifying structure resembles that of a sin-gle neuron ANN [1].
102 Inteligencia Artificial Vol. 10 No 29 (2006)

MAD(dixj/ρi/k) = ρdixj
i/k (1 − ρi/k)1−dixj (5)
where
dixj = Descriptor i of the objectj ρi/k =ρ of descriptor i and class k
GAD = βT (MAD) + (1 − β)S(MAD) (6)
Formalizing the description of LAMDA, it is pos-sible to define an individual as a series of des-criptors values d1, ...,dn such that each dj takesvalues from the either finite or infinite set Dj . Wewill call universe or context to the Cartesian pro-duct U = D1 x D2 ... x Dj. Thus, any object orindividual is represented as a vector x = (x1,...,xn) from U , such that each component xj expres-ses the value for the descriptor dj in the object x.The subset of U gathering all these vectors willbe called data base or population. To assign indi-viduals to classes MAD step will be calculated foreach individual, every class and each descriptor,and these partial results will be aggregated in or-der to get the GAD of an individual to a class.The simplest way to build this system would beby using probability distributions functions, andaggregating them by the simple product, but thatwould force us to impose a series of hypothesis onthe data distribution and independence which aretoo arbitrary. Finally, MAD and GAD have beenused according to definitions of equation 5 andequation 6 respectively [1]. The hybrid connectiveused for GAD is a combination between a t-normand a t-conorm by means of the β parameter. β =0 represents the intersection and β = 1 means theunion. This parameter will -inversely- determinethe exigency level of the classification, so it can beidentified as a tolerance or exigency parameter.
5. Results
5.1. Types of batch process
The data obtained from the SBR process wasanalyzed under to points of view. The first one,based on analytical methods proposed in [13]where the sludge reaction is explained. The se-cond one, was a preliminary MSPC analysis whe-re some batches are detected to be outside thecontrol limit. This study create five types of SBR
batch process: Electrical fault, variation com-position, atmospheric changes (corresponding torain), equipment defects and normal behavior.According to the classification it is possible toquantify the number of batches for each group,in the Table 1 all batches of the SBR process aresummarised. There are 60 (equivalent to 33,5 %)batches with abnormal behavior. The normalbehavior was the most common type (66,5 %)with a higher nitrogen efficiency than legally re-quired effluent standards, which are classified ac-cording to the final quality of the wastewater.
Table 1. Batch classification by group
5.1.1. MPCA: batch direction
Each batch lasts 8 hours (5760 samples for eachvariable sampled every 5 seconds). Only 392 sam-ples from each one of the four acquired variableshave been used in order to reduce computatio-nal cost resulting a IxKxJ = 179x4x392 array,(X) for the collection of 179 available batches.MPCA algorithm was applied to the three-waydata array, X unfolded in the batch direction (Ix KJ) resulting 8 principal component. So, thenew dimensionality becomes (179 x 8). The sta-tistical model was created with eight components,which explain 92,79 % of the total variability. Toexamine the process data in the reduced projec-tion spaces (defined by a small number of latentvariables), the variables contribution analysis aremade; as is shown in Figure 8 the temperaturevariable is positively correlated with loadings 1where can be appreciate that in sample 1113 hada increase of the temperature. From the Figure 9represents loadings 2 where Load2 represents atORP variable.
Inteligencia Artificial Vol. 10 No 29 (2006) 103

Figure 8. Variable loadings for the principal
component
Figure 9. Variable loadings for the second
component
Figure 10. Multiway PCA. Q and T 2 charts
with 92,79 % confidence limits
Figure 10 shows the Q and T 2 charts for all pro-cess batches. In the Q chart, it can be seen thatsome batches exceed its limits. These batches ha-ve several behaviors. In T 2, two batches are out-side. These batches had electrical fault (EF).
In Table 2 the batches outside the model are sum-marised. In the Q chart, only a third of the to-tal the abnormal behavior is detected, further-more there are 8 false alarms. The T 2 chart has20 batches with abnormal behavior (without fal-se alarm). 39 about 60 of the abnormal behaviorcan be detected, 9 batches are in both charts.
Table 2. MPCA classification
5.1.2. MPCA: variable direction
Three-data matrix X has been unfolded in varia-ble direction too (IK x J). The model was deve-loped with dimensions (70168 x 4), where MPCAsqueezes in 3 principal components explaining the95,18 % of the total variability. In figure 11 a pro-jection on the first and second component planeof the statistical model.
Figure 11. Variables weighs and model in
variable direction
The batches are sequentially ordered and thereare 3 sections into the model. Each section corres-ponds to batch gathered during specific seasons.Test of SBR process match the first month withmonitoring; Spring is the batches developed in
104 Inteligencia Artificial Vol. 10 No 29 (2006)

spring season finally summer correspond to cy-cles in summer season. Temperature contributionwas demonstrated to be less important than ot-hers variables (−0,25 of first component) in con-sequence, it was omitted and a new model wasbuilt using only 3 variables. Figure 12 shows howthe the new model is equally representative.
Figure 12. Variables weighs and model in
variable direction without Temperature
variable
5.1.3. Multiblock MPCA
The SBR pilot plant consists of 6 stages in whichthe latent variable structure can change due todifferent environments. Applying Multiway MP-CA, the data matrix X can be break. In thisway, it is possible to work with the total three-way data array, X, with dimensions 179 x 4 x5760. Data array for each stage are: cycle 1 (179x 4 x 780);cycle 2 (179 x 4 x 780);cycle 3 (179x 4 x 780);4 (179 x 4 x 780);cycle 5 (179 x 4 x780);cycle 6 (179 x 4 x 804);purge cycle (179 x4 x 36);settling cycle (179 x 4 x 720);draw cycle(179 x 4 x 300). Using the control charts by ea-ch stage, it is possible to observe the following:Batches 11 to 17 have variation in the compo-sition and these batches are identified by the Q
and T 2 control charts. The alarms by each stageare summarized in Table 3 (common batches arediscounted). Purge, settling and draw are stageswithout nitrogen removal, they have more falsealarms than other stages.
Table 3. Alarms by each stage
These Multiblock charts supply knowledge by sta-ges which potentially help to fault location anddiagnosis. Furthermore the data interpretation iseasier. Some types of batch process with large du-ration fault have been found to be present in the6 stages models, for example the batches 10 to 16.
5.1.4. Conclusions of MSPC
Initially with the combination of MPCA andanalytical methods it was possible to classify allbatches. Individually, the model developed withMPCA in batch direction has produced satisfac-tory results because knowledge of the process wasobtained while the model developed with MPCAin variable direction allows to detect the relations-hip between process behavior and environment(rain period, summer, among others) and Multi-block MPCA gives detail of the process. In ge-neral, MSPC has been used to detect abnormalbehavior in SBR process, by projecting the da-ta into a lower dimensional space that accuratelycharacterizes the state of the process. The use ofa classification tool to the new variables allows asimple identification and grouping of similar si-tuations according to a matching criteria.
5.2. Classification for situation as-sessment
Initially, MPLS was used. This technique is a di-mensionality reduction that maximises the rela-tion between the matrix X (I x JK) and thepredicted matrix Y [14] (179 x 5) where 179 isthe number of historical data batches and 5 arethe types of batch process. The model make didnot describe the process because matrix Y wascreated with the results obtained of the prelimi-nary MSPC analysis. Matrix Y should be cons-tructed with quality variables which are obtainedeach three days, finding now the missing problem.Thus, a classification tool for situation assessmentis used: MPCA + classification tool.
5.3. MPCA classification
X is the principal components by each batch withdimensions 8 x 179. These were sued as descrip-tors to feed into LAMDA algorithm to discoverrelevant classes under an unsupervised schema.The tool automatically classified the data in ele-ven classes (11). Table 4 compares the classes andthe types of batch process. According to these re-sults, it is possible to identify classes that onlycontain batches with equipment defects, electricalfaults, atmospheric changes and variation in thecomposition. The classes 1,9 and 10 correspondto normal behavior. The group 6 is associated toatmospheric changes. Classes 3 and 11 represent
Inteligencia Artificial Vol. 10 No 29 (2006) 105

variations in the composition while classes 7 and8 include electrical fault. Finally, the classes 2, 4and 5 groups different types of batches. The pre-dominant class (class 1) has 48,04 % of the totalhistorical data, this class represents the normalbehavior. The class 5 is abnormal behavior dueto atmospheric changes and equipment defects.
Table 4. Composition by class
The relationship between the class and princi-pal components is another observation. The 8th
component is less predominant because it doesnot change. It indicates that X can be compu-ted using only seven descriptors. Then, the to-tal variability will be 90,54 %. Consequently, only7 principal components are used in the analysisMultiblock MPCA.
5.4. MMPCA classification
According to previous analysis, there are sevenprincipal components (seven descriptors for eachstage). Classification tool is used individually atevery stage taking the whole set of batches. Itresulted that at different stages the numbers ofclasses was very also different. Likewise to MP-CA classification, the classes were marked (Table5). Table 6 summarises the error for this classifica-tion. Other observation: electrical Fault is presentin cycles 2 and 6 because one batch experimenteda sags in two cycles (Remember Table 1). Typesof normal behavior are the classes more popula-ted.
Table 5. Classes by each cycle
Table 6. Classes by each cycle
6. Conclusions
Multivariate Statistical Process Control has beenused to detect abnormal behavior in SBR processby projecting the data into a lower dimensionalspace that accurately characterizes the state ofthe process. Therefore, the new variable matrixis smaller. The use of a classification tools hasbeen teste with previously known data to verifythe utility of it to discover clusters of data in thehistorical registers useful for further situation as-sessment. MSPC and classification tool. Splittingdata into meaningful groups allows a faster loca-lization and identification of faults reporting si-milar experiences.
In order to improve the results and to process thedata faster, it is necessary to developed a tech-nique that combine the dimensionality reductionand nonlinear classification instead of the clas-sical strategy. The use of a classification tool tothe new variables allows a simple identificationand grouping of similar situations according to amatching criteria.
Acknowledgement
This work is part of the research project De-velopment of a intelligent control system applyto a Sequencing Batch Reactor by loads (SBR)for the elimination of organic matter, nitrogenand phosphorus DPI2005-08922-C02-02 suppor-ted by the Spanish Government and the FEDERFounds.
Referencias
[1] J. Aguliar-Martin and R. Lopez. The processof classification and learning the meaning oflinguistic descriptors of concepts. Approxi-
mate Reasoning in Decision Analysis, pages165–175, 1982.
[2] Fuat Doymaz, Jose Romagnoli, and AhmetPalazoglu. A strategy for detection andisolation of sensor failures and process up-sets. Chemometrics and Intelligent Labora-
tory Systems, 55:109–123, 2000.
106 Inteligencia Artificial Vol. 10 No 29 (2006)

[3] Alberto Ferrer, editor. Control Estadisti-
co MegaVariante para los Procesos del Siglo
XXI. 27 Congreso Nacional de Estadistica eInvestigacion Operativa (Spain), 2003.
[4] Dae Sung Lee, Jong Moon Park, and PeterVanrolleghem. Adaptive multiscale principalcomponent analysis for on-line monitoring ofa sequencing batch reactor. Journal of Bio-
technology, 116:195–210, 2005.
[5] Dae Sung Lee and Peter A. Vanrolleghem.Adaptive consensus principal componentanalysis for on-line batch process monito-ring. Technical report, Fund for ScientificReseach - Flander (F.W.O.) and the GhentUniversity Resarch Fund, Coupure Links653, B-9000 Gent, Belgium, 2003.
[6] Dae Sung Lee and Peter A. Vanrolleghem.Monitoring of a sequencing batch reactorusing adaptive multiblock principal compo-nent analysis. Biotechnology and Bioenginee-
ring, 82(4):489–497, mai 2003.
[7] J.A. Lopes, J.C. Menezes, J.A. Westerhuis,and A.K. Smilde. Multiblock pls analysis ofan industrial pharmaceutical process. Biote-
chnol Bioeng, (80):419–427, 2002.
[8] K. Moore. Using neural nets to analyse quali-tative data. A Marketing Research, 7(1):35–39, 1995.
[9] Paul Nomikos and John MacGregor. Multi-variate spc charts for monitoring batch pro-cess. Technometrics, 37(1):41–59, feb 1995.
[10] Paul Nomikos and John F. MacGregor.Monitoring batch processes using multiwayprincipal component analysis. AIChE,40(8):1361–1375, aug 1994.
[11] Paul Nomikos and John F. MacGregor.Multi-way partial least squares in monitoringbatch processes. First International Chemo-
metrics InterNet Conference, 1994.
[12] Aras Norvilas, Eric Tatara, Antoine Negiz,Jeffrey DeCicco, and Ali Cinar, editors. Mo-
nitoring and fault diagnosis of a polymeriza-
tion reactor by interfacing knowledge based
and multivariate SPM tools, number 0-7803-453. American Control Conference, 1998.
[13] S. Puig, M.T. Vives, Ll. Corominas, M.D.Balaguer, and J. Colprim, editors. Was-
tewater nitrogen removal in SBRs, applying
a step-feed strategy: From Lab-Scale to pilot
plant operation. 3a IWA Specialised Confe-rence on Sequencing Batch Reactor, Austra-lia, feb 2004.
[14] Evan L. Russell, Leo H. Chiang, and Ri-chard D. Braatz. Data-driven techniques
for fault detection and diagnosis in chemical
processes ”Advances in Industrial Control”.ISBN 1-85233-258-1, London, 2000.
[15] Age K. Smilde, Johan A. Westerhuis, andRicard Boque. Multiway multiblock compo-nent and covariates regression models. Jour-
nal of Chemometrics, 14:301–331, 2000.
[16] Cenk Undey and Ali Cinar. Statistical moni-toring of multistage, multiphase batch pro-cesses. IEEE Control Systems Magazine,22(5):40–52, oct 2002.
[17] Cenk Undey, Bruce A. Williams, and AliCinar, editors. Monitoring of Batch Phar-
maceutical Fermentations: Data Synchroni-
zation, Landmark Alignment, and Real-Time
Monitoring. 15th Triennial World Congress,Barcelona Spain 2002 IFAC, 2002.
[18] V. Venkatasubramanian, R. Rengaswamy,K. Yin, and S. Kavuri. A review of processfault detection and diagnosis part i quanti-tative model-based methods. Computer and
Chemical Engineering, 27:293–311, 2003.
[19] Johan A. Westerhuis, Theodora Kourti, andJohn F. MacGregor. Analysis of multiblockand hierarchical pca and pls models. Journal
of Chemometrics, 12:301–321, 1998.
[20] Manuel Zarzo and Alberto Ferrer. Batchprocess diagnosis: Pls with variable selectionversus block-wise pcr. Chemometrics and
intelligent laboratory systems, 73:15–27, jun2004.
Inteligencia Artificial Vol. 10 No 29 (2006) 107
Copyright © 2022 FDOKUMEN