Process Analytical Technology (PAT): Batch-to-batch reproducibility of fermentation processes by...
7
Available online at www.sciencedirect.com Journal of Biotechnology 132 (2007) 180–186 Process Analytical Technology (PAT): Batch-to-batch reproducibility of fermentation processes by robust process operational design and control S. Gnoth a,∗ , M. Jenzsch a , R. Simutis b , A. L ¨ ubbert a a Center for Bioprocess Engineering, Martin-Luther-University Halle-Wittenberg, Germany b Institute of Automation and Control Systems, Kaunas Institute of Technology, Lithuania Received 16 January 2007; received in revised form 5 March 2007; accepted 27 March 2007 Abstract The Process Analytical Technology (PAT) initiative of the FDA is a reaction on the increasing discrepancy between current possibilities in process supervision and control of pharmaceutical production processes and its current application in industrial manufacturing processes. With rigid approval practices based on standard operational procedures, adaptations of production reactors towards the state of the art were more or less inhibited for long years. Now PAT paves the way for continuous process and product improvements through improved process supervision based on knowledge-based data analysis, “Quality-by-Design”-concepts, and, finally, through feedback control. Examples of up-to-date implementations of this concept are presented. They are taken from one key group of processes in recombinant pharmaceutical protein manufacturing, the cultivations of genetically modified Escherichia coli bacteria. © 2007 Elsevier B.V. All rights reserved. Keywords: PAT; Robust process design; Feedback control 1. Introduction FDA’s Process Analytical Technology (PAT)-initiative (FDA, 2004) has been discussed in industry (DePalma, 2004) as well as in academia much more intensively than any other regulatory topic before. It is recognized as an important paradigm change in the agencies’ way to inspect and approve production processes for pharmaceuticals. The initiative was immediately taken up by the European EMEA and the Japanese MHLW. PAT is imbedded into the new concept of the agencies, which is going to leave the more or less formal fixed set of standard operational procedures that do not take into account the spe- cialties of the concrete production processes. It will be replaced by a risk-based procedure, where the importance of the indi- vidual operations with respect to their risk to the quality of the This paper is based on an oral contribution to ESBES 6, August 30, 2006, Salzburg. ∗ Corresponding author. Tel.: +49 345 55 25 953; fax: +49 345 55 27 288. E-mail address: [email protected] (S. Gnoth). final product and hence to the safety of the patients. The com- mon steady conference on harmonization (ICH) of the leading agencies, issued a couple of guidelines (Q7–Q10), which define the framework for the new approach to process approval (ICH, 2005). Changes at the production processes, made in order to improve them, bare a risk (Chirino and Mire-Slius, 2004). This can only be quantified when the influence of the changes on the process or product quality is sufficiently well understood. Hence, central to the new approach is the knowledge about the essential details of process equipment and its dynamical operation during product formation and downstream processing. Particularly the quality of recombinant therapeutic proteins, which cannot be measured online, is closely related to the quality of the production process. Process quality is tightly related to its reproducibility. Thus, in real practice, the straightforward way of assuring protein quality is guaranteeing reproducibility of the processes in which the product is formed. A typical example of the batch-to-batch reproducibility for the product concentration patterns in current fermentation pro- cesses is shown in Fig. 1 in form of a scatter plot of protein data 0168-1656/$ – see front matter © 2007 Elsevier B.V. All rights reserved. doi:10.1016/j.jbiotec.2007.03.020
Transcript of Process Analytical Technology (PAT): Batch-to-batch reproducibility of fermentation processes by...

A
prikto©
K
1
2attft
iocbv
S
0d
Available online at www.sciencedirect.com
Journal of Biotechnology 132 (2007) 180–186
Process Analytical Technology (PAT): Batch-to-batchreproducibility of fermentation processes by robust
process operational design and control�
S. Gnoth a,∗, M. Jenzsch a, R. Simutis b, A. Lubbert a
a Center for Bioprocess Engineering, Martin-Luther-University Halle-Wittenberg, Germanyb Institute of Automation and Control Systems, Kaunas Institute of Technology, Lithuania
Received 16 January 2007; received in revised form 5 March 2007; accepted 27 March 2007
bstract
The Process Analytical Technology (PAT) initiative of the FDA is a reaction on the increasing discrepancy between current possibilities inrocess supervision and control of pharmaceutical production processes and its current application in industrial manufacturing processes. Withigid approval practices based on standard operational procedures, adaptations of production reactors towards the state of the art were more or lessnhibited for long years. Now PAT paves the way for continuous process and product improvements through improved process supervision based on
nowledge-based data analysis, “Quality-by-Design”-concepts, and, finally, through feedback control. Examples of up-to-date implementations ofhis concept are presented. They are taken from one key group of processes in recombinant pharmaceutical protein manufacturing, the cultivationsf genetically modified Escherichia coli bacteria.2007 Elsevier B.V. All rights reserved.
fimat2
icpcdp
eywords: PAT; Robust process design; Feedback control
. Introduction
FDA’s Process Analytical Technology (PAT)-initiative (FDA,004) has been discussed in industry (DePalma, 2004) as wells in academia much more intensively than any other regulatoryopic before. It is recognized as an important paradigm change inhe agencies’ way to inspect and approve production processesor pharmaceuticals. The initiative was immediately taken up byhe European EMEA and the Japanese MHLW.
PAT is imbedded into the new concept of the agencies, whichs going to leave the more or less formal fixed set of standardperational procedures that do not take into account the spe-
ialties of the concrete production processes. It will be replacedy a risk-based procedure, where the importance of the indi-idual operations with respect to their risk to the quality of the� This paper is based on an oral contribution to ESBES 6, August 30, 2006,alzburg.∗ Corresponding author. Tel.: +49 345 55 25 953; fax: +49 345 55 27 288.
E-mail address: [email protected] (S. Gnoth).
worop
tc
168-1656/$ – see front matter © 2007 Elsevier B.V. All rights reserved.oi:10.1016/j.jbiotec.2007.03.020
nal product and hence to the safety of the patients. The com-on steady conference on harmonization (ICH) of the leading
gencies, issued a couple of guidelines (Q7–Q10), which definehe framework for the new approach to process approval (ICH,005).
Changes at the production processes, made in order tomprove them, bare a risk (Chirino and Mire-Slius, 2004). Thisan only be quantified when the influence of the changes on therocess or product quality is sufficiently well understood. Hence,entral to the new approach is the knowledge about the essentialetails of process equipment and its dynamical operation duringroduct formation and downstream processing.
Particularly the quality of recombinant therapeutic proteins,hich cannot be measured online, is closely related to the qualityf the production process. Process quality is tightly related to itseproducibility. Thus, in real practice, the straightforward wayf assuring protein quality is guaranteeing reproducibility of the
rocesses in which the product is formed.A typical example of the batch-to-batch reproducibility forhe product concentration patterns in current fermentation pro-esses is shown in Fig. 1 in form of a scatter plot of protein data

S. Gnoth et al. / Journal of Biotech
Fig. 1. Product (triangles) and biomass concentration (circles) patterns, typicalf2
fsbjWtotttl
cfiatf
p“miAmmouv
ncmpmfitt
eouiwuqp
i
2
idimnfstattrcmdhF
fRttra
rtTbsAcHtea
iinstead of the linear approach originally proposed, the use of
or a cultivation process in recombinant protein manufacturing (Jenzsch et al.,006a,b,c,d).
rom 12 cultivation processes operated with the same controltrategy. The batch-to-batch reproducibility can be characterizedy the mean standard deviation of the product concentrations tra-ectories from successive production runs from a desired profile.
hat is desired might be defined as the mean of the set of pat-erns obtained in the cultivations performed for the applicationf the product approval. It is immediately clear from Fig. 1 thathe reproducibility is much worse than expected. At the end ofhe cultivation, we find a scatter in the order of 50% and some-imes even more, meaning that the process-capability is ratherow.
The situation is not better for the corresponding biomassoncentration profiles. This is also shown in Fig. 1. Again wend significant variations from batch to batch. Standard devi-tions are observed that are orders of magnitude larger thanhose observed in many other high-tech production processes,or instance in semiconductor production.
FDA recognized this situation and, in order to sup-ort improvements, it issued guidance for industry entitled:PAT, a framework for innovative pharmaceutical develop-ent, measurement and quality assurance” in order to catalyze
mprovements. Although PAT is the shortage for “Processnalytical Technology”, this guidance is not just about imple-enting new measurement devices. It aims in using moderneasurement techniques to gain understanding of the influence
f the various process variables on quality and immediatelysing this knowledge for quality assurance by process super-ision and control.
In order to improve process and product quality, bioengi-eers prefer a knowledge-based approach, consistent with theentral requirements formulated in the PAT initiative. They for-ulate their knowledge in a computationally exploitable way,
referably in mechanistic mathematical models. As a funda-ental prerequisite, data measured at the real process is needed
or model validation. Getting informative data is often the most
mportant bottleneck, and from this point-of-view it makes sensehat analytics received such a prominent weight in the PAT ini-iative.cbN
nology 132 (2007) 180–186 181
Significant data are also necessary to improve process mod-ls by which we represent the mortgageable knowledge aboutur process. Well performing models are indispensable prereq-isites for knowledge-based design. Here we are preferentiallynterested in design of operational procedures that are robustith respect of the main distortions. Finally, the models are alsosed to improve feedback control, which is an immediate conse-uence whenever the process behaviour deviates from its desiredath.
This is the conceptual framework of the work reported aboutn this paper.
. Online estimation of key quantities
That analytics plays a central role in the PAT discussion whichs obvious from the title of FDA’s initiative and what is imme-iately clear is that the biomass concentration X is of centralmportance to cultivation processes. Hence, biomass measure-
ents can be considered central examples for measurementeeds in bioprocess technology. Within the PAT framework, theocus is on realtime measurements of this key quantity. There areome online sensors available for more or less directly measuringhe biomass concentration (Aber, Komatsugawa), however, theirpplication must very carefully be shielded from bubbles. Fur-her, their use in production-scale reactors is questionable, sincehey provide local measurement data, which might not deliver aepresentative value of the biomass concentration in the entireulture. Hence, it is straightforward to use indirect measure-ent techniques obtained from global measurement signals. The
esired information must be taken from different online signals;ence, multivariate techniques are required, just as proposed inDA’s PAT initiative.
What we can measure reliably online during practically allermentations on the production scale are: the Oxygen Uptakeate OUR, the Carbon dioxide Production Rate CPR and the
otal amount of base, for instance NH4OH, used during pH con-rol. These three quantities (or their cumulative values) can beelated to the desired biomass concentration X. The simplestpproach is using a multivariate linear relationship.
The results of regression curves for a couple of cultivationuns are surprisingly good for such a crude linear approxima-ion: the mean root square error is roughly 1 g/L culture broth.hese results can be improved by taking into account that theiochemical relationships are nonlinear in nature. Hence, it istraightforward to replace the linear by a nonlinear correlation.n adequate nonlinear representation method is using artifi-
ial neural networks (e.g., Rumelhard and McClelland, 1986;aykin, 1999). This technique halves the root mean square error
o yield 0.5 g/kg which basically improves accuracy in biomassstimates high enough for applications in process supervisionnd control.
Thus, the multivariate data analysis suggested in the PAT-nitiative is an excellent tool for process supervision, however,
ommon process knowledge reveals that better results shoulde obtained with nonlinear extensions using Artificial Neuraletworks (Jenzsch et al., 2006c).

1 iotech
3m
keePiLva
spbHtitkt
ttsmp
dWfifwdca
Ft2
bh
Fi
aas
4
batb
a
etadep
pir
f
82 S. Gnoth et al. / Journal of B
. Representing process knowledge by mechanisticodels
A key requirement of PAT is functionalizing processnowledge for process quality improvements. In bioprocessngineering a major approach is to represent the process knowl-dge by means of quantitatively exploitable process models.referentially these are formulated as mechanistic mathemat-
cal models which can be used for process optimization (e.g.,evisauskas et al., 2003) or for model supported process super-ision (e.g., Jenzsch et al., 2006a) and control (e.g., Jenzsch etl., 2006b).
With respect to process modelling the advice of PAT to usetatistical analysis techniques is only one possibility. Advancedrocess engineering prefers representing quantitative knowledgey mechanistic numerically exploitable mathematical models.owever, as generally accepted and concretely written within
he PAT guidelines process knowledge particularly means know-ng the reason for the process variability, and, functionalizinghe knowledge for quality improvements means performing anowledge-based root-cause-analysis or in other words “findinghe critical quality and performance attributes”.
A closer inspection of our accompanying example, the batch-o-batch variability with respect to the biomass profiles, showshat nearly the entire variability in the data is present before wetart product formation through the induction process. Hence, weust search for the reason of the scatter in the biomass formation
hase of the process.Knowing this allows us to keep the model quite simple as we
o not need to consider protein production in this initial phase.hen we use mass balances of the key variables involved (i)
rst the biomass and (ii) second the substrate used by the cellsor energy supply and to form the brick stones for growth, then
e can perfectly simulate the individual biomass measurementata as can be seen in the comparison between the data and theomputational profile in Fig. 2. All curves are obtained with onend the same model parameter set.ig. 2. Biomass concentration profiles during the biomass formation phase ofhe process: comparison between model and measurement data (Jenzsch et al.,006b).
dtqopt
apspaat
bc
i0avlb
nology 132 (2007) 180–186
Such models can perfectly be used for predicting the process’ehaviour. And this prediction capability is a clear evidence ofard process knowledge, a key requirement of PAT.
The model fits well to all the measured data as can be seen inig. 2: the result of this knowledge-based root cause analysis thus
s that the differences originate from the operating conditions.As the only appreciable variances in the operating conditions
re those in the inoculum size taken from the seed fermenter, thenswer is clear: the batch-to-batch reproducibility is caused bymall variances in the inoculum size.
. Quality-by-Design
Deviations from the desired inoculum size cannot completelye avoided in real practice, hence the next question to benswered using this quantitative knowledge is: “How to reducehe influences of these deviations in the inoculum size on theatch-to-batch reproducibility or process quality?”
This is what is referred to in PAT (FDA, 2004) as well as inll other quality assurance procedures as “Quality-by-Design”.
It should be allowed to criticize some of the recommendationsxpressed in the PAT guideline: as we do have a lot of mechanis-ic knowledge about the dynamics of our production processesnd we do not need, – at least not predominantly – statisticalesign methods to find relationships between the various influ-nce variables and optimal process parameters. The statisticalrocedures are clearly overemphasized in these guidelines!
We must use our hard knowledge represented by the dynamicrocess model by means of simulations in order to investigate thenfluence of process operational procedure on the batch-to-batcheproducibility was investigated.
In order to illustrate this, we stay with the example of biomassormation phase in fermentations for recombinant protein pro-uction (Jenzsch et al., 2006b). Industrial companies usually tryo shorten this initial growth phase as much as possible. Conse-uently many companies run it at the maximum growth rate μmaxf the cells. This means exponential growth and, in the fed-batchrocesses, the substrate must be fed exponentially increasing tohe culture.
In the fermentation plant the substrate feeding pump isdjusted by means of a programmable controller. This must berogrammed in advance using the normal textbook relation-hip for the exponential feed rate in a fed-batch operationalrocedure. The corresponding μ-setpoint most often taken is,s mentioned, the maximum specific growth rate μmax and thevailable inoculum size x0 leads to the initial biomass concen-ration X0.
Let us assume in a concrete case that the desired initialiomass concentration is X0 = 0.2 (g/kg) and the maximum spe-ific growth rate of the Escherichia coli strain μmax = 0.65 (1/h).
When, in the subsequent production run, inoculation leads tonitial biomass concentrations that are different to the desired.2 (g/kg), then significantly different biomass concentrations
ppear at the end of the biomass formation phase. Even smallariations around the desired initial value X0 finally lead to aarge variance in the biomass concentrations at the end of theiomass formation phase.
iotechnology 132 (2007) 180–186 183
gvtltow
slμ
cg
BtrTμ
Xμ
i1oic
lobalcp
Fep(
Fi
cmpi2
tt
awfb
S. Gnoth et al. / Journal of B
When, however, the specific growth rate μset in this biomassrowth phase is chosen a little bit smaller than the maximumaluesμmax, then we obtain a completely different picture. Whenhen the initial biomass is higher than desired one, the cells seeess substrate than they expect and consequently they reduceheir growth rate. Thus, the biomass does grow slower. On thether hand, when the biomass is lower than expected, the cellsill see more substrate and, hence, they grow faster.In this way we experience a self-stabilizing effect with the
ame variance in the initial biomass concentrations! The stabi-izing mechanism cannot work, however, when μset is equal to
max, because then the cells cannot react on a lower substrateoncentration by increasing their growth rate: they are alreadyrowing at their maximum speed.
This stabilizing effect was first discovered in a simulation.ut subsequently performed validation experiments confirmed
his finding (Jenzsch et al., 2006b). Two sets of fermentationuns were performed with two exponential feed rate profiles F(t).he first set was performed with an F-profile corresponding toset = μmax = 0.65 (1/h) and an initial biomass concentration of0 = 0.2 (g/kg). The other set of fermentations was run with aset smaller than μmax.
Both sets of fermentations were started with the same set ofnitial conditions, where the initial biomass was varied by over00%. This was made sure by using a different number of vialsf biomass from the working cell bank in order to prepare thenoculum for the different experiments. The number of vials washanged from 5 to 20.
As shown in Fig. 3, the set of experiments with μset < μmaxed to an excellent batch-to-batch reproducibility, while the setf experiments with μset = μmax led to a large divergence of theiomass concentration profiles. Of course, one must pay for the
dvantage of a small variability. But the only price is a slightlyonger fermentation time. However this does not make signifi-ant problems in real recombinant therapeutic protein formationrocesses. Finally, however, not only the same biomass con-ig. 3. Measured biomass concentration data from a set of experiments withxponentially increased substrate flow rates. The triangles correspond to feed raterofiles with μset = μmax = 0.55 (1/h), the circles to experiments with μset = 0.51/h) (Jenzsch et al., 2006b).
gBt
5
cIdt
tmrr
m
au1o
ig. 4. Product formation in the open-loop controlled fermentation runs depictedn Fig. 3 (Jenzsch et al., 2006b).
entrations will be reached with such controlled experiments,oreover, higher biomass concentrations can be obtained as the
rocess can be driven closer to the constraints given by the lim-ted oxygen transfer capacity of the bioreactor (Jenzsch et al.,006b).
Then, additionally, it is not only the biomass concentrationhat shows up a lower batch-to-batch variability. This is valid forhe product formation as well, as shown in Fig. 4.
We learned from these experiments that the hard knowledgebout the processes represented by a mechanistic model thatas previously validated at experimental data could be used
or “quality improvements by design”. This result was obtainedy systematically exploiting the theoretical dynamic model ofrowth in the biomass growth phase. In the words of Ludwigoltzmann (1844–1906): “Nothing is more practical than a good
heory”.
. Feedback control
In real industrial environments distortions may appear whichannot simply be compensated for by a robust process operation.n order to guarantee that even then the process will follow theesired paths, the advice in PAT (FDA, 2004) is using control inhe engineering sense (Lee et al., 1999).
The first question arising in practice is what to control in ordero keep the process on track. Generally the major objective is to
aximize the amount of the desired protein. This mass mp can beepresented as a time integral of the specific product formationate π and x over a cultivation time interval (0 tf).
p =∫ tf
0π · x · dt
x is the mass of the cells expressing the protein. The more cells
re employed, the more protein mp can be produced. Thus, man-factures are interested in high-cell-density cultivations (Lee,996; Riesenberg and Guthke, 1999). However, a high numberf cells are not sufficient to get much product; it is essential
184 S. Gnoth et al. / Journal of Biotechnology 132 (2007) 180–186
Fr
tc
aesifcmp
itstphsagomo1LibF
faMtcri
Fig. 6. Typical record of a specific growth rate pattern μ(t) obtained during anE. coli cultivation controlled with a Generic Model Control algorithm togetherwrp
dp
ifsstc
pv
vdF
ig. 5. Specific product formation rate π as a function of the specific growthate μ for a GFP production in an E. coli culture.
hat these cells perform well and this performance property isharacterized by π, the specific product formation rate.
Both variables must simultaneously assume values as larges possible to get a large value of mp. Cell-physiological knowl-dge reveals that the primary influence variable for both is thepecific biomass growth rate μ. This is trivial for x, but in mostndustrially relevant fermentations we found that it is also validor π (e.g., Neidhardt et al., 1990; Pirt, 1994). The reason is thatell replication needs a well running and efficient protein for-ation machinery and this can be employed for foreign protein
roduction as well.In practice, the specific growth rate μ often must not be run at
ts maximum value in order to obtain a maximum product forma-ion performance of the cells. Fig. 5 shows a typical example ofuch a π(μ)-relationship for recombinant proteins dissolved inhe cells’ cytoplasm as for the well-known green fluorescencerotein GFP. The curve depicts a maximum at about 0.14 perour (this relationship is of course specific for this particularystem). Hence, in order to keep the performance of our cellss high as possible, the best solution is to keep their specificrowth rate at that value. Thus, from the physiological point-f-view, μ is the obviously preferred control variable. Hence,any bioprocess engineers considered μ control as the matter
f choice (e.g., Shioya et al., 1985; Lee et al., 1989; Paalme et al.,990; Riesenberg et al., 1991; Shioya, 1992; Yoon et al., 1994;evisauskas et al., 1996; Soons et al., 2006). Now the question
s, how to keep the culture at a predefined growth rate? This cane done with control in the engineering sense, as it is said inDA’s PAT guideline.
There are many control algorithms that can be employedor feedback control (Levisauskas et al., 1996; Pico-Marco etl., 2005; Jenzsch et al., 2006a; Soons et al., 2006). “Genericodel Control”, is a simple model-aided technique that proved
o be a particularly good choice (Jenzsch et al., 2006a). In thisontrol algorithm, knowledge about the process dynamics, isepresented by a simple mechanistic model. In this application,t computes the corrections in the feed rate F, required upon a
rtvv
ith the corresponding setpoint profile (upper graph). The profile of the cor-esponding action variable, the substrate feed rate F(t) is shown in the lowerart.
eviation of the actual specific growth rate μ(t) from its setpointrofiles μset(t).
The typical result, measured by Jenzsch et al. (2006a,b,c,d)s depicted in Fig. 6. It shows that the process can be run per-ectly along the desired setpoint profile. The movements in theubstrate feed rate F(t), taken the action variable to change thepecific growth rate μ(t) are, as shown in the lower part ofhe Figure, quite moderate. This says that the process is underlosed-loop control.
However, this result is only sufficiently good from the cellhysiological point-of-view. From the process-quality point-of-iew, a problem appears that is easy to understand.
When we fix the specific growth rate profiles μ(t) in culti-ation processes, then different initial biomass values lead toifferent biomass trajectories. This is schematically depicted inig. 7. At the end, quite large deviations from the desired path
esult from initial biomasses x0, which deviate only a little fromhe originally projected value. Hence, initially not noticeableariations in the inoculum size lead to quite large batch-to-batchariations.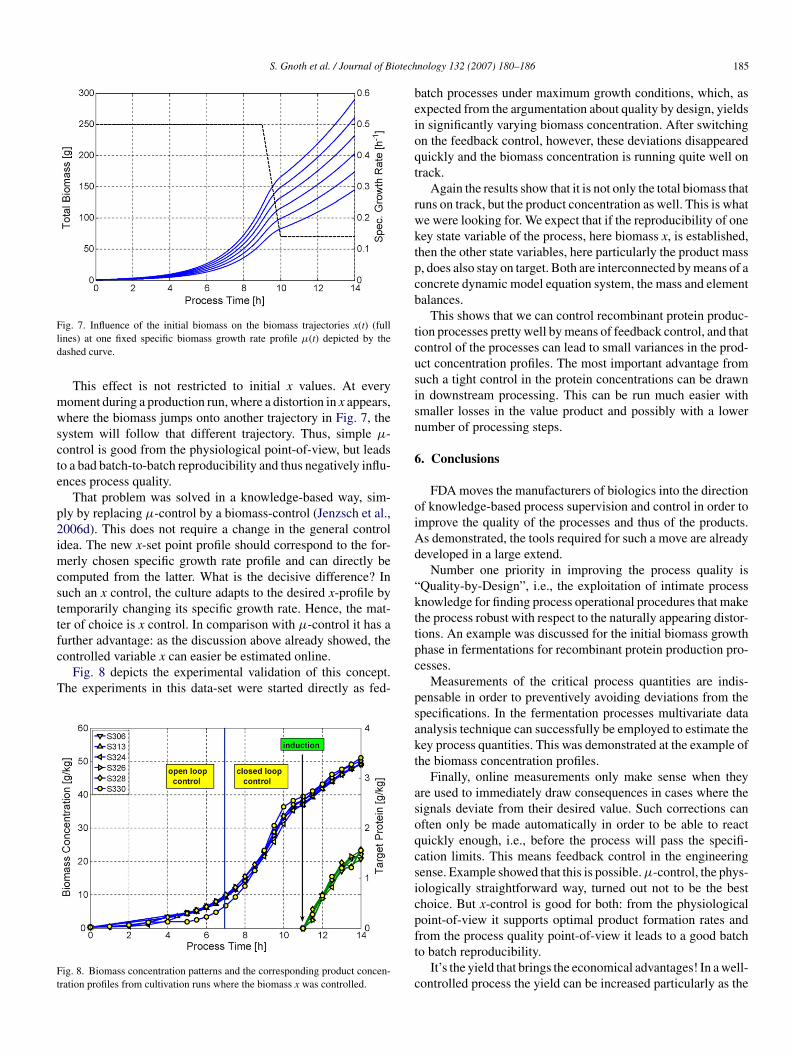
S. Gnoth et al. / Journal of Biotech
Fld
mwscte
p2imcsttfc
T
Ft
beioqt
rwktpcb
tcusisn
6
oiAd
“ktt
ig. 7. Influence of the initial biomass on the biomass trajectories x(t) (fullines) at one fixed specific biomass growth rate profile μ(t) depicted by theashed curve.
This effect is not restricted to initial x values. At everyoment during a production run, where a distortion in x appears,here the biomass jumps onto another trajectory in Fig. 7, the
ystem will follow that different trajectory. Thus, simple μ-ontrol is good from the physiological point-of-view, but leadso a bad batch-to-batch reproducibility and thus negatively influ-nces process quality.
That problem was solved in a knowledge-based way, sim-ly by replacing μ-control by a biomass-control (Jenzsch et al.,006d). This does not require a change in the general controldea. The new x-set point profile should correspond to the for-
erly chosen specific growth rate profile and can directly beomputed from the latter. What is the decisive difference? Inuch an x control, the culture adapts to the desired x-profile byemporarily changing its specific growth rate. Hence, the mat-er of choice is x control. In comparison with μ-control it has aurther advantage: as the discussion above already showed, the
ontrolled variable x can easier be estimated online.Fig. 8 depicts the experimental validation of this concept.he experiments in this data-set were started directly as fed-
ig. 8. Biomass concentration patterns and the corresponding product concen-ration profiles from cultivation runs where the biomass x was controlled.
pc
psakt
asoqcsicpft
c
nology 132 (2007) 180–186 185
atch processes under maximum growth conditions, which, asxpected from the argumentation about quality by design, yieldsn significantly varying biomass concentration. After switchingn the feedback control, however, these deviations disappeareduickly and the biomass concentration is running quite well onrack.
Again the results show that it is not only the total biomass thatuns on track, but the product concentration as well. This is whate were looking for. We expect that if the reproducibility of oneey state variable of the process, here biomass x, is established,hen the other state variables, here particularly the product mass, does also stay on target. Both are interconnected by means of aoncrete dynamic model equation system, the mass and elementalances.
This shows that we can control recombinant protein produc-ion processes pretty well by means of feedback control, and thatontrol of the processes can lead to small variances in the prod-ct concentration profiles. The most important advantage fromuch a tight control in the protein concentrations can be drawnn downstream processing. This can be run much easier withmaller losses in the value product and possibly with a lowerumber of processing steps.
. Conclusions
FDA moves the manufacturers of biologics into the directionf knowledge-based process supervision and control in order tomprove the quality of the processes and thus of the products.s demonstrated, the tools required for such a move are alreadyeveloped in a large extend.
Number one priority in improving the process quality isQuality-by-Design”, i.e., the exploitation of intimate processnowledge for finding process operational procedures that makehe process robust with respect to the naturally appearing distor-ions. An example was discussed for the initial biomass growthhase in fermentations for recombinant protein production pro-esses.
Measurements of the critical process quantities are indis-ensable in order to preventively avoiding deviations from thepecifications. In the fermentation processes multivariate datanalysis technique can successfully be employed to estimate theey process quantities. This was demonstrated at the example ofhe biomass concentration profiles.
Finally, online measurements only make sense when theyre used to immediately draw consequences in cases where theignals deviate from their desired value. Such corrections canften only be made automatically in order to be able to reactuickly enough, i.e., before the process will pass the specifi-ation limits. This means feedback control in the engineeringense. Example showed that this is possible. μ-control, the phys-ologically straightforward way, turned out not to be the besthoice. But x-control is good for both: from the physiologicaloint-of-view it supports optimal product formation rates and
rom the process quality point-of-view it leads to a good batcho batch reproducibility.It’s the yield that brings the economical advantages! In a well-ontrolled process the yield can be increased particularly as the

1 iotech
dt
fttms
A
oh
R
C
D
F
H
I
J
J
J
J
L
L
L
L
L
N
P
P
P
R
R
R
S
S
S
86 S. Gnoth et al. / Journal of B
ownstream processes can be made much more efficient whenheir input material has a smaller variance.
The techniques described here were discussed at examplesrom various genetically modified E. coli bacteria. However,hey are not restricted to them. In the laboratories of the authors,hey were also applied to yeast cultivations, particularly to fer-
entations with Pichia pastoris. The results have been of theame quality.
cknowledgement
This work was supported by the Ministry of Cultural Affairsf Sachsen-Anhalt, Germany. We gratefully acknowledge thiselp.
eferences
hirino, A.J., Mire-Slius, A., 2004. Characterizing biological products andassessing comparability following manufacturing changes. Nat. Biotechnol.22, 1383–1391.
ePalma, A., 2004. PAT: taking process monitoring to next level. Gen. Eng.News 24 (9), 46–47.
DA, 2004. Guidance for Industry: PAT-A Framework for Innova-tive Pharmaceutical Manufacturing & Quality Assurance, http://www.fda.gov/cvm/guidance/published.html.
aykin, S., 1999. Neural Networks: A Comprehensive Foundation, second ed.Prentice Hall, Upper Saddle River, NJ.
CH, 2005. Q9—Quality Risk Management, at Step 4 of the ICH Process,November 9th, 2005. Q8-Q10 available at www.ich.org.
enzsch, M., Simutis, R., Lubbert, A., 2006a. Generic model control of thespecific growth rate in E. coli cultivations. J. Biotechnol. 122, 483–493.
enzsch, M., Gnoth, S., Beck, M., Kleinschmidt, M., Simutis, R., Lubbert, A.,2006b. Open loop control of the biomass concentration within the growthphase of recombinant protein production processes. J. Biotechnol. 127,84–94.
enzsch, M., Simutis, R., Eisbrenner, G., Stuckrath, I., Lubbert, A., 2006c. Esti-mation of biomass concentrations in fermentation processes for recombinant
protein production. Bioproc. Biosyst. Eng. 29 (1), 19–27.enzsch, M., Gnoth, S., Kleinschmidt, M., Simutis, R., Lubbert, A., 2006d.Improving the batch-to-batch reproducibility in microbial cultures duringrecombinant protein production by guiding the process along a predefinedtotal biomass profile. Bioproc. Biosyst. Eng 29 (5–6), 315–321.
Y
nology 132 (2007) 180–186
ee, S.Y., 1996. High cell-density culture of Escherichia coli. Trends Biotechnol.14, 98–105.
ee, J., Youn-Hee, C., Shin-Kwon, K., Hyung-Hwan, P., Ik-Boo, K., 1989.Production of human leukocyte interferon in Escherichia coli by con-trol of growth rate in fed-batch fermentation. Biotechnol. Lett. 11, 695–698.
ee, J., Lee, S.Y., Park, S., Middelberg, A.P.J., 1999. Control of fed-batchfermentations. Biotechnol. Adv. 17, 29–48.
evisauskas, D., Simutis, R., Borvitz, D., Lubbert, A., 1996. Automatic con-trol of the specific growth rate in fed-batch cultivations processes based onexhaust gas analysis. Bioproc. Eng. 15, 145–150.
evisauskas, D., Galvanauskas, V., Henrich, S., Wilhelm, K., Volk, N., Lubbert,A., 2003. Model-based optimization of viral capsid protein production infed-batch culture of recombinant Escherichia coli. Bioproc. Biosyst. Eng.25, 255–262.
eidhardt, F.C., Ingraham, J.L., Schaechter, M., 1990. Physiology of the Bac-terial Cell, a Molecular Approach. Sinauer, Sunderland, MA.
aalme, T., Tiisma, K., Kahru, A., Vanatalu, K., Vilu, R., 1990. Glucose-limitedfed-batch cultivation of Escherichia coli with computer-controlled fixedgrowth rate. Biotechnol. Bioeng. 35, 312–319.
ico-Marco, E., Pico, J., De Battista, H., 2005. Sliding mode scheme for adaptivespecific growth rate control in biotechnological fed-batch processes (2005).Int. J. Control 78 (2), 128–141.
irt, S.J., 1994. Product Formation in Cultures of Microbes. Pirtferm Papers,Pirtferm Ltd., London.
iesenberg, D., Guthke, R., 1999. High-cell-density cultivation of microorgan-isms. Appl. Microbiol. Biotechnol. 51, 422–430.
iesenberg, D., Schulz, V., Knorre, W.A., Pohl, H.D., Korz, D., Sanders, E.A.,Ross, A., Deckwer, W.D., 1991. High cell density cultivation of Escherichiacoli at controlled specific growth rate. J. Biotechnol. 20, 17–28.
umelhard, D.E., McClelland, J.L., 1986. Parallel Distributed Processing, vol.1. MIT Press, Cambridge, MA.
hioya, S., 1992. Optimization and control in fed-batch bioreactors. Adv.Biochem. Eng./Biotechnol. 46, 112–142.
hioya, S., Shimizu, H., Ogata, M., Takamatsu, T., 1985. Simulation andexperimental studies of the profile control of the specific growth ratein a fed-batch culture. IFAC Modelling and Control of Biotechno-logical Processes, vol. 10. Pergamon Press, Oxford, Noordwijkerhout,pp. 79–84.
oons, Z.I.T.A., Voogt, J.A., van Straten, G., van Boxtel, A.J.B., 2006. Constant
specific growth rate in fed-batch cultivation of Bordetella pertussis usingadaptive control. J. Biotechnol. 125, 252–268.oon, S.K., Kang, W.K., Park, T.H., 1994. Fed-batch operation of recombinantEscherichia coli containing Trp promoter with controlled specific growthrate. Biotechnol. Bioeng. 43, 995–999.