Combination of imaging spectrometer data and high resolution LIDAR data by 3-D radiative transfer...
6
Combination of Imaging Spectrometer Data and High-Resolution LIDAR Data by 3-D Radiative Transfer Modeling Benjamin Koetz, a Felix Morsdorf, a Mathias Kneubuehler, a Michael Schaepman, b Erich Meier, a Klaus Itten, a and Britta Allgoewer c 1 Introduction Coniferous forests represent canopies with a high heterogeneity in the horizontal and as well in the vertical dimension. Consequently the interaction of incident radiation is dominated by the complex 3-D canopy structure and architecture. Radiative transfer approaches based on coupled leaf and canopy radiative transfer models (RTM) still allow the simulation of the multi- directional canopy reflectance as a function of leaf optical properties, canopy structure and viewing geometry as well as the retrieval of biophysical and biochemical canopy variables. High-resolution imaging spectrometry supported by light detection and ranging (LIDAR) data and the complex 3-D radiative transfer model FLIGHT (North, 1996) are employed to assess the influence of canopy heterogeneity and structure on canopy reflection. Exhaustive ground measurements of biochemical and biophysical parameters combined with the geometry of single trees derived from LIDAR data provide the possibility of a realistic scene parameterization of a boreal forest in Switzerland. 2 Data This study is based on an extensive field campaign during summer 2002 in the Eastern Ofenpass valley, which is part of the Swiss National Park (SNP) (Kötz et al., 2004). The Ofenpass represents an inner-alpine valley at an average altitude of about 1900 m above [mean] sea level (a.s.l) with annual precipitation of 900-1100 mm. The south-facing Ofenpass forests, the location of the field measurement, are largely dominated by mountain pine (Pinus montana ssp. arborea) and some stone pine (Pinus cembra L.) a second tree specie that is of interest for natural succession (Zoller, 1992; Zoller, 1995; Lauber and Wagner, 1996). These forest stands can be classified as woodland associations of Erico-Pinetum mugo (Zoller, 1995). Unique ground-based characterization of the canopy structure, biochemistry and optical properties of the canopy elements were conducted using various instruments, ranging from non-destructive spectroradiometric measurements to dry biomass estimation of needles. The field data have been collected on four core test sites each subdivided into 9 plots spaced in a grid of 10 meters. The core test sites were selected following a stratified sampling scheme to cover different canopy densities within a stand of Pinus montana ssp. arborea (Fig.1). They were set up according to the elementary sampling units of the VALidation of Land European Remote-sensing Instruments (VALERI) scheme (Baret et al., submitted). For the presented study we selected two test sites (LWF1 and STA1) representing different canopy densities. a Remote Sensing Laboratories (RSL), Dept. of Geography, University of Zurich, Winterthurerstrasse 190, CH- 8057 Zurich, Switzerland, Email: [email protected] b Centre for Geo-Information, Wageningen University and Research Centre, Droevendaalsesteeg 3, NL-6708 PB Wageningen, The Netherlands c Geographic Information Systems, Dept. of Geography, University of Zurich, Winterthurerstrasse 190, CH-8057 Zurich, Switzerland
Transcript of Combination of imaging spectrometer data and high resolution LIDAR data by 3-D radiative transfer...
Combination of Imaging Spectrometer Data and High-Resolution LIDAR Data by 3-D Radiative Transfer Modeling
Benjamin Koetz,a Felix Morsdorf,a Mathias Kneubuehler,a Michael Schaepman,b Erich Meier,a Klaus Itten,a and Britta Allgoewerc
1 Introduction Coniferous forests represent canopies with a high heterogeneity in the horizontal and as
well in the vertical dimension. Consequently the interaction of incident radiation is dominated by the complex 3-D canopy structure and architecture. Radiative transfer approaches based on coupled leaf and canopy radiative transfer models (RTM) still allow the simulation of the multi-directional canopy reflectance as a function of leaf optical properties, canopy structure and viewing geometry as well as the retrieval of biophysical and biochemical canopy variables.
High-resolution imaging spectrometry supported by light detection and ranging (LIDAR) data and the complex 3-D radiative transfer model FLIGHT (North, 1996) are employed to assess the influence of canopy heterogeneity and structure on canopy reflection. Exhaustive ground measurements of biochemical and biophysical parameters combined with the geometry of single trees derived from LIDAR data provide the possibility of a realistic scene parameterization of a boreal forest in Switzerland.
2 Data This study is based on an extensive field campaign during summer 2002 in the Eastern
Ofenpass valley, which is part of the Swiss National Park (SNP) (Kötz et al., 2004). The Ofenpass represents an inner-alpine valley at an average altitude of about 1900 m above [mean] sea level (a.s.l) with annual precipitation of 900-1100 mm. The south-facing Ofenpass forests, the location of the field measurement, are largely dominated by mountain pine (Pinus montana ssp. arborea) and some stone pine (Pinus cembra L.) a second tree specie that is of interest for natural succession (Zoller, 1992; Zoller, 1995; Lauber and Wagner, 1996). These forest stands can be classified as woodland associations of Erico-Pinetum mugo (Zoller, 1995). Unique ground-based characterization of the canopy structure, biochemistry and optical properties of the canopy elements were conducted using various instruments, ranging from non-destructive spectroradiometric measurements to dry biomass estimation of needles.
The field data have been collected on four core test sites each subdivided into 9 plots spaced in a grid of 10 meters. The core test sites were selected following a stratified sampling scheme to cover different canopy densities within a stand of Pinus montana ssp. arborea (Fig.1). They were set up according to the elementary sampling units of the VALidation of Land European Remote-sensing Instruments (VALERI) scheme (Baret et al., submitted). For the presented study we selected two test sites (LWF1 and STA1) representing different canopy densities.
a Remote Sensing Laboratories (RSL), Dept. of Geography, University of Zurich, Winterthurerstrasse 190, CH-
8057 Zurich, Switzerland, Email: [email protected] b Centre for Geo-Information, Wageningen University and Research Centre, Droevendaalsesteeg 3, NL-6708 PB
Wageningen, The Netherlands c Geographic Information Systems, Dept. of Geography, University of Zurich, Winterthurerstrasse 190, CH-8057
Zurich, Switzerland
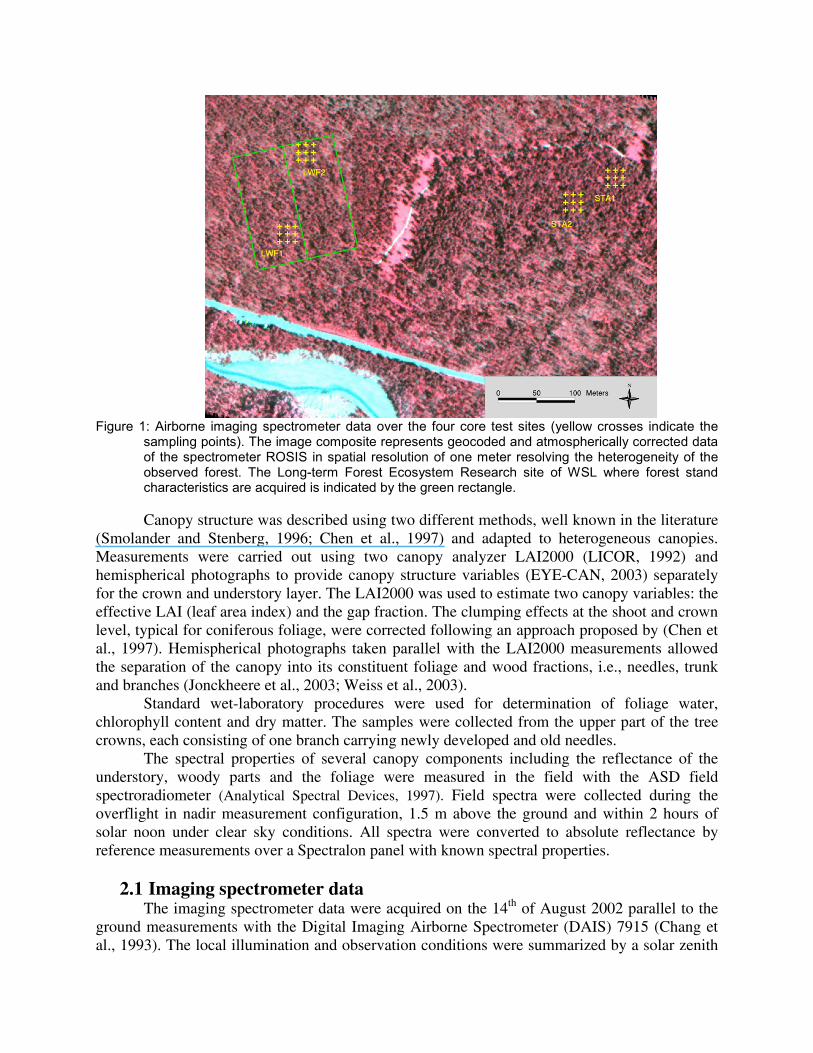
Figure 1: Airborne imaging spectrometer data over the four core test sites (yellow crosses indicate the
sampling points). The image composite represents geocoded and atmospherically corrected data of the spectrometer ROSIS in spatial resolution of one meter resolving the heterogeneity of the observed forest. The Long-term Forest Ecosystem Research site of WSL where forest stand characteristics are acquired is indicated by the green rectangle.
Canopy structure was described using two different methods, well known in the literature
(Smolander and Stenberg, 1996; Chen et al., 1997) and adapted to heterogeneous canopies. Measurements were carried out using two canopy analyzer LAI2000 (LICOR, 1992) and hemispherical photographs to provide canopy structure variables (EYE-CAN, 2003) separately for the crown and understory layer. The LAI2000 was used to estimate two canopy variables: the effective LAI (leaf area index) and the gap fraction. The clumping effects at the shoot and crown level, typical for coniferous foliage, were corrected following an approach proposed by (Chen et al., 1997). Hemispherical photographs taken parallel with the LAI2000 measurements allowed the separation of the canopy into its constituent foliage and wood fractions, i.e., needles, trunk and branches (Jonckheere et al., 2003; Weiss et al., 2003).
Standard wet-laboratory procedures were used for determination of foliage water, chlorophyll content and dry matter. The samples were collected from the upper part of the tree crowns, each consisting of one branch carrying newly developed and old needles.
The spectral properties of several canopy components including the reflectance of the understory, woody parts and the foliage were measured in the field with the ASD field spectroradiometer (Analytical Spectral Devices, 1997). Field spectra were collected during the overflight in nadir measurement configuration, 1.5 m above the ground and within 2 hours of solar noon under clear sky conditions. All spectra were converted to absolute reflectance by reference measurements over a Spectralon panel with known spectral properties.
2.1 Imaging spectrometer data
The imaging spectrometer data were acquired on the 14th of August 2002 parallel to the ground measurements with the Digital Imaging Airborne Spectrometer (DAIS) 7915 (Chang et al., 1993). The local illumination and observation conditions were summarized by a solar zenith
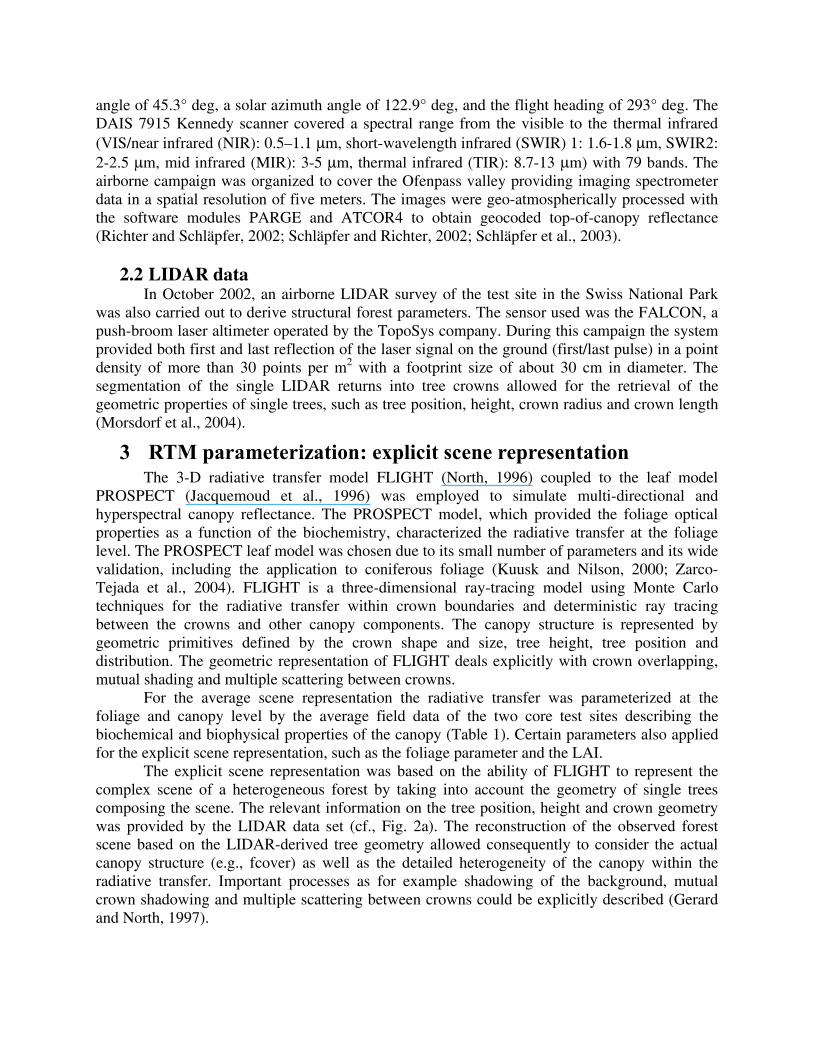
angle of 45.3° deg, a solar azimuth angle of 122.9° deg, and the flight heading of 293° deg. The DAIS 7915 Kennedy scanner covered a spectral range from the visible to the thermal infrared (VIS/near infrared (NIR): 0.5–1.1 µm, short-wavelength infrared (SWIR) 1: 1.6-1.8 µm, SWIR2: 2-2.5 µm, mid infrared (MIR): 3-5 µm, thermal infrared (TIR): 8.7-13 µm) with 79 bands. The airborne campaign was organized to cover the Ofenpass valley providing imaging spectrometer data in a spatial resolution of five meters. The images were geo-atmospherically processed with the software modules PARGE and ATCOR4 to obtain geocoded top-of-canopy reflectance (Richter and Schläpfer, 2002; Schläpfer and Richter, 2002; Schläpfer et al., 2003).
2.2 LIDAR data
In October 2002, an airborne LIDAR survey of the test site in the Swiss National Park was also carried out to derive structural forest parameters. The sensor used was the FALCON, a push-broom laser altimeter operated by the TopoSys company. During this campaign the system provided both first and last reflection of the laser signal on the ground (first/last pulse) in a point density of more than 30 points per m2 with a footprint size of about 30 cm in diameter. The segmentation of the single LIDAR returns into tree crowns allowed for the retrieval of the geometric properties of single trees, such as tree position, height, crown radius and crown length (Morsdorf et al., 2004).
3 RTM parameterization: explicit scene representation The 3-D radiative transfer model FLIGHT (North, 1996) coupled to the leaf model
PROSPECT (Jacquemoud et al., 1996) was employed to simulate multi-directional and hyperspectral canopy reflectance. The PROSPECT model, which provided the foliage optical properties as a function of the biochemistry, characterized the radiative transfer at the foliage level. The PROSPECT leaf model was chosen due to its small number of parameters and its wide validation, including the application to coniferous foliage (Kuusk and Nilson, 2000; Zarco-Tejada et al., 2004). FLIGHT is a three-dimensional ray-tracing model using Monte Carlo techniques for the radiative transfer within crown boundaries and deterministic ray tracing between the crowns and other canopy components. The canopy structure is represented by geometric primitives defined by the crown shape and size, tree height, tree position and distribution. The geometric representation of FLIGHT deals explicitly with crown overlapping, mutual shading and multiple scattering between crowns.
For the average scene representation the radiative transfer was parameterized at the foliage and canopy level by the average field data of the two core test sites describing the biochemical and biophysical properties of the canopy (Table 1). Certain parameters also applied for the explicit scene representation, such as the foliage parameter and the LAI.
The explicit scene representation was based on the ability of FLIGHT to represent the complex scene of a heterogeneous forest by taking into account the geometry of single trees composing the scene. The relevant information on the tree position, height and crown geometry was provided by the LIDAR data set (cf., Fig. 2a). The reconstruction of the observed forest scene based on the LIDAR-derived tree geometry allowed consequently to consider the actual canopy structure (e.g., fcover) as well as the detailed heterogeneity of the canopy within the radiative transfer. Important processes as for example shadowing of the background, mutual crown shadowing and multiple scattering between crowns could be explicitly described (Gerard and North, 1997).
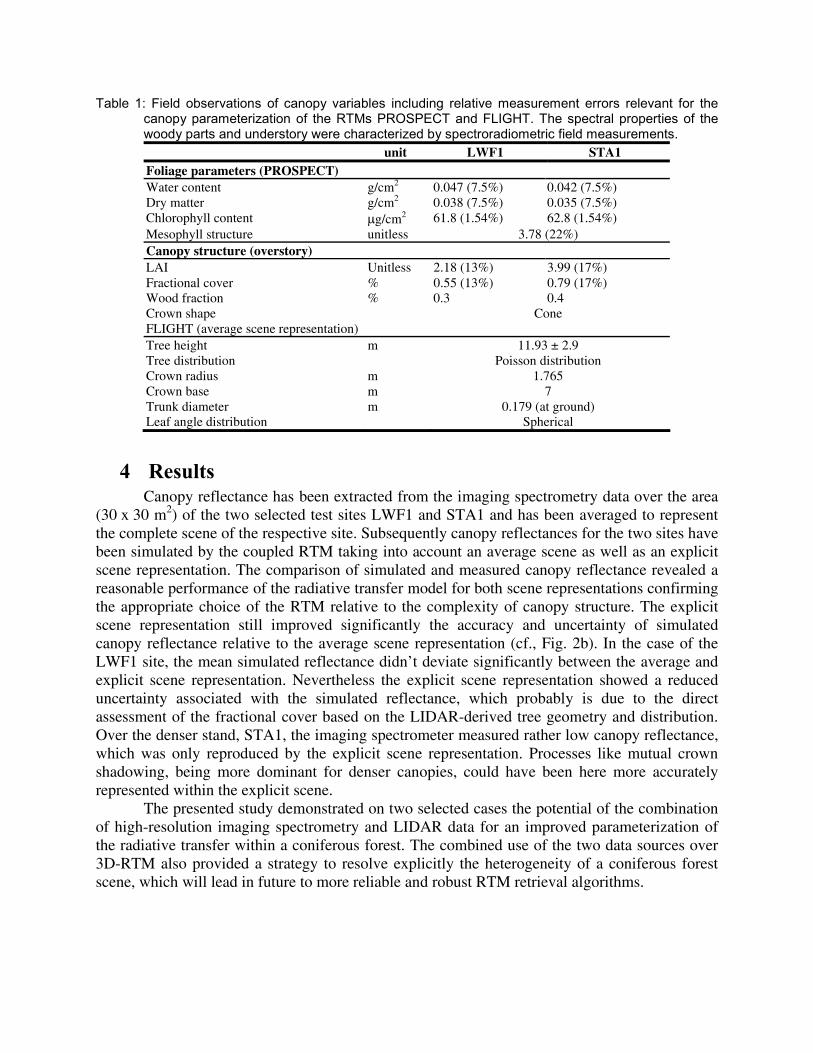
Table 1: Field observations of canopy variables including relative measurement errors relevant for the canopy parameterization of the RTMs PROSPECT and FLIGHT. The spectral properties of the woody parts and understory were characterized by spectroradiometric field measurements. unit LWF1 STA1 Foliage parameters (PROSPECT) Water content g/cm2 0.047 (7.5%) 0.042 (7.5%) Dry matter g/cm2 0.038 (7.5%) 0.035 (7.5%) Chlorophyll content µg/cm2 61.8 (1.54%) 62.8 (1.54%) Mesophyll structure unitless 3.78 (22%) Canopy structure (overstory) LAI Unitless 2.18 (13%) 3.99 (17%) Fractional cover % 0.55 (13%) 0.79 (17%) Wood fraction % 0.3 0.4 Crown shape Cone FLIGHT (average scene representation) Tree height m 11.93 ± 2.9 Tree distribution Poisson distribution Crown radius m 1.765 Crown base m 7 Trunk diameter m 0.179 (at ground) Leaf angle distribution Spherical
4 Results Canopy reflectance has been extracted from the imaging spectrometry data over the area
(30 x 30 m2) of the two selected test sites LWF1 and STA1 and has been averaged to represent the complete scene of the respective site. Subsequently canopy reflectances for the two sites have been simulated by the coupled RTM taking into account an average scene as well as an explicit scene representation. The comparison of simulated and measured canopy reflectance revealed a reasonable performance of the radiative transfer model for both scene representations confirming the appropriate choice of the RTM relative to the complexity of canopy structure. The explicit scene representation still improved significantly the accuracy and uncertainty of simulated canopy reflectance relative to the average scene representation (cf., Fig. 2b). In the case of the LWF1 site, the mean simulated reflectance didn’t deviate significantly between the average and explicit scene representation. Nevertheless the explicit scene representation showed a reduced uncertainty associated with the simulated reflectance, which probably is due to the direct assessment of the fractional cover based on the LIDAR-derived tree geometry and distribution. Over the denser stand, STA1, the imaging spectrometer measured rather low canopy reflectance, which was only reproduced by the explicit scene representation. Processes like mutual crown shadowing, being more dominant for denser canopies, could have been here more accurately represented within the explicit scene.
The presented study demonstrated on two selected cases the potential of the combination of high-resolution imaging spectrometry and LIDAR data for an improved parameterization of the radiative transfer within a coniferous forest. The combined use of the two data sources over 3D-RTM also provided a strategy to resolve explicitly the heterogeneity of a coniferous forest scene, which will lead in future to more reliable and robust RTM retrieval algorithms.
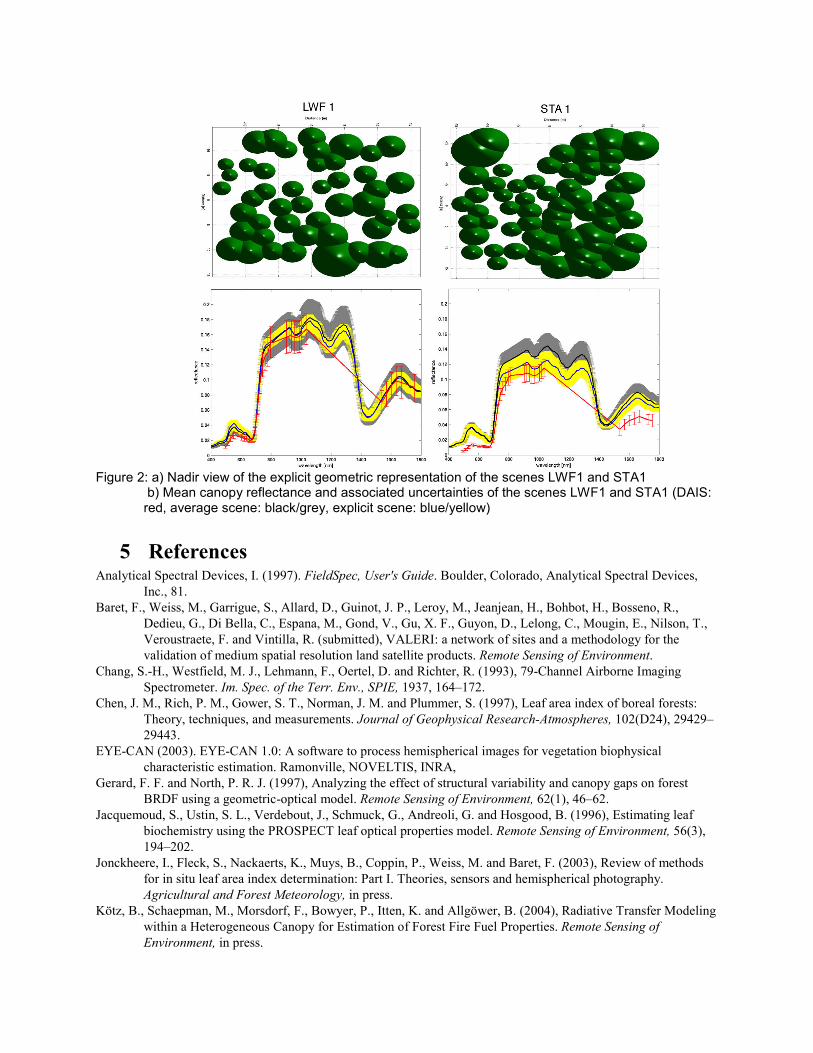
Figure 2: a) Nadir view of the explicit geometric representation of the scenes LWF1 and STA1
b) Mean canopy reflectance and associated uncertainties of the scenes LWF1 and STA1 (DAIS: red, average scene: black/grey, explicit scene: blue/yellow)
5 References Analytical Spectral Devices, I. (1997). FieldSpec, User's Guide. Boulder, Colorado, Analytical Spectral Devices,
Inc., 81. Baret, F., Weiss, M., Garrigue, S., Allard, D., Guinot, J. P., Leroy, M., Jeanjean, H., Bohbot, H., Bosseno, R.,
Dedieu, G., Di Bella, C., Espana, M., Gond, V., Gu, X. F., Guyon, D., Lelong, C., Mougin, E., Nilson, T., Veroustraete, F. and Vintilla, R. (submitted), VALERI: a network of sites and a methodology for the validation of medium spatial resolution land satellite products. Remote Sensing of Environment.
Chang, S.-H., Westfield, M. J., Lehmann, F., Oertel, D. and Richter, R. (1993), 79-Channel Airborne Imaging Spectrometer. Im. Spec. of the Terr. Env., SPIE, 1937, 164–172.
Chen, J. M., Rich, P. M., Gower, S. T., Norman, J. M. and Plummer, S. (1997), Leaf area index of boreal forests: Theory, techniques, and measurements. Journal of Geophysical Research-Atmospheres, 102(D24), 29429–29443.
EYE-CAN (2003). EYE-CAN 1.0: A software to process hemispherical images for vegetation biophysical characteristic estimation. Ramonville, NOVELTIS, INRA,
Gerard, F. F. and North, P. R. J. (1997), Analyzing the effect of structural variability and canopy gaps on forest BRDF using a geometric-optical model. Remote Sensing of Environment, 62(1), 46–62.
Jacquemoud, S., Ustin, S. L., Verdebout, J., Schmuck, G., Andreoli, G. and Hosgood, B. (1996), Estimating leaf biochemistry using the PROSPECT leaf optical properties model. Remote Sensing of Environment, 56(3), 194–202.
Jonckheere, I., Fleck, S., Nackaerts, K., Muys, B., Coppin, P., Weiss, M. and Baret, F. (2003), Review of methods for in situ leaf area index determination: Part I. Theories, sensors and hemispherical photography. Agricultural and Forest Meteorology, in press.
Kötz, B., Schaepman, M., Morsdorf, F., Bowyer, P., Itten, K. and Allgöwer, B. (2004), Radiative Transfer Modeling within a Heterogeneous Canopy for Estimation of Forest Fire Fuel Properties. Remote Sensing of Environment, in press.
Kuusk, A. and Nilson, T. (2000), A directional multispectral forest reflectance model. Remote Sensing of Environment, 72(2), 244–252.
Lauber, K. and Wagner, G. (1996). Flora Helvetica. Flora der Schweiz. Bern, Stuttgard, Wien, Paul Haupt Verlag, pp. 1613.
LICOR (1992). LAI-2000 Plant Canopy Analyzer – Operating Manual. Lincoln, Nebraska, LI-COR, Inc., Morsdorf, F., Meier, E., Kötz, B., Itten, K. and Allgöwer, B. (2004), LIDAR based geometric reconstruction of
broreal type forest stands at single tree level for forest and wildland fire management. Remote Sensing of Environment, in press.
North, P. R. J. (1996), Three-dimensional forest light interaction model using a Monte Carlo method. Ieee Transactions on Geoscience and Remote Sensing, 34(4), 946–956.
Richter, R. and Schläpfer, D. (2002), Geo-atmospheric processing of airborne imaging spectrometry data. Part 2: atmospheric/topographic correction. International Journal of Remote Sensing, 23(13), 2631–2649.
Schläpfer, D., Koetz, B. and Gruber, S. (2003). The influence of DEM characteristics on preprocessing of DAIS/ROSIS data in high altitude alpine terrain. 3rd EARSEL Workshop on Imaging Spectroscopy, Oberpfaffenhofen,
Schläpfer, D. and Richter, R. (2002), Geo-atmospheric processing of airborne imaging spectrometry data. Part 1: parametric orthorectification. International Journal of Remote Sensing, 23(13), 2609–2630.
Smolander, H. and Stenberg, P. (1996), Response of LAI-2000 estimates to changes in plant surface area index in a Scots pine stand. Tree Physiology, 16(3), 345–349.
Weiss, M., Baret, F., Smith, G. J., Jonckheere, I. and Coppin, P. (2003), Review of methods for in situ leaf area index (LAI) determination Part II: Estimation of LAI, errors and sampling. Agricultural and Forest Meteorology, in press.
Zarco-Tejada, P. J., Miller, J. R., Harron, J., Hu, B., Noland, T. L., Goel, N., Mohammed, G. H. and Sampson, P. H. (2004), Needle chlorophyll content estimation through model inversion using hyperspectral data from boreal conifer forest canopies. Remote Sensing of Environment, 89(2), 189–199.
Zoller, H. (1992). Vegetationskarte des Schweizerischen Nationalparks und seiner Umgebung. Bern, Hallwag AG. Zoller, H. (1995). Vegetationskarte des Schweizerischen Nationalparks. Erläuterungen. National Park Forschnung,
pp. 108.