Fast radiative cooling of anthracene: Dependence on internal ...
14
HAL Id: hal-01673975 https://hal.archives-ouvertes.fr/hal-01673975 Submitted on 12 Feb 2021 HAL is a multi-disciplinary open access archive for the deposit and dissemination of sci- entific research documents, whether they are pub- lished or not. The documents may come from teaching and research institutions in France or abroad, or from public or private research centers. L’archive ouverte pluridisciplinaire HAL, est destinée au dépôt et à la diffusion de documents scientifiques de niveau recherche, publiés ou non, émanant des établissements d’enseignement et de recherche français ou étrangers, des laboratoires publics ou privés. Fast radiative cooling of anthracene: Dependence on internal energy S. Martin, M. Ji, J. Bernard, R. Brédy, B. Concina, Abdul-Rahman Allouche, C. Joblin, C. Ortega, G. Montagne, A. Cassimi, et al. To cite this version: S. Martin, M. Ji, J. Bernard, R. Brédy, B. Concina, et al.. Fast radiative cooling of anthracene: Depen- dence on internal energy. Physical Review A, American PhysicalSociety, 2015, 92 (5), 10.1103/Phys- RevA.92.053425. hal-01673975
-
Upload
khangminh22 -
Category
Documents
-
view
1 -
download
0
Transcript of Fast radiative cooling of anthracene: Dependence on internal ...

HAL Id: hal-01673975https://hal.archives-ouvertes.fr/hal-01673975
Submitted on 12 Feb 2021
HAL is a multi-disciplinary open accessarchive for the deposit and dissemination of sci-entific research documents, whether they are pub-lished or not. The documents may come fromteaching and research institutions in France orabroad, or from public or private research centers.
L’archive ouverte pluridisciplinaire HAL, estdestinée au dépôt et à la diffusion de documentsscientifiques de niveau recherche, publiés ou non,émanant des établissements d’enseignement et derecherche français ou étrangers, des laboratoirespublics ou privés.
Fast radiative cooling of anthracene: Dependence oninternal energy
S. Martin, M. Ji, J. Bernard, R. Brédy, B. Concina, Abdul-Rahman Allouche,C. Joblin, C. Ortega, G. Montagne, A. Cassimi, et al.
To cite this version:S. Martin, M. Ji, J. Bernard, R. Brédy, B. Concina, et al.. Fast radiative cooling of anthracene: Depen-dence on internal energy. Physical Review A, American Physical Society, 2015, 92 (5), �10.1103/Phys-RevA.92.053425�. �hal-01673975�

PHYSICAL REVIEW A 92, 053425 (2015)
Fast radiative cooling of anthracene: Dependence on internal energy
S. Martin,1 M. Ji,1 J. Bernard,1 R. Bredy,1 B. Concina,1 A. R. Allouche,1 C. Joblin,2,3 C. Ortega,1
G. Montagne,1 A. Cassimi,4 Y. Ngono-Ravache,4 and L. Chen1,*
1Institut Lumiere Matiere, UMR5306, Universite Lyon 1-CNRS, Universite de Lyon, 69622 Villeurbanne Cedex, France2Universite de Toulouse, UPS-OMP, IRAP, Toulouse, France
3CNRS, IRAP, 9 Avenue Colonel Roche, BP 44346, F-31028 Toulouse Cedex 4, France4CIMAP, CEA/CNRS/ENSICAEN/Universite Caen Normandie, Boulevard H. Becquerel, BP 5133, F-14070 Caen cedex 5, France
(Received 17 July 2015; published 25 November 2015)
Fast radiative cooling of anthracene cations (C14H10)+ is studied with a compact electrostatic storage device,the Mini-Ring. The time evolution of the internal energy distribution of the stored ions is probed in a timerange from 3 to 7 ms using laser-induced dissociation with 3.49-eV photons. The population decay rate dueto radiative emission is measured to vary from 25 to 450 s–1 as a function of the excitation energy in the rangefrom 6 to 7.4 eV. After corrections of the infrared emission effect via vibrational transitions, the fluorescenceemission rate due to electronic transitions from thermally excited electronic states is estimated and comparedwith a statistical molecular approach. In the considered internal energy range, the radiative cooling process isfound to be dominated by the electronic transition, in good agreement with our previous work [S. Martin et al.,Phys. Rev. Lett. 110, 063003 (2013)] focused on a narrower energy range.
DOI: 10.1103/PhysRevA.92.053425 PACS number(s): 37.10.Mn, 33.80.−b, 37.10.Pq, 95.30.Ft
I. INTRODUCTION
Polycyclic aromatic hydrocarbon (PAH) molecules are keychemical species in astrophysics, combustion, and environ-mental studies. The ubiquitous presence of PAH moleculesin the interstellar medium (ISM) was proposed 30 yearsago [1,2] and has motivated a considerable effort in thelaboratory to study the physical and chemical properties ofthese species (see [3] for a compilation of studies). Polycyclicaromatic hydrocarbon molecules in the ISM are revealed byemission in specific IR bands following the absorption ofUV photons. Their survival depends then on the competitionbetween the two main energy decay routes: the unimoleculardissociation and radiative cooling. It is generally admittedthat after absorption of a UV photon, internal conversionfrom the electronic excited state followed by intermolecularvibrational distribution in the ground electronic state leads tohot molecules. The IR cooling rate has been calculated to bein the range from ∼1 to ∼10 s–1 without a strong dependenceon size. With such a slow radiative decay mechanism, PAHmolecules are expected to experience severe photodissociationunless they are large enough (more than 50 carbon atomsaccording to [4]). Leger et al. considered an additionalradiative decay mechanism that would lead to faster radiativecooling especially at high energies [5,6]. This mechanismis based upon the fact that excited electronic states may bepopulated by interaction with the electronic ground state athigh enough internal energy due to inverse internal conversion.Even though the population probability is very low, theEinstein coefficient for spontaneous electronic transition ofsuch excited states could be several orders of magnitude largerthan the IR vibrational emission rate leading to faster coolingvia visible fluorescence emission. The latter is called Poincarefluorescence in [5] and its first indirect evidence was reportedfor the PAH cation anthracene C14H10
+ [7]. In more recent
works on this small PAH molecule, the fast radiative decay rateof the anthracene cation was measured [8] and calculationsof its structure and spectral properties were performed [9].A similar radiative decay process has been referred to asfluorescence from thermally excited electronic states in studieson large molecules such as fullerenes [10–12] and on smallcluster anions Aln− (n = 4–5) [13,14]. Studies on smallcarbonaceous anions, namely, C5
−, C6−, C6H−, and C7
−, havedemonstrated the dramatic effect of the electronic structure onradiative cooling, which was found to be limited to IR emissionin the case of C5
− and C6H− and much faster for the otherspecies due to the fluorescence from electronic states [15–17].For fullerene and metal clusters, radiative cooling rates fromelectronic states were calculated using a dielectric model basedon a plasmon description [18]. For anthracene, Boissel et al. [7]used a statistical molecular approach to estimate the populationprobability of the excited states and their emission rates.They showed that the calculated cooling rate allowed themto account for the evolution of the fragmentation efficiencywith the period of modulation of the UV light.
A direct way to obtain the electronic fluorescence ratewould involve the detection of the emitted (visible or near-IR)photons. However, despite it being a fast cooling processcompared to IR emission, this fluorescence is actually slowwith a typical lifetime larger than 1 ms. Ion storage techniquesare needed to study decay processes on such a time scale.Linear or bend electrostatic ion-beam storage traps (EIBT) orrings [19–28] have been developed to study the dynamics ofdelayed photofragmentation, electron photodetachment, andphotoionization processes for time scales between microsec-onds and a few tens of milliseconds. With these devices,it becomes possible to get insight into cooling rates bymonitoring neutral dissociation products and following theevolution of the internal energy distribution (IED) of the storedmolecular ensemble. We constructed a small electrostaticstorage ring (ESR) [27], called Mini-Ring, which combined theadvantages of the large ESRs and the small EIBTs. Similarlyto larger ESR experiments, the stored ions can be excited
1050-2947/2015/92(5)/053425(13) 053425-1 ©2015 American Physical Society

S. MARTIN et al. PHYSICAL REVIEW A 92, 053425 (2015)
along one of the straight sections (of 9.2 cm long) by a laserbeam. Neutral fragments resulting from dissociation processesoccurring at the opposite straight section can be detected as afunction of time. Due to the compactness of this device andthe short ion revolution period (a few microseconds), we areable to measure the laser-induced dissociation in a typical timerange from the very first microsecond to about 1ms after laserexcitation. Compared with larger rings with a much longerrevolution period, the Mini-Ring is very sensitive to the high-energy part of the IED of the stored molecular ion ensemble.
In this paper we focus on the radiative cooling of anthracenecations and its dependence on internal excitation energy.Anthracene cations were stored in the Mini-Ring for sucha long time that the dissociation was a negligible processin the experimental time range. The further evolution of theIED of the stored ions was probed by the absorption of asingle 3.49-eV photon at different storage times followedby delayed fragmentation. The evolution of the high-energyedge of the IED versus the storage time was analyzed todetermine the radiative-emission-induced population decayrate as a function of the energy. The electronic fluorescencerates were derived from the measured population decay ratesby correcting the minor contributions of IR emissions. Theestimated energy-dependent electronic fluorescence rates werefitted with theoretical values calculated using the Poincarefluorescence model with a modified spontaneous emission rate.
II. EXPERIMENTAL PROCEDURE
The experimental setup including details about the Mini-Ring has been described in previous papers [27,8]; we givehere only a description of the latest updates. The schematicview of the Mini-Ring is shown in Fig. 1. Compared to itsearlier design in [27], the setup has been modified in orderto improve the experimental conditions. Among the recentdevelopments, we emphasize here the following points.
(i) The kinetic energy of the ion beam has been increasedfrom 2 to 12 keV in order to obtain a better beam shape, higherbeam intensity, higher neutral detection efficiency, and weakerbetatron oscillation effect.
(ii) Tilted deflection plates (D1 − D4) (by an angle of7°) have been installed in order to reduce the noise on theneutral detector and to improve the storage conditions with iontrajectories that remain far enough from the electrode edges.
Position analyzer (M.C.P)
D1 D2
D3D4
FIG. 1. (Color online) Schematic view of the Mini-Ring com-posed of two off-axis electrostatic reflectors (C1 and C2) and fourdeflection plates (D1 − D4). The stored ion trajectory was simulatedwith the SIMION software.
FIG. 2. (Color online) Picture of the Mini-Ring and the trajectoryof the Ar+ ion beam stored for a single turn in the chamber filled withnitrogen gas of pressure about 10–4 mbar.
(iii) For neutral detection, the small channeltron electronmultiplier has been replaced by a position-sensitive detector(PSD) (Quantar Technology Inc., Santa Cruz CA) composedof two multichannel plates (MCPs) and a resistive anode. ThisPSD provides a larger collection solid angle and allows for athree-dimensional imaging detection (x,y,t).
(iv) The fragment detection times were recorded usinga Lecroy 4208 multihit time-to-digital converter with theresolution of 1 ns and a full time range up to 16 ms. Ananalog-to-digital converter (AD811 ORTEC) was used torecord the X and Y positions of the neutral impact on thePSD. A fast list mode processor Hytec LP1342 was employedto record all events for each storage cycle.
Figure 2 shows a picture of the Mini-Ring in the vacuumchamber. The visible beam trace was obtained using an intenseAr+ argon ion beam (2 μA) of 12 keV stored for a singlerevolution in the chamber, which was filled with nitrogengas at a pressure of about 10–4 mbar. The blue light was dueto the fluorescence from the N2 target gas that was excitedby collisions with Ar+ ions along the storage trajectory. ACanon camera (EOS 5D Mark II) equipped with a zoom lens(Ultrasonic 16–35 mm 1:2.8 II USM) was used to take thepicture with an exposure time of 10 s. This direct view of theion trace was helpful for a fine-tuning of the storage conditions.It allowed for in situ monitoring of the beam location as afunction of the voltages applied to the electrodes in order todrive the ion beam to the optimum trajectory.
A continuous C14H10+ anthracene ion beam of kinetic
energy Ek0 = 12 keV with a broad IED was extracted from anelectron cyclotron resonance (ECR) NANOGAN ion source.The high-frequency supply of the ECR ion source was operatedat very low power (0.2 W) to optimize the intensity of theintact, singly charged C14H10
+ ion beam. The beam wasmass selected with a 90° magnetic sector and driven into theMini-Ring chamber with a typical continuous beam intensityof about 1 μA measured on a Faraday cup after one revolutioncycle in the ring.
The experiments described in the following were performedusing a pulsed beam mode. Beam pulses of short duration,typically 1 μs, were generated every 10 ms by choppingthe continuous beam with a parallel plate deflector mounteddownstream the mass selection magnet. The flying time ofthe ions from the ECR source to the Mini-Ring chamber wasestimated to be 29 μs. The ion bunches entered then intothe ring via the first straight section through D1 and D2 andwere stored with a revolution period measured to be 6.49 μs.
053425-2

FAST RADIATIVE COOLING OF ANTHRACENE: . . . PHYSICAL REVIEW A 92, 053425 (2015)
The evolution of a stored ion bunch was monitored during astorage cycle (10 ms) by recording the time and position atwhich neutrals exiting the ring through D4 were impacting thePSD. The electronic pulse applied to the chopper provided thetime reference of the subsequent dissociation events for eachstorage cycle. At the end of each cycle, the remaining ions wereejected from the ring before the entrance of the next bunch. Theduration of a storage cycle was chosen much shorter than thestorage lifetime limitation due to collisions with the residualgas. The pressure inside the vacuum chamber was maintainedunder 2 × 10⁻⁹ mbar, which ensured a storage lifetime up to300 ms. This storage lifetime limitation has been found to berelatively independent of the nature of the stored ions. Verysimilar values have been measured for both atomic ions Ar+and molecular PAH ions, namely, singly charged anthracene,naphthalene, and pyrene. Therefore, during a storage cycle,the ion losses resulting from collisions with the residual gascould be considered as a small correction in the analysis.
The Mini-Ring was optimized to store ions within a narrowkinetic energy acceptance window, �Ek = ±40 eV aroundEk0 = 12 keV. By the loss of a small neutral fragment ofmass �M from the parent molecule of mass M, the kineticenergy of the residual daughter charged fragment is reducedby a quantity (�M/M)Ek0. In the case where this quantity issmaller than 40 eV, the daughter ion will still be stored in thering along with the parent ions; otherwise it will be rapidlyejected from the ring. Therefore, the intrinsic kinetic energyacceptance window results in a fragment mass acceptancewindow M ± (�M)max, with (�M)max = M(|�Ek|/Ek0) =M(40/12 000) = M/300. The ratio (�M)max/M is definedas the mass resolution of the ring and is equal to 1/300 inthe present experiment. Daughter ions of mass smaller thanM − (�M)max cannot be stored in the ring. It is well knownthat the anthracene cation (M = 178 amu) dissociates mainlyvia the loss of a neutral H or C2H2 [7,29–31] with comparablebranching ratios in the range of the internal energy of this work.So, for dissociation events occurring during the storage time,the mass resolution of the ring is sufficient to ensure the ejec-tion of the heavy daughter (C14H9)+ or (C12H8)+ fragmentsfrom the ring within one additional revolution period.
The detection efficiency of a neutral fragment (mass�M) by the PSD depends sensitively on its kinetic en-ergy (�M/M)Ek0. It was estimated to be about 40% forC2H2(�M = 26) with a kinetic energy of 1.753 keV [32]and much smaller for H(�M = 1) estimated to less than5% due to its much smaller kinetic energy, 70 eV [33].Moreover, the trajectory of H fragments is expected to bemuch more sensitive to the kinetic energy release (KER) of thedissociation. The KER for the emission of H was measured tobe 0.35 eV for pyrene [34,35] and we have found a comparablevalue for anthracene. As a consequence, the KER inducedsignificant deviations of the trajectories of the H fragmentssuch that the spot size was larger than the PSD, leadingto poor collection efficiency. Due to the reduced detectionand collection efficiencies for H fragments, impacts recordedwith the PSD were mainly attributed to C2H2 neutrals. In atypical spectrum, we plot the number of neutrals (counts) as afunction of the storage time (Fig. 3), accumulated over a largenumber of storage cycles. Neutral count spectra presented inthe following were recorded during a typical experimental time
Storage time t(ms)
1200
1000
800
600
400
200
0
Counts
0 1 2 3 4 5 6
FIG. 3. (Color online) Neutral count spectrum. The number ofneutrals as a function of the storage time: t < 3 ms, neutral emissiondue to high-energy population depletion of the broad initial IED fromthe ECR source; t > 3 ms, neutral yield enhancement due to laserexcitation at 3 ms.
of one hour corresponding to about 4 × 10⁵ storage cycles. Aneutral count rate of 300 counts/s was enough to acquire goodstatistics. Such a low count rate was maintained to limit theneutral detection number to 3 or 4 per storage cycle so thatthe probability of having two hits per revolution could beneglected. It also ensured very low ion densities in order toneglect any intrabunch ion-ion scattering effects.
A few milliseconds after the ion injection, at a precise timedenoted by tlaser, a laser pulse was sent to merge with theion bunch as the ions passed between deflectors D1 and D2.Photon absorption resulted in a sharp and huge enhancementof the neutral count at t > tlaser (Fig. 3). We used nanosecondlaser pulses of the third-harmonic Nd:YAG 1-kHz EKSPLAOPO NT242 operated at a 100-Hz repetition rate. The laserbeam was unfocused and the size of the spot was estimatedto be around 2 mm in diameter along the path between D1
and D2. The maximum fluence that we could obtain with thislaser at 3.49 eV was about 12 mJ/cm2 per pulse, howeverthe present spectra were recorded at 2 or 3 mJ/cm2 per pulseto ensure single-photon-absorption conditions. Adjustmentsof laser beam paths were realized by translating two planemirrors mounted on X-Y microcontrol carriages. In order tooptimize both the space and time overlapping between thelaser pulse and the ion bunch, neutral counts were recorded asa function of time during the first revolution period after laserexcitation with the maximum time resolution (1 ns). The bestlaser pulse adjustment led to a homogeneous excitation of theion bunch spreading along the straight line from D1 to D2.The signature of such optimized conditions was the recordingof a rectangular laser-induced neutral count spectrum (inset inFig. 4) with a typical width corresponding to the flight timeof the ions from D1 to D2. The optimized space overlappingconditions were found to be independent of tlaser over the totalstorage time range (<10 ms). This demonstrated that the ionbunch trajectory between D1 and D2 was nearly unchangedwith the increasing number of revolutions [36] and that thebetatron oscillations were considerably reduced compared tothe previous measurements [27].
053425-3

S. MARTIN et al. PHYSICAL REVIEW A 92, 053425 (2015)
Cou
nts
10000
5000
1000
3.0 3.1Storage time t (ms)
3.007 3.008 Storage time(ms)
10000
0
FIG. 4. Neutral count spectrum with one-photon excitation attlaser = 3 ms. The inset shows a zoom in of a laser-induced peakshowing a rectangular shape and therefore a good overlap betweenthe laser beam and the ion bunch.
III. ANALYSIS OF THE NEUTRAL YIELDDECAY CURVE AT 3 ms
To study the cooling mechanism, one should first prepareanthracene molecular ions to highly excited states. For ex-ample, in several previous experiments, thermally evaporatedanthracene or other PAH molecules were excited to highenergies by UV multiphoton absorption to perform time-resolved photodissociation experiments [37] or by VUVsynchrotron radiation absorption to perform threshold pho-toelectron or imaging photoelectron-photoion coincidenceexperiments [38,39]. The conditions are very different in ourexperiment since we started with an ensemble of molecularions ionized in the plasma of the ECR source with an unknown,probably nonthermalized and broad IED. Molecules withinternal energy E may decay via unimolecular dissociationcharacterized by the dissociation rate kdiss(E). Starting from abroad IED at the extraction time (t = 0) from the ECR source,the molecules with highest internal energy were dissociatedduring the first 29 μs along the beam line from the ECRsource through the magnet until the Mini-Ring chamber.Although daughter fragment ions were formed along thestraight line between the exit of the magnet and the Mini-Ringand entered in the ring through D1 and D2, they couldnot be stored due to the mass resolution of the Mini-Ring.Therefore, compared to the initial IED in the ECR source, thestored bunch of ions had undertaken high-energy populationdepletion due to the dissociation processes occurring beforethe entrance in the ring at t < 29 μs. Inside the Mini-Ring, thishigh-energy population depletion process continued as clearlydemonstrated in Fig. 3 by the fast decrease of the counts ofneutral fragments during the first milliseconds of storage. Forlonger storage times (t >3 ms), the neutral counts varied muchmore slowly with time. We have verified by storing over 1 s (notshown here) that for t >3 ms the neutral count decay tendedto be purely exponential with a time constant of about 300 ms,corresponding to the expected storage lifetime limitation dueto collisions with the residual gas. This particular decay
behavior shows that the dissociation process of the storedmolecular ensemble was quenched to become negligible fort >3 ms and could no longer induce further high-energypopulation depletion (see [8]). We have estimated that underour experimental conditions the proportion of hot moleculesthat spontaneously dissociated inside the ring stood for lessthan 30% of the total stored ion population and the major partwas well stored in the ring. Although other decay mechanisms,such as the electronic fluorescence or IR radiative cooling,could certainly lead to further evolution of the high-energy partof the surviving stored population distribution, their effect wasindiscernible in the spectrum of neutrals when the dissociationprocess was nearly completely quenched.
In order to probe the time evolution of the IED, denoted bythe function G(E,t) hereafter, we reheated the stored moleculesby laser absorption at different storage times tlaser, varying from3 to 7 ms by steps of 1 ms. The photon energy (hν = 3.49 eV)was chosen to match the electronic absorption band of theanthracene cation that has been measured in the Ar matrixat around 352 nm [40]. In response to the laser pulse, asmall fraction of the stored ions absorbed one single photonleading to the formation of a reheated molecular ensemble attlaser. The IED of this ensemble, denoted by G∗(E), is relatedto G(E, tlaser) via an internal energy-dependent absorptionfunction and a shift towards higher-energy values by hν.Although for molecules with high internal energy, up to7 eV in the present case, the absorption cross section isunknown, it was observed to be high enough for recordingspectra with good statistics. The energy dependence of theabsorption cross section was not considered as a key issuein the analysis presented here, so we used a constant forits value. Also the absolute value of this cross section doesnot impact the analysis. It has been taken arbitrarily as unityfor simplification. Therefore, G∗(E) is related to G(E, tlaser)simply with an energy shift of hν,G∗(E + hν) = G(E, tlaser).
The fast dissociation of the reheated high-energy moleculesled to a huge increase of the neutral yield at about half arevolution period (3.25 μs) after tlaser and a regular decreaseduring the first 150 μs. As an example, Fig. 4 shows a typicalrecord of the neutral count for tlaser = 3 ms. The small andnarrow peak just before the main peak is due to the noise signalon the MCP produced by the UV laser hitting the injection lenselectrode. The other smaller broad and very weak peaks barelyvisible before tlaser are due to the contribution of collisionswith the residual gas. In spite of the high intensity of thelaser-induced peaks, their total counts were estimated to beless than 3% of the total number of stored ions. In Fig. 5 theintegrated neutral yield for each revolution period is plottedas a function of time t ′, with t ′ = t–tlaser. This experimentalneutral yield decay curve could not be reproduced by asimple exponential function. As discussed in several papers,e.g., [18,41], a power function (t ′–α) was found to be moreappropriate and the variation of the constant α under differentexperimental conditions provides a rough indicator of themodification of the corresponding initial IED, G∗(E) [36].Indeed, α = 1 would be expected for an infinitely broad (flat)IED, while α < 1 indicates that the high-energy side of theIED is in the sensitive energy window as discussed in Sec. V.For the present case (tlaser = 3 ms), the data of the first tenrevolutions were fitted with a power law of exponent α = 0.87.
053425-4

FAST RADIATIVE COOLING OF ANTHRACENE: . . . PHYSICAL REVIEW A 92, 053425 (2015)
Counts
Square
Gaussian
15000
10000
5000
00 50 100 150
Time t (µs)
FIG. 5. (Color online) Laser-induced neutral yields as a functionof t ′ = t–tlaser (tlaser = 3 ms) and the adjusted decay curves usingdifferent energy population distribution profiles: long-dashed (red)line, square function; short-dashed line, power-three function; andsolid line, half Gaussian shape.
IV. SIMULATION OF THE INTERNAL ENERGYDISTRIBUTIONS
To determine directly the time evolution of the IED G(E,t)of the stored molecular ensemble, one should take into accountseveral factors, most of them being unknown or difficult toestimate such as the initial IED in the ion source, the depletiondue to dissociation, and the radiative cooling. In the following,we aim at simulating the reheated population distributionG∗(E) by fitting the measured laser-induced neutral decaycurves in order to model the time evolution of G(E,t) beforelaser excitation. We postulated a mathematical shape G∗(E)for the IED of the reheated molecular ensemble at t ′ = 0with adjustable parameters. Considering that molecules ofenergy E might lose a neutral fragment with the dissociationrate kdiss(E), neutral yields from molecules of the wholeinternal energy range were calculated as a function of t ′. Inthe simulation, the energy scale was discretized with stepsof 0.1 eV, which was sufficiently small to ensure a goodand fast convergence. The values of kdiss(E) were calculatedfollowing the work of West et al. [31], where the breakdowndiagram of the anthracene cation was well reproduced with thefitted relation kdiss(E). The kdiss(E) values for typical energiesare listed in Tables I. In order to fit the experimental decaycurve (Fig. 5) and to evaluate the effect of the IED shape onthe simulated neutral yield we have tentatively tested three
TABLE I. Dissociation lifetime τ , dissociation rate kdiss, and thecorresponding excitation energy E of C14H10
+ according to Westet al. [31].
τ kdiss = 1/τ (s−1) E (eV)
25 ns 4 × 10⁷ 143.25 μs 3.1 × 10⁵ 10.829 μs 3.4 × 10⁴ 9.8150 μs 6.7 × 10³ 9.2
9.0 9.5 10.0 10.5 11
Energy (eV)
3 x10⁵
2 x10⁵
Pop
ulat
ion
dist
ribut
ion
G*(
E)
1x10⁵
0
FIG. 6. (Color online) Adjusted IED G∗(E) after the absorptionof a single photon (hν = 3.49 eV) at tlaser = 3 ms: red squares, squarefunction; purple circles, power-three function; and blue diamonds,half Gaussian shape.
distribution functions: a rectangular shape with a maximumenergy value Emax defined as
G∗(E) = Nr for E � Emax,
G∗(E) = 0 for E > Emax; (1)
a power-3 function as used in [8] and defined as
G∗(E) = Na for E � E0,
G∗(E) = Na − Y (E − E0)3 for E � E0; (2)
and a half Gaussian function defined as
G∗(E) = Nb for E � E1,(3)
G∗(E) = Nb exp[ − (E − E1)2/2σ 2] for E � E1,
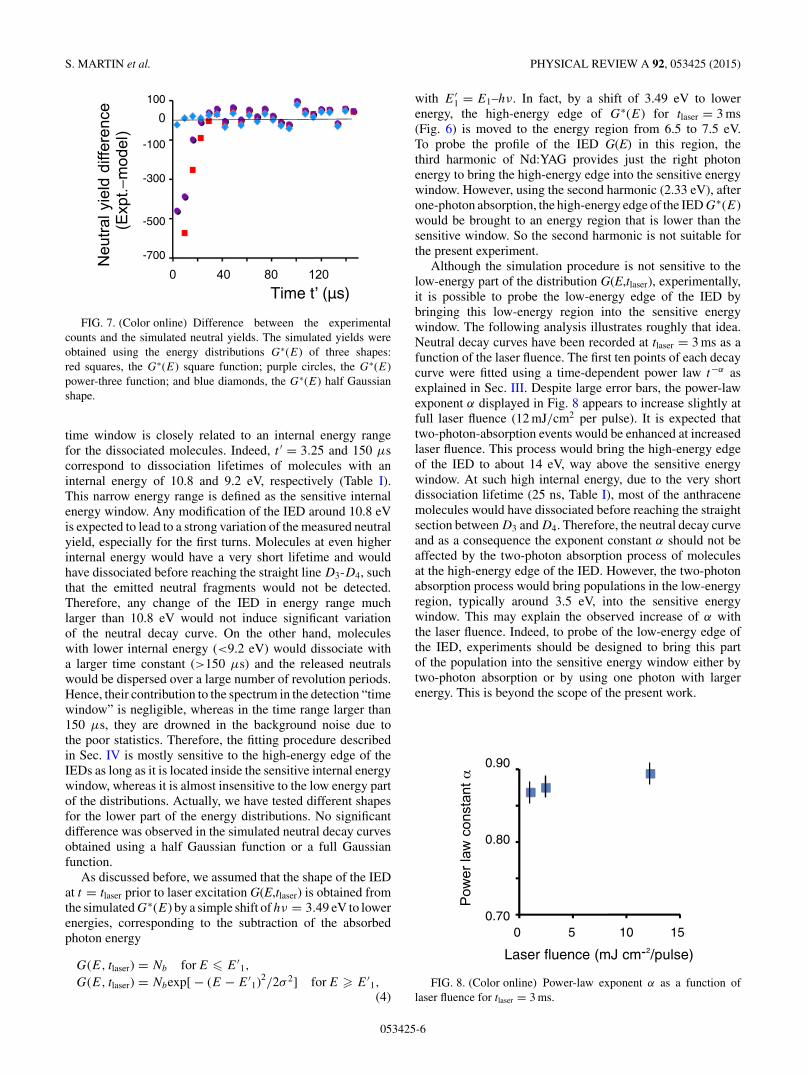
where (Nr,Emax), (E0,Na, Y ), or (E1,Nb,σ ) are parametersto be adjusted in order to fit the experimental decay curves.The fitted neutral yields and the corresponding adjusted G∗(E)functions are presented in Figs. 5 and 6, respectively. At firstglance, each of these shapes leads apparently to an equallygood fit of the experimental decay (Fig. 5). However, a morecareful analysis reveals some differences. Figure 7 displays thedifference between the experimental counts and the simulatedneutral yields. In the time range larger than 50 μs, thedivergence was found to be comparable for the three shapes.Contrarily, for shorter times, it is much smaller for the halfGaussian shape, while larger deviations are noticed using thesquare and power-3 shapes. This means that the decay curvein the range from 0 to 50 μs is very sensitive to the shape ofthe high-energy edge of the distribution and, among the testedG∗(E) functions, the half Gaussian shape with σ = 0.57 eVleads to the best fit of the experimental data.
V. SENSITIVE INTERNAL ENERGY WINDOW
From Fig. 5 it can be noticed that significant neutral yieldscould be detected in a time window ranging from the firsthalf revolution period t ′ = 3.25 μs up to t ′ = 150 μs. This
053425-5
S. MARTIN et al. PHYSICAL REVIEW A 92, 053425 (2015)
100
-100
-300
-500
-700
Time t (µs)
Neu
tral y
ield
diff
eren
ce
(Exp
t.−m
odel
)0
0 40 80 120
FIG. 7. (Color online) Difference between the experimentalcounts and the simulated neutral yields. The simulated yields wereobtained using the energy distributions G∗(E) of three shapes:red squares, the G∗(E) square function; purple circles, the G∗(E)power-three function; and blue diamonds, the G∗(E) half Gaussianshape.
time window is closely related to an internal energy rangefor the dissociated molecules. Indeed, t ′ = 3.25 and 150 μscorrespond to dissociation lifetimes of molecules with aninternal energy of 10.8 and 9.2 eV, respectively (Table I).This narrow energy range is defined as the sensitive internalenergy window. Any modification of the IED around 10.8 eVis expected to lead to a strong variation of the measured neutralyield, especially for the first turns. Molecules at even higherinternal energy would have a very short lifetime and wouldhave dissociated before reaching the straight line D3-D4, suchthat the emitted neutral fragments would not be detected.Therefore, any change of the IED in energy range muchlarger than 10.8 eV would not induce significant variationof the neutral decay curve. On the other hand, moleculeswith lower internal energy (<9.2 eV) would dissociate witha larger time constant (>150 μs) and the released neutralswould be dispersed over a large number of revolution periods.Hence, their contribution to the spectrum in the detection “timewindow” is negligible, whereas in the time range larger than150 μs, they are drowned in the background noise due tothe poor statistics. Therefore, the fitting procedure describedin Sec. IV is mostly sensitive to the high-energy edge of theIEDs as long as it is located inside the sensitive internal energywindow, whereas it is almost insensitive to the low energy partof the distributions. Actually, we have tested different shapesfor the lower part of the energy distributions. No significantdifference was observed in the simulated neutral decay curvesobtained using a half Gaussian function or a full Gaussianfunction.
As discussed before, we assumed that the shape of the IEDat t = tlaser prior to laser excitation G(E,tlaser) is obtained fromthe simulated G∗(E) by a simple shift of hν = 3.49 eV to lowerenergies, corresponding to the subtraction of the absorbedphoton energy
G(E, tlaser) = Nb for E � E′1,
G(E, tlaser) = Nbexp[ − (E − E′1)2
/2σ 2] for E � E′1,
(4)
with E′1 = E1–hν. In fact, by a shift of 3.49 eV to lower
energy, the high-energy edge of G∗(E) for tlaser = 3 ms(Fig. 6) is moved to the energy region from 6.5 to 7.5 eV.To probe the profile of the IED G(E) in this region, thethird harmonic of Nd:YAG provides just the right photonenergy to bring the high-energy edge into the sensitive energywindow. However, using the second harmonic (2.33 eV), afterone-photon absorption, the high-energy edge of the IED G∗(E)would be brought to an energy region that is lower than thesensitive window. So the second harmonic is not suitable forthe present experiment.
Although the simulation procedure is not sensitive to thelow-energy part of the distribution G(E,tlaser), experimentally,it is possible to probe the low-energy edge of the IED bybringing this low-energy region into the sensitive energywindow. The following analysis illustrates roughly that idea.Neutral decay curves have been recorded at tlaser = 3 ms as afunction of the laser fluence. The first ten points of each decaycurve were fitted using a time-dependent power law t−α asexplained in Sec. III. Despite large error bars, the power-lawexponent α displayed in Fig. 8 appears to increase slightly atfull laser fluence (12 mJ/cm2 per pulse). It is expected thattwo-photon-absorption events would be enhanced at increasedlaser fluence. This process would bring the high-energy edgeof the IED to about 14 eV, way above the sensitive energywindow. At such high internal energy, due to the very shortdissociation lifetime (25 ns, Table I), most of the anthracenemolecules would have dissociated before reaching the straightsection between D3 and D4. Therefore, the neutral decay curveand as a consequence the exponent constant α should not beaffected by the two-photon absorption process of moleculesat the high-energy edge of the IED. However, the two-photonabsorption process would bring populations in the low-energyregion, typically around 3.5 eV, into the sensitive energywindow. This may explain the observed increase of α withthe laser fluence. Indeed, to probe of the low-energy edge ofthe IED, experiments should be designed to bring this partof the population into the sensitive energy window either bytwo-photon absorption or by using one photon with largerenergy. This is beyond the scope of the present work.
Laser fluence (mJ cm-2/pulse)
Pow
er la
w c
onst
ant
0.90
0.80
0.700 5 10 15
FIG. 8. (Color online) Power-law exponent α as a function oflaser fluence for tlaser = 3 ms.
053425-6

FAST RADIATIVE COOLING OF ANTHRACENE: . . . PHYSICAL REVIEW A 92, 053425 (2015)
VI. TIME EVOLUTION OF THE INTERNAL ENERGYDISTRIBUTIONS
In order to study the time evolution of the IED as a functionof the storage time, we have recorded neutral count spectrafor different laser excitation times tlaser = 3, 4, 5, 6, and 7 msunder the same experimental conditions. The correspondingneutral decay curves, after corrections, are plotted in Fig. 9 asa function of t ′, with tlaser defined as the time reference t ′ = 0in all cases. The stability of the experimental conditions mightbe altered by the fluctuation of the ECR ion source. It wasmonitored by measuring a constant total number of neutralsfrom 0 to 3 ms due to the spontaneous dissociation of hotmolecules. In this series of experiments, the initial ion bunchtime width was about 1 μs. Special care was taken to ensure thetime overlap between the laser pulses and the center of the ionbunches. Nevertheless, the following experimental factors ledto a progressive decrease of the number of excited moleculeswith increasing tlaser: the spread of the ion bunch during thestorage time due to the initial kinetic energy dispersion of theion beam, the initial emittance of the beam that would result indispersion of the revolution period and a decrease in the num-ber of stored ions with time due to collisions with the residualgas. The neutral decay curves shown in Fig. 9 were obtainedfrom the raw decay curves recorded at different tlaser withcorrections taking into account the above predictable factors.
Following the procedure described in Sec. IV, each decaycurve was fitted using a half Gaussian shape function G∗(E).It should be noticed that although the decay curves of Fig. 9have been fitted independently, the resulting values of Nb arevery similar, showing only small dispersions in a range of lessthan 5%. The absolute values of Nb depend on experimentalparameters that have been corrected during the analysis(see the discussion above), except, however, for a possiblevariation of the absorption cross section. The nearly constant
Counts
t = 3 ms
7 ms
laser
15000
10000
5000
0
0 20 40 60 80 100
Time t (µs)
FIG. 9. (Color online) Experimental (symbols) and modeled(solid lines) decay curves versus t ′ = t − tlaser after the laser pulsefired at tlaser = 3, 4, 5, 6, and 7 ms.
Energy (eV)
5.5 6 6.5 7 7.5
t=3ms
7ms
2 x10⁵
1x10
0
Pop
ulat
ion
dist
ribut
ion
G(E
,t)
5
FIG. 10. (Color online) The IED of the stored ion bunches at 3,4, 5, 6, and 7 ms of storage time.
value of Nb for different tlaser is tentatively interpreted as proofof the nearly constant overall absorption cross section onthe time evolution of the IED. It justifies our approximationconsidering the absorption factor as quasi-independent ofthe internal energy in the studied energy region. This weakdispersion of the values of Nb will be neglected in thefollowing. The corresponding IEDs G(E, t = tlaser) prior tolaser absorption are displayed in Fig. 10.
The main feature appearing in Fig. 10 is the time evolutionof the IED G(E,t). The regular shift of the high-energy edgeof the IED to lower energies demonstrates the existence ofan efficient cooling process occurring in the observed timerange from 3 to 7 ms. In the energy region around 6.5 eV,the high-energy edge was estimated to shift globally at arate of [�E/�t]measured
∼= –100 eV/s. Since the populationdepletion due to dissociation is negligible in this time range,the measured shift rate is attributed to radiative cooling andwill be discussed in details in the following sections.
VII. FAST POPULATION DECAY RATE VERSUSINTERNAL ENERGY
From the simulated IEDs shown in Fig. 10, it is possible toextract population decay rates as a function of the excitationenergy E. As an example, a vertical line was drawn at anenergy value E = 6.5 eV in Fig. 10. It crosses all the G(E,tlaser)curves at different times corresponding to the experimentaltlaser values. By plotting the data G(6.5 eV,tlaser) as a functionof time (Fig. 11), a population decay curve of moleculeswhose initial internal energy was 6.5 eV is obtained. Thisanalysis has been repeated for E varying from 6.0 to 7.4 eVby steps of 0.2 eV and the results are plotted in Fig. 11 in asemilogarithmic scale. All those decay curves could be nicelyfitted by exponentials with characteristic measured populationdecay rates kmeasured, presented in Table II. It should be kept inmind that these population decay rates were determined fromthe set of simulated IEDs and were not measured directly inthe experiment. These rates are expected to result from thesum of contributions of all possible decay mechanisms fora molecule of internal energy E, i.e., the dissociation and the
053425-7

S. MARTIN et al. PHYSICAL REVIEW A 92, 053425 (2015)
Pop
ulat
ion
dist
ribut
ion
G(E
,t)
6.8
7.4
7.2
7.0
6.6
6.46.2
E (eV)
0 2 4 6 8Storage time t (ms)
3 x10
3 x10
3 x10
3
4
5
6.5
FIG. 11. (Color online) Evolution of G(E,t) versus the storagetime at different excitation energies from E = 6.2 to 7.4 eV. Eachseries of G(E,t) values at a given value E is fitted with an exponentialdecay G(E,0) exp(−kmeasuredt). Arrows indicate the extrapolatedvalue G(E,0).
radiative emissions. For comparison, the dissociation rates kdiss
from the Ref. [31] are given in Table II. In the energy rangeof interest E < 7.5 eV, kdiss is much smaller than kmeasured,so the contribution of the dissociation is negligible. This isin agreement with our statement based on the analysis ofthe spontaneous neutral count decay (Fig. 3). The observedpopulation decay is therefore attributed predominantly to theradiative emissions. The measured decay rates were found tobe varying from 450 to 25 s–1 in the internal energy range from7.4 to 6.0 eV.
TABLE II. Calculated dissociation rate kdiss from [31], measuredpopulation decay rate kmeasured, and fluorescence cooling rate ηcool, elec
as a function of the excitation energy E before laser irradiation.
E (eV) kdiss(s–1) kmeasured(s–1) ηcool, elec(s–1)
8.6 13308.2 3687.6 427.4 18 450 927.2 9 390 837.0 3.4 320 716.8 1.2 260 606.6 0.4 200 486.4 0.1 130 326.2 0.04 85 226.0 0.01 25 7
6.0 6.5 7.0 7.5
1x10
2x10
3x10
0
5
5
Energy (eV)
5
G(E,0)
FIG. 12. Extrapolated values G(E,t = 0) of the data in Fig. 11as a function of the energy E.
From Fig. 10 one can notice that the measured populationdecay rate kmeasured and the shift rate [�E/�t]measured of thehigh-energy edge of IED provide complementary informationon the time evolution of the IED. These two measuredquantities are tightly related through the IED profile G(E,t).By following the time evolution of the high-energy edge of theIED along a horizontal line in Fig. 10, G(E,t) stays constant,therefore dG(E, t) = 0. One can express the total differentialdG(E, t) = 0 with the partial derivatives of G(E,t) and obtainthe relation between kmeasured and [�E/�t]measured as
kmeasured = − 1
G
∂G
∂t= 1
G
∂G
∂E
[�E
�t
]measured
. (5)
This relation is locally linear. A fast energy shift leads to fastpopulation decay and conversely fast population decay leadsto a fast energy shift.
In Fig. 11, for each value of E, the fitted exponentialfunction, namely, G(E,0) exp (–kmeasuredt), was extrapolatedto t = 0. The obtained values G(E,0) are displayed in Fig. 12as a function of E. Under the hypothesis that no fasterprocess would have modified the IED in the shorter timerange t < 3 ms, the values G(E,0) could be considered asthe initial IED in the ECR source. The extrapolated values arequite constant for 6.2 � E � 6.8 eV and exhibit a decreasingtendency with increasing energy for E � 7 eV. This featureis generally expected for IEDs from an ECR ion source, i.e.,a rather broad distribution that depends on the ion nature andthe source conditions. Although the half Gaussian functionwas found to be the best shape for simulating the measuredneutral decay curves, this predefined shape was still a factorof approximation in the present approach. Slight dispersionof these Gaussian functions from the true IEDs would lead tolarge deviations of the extrapolated G(E,0) values especiallyin the high-energy region where the corresponding decaycurves were extracted from the tails of the simulated IEDG(E,tlaser) (Fig. 10). To get a more precise description of thehigh-energy part of the IED, it would be necessary to probethe population distributions at shorter storage times or to usea more sophisticated simulation model.
053425-8

FAST RADIATIVE COOLING OF ANTHRACENE: . . . PHYSICAL REVIEW A 92, 053425 (2015)
VIII. RADIATIVE COOLING MECHANISMS: INFRAREDAND ELECTRONIC PHOTON EMISSIONS
As mentioned in the Introduction, the radiative coolingof anthracene molecular ions can result from two differentmechanisms: IR emission and/or fluorescence emission dueto electronic transitions from thermally excited states. In thefollowing sections we will discuss both mechanisms in order todetermine their relative importance in the measured populationdecay and in the global radiative cooling of the anthracenemolecular ions. These mechanisms have been described indetail for anthracene cations by Boissel et al. [7] and will berecalled briefly in Secs. VIII A and VIII C.
A. IR emission cooling rate
For PAH molecules (including anthracene) with excitationenergy E, the IR cooling process is usually described usinga statistical model. For molecules in the ground electronicstate, the total internal energy E is distributed statisticallyamong all vibrational modes (3N–6, N stands for the numberof atoms). The emission rate ki,v from a specific mode i via thetransition between two vibrational states v→v–1 is defined asthe product of the Einstein coefficient of spontaneous transitionand the probability of presence in the higher state. Consideringone particular molecule, the emission of an IR photon ofmode i induces an energy loss via a discrete step of hνi . Inthe case of anthracene, the quanta of transition energies aresmaller than 0.2 eV [40]. Due to the statistical nature of theenergy distribution, an average energy decreasing rate due toIR emission was therefore defined by summing over the wholeset of IR transitions [7]⌊
dE
dt
⌋IR
= −∑
i
∑v
ki, vhνi . (6)
Under this model, for E much higher than the IR emissionenergy quanta E � hνi the internal energy of each moleculefollows a rather smooth variation curve. In the same paper [7]a logarithmic IR cooling rate ηcool, IR was defined as
ηcool, IR = − 1
E
⌊dE
dt
⌋IR
. (7)
For anthracene, in a wide energy range from 2 to 10 eV, ηcool, IR
was found to be about 2 s–1 and nearly energy independent (seeFig. 2 in [7]). As a consequence, in our experiment, the IRemission is expected to induce a shift of the high-energy edgeof the IED of the stored anthracene ions. In the region around6.5 eV, the high-energy edge would shift due to IR emission ata rate of [E/�t]IR = –ηcool, IR × E ∼= –13 eV/s. This value ismuch smaller than the measured value of [�E/�t]measured =–100 eV/s (in absolute values). To estimate the contributionof the IR emission to the variation of the IED, it is convenientto define a mean IR emission rate kIR by replacing thesummation in Eq. (6) with a simple product kIRhνIR. TakinghνIR ≈ 0.165 eV as the mean energy of the main IR transitionmodes in the range from 0.15 to 0.18 eV [40], we getkIR = −[dE/dt]IR
hνIR= ηcool,IRE
0.165 ≈ 12E (s−1), with E in eV.Due to the energy evolution governed by the rate equa-
tion (7), the high-energy edge of an IED G(E,t) varies withtime through an energy variation function G(E(t)) for a given
G value. For the fitted IED of this work, i.e., the half Gaussianshape function [Eq. (4)], the global shift of the high-energyedge to lower energies due to IR emission leads to a populationdecrease at a given energy E. A population decay rate k
popIR can
be defined in the same way as in Eq. (5),
kpopIR = − 1
G
∂G
∂t= 1
G
∂G
∂E
[dE
dt
]IR
= (E − E′1)E
σ 2ηcool,IR.
(8)
It should be noted that this population decay rate should by nomeans be confused with the mean IR emission rate kIR. Dueto the fact that the IR emission energies are much smaller thanthe studied internal energy E, when considering the variationof G(E,t) during �t at a given E, one should take into accountnot only the decrease �G− = kIRG(E)�t due to IR emissionfrom molecules at the energy E but also the increase �G+ =kIRG(E + hνIR)�t due to the IR emission from moleculesat neighboring higher energies. Therefore, the IR-inducedpopulation decay rate k
popIR is tightly related to the profile of the
IED and particularly the partial derivative of G with respectto E, ∂G
∂E. In an IED region where G is constant ∂G
∂E= 0, it is
expected that �G− = �G+, i.e., the population decrease iscompensated for exactly by the population increase, thereforek
popIR = 0, i.e., no population decay should be observed. In a
G increasing region, for example, the low-energy edge of anIED ∂G
∂E> 0, �G− < �G+, i.e., the population decrease is
smaller than the population increase, therefore kpopIR < 0 and
the IR emission should lead to a population gain. Aroundthe high-energy edge of an IED ∂G
∂E< 0, �G− > �G+,
i.e., the population decrease is larger than the populationincrease, therefore k
popIR > 0 and the IR emission should lead
to a population decay.
B. Estimated electronic fluorescence decay rates
The measured population decay rate kmeasured is contributedpartly by the IR emission and partly by the electronicfluorescence decay. By subtracting k
popIR from kmeasured, one
can get the contribution from the electronic fluorescenceemissions, referred to as k
popelec:
kpopelec = kmeasured − k
popIR . (9)
However, the determination of kpopIR at a given energy
value E is not straightforward. In fact, kpopIR depends not
only on E, but also on E′1 [Eq. (8)], which varies in turn
with time. By using Eq. (8), numerical values of kpopIR were
calculated for a given E at different tlaser. A mean value overthe experimental tlaser range was found to be proportionalto kmeasured with a coefficient around 0.1. This coefficientcoincides with the ratio between the IR induced and themeasured energy shift rate [�E/�t]IR/[�E/�t]measured, inagreement with Eqs. (5) and (8). Therefore, the measuredpopulation decay rate due to electronic fluorescence emissionwas estimated by k
popelec(E) ≈ 0.9kmeasured(E).
Electronic fluorescence emission is the major processleading to the population decay of molecules at a given energyvalue E. A fluorescence emission rate kelec(E) is defined as afunction of the internal energy. Following the model of Boisselet al. recalled in detail in Sec. VIII C, the fluorescence emission
053425-9

S. MARTIN et al. PHYSICAL REVIEW A 92, 053425 (2015)
FIG. 13. (Color online) Experimental fluorescence emission rate(triangles) and the modeled rate versus the excitation energy.Theoretical values were calculated using ED2 = 1.75 eV and Aelec =7 × 10⁶ s–1 (squares) or Aelec = 15.7 × 10⁶ s–1 (circles).
process of molecules of energy E results in a sudden decreaseof the internal energy in a single step from E to E–hνelec. Thiswould lead to a decrease of G(E,t) at energy E and its increaseat lower energy E–hνelec. Similarly, the fluorescence emissionfrom molecules at higher energy E + hνelec should lead to anincrease of G(E,t) at E. The time evolution of the populationat the energy E is governed by the rate equation
∂G(E,t)
∂t= −k
popelec G(E,t) = −kelec(E)G(E,t)
+ kelec(E + hνelec)G(E + hνelec,t). (10)
To simplify the discussion, we consider the electronic tran-sition of energy hνelec = 1.75 eV (see Sec. VIII C). It shouldbe noted that for E at the high-energy edge of the IED around6.5 eV, the value E + hνelec is about 8.2 eV. In this high-energyregion, the IED vanishes as shown in Fig. 10. So, the positiveterm in the rate equation (10) is negligible and the populationdecay rate k
popelec coincides with kelec at the high-energy edge of
the IED,
kelec(E) ≈ kpopelec (E). (11)
The estimated electronic fluorescence emission rate kelec(E) isplotted in Fig. 13 as a function of the internal energy E.
C. Theoretical model: Electronic fluorescence emission
Considered as a fast radiative cooling mechanism, thefluorescence emission via electronic transitions was studiedby Boissel et al. for the anthracene cation [7]. For moleculesinitially in the ground electronic state, denoted by D0, atED0 = 0 with high vibrational energy E, the degeneratedelectronic excited states, denoted by D1, D2, . . . , at EDn
with vibrational energy E − EDn, can be populated via the
inverse internal conversion. The probability of presence atsuch vibronic excited states can be estimated by the ratioof the density of states ρ(E − EDn
)/ρ(E). Molecules inan electronic excited state may undergo a fast fluorescencetransition with Einstein coefficients typically on the orderof 106 − 107 s−1. Due to the fact that the density of stateρ(E − EDn
) decreases dramatically with increasing EDn,
the probability of an inverse internal conversion to higher
electronic states (Dn, n > 2) can be neglected. Furthermore,the transition from the first excited electronic state (D1) tothe ground state is forbidden; the fluorescence decay occurstherefore mainly via the second electronic exited state (D2).The corresponding rate of fluorescence emission kelec wasestimated as the sum of two terms:
kelec(E) ≈ Aelecρ(E − ED2 )
ρ(E)+ Aelec, 1
ρ(E − ED2 − hν1)
ρ(E).
(12)
The first term is the product of the Einstein coefficient Aelec
by the probability of presence in the electronic excited stateD2 with vibrational energy E − ED2 . This term correspondsto the dominant pure electronic transition of energy hνelec =ED2 without implying variation of quantum numbers of anyvibrational oscillators, namely, �vi = 0. In Ref. [7] the secondterm takes into account the vibronic transition of energyhνelec = ED2 + hν1 with the decrease of one unit of thequantum number of a particular mode �v1 = −1, denotedarbitrarily by the mode number 1. Its contribution to kelec
corresponds to about 10% of the first term. Contributionsfrom similar transitions implying other modes with largervibrational energies hνi correspond to less than 1% of thetotal kelec [7]. These extra terms are neglected in Eq. (12). Tocalculate the theoretical value of the fluorescence emission ratekelec, accurate values of ED2 and Aelec are needed. First, for theelectronic state D2, several values can be found in the literature.Using the Gaussian software with the B3LYP functional,Sanchez-Carrera [42] calculated a value of 1.68 eV. A value of1.7 eV was used by Boissel et al. [7]. In an experimental work, alarger value of 1.75 eV was obtained in the gas phase by Sukho-rukov et al. [43]. This last value will be used in the followingbecause it was measured under conditions more comparableto the present work, i.e., in the gas phase without a matrixshift as in previous studies [40]. The values of kelec calculatedwith Eq. (12), ED2 = 1.75 eV, and Aelec = 7 × 10⁶ s–1, as wellas hν1 ≈ 1331 cm–1 and Aelec, 1 = 3.2 × 10⁶s–1 as in Ref. [7],are shown in Fig. 13. These values are much smaller than ourestimated electronic fluorescence emission rates. To reproducethe measured kelec(E) values with the theoretical model, a largervalue of Aelec is needed. Indeed, using Aelec = 15.7 × 10⁶ s–1,the theoretical values calculated using Eq. (12) gives the bestfit of the experimental data as shown in Fig. 13. This Aelec
value is about twice that used in the work of Boissel et al. [7].The enhancement of the fitted Aelec can be interpreted
as follows. It is noteworthy that in Ref. [7] the Einsteincoefficients Aelec of the spontaneous emission channels ofD2 were obtained from the optical absorption spectra of theanthracene cation trapped in an Ar matrix at 12 K [40]. Insuch experiments, only allowed transitions from the groundelectronic and vibrational states (D0, vi = 0 for all modesi) to vibronic levels (D2,v
′i) were measured. The absorption
lines include the main line with �vi = 0 leading to v′i = 0
and the high-energy band composed of weaker lines with�vi > 0 leading to v′
i = 1 or 2 for several specific modes.The low-energy band implying transitions with �vi < 0 isforbidden in such an absorption spectrum. For the electronicspontaneous emission from D2 to D0, the reverse transitionsof the absorption lines were considered in Ref. [7]. Indeed, the
053425-10

FAST RADIATIVE COOLING OF ANTHRACENE: . . . PHYSICAL REVIEW A 92, 053425 (2015)
first term in Eq. (12) corresponds to the main absorption linewith �vi = 0; the second term in Eq. (12) and other negligibleterms in Ref. [7] correspond to the contribution of linesappearing in the high-energy band of the absorption spectrum.However, these terms represent only a part of the allowedspontaneous emission routes. In fact, emissions leading to linesin the low-energy band, which are absent in the absorptionspectrum, may be allowed in the spontaneous transitions,notably, transitions from initial vibronic states (D2,v
′i) to
(D0,vi) with vi = v′i + 1 or v′
i + 2 for several modes whilevi = v′
i for most of the modes. To estimate the contribution ofthe low-energy band in the spontaneous emission spectrum,we have performed a theoretical calculation using the linear-response time-dependent density-functional theory [44,45]approach with the CAM-B3LYP [46] functional and the6311++G (2df,2pd) basis set. As a first approximation, wehave estimated the spontaneous transition rate from (D2,v
′i =
0) to (D0,vi = 0) simulating the main emission channel with�vi = 0 and the total Aelec including contributions from allpossible spontaneous transition channels with vi >= v′
i . Thetotal Aelec was found to be about twice that of the route onlytaking into account �vi = 0. This explains the disagreementbetween our fitted value Aelec and the value used in Ref. [7].Indeed, in that work, the electronic fluorescence emission ratekelec was underestimated due to the omission of the low-energyband in the spontaneous emission channels with vi > v′
i .
D. Fluorescence cooling rate
To estimate the contribution of the fluorescence emissionto the cooling of a molecular ensemble of a given initialinternal energy E, one should consider both the fluorescenceemission rate and the energy carried by the emitted photons.Although for each molecule the internal energy varies inlarge discrete steps via electronic transitions, it is informativeand meaningful to proceed in an analogous way as for theIR emission by calculating the variation rate [ dE
dt]elec of the
average energy per molecule to determine a mean fluorescencecooling rate ηcool, elec [7],
ηcool, elec = − 1
E
[dE
dt
]elec
≈ ED2
Ekelec. (13)
Similarly to IR emission, the average energy variation rate[ dE
dt]elec approximated by −ED2kelec corresponds to the ratio
of the total power emitted via electronic transitions and thenumber of molecules in the ensemble. It is noteworthy that[ dE
dt]elec is different from the shift rate of the high-energy
edge of the IED induced by the fluorescence emission.Indeed, similar to Eq. (5), the high-energy edge shift rateis proportional to [ dE
dt]elec through a coefficient that depends
on the partial derivative of G(E,t) with respect to E. For thefitted half Gaussian shape functions [Eq. (4)], the coefficientis given by σ 2/(E − E′
1)ED2 . The mean fluorescence coolingrate ηcool, elec, presented in Table II, was calculated withEq. (13) using kelec values estimated from the measuredpopulation decay rate after corrections of the IR emissioneffect. Here ηcool, elec ranges from 7 to 92 s–1 for internalenergies in the range from 6 to 7.4 eV. These values aremuch larger than the theoretical IR cooling rate ηcool, IR(2 s–1)calculated in this energy region [7]. So, for anthracene ions, in
our investigated energy range, the fluorescence emission viaelectronic transition is found to be a more efficient radiativecooling channel. This is due not only to the increase of thefluorescence emission rate kelec with the excitation energy butalso to the larger energy carried by a single photon.
IX. CONCLUSION
In summary, using an ECR ion source and a smallelectrostatic storage device Mini-Ring, we have measuredthe radiative-emission-induced population decay rate of an-thracene cations with internal energy from 6 to 7.4 eV byfollowing the time evolution of the simulated IEDs in thetime range from 3 to 7 ms. In the investigated internal energyrange, the fluorescence emission rate kelec has been estimatedand found to strongly increase from 23 to 400 s–1. These valuesare larger than the prediction based on the theoretical model ofBoissel et al. [7]. Nevertheless, the experimental fluorescenceemission rates kelec were well simulated using the model ofBoissel et al. with a modified value of Aelec that had to beincreased by a factor of 2. This enhancement of the Einsteincoefficient Aelec of the excited states is interpreted by theaddition of contributions from the low-energy band in theexpected spontaneous emission spectrum. This band, due totransitions from (D2,v
′i) to (D0,vi) with vi > v′
i , is absent inthe absorption spectrum. The total Einstein coefficient of thestate (D2,v
′i = 0) was calculated theoretically. It was found
that by including the low-energy band, the value of Aelec wasindeed increased by about a factor of 2 compared to that ofthe main origin line with �vi = 0. This is in good agreementwith our interpretation.
The fluorescence cooling rates ηcool, elec were also estimatedand compared with the theoretical IR cooling rate. We foundthat for E > 6 eV the fluorescence emission is the dominantradiative cooling channel. In spite of the statistically very lowprobability of presence in the electronic excited states, therelatively high fluorescence cooling rate is explained by thehigh spontaneous transition rate of the involved states andthe large quantity of energy carried by a single photon. Asimilar mechanism has been observed in the cooling of largersystems such as C60 and explained as due to the transitionof thermally excited electrons, involving the energy transferfrom vibrational to electronic excitation. This process is verysensitive to the energy gap between the first electronic excitedstates and the ground state and therefore it is expected todepend strongly on the charge and size of PAHs. Confirmationof this effect has been provided by the study of the coolingof C6
− and C6H− [17]. The very different radiative coolingrates measured for these two cations were explained by theirdifferent electronic structure, especially by the different energyfor their first excited states.
The application of the present experimental method toother molecules of the PAH family with different chargestates is left for future work. The enhancement or absence ofthis fast electronic cooling mechanism may have importantconsequences for the presence of particular PAHs in theISM. Experiments using other small- and medium-sizedPAH molecules such as naphthalene, pyrene, and coronenehave been performed [47]. This work also demonstrates thepotential of the new generation of small ESR for measuring
053425-11

S. MARTIN et al. PHYSICAL REVIEW A 92, 053425 (2015)
the radiative decay rate of molecular ions. Other diagnosticsbeing developed for the Mini-Ring include the detection ofneutrals after a shorter delay time following laser excitationto gain more information on the high energy edge of theIED and the coincidence measurement of charged and neutralfragments versus the storage time to identify the fragmentationchannels (time-resolved daughter mass spectrometry). Thisring provides therefore an excellent tool for probing therelaxation dynamics of large molecular systems such as PAHs.
ACKNOWLEDGMENTS
We thank F. Lepine, I. Compagnon, and C. Bordas (InstitutLumiere Matiere) for useful discussions about the statisticalmodel, thermal emission, and the photoelectron detachmentprocess. We also thank this group for support with the pulsedUV 1-kHz laser (Spectra-Physics) (supported by AgenceNationale de la Recherche (ANR) through Project No. ANR-06-BLAN-0041). This work was supported by the ANRProgram No. ANR-10-BLAN-0426 “Anneau.”
[1] A. Leger and J. Puget, Astron. Astrophys. 137, L5 (1984).[2] L. Allamandola, A. Tielens, and J. Barker, Astrophys. J. 290,
L25 (1985).[3] PAHs and the Universe, edited by C. Joblin and A. G. G. M.
Tielens, EAS Publications Series Vol. 46 (EDP Sciences, France,2011).
[4] A. G. G. M. Tielens, Rev. Mod. Phys. 85, 1021 (2013).[5] A. Leger, P. Boissel, and L. d’Hendecourt, Phys. Rev. Lett. 60,
921 (1988).[6] A. Leger, P. Boissel, F. Desert, and L. d’Hendecourt, Astron.
Astrophys. 213, 351 (1989).[7] P. Boissel, P. de Parseval, P. Marty, and G. Lefevre, J. Chem.
Phys. 106, 4973 (1997).[8] S. Martin, J. Bernard, R. Bredy, B. Concina, C. Joblin, M. Ji,
C. Ortega, and L. Chen, Phys. Rev. Lett. 110, 063003 (2013).[9] Q. Meng and H.-D. Meyer, J. Chem. Phys. 138, 014313 (2013).
[10] J. U. Andersen, C. Gottrup, K. Hansen, P. Hvelplund, and M. O.Larsson, Eur. Phys. J. D 17, 189 (2001).
[11] K. Hansen and E. E. B. Campbell, J. Chem. Phys. 104, 5012(1996).
[12] A. E. K. Sunden, M. Goto, J. Matsumoto, H. Shiromaru,H. Tanuma, T. Azuma, J. U. Andersen, S. E. Canton, and K.Hansen, Phys. Rev. Lett. 103, 143001 (2009).
[13] M. Lange, M. W. Froese, S. Menk, D. Bing, F. Fellenberger,M. Grieser, F. Laux, D. A. Orlov, R. Repnow, T. Sieber, Y.Toker, R. von Hahn, A. Wolf, and K. Blaum, New J. Phys. 14,065007 (2012).
[14] Y. Toker, O. Aviv, M. Eritt, M. L. Rappaport, O. Heber,D. Schwalm, and D. Zajfman, Phys. Rev. A 76, 053201 (2007).
[15] M. Goto, A. E. K. Sunden, H. Shiromaru, J. Matsumoto,H. Tanuma, T. Azuma, and K. Hansen, J. Chem. Phys. 139,054306 (2013).
[16] K. Najafian, M. S. Pettersson, B. Dynefors, H. Shiromaru,J. Matsumoto, H. Tanuma, T. Furukawa, T. Azuma, and K.Hansen, J. Chem. Phys. 140, 104311 (2014).
[17] G. Ito, T. Furukawa, H. Tanuma, J. Matsumoto, H. Shiromaru,T. Majima, M. Goto, T. Azuma, and K. Hansen, Phys. Rev. Lett.112, 183001 (2014).
[18] K. Hansen, J. U. Andersen, P. Hvelplund, S. P. Møller, U. V.Pedersen, and V. V. Petrunin, Phys. Rev. Lett. 87, 123401 (2001).
[19] H. T. Schmidt, H. Cederquist, J. Jensen, and A. Fardi, Nucl.Instrum. Methods Phys. Res. Sect. B 173, 523 (2001).
[20] O. Aviv, Y. Toker, M. Errit, K. G. Bhushan, H. B. Pedersen,M. L. Rappaport, O. Heber, D. Schwalm, and D. Zajfman, Rev.Sci. Instrum. 79, 083110 (2008).
[21] J. Bernard, B. Wei, A. Bourgey, R. Bredy, L. Chen,M. Kerleroux, S. Martin, G. Montagne, A. Salmoun, and B.
Terpend-Ordaciere, Nucl. Instrum. Methods Phys. Res. Sect. B262, 105 (2007).
[22] C. R. Calvert, L. Belshaw, M. J. Duffy, O. Kelly, R. B. King,A. G. Smyth, T. J. Kelly, J. T. Costello, D. J. Timson, W. A.Bryan, T. Kierspel, P. Rice, I. C. E. Turcu, C. M. Cacho, E.Springate, I. D. Williams, and J. B. Greenwood, Phys. Chem.Chem. Phys. 14, 6289 (2012).
[23] P. Reinhed, A. Orban, S. Rosen, R. D. Thomas, I. Kashperka,H. A. B. Johansson, D. Misra, A. Fardi, L. Brannholm,M. Bjorkhage, H. Cederquist, and H. T. Schmidt, Nucl. Instrum.Methods Phys. Res. Sect. A 621, 83 (2010).
[24] V. Lepere, I. M. Ismail, M. Barat, J. A. Fayeton, Y. J. Picard,K. Wohrer, C. Jouvet, and S. Martrenchard, J. Chem. Phys. 123,174307 (2005).
[25] L. H. Andersen, O. Heber, and D. Zajfman, J. Phys. B 37, R57(2004).
[26] L. H. Andersen, T. Andersen, and P. Hvelplund, Adv. At. Mol.Opt. Phys. 38, 155 (1997).
[27] J. Bernard, G. Montagne, R. Bredy, B. Terpend-Ordaciere, A.Bourgey, M. Kerleroux, L. Chen, H. T. Schmidt, H. Cederquist,and S. Martin, Rev. Sci. Instrum. 79, 075109 (2008).
[28] R. D. Thomas et al., Rev. Sci. Instrum. 82, 065112 (2011).[29] Y. Ling and C. Lifshitz, J. Phys. Chem. A 102, 708 (1998).[30] R. Bredy, C. Ortega, M. Ji, J. Bernard, L. Chen, G. Montagne,
and S. Martin, Phys. Scr. T156, 014042 (2013).[31] B. West, A. Sit, S. Mohamed, C. Joblin, V. Blanchet, A. Bodi,
and P. M. Mayer, J. Phys. Chem. A 118, 9870 (2014).[32] N. Takahashi, Y. Adachi, M. Saito, and Y. Haruyama, Nucl.
Instrum. Methods Phys. Res. Sect. B 315, 51 (2013).[33] B. L. Peko and T. M. Stephen, Nucl. Instrum. Methods Phys.
Res. Sect. B 171, 597 (2000).[34] Y. Ling, Y. Gotkis, and C. Lifshitz, Eur. Mass Spectrom. 1, 41
(1995).[35] J. Laskin and C. Lifshitz, J. Mass Spectrom. 36, 459 (2001).[36] M. Ji, R. Bredy, L. Chen, J. Bernard, B. Concina, G. Montagne,
A. Cassimi, and S. Martin, Phys. Scr. T156, 014091(2013).
[37] Y. Ho, Y. Yang, S. Klippenstein, and R. Dunbar, J. Phys. Chem.99, 12115 (1995).
[38] B. West, C. Joblin, V. Blanchet, A. Bodi, B. Sztaray, and P. M.Mayer, J. Phys. Chem. A 116, 10999 (2012).
[39] P. M. Mayer, V. Blanchet, and C. Joblin, J. Chem. Phys. 134,244312 (2011).
[40] J. Szczepanski, M. Vala, D. Talbi, O. Parisel, and Y. Ellinger,J. Chem. Phys. 98, 4494 (1993).
[41] J. U. Andersen, H. Cederquist, J. S. Forster, B. A. Huber,P. Hvelplund, J. Jensen, B. Liu, B. Manil, L. Maunoury,
053425-12

FAST RADIATIVE COOLING OF ANTHRACENE: . . . PHYSICAL REVIEW A 92, 053425 (2015)
S. B. Nielsen, U. V. Pedersen, H. T. Schmidt, S. Tomita, andH. Zettergren, Eur. Phys. J. D 25, 139 (2003).
[42] R. S. Sanchez-Carrera, V. Coropceanu, D. A. da Silva Filho,R. Friedlein, W. Osikowicz, R. Murdey, C. Suess, W. R.Salaneck, and J.-L. Bredas, J. Phys. Chem. B 110, 18904 (2006).
[43] O. Sukhorukov, A. Staicu, E. Diegel, G. Rouille,T. Henning, and F. Huisken, Chem. Phys. Lett. 386, 259 (2004).
[44] E. Runge and E. K. U. Gross, Phys. Rev. Lett. 52, 997 (1984).
[45] M. E. Casida, in Recent Advances in Density FunctionalMethods Part I, edited by D. P. Chong (World Scientific,Singapore, 1995), p. 155.
[46] T. Yanai, D. P. Tew, and N. C. Handy, Chem. Phys. Lett. 393,51 (2004).
[47] C. Ortega, R. Bredy, L. Chen, J. Bernard, M. Ji, G. Montagne,A. R. Allouche, A. Cassimi, C. Joblin, and S. Martin, J. Phys.Conf. Ser. 583, 012038 (2015).
053425-13
View publication statsView publication stats