Cole A 2019.pdf - espace - Curtin's institutional repository
160
School of Molecular and Life Science Substrate Dependent Microbial Bioremediation in Freshwater Marron (Cherax cainii Austin 2002) Aquaculture Anthony J. Cole This thesis is presented for the Degree of Master of Philosophy (Environment & Agriculture) of Curtin University March 2019
-
Upload
khangminh22 -
Category
Documents
-
view
1 -
download
0
Transcript of Cole A 2019.pdf - espace - Curtin's institutional repository

School of Molecular and Life Science
Substrate Dependent Microbial Bioremediation in Freshwater
Marron (Cherax cainii Austin 2002) Aquaculture
Anthony J. Cole
This thesis is presented for the Degree of
Master of Philosophy (Environment & Agriculture)
of
Curtin University
March 2019

ii
DECLARATION
To the best of my knowledge and belief this thesis contains no material previously
published by any other person except where due acknowledgement has been made.
This thesis contains no material which has been accepted for the award of any other
degree of diploma in any other university.
Signature : Anthony J. Cole
Date : 29th of March 2019
iii
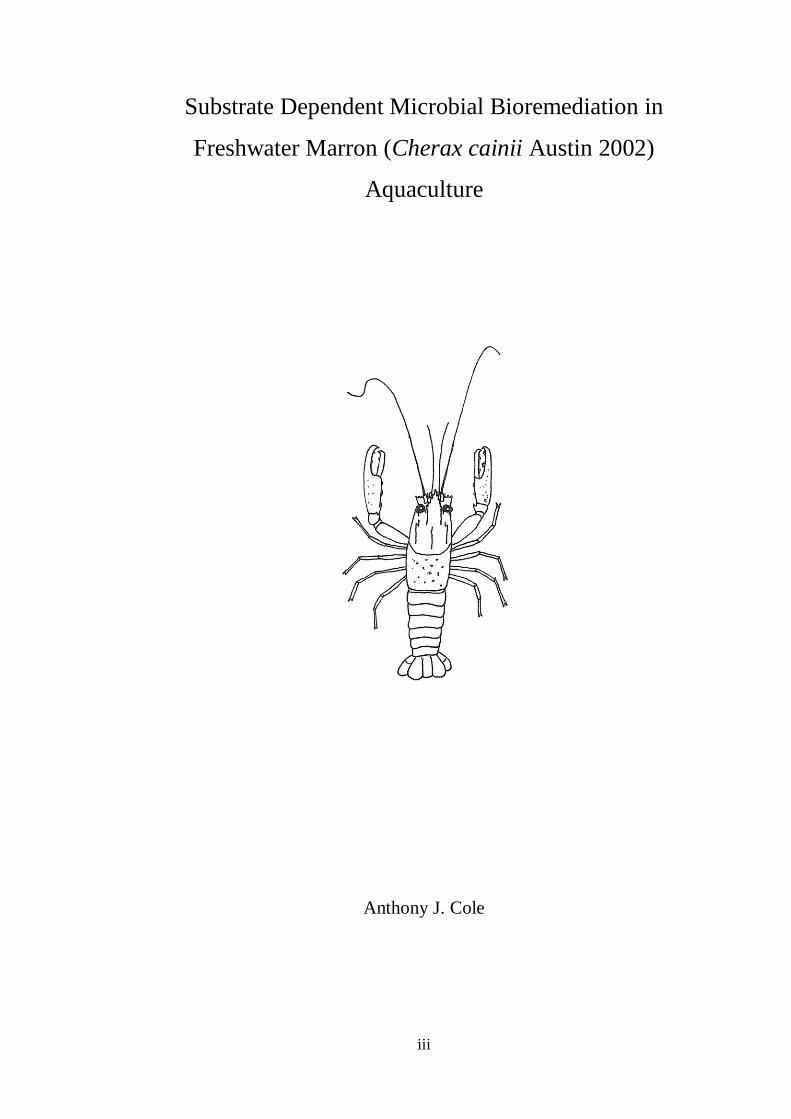
Substrate Dependent Microbial Bioremediation in
Freshwater Marron (Cherax cainii Austin 2002)
Aquaculture
Anthony J. Cole

iv
This thesis is dedicated to my parents, Darrel and Kathleen Cole

v
ACKNOWLEDGEMENTS
I am grateful to all the staff and students at Curtin University who have contributed to
this work. Thanks to Rowan Klienderst, hatchery manager, for assisting in setting up
the experiment and for advice, and to Anne Barnes, Elizabeth Crompton and Carey
Ryken-Rapp for administrative help. Thanks also goes to Dr William Robbins for
general advice about field work.
I would like to thank all the honours and postgraduate students who have been with
me during my time as a masters student. They were always ready to give advice, and
were friends as well as colleagues; whether in the office or ‘fish bowl’, laboratory, on
campus or outside of university. Thanks to Dr Tin Cong Hoang for helping with
scientific graphs, and in scientific writing. Special thanks to Smita Tulsankar for
assisting in laboratory experiments, field work, counting plankton, plating bacteria,
measuring water quality, weighing marron, improving writing, and in further teaching
me about aquaculture.
I am sincerely thankful to my supervisors; Professor Ravi Fotedar and Dr Benjamin
Saunders, without whom this work would not have been possible.
I am also grateful to Robert Morgan, the inventor of the water cleanser, for providing
the product and for discussing any ideas we had regarding its use, and for funding
support. Thanks also to the marron growers, especially John Guest, for their passionate
discussions about marron farming. A big thanks goes to Bevan and Debbie Hall for
their hospitality, for letting me conduct the field trial at their farm, and for providing
marron for experiments.
Last but certainly not least, thank you to my family; Mum, Dad, Samantha, Joe, Billie,
Summer and James for their love, support, and shared interest in aquatic life, to all of
my relatives that I haven’t mentioned, and to Oma and Opa for igniting my interest in
freshwater crayfish.

vi
TABLE OF CONTENTS
DECLARATION ii
ACKNOWLEDGEMENTS v
TABLE OF CONTENTS vi
LIST OF FIGURES xi
LIST OF TABLES xiii
LIST OF PLATES xv
LIST OF ABBREVIATIONS xvi
LIST OF SPECIES NAMES USED IN THIS THESIS xviii
ABSTRACT xx
CHAPTER 1: INTRODUCTION 1
1.1 Introduction 2
1.2 Aims and Objectives 3
1.3 Significance 6
CHAPTER 2: LITERATURE REVIEW 7
2.1 Aquaculture 8
2.1.1 World Aquaculture 8
2.1.2 Australian Aquaculture 9
2.1.3 Freshwater Crayfish Aquaculture 10
2.2 Marron Biology 12
2.2.1 Taxonomy and Distribution 12
2.2.2 Biology and Physiology 13
2.2.3 Water Quality 15
2.2.4 Stocking Density in Crayfish Culture 17
2.3 Freshwater Crayfish and Natural Productivity 18

vii
2.4 Microbes 19
2.4.1 Microbes in Aquaculture 19
2.4.2 Probiotics 21
2.4.3 Bacillus Species 22
2.5 Bioremediation 23
2.6.1 Bioremediation in Aquaculture 23
2.6.2 Bioremediation using Substrates 25
2.6 The Water Cleanser Substrate 26
2.7 Potential for Bioremediation in Marron Aquaculture 29
CHAPTER 3: EFFICACY OF DIFFERENT OIL-BASED SUBSTRATES AS
BIOREMEDIATORS 30
3.1 Introduction 31
3.2 Materials and Methods 32
3.2.1 Experiment Design 32
3.2.2 Bacterial Abundance 33
3.2.3 Statistical Analysis 34
3.3 Results 34
3.3.1 Water Quality 34
3.3.2 Bacterial Abundance 37
3.4 Discussion 38
CHAPTER 4: EFFECTS OF AN OIL-BASED SUBSTRATE (THE WATER
CLEANSER™ AND COMMERCIAL PROBIOTICS ON WATER QUALITY,
PHYTOPLANKTON AND MICROBIAL ECOLOGY AND MARRON (CHERAX
CAINII AUSTIN 2002) IN OUTDOOR CULTURE 41
4.1 Introduction 42
4.2 Materials and Methods 44
4.2.1 Experiment Design 44
viii
4.2.2 Water Quality 45
4.2.3 Animals and Growth Parameters 45
4.2.4 Phytoplankton 45
4.2.5 Haemolymph Indices 46
4.2.6 Bacteria 46
4.2.7 Statistical Analysis 47
4.3 Results 47
4.3.1 Water Quality 47
4.3.2 Bacteria 49
4.3.3 Marron 49
4.3.4 Phytoplankton 50
4.4 Discussion 52
4.5 Conclusions 56
CHAPTER 5: EFFECTS OF POND AGE AND A COMMERCIAL SUBSTRATE
(THE WATER CLEANSER™) ON NATURAL PRODUCTIVITY, BACTERIAL
ABUNDANCE, NUTRIENT CONCENTRATIONS, AND GROWTH AND
SURVIVAL OF MARRON (CHERAX CAINII AUSTIN 2002) IN SEMI-
INTENSIVE POND CULTURE 57
5.1 Abstract 58
5.2 Introduction 58
5.3 Materials and Methods 60
5.3.1 Location 60
5.3.2 Study Design 62
5.3.3 Animals 62
5.3.4 Water Quality 63
5.3.5 Bacteria 63
5.3.6 Natural Productivity 63

ix
5.3.7 Statistical Analysis 64
5.4 Results 65
5.4.1 Water Quality 65
5.4.2 Nutrient Concentrations 67
5.4.3 Natural Productivity 70
5.4.4 Bacteria 72
5.4.5 Marron Growth and Survival 75
5.4.6 Correlations 76
5.5 Discussion 78
5.6 Conclusions 81
CHAPTER 6: COMPARING BIOBALL® MEDIA AND THE WATER
CLEANSER™ IN REDUCING NUTRIENT LOADING IN MARRON (CHERAX
CAINII AUSTIN 2002) CULTURE 82
6.1 Introduction 83
6.2 Methodology 84
6.2.1 Location 84
6.2.2 Animals 84
6.2.3 Experimental Design 85
6.2.4 Feed and Nutrient Loading 85
6.2.5 Water Quality Sampling and Analysis 86
6.2.6 Analysis of Haemolymph 87
6.2.7 Analysis of Organosomatic Indices 87
6.2.8 Bacteria Sampling and Analysis 88
6.2.9 Statistical Analysis 89
6.3 Results 89
6.3.1 Observations 89
6.3.2 Survival 90

x
6.3.3 Water Quality 90
6.3.4 Nutrient Concentrations 92
6.3.5 THC and DHC 100
6.3.6 Organosomatic Indices 101
6.3.7 Bacteria 102
6.3.8 Marron Growth 103
6.4 Discussion 104
6.5 Conclusions 109
CHAPTER 7: GENERAL DISCUSSION 110
7.1 Introduction 111
7.2 Effects of TWC on Water Quality 114
7.3 Effects of TWC on Phytoplankton and Zooplankton Communities 116
7.4 Effects of TWC on Marron Health, Growth and Survival 117
7.5 Bacterial Abundance and Diversity in Different Experiments 118
7.6 Conclusions 120
7.7 Recommendations for Further Research 121
REFERENCES 123
APPENDIX A 139
APPENDIX B 140

xi
LIST OF FIGURES
Figure 1.1 Conceptual diagram of the Study. 5
Figure 2.1 Cherax distribution in Australia. 9
Figure 2.2 Conceptual diagram of The Water Cleanser in an aquatic
environment. 28
Figure 3.1 Experimental Design of Experiment 1. 33
Figure 3.2 Concentrations of TAN (mg/L) in four treatments over time. 35
Figure 3.3 Concentrations of NO2-N (a) and NO3-N (b) over time. 36
Figure 3.4 Concentrations of NO3-N and Total Phosphate after 13 weeks. 37
Figure 4.1 Mean temperature of all tanks over 18 weeks. 48
Figure 4.2 Changes in phytoplankton density (cells/mL) in different treatments
over 11 weeks. 51
Figure 5.1 Location of study site. 61
Figure 5.2 Study site, near Manjimup, W.A. 61
Figure 5.3 Variation of temperature from spring (6 weeks) to
autumn (24 weeks). 67
Figure 5.4 Variation in concentrations of TAN, NO2-N, NO3-N and
Orthophosphate, comparing old and new ponds over time. 70
Figure 5.5 Fluctuation of phytoplankton and zooplankton abundance, comparing
with and without substrate, and pond age. 72
Figure 5.6 Mean final biomass for juvenile and grow out ponds, between old and
new ponds with substrate and without substrate (control). 75
Figure 5.7 Survival rate in juvenile ponds between old and new ponds with and
without substrate. 76
Figure 5.8 Correlation between phytoplankton abundance and zooplankton
species richness in old ponds after six weeks (spring). 77

xii
Figure 5.9 Correlation between the concentration of orthophosphate and estimated
bacterial diversity in old ponds after 12 weeks in old ponds after 12
weeks (summer). 77
Figure 6.1 Concentration of NH3 with different substrate types at low and high
stocking density. 94
Figure 6.2 Concentration of NO2 with different substrate types at low and high
stocking density. 95
Figure 6.3 Concentration of NO3 in control, BM and TWC tanks, between two
stocking densities. 96
Figure 6.4 Concentration of NO3 with different substrate types at low and high
stocking density. 97
Figure 6.5 Concentration of total phosphates at different stocking densities in
control tanks, BM tanks and TWC tanks. 98
Figure 6.6 Concentration of total phosphates between different substrate types at
low and high stocking density. 99
Figure 6.7 Concentrations of orthophosphate with different substrate treatments at
low and high stocking density, after seven weeks. 100
Figure 7.1 Summary diagram of the study, showing the different objectives and
conditions in each Chapter, as illustrated in Figure 1.1. 113
Figure 7.2 Effects of different probiotics on the reduction of nutrient
concentrations in two experiments. 116
Figure 7.3 Comparison of bacterial abundance on the surface of TWC and BM
(Bioball Media) experiments 2 and 3 (Chapters 4 and 6 respectively).
120

xiii
LIST OF TABLES
Table 4.1 Water quality after 5 days, when concentrations of NO3-N and PO4
had both significantly decreased in TWC+B tanks. 48
Table 4.2 Mean Heterotrophic Plate Count in marron culture water. 43
Table 4.3 Mean phytoplankton abundance between four treatments over eighteen
weeks. 51
Table 4.4 Shannon Index (H) between four treatments over 18 weeks. 52
Table 5.1 Optimum ranges for water quality compared to observed range for all
ponds throughout the study. 65
Table 5.2 Grand means and standard errors for water quality between old and new
ponds. 66
Table 5.3 Concentration of orthophosphate in old and new ponds with and
without TWC. 68
Table 5.4 The Heterotrophic Plate Count (HPC) (x103) and Bacillus sp. count as
CFU/mL and estimated diversity. 74
Table 6.1 Mean ± standard error and range of the physico-chemical parameters
measured in all tanks throughout the experiment. 91
Table 6.2 Mean DO between low (SD1) and high (SD2) stocking density in
weeks 4 and 8. 91
Table 6.3 Mean ± standard error and ranges for nutrient concentrations in all
tanks throughout the experiment 91
Table 6.4 Mean ± standard error for water quality and bacteria parameters in all
tanks throughout the experiment (n=24 x no. of samplings). 92
Table 6.5 Results of 3-factor mixed model ANOVA on concentrations of NH3,
NO2, NO3, & PO4 with different substrate treatments and stocking
densities over 13 weeks. 93
Table 6.6 THC and DHC between substrate type and stocking density over time.
101

xiv
Table 6.7 Organosomatic indices of marron at end of experiment 3, after 13
weeks. 101
Table 6.8 Heterotrophic Plate Count (HPC), and Bacillus sp. growth between
treatments and stocking densities. 102
Table 6.9 Bacterial plate counts and diversity on different substrates after 9
weeks. 102
Table 6.10 Marron specific growth rate and final average weight between substrate
types and stocking density. 104
Table 7.1 Comparison of nutrient concentrations between all experiments, 6
weeks after application of TWC. 115
Table 7.2 Comparison of Growth and Physiological Parameters of adult 1+
marron from three experiments with and without TWC. 118

xv
LIST OF PLATES
Plate 3.1 TWC and TWC+ after six weeks of experiment 1. 38
Plate 4.1 TWC and TWC+B upon application. 44
Plate 4.2 Chlamydomonas sp. and Scenedesmus sp. found in phytoplankton
stock water, at 400x magnification. 50
Plate 5.1 Photographs of marron ponds showing TWC block, and hides. 62
Plate 6.1 The cylindrical white tanks and black planter-basket cages used in the
experiment. 86
Plate 6.2 Heterotrophic bacteria colonies sampled from water column after 48
hours incubation. 89
Plate 6.3 TWC with submerged biofilm, and the Bioball® Media used. 90
Plate 6.4 Bacillus sp. stained with crystal violet, at 1000x magnification. 103

xvi
LIST OF ABBREVIATIONS
ANOVA Analysis of Variance
APHA American Public Health Association
API Aquarium Pharmaceuticals ®
BM Bioball Media
CARL Curtin Aquatic Research Laboratories
CFU Colony-Forming Units
DHC Differential haemocyte count
DO Dissolved Oxygen
FCR Food Conversion Ratio
Hid Dry hepatopancreas index
Hiw Wet hepatopancreas index
HM% Moisture content of the hepatopancreas
HPC Heterotrophic Plate Count
LSD Least significant difference
N Nitrogen
OCL Orbital Carapace Length
P Phosphorous
PAO Phosphate Accumulating Organisms
RAS Recirculating Aquaculture System
SD Stocking Density
SGR Standard Growth Rate
SPSS Statistical package for the social sciences
TAN Total Ammonia Nitrogen
Tbd Dry tail muscle to body ratio
Tbw Wet tail muscle to body ratio

xvii
THC Total haemocyte count
TM% Moisture content of tail muscle
TWC The Water Cleanser
TWC+ The Water Cleanser Plus
TWC+B The Water Cleanser and Bacillus sp.

xviii
LIST OF SPECIES NAMES USED IN THIS THESIS
Scientific Name Common Name
Aeromonas bestarium N/A
Aeromonas eucrenophila N/A
Aeromonas veronii N/A
Astacus astacus Noble Crayfish
Astacus leptodactylus Narrow Clawed Crayfish
Bacillus cereus N/A
Bacillus mycoides N/A
Bacillus subtilis Hay/Grass Bacillus
Bacillus thuringiensis N/A
Bacillus vietnamensis N/A
Bidyanus bidyanus Silver Perch
Carassius auratus Common goldfish
Cherax cainii Smooth Marron
(Formerly Cherax tenuimanus)
Cherax tenuimanus Hairy Marron
Cherax destructor / albidus Yabby
Cherax quadricarinatus Redclaw Crayfish
Skistodiaptomus pallidus Calanoid Copepod
(Formerly Diaptomus pallidus)
Gadus morhua Atlantic Cod
Ictalurus punctatus Channel Catfish
Lates calcarifer Barramundi
Lemna minor Duckweed
Macrobrachium rosenbergii Giant Freshwater Prawn

xix
Oncorhyncus mykiss Rainbow Trout
Oreochromis niloticus Nile Tilapia
Pacifastacus leniusculus Signal Crayfish
Penaeus brasiliensis Red Spotted Shrimp
(Formerly Farfantapenaeus brasiliensis)
Penaeus indicus Indian White Shrimp
(Formerly Fenneropenaeus indicus)
Penaeus japonicus Kuruma Prawn
(Formerly Marsupenaeus japonicus)
Penaeus latisulcatus Western King Prawn
Penaeus paulensis Pink Shrimp
Penaeus monodon Tiger Prawn
Penaeus vannamei Pacific White Shrimp / Whiteleg Shrimp
(Formerly Litopenaeus vannamei)
Pinctada maxima Pearl Oyster
Pseudomonas aeruginosa N/A
Pseudomonas anguilliseptica N/A
Pseudomonas brassicacearum N/A
Pseudomonas cedrina N/A
Pseudomonas synxantha N/A
Pseudomonas extremorientalis N/A
Procambarus clarkii Red Swamp Crayfish
Rheineimera soli N/A
Salmo salar Atlantic Salmon
Thunnus maccoyii Southern Bluefin Tuna
Vibrio mimicus N/A

xx
ABSTRACT
Aquaculture is an important source of cheap protein and employment, especially with
the decline of wild fish stocks and increasing demand for seafood. With limited land
and water resources intensification of aquaculture is sometimes necessary, however
this can negatively affect water quality and the quality of produce. The maintenance
of good water quality is essential in all types of aquaculture, including that of marron
(Cherax cainii Austin 2002). One solution to improve water quality of the culture
environment and to reduce water use is bioremediation by using certain substrates that
function by promoting the growth of biofilm, containing heterotrophic bacteria. This
research investigated the role of oil-based substrates, The Water Cleanser™ (TWC and
TWC+), and associated microbes, in the bioremediation of water in marron culture.
Two indoor laboratory experiments, an outdoor laboratory experiment and a field
experiment were conducted to investigate the effects of TWC, Bioball Media, and
probiotics on water quality, plankton communities, bacterial communities, marron
health and productivity. TWC significantly reduced the concentration of
orthophosphate in all trials. TWC and TWC+ reduced the concentrations of ammonia,
nitrite and nitrate under indoor laboratory conditions, while Bioball Media reduced the
concentration of nitrate only. A combination of TWC and Bacillus sp. was effective in
bioremediation in outdoor laboratory conditions, and increased the abundance of
phytoplankton. TWC had no effect on the bacterial abundance in the water column in
any experiment, however commercial marron ponds with TWC resulted in a higher
abundance of Bacillus sp. Ponds with TWC also had a significantly higher final
biomass of juvenile marron. No negative effects were found on plankton communities.
Meanwhile, pond age had a significant effect on water quality and natural productivity.
There were no adverse effects of TWC or probiotics on the haemolymph indices (THC,
DHC) or condition indices of marron. The results of this study suggest that TWC can
provide habitat for heterotrophic bacteria, which maintain lower concentrations of
ammonia, nitrite, nitrate and orthophosphate in aquaculture conditions. TWC also
affects the bacterial composition of culture water, by promoting certain species (e.g.
Bacillus sp.). Further research is required to assess the microbial composition on TWC
surface, to better understand the mechanisms by which TWC functions, and to further
determine the benefits of TWC on the health and survival rate of marron.

Chapter 1: Introduction
This thesis presents an investigation into substrate dependent microbial
bioremediation of marron (Cherax cainii Austin 2002) aquaculture. Substrates can
have significant benefits for aquatic systems, including the improvement of water
quality, and the maintenance of good water quality is essential to all forms of
aquaculture. The thesis includes seven chapters, those concerning experiments are
described in Figure 1.1.
Chapter 1 presents an introduction to the thesis. This provides an overview of the main
aspects of the research, as well as the rational, aim, objectives and significance.

Chapter 1: Introduction
2
1.1 Introduction
Aquaculture is simply the practice of farming aquatic plants and animals in water. This
includes freshwater culture, and mariculture, among other forms. Aquaculture is an
important industry as a source of income, fish protein and for food security (Martinez-
Porchas & Martinez-Cordova 2012), in part due to declining fish stocks and increasing
demand. Aquaculture may help to relieve pressure on fish stocks, though there is some
controversy over this, as aquaculture often sources feeds from wild fish stocks, and
can have a detrimental impact on the environment (Naylor et al. 2000; Cabello et al.
2016; Alonso 2009). The aquaculture of marron (Cherax cainii Austin 2002) has a
lower impact on the environment than more intensive forms of aquaculture, and is
considered sustainable. However, water quality is still an important issue and
intensification of aquaculture may require new methods, such as the use of substrates
for bioremediation, to maintain good water quality and good marron productivity and
health.
Marron is a freshwater crayfish species native to, and successfully cultured in, Western
Australia. Marron aquaculture is considered a sustainable practice; which has minimal
water use, low environmental impact, and is mostly free of diseases (Alonso 2009).
However, if the industry is to expand more intensive aquaculture may be required, with
repercussions for the water quality within ponds, the ecology of ponds, the quality of
marron, and the surrounding environment. Maintaining good water quality is essential
in marron culture, as marron are adversely affected by changes in water quality
(Ackerfors 2000). Elevated levels of ammonia and/or nitrite can cause physiological
problems, growth inhibition, and mortality in freshwater crayfish (Jensen 1996; Jussila
1997a, Harris et al. 2001). High levels of nitrogen and phosphorous lead to
eutrophication. One solution to improve water quality and ecology of aquatic systems
is bioremediation. This process commonly uses probiotics, such as Bacillus sp.,
microalgae or macroalgae to improve water quality and aquatic ecology (Lananan et
al. 2014; Chávez-Crooker & Obreque-Contreras 2010; Perumal et al. 2015;
Ardiansyah & Fotedar 2016a; Abdel-Tawwab 2008; Samocha et al. 2015). Artificial
substrates can also be used, which encourage the growth of bacteria-containing
biofilm, and periphyton (Viau et al. 2012). These can be effective in improving water
quality (Schveitzer et al. 2013), while also providing a complementary food source for
certain species, including Cherax species (Jones et al. 2002; Viau et al. 2012).

Chapter 1: Introduction
3
One potential tool for the bioremediation of aquaculture is The Water Cleanser™
(TWC), which is an oil and wax based substrate for microbial growth, and provides
habitat and a carbon source for heterotrophic bacteria. Heterotrophic bacteria require
a carbon source in order to function; and to convert nitrates to nitrogen gas via nitrite
(Hamlin et al. 2008). Bacteria can enhance the nutrient cycling of an aquatic system,
increasing the rates of nitrification and denitrification processes and cycling of
phosphates from organic matter to dissolved particles and to and from sediments
(Moriarty 1997). This could aid in the bioremediation process by removing excess
organic matter, nitrogenous wastes and biologically available phosphates
(orthophosphates) from water. Alternatively, the enhanced nutrient cycling may
improve natural productivity by releasing nutrients from organic matter into usable
forms for phytoplankton. TWC is thought to promote bacterial and biofilm growth in
aquatic systems; which may in turn improve water quality and limit excessive build-
up of organic matter and organic wastes. TWC may improve the health of marron and
the surrounding aquatic environment, while also providing an additional food source
as attached biofilm. Increased understanding of bioremediation using substrates may
also help to improve other forms of aquaculture. Limited research has been conducted
using TWC in aquaculture systems, therefore further research is needed to better
understand microbial bioremediation using TWC in aquaculture.
1.2 Aims and objectives
This study aims to increase understanding of microbial bioremediation using TWC
substrate, to identify the role of bioremediation in marron (Cherax cainii) aquaculture
systems, and to investigate the effects on microbial ecology, natural productivity, and
on marron productivity and health. The flow of this thesis in relation to this is
illustrated in Figure 1.1.
The thesis sets out to address the aim above through the following specific objectives:
1. To evaluate the effects of substrates on bacterial abundance and diversity of colony
types under commercial and laboratory conditions of marron aquaculture.
2. To evaluate the effects of substrates and beneficial bacteria on water quality, natural
and marron productivity and marron health under commercial and laboratory
conditions.

Chapter 1: Introduction
4
3. To assess the impact of substrates on water quality, bacterial abundance, and marron
productivity and health at different stocking densities under laboratory conditions.
4. To study the relationships between water quality, natural productivity, bacterial
abundance, diversity of colony types, and marron productivity under commercial and
laboratory conditions.

Chapter 1: Introduction
5
Figure 1.1: Conceptual diagram outlining the main themes of the study (orange), the
main questions this study investigates (blue), and the research topic and the
experiments carried out, with the conditions under which each study was done (green).
Uses Types
Back
gro
un
d
Why Bioremediation?
-To improve water quality
-To reduce water exchanges
-To limit fish loss/mortality
-Intensification of aquaculture can
degrade water quality
Substrates
-Biofilm -Conditioned/not
-Attached biofilm and microbes can
reduce nutrient concentrations
-Biofilm can be a food source for cultured
animals
Probiotics
-addition of beneficial bacteria
-reduces nutrient concentrations
-can change microbial
composition
-can improve animal health
Qu
est
ion
s?
Role in Marron Culture
-Can water quality in marron culture be
improved?
-Effect of higher stocking densities on
water quality and marron?
-Can substrates increase plankton
productivity of marron ponds?
-Can substrates be used to improve health,
growth, survival rate of marron?
The Water Cleanser Substrate
-Biofilm present?
-Bacteria present?
-Effects on bacterial abundance?
-Effect on water quality?
-Effects on plankton?
-Effects on marron?
Microbes
-Abundance and diversity of
bacteria present in marron
ponds?
-Bacteria found on substrates?
-Bacteria important for
bioremediation and found on
substrates?
Chapter 3
-Experiment 1
-Laboratory -Indoor
-Nutrients added
-No marron or plankton
-Treatment: TWC, TWC+,
probiotic
-Efficacy in removal of N
& P?
Chapter 4
-Experiment 2
-Laboratory -Outdoor
-Nutrients added
-Marron and phytoplankton
-Treatment: TWC, probiotic,
combination
-What are the effects on water
quality, marron, bacteria and
phytoplankton?
Chapter 5
-Field experiment
-Commercial marron ponds
-Marron, phytoplankton
and zooplankton
-Treatment: TWC, pond
age
-What are the effects in
pond culture?
Chapter 6
-Experiment 3
-Laboratory -Indoor
-No nutrients added
-Marron, no plankton
-2 stocking densities
-Treatment: TWC, Bioball
Media
-Efficacy of substrates in
reducing nutrient loading?
Bioremediation in Aquaculture
Effects of TWC in Bioremediation of Marron Culture
Effects on water quality, plankton, bacteria and marron under different conditions

Chapter 1: Introduction
6
1.3 Significance
There is a growing need to improve water quality, reduce water usage, improve
environmental conditions and increase productivity in aquaculture systems (Zhou et
al. 2009; Samocha et al. 2002; Romano & Zeng 2012; Morrissy 1979). Sustainability
is becoming increasingly important in aquaculture (Naylor et al. 2000), and this can
be achieved in part by reducing inputs, such as water use (Samocha et al. 2002), and
improving water quality in water bodies and effluent (Hamlin et al. 2008). Improving
the microbiome of aquaculture systems via the addition of probiotics or substrates may
provide a simple solution to this growing problem. Substrates can promote growth of
bacteria and biofilm, which can have multiple benefits for the water quality, ecology
and overall health of aquatic systems and the health of cultured species (Viau et al.
2012; Thompson et al. 2002; Santhana Kumar et al. 2017; Batvold & Browdy 2001).
This research will help to increase understanding of the use of substrates in microbial
bioremediation, and add to the current knowledge about bioremediation in marron
aquaculture. The study may also help determine uses for substrates in marron culture
and other forms of aquaculture; improving productivity, health of the environment and
cultured animals, and increasing their farming sustainability.

Chapter 2: Literature Review
Chapter 2 presents a review of the literature of the main aspects of aquaculture and
bioremediation discussed in this thesis. Aquaculture in general is discussed, as well
as that of Australia, freshwater crayfish and specifically marron. The issues
surrounding water quality and the need for bioremediation are presented, as well as
the marron biology and the role of natural productivity in marron culture; relating to
Chapters 3, 4 & 5. The effects of stocking density are discussed, relating to Chapter 6.
An overall review of microbes in aquaculture, and the use of probiotics and substrates
is given, as well as a brief background to the oil-based substrate, The Water Cleanser
(TWC), investigated in this thesis, and its potential benefits for marron aquaculture.

Chapter 2: Literature Review
8
2.1 Aquaculture
2.1.1 World Aquaculture
Aquaculture is an important industry in terms of food security and supplying seafood
where fisheries alone cannot meet demand. Aquaculture has brought substantial
benefits to humanity; including food produced, the nutritional quality of aquatic
products, as a source of employment, and for the high trade potential of aquaculture
products (Martinez-Porchas & Martinez-Cordova 2012; Martinez-Porchas et al. 2014;
Bostock et al. 2010). This is increasingly become an important source of income and
fish protein, with the decline of fish stocks, and increasing demand for seafood. Almost
half of the global production of food fish is produced by fish farming (Nadarajah &
Flaaten 2017; Perumal et al. 2015). In 2014, 44.1% of seafood was contributed by
aquaculture (FAO 2016). Asia is the largest producer of farmed fishes, largely due to
the favourable tropical climate conditions, and availability of suitable sites and natural
water resources (Perumal et al. 2015).
Aquaculture is also one of the world’s fastest growing food sectors, with an annual
growth of approximately 4.7% (Perumal et al. 2015). Between 1987 and 1997 global
production of farmed fish and shellfish more than doubled (FAO 1999). Aquaculture
can have adverse impacts on the environment and certain fish stocks however (Naylor
et al. 2000; Cabello et al. 2016; Alonso 2009) and needs to be more sustainable. There
is increasing need to develop more sustainable aquaculture, with less reliance on
fishmeal sourced from fisheries, excessive water use, and antibiotics. As aquaculture
becomes more intensive, the high densities of animals and high inputs needed to
achieve good production can cause problems in terms of water usage, water quality
and health. Fish cages for example are known to increase organic matter on the bottom
sediments (Holmer 1991; Karakassis et al. 1998), and cause the progressive
transformation of sediments into an anoxic surface (Danovaro et al. 2003).
Bioremediation can be used to improve the water quality and cleanliness of aquatic
systems, and provides an alternative to filtration and water exchanges. Bioremediation
may also improve the environmental health of aquatic systems. Macrophytes can be
used to reduce nutrient concentrations (Abdel-Tawwab 2008; Samocha et al. 2015;
Ferdoushi et al. 2008). Microbial bioremediation may be applicable to aquaculture
where nutrient levels are excessive or where the environmental and ecological health

Chapter 2: Literature Review
9
can be improved. This may also improve carrying capacity of aquaculture ponds;
increasing the stocking rate of animals without impacting on growth or water quality.
Water resources are limited, therefore new systems such as recirculating aquaculture
systems and biofloc are being used to limit water use without compromising on water
quality (Ardiansyah & Fotedar 2016a; Ahmad et al. 2017; Ray et al. 2010). Meanwhile,
heavy use of antibiotics has been used, particularly in shrimp culture, leading to
environmental problems and growing antibiotic resistance in pathogens (Cabello et al.
2016). This has led to an increase in probiotics use in aquaculture (Balcázar et al.
2006). The use of artificial substrates, such as the Water Cleanser™ (TWC), Aquamat™,
Bioballs®, bamboo or ethylene substrates, is an alternate solution which can provide
a habitat for probiotic bacteria and biofilm which in turn may promote the health and
growth of cultured species and help control water quality (Schveitzer et al. 2013;
Thompson et al. 2002; Viau et al. 2012).
Research into bioremediation in aquaculture is largely focused on probiotics, with the
use of artificial substrates in bioremediation slowly becoming more common. Limited
bioremediation research has been carried out in freshwater crayfish culture. Crayfish
culture is present in Australia, largely due to the several native species that are suitable
for aquaculture there.
2.1.2 Australian Aquaculture
In Australia, the majority of aquaculture production is limited to five main types; Pearl
Oysters (Pinctada maxima), Edible Oysters (various species), Atlantic Salmon (Salmo
salar), shrimp/prawns (various species) and Southern Bluefin Tuna (Thunnus
maccoyii) (ABARE 2003). Cage culture is common for marine fishes, while pond
culture is more widely used for shrimp and freshwater species. Aquaculture in
Australia involves producing high value products and fishes, often for export. There is
potential for aquaculture expansion in Australia, especially in marine and brackish
waters as freshwater is somewhat limited. Presently, mariculture is more common,
though freshwater culture is practiced. Freshwater aquaculture species farmed include
rainbow trout (Oncorhyncus mykiss), silver perch (Bidyanus bidyanus), Barramundi
(Lates calcarifer) and freshwater crayfish (Cherax sp.). There was an estimated
production of 400 tonnes from crayfish aquaculture in Australia in 1999 (Ackerfors
2000).

Chapter 2: Literature Review
10
2.1.3 Freshwater Crayfish Aquaculture
Worldwide crayfish aquaculture includes cambarid culture in North America and
China, and astacid culture in Europe (Huner et al. 1988; Ding et al. 2012). The culture
of crayfish is sometimes referred to as astaciculture. There are two main families of
crayfish cultured outside of Australia; Cambarids and Astacids. Cambarids such as
Procambarus clarkii are fast growing and found in warm waters, whereas most
astacids such as Astacus astacus and Pacifastacus leniusculus are slower growing and
inhabit cooler temperate waters.
In Australia three main crayfish species are cultured, all in the genus Cherax
(Decapoda: Parastacidae). In northern Australia Redclaw Crayfish (Cherax
quadricarinatus) is cultured, in warm subtropical ponds, with a fast growth rate. In
Eastern Australia the Yabby (Cherax destructor / Cherax albidus) is cultured. Marron
(Cherax cainii Austin 2002), formerly Cherax tenuimanus (Smith 1912), are a
freshwater crayfish species native to south Western Australia (Figure 2.1) and a target
of aquaculture there. They are also cultured in southern Africa. They are larger than
the yabby (Cherax destructor) and redclaw (C. quadricarinatus), but can be relatively
slow growing. They are the third largest species of crayfish in the world and are
capable of reaching 2kg in weight (Holdich 2002; Morrissy 2000), though market size
is approximately 70 to 200 g. Unlike yabbies and other crayfish, marron are poor
burrowers and can only survive in permanent waters such as lakes and rivers in nature,
such as the Blackwood and Margaret River. The cultured marron C. cainii, known as
‘smooth marron’, were formerly known as C. tenuimanus, which are now referred to
as ‘hairy marron’. Marron are a decapod crustacean in the family Parastacidae; the
main family of crayfish in Australia and the southern hemisphere. There is great
diversity of freshwater crayfish in Australia; there are nine endemic genera of crayfish
found in Australia, though Cherax and Euastacus are the more widespread genera
(Beatty et al. 2013). In Western Australia, parastacid crayfish are restricted to the
southwest coast drainage division, and do not occur naturally in the Pilbara or
Kimberley areas.
Chapter 2: Literature Review
11
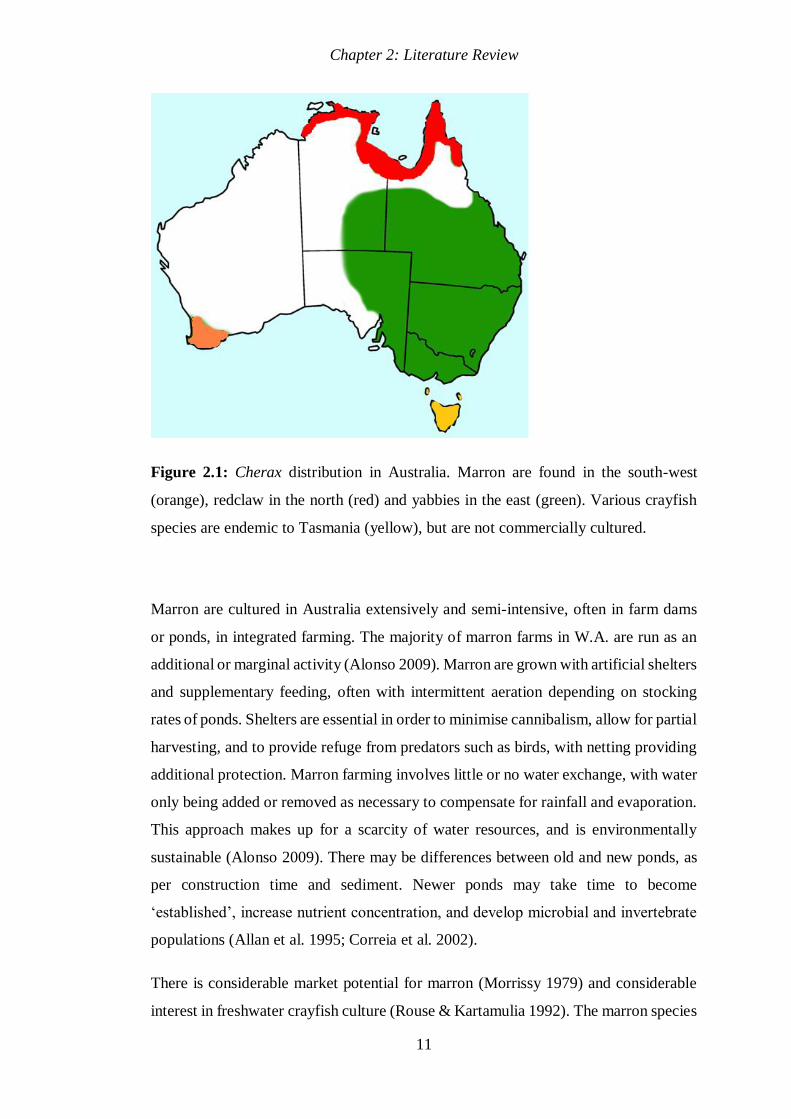
Figure 2.1: Cherax distribution in Australia. Marron are found in the south-west
(orange), redclaw in the north (red) and yabbies in the east (green). Various crayfish
species are endemic to Tasmania (yellow), but are not commercially cultured.
Marron are cultured in Australia extensively and semi-intensive, often in farm dams
or ponds, in integrated farming. The majority of marron farms in W.A. are run as an
additional or marginal activity (Alonso 2009). Marron are grown with artificial shelters
and supplementary feeding, often with intermittent aeration depending on stocking
rates of ponds. Shelters are essential in order to minimise cannibalism, allow for partial
harvesting, and to provide refuge from predators such as birds, with netting providing
additional protection. Marron farming involves little or no water exchange, with water
only being added or removed as necessary to compensate for rainfall and evaporation.
This approach makes up for a scarcity of water resources, and is environmentally
sustainable (Alonso 2009). There may be differences between old and new ponds, as
per construction time and sediment. Newer ponds may take time to become
‘established’, increase nutrient concentration, and develop microbial and invertebrate
populations (Allan et al. 1995; Correia et al. 2002).
There is considerable market potential for marron (Morrissy 1979) and considerable
interest in freshwater crayfish culture (Rouse & Kartamulia 1992). The marron species

Chapter 2: Literature Review
12
has many advantages for culture, such as having a relatively large size and a simple
life cycle with no larval stage. Marron breed naturally in ponds and dams, and are
brooders. Reproduction generally begins in spring when the water temperature and day
length begin to increase. They are the largest cultured freshwater crayfish in the world.
Marron production has been stable for the past few decades at close to 50
tonnes/annum (ABARE 2003). Marron are generally considered a luxury food highly
respected by chefs, and yield high prices. The tail muscle to body ratio and the meat
yield are quite high when compared to other crayfish, and compares favourably with
marine rock lobsters (Holdich 2002). Similarly to other Cherax species, Marron are
also an important component of freshwater ecosystems in Australia.
2.2 Marron Biology
2.2.1 Taxonomy and Distribution
Freshwater crayfish are considered monophyletic in origin (Holdich 2002), and are
native to every continent except Africa and Antarctica, though crayfish are native to
Madagascar. Parastacids occur in New Guinea, New Zealand, Madagascar, South
America, and Australia. The family Parastacidae comprises 14 genera and
approximately 139 species (Holdich 2002). Cherax and Euastacus are the more
widespread genera (Beatty et al. 2013). The natural distribution of Cherax cainii has
been extended as far north as the Hutt River, north of Geraldton, and as far east as
Esperance. Marron (Cherax cainii) are identified by their dark colour, narrow pincer-
like chelipeds, five keels on the dorsal surface of the carapace, and two small spines
on the telson. The systematic classification of marron is as follows:
Kingdom: Animalia
Phylum: Arthropoda
Subphylum: Crustacea
Class: Malacostraca
Order: Decapoda
Suborder: Pleocyemata
Infraorder: Astacidea

Chapter 2: Literature Review
13
Family: Parastacidae
Genus: Cherax
Species: Cherax cainii (Austin 2002)
2.2.2 Biology and Physiology
Marron are primarily detrivores, but are polytrophic, occupying various part of the
trophic web. They can consume microbially-enriched detritus, phytoplankton,
including diatoms, zooplankton, macrophytes, and other plant matter and animal
matter. Marron have been found to be predatory in part, consuming small fish as part
of their diet (Duffy et al. 2010). Cannibalism is also common in marron culture. In
south-western rivers they are usually the dominant species due to their large biomass.
They can fall prey to terrestrial birds and other animals, however, including finfish,
cormorants, water rats and tortoises (Tay et al. 2007). Due to the predation by finfish
polyculture is uncommon. Marron comprise an important part of aquatic ecosystems
by converting plant and algal matter into consumable animal protein, and by occupying
a key role in the ecosystem as both predator and prey. Juveniles are generally more
carnivorous than adults, consuming more zooplankton. Shelters are important for
juvenile crayfish for reducing cannibalism and providing a refuge (Jones et al. 2002).
The life cycle of marron is fairly simple and easily managed. Spawning occurs in late
winter to early spring, with temperature being a probable stimulus for spawning.
Reproduction generally begins when the water temperature and day length begin to
increase. Females incubate from 100 to 300 berries attached to pleopods under the tail,
which then hatch with young remaining attached for 3 stages before being released as
juveniles. As marron are brooders they are easier to culture than marine crustaceans
such as lobsters, which go through several larval stages.
The physiology of marron is similar to that of other decapod crustaceans. Haemolymph
is the transport medium of the decapod crustaceans’ open circulatory system. The
system includes various types of haemocytes, similar to blood cells. The three main
types are known as granulocytes, semi-granulocytes and hyalinocytes, which differ in
morphology and function.
The number of haemocytes and the proportion of granulocytes are considered
indicators of stress and health of crustaceans (Jussila 1997b). The total haemocyte

Chapter 2: Literature Review
14
count (THC), essentially measuring the production or release of haemocytes into the
haemolymph, is one of the most important immunological responses for crustaceans
(Romano 2012). The haemocytes of several species of crustaceans can be affected by
factors such as temperature, pH, salinity, dissolved oxygen and ammonia (Sang et al.
2009).
The hepatopancreas is an important organ in crayfish which acts as both a pancreas
and a liver, and as a store of energy and nutrients. Hepatopancreas size and moisture
concentration can be used as condition indices (Jussila 1997b). Changes in size and
moisture content of the hepatopancreas can be affected by diet, and also indicate
condition of crustaceans. The hepatopancreas can detoxify foreign compounds in the
haemolymph, and store calcium and other nutrients required for moulting (Jussila
1997b). The organosomatic indices of the tail muscle can also be used as a monitor of
physiological condition in crustaceans (Prangnell & Fotedar 2006). As the
hepatopancreas and tail muscle are used as energy stores in marron, their composition
is often related to the nutrition of marron.
Growth of marron is largely dependent on temperature, with optimum temperatures
for marron at approximately 15-20°C, but they can be higher at 24°C, while the
minimum temperature for growth is at 11-13°C (Morrissy 1990). At temperatures
above 27°C survival can be affected (Rouse & Kartamulia 1992), while temperature
below 13°C can inhibit growth (Morrissy 1990). As marron inhabit cool waters they
are relatively slow growing compared to tropical species, such as redclaw. From the
effects of seasonal temperature change growth is not constant year round, and can be
very slow between April and August. Growth of arthropods, including crayfish, occurs
via moulting. Similarly to other temperate crayfish (Holdich 2002), growth is generally
seasonal, where moulting may slow from April to August (winter) and increase from
spring through to autumn. Moulting is also limited by reproduction in females, as
berried females cannot moult. Temperature is the main limiting factor for growth in
colder months, while in warmer months other factors are limiting such as food
availability and photoperiod. Growth of crayfish may be suppressed in laboratory
conditions due to limited space, poor water quality and/or an entirely artificial diet
(Geddes et al. 1988). Fed only an artificial diet moulting frequency may be depressed
compared to marron fed a natural diet (Morrissy et al. 1984), while some loss of
exoskeleton pigmentation may also occur, presumably because of lack of carotenoids

Chapter 2: Literature Review
15
(Sommer et al. 1991). Other factors such as water quality, and concentrations of
important trace elements such as calcium may also be limiting. Nitrogenous wastes
ammonia and nitrite can have lethal and sublethal effects on crustaceans, and may also
impede growth.
2.2.3 Water Quality
Marron are adversely affected by changes in water quality (Ackerfors 2000), for
example parasites and surface fouling such as Epistylis can occur on marron due to
poor water quality and excessive organic matter build up (Ambas et al. 2013). Epistylis
is a protozoan common in crayfish aquaculture that can restrict water flow to the gills,
causing asphyxiation, and also decreases value. The presence of Epistylis is an
indicator of high organic load or excessive organic matter build up, low oxygen levels
and poor water quality in dams (Department of Fisheries 2012; Ambas et al. 2013).
Another common parasite is Temnocephala, a flatworm that can found as eggs on the
tail underside. They pose no health risk, however. Disease is not currently a serious
issue in marron aquaculture, and though surface fouling decreases market value it does
not have lethal effects. Aeration is recommended for moderate to high densities to
improve water quality and prevent anoxic conditions. Turbidity is an important
measure in aquaculture, as it relates to microalgae concentrations (Gamboa-Delgado
2014), which can be an important food source and source of primary productivity.
Turbidity can affect photosynthesis at the benthic level, while high concentrations of
phytoplankton may increase the turbidity. Clear water may increase vulnerability of
crayfish to predation by birds such as cormorants. Turbid ponds encourage daytime
feeding and provide some protection from predators. This also doesn’t impair their
feeding abilities as crayfish rely on chemo-sensitivity. When turbidity is too high
though benthic natural production will decrease due to lack of light penetration and
primary production will be limited.
Toxic ammonia and nitrite can cause physiological problems in crayfish (Jensen 1996;
Harris et al. 2001), though the levels are generally low in semi-intensive pond culture.
Ammonia from excretion and other sources can be transformed into toxic unionised
ammonia, or oxidised into nitrite; which is then oxidised into nitrate. High ammonia,
nitrite and nitrate levels can occur in intensive culture, which may be a problem for
health of crayfish and may inhibit growth (Jussila & Evans 1996). Inclusion in plant

Chapter 2: Literature Review
16
protein diets has been shown to increase unionised ammonia levels in ponds culture,
which has been attributed to lower survival (Fotedar 2004). High pH levels can also
increase the amount of ammonia in the toxic unionised form. The pH of water in
aquaculture is of key importance. The pH is considered to be important to freshwater
productivity in general. Though the effects of acidification in aquatic systems and
aquaculture systems containing marron is not well studied, a neutral to slightly alkaline
pH is thought to be optimal for marron. Crayfish species are thought to be negatively
affected at low pH, below 5.6 (Holdich 2002). In acidic waters calcium and oxygen
levels in crayfish can be difficult to maintain (Ackerfors 2000). Acidified systems may
inhibit reproduction. Meanwhile, excessive algal blooms can cause very high pH
levels.
In tank culture ammonia and nitrite can be more problematic, while in pond culture
high nitrate and phosphate levels can trigger algal blooms and filamentous algae
growth (Blaas & Kroeze 2016). Eutrophication can have direct and indirect negative
effects on crayfish. In natural systems, runoff from fertilizers in agriculture, and from
stormwater drains can cause excess build-up of nutrients. In aquaculture runoff,
excessive feeding, fertilization and overstocking can cause this. There are a host of
problems caused by eutrophication including decrease in oxygen concentration as
algal and bacterial blooms consume more oxygen, and toxic cyanobacteria blooms.
Eutrophication can lead to high biological oxygen demand (BOD) and low dissolved
oxygen in ponds, especially in summer (Huner 1994). Marron are sensitive to low
oxygen levels and hypoxia brought about by excessive feeding (Morrissy 1984).
Overloading of a pond with organic matter may lead to low survival due to oxygen
depletion (Morrissy 1979), and may increase turbidity. Build-up of organic matter in
sediment can create anaerobic conditions and slowly release nutrients and toxic
substances such as ammonia, nitrite and hydrogen sulphide. The main sources of
organic matter are uneaten feed, senescence of microalgae and faeces (Li & Boyd
2016). In systems with algal blooms low oxygen levels may be found in the morning,
while algal die-off will further deplete oxygen levels. Meanwhile, crayfish can
consume toxic blue-green algae, but consumption for an extended period of time may
cause ill effects and may even be lethal. Filamentous algae can also grow to ‘choke’
eutrophic ponds. A stable, green algae bloom can be beneficial to natural productivity
and in supporting natural food sources for crayfish, however. Ponds with higher

Chapter 2: Literature Review
17
stocking rates, such as intensive systems, may increase eutrophication and impede on
water quality.
2.2.4 Stocking Density in Crayfish Culture
There are many studies concerning crayfish and stocking density (Mazlum 2007;
Fotedar et al. 1999; García-Ulloa et al. 2012; Jones & Ruscoe 2000; Mills & McCloud
1983). Most studies have focused on juvenile crayfish, which are generally more
susceptible to mortality. Several studies have also found that size at stocking and
stocking density can greatly affect production (Jones & Ruscoe 2000; Geddes &
Smallridge 1993). Mazlum (2007) found that narrow-clawed crayfish (Astacus
leptodactylus) juveniles were negatively affected by increased stocking density in
terms of growth in both length and weight. Similarly, Mills & McCloud (1983) found
greater growth of yabbies (Cherax destructor) at the lower stocking density of 10/m2.
Geddes et al. (1988) found that C. destructor growth was significantly depressed in
small crayfish held communally at a higher density. Growth rate of freshwater crayfish
has been found to be inversely related to density (Verhoef & Austin 1999).
In aquaculture ponds, carrying capacity is often exceeded to that of a natural system.
Carrying capacity is generally defined as the maximum population or biomass that can
be supported sustainably, given resource constraints and other physical and biological
factors (Acou et al. 2011). When carrying capacity is exceeded physical factors such
as water quality may be negatively affected, and in turn growth and health of animals
in the water body may be impaired. Higher stocking density may lead to stunted
growth, higher levels of wastes and nutrients, lower oxygen levels, and higher
mortality rates. In crayfish culture higher stocking densities can also lead to increased
fighting among crayfish, cheliped damage, lower production, and lower survival rates
(Mazlum 2007). In intensive culture, using individual cages may improve survival and
decrease cheliped damage. Overcrowding influences oxygen, water quality, food
availability, competition and negative social interaction (García-Ulloa et al. 2012).
Crowding may also increase stress in crayfish. Marron are susceptible to low oxygen
levels, and may require aeration for intensive aquaculture (Morrissy 1979). Various
methods may be adopted to improve carrying capacity of systems. In prawn
(Macrobracium rosenbergii) culture, carrying capacity may be improved by adding
substrate; increasing growth and overall size of prawns (Tidwell et al. 1998). In marron

Chapter 2: Literature Review
18
culture, hides or shelters are commonly used, whereas substrate may be used for
detrital food formation or for microbial colonisation (Morrissy 1979; Jones & Ruscoe
2000). Using artificial substrates may also improve water quality, allowing for higher
stocking densities without impacting on growth and health of animals. Higher stocking
rates of animals can lead to better utilization of space, labour and water, and greater
production per unit of space. The substrates present in this study provide no habitat or
refuge for marron however.
In Chapter 5 of this thesis, containers have been used to house marron. Research has
suggested a method for determining the area needed for unrestricted growth in a
similar animal; lobsters (Geddes et al. 1988). The area, A, required for unrestricted
growth has been expressed in the form A = bC2, where C is carapace length. The value
for b may vary from 20 to 75, with lower values limiting growth. By this method
container size and sizes which may limit growth for crayfish can be determined.
However, Geddes et al. (1988) found that growth, in terms of moult increments and
intermoult periods, of C. destructor was not significantly depressed by smaller
container size. The size of containers used in the current study, in Chapter 5, were
determined not to limit growth using the formula A=bC2. Apart from providing
shelters and the maintenance of good water quality, promoting the natural food items
is important in marron culture.
2.3 Freshwater Crayfish and Natural Productivity
The natural diet of marron is largely composed of fine particulate organic matter, as
well as smaller amounts of plants and insects and other plant and animal matter
(O’Brien 1995). Freshwater crayfish are known to feed on both artificial feed and
natural sources of feed including macrophytes, benthic invertebrates, zooplankton,
algae, bacteria and detritus (Saoud et al. 2012; Browne et al. 1992). Marron are
opportunistic feeders but are primarily detrivorous. They also ingest large amounts of
microbes living in the detritus and decomposing organic matter. Thus while they can
feed on artificial feed, natural food sources also contribute largely to their diet. Feed
can constitute a large proportion of the production costs associated with marron
culture, thus increasing natural productivity can save on costs and potentially increase
production. Natural productivity is the production of plankton and natural food
sources. Natural productivity is important in prawn aquaculture, where fertilizer is

Chapter 2: Literature Review
19
often added to stimulate the natural food sources which supplement artificial feeding
(Gamboa-Delgado 2014; Abu Hena & Hishamuddin 2014). Fewer studies have
investigated the role of natural productivity in marron culture, however studies have
shown the benefits of zooplankton and other natural food sources in crayfish culture.
Austin et al. (1997) found that juvenile C. destructor fed a combination of zooplankton
(Daphnia sp.) and artificial feed had higher survival and growth rates then juveniles
fed artificial feed alone. Juveniles fed zooplankton also had less variability in size then
pellet fed juveniles. There is potential for ponds to be partly or wholly dried out,
planted with a forage crop such as clover and incrementally flooded to provide a food
source for crayfish. This method of feeding was used in one study, where extensive
aquaculture with a forage crop was used to produce modest yields of C. destructor
(Geddes & Smallridge 1993). Zooplankton were also present and may have provided
a source of high protein. The use of a forage crop has not been widely tested in marron
aquaculture yet however. More research is needed to establish suitable natural feeds
for adult marron in aquaculture. It is recommended that zooplankton populations are
well established in juvenile ponds, as they may be key in improving juvenile survival
and growth. Zooplankton communities are thought to be partly dependent on
phytoplankton.
Phytoplankton growth is known to be dependent on the availability of nitrogen and
phosphorous, both of which are cycled by microbes. Thus altering the concentration
and composition of microbes in the water, and on substrates, will likely affect the
concentrations of phytoplankton and in turn zooplankton and epiphytes, and affect
crayfish growth. The application of microbes may also change the concentration of
cyanobacteria, which can form harmful blooms and produce toxins. Microbes may
influence the natural productivity, by affecting nutrient cycles. However, while aquatic
heterotrophic bacteria decompose organic matter and cycle nutrients, they may also
consume inorganic phosphorous, thus competing with phytoplankton (Sorokin 1999).
Bacteria and associated biofilm may also provide food directly to marron, which are
known to ingest microbes in organic matter.
2.4 Microbes
2.4.1 Microbes in Aquaculture

Chapter 2: Literature Review
20
Microbes were not known to mankind until Antonie Philips van Leeuwenhoek (1632–
1723), a Dutch tradesman and scientist from Delft, The Netherlands, first found
microbes in 1676. He is commonly known as the Father of Microbiology, and is
considered to be the first microbiologist (Zhou et al. 2009). Microbes are an important
component of all ecosystems, including lakes, rivers and seas. Bacteria have several
important roles in aquatic systems; including affecting oxygen levels, oxidising
ammonia and nitrite, influencing pH levels, affecting other water quality parameters,
contributing to food webs, and as heterotrophic decomposers; cycling nutrients from
organic matter to increase availability to primary producers (Moriarty 1997). Microbes
can also convert wastes into consumable cellular protein that may provide alternative
food sources for cultured aquatic animals (Bender & Phillips 2004). The use of
bioflocs is common in many forms of aquaculture, where inorganic waste and carbon
is converted to a food source for larvae. In nature, bacteria are often found in
association with microalgae and cyanobacteria, and can influence the development or
decline of algal blooms (Subashchandrabose et al. 2011). Classical methods such as
plating bacteria have been used for isolating or counting bacteria colonies, but these
can be fairly inaccurate and newer methods such as epifluorescence microscopy have
become powerful tools for determining numbers and biomass of bacteria (Moriarty
1997).
Aquatic microbes include phytoplankton, bacteria, protozoans and microzooplankton
(Sorokin 1999). The microbes that grow on the Substrate and consume organic oils
include Archaea bacteria and Bacillus sp., though other microbes may also settle on
the Substrate and contribute to its bioremediation processes (Marine Easy Clean 2015).
These may include Nitrosomonas, Nitrobacter and other chemoautotrophic bacteria,
though are thought to be mostly heterotrophic in nature. Nitrosomonas convert toxic
ammonia into less toxic nitrite, while Nitrobacter convert this nitrite into far less toxic
nitrate, which can then be used by primary producers. Nitrogenous wastes can be
sourced from ammonia excretion, solid faecal waste, decaying organisms, excess feed
and nitrogen fixation. Ammonia is more toxic at higher pH and temperature, which
shifts the ionization equilibrium towards the unionized form (Hargreaves 1998).
Ammonia transformation requires oxygen, therefore there is often a build-up of
ammonia in anoxic sediments.

Chapter 2: Literature Review
21
Heterotrophic bacteria, including Bacillus species, require a carbon source to function.
Microbial nitrogen removal is limited by the supply of carbon as an electron donor
(Robinson et al. 2018). Bacteria may assimilate nitrogen, phosphorous and other
nutrients or trace elements to build biomass. They may also convert nitrates to nitrites
and then nitrogen gas via denitrification, removing it from the system. Exogenous
carbon is required for this process (Robinson et al. 2018).
Microscopic organisms also accomplish the basic transformation of organic matter
(Sorokin 1999). Dead organic matter build up a detritus energy pool made up of
particulate and dissolved organic matter, which can be used by microbes. Bacteria
decompose and oxidise complex organic substances from this stock of dead organic
matter, using 15 to 35% for their own biosynthesis (Sorokin 1999). This drives the
self-purification process in aquatic systems. Several types of microbes decompose
organic matter to meet the growth requirements of cultured species and reduce
pollution from aquaculture (Zhou et al. 2009). Bender & Philips (2004) suggest that
microbial ecosystems might be useful to bioremediation of environmental pollutants.
2.4.2 Probiotics
The overuse of antibiotics in aquaculture to treat disease can lead to the emergence of
bacterial resistant species and environmental problems. Antibiotics may be ineffective
due to overuse leading to increased disease resistance by bacteria, damage to the
microflora of the environment and antibiotic residue building up in aquatic systems
(Zhou et al. 2009). Probiotics can be used as an environmentally friendly alternative
to disease management. Probiotics can be defined as microbial supplements which
beneficially affect the host and their digestive health. The health of the aquatic
environment and ecosystem can also be improved. Probiotics may also aid in removing
excess organic matter, nutrient cycling, water quality improvement and potentially
may improve natural productivity. They may be added in feed or added directly to the
water. Probiotics can be used to alter bacterial composition and abundance in the
gastrointestinal tract, improving digestive health and immunity. Several studies have
investigated the use of probiotics in crustacean aquaculture (Ambas et al. 2013; Hai et
al. 2009). Ambas et al. (2013) found that Bacillus mycoides and Bacillus sp. were
effective in improving physiological condition, immune parameters and the level of
the bacterial load in the intestine of marron (C. cainii) when compared to the control

Chapter 2: Literature Review
22
diet. The total haemocyte count was similar between treatments before exposure to
Vibrio mimicus but after there was a significant decrease. Probiotic treatments had a
significant effect on differential haemocyte count, resulting in a higher granulocyte
cell proportion.
Prebiotics have also been widely used in prawn aquaculture as an alternative to
antibiotics and chemical treatments. Prebiotics are supplements which promote the
growth of intestinal flora. Hai et al. (2009) found that immunostimulants increased the
standard growth rate and survival of western king prawns (Penaeus latisulcatus).
Commercial probiotics, Bio-mos and β-1,3-D-glucan, and customised probiotics,
Pseudomonas synxantha and P. aeruginosa, were used. The bacterial load in the
intestine of prawns fed probiotics also increased (Hai et al. 2009). In marron farming
limited research has been done on probiotics or prebiotics. However, some bacterial
additives, generally containing Nitrosomonas and Nitrobacter are used by marron
farmers to improve water quality.
Microbes can also convert wastes into consumable cellular protein that may provide
alternative food sources for cultured aquatic animals (Bender & Phillips 2004). The
use of bioflocs is common in many forms of aquaculture, where inorganic waste and
carbon is converted to a food source for larvae. Culturing microbes or biofilm on
substrates can also provide a complementary food source. Probiotics can also be used
to improve the microbial ecology of a system; changing the microbial concentrations
and species present, and improving the health of the system and in turn the animals.
Carbon sources such as fermented barley straw or humic acid may also be used. These
can be rich sources of carbon for heterotrophic bacteria such as Bacillus species.
2.4.3 Bacillus Species
Bacterial probiotics for bioremediation include Nitrosomonas, Nitrobacter, Bacillus,
Pseudomonas and Acinetobacter. Nitrifying bacteria have only one main role
however, and using Pseudomonas and Vibrio strains can be dangerous as pathogenic
strains present in the water may transfer genes to the probiotic forms. Bacillus are gram
positive bacteria and are unlikely to use genes for antibiotic resistance or virulence
from Vibrio species (Moriarty 1999). Bacillus sp. are commonly associated with
improvement of water quality. Archaea and certain Bacillus species are thought to
consume organic oils including hydrocarbons, and cycle nutrients. Bacillus sp.

Chapter 2: Literature Review
23
compete for nutrients with other bacteria, thereby limiting the growth of pathogenic
and resistant bacteria (Hong et al. 2005; Moriarty 1999). Bacillus which produce an
antibiotic may also outcompete Vibrio, even if only a fraction are killed the Bacillus
may then outnumber the Vibrio and there will be a shift in dominance. Research into
probiotics such as Bacillus in aquaculture is mostly focused on addition to feed, with
its use in bioremediation slowly becoming more common.
2.5 Bioremediation
2.5.1 Bioremediation in Aquaculture
As aquaculture becomes more intensive, the high densities of animals and high inputs
needed to achieve good production can cause problems in terms of water usage and
water quality. Fish cages for example are known to increase organic matter on the
bottom sediments (Holmer 1991; Karakassis et al. 1998), and cause the progressive
transformation of sediments into an anoxic surface (Danovaro et al. 2003).
Bioremediation can be used to improve the water quality and cleanliness of aquatic
systems, and provides an alternative to filtration and water exchanges. Bioremediation
may also improve the environmental health of aquatic systems. Macrophytes can be
used to reduce nutrient concentrations (Abdel-Tawwab 2008; Samocha et al. 2015;
Ferdoushi et al. 2008), and a combination of probiotics and macrophytes may be
effective in reducing organic wastes. Microbial bioremediation may be applicable to
aquaculture where nutrient levels are excessive or where the environmental and
ecological health can be improved. Bioremediation is the use of microbial organisms
to improve water quality and remove pollutants in water. The process involves many
different organisms including bacteria and microalgae (Chávez-Crooker & Obreque-
Contreras 2010). Application of bacteria or probiotics can modify the bacterial
composition of water and sediments which can improve various water quality
parameters (Perumal et al. 2015). This can potentially replace previously established
bacteria, some of which may be pathogenic, and increase populations of bacteria that
oxidise toxic nutrients and heavy metals; improving environmental health of the water
and sediment. With the intensification of various aquaculture farms, research is
increasing with the demand for sustainable and environmentally friendly aquaculture
(Wang et al. 2005). Bioremediation may improve carrying capacity of aquaculture

Chapter 2: Literature Review
24
ponds; increasing the stocking rate of animals without impacting on growth or water
quality.
Fish farmers are concerned about soil and water quality, and can use biological and
chemical amendments to treat and improve this. Fertilization of ponds and excessive
feeding can lead to accumulation of nutrients such as nitrogen and phosphorous in the
sediment and water, which can cause eutrophication, algal blooms, poor ecosystem
and animal health and other problems associated with poor water quality. The use of
bacterial suspensions for bioremediation is thought to reduce blue green algae, restrict
algal blooms, decrease nitrate, nitrite, ammonia and phosphate, increase dissolved
oxygen levels and enhance the degradation of organic matter (Browdy & Hopkins
1995). Studies using bacterial suspensions can have varied results, however (Boyd &
Gross 1998). One study showed no significant differences in inorganic nitrogen, total
phosphorous, chemical oxygen demand, chlorophyll a, abundance of bacteria and
phytoplankton, and percentages of blue green algae between ponds with and without
bacterial-treatment (Boyd et al. 1984). Another found that treating northern white
shrimp (Penaeus vannamei) ponds with commercial probiotics increased the
population density of beneficial bacterial flora, which included Bacillus sp. and
photosynthetic bacteria (Wang et al. 2005). The treatment also stabilised pH levels,
and inorganic nitrogen and phosphate were significantly lower in treated ponds than
the control. Shrimp in bioremediated ponds also had higher survival rate, FCR and
final production yield (Wang et al. 2005). Increased Vibrio count in control ponds may
have decreased production, as numerous Vibrio species can cause infections in shrimp.
Microbes are often used to treat water high in heavy metals. Heavy metals can have
many toxic effects at high concentrations. Lead, for example, has been shown to reduce
the ability of crayfish (C. destructor) to survive a hypoxic environment (Ahern &
Morris 1999). While inorganic pollutants, including heavy metals, cannot be removed
by microbial activity, microbes can change the electrostatic charge of these pollutants,
affecting their mobility in the environment (Kirchman 2012). Microbes may improve
survival and health of crayfish by treating water high in heavy metals. Microbes can
breakdown organic compounds, even those toxic to eukaryotic organisms.
A large portion of research into bioremediation is focused on treatment of wastewater,
or aquaculture effluent (Chávez-Crooker & Obreque-Contreras 2010). There is less

Chapter 2: Literature Review
25
research on bioremediation within aquaculture systems; and results can vary greatly
with differed reports on both positive and negligible effects. The use of bioremediation
products is often not grounded on reliable research, instead coming from observations.
Some positive effects of bacterial applications in prawn aquaculture have been
reported, however the effectiveness of these probiotics has not been clearly established
(De Paiva-Maia et al. 2013).
There has been little research into the bioremediation of freshwater crayfish
aquaculture. One study used biofilm, attached to a substrate, to improve water quality
and survival of redclaw crayfish, and as a food source (Viau et al. 2012).
Microorganisms have an important role in the transference of organic matter through
trophic chains in aquatic ecosystems (Danovaro et al. 2003; Meyer-Reil 1994), and
play a fundamental role in converting organic detritus into living biomass (La Rosa et
al. 2001). Viau et al. (2012) found that the control also showed a greater increase in
ammonium and nitrite during the beginning of the experiment. Survival and growth of
redclaw with the biofilm treatment was also much better than without the biofilm. The
biofilm is an organic matrix containing micro-organisms including bacteria,
cyanobacteria, microalgae, protozoans, nematodes and rotifers. Bacteria,
cyanobacteria and microalgae may act as producers and bioremediators, while also
providing a food source for other microorganisms and for freshwater crayfish.
Substrates may be used to culture biofilm.
2.5.2 Bioremediation using Substrates
An alternative to probiotics in the bioremediation of aquaculture systems is the use of
substrates. Artificial substrates include bamboo or wood substrates, plastic netting,
polyethylene, Bioballs and other plastic substrates, mats such as the Aquamat™, and
oil or wax based substrates such as the Water Cleanser™, which is investigated in this
thesis. Substrates can harbour beneficial bacteria and periphyton, both of which
improve water quality (Schveitzer et al. 2013). Substrates may provide as sites for
attachment of biofilms. Biofilm cultured on substrates can influence water quality and
provide a complementary food source (Viau et al. 2012). Various studies have
investigated the effects of artificial substrates on water quality in shrimp aquaculture
(Bratvold & Browdy 2001; Khatoon et al. 2007; Schveitzer et al. 2013; Thompson et
al. 2002; Viau et al. 2013), while relatively few studies have applied substrates to

Chapter 2: Literature Review
26
Cherax crayfish culture (Jones et al. 2002; Viau et al. 2012). Results can be varied
however. Schveitzer et al. (2013) found that application of a polyethylene mesh
substrate did not have any significant improvements in water quality as ammonia,
nitrite, nitrate and orthophosphate. Water quality was thought to be mainly affected by
bacteria present in the water column. Alternatively, Thompson et al. (2002) reported
that biofilm attached to artificial substrates maintained a low level of ammonium and
phosphate in shrimp culture.
Substrates can be used to provide habitat for animals, thus reducing effects of high
stocking density, and can improve water quality, thereby improving carrying capacity
of aquatic systems. However, the Substrate is not designed as a refuge or habitat, and
is used primarily to improve water quality. Scarce research has focused on substrates
and freshwater crayfish, with most studies focusing on shrimp culture. In the past the
use of artificial substrates has mainly been used to improve growth of aquatic
organisms and in reducing the effects of stocking density (Schvietzer et al. 2013). In
one study, substrates provided shelter for crayfish (Cherax destructor) and improved
growth, but did not increase survival (Jones et al. 2002). Survival and growth of shrimp
(Litopenaeus vannamei) has been improved by using substrates; which increased the
surface area of the tank and reduced the relative stocking density (Schveitzer et al.
2013). Substrates may also reduce the effects of high stocking density indirectly by
improving water quality. While research has sought to understand effects of various
substrates in bioremediation of aquaculture, no noteworthy research has applied oil-
based substrates to aquaculture, including that of marron.
2.6 The Water Cleanser Substrate
The Water Cleanser™ (TWC) is an oil and wax based substrate used in the
bioremediation of aquatic systems, by providing a habitat and carbon source for
microbes. TWC may potentially increase the rate of decomposition of organic matter
using microbes. Therefore, TWC may enhance the cycling of nitrogen within the
system, or enhance removal of nitrogen as nitrogen gas, by bacterial processes, and
improve water quality. The effects of substrates on disease have not been widely
studied, however microbes have been applied to treat disease in aquaculture.
The crude oil within TWC may provide a carbon source for various microbes.
Hydrocarbons, including crude oils, have been found to be suitable substrates for

Chapter 2: Literature Review
27
microbial growth. More than 100 species of heterotrophic bacteria, including some
Pseudomonas sp. and some Bacillus sp., are known to utilize hydrocarbons as a carbon
source (Hu et al. 2017). For example, Bacillus subtilis can grow on hydrocarbon
substrate, and utilize waxy crude oil, model crude oil, and long chain paraffins present
therein, producing biosurfactants which increase the bioavailability to other
microorganisms (Sakthipriya et al. 2015). Various species of microorganisms,
including micromycetes, yeasts and bacteria, are capable of hydrocarbon oxidation to
utilize a wide spectrum of hydrocarbons, including aromatics, and can have a high
growth rate (Astashkina et al. 2015). On the surface of TWC abundant growth can be
visible, as microbial biofilm. Biofilm is a microbial consortium associated with a
matrix of extracellular polymeric substances bound to submerged surfaces, which can
affect water quality in aquaculture (Pandey et al. 2014). TWC acts as a habitat, and a
carbon and mineral source for a microbial community living within a biofilm. Crude
oil contains many impurities, including heteronuclear compounds, emulsified water
and minerals (Tissot & Welt 1984).
TWC provides certain trace elements and organic oils for the microbes to thrive, and
does not leach any hydrocarbons into the water (Marine Easy Clean 2015). In addition,
microbial communities can be found on TWC, with the bacteria as the base of the food
chain. The bacteria cultured include various Bacillus sp., Acinetobacter sp.,
Mycobactelium sp., Nocardia sp., Paecilomyces sp., Holomonas sp., Lactobacillus sp.,
Tenacibaculum sp., Lysinibacillus sp., Burkholderia sp., Pseudomonas sp.,
Aeromonas sp., Rheinheirmera sp. and Exiguobacterium sp. (Marine Easy Clean
2015). The cultured bacteria and other microbes are thought to consume organic
matter, organic oils and wastes in the water, which may in turn improve turbidity,
reduce the availability of nutrients to algae, and improve the health of aquatic systems
and animals therein (Marine Easy Clean 2015). Healthier water can improve
physiology of cultured species, as better water quality can improve health and in turn
quality of cultured species (Li et al. 2013a). The beneficial bacteria cultured on TWC
are thought to consume organic matter and nitrogenous wastes in the water, while some
may accumulate inorganic phosphates (Figure 2.2). The microbes convert ammonia
and ammonium to nitrite, and the nitrite in turn to nitrate, via nitrification.
Denitrification may also increase, removing nitrogen from the aquatic system. These
wastes can cause physiological problems in aquaculture species, including freshwater

Chapter 2: Literature Review
28
crayfish (Jensen 1996; Harris et al. 2001), carp (Sun et al. 2012) and prawn species
(Wang et al. 2004). Ammonia may be toxic at high levels, and often causes a sublethal
reduction of animal growth or suppression of immunocompetence, while nitrite is also
toxic and this toxicity is expressed through the competitive binding of nitrite to
haemoglobin, reducing the capacity of blood to carry oxygen (Hargreaves 1998). The
haemolymph of most crustaceans, including crayfish, does not contain haemoglobin
(Jensen 2003), meaning that nitrite is less toxic to these animals. Nitrite can induce a
decrease in extracellular chloride ions however (Jensen 1996). Low levels of dissolved
oxygen also occur in aquaculture systems, and can be lethal to aquatic organisms
(Chabot & Dutil 1999). The availability of dissolved oxygen can be limited in
aquaculture systems, especially when stagnant, where bacterial action can cause
hypoxia (Aji 2012). The bacteria associated with TWC are thought to consume low
amounts of oxygen, as some are anaerobic (Marine Easy Clean 2015). Another
macronutrient, phosphate, can cause algal blooms at high levels, and TWC is thought
to reduce the availability of phosphate. TWC may help in the maintenance of water
quality of aquaculture systems.
Figure 2.2: Conceptual diagram of The Water Cleanser in an aquatic environment;
showing theoretical pathways between Nitrogen, Phosphorous, organic matter and
TWC. PAOs = Phosphate Accumulating Organisms.
Limited research has been conducted using TWC for microbial bioremediation in
aquaculture. However, a previous study has shown that TWC can improve survival

Chapter 2: Literature Review
29
and carrying capacity of goldfish (Carassius auratus) in aquaria (Marine Easy Clean
2015). In a similar study on Cyprinus carpio culture, turbidity of ponds remained
stable following application of TWC (Iguodala & Cole 2015, unpublished data).
2.7 Potential for Bioremediation in Marron Aquaculture
Freshwater crayfish are ideal species for this research as they are known to feed on
plankton (Austin et al. 1997; Gamboa-Delgado 2014), and are sensitive to changes in
water quality, both of which may be affected by microbial bioremediation. Very little
research has investigated bioremediation in marron aquaculture. The use of
bioremediation in freshwater marron aquaculture may help to maintain low levels of
nitrogenous wastes and phosphates, improve environmental health and ergo improve
marron health and productivity.
Research into bioremediation in marron ponds may help improve health, and in turn
growth rate of marron, and could also help increase stocking density without impacting
on water quality. Research could focus on using bacterial additives (Wang et al. 2005),
substrates (Viau et al. 2012), macrophytes (Ardiansyah & Fotedar 2016b) or new
systems to increase production, improve water quality and reduce water use and other
costs. A better understanding of marron ecology within aquaculture systems is also
needed, as it is unknown exactly how it feeds and what it feeds on. TWC may also
provide a complementary food source as biofilm, though is primarily designed to
improve water quality.

Chapter 3:
Efficacy of different oil-based substrates as bioremediators
Chapter 3 presents the first laboratory experiment, focusing on water quality in an
indoor environment, without marron. This experiment was designed to trial two
different substrates, The Water Cleanser™ and The Water Cleanser™ Plus, and a
commercial probiotic, BioAid®, as bioremediators, under laboratory conditions.

Chapter 3: Efficacy of different oil-based substrates as bioremediators
31
3.1 Introduction
In aquatic systems, accumulation of wastes can have adverse impacts on the ecosystem
(Hargreaves 1998, Jørgensen 2008). Ammonia may be toxic at high levels, and often
causes a sublethal reduction of fish growth or suppression of immunocompetence,
while nitrite is also toxic and this toxicity is expressed through the competitive binding
of nitrite to haemoglobin, reducing the capacity of blood to carry oxygen (Hargreaves
1998, Sun et al. 2012). Nitrites can cause physiological problems for freshwater fish
(Sun et al. 2012), while high nitrate and phosphate levels can increase risk of harmful
algal blooms, filamentous algae growth and slight toxicity (Blaas & Kroeze 2016;
Hamlin et al. 2008).
Probiotic bacteria can modify the bacterial composition of water and sediments, which
can improve various water quality parameters (Perumal et al. 2015). Heterotrophic and
polyphosphate-accumulating bacteria are used to remove nitrogen and phosphorous,
respectively, in wastewater (Wang et al. 2015). The use of environmental probiotics
may also reduce the availability of heavy metals and other toxins (Kirchman 2012) in
aquatic systems and inhibit pathogenic bacteria (Hong et al. 2005); improving water
quality and ecology.
Heterotrophic bacteria require a carbon source in order to function; and to convert
nitrates to nitrogen gas via denitrification (Hamlin et al. 2008). Oil-based substrates
can provide hydrocarbons, which can be utilised as a carbon and energy source
(Astashkina et al. 2015; Hu et al. 2017), while also providing habitat for various
microbes. The Water Cleanser™ is made from crude oil and waxes, and is designed
primarily for bioremediation. Another form of the substrate used in this study, the
water cleanser plus (TWC+), is made from a mixture of crude oil, tea-tree oil and
waxes. Because of the antibacterial properties of tea-tree oil, TWC+ is thought to be
more selective in terms of the bacterial species that colonise the substrate than TWC
(Personal communication with Marine Easy Clean). TWC is a substrate for the growth
of microbial biofilm, which has been shown to be important in nitrification; where
ammonia oxidation rates can be nearly 60 times higher than in water particles (Holl et
al. 2011). Biofilm attached to substrates has previously been used to improve water
quality (Otoshi et al. 2006; Viau et al. 2012). This study was conducted under
laboratory conditions as a preliminary trial to investigate the efficacy of oil-based
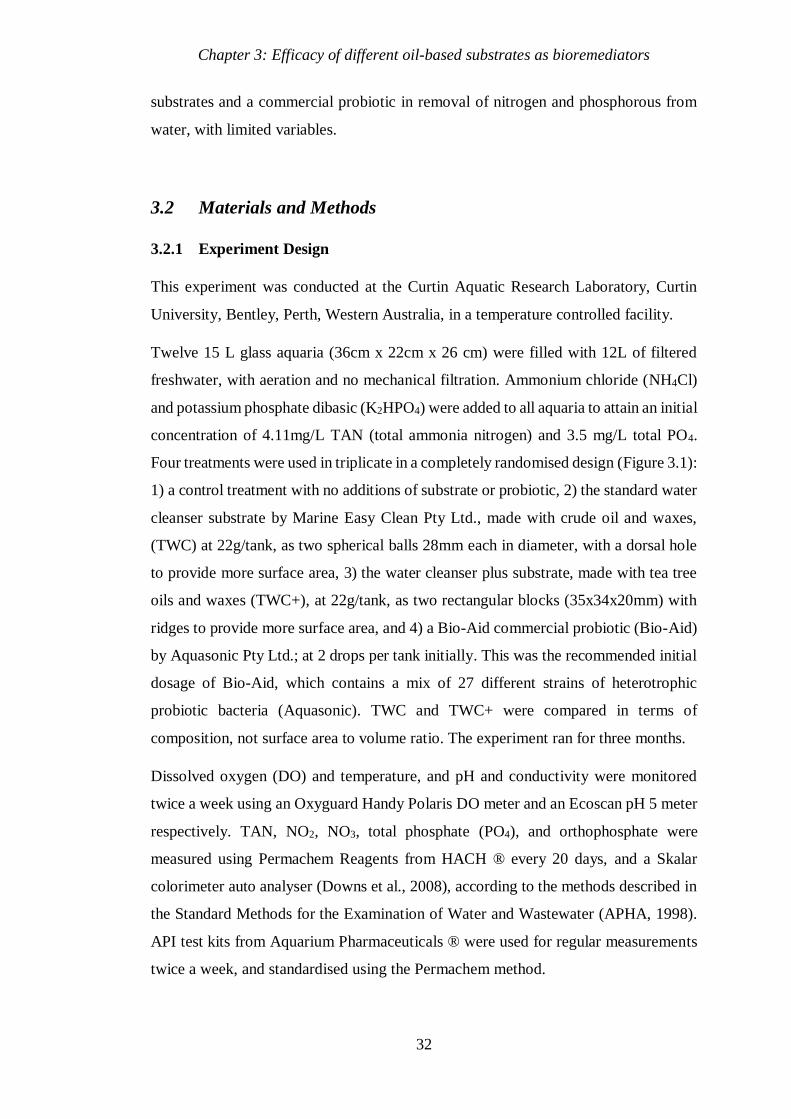
Chapter 3: Efficacy of different oil-based substrates as bioremediators
32
substrates and a commercial probiotic in removal of nitrogen and phosphorous from
water, with limited variables.
3.2 Materials and Methods
3.2.1 Experiment Design
This experiment was conducted at the Curtin Aquatic Research Laboratory, Curtin
University, Bentley, Perth, Western Australia, in a temperature controlled facility.
Twelve 15 L glass aquaria (36cm x 22cm x 26 cm) were filled with 12L of filtered
freshwater, with aeration and no mechanical filtration. Ammonium chloride (NH4Cl)
and potassium phosphate dibasic (K2HPO4) were added to all aquaria to attain an initial
concentration of 4.11mg/L TAN (total ammonia nitrogen) and 3.5 mg/L total PO4.
Four treatments were used in triplicate in a completely randomised design (Figure 3.1):
1) a control treatment with no additions of substrate or probiotic, 2) the standard water
cleanser substrate by Marine Easy Clean Pty Ltd., made with crude oil and waxes,
(TWC) at 22g/tank, as two spherical balls 28mm each in diameter, with a dorsal hole
to provide more surface area, 3) the water cleanser plus substrate, made with tea tree
oils and waxes (TWC+), at 22g/tank, as two rectangular blocks (35x34x20mm) with
ridges to provide more surface area, and 4) a Bio-Aid commercial probiotic (Bio-Aid)
by Aquasonic Pty Ltd.; at 2 drops per tank initially. This was the recommended initial
dosage of Bio-Aid, which contains a mix of 27 different strains of heterotrophic
probiotic bacteria (Aquasonic). TWC and TWC+ were compared in terms of
composition, not surface area to volume ratio. The experiment ran for three months.
Dissolved oxygen (DO) and temperature, and pH and conductivity were monitored
twice a week using an Oxyguard Handy Polaris DO meter and an Ecoscan pH 5 meter
respectively. TAN, NO2, NO3, total phosphate (PO4), and orthophosphate were
measured using Permachem Reagents from HACH ® every 20 days, and a Skalar
colorimeter auto analyser (Downs et al., 2008), according to the methods described in
the Standard Methods for the Examination of Water and Wastewater (APHA, 1998).
API test kits from Aquarium Pharmaceuticals ® were used for regular measurements
twice a week, and standardised using the Permachem method.

Chapter 3: Efficacy of different oil-based substrates as bioremediators
33
3.2.2 Bacterial Abundance
Prior to bacteria culturing, agar plates were made by the following procedure:
Approximately 3.5g of tryptone glucose yeast agar powder (Oxoid, U.K.) was stirred
in 200 mL of distilled water in a conical flask and brought to the boil. The flask of agar
was placed in an autoclave for 15 minutes for sterilization. The flask was then cooled
to approximately 40°C, and the agar poured into petri dishes, in a laminar flow cabinet.
The dishes were left for 30 minutes to allow agar to set, and to remove condensation,
before being wrapped in alfoil and placed in a refrigerator until plating. Before plating
the agar plates were brought back to room temperature.
Bacterial colonies were counted in colony-forming units (CFU) after 11 weeks with a
dilution of (10-1.3), to determine bacterial abundance. A 50 µL subsample was collected
from a sample of aquaria water, then transferred onto agar plates using aseptic
techniques. Samples were spread using a hoop, which was flamed between samples,
and then cultured on standard plate count agar (Tryptone glucose yeast agar) at 30°C
for 48 hours. Viable colonies were counted and identified according to colony
morphology and colour to estimate diversity.
Figure 3.1: Experimental Design of Experiment 1; with experimental units
represented as rectangles, T=Treatment, R=Replicate.

Chapter 3: Efficacy of different oil-based substrates as bioremediators
34
3.2.3 Statistical Analysis
All data were expressed as mean ± standard error. All statistical analyses were carried
out using SPSS version 23.0. Significant differences among treatments and time were
determined using a one-way ANOVA, for each factor. Least-significant difference
(LSD) pos-hoc tests were used for multiple mean comparisons when the p value
showed significance. Kruskal-Wallis tests were used when data did not have normal
distribution and homogeneity of variance. Differences were considered significant at
p<0.05 in all cases.
3.3 Results
3.3.1 Water Quality
The physico-chemical parameters, pH, temperature, DO and conductivity, were not
significantly different among tanks with TWC, TWC+, Bio-Aid or control.
Temperature ranged from 15.1°C to 23.1°C, with an overall mean of 18.45±0.11 °C.
TWC and TWC+ changed the dynamics of nutrient concentrations in the aquaria.
While in the control and Bio-Aid aquaria, TAN was oxidised more quickly than in
TWC and TWC+ aquaria, the concentrations of NO2-N and NO3-N rose to
significantly higher levels, which are toxic to some freshwater invertebrates (Soucek
& Dickinson 2012). TAN decreased steadily in all treatments, but was significantly
lower in the aquaria with Bio-Aid than with substrates after 7, 8, 9 and 11 weeks, and
lower in control aquaria after 9 and 11 weeks (Figure 3.2). TAN fell to <0.02 mg/L in
all aquaria by week 13.

Chapter 3: Efficacy of different oil-based substrates as bioremediators
35
Figure 3.2: Concentrations of TAN (mg/L) in four treatments over time (weeks). Like
letters (a, b) indicate that the means are statistically similar (α=0.05).
Over time, the concentrations of NO2-N and NO3-N were generally lower and more
stable in TWC and TWC+ aquaria than in the control and Bio-Aid aquaria, which
showed large fluctuations and peaks in both NO2-N and NO3-N (Figure 3.3). Total
nitrogen was significantly lower in TWC and TWC+ aquaria than without substrates
after 10 weeks.
a
ab
b
a
a
a
a a a
a
a
ab
b b abb b0
0.5
1
1.5
2
2.5
3
3.5
4
4.5
1 2 3 4 5 6 7 8 9 10 11 12 13
TA
N (
mg/L
)
Time (weeks)
Control TWC
TWC+ BioAid

Chapter 3: Efficacy of different oil-based substrates as bioremediators
36
a)
b)
Figure 3.3: Concentrations of Nitrite-Nitrogen (NO2-N) (a) and Nitrate-Nitrogen
(NO3-N) (b) over time. Like letters (a, b, c) indicate that the means are statistically
similar (α=0.05).
The concentration of orthophosphate was significantly lower with TWC+ than with
BioAid or control in week 4 (0.85±0.02, 1.01±0.03 mg/L, 0.96±0.04 respectively), and
lower than with BioAid in week 7 (0.96±0.01, 1.15±0.04 mg/L respectively).
c c c
b
ab
aa
b bc c b c bb
a
a a
a b bc b
a
b b bc
ab
a
a
a
a
b
b0.0
0.1
0.2
0.3
0.4
0.5
0.6
0.7
0.8
0.9
1.0
1 2 3 4 5 6 7 8 9 10 11 12 13
NO
2-N
(m
g/L
)
Time (weeks)
Control TWC
TWC+ BioAid
a
b
bb b
a
a
0.0
1.0
2.0
3.0
4.0
5.0
6.0
7.0
8.0
1 2 3 4 5 6 7 8 9 10 11 12 13
NO
3-N
(m
g/L
)
Time (weeks)
Control TWCTWC+ BioAid

Chapter 3: Efficacy of different oil-based substrates as bioremediators
37
Concentrations of PO4 and NO3-N were lower with TWC+ than with Bio-Aid or
control at the end of trial (Figure 3.4).
Figure 3.4: Concentrations of Nitrate-Nitrogen (NO3-N) and Total Phosphate after 13
weeks. Different letters (a, b) show significant differences in total phosphate and
numbers (1, 2) show significant differences in NO3-N between treatments (α<0.05).
3.3.2 Bacterial abundance
No significant differences were found among heterotrophic plate count (HPC) after
ten weeks. Mean HPC was 51.6±35.2, 55.7±11.1, 25.0±7.94 and 7.87±0.29 (CFU/mL
x 102) in control, TWC, TWC+ and Bio-Aid tanks respectively, after 11 weeks.
Biofilm grew at the bottom of aquaria in all tanks. A thick layer of biofilm developed
on TWC and TWC+ after 4 weeks, varied in colour and texture (Plate 3.1). Cocci and
rod-shaped bacteria were found within the biofilm, as determined by microscopy.
b ab a b2 1 1 20
0.5
1
1.5
2
2.5
Control TWC TWC+ Bio-Aid
Con
cen
trati
on
(m
g/L
)
Total Phosphate Nitrate-Nitrogen
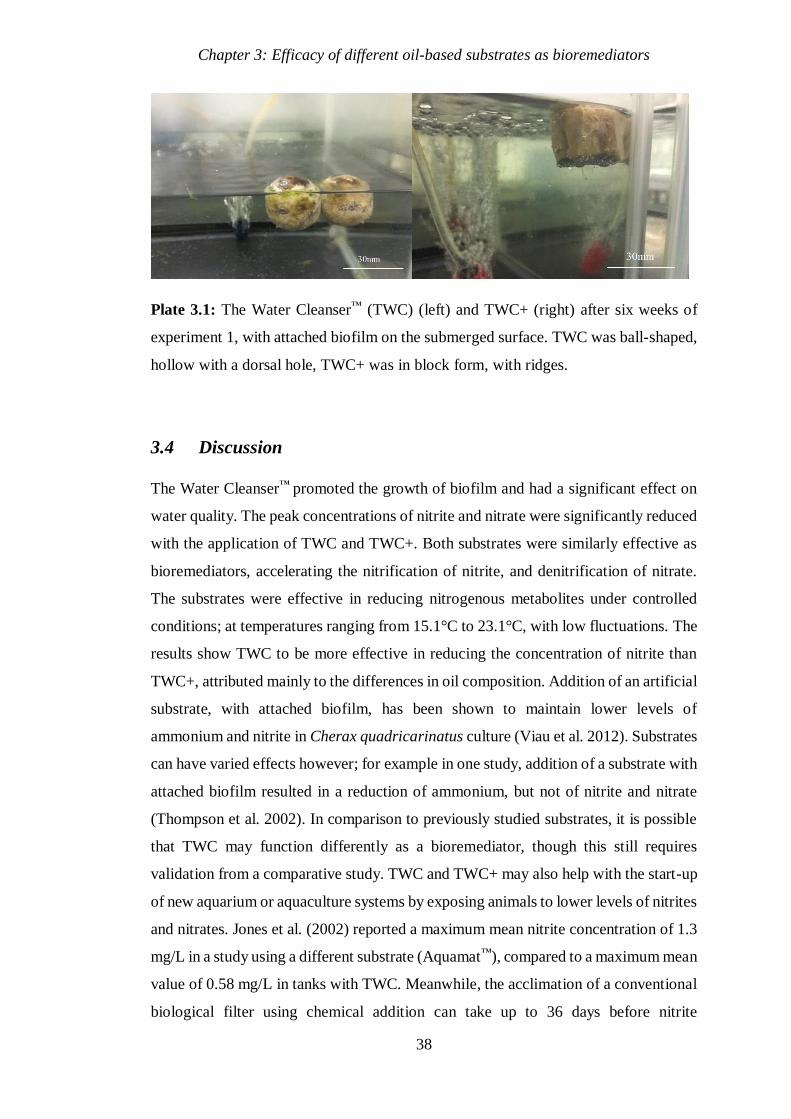
Chapter 3: Efficacy of different oil-based substrates as bioremediators
38
Plate 3.1: The Water Cleanser™ (TWC) (left) and TWC+ (right) after six weeks of
experiment 1, with attached biofilm on the submerged surface. TWC was ball-shaped,
hollow with a dorsal hole, TWC+ was in block form, with ridges.
3.4 Discussion
The Water Cleanser™ promoted the growth of biofilm and had a significant effect on
water quality. The peak concentrations of nitrite and nitrate were significantly reduced
with the application of TWC and TWC+. Both substrates were similarly effective as
bioremediators, accelerating the nitrification of nitrite, and denitrification of nitrate.
The substrates were effective in reducing nitrogenous metabolites under controlled
conditions; at temperatures ranging from 15.1°C to 23.1°C, with low fluctuations. The
results show TWC to be more effective in reducing the concentration of nitrite than
TWC+, attributed mainly to the differences in oil composition. Addition of an artificial
substrate, with attached biofilm, has been shown to maintain lower levels of
ammonium and nitrite in Cherax quadricarinatus culture (Viau et al. 2012). Substrates
can have varied effects however; for example in one study, addition of a substrate with
attached biofilm resulted in a reduction of ammonium, but not of nitrite and nitrate
(Thompson et al. 2002). In comparison to previously studied substrates, it is possible
that TWC may function differently as a bioremediator, though this still requires
validation from a comparative study. TWC and TWC+ may also help with the start-up
of new aquarium or aquaculture systems by exposing animals to lower levels of nitrites
and nitrates. Jones et al. (2002) reported a maximum mean nitrite concentration of 1.3
mg/L in a study using a different substrate (Aquamat™), compared to a maximum mean
value of 0.58 mg/L in tanks with TWC. Meanwhile, the acclimation of a conventional
biological filter using chemical addition can take up to 36 days before nitrite

Chapter 3: Efficacy of different oil-based substrates as bioremediators
39
concentrations are reduced to levels below 1 mg/L, exposing animals to acute toxicity
during this time (Manthe & Malone 1987). In finfish, nitrite leads to the oxidation of
functional haemoglobin to methaemoglobin, which cannot bind oxygen, while in
crayfish, nitrite competes with chlorine and bromine ions for the same uptake
mechanism within the haemolymph (Jensen 2003). Jensen (1996) has shown that
nitrite levels of 1 mM are toxic to noble crayfish (Astacus astacus). Therefore, in
crayfish aquaculture maintaining safe levels of nitrite is important, as with finfish
species. Promoting the growth of bacteria on oil-based substrates within aquaculture
systems may reduce nitrites, through denitrification, thus improving the health of
cultured animals.
While aquaria with TWC and TWC+ exhibited a greater reduction in nitrite, nitrate
and phosphate concentrations, there was a slower rate of ammonia oxidation. The Bio-
Aid probiotic effectively oxidised ammonia, but was only added initially, which may
explain why the nitrates and phosphates were not removed quickly. The addition of
probiotics has previously given mixed results. Some studies have reported only limited
effects of probiotics on water quality (Boyd & Gross 1998; Chiayvareesajja & Boyd
1993), while others have reported significant reductions in ammonia levels with
probiotic treatments (Nimrat et al. 2012). The difference that we observed between the
substrates and the probiotic can be partly explained by variation in the numbers of
nitrifying and heterotrophic bacteria, which are often associated with changes in filter
conditions (Itoi et al. 2006). In TWC and TWC+ aquaria, increased ammonia could
have been sourced from mineralization of organic matter by bacteria attached to the
substrates (Prabu & Santhiya 2016). Also present on the substrate surface were
protozoans, which can also work as mineralizers by excreting ammonium and
returning nitrogen incorporated by the bacteria to the water (Caron 1994). The degree
of grazing by ciliates and other protozoans on TWC surface was not studied, though
this predation pressure can affect the bacterial abundance on substrates (Thompson et
al. 2002). The composition of attached biofilm and periphyton, and effects on water
quality, may vary between substrates composed of different materials.
In this experiment, TWC and TWC+ were more effective in reducing the
concentrations of nitrites, nitrates and phosphates than the Bio-Aid or control, though
were not as effective in the oxidation of ammonia. Both substrates functioned
similarly, though TWC maintained lower concentrations of nitrite than TWC+. A

Chapter 3: Efficacy of different oil-based substrates as bioremediators
40
biofilm developed on both substrates after several weeks of trial, containing
heterotrophic bacteria, protozoans and minute nematodes. TWC provides habitat for
various heterotrophic bacteria already present in the water, and hydrocarbon which can
be utilised by certain bacteria. The water cleanser may function differently as a
bioremediator to probiotics or substrates made up of different materials. This trial
shows that TWC and TWC+ have an effect on nutrient concentrations in freshwater
environments.

Chapter 4:
Effects of an oil-based substrate (The Water Cleanser™) and
commercial probiotics on water quality, phytoplankton and microbial
ecology, and marron (Cherax cainii Austin 2002) in outdoor culture
Chapter 4 presents the second laboratory experiment, focusing on water quality,
phytoplankton and microbial ecology in outdoor marron tank culture. This experiment
was designed to trial TWC, TWC combined with Bacillus sp., and a commercial
probiotics as bioremediators in an aquaculture environment, and to investigate
potential benefits or disadvantages for natural productivity, and marron health and
productivity.

Chapter 4: Effects of TWC and Probiotics in Marron Culture
42
4.1 Introduction
In Australia, marron (Cherax cainii Austin) farms are run extensively and semi-
intensively, and often as a secondary source of income based upon low-input self-
sustaining populations (Mills & Mccloud 1983). If the industry is to expand,
intensification may be required, while still maintaining good water quality and quality
produce. Intensive stocking results in increases in nutrient loads from uneaten feed and
metabolic waste products (David et al. 2015); leading to eutrophic conditions and algal
blooms (Seymour 1980). Concomitantly, an increase in ammonium and nitrite may
damage the health of aquatic organisms (Deng et al. 2014). Poor water quality and
excessive organic matter can also cause epibionts such as Epistylis and Temnocephala
to thrive, which can be problematic for the health and market value of marron (Ambas
et al. 2013).
Microbial bioremediation is one solution to decrease the build-up of nutrients in
aquaculture water and wastewater. Additions of heterotrophic and polyphosphate-
accumulating bacteria have been used to remove nitrogen and phosphorous in aquatic
systems (Zokaeifar et al. 2014; Wang et al. 2005; Wang et al. 2015). Microorganisms
can influence the development and decline of algal blooms (Subashchandrabose et al.
2011), regulating algal populations in water bodies so as to avoid algal blooms (Zhou
et al. 2009), or alternatively benefiting phytoplankton by increasing nutrient
availability through mineralization of organic matter (Amin et al. 2012). Microbial
communities play a major role in recycling the autochthonous nutrients accumulating
within the system (Avnimelech et al. 1995). Increased abundance of phytoplankton
can increase phytoremediation (Lananan et al. 2014; Labbé et al. 2017), and may also
provide more food sources for freshwater crayfish, which consume phytoplankton
such as diatoms in biofilm (Viau et al. 2012), and zooplankton, which depend on
phytoplankton, and detritus, which may be formed by decaying plankton (Saoud et al.
2012).
Substrates can also be used for bioremediation, and provide suitable sites for the
growth of biofilm, which can provide a complementary food source (Viau et al. 2012).
Substrates also harbour beneficial bacteria and periphyton, both of which may improve
water quality (Schveitzer et al. 2013). Various studies have investigated the effects of
substrates on water quality in shrimp aquaculture (Khatoon et al. 2007; Schveitzer et

Chapter 4: Effects of TWC and Probiotics in Marron Culture
43
al. 2013; Thompson et al. 2002; Viau et al. 2013), while relatively few studies have
applied substrates to Cherax crayfish culture (Jones et al. 2002; Viau et al. 2012).
Artificial substrates are most commonly been made up of plastic, polyethylene mesh,
mats, netting and other similar materials. Bacteria densities can be increased by
maintaining organic particles as substrate in the water column (Hargreaves 2006).
Furthermore, artificial substrates may create a habitat for nitrifying bacteria (Otoshi et
al. 2006). Substrates may also enhance the degradation of organic matter, as this can
at times be limited by the substrate, rather than the microbial biomass (Avnimelech et
al. 1995).
Unlike conventional substrates, the Water Cleanser™ (TWC) is oil and wax based, and
is designed primarily for bioremediation. Past trials by (Marine Easy Clean 2015)
show that TWC provides habitat for bacteria present in the surrounding water, while
also providing a carbon source, high surface area, and trace elements within the oils.
A carbon source is essential for heterotrophic bacteria processes including
denitrification (Hamlin et al. 2008). The provision of a carbon source will promote the
growth of heterotrophic bacteria, influencing the bacterial population. TWC could
thereby encourage the growth of Bacillus sp. for example, which are known to affect
the water quality and microbial ecology of aquatic systems, and health of crustaceans
(Nimrat et al. 2012; Ambas et al. 2013; Hai et al. 2009). However, the effectiveness of
TWC in marron culture has not been investigated so far.
The first experiment showed that TWC is effective in bioremediation, however the
effects in an aquaculture environment are largely unknown. No peer reviewed research
has applied TWC to aquaculture. Semi-intensive marron aquaculture is dependent on
maintaining good water quality, and in promoting the pond ecology to provide natural
food sources, both of which may be affected by TWC. The current study evaluated the
effects of TWC, TWC with Bacillus sp. (TWC+B), and a commercial probiotic (Eviro-
3) on nutrient concentrations, bacterial and phytoplankton abundance and species
composition, and marron growth and health in outdoor culture. The temporal
fluctuations, and relationships between different parameters were also studied. This
experiment was designed as a preliminary trial to examine the effects of the TWC on
water quality, marron health, and phytoplankton productivity, and its applicability to
commercial marron ponds, as investigated further in Chapter 5.
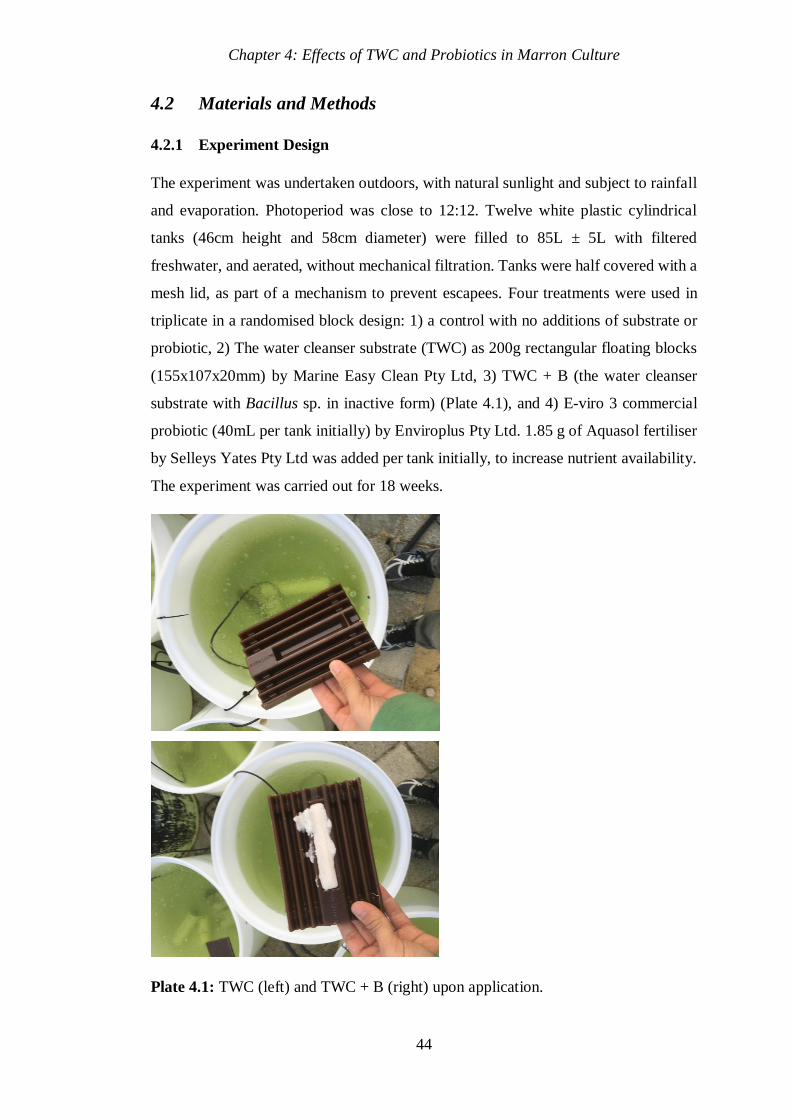
Chapter 4: Effects of TWC and Probiotics in Marron Culture
44
4.2 Materials and Methods
4.2.1 Experiment Design
The experiment was undertaken outdoors, with natural sunlight and subject to rainfall
and evaporation. Photoperiod was close to 12:12. Twelve white plastic cylindrical
tanks (46cm height and 58cm diameter) were filled to 85L ± 5L with filtered
freshwater, and aerated, without mechanical filtration. Tanks were half covered with a
mesh lid, as part of a mechanism to prevent escapees. Four treatments were used in
triplicate in a randomised block design: 1) a control with no additions of substrate or
probiotic, 2) The water cleanser substrate (TWC) as 200g rectangular floating blocks
(155x107x20mm) by Marine Easy Clean Pty Ltd, 3) TWC + B (the water cleanser
substrate with Bacillus sp. in inactive form) (Plate 4.1), and 4) E-viro 3 commercial
probiotic (40mL per tank initially) by Enviroplus Pty Ltd. 1.85 g of Aquasol fertiliser
by Selleys Yates Pty Ltd was added per tank initially, to increase nutrient availability.
The experiment was carried out for 18 weeks.
Plate 4.1: TWC (left) and TWC + B (right) upon application.

Chapter 4: Effects of TWC and Probiotics in Marron Culture
45
4.2.2 Water Quality
The physico-chemical parameters; DO, temperature, pH, and conductivity were
measured twice a week, diurnally. TAN, NO2-N and NO2-N concentrations were
measured every 20 days, and orthophosphate every 30 days, with Permachem tests and
colorimeter by HACH ®, and a Skalar colorimeter auto analyser (Downs et al. 2008),
and were determined based on the standard methods of testing Water and Wastewater
(APHA, 1998). Concentrations of ammonia, nitrite, nitrate and total phosphate (PO4)
concentrations were also monitored twice a week during the first month with API test
kits, in case of elevated levels. Samples were kept refrigerated and processed within 7
days to prevent excessive changes in concentrations.
4.2.3 Animals and Growth Parameters
Marron were procured from Blue Ridge Marron, Manjimup, and acclimatised in stock
tanks for 7 days before trial, with aeration and regular water exchange. Thirty six
(51.33±1.29 g; 56.5±0.5 mm OCL), were stocked at a density of 3 marron per tank.
Sufficient shelter was provided in the form of PVC pipes. Feed was provided at a rate
of 0.5% of wet body weight, 3 times per week. Tanks were checked daily for
mortalities or escapees, and animal condition. Marron were weighed individually
every month, and measured for OCL, from the start of the carapace to the end of the
rostrum, using a calliper. Growth was determined as mean monthly weight gain (mean
weight from end of month – mean weight at start of month), and total individual weight
gain from start to 3 months (mean weight at end – mean weight at start). Mortalities
and escapees were discounted from growth data.
4.2.4 Phytoplankton
Phytoplankton species were procured from commercial marron ponds in Manjimup,
WA and cultured outdoors in an aerated stock tank. Initially, approximately 10 L of
microalgae stock water was added to each experimental tank in order to cultivate a
population of phytoplankton. Phytoplankton abundance and species composition was
measured every two weeks. Water samples were taken directly from the water surface
into 100 mL plastic containers. Lugol’s Iodine was added at 3% concentration for
staining and preservation, and samples were counted within 3 hours. Phytoplankton
were counted using a haemocytometer with a heavy cover slip, and viewed using a
Motic compound microscope at 400x magnification. Phytoplankton abundance was

Chapter 4: Effects of TWC and Probiotics in Marron Culture
46
calculated by using equations adapted from Ingram et al. (1997) and Nugroho &
Fotedar (2013):
Phytoplankton abundance (cells/L) = ((No. x 1000 / (volume of grid (0.1mm3) x No.
of squares in grid counted)*(Conc. Vol. / 1 mL)) / Tot. Vol.
where Tot. Vol. = Total volume of water (L) collected from the pond, Conc. Vol. =
Volume of water (mL) containing concentrated plankton after sieving, Sub. Vol. =
Sub-sample of water (mL) from concentrated volume in which plankton is counted,
and No. = Mean number of cells or individuals counted.
Identification was carried out to genus level, with reference to Ingram et al. (1997),
and the number of genera per sample counted. The species diversity was further
calculated using the Shannon diversity index with the following formula: H = - [ΣPi x
Ln(Pi)], where H = Diversity index, Pi = the number each species in the sample/total
number of samples, and Ln(Pi) = the natural logarithm of this proportion.
4.2.5 Haemolymph Indices
As a measure of stress and changes in immune response, haemolymph samples were
taken from marron after 20 days (following a period when nutrient concentrations were
high), and after 55 and 80 days (periods when nutrient concentrations were low).
Syringes were filled with 0.3 mL trisodium citrate anticoagulant and 0.3 mL of
haemolymph. 27 G needles were used with 1 mL syringes. Total haemocyte count
(THC) was taken within 8 hours of sampling, using a haemocytometer and a Motic
compound microscope at 400x magnification. Samples were stained with Giemsa and
May-Grunwald for differential haemocyte count (DHC), then granular, semi-granular
and hyaline cells were counted, and DHC determined following established protocol
(Sang et al. 2009).
4.2.6 Bacteria
Bacterial abundance was determined in the water column after 43 days, giving bacteria
a six week period to become established, with follow up sampling four weeks later,
after 70 days. Water samples were diluted by 10-3; by diluting 1 mL of samples in 100
mL of sterile 0.85% saline solution, and 100 µL of diluted sample then being
transferred onto agar plates using aseptic techniques. Samples were spread using a
hoop, which was flamed between samples. Samples were cultured on standard plate

Chapter 4: Effects of TWC and Probiotics in Marron Culture
47
count agar (Tryptone glucose yeast agar) at 30°C for 48 hours. Viable colonies were
counted and identified according to colony morphology and colour to estimate
diversity. Bacillus species were identified to genus level by colony morphology and
were counted. Heterotrophic Plate Count (HPC), Bacillus sp. count and estimated
diversity was determined on TWC surface, by taking a swab of 1cm3 from the
submerged surface and conducting a standard plate count as per the water sampling
method.
4.2.7 Statistical Analysis
All data obtained were expressed as mean ± standard error. All statistical analysis was
done using SPSS version 23.0. Mean differences between treatment and time (weeks)
were compared using a multivariate two way analysis of variance (ANOVA). Where
significant main effects were detected a least significant difference (LSD) post-hoc
test was conducted. A Kruskal-Wallis test was used where data lacked normality
and/or homogeneity of variance. Spearman’s rank test was carried out to determine
relationships between measured parameters, such as TAN and THC. Differences were
considered significant at α=0.05 in all cases.
4.3 Results
4.3.1 Water quality
The physico-chemical parameters pH, temperature, DO and conductivity were not
significantly affected by treatment. Diurnal temperature ranged from 10.3°C to
19.2°C, with an overall mean of 14.8±0.1°C. Temperature remained low throughout
the experiment, relative to the optimal temperature for marron growth (Morrissy
1990); (Figure 4.1). The pH ranged from 7.78-11.8 with an overall mean of 7.91±0.02.
Higher phytoplankton abundance was correlated with higher pH levels (R=0.629,
p=0.028). Dissolved oxygen remained high in all tanks, partly due to the high
abundance of phytoplankton, with an overall mean of 10.98±0.11. A thin layer of
biofilm was visible growing on the surface of TWC after 79 days.

Chapter 4: Effects of TWC and Probiotics in Marron Culture
48
Figure 4.1: Mean temperature of all tanks over 18 weeks.
After five days nutrient concentrations had decreased significantly in TWC+B tanks.
Nitrate and total phosphate were significantly lower in TWC+B treatment than all
other treatments (Table 4.1). The concentration of orthophosphate was also
significantly lower in TWC+B tanks in week 1. There were no other significant
differences in terms of phosphates. Mean TAN and NO2-N means remained less than
1.20 and 0.026 mg/L respectively in all treatments during the experiment, and were
never significantly different between treatments. TAN levels peaked in week 3 in all
treatments, possibly due to a build-up of uneaten feed and marron waste. Following
week 3, TAN levels remained less than 0.10 mg/L in all treatments. NO3-N fell to less
than 0.50 mg/L after week 3, and then rose to more than 0.49 mg/L in week 13 in all
treatments. NO3-N was not significantly different between treatments, except in the E-
viro 3 tanks after 10 weeks, where NO3-N rose to 0.50±0.29 mg/L compared to
0.10±0.06, 0.13±0.03 and 0.30±0.06 mg/L in the control, TWC+B and TWC tanks,
respectively. NO3-N was negatively correlated with phytoplankton abundance (R=-
0.740, p<0.001), as was TAN (R=-0.675, p<0.001).
Table 4.1: Water quality after 5 days, when concentrations of NO3-N and PO4 had
both significantly decreased in TWC+B tanks.
Superscript a,b indicate significant differences between treatment (α<0.05).
Control TWC TWC+B E-viro3
TAN <0.02±0.00 <0.02±0.00 <0.02±0.00 0.02±0.02
NO2-N <0.01±0.00 <0.01±0.00 <0.01±0.00 <0.01±0.00
NO3-N 0.26±0.07a 0.30±0.04a <0.10±0.00b 0.30±0.04a
PO4 1.17±0.17a 1.17±0.17a 0.33±0.08b 1.33±0.17a

Chapter 4: Effects of TWC and Probiotics in Marron Culture
49
4.3.2 Bacteria
The heterotrophic plate count (HPC) was not significantly different between
treatments at any time (Table 4.2). Variance was high within treatments, as inferred
from the high standard errors. Mean bacterial abundance was comparably higher in
experiment 2 than experiment 1, likely due to the increase in nutrient inputs from feed.
During experiment 2, where Bacillus sp. was added in experiment 2 (TWC+B),
Bacillus sp. were present in water in TWC + B in all 3 tanks after 7 weeks and 2 tanks
after 10 weeks. Bacillus sp. were also present in one of the E-viro 3 tanks after 7 weeks.
On TWC surface Bacillus sp. was found in TWC+B tanks but not in TWC tanks. HPC
on the substrate surface was not significantly different between TWC and TWC+B, at
859±133 and 392±189 CFU/cm3 respectively.
Table 4.2: Mean Heterotrophic Plate Count (HPC) in marron culture water.
HPC (x104)
(CFU/mL)
Control TWC TWC + B E-viro 3
Week 7 10.7 ± 5.25 14.1 ± 3.97 9.40 ± 0.600 9.07 ± 2.74
Week 10 5.63 ± 3.19 6.80 ± 3.61 34.1 ± 29.3 6.17 ± 1.88
4.3.3 Marron
Marron survival could not be measured accurately due to escapees. One mortality was
found each in the control and TWC+B tanks, and 2 in TWC tanks. Cannibalism was
the most frequent cause of mortality, often occurring after moulting. The average
number of marron per tank was reduced from 3.0 to 2.0 after 3 months, and then to
1.75 after 4 months, primarily due to escapees. Neither substrate nor E-viro 3
significantly influenced the marron mortality rate, or monthly weight gain. However,
in the E-viro 3 tanks average weight gain was higher in the second month, than in the
first or third months; at 0.773 g±0.152, -0.310±0.213 and 0.107±0.272 respectively.
Mean individual weight gain from start to 3 months was 1.37±0.67 g, 1.96±1.14 g,
1.51±0.45 g, and 0.90±0.42 g for control, TWC, TWC+B and E-viro 3 respectively.
The THC and DHC were not significantly different between treatments at any time.
Within the control tanks, THC was significantly higher (p<0.05) after 12 weeks, at
4.96±0.97 x 10⁶ haemocytes/mL, than after 3 weeks and 8 weeks, at 1.13±0.17 x 10⁶
and 1.69±0.43 x 10⁶ haemocytes/mL respectively. Negative correlation was present

Chapter 4: Effects of TWC and Probiotics in Marron Culture
50
between THC and TAN (p=0.017, R=-0.670). After 12 weeks, the proportion of
granulocytes was not significantly different between treatments, varying from
12.0±0.7% with TWC to 14.3±3.6% with TWC+B.
4.3.4 Phytoplankton
The phytoplankton abundance was highest in TWC+B treatment in week 5 and week
7 (Figure 4.2), with weekly fluctuations (Table 4.3). Phytoplankton abundance grew
exponentially and peaked after three weeks, and then fell again after five weeks. The
mean number of genera found and the Shannon-Wiener Diversity Index (H) were not
significantly different between treatments. The number of genera increased from the
start to end of experiment; from 2-4 to 5-7 overall. Within TWC tanks, the Shannon-
Wiener Diversity Index fluctuated over time (Table 4.4). The stock water was
dominated by Scenedesmus sp., Chlorella sp., and Chlamydosomonas sp. (Plate 4.2).
Species found throughout the experiment included Scenedesmus sp., Chlorella sp.,
Chlamydomonas sp., Euglena sp., Monoraphidium sp., and Tetraedron sp.
Plate 4.2: Chlamydomonas sp. and Scenedesmus sp. found in phytoplankton stock
water, at 400x magnification.

Chapter 4: Effects of TWC and Probiotics in Marron Culture
51
Table 4.3: Mean phytoplankton abundance between four treatments over 18 weeks.
Phytoplankton
abundance
(cells / mL x 104)
Control TWC TWC + B E-viro 3
Week 1 w1.8±0.2 x2.8±1.1 x2.9±0.59 x2.3±0.6
Week 3 x103.7±3.7 z89.7±20.1 z87.2±11.6 z97.8±5.5
Week 5 y20.3±2.6a xy19.0±5.4a xy35.3±1.2b x9.7±2.7a
Week 7 y2.4±6.6a xy2.3±4.6a yz57.8±6.9b x16.4±4.1a
Week 9 y29.0±3.7 xy28.6±6.2 yz67.5±23.0 y55.5±12.2
Week 11 z53.8±12.6 yz57.8±8.7 yz64.5±17.4 yz69.3±24.0
Week 18 y31.2±2.51 z69.4±25.8 z99.9±28.4 yz78.7±1.0 Superscript a,b indicate significant differences between treatment, while x,y,z indicate significant
differences over time.
Figure 4.2: Changes in phytoplankton density (cells/mL) in different treatments over
11 weeks. Like letters (a, b) indicate that means are statistically similar (α<0.05).
bb
a
a
b
b
0.0
20.0
40.0
60.0
80.0
100.0
120.0
1 3 5 7 9 11
Ph
yto
pla
nk
ton
Ab
un
dan
ce (
cell
s/m
L x
10
4)
Time (weeks)
Control TWC
TWC + B E-viro 3

Chapter 4: Effects of TWC and Probiotics in Marron Culture
52
Table 4.4: Shannon Index (H) between four treatments over 18 weeks.
Shannon
Index (H)
Control TWC TWC+B E-viro 3
Week 1 0.91±0.13 yz1.12±0.05 1.03±0.18 0.98±0.19
Week 3 1.01±0.09 xy0.98±0.03 0.94±0.01 0.90±0.01
Week 5 0.92±0.12 z1.21±0.04 1.29±0.08 0.95±0.25
Week 7 1.14±0.04 yz1.12±0.04 1.23±0.09 0.91±0.14
Week 9 1.10±0.08 xyz1.05±0.07 1.07±0.16 1.16±0.05
Week 11 1.04±0.06 xy0.93±0.08 1.12±0.03 1.18±0.10
Week 18 1.22±0.16 x0.90±0.10 1.18±0.05 0.77±0.19
Superscript x,y,z indicate significant differences between time (weeks).
4.4 Discussion
Past studies have found mixed results based on the effects of artificial substrates on
water quality. Substrates made from mineral media have been used to culture microbial
mats, which can then be used to remediate nutrient-enriched aquaculture effluent
(Bender & Phillips, 2004), or used directly as filter media in aquaculture systems
(Bender et al. 2004). Culturing biofilm on TWC prior to application could similarly
improve the rate of bioremediation, as biofilm can take several weeks to develop on
TWC surface. In contrast, a polyethylene mesh substrate was not effective in reducing
concentrations of ammonia, nitrite, nitrate and orthophosphate in one study
(Schveitzer et al. 2013). Similar results were found in the current experiment under
outdoor culture conditions. The indoor experiment showed that oil-based substrates
have a significant impact on water quality when nutrient concentrations are high and
in the absence of high concentrations of microalgae, however. This was also under a
controlled environment, with higher, more stable temperatures than in the outdoor
experiment. The average temperature during the outdoor experiment, of 14.8°C, was
lower than the optimum temperature of many nitrifying bacteria and Bacillus strains,
at 25-35°C (Song et al. 2011; Hargreaves 1998), which may have limited the efficacy
of TWC. Schveitzer et al. (2013) attributed the limited effects to a low amount of
biological growth on the substrate surface. Biofilm was present on TWC in experiment
2, however the nutrient concentrations were likely to have been reduced mainly by
phytoremediation from microalgae, as similar effects were observed with TWC and

Chapter 4: Effects of TWC and Probiotics in Marron Culture
53
without substrate. While microalgae such as diatoms and cyanobacteria can be grown
on substrates to reduce nutrient concentrations in culture systems (Khatoon et al.,
2007; Thompson et al., 2002), our observations suggest that TWC encourages the
growth of a diverse consortium of heterotrophic rather than autotrophic microbes for
bioremediation.
The oil-based substrates developed a thick layer of biofilm during both experiments,
containing heterotrophic bacteria useful for water quality improvement. Biofilm
growing on plastic substrates generally does not develop the same thick layer of
biofilm (Personal observations), and is often dominated by cyanobacteria or
microalgae rather than bacteria. A similar study suggested that TWC surface develops
higher bacteria counts than the surface of plastic filter media. The study found
heterotrophic bacteria counts to be 5 to 8 times higher on TWC than on standard filter
media, with higher numbers of Bacillus sp. also present (Cole, A. unpublished data).
The function in bioremediation between these different types of substrates may vary
greatly, through this requires more extensive research for verification.
Substrates are rarely used in combination with probiotics to promote microbial growth.
The combination of TWC and Bacillus sp. significantly reduced concentrations of
nutrients in the first week of experiment 2 (Table 4.1). This is mainly attributed to the
probiotic, as biofilm on TWC takes several weeks to become established. The
commercial probiotic, E-viro 3, did not reduce the concentrations of nitrogen and
phosphate, although previous studies have been found to decrease inorganic nitrogen
and phosphate concentration in aquaculture water (Wang et al., 2005). TWC may help
to maintain the effectiveness of probiotics for a longer time by providing habitat and a
carbon source for the bacteria to thrive. In experiment 2, TWC+B maintained a
population of Bacillus sp. on TWC surface.
The surface of TWC becomes abundant in heterotrophic bacteria after several weeks
in the aquatic environment. TWC provides a habitat, and contains hydrocarbons;
which is likely to provide an accessible carbon source for Bacillus sp. (Hu et al. 2017).
Bacillus sp., is commonly used to improve water quality and in nitrate and phosphate
removal (Hong et al., 2005, Boyd & Gross, 1998, Hu et al., 2017). The first experiment
did not determine whether Bacillus sp. was present, though in experiment 2, Bacillus
sp. was found on TWC surface where the bacteria was added initially. This suggests

Chapter 4: Effects of TWC and Probiotics in Marron Culture
54
that addition of probiotics into a system containing TWC can result in a continued
population living on TWC surface. Observations showed that TWC surface also
contained microalgae, but was dominated by heterotrophic bacteria.
There was a high abundance of phytoplankton and epiphytic microalgae present in the
outdoor tanks, influencing the tank environment. Nitrate and phosphate levels remain
low when microalgae biomass is high (Lananan et al. 2014). Nutrient levels are also a
limiting factor on microalgae abundance (Zhihong et al. 2010). Nitrate and ammonia
both had an inverse relationship with phytoplankton abundance, which can partly be
explained by the uptake of nutrients as phytoplankton biomass increased, and the
steady release of nutrients from dead algae cells (Seymour 1980). Meanwhile, TWC+B
had a positive impact on phytoplankton abundance, which may be attributed to the
addition of heterotrophic bacteria; which are important for nutrient mineralization in
many plankton ecosystems (Caron, 1994). Addition of Bacillus sp. and Lactobacillus
sp. has likewise been found to increase Chlorophyta abundance in shrimp recirculating
systems (Litopenaeus vannamei) (De Paiva-Maia, Alves-Modesto, Otavio-Brito,
Oliveira, & Vasconcelos-Gesteira, 2013). Microbial communities play a major role in
recycling the autochthonous nutrients accumulating within the system (Avnimelech et
al., 1995). In the current study microalgae including Scenedesmus sp. and Chlorella
sp. were abundant, and it has previously been demonstrated that both are useful in the
reduction of nutrients (Lananan et al., 2014, Uma Devi, Swapna, & Suneetha, 2014).
Lananan et al. (2014) found that a combination of Chlorella and a microorganism was
more effective in decreasing orthophosphate than either organism alone. A
combination of microalgae and the Bacillus sp. added to TWC+B tanks reduced
concentrations of orthophosphate effectively for the first two weeks, however this
changed in the middle to end of the experiment where it was not different to the other
treatments.
Phytoplankton grew exponentially at the start of experiment; as nutrients were
available, and then the phytoplankton population crashed to a much lower biomass
following the depletion of nutrients, reflecting patterns of an algal bloom. However,
in the TWC+B tanks the phytoplankton density did not collapse to such low levels. If
applied to natural systems this may help to prevent the depletion of oxygen associated
with the collapse of algal blooms. The collapse of dense algal blooms often causes
mortality due to depletion of oxygen by algal decomposition (Seymour, 1980). The

Chapter 4: Effects of TWC and Probiotics in Marron Culture
55
use of aerators prevented any depletion of oxygen in the present study. Here, as in
natural systems, the ‘bloom’ of excess algae resulted in accumulation of dead algae
(Pace & Lovett, 2013). Following the drop in phytoplankton abundance, the nutrients
released from marron waste, excess feed and organic matter decomposition allowed
the algae population to recover.
The slow growth of marron was mainly attributed to the low temperatures, as
temperatures below 11-13°C can be limiting to growth (Morrissy, 1990). Meanwhile,
there was no significant effect of any treatment on growth, and any biofilm growing
on the floating TWC was physically inaccessible to marron, providing no
complementary food source. Substrates can increase growth rates in shrimp and
crayfish, by promoting the growth of periphyton for use as a complementary food
source, or by providing habitat (Jones et al., 2002; Schveitzer et al., 2013). For
example, Schveitzer et al. (2013) found an increase in growth and survival of L.
vannamei attributed to a substrate providing increased surface area for habitat and food
sources as periphyton. Meanwhile, Viau et al. (2012) have attributed improved growth
and survival of C. quadricarinatus to maintenance of good water quality using biofilm.
Marron in this study were generally in good health. Meanwhile, there was a
relationship found between the concentration of ammonia and THC. Exposure to
ammonia, at a concentration of 1.37mg/L, can reduce the THCs of marron (Sang et al.,
2009). During these times neither TWC, TWC+B nor E-viro 3 improved the THCs
compared to the control. TWC+B might be expected to improve THC and DHC as
addition of Bacillus sp. has improved DHC in shrimp (Penaeus brasiliensis) (De Souza
et al., 2012), however in our study no improvement was found. Similarly, one would
expect E-viro 3 to improve health and survival of animals, as previous studies have
demonstrated increased survival in L. vannamei ponds treated with commercial
probiotics (Wang et al. 2005), though no difference was found between treatments in
terms of physiology or mortality rate.

Chapter 4: Effects of TWC and Probiotics in Marron Culture
56
4.5 Conclusions
TWC provided a habitat for heterotrophic bacteria, including Bacillus sp., in this study,
and when combined with probiotics significantly reduced nutrient concentrations. The
first experiment previously demonstrated that addition of TWC can maintain lower
concentrations of nitrite and nitrate than without TWC. When applied to an outdoor
culture system however, no significant effects on total phosphate, nitrite or nitrate were
present. TWC had no significant negative effects to phytoplankton abundance or
diversity, and had no significant effects on marron haemolymph, as THC and DHC.
Meanwhile, TWC+B maintained a population of Bacillus sp. in the water column and
the substrate surface. TWC+B also maintained a higher abundance of phytoplankton
than any other treatment. The results show that TWC can be effective in
bioremediation, and had no negative effects on phytoplankton or marron. This
substrate is suitable for trialling in marron pond culture, and may be suitable in
reducing the effects of high stocking density by improving water quality.

Chapter 5:
Effects of pond age and a commercial substrate (The Water
Cleanser™) on natural productivity, bacterial abundance, nutrient
concentrations, and growth and survival of marron (Cherax cainii
Austin 2002) in semi-intensive pond culture
Paper published in Aquaculture 502 (2019): 242-249
(With some alterations, including Figures presented.)
Chapter 5 investigates the effects of The Water Cleanser™ (TWC) and pond age in
marron pond culture. Experiments 1 and 2 showed the potential of the standard TWC
in bioremediation, and demonstrated that the substrate had no detrimental effects on
marron or microalgae. Therefore, TWC was selected as a suitable treatment for a field
study. This field experiment investigates the effects of pond age and TWC on water
quality, bacterial abundance, bacterial colony diversity, natural productivity and
marron production on a commercial marron farm.

Chapter 5: Effects of pond age and substrate on a commercial marron farm.
58
5.1 Abstract
The effects of a commercial substrate (The Water Cleanser™) (TWC), and pond age,
on bacterial abundance, nutrient concentrations, natural productivity and marron
production, were investigated on a commercial marron (Cherax cainii) farm. The farm
had 21 ponds, categorised as: 10 new ponds (2 juvenile, 4 grow-out, and 4 brooder; 5
with TWC, 5 without) and 11 old ponds (5 juvenile, 4 grow-out, and 2 brooder; 5 with
TWC, 6 without). At the end of 7 months, TWC had no significant effects on the
concentration of total ammonia nitrogen (TAN), nitrite nitrogen (NO2-N) and nitrate
nitrogen (NO3-N), but reduced the concentration of orthophosphate. The initial
concentrations of NO2-N, NO3-N after 18 weeks, and orthophosphate after 12 weeks,
were significantly higher in old ponds. The phytoplankton abundance, after 6 weeks
and 18 weeks, and bacterial abundance after 6 weeks were significantly higher in old
ponds. Water quality and natural productivity in old and new ponds showed temporal
fluctuations. There were no significant effects of TWC on phytoplankton or
zooplankton abundance and diversity. In old ponds, there was a significant increase in
juvenile marron final biomass of 26.3% with TWC, attributed to higher survival rate.
The results suggest that TWC can be used to improve juvenile marron production.
5.2 Introduction
Marron (Cherax cainii Austin 2002) are an omnivorous, polytrophic,
parastacid crayfish and a target of fisheries and aquaculture in Australia (Molony &
Bird 2005; O’Brien 1995; Rouse & Kartamulia 1992). Water quality is of key
importance in all forms of aquaculture, including marron farming. Excessive dissolved
concentrations of ammonia, nitrite and nitrates can have physiological impacts on
crayfish (Jensen 1996). Nutrient-rich waters also stimulate growth of filamentous
algae, which are an unlikely food source for crayfish and can greatly hinder crayfish
mobility (Ulikowski et al. 2015). However, marron nutrition is partly dependent on
phytoplankton growth, which is limited by nitrogen and phosphorous (Wallen 1979).
Zooplankton are also an important food source for crayfish, especially for juveniles
(Jones 1995). Seasonality can greatly affect the abundance and species composition of
phytoplankton and zooplankton communities, partly due to fluctuations in solar
radiation and temperature (Canovas et al. 1996; Armitage et al. 1973). The current trial

Chapter 5: Effects of pond age and substrate on a commercial marron farm.
59
was conducted from October to April; comprising of warmer and variable
temperatures in October and November (spring), high temperatures with low rainfall
and a long photoperiod in January (summer), and cooler and variable temperatures in
March and April (autumn), showing seasonal changes in the water quality and
development of natural productivity.
The age of ponds affects water quality, including nutrient concentrations, and
plankton communities; impacting on food availability, and growth of cultured animals
(Correia et al. 2002; Zimba et al. 2003). Newer ponds may take time to become
‘established’ and develop microbial and invertebrate populations of high nutritional
value (Allan et al. 1995). The age of ponds may also affect plankton composition, for
example Zimba et al. (2003) found that older channel catfish ponds were dominated
by cyanobacteria, compared to newer ponds which had higher numbers of centric
diatoms and green algae. Growth of algae communities, associated with periphyton,
can be encouraged via the addition of substrates (Santhana Kumar et al. 2017).
Substrates are used in aquaculture systems to provide sites for the development
of biofilm, a microbial consortium associated with a matrix of extracellular polymeric
substances bound to submerged surfaces (Pandey et al. 2014), that has a potential to
improve water quality, and crustacean survival and growth (Khatoon et al. 2007;
Otoshi et al. 2006; Viau et al. 2012). Various substrates may be used as habitat for
heterotrophic bacteria, including duckweed (Lemna minor) (Ardiansyah & Fotedar
2016b). Heterotrophic bacteria may aid in bioremediation of nitrogenous wastes and
phosphates (Li & Boyd 2016), and may enhance mineralization of organic matter,
releasing ammonium into the water (Amin et al. 2012), but require a carbon source for
certain functions, including denitrification (Hamlin et al. 2008). Concomitantly,
addition of a carbon source may increase bacterial diversity (Hu et al. 2017). Carbon
addition can change the predominant bacteria to Bacillus sp. over Vibrio sp., while use
of a substrate (Aquamat®) has been shown to reduce Vibrio sp. counts in prawn ponds
(Zhao et al. 2012; Santhana Kumar et al. 2017). Research suggests that attached
biofilm, periphyton or particulate organic matter on artificial substrates can provide an
additional food source for prawns and crayfish (Otoshi et al. 2006; Moss & Moss 2004;
Viau et al. 2012). Substrates have been used to encourage growth of primarily

Chapter 5: Effects of pond age and substrate on a commercial marron farm.
60
cyanobacteria and microalgae, including diatoms, to promote bioremediation and
animal growth (Khatoon et al. 2007).
Oil-based substrates may provide both a habitat and carbon source, as
hydrocarbon. More than 100 species of heterotrophic bacteria, including Pseudomonas
sp. and Bacillus sp. are known to utilize hydrocarbons as a carbon source (Hu et al.
2017). Oil-based substrates may have multiple repercussions on the pond environment,
such as improved water quality, enhanced ecology, improved animal health, and
changes in bacterial composition. However, limited evidence based research has been
conducted using oil-based substrates, especially in marron aquaculture.
The substrate used in this trial is an oil and wax based product known
commercially as The Water Cleanser™, which acts as a substrate for the growth of
heterotrophic bacteria and biofilm. TWC is thought to provide habitat to harbour
bacteria, by providing a large surface area and a carbon source, maintaining
populations of beneficial bacteria a prolonged period of time (Marine Easy Clean
2015). TWC is also a potential biofilter for nutrient removal. Attached biofilm may
provide an additional food source for marron, as microbial productivity is known to
contribute as food for crayfish growth (Morrissy et al. 1984). TWC may promote the
growth of heterotrophic bacteria, certain species of which are beneficial to marron
health (Ambas et al. 2013). By providing a carbon source, TWC would benefit the
growth of Bacillus species already present in aquaculture ponds. This field experiment
aimed to investigate the effects of a commercial substrate and pond age on water
quality, natural productivity and marron production on a commercial marron farm.
5.3 Materials and Methods
5.3.1 Location
A field trial was conducted near Manjimup, Western Australia at a commercial marron
farm (34°18’75” S, 116°06’61” E) (Figure 5.1; Figure 5.2). All laboratory based
analytical work was conducted at the Curtin Aquatic Research Laboratories (CARL);
Perth, Bentley, WA.

Chapter 5: Effects of pond age and substrate on a commercial marron farm.
61
Figure 5.1: Location of study site.
Figure 5.2: Study site, near Manjimup, WA.

Chapter 5: Effects of pond age and substrate on a commercial marron farm.
62
5.3.2 Study Design
Marron were stocked in ponds from May 2016, and harvested in May 2017 by farmer.
Twenty-one ponds were selected for the study, and categorised according to life stage,
pond age, and presence of The Water Cleanser™ (TWC), as: 10 new ponds (2 juvenile,
4 grow-out, and 4 brooder; 5 with TWC, 5 without) and 11 old ponds (5 juvenile, 4
grow-out, and 2 brooder; 5 with TWC, 6 without). Ponds were treated to the same
commercial marron farming practices. Ten kilograms of TWC, supplied by Marine
Easy Clean Pty Ltd, were added to treatment ponds, as 10 x 1 kg rectangular blocks,
and dispersed evenly around the ponds. Blocks were designed to stand upright at the
bottom of the ponds, as per the supplier’s suggestion (Plate 5.1).
Plate 5.1: Photographs of marron ponds showing the The Water Cleanser block, and
hides.
5.3.3 Animals
Marron were stocked as juveniles, monosex grow out 40-90 g, monosex grow out 95-
130 g and brooders in May-June 2016. Adults were removed from brooder ponds
following juvenile production in summer-autumn. Approximately 3500 juvenile
marron were stocked in juvenile ponds, while 150-155 kg of 1+ marron were stocked
in grow out ponds. Final biomass (kg per pond) was calculated for juvenile and grow
out ponds at harvest in May-June 2017. Juvenile survival rate was estimated by
counting the numbers stocked, calculating the average weight at harvest and estimating
the number harvested.

Chapter 5: Effects of pond age and substrate on a commercial marron farm.
63
5.3.4 Water Quality
Sampling was carried out every six weeks, in spring (October and November), summer
(January), and autumn (March and April), over seven months. Ponds had a shallow
gradient, approximate depth of 1.5 m and area of 1005 to 1325 m2.
During sampling, pH, temperature and dissolved oxygen (DO) were taken with an
Ecoscan pH meter 5 (Eutech), and Oxyguard Handy Polaris meter respectively in all
ponds. Turbidity was measured using a secchi disc, with clear ponds given a turbidity
reading of 150cm (approximate pond depth). 100 mL of water was taken from each
ponds for nutrient concentration analysis. The concentrations of total ammonia
nitrogen (TAN), NO2-N, NO3-N and orthophosphate were analysed using Permachem
reagents from HACH® and a Skalar colorimeter auto-analyser (Downs et al. 2008). All
measurements of water quality were in accordance with standard methods for the
examination of water and wastewater (APHA 1998).
5.3.5 Bacteria
During daylight, 1.5 mL of pond water was collected in sterilized Eppendorf tubes for
bacteria analysis. Samples were kept on ice during transportation, and were analysed
for Colony Forming Units (CFU) within 24 hours of sampling. A 50 µL sample of
pond water was directly cultured onto standard plate count agar (Oxoid, U.K.) using
aseptic techniques. This dilution factor was adequate to attain plates with 30 to 300
colonies. After incubation for 48 hours at 30°C, colonies were counted and expressed
as CFU/mL as previously described (Leonard et al. 2000); calculated by multiplying
the colony count by the dilution factor. Colonies were identified according to colony
morphology to estimate diversity and Bacillus sp. count. Bacillus sp. were
distinguished by colony morphology. At the end of trial, 3 samples of TWC were
collected from 3 randomly selected ponds and analysed for bacterial species
identification by Matrix-assisted laser desorption ionization time-flight mass
spectrometry (MALDI-TOF MS), by the Department of Agriculture (Western
Australia).
5.3.6 Natural Productivity
Phytoplankton were sampled with a fine plankton net and concentrated from 500 mL
of pond water into 100 mL plastic containers. Zooplankton samples were sampled with

Chapter 5: Effects of pond age and substrate on a commercial marron farm.
64
a coarse plankton net of 60 micron, and concentrated from 15 L of pond water into 100
mL containers. Phytoplankton samples were preserved with 2-3% Acid Lugol’s Iodine
within 24 hours of sampling. Samples were then inverted several times, and a sub-
sample was counted using a haemocytometer at 400x magnification. Identification was
carried out to genus level, and species richness calculated, as number of genera per
sample. Zooplankton samples were preserved in 70% Ethanol within 24 hours of
sampling. Number and species present in 1mL sub-samples were counted in a petri
dish at 20x magnification. Identification was carried out to family level, and species
richness calculated, as number of families per sample. The presence of dinoflagellates,
and water bug count per 100mL sample, was also measured. Plankton were identified
with reference to Ingram et al. (1997). Phytoplankton and zooplankton abundance
were calculated by using equations adapted from Ingram et al. (1997) and Nugroho &
Fotedar (2013):
Phytoplankton Abundance (cells/L) = ((No. x 1000 / (volume of grid (0.1mm3) x No.
of grid squares counted)*(Conc. Vol. / 1mL)) /Tot. Vol.
Zooplankton Abundance (ind. /L) = (No. x (Conc. Vol. / Sub. Vol.)) / Tot. Vol.
where Tot. Vol. = Total volume of water (L) collected from the pond, Conc. Vol. =
Volume of water (mL) containing concentrated plankton after sieving, Sub. Vol. =
Sub-sample of water (mL) from concentrated volume in which plankton is counted,
and No. = Mean number of cells or individuals counted.
5.3.7 Statistical Analysis
All data were expressed as mean ± standard error. Data was analysed between
treatment and pond age with a multivariate two way analysis of variance (ANOVA)
and independent t-tests. Least significant difference (LSD) post-hoc tests were used
for multiple mean comparisons when the p value showed significant differences. For
data which were not normally distributed Kruskal-Wallis and Mann Whitney tests
were used. Finally, Pearson correlations were carried out to determine relations
between water quality, productivity, and bacteria counts. All computations were done
with SPSS version 23.0 and a p value of less than 0.05 was deemed significant.

Chapter 5: Effects of pond age and substrate on a commercial marron farm.
65
5.4 Results
5.4.1 Water Quality
All water quality parameters were within the optimal range for marron (Morrissy 1984;
Morrissy 1990; Environment Protection Water Quality Policy 2003), except TAN
(Table 5.1). The maximum pH was higher than the optimum for Cherax
quadricarinatus (Villarreal & Peláez 1999). Turbidity ranged from 20 to 150 cm
(clear). There was no significant difference in water quality grand means between
ponds with and without TWC over the course of the trial. However, pond age had a
significant influence on water quality, bacterial abundance and phytoplankton grand
means (Table 5.2).
Table 5.1: Optimum ranges for water quality compared to observed range for all ponds
throughout the study.
Parameter Optimum Observed range
Temperature (°C) 11-301 20.5-29.3
pH 6.5-9.04 7.25-9.19
aDO (mg/L) >52 >6.3
bTAN (mg/L) <0.013 <0.3
NO2-N (mg/L) <1.03 <0.089
NO3-N (mg/L) <10.03 <2.0
1 = Morrissy, 1990, 2 = Morrissy et al., 1984, 3 = Environment Protection (Water Quality) Policy, 2003,
4 = Villarreal & Peláez, 1999.
a TAN=Total Ammonia Nitrogen
b DO=Dissolved Oxygen
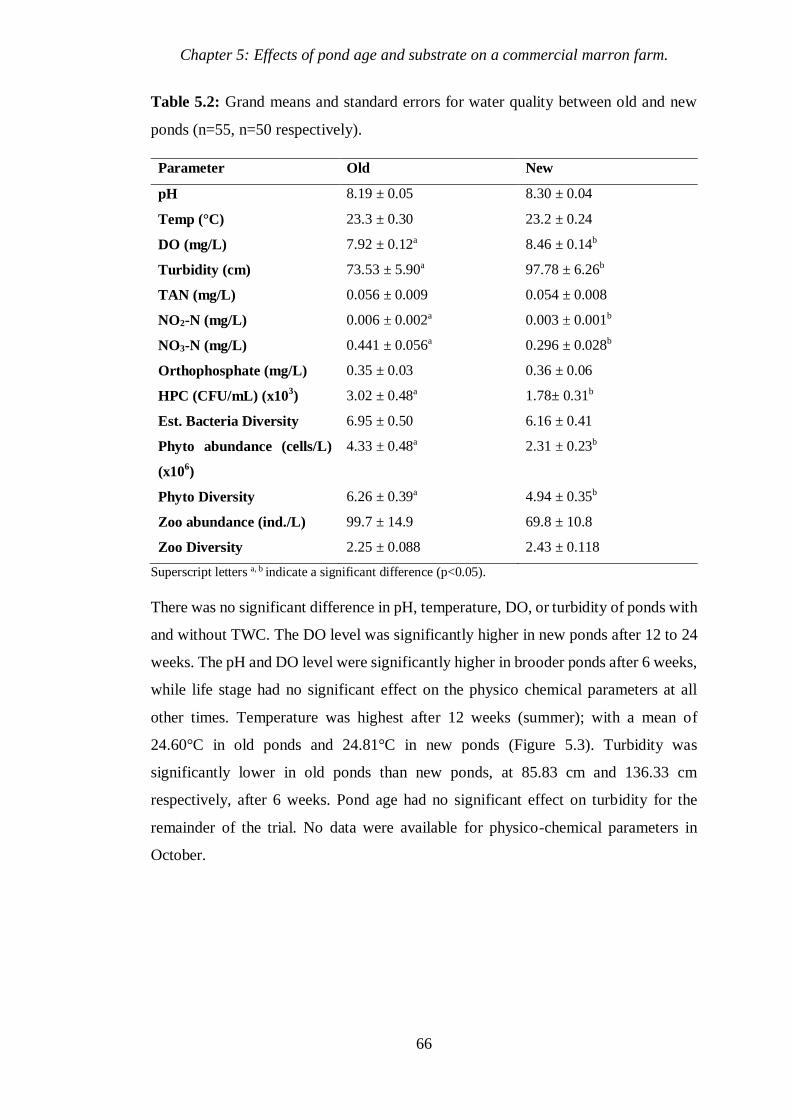
Chapter 5: Effects of pond age and substrate on a commercial marron farm.
66
Table 5.2: Grand means and standard errors for water quality between old and new
ponds (n=55, n=50 respectively).
Parameter Old New
pH 8.19 ± 0.05 8.30 ± 0.04
Temp (°C) 23.3 ± 0.30 23.2 ± 0.24
DO (mg/L) 7.92 ± 0.12a 8.46 ± 0.14b
Turbidity (cm) 73.53 ± 5.90a 97.78 ± 6.26b
TAN (mg/L) 0.056 ± 0.009 0.054 ± 0.008
NO2-N (mg/L) 0.006 ± 0.002a 0.003 ± 0.001b
NO3-N (mg/L) 0.441 ± 0.056a 0.296 ± 0.028b
Orthophosphate (mg/L) 0.35 ± 0.03 0.36 ± 0.06
HPC (CFU/mL) (x103) 3.02 ± 0.48a 1.78± 0.31b
Est. Bacteria Diversity 6.95 ± 0.50 6.16 ± 0.41
Phyto abundance (cells/L)
(x106)
4.33 ± 0.48a 2.31 ± 0.23b
Phyto Diversity 6.26 ± 0.39a 4.94 ± 0.35b
Zoo abundance (ind./L) 99.7 ± 14.9 69.8 ± 10.8
Zoo Diversity 2.25 ± 0.088 2.43 ± 0.118
Superscript letters a, b indicate a significant difference (p<0.05).
There was no significant difference in pH, temperature, DO, or turbidity of ponds with
and without TWC. The DO level was significantly higher in new ponds after 12 to 24
weeks. The pH and DO level were significantly higher in brooder ponds after 6 weeks,
while life stage had no significant effect on the physico chemical parameters at all
other times. Temperature was highest after 12 weeks (summer); with a mean of
24.60°C in old ponds and 24.81°C in new ponds (Figure 5.3). Turbidity was
significantly lower in old ponds than new ponds, at 85.83 cm and 136.33 cm
respectively, after 6 weeks. Pond age had no significant effect on turbidity for the
remainder of the trial. No data were available for physico-chemical parameters in
October.

Chapter 5: Effects of pond age and substrate on a commercial marron farm.
67
Figure 5.3: Variation of temperature from spring (6 weeks) to autumn (24 weeks),
according to old ponds (open circles) and new ponds (filled circles), with mean and
standard error (old ponds, n=11; new ponds, n=10). An asterisk represents a significant
difference between pond age (p<0.05).
5.4.2. Nutrient Concentrations
Concentrations of TAN, NO2-N, NO3-N and total nitrogen were not significantly
affected by TWC. After 24 weeks (April), significantly lower concentrations of
orthophosphate were present in old ponds with TWC (Table 5.3). Meanwhile, pond
age had a significant effect on all nutrient concentrations except TAN (Figure 5.4),
and Total Nitrogen. Seasonally, TAN concentration peaked after 6 weeks, while all
nitrogenous waste levels fell after 12 weeks (summer), coinciding with an increase in
bacteria and plankton abundance. The concentrations of Total Nitrogen were lowest
after 12 and 24 weeks. No TAN data could be obtained after 18 weeks.
*
*

Chapter 5: Effects of pond age and substrate on a commercial marron farm.
68
Table 5.3: Concentration of orthophosphate in old and new ponds with and without
TWC.
Orthophosphate Control TWC Overall
Old New Old New Old New
0 weeks (Oct) - - - - 0.21 ±
0.06
0.27 ±
0.04
6 weeks (Nov) 0.09 ±
0.02
0.36 ±
0.18
0.19 ±
0.06
0.10 ±
0.04
0.13 ±
0.03
0.23 ±
0.10
12 weeks (Jan) 0.57 ±
0.07m
0.12 ±
0.06n
0.42 ±
0.03
0.24 ±
0.15
0.50 ±
0.05m
0.18 ±
0.08n
18 weeks (Mar) 0.51 ±
0.08
0.48 ±
0.07
0.65 ±
0.13
0.39 ±
0.07
0.57 ±
0.07
0.44 ±
0.05
24 weeks (Apr) a0.43 ±
0.22
1.12 ±
0.24
b0.27 ±
0.24 m
0.45 ±
0.24n
0.36 ±
0.04
0.79 ±
0.25
Superscript a, b indicate a significance between ponds with and without TWC; superscript m, n indicate a
significant difference between old and new ponds (p<0.05).
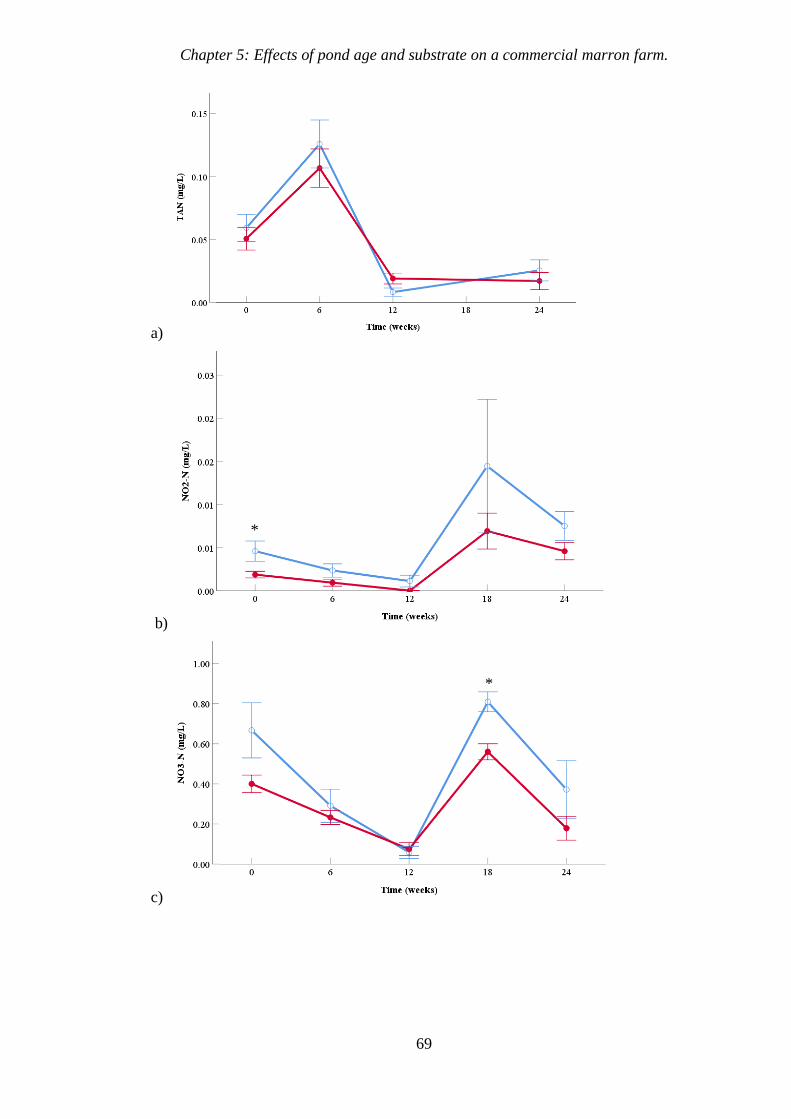
Chapter 5: Effects of pond age and substrate on a commercial marron farm.
69
a)
b)
c)
*
*
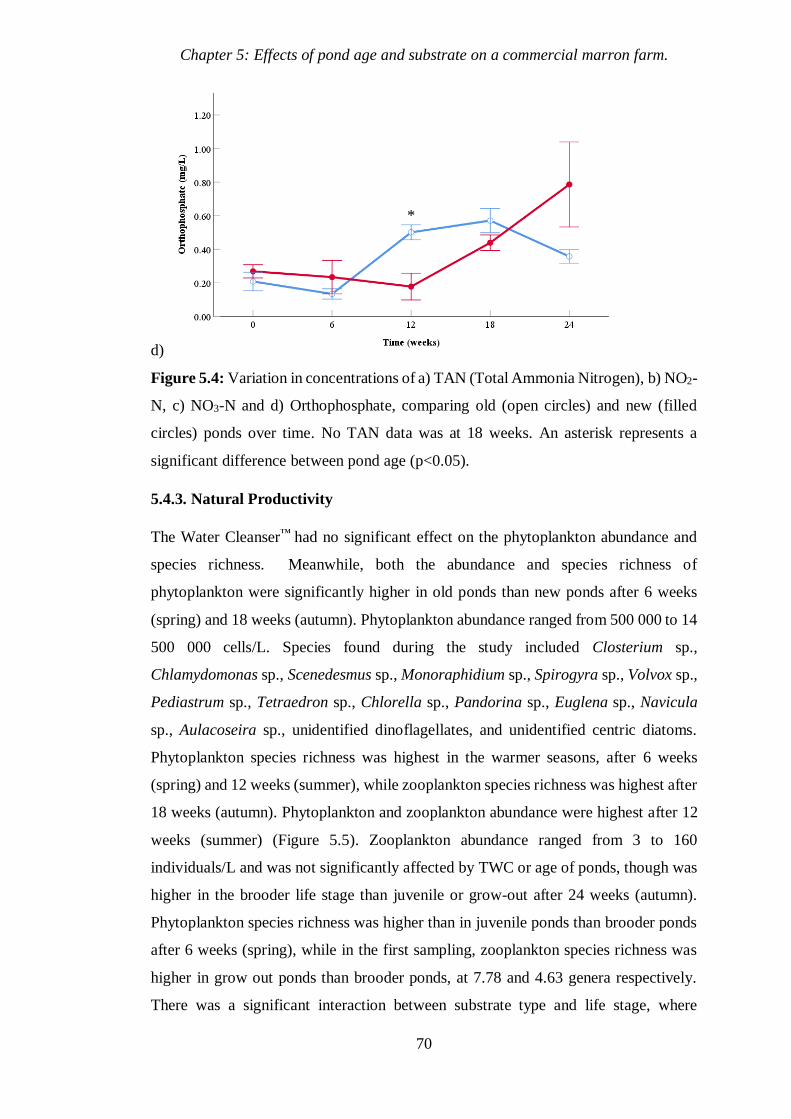
Chapter 5: Effects of pond age and substrate on a commercial marron farm.
70
d)
Figure 5.4: Variation in concentrations of a) TAN (Total Ammonia Nitrogen), b) NO2-
N, c) NO3-N and d) Orthophosphate, comparing old (open circles) and new (filled
circles) ponds over time. No TAN data was at 18 weeks. An asterisk represents a
significant difference between pond age (p<0.05).
5.4.3. Natural Productivity
The Water Cleanser™ had no significant effect on the phytoplankton abundance and
species richness. Meanwhile, both the abundance and species richness of
phytoplankton were significantly higher in old ponds than new ponds after 6 weeks
(spring) and 18 weeks (autumn). Phytoplankton abundance ranged from 500 000 to 14
500 000 cells/L. Species found during the study included Closterium sp.,
Chlamydomonas sp., Scenedesmus sp., Monoraphidium sp., Spirogyra sp., Volvox sp.,
Pediastrum sp., Tetraedron sp., Chlorella sp., Pandorina sp., Euglena sp., Navicula
sp., Aulacoseira sp., unidentified dinoflagellates, and unidentified centric diatoms.
Phytoplankton species richness was highest in the warmer seasons, after 6 weeks
(spring) and 12 weeks (summer), while zooplankton species richness was highest after
18 weeks (autumn). Phytoplankton and zooplankton abundance were highest after 12
weeks (summer) (Figure 5.5). Zooplankton abundance ranged from 3 to 160
individuals/L and was not significantly affected by TWC or age of ponds, though was
higher in the brooder life stage than juvenile or grow-out after 24 weeks (autumn).
Phytoplankton species richness was higher than in juvenile ponds than brooder ponds
after 6 weeks (spring), while in the first sampling, zooplankton species richness was
higher in grow out ponds than brooder ponds, at 7.78 and 4.63 genera respectively.
There was a significant interaction between substrate type and life stage, where
*

Chapter 5: Effects of pond age and substrate on a commercial marron farm.
71
zooplankton species richness was higher in ponds with substrate in juvenile and grow-
out ponds, but higher in ponds without substrate in brooder ponds, after 18 weeks
(autumn). In ponds with TWC; zooplankton species richness was higher in new ponds
after 6 weeks (spring), while phytoplankton species richness was higher in old ponds
after 18 weeks (autumn). Zooplankton species richness was also higher in new ponds
after 24 weeks, in ponds without TWC. The abundance of certain species appeared to
be somewhat seasonal, e.g. Cladoceran abundance was greatest in spring. Zooplankton
species found include rotifers; Branchionus sp. and Keratella sp.; Calanoida and
Cyclopoida copepods (adult and nauplii); and Cladocerans Daphnia sp. and Moina
species. Insecta (Orders Hempitera and Coleoptera) were commonly found.
a)
b)
*
*

Chapter 5: Effects of pond age and substrate on a commercial marron farm.
72
c)
d)
Figure 5.5: Fluctuation of phytoplankton (a, b) and zooplankton (c, d) abundance (no.
/ L), comparing with and without substrate (control), and pond age. An asterisk
represents a significant difference between pond age (p<0.05).
5.4.4. Bacteria
The heterotrophic plate count (HPC), Bacillus sp. count and estimated colony diversity
are summarized in Table 5.4. Life stage had no significant effect on bacterial
abundance, while estimated colony diversity was higher in juvenile ponds than grow-
Chapter 5: Effects of pond age and substrate on a commercial marron farm.
73
out and brooder ponds, in the first sampling. Biofilm was observed on TWC surface
after six weeks. After 24 weeks, no bacteria data could be obtained. At the end of trial,
TWC samples from three randomly selected ponds were analysed, using MALDI-TOF
MS, and the following bacteria species were found: Aeromonas eucrenophila,
Pseudomonas brassicacearum, Bacillus cereus, Bacillus thuringienis, Pseudomonas
anguilliseptica, Pseudomonas extremorientalis, Rheineimera soli, Aeromonas
bestarium, Exiguobacterium sp., Pseudomonas cedrina, Aeromonas veronii, and
Bacillus vietnamensis.

Chapter 5: Effects of pond age and substrate on a commercial marron farm.
74
Table 5.4: The Heterotrophic Plate count (HPC) (x103) and Bacillus sp. count as
CFU/mL and estimated diversity between old and new ponds with and without TWC.
Variable Control TWC Overall
Old
New HPC (CFU/mL) Old New Old New
1st Sampling
(Oct)
3.58 ±
3.03
1.36 ±
0.62
3.23 ±
2.26
1.93 ±
1.69
3.40 ±
1.75
2.45 ±
0.92
2nd (Nov) 2.35 ±
0.90
1.20 ±
0.23
3.05 ±
0.88
1.42 ±
0.17
2.64 ±
0.62m
1.30 ±
0.14n
3rd (Jan) 6.23 ±
1.30
3.94 ±
1.70
3.47 ±
1.10
3.21 ±
1.00
4.98 ±
0.93
3.58 ±
0.94
4th (Mar) 1.17 ±
0.18
1.02 ±
0.19
1.24 ±
0.30
0.74 ±
0.16
1.20 ±
0.16
0.88 ±
0.12
Bacillus sp.
1st (Oct) <20.0 40.0 20.0 <20.0 20.00 40.0
2nd (Nov) <20.0 20.0 20.0 <20.0 20.0 20.0
3rd (Jan) 36.7 ±
15.0
16.0 ±
4.0
48.0 ±
30.1
24.0 ±
9.80
41.8 ±
15.1
20.0 ±
5.2
4th (Mar) a50.0 ±
10.0
20.0 ±
12.7
b120.0 ±
26.1m
20.0 ±
9.43n
81.8 ±
16.5m
20.0 ±
9.4n
Estimated
colony diversity
1st (Oct) 3.8 ±
0.5
3.6 ±
0.7
3.0 ±
0.7
2.5 ±
0.3
3.4 ±
0.4
3.3 ±
0.4
2nd (Nov) 4.7 ±
0.5
4.9 ±
0.4
4.6 ±
0.3
5.0 ±
0.3
4.7 ±
0.3
4.9 ±
0.2
3rd (Jan) a10.7 ±
0.6m
7.4 ±
0.7n
b8.0 ±
0.3
9.4 ±
1.4
9.5 ±
0.6
8.4 ±
0.8
4th (Mar) a10.8 ±
0.9m
7.4 ±
0.8n
b8.0 ±
0.8
9.4 ±
0.5
9.6 ±
0.7
8.4 ±
0.5
Superscript a, b indicate a significant difference between ponds with and without TWC; superscript m, n
indicate significant difference between old and new ponds (p<0.05).

Chapter 5: Effects of pond age and substrate on a commercial marron farm.
75
5.4.5. Marron Growth and Survival
Final biomass was calculated for grow-out and juvenile ponds at harvest. No growth
data was available for brooder ponds. In juvenile old ponds, final biomass was
significantly higher with TWC (Figure 5.6). There was a mean increase of
approximately 26%. Final biomass was not significantly different between old and
new ponds, or between ponds with and without substrate irrespective of pond age.
a)
b)
Figure 5.6: Mean final biomass for juvenile (a) and grow-out (b) ponds, between old
and new ponds with substrate and without substrate (control). A and B represent
significant differences ponds with and without TWC (p<0.05). Where no standard
error bar is present n=1.
Survival rate of juvenile marron was not significantly different between ponds with or
without substrate in old or new ponds, irrespective of pond age, or between old and

Chapter 5: Effects of pond age and substrate on a commercial marron farm.
76
new ponds (Figure 5.7). However, survival rate was approximately 20% higher in old
ponds with substrate than without.
Figure 5.7: Survival rate in juvenile ponds between old and new ponds with and
without substrate (control). Where no standard error bar is present n=1.
5.4.6 Correlations
No strong correlation (R>0.70) was present between phytoplankton and zooplankton
abundance. Ponds with high abundance often had high species richness. There was a
significant negative correlation between phytoplankton abundance and zooplankton
species richness in old ponds after 6 weeks (p=0.005, R=-0.749) (Figure 5.8). There
were no strong correlations found between nutrient concentrations and plankton
parameters, or between the final biomass and survival rate of juvenile marron.
No strong correlations were found between bacteria abundance and other parameters.
However, old ponds with higher orthophosphate also had higher bacteria diversity after
12 weeks (p=0.009, R=0.743) (Figure 5.9), where phosphorous may have been a
limiting factor. Weak correlations were also found between HPC and nitrogenous
nutrient concentrations. Ponds with higher HPC were also likely to have higher
bacteria diversity (p<0.05). A two-way ANOVA found no significant interaction
effects between pond age and substrate.

Chapter 5: Effects of pond age and substrate on a commercial marron farm.
77
Figure 5.8: Correlation between phytoplankton abundance and zooplankton species
richness in old ponds after six weeks (spring).
Figure 5.9: Correlation between the concentration of orthophosphate and estimated
bacteria diversity in old ponds after 12 weeks (summer).
R² = 0.5603
0
2,000,000
4,000,000
6,000,000
8,000,000
10,000,000
12,000,000
14,000,000
16,000,000
0.5 1 1.5 2 2.5 3 3.5
Ph
ytopla
nkto
n a
bun
dan
ce (
cell
s/L
)
Zooplankton Species Richness
R² = 0.5672
6
7
8
9
10
11
12
13
14
0.1 0.12 0.14 0.16 0.18 0.2 0.22 0.24 0.26 0.28 0.3
Bac
teri
a D
iver
sity
Orthophosphate concentration (mg/L)

Chapter 5: Effects of pond age and substrate on a commercial marron farm.
78
5.5 Discussion
The Water Cleanser™ had a significant effect on the juvenile marron, because
this is a more critical stage of the crayfish life cycle, where mortality can be high
(Ghanawi & Saoud 2012). Artificial substrates have previously improved survival rate
in various prawn cultures including Penaeus monodon tank culture (Khatoon et al.
2007), and Litopenaeus vannamei pond culture (Santhana Kumar et al. 2017); both
attributed to improved water quality. Viau et al. (2012) have shown that biofilm
attached to artificial substrate can improve survival and contribute to growth of C.
quadricarinatus (redclaw crayfish) juveniles, by providing a complementary food
source, as well as improving water quality, which is essential for good survival. Jones
et al. (2002) found that another species in the Cherax genus, Cherax destructor,
consumes biofilm attached to artificial substrate. TWC also provided biofilm,
containing bacteria, protozoans, nematodes, and microalgae including diatoms. Signs
of biofilm utilization were present in both juvenile and grow out ponds. In C.
quadricarinatus culture, analysis of stomach contents found that they consumed
various periphyton found in biofilm, including ciliates, rotifers and nematodes (Viau
et al. 2012), which can be nutritionally important (Da Silva et al. 2008). Better
nutrition, provided by good natural productivity, can help to improve juvenile crayfish
survival (Ghanawi & Saoud 2012).
Detritus and zooplankton are important food items due to their nutritional
composition and availability (Browne et al. 1992; Jones 1995). In the present study
substrate had no significant effect on zooplankton abundance, however. Uddin et al.
(2009) found similar results in the zooplankton populations of tilapia (Oreochromis
niloticus) and freshwater prawn (Macrobrachium rosenbergii) polyculture; where
there were no significant differences between Rotifera and Crustacea numbers in
ponds with and without bamboo substrate with attached periphyton. Phytoplankton
composition varied however, where ponds with bamboo substrate had higher numbers
of Bacillariophyceae, Chlorophyceae and Cyanophyceae than control ponds (Uddin et
al. 2009).
Natural productivity generally increases in the warmer months (Armitage et al.
1973; O’Brien & deNoyelles 1974; Affan et al. 2005). The population of Calanoida
copepods (Skistodiaptomus pallidus) in a large freshwater pond in Kansas, U.S. was

Chapter 5: Effects of pond age and substrate on a commercial marron farm.
79
found to be more abundant in spring and autumn, and much lower in winter (Armitage
et al. 1973). O’Brien & deNoyelles (1974) found a high level of chlorophyll a,
indicating high phytoplankton abundance, in late summer, while Affan et al. (2005)
found the lowest phytoplankton abundance in winter. In the current trial the highest
abundance of phytoplankton and zooplankton was also in summer. While a
relationship clearly exists between phytoplankton and zooplankton, no strong
correlation was found between phytoplankton and zooplankton abundance in this
study, as in another study (Armitage et al. 1973). McKnight et al. (1990) showed that
increased zooplankton grazing can cause a decrease in phytoplankton abundance,
however. In the current trial, higher zooplankton diversity was related to lower
phytoplankton abundance, possibly showing enhanced grazing by certain species, such
as rotifers (Keratella sp.). The increase in phytoplankton in summer in the current trial
would have depleted the ammonia and nitrate levels, while the increased
concentrations of orthophosphate in summer may have helped to trigger the increase
in phytoplankton growth (O’Brien & deNoyelles, Jr. 1974).
The concentration of orthophosphate was significantly reduced in ponds with
TWC after 24 weeks. A study in intensive shrimp (Penaeus paulensis) culture has
shown the effectiveness of biofilm, attached to PVC tubes, in reducing ammonium and
phosphate levels (Thompson et al. 2002). TWC had no significant effect on
concentrations of nitrogen metabolites in marron ponds though, partly due to low
nutrient concentrations. Fotedar (2004) reported ammonia and nitrite levels of 0.5
mg/L or less in semi-intensive marron ponds in Jurien Bay, Western Australia. In
systems with higher nutrient loading, substrates have been used to improve water
quality. A substrate (Aquamat) combined with sand sediment has resulted in low TAN
and orthophosphate levels in shrimp (L. vannamei) tanks (Bratvold & Browdy 2001).
Phosphorous in water can be oxidised to produce energy for microbes, and used for
their growth and metabolism (Lananan et al. 2014). Phosphorous may then be
converted into cellular polyphosphate and protein. Meanwhile, the application of an
artificial substrate (Aquamat) into semi-intensive shrimp (L. vannamei) ponds has
resulted in a reduction of 12% in the concentration of nitrogen in effluent, attributed
to attached heterotrophic bacterial and algal biomass (Santhana Kumar et al. 2017).
Observations from this field experiment and experiments 1 and 2 suggest that TWC
may provide better habitat for heterotrophic bacteria than algae.

Chapter 5: Effects of pond age and substrate on a commercial marron farm.
80
Biofilm containing heterotrophic bacteria was found attached to TWC surface
in marron ponds. This could be the main cause for the higher Bacillus sp. count found
in pond water with substrate. Another study has found a variety of heterotrophic
bacteria, including Bacillus sp. and Pseudomonas sp., on duckweed substrate
(Ardiansyah & Fotedar 2016b). Application of Bacillus sp. is generally used to increase
Bacillus sp. counts in aquaculture water (Zokaeifar et al. 2014), however TWC
maintains the Bacillus sp. population without further addition, by providing a habitat
and carbon source, as hydrocarbon. Bacillus sp. have been shown to reduce
concentrations of orthophosphate and nitrogen in aquaculture water (Wang et al. 2005;
Lalloo et al. 2007; Xie et al. 2013). TWC with attached Bacillus sp. could affect marron
via ingestion of biofilm or by altering the bacterial composition of water, potentially
improving physiological condition of marron (Ambas et al. 2013). Addition of Bacillus
sp. in water has been shown to increase survival of the Indian white shrimp (Penaeus
indicus) in tanks and earthen ponds (Ziaei-Nejad et al. 2006). Of the species found on
TWC surface; Bacillus thuringienis helps to maintain eco equilibrium and inhibits the
proliferation of harmful organisms (Zhou et al. 2009), while B. cereus is a common
and beneficial probiotic in aquatic animals (Deng et al. 2014; Hong et al. 2005;
Balcázar et al. 2006). Aeromonas sp. and Pseudomonas sp. are common indigenous
bacteria in aquatic animals, sometimes in association with animals, and ubiquitous in
nature. Pseudomonas sp. are commonly used as probiotics, while others are pathogenic
(Balcázar et al. 2006).
No discernible effect was present on bacterial abundance in the water column,
largely due to the high variation in bacterial abundance. Schveitzer et al. (2013) also
found no significant differences in microbial activity between tanks with and without
substrate. Bacterial abundance in marron ponds was highest in summer, coinciding
with a low concentration of nitrogen. The optimum temperature for denitrification, for
nitrifying bacteria and for several Bacillus strains, is between 25°C and 35°C (Song et
al. 2011; Hargreaves 1998). Phosphorous also limited the growth of certain species, as
inferred by the significant correlation between orthophosphate and estimated bacterial
diversity. Phosphorous is often a limiting element in microbial growth (Kirchman
2012).
Fertilization of newly-dug freshwater prawn ponds has been suggested by
Correia et al. (2002), due to low biomass of microbial and macroinvertebrate

Chapter 5: Effects of pond age and substrate on a commercial marron farm.
81
populations. Fertilization is uncommon in marron aquaculture though, due to the risk
of eutrophication leading to algal blooms (Comm. with farmers). Nutrient
concentrations, turbidity and dissolved oxygen levels were lower in new marron pond,
resulting in lower phytoplankton abundance, bacterial abundance, Bacillus sp. count,
and estimated bacterial diversity. In a study on channel catfish (Ictalurus punctatus)
ponds, Zimba et al. (2003) also found that older ponds had significantly higher
nitrogen and phosphorous concentrations. Pond age had no discernible effect on
zooplankton abundance, but significantly higher species richness was present in new
marron ponds. Abu Hena & Hishamuddin (2014) found similar results, recording no
differences in zooplankton abundance between old and new ponds, and higher
diversity and evenness in new ponds. Macroinvertebrate populations were more
established in older ponds.
5.6. Conclusions
The trial demonstrated the significant effects of pond age on water quality,
natural productivity and bacterial abundance. The Water Cleanser™ significantly
improved the growth rate of juvenile marron in old ponds, attributed to a high survival
rate, and to an extent to biofilm attached to the substrate providing a complementary
food source. Additionally, there was higher abundance of Bacillus sp. in ponds with
TWC. Effects on water quality were limited however, with a reduction in the
concentration of orthophosphate only, in the final sampling. TWC may be applied to
pond culture with no detrimental effects to natural productivity or marron, however
more research is needed to determine its effects on plankton and microbial ecology,
and marron health and physiology.

Chapter 6:
Comparing Bioball® Media and The Water Cleanser™ in reducing
nutrient loading in marron (Cherax cainii Austin 2002) culture
Chapter 6 presents the third laboratory experiment conducted, comparing the effects
of low and high nutrient inputs (as determined by marron stocking density) and two
types of substrate (The Water Cleanser™, and Bioball® Media) in indoor marron tank
culture. This may help determine if substrates can be used to reduce nutrient loading
and improve marron health in aquaculture.

Chapter 6: Comparing two substrates in reducing nutrient loading
83
6.1. Introduction
In aquaculture, relatively low proportions of the nitrogen and phosphorous added
through feed are retained in animal biomass with the majority wasted in water and
sediment (Khoi & Fotedar 2010). For example, Thakur & Lin (2003) found that 22-
30% N and 10-13% P was retained in P. monodon biomass. This can result in high
nutrient loading; the difference between nutrient supplied, e.g. as feed, and nutrients
harvested in the form of cultured species (Verdegem 2013). In marron (Cherax cainii)
farming, eutrophication, build-up of organic matter and high biological oxygen
demands can cause health issues such as hypoxia (Morrissy et al. 1984). One solution
to reduce nutrient concentrations, thereby improving survival and growth of
crustaceans, is bioremediation using substrates (Viau et al. 2012; Viau et al. 2013).
Artificial substrates have previously been used to lessen the effects of high stocking
density, by providing additional habitat and a complementary food source in biofilm
(Pandey et al. 2014; Schveitzer et al. 2013; García-Ulloa et al. 2012; Jones et al. 2002;
Otoshi et al. 2006). There is thought to be an inverse relationship between stocking
density, and growth and survival of freshwater crayfish (Verhoef & Austin 1999;
Naranjo-Páramo et al. 2004; Jones & Ruscoe 2000; Mills & McCloud 1983; Geddes
1993). One of the reasons for a reduction in growth rate at higher stocking density
could be the deterioration of water quality present at high densities (Naranjo-Páramo
et al. 2004). Nutrient loading is likely to increase with increasing stocking density, due
to corresponding higher feed inputs and animal waste. The addition of substrates which
promote bacterial growth can be used to reduce nutrient concentrations in shrimp and
crayfish culture. Substrate addition has been shown to improve the survival rate of
crustaceans, by reducing the relative stocking density, providing a complementary
food source, and/or improving the water quality (Schveitzer et al. 2013; Khatoon et
al. 2007; Viau et al. 2012). The water cleanser (TWC) is one commercially available
substrate that could be used to negate some of the negative effects of increased nutrient
loading associated with high stocking density, such as poor water quality and animal
health.
The previous chapters have shown that TWC can improve water quality by reducing
concentrations of nitrites, nitrates and orthophosphates. Bioball® Media (BM) can also
be effective in removing nutrients from water (Masłoń & Tomaszek 2015). However,

Chapter 6: Comparing two substrates in reducing nutrient loading
84
no comparison has been made between TWC and other substrates in the previous
chapters, while no reduction in the concentration of ammonia, or any significant
improvement in marron health has been shown with addition of TWC. Concomitantly,
no peer-reviewed research has investigated the effects of TWC in marron aquaculture.
The aim of this experiment was to compare the efficacy of a filter media substrate,
Bioball® Media (BM), and an oil-based substrate, TWC, in reducing nutrient loading
in marron culture with different rates of nutrient inputs as a result of different stocking
densities. Furthermore, the experiment investigated the effects of these treatments on
marron growth and health, and bacterial abundance in water.
6.2. Methodology
6.2.1. Location
All laboratory work was carried out at the Curtin Aquatic Research Laboratories
(CARL), Curtin University, Bentley, Perth, Western Australia. The experiment was
conducted indoors in a temperature-controlled aquaria facility.
6.2.2. Animals
For the experiment, marron (weight = 62.14±1.90g, and OCL (Orbital Carapace
Length) = 59.7±0.59mm) were brought from a commercial marron farm in Manjimup,
Western Australia (site of field trial). They were acclimatised for one week in three
200 L tanks with PVC pipes as shelters, aeration and daily water exchange.
During the experiment, marron were kept in individual cages made by connecting two
17 cm diameter Clearpond™ planter baskets at the open ends (Plate 6.1). The cages
were designed to prevent cannibalism and escapees, and to allow for individual
feeding. Marron were monitored for condition regularly and any mortalities were
removed, weighed, and replaced with stock marron to maintain stocking density.
Mortalities were recorded as a measure of survival rate. Individual marron weight and
OCL were measured every month. Then, the monthly weight gain, weight gain for 2
months (0-60 days), and weight gain for 3 months (0-90 days) were calculated. Moults
were recorded, however were too infrequent to allow for moult increments or moult
frequency to be calculated.

Chapter 6: Comparing two substrates in reducing nutrient loading
85
6.2.3. Experimental Design
The experimental units were distributed in a standardised block design, with four
replicates for each treatment level. Stocking density was used to provide low (SD1)
and high (SD2) nutrient loadings. The three treatments were: 1) no substrate, 2) The
Water Cleanser™ (TWC), as 100g rectangular floating blocks (93x93x20mm), and 3)
100g of Bioball® Media (BM) (diameter=25.4mm) (Plate 6.3). Marron were stocked
at two densities: SD1) 2 marron per tank (approximately 454g/m2) and SD2) 4 marron
per tank (approximately 908g/m2). Four replicates of each of the three substrate
treatments were used for each stocking density, totalling 24 experiment units. Twenty
four cylindrical 100 L water tanks (diameter=58cm, height=46cm; surface
area=1.10m2) were filled to 80L with filtered freshwater and aerated for the
experiment, without mechanical filtration. Regardless of treatment, each tank
contained 4 of the planter basket cages, to standardise any potential effect of the
presence of the cage, as microbial substrate. The experiment ran for 3 months, from
May to August 2017.
6.2.4. Feed and Nutrient Loading
Marron were fed individually at a rate of approximately 0.5% of body weight daily for
the first four weeks, and three times a week for the remaining period of time. The
reduction in feeding was required due to a build-up of excess feed. The feed was
fishmeal-based, with an average of 30.7% protein, an energy content of 18.63 MJ/kg
and 14% moisture content. The feed was manufactured at the CARL, unlike that in
experiment 3 (Chapter 4) which was made commercially, and had a higher protein
content. Nitrogen and phosphorous concentrations of the feed were approximately
4.91% and 1% respectively. Uneaten feed was removed twice a week. Derived from
feed inputs, the estimated nutrient loading for the entire experiment was
approximately: 1.513 g N and 0.312 g P at low stocking density, and 3.06 g N and
0.624 g P at high stocking density. The nutrient budget could not be calculated due to
the removal of uneaten feed.

Chapter 6: Comparing two substrates in reducing nutrient loading
86
Plate 6.1: The cylindrical white tanks and black planter-basket cages used in the
experiment (Cages remained horizontal during the experiment).
6.2.5. Water Quality Sampling and Analysis
The pH was measured with a pH meter (Ecoscan pH 5, Eutech Instruments, Singapore)
and DO and temperature with a DO meter (Handy Polaris, Oxyguard, Denmark) twice
a week, diurnally. Ammonia, nitrite, nitrate and total phosphate were measured twice
a week with API test kits (Aquarium Pharmaceuticals Incorporated™, USA). Nutrient
concentrations were standardised using Permachem test kits (HACH®, USA) and a
colorimeter auto analyser (Skalar, The Netherlands) (Downs et al. 2008). The
concentration of orthophosphate was determined after seven weeks using the
molybdovanadate method.
During the first month, there was a deterioration of water quality and an increase in
the concentration of nitrite (>4 mg/L) in several tanks. As there was a high likelihood
that water quality would deteriorate further, to prevent marron mortalities, a 90% water
exchange was carried out in all tanks after four weeks. Afterwards, the feeding rate
was decreased from daily feeding to three times per week to help alleviate this. There
were no further water exchanges throughout the experiment.
Observations were taken during the experiment, monitoring amounts of excess feed,
waste and fungal growth in tanks, changes in marron condition, and microbial growth
on the substrates.

Chapter 6: Comparing two substrates in reducing nutrient loading
87
6.2.6. Analysis of Haemolymph
Haemolymph samples from marron were taken every 2 weeks to monitor stress. A
0.3mL aliquot of haemolymph was withdrawn from the underside of marron between
the 4th and 5th thoracic leg, using 27 G needles with 1 mL syringes containing 0.3 mL
of anticoagulant (trisodium citrate). Marron were marked for identification and
returned to cages. Haemolymph samples were then placed into an Eppendorf tube kept
on ice, and analysed within 6 hours. Total haemocyte count (THC) was estimated using
a haemocytometer under 400x magnification. The total haemocyte count was
calculated as THC = (cells counted x dilution factor x 1000)/volume of grid (0.1 mm3).
Samples were stained with Giemsa and May-Grunwald to analyse the differential
haemocyte count (DHC), which was determined following established protocol (Sang
et al. 2009).
6.2.7. Analysis of Organosomatic Indices
At the end of trial, one marron was randomly selected from each tank for tissue
sampling. Excess moisture was removed, marron were weighed for total weight, and
OCL was measured with a calliper. Marron were dissected, the carapace was removed,
the hepatopancreas was placed into a crucible and weighed, and the tail muscle was
removed from the exoskeleton and placed in a crucible and weighed, to determine wet
weight. Crucibles were placed in an oven (Thermotec 2000, Contherm, New Zealand)
for 24 hours at 105°C, before being placed into a desiccating chamber for 30 minutes,
and reweighed to determine dry weight.
The hepatopancreas moisture content (HM%), tail muscle moisture content (TM%),
wet hepatopancreas index (Hiw), dry hepatopancreas index (Hid), wet tail muscle to
body ratio (Tbw) and dry tail muscle to body ratio (Tbd) were calculated using
established equations (Fotedar 1998):
HM% = (WHwet – WHdry) x 100 / WHwet
TM% = (WTwet – WTdry) x 100 / WTwet
Where: WHwet is the weight of the wet hepatopancreas (g)
WHdry is the weight of the dry hepatopancreas (g)
WTwet is the weight of the wet tail muscles (g)

Chapter 6: Comparing two substrates in reducing nutrient loading
88
and WTdry is the weight of the dry tail muscles (g)
Tbd = WTwet x 100 / Wt
Tbw = WTdry x 100 / Wt
Hiw = WHwet x 100/ Wt
Hid = WHdry x 100 / Wt
Where: Wt = Total weight of the animal (wet)
6.2.8. Bacteria Sampling and Analysis
Heterotrophic plate count (HPC) of the water column, in colony forming units
(CFU)/mL, was determined after 2, 6 and 11 weeks; before substantial bacterial growth
was thought to have developed, after substantial growth had developed, and four weeks
following this. Bacteria samples were collected in 1.5mL Eppendorf tubes directly
from the tank water within 30 minutes of plating. Using a pipette, 10µL of water was
directly transferred onto Tryptone glucose yeast agar (Standard Plate Count Agar)
using aseptic techniques. Agar plates were prepared as per Chapter 3. Samples were
spread using a hoop, which was flamed between samples. Petri dishes were wrapped
in alfoil and placed for in an incubator (Thermoline, Australia) for 48 hours at 30°C.
Viable colonies were counted and identified by colour and colony morphology to
estimate diversity after 24 hours and 48 hours under 20x magnification. Bacillus sp.
were identified by colony morphology and counted (Plate 6.2). Bacillus sp. were
sampled, fixed onto a glass slide and stained with crystal violet stain for further
identification (Plate 5.4).
Swabs were taken from approximately 1cm3 of TWC and BM surface, and cultured on
Tryptone glucose yeast agar. Colony count and identification was carried out after 48
hours of incubation.

Chapter 6: Comparing two substrates in reducing nutrient loading
89
Plate 6.2: Heterotrophic bacteria colonies after 48 hours incubation, during counting
procedure, under 20x magnification.
6.2.9. Statistical Analysis
Patterns in the data were expressed as mean ± standard error. Data were analysed
between substrate type (Control, BM, TWC), stocking density (SD1, SD2), and week
(1 to 13) with a univariate three factor mixed model analysis of variance (ANOVA)
and independent samples t-tests. Least significant difference (LSD) post-hoc tests were
used for multiple mean comparisons. For data which were not parametric, Kruskal-
Wallis and Mann Whitney tests were used. Pearson correlations were used test for
associations between measured parameters. SPSS version 23 was used for all statistical
analyses and a p value of less than 0.05 was deemed significant.
6.3. Results
6.3.1. Observations
After six weeks, a thick layer of biofilm was observed on the submerged surface of
TWC (Plate 6.3). No visible biofilm was visible on the surface of the BM.
Microorganisms, including ciliates of varied size, other protozoans, minute nematodes,
microalgae, fungi, and various unidentified bacteria (majority rod-shaped) were
present in the biofilm attached to TWC, as determined by microscopy.

Chapter 6: Comparing two substrates in reducing nutrient loading
90
Marron were generally in good condition, though some turned a blueish hue towards
the end of experiment; possibly due to a lack of carotenoids in the artificial diet
(Sommer et al. 1991). Epibionts were found attached to marron, including
Temnocephala eggs, indicative of poor water quality (Holdich 2002). Fungi, possibly
Saprolegnia, grew on any uneaten feed and marron carcasses.
a) b)
Plate 6.3: TWC with submerged biofilm (a), and the Bioball® Media used (b).
6.3.2. Survival
There were 10 mortalities throughout the experiment: 2 in control tanks, 1 at low and
1 at high stocking density; 4 in BM tanks, 1 at low and 3 at high stocking density; and
4 in TWC tanks, all at high stocking density. No cannibalism or escapees occurred.
Mortality often occurred after moulting, attributed to poor water quality, as inferred
by the presence of fungal growth in the tank water and general observations indicating
that high levels of organic matter were present.
6.3.3. Water Quality
The pH, temperature and dissolved oxygen (DO) remained within suitable ranges for
marron culture (Table 6.1), and were not significantly different between substrate type
or stocking density. The minimum recorded temperature of 14°C would not have been
too low to prevent growth of marron, while the maximum of 20°C would have allowed
for favourable growth (Morrissy 1990). In control tanks the DO was significantly
lower at SD2 after 4 and 8 weeks (Table 6.2), reflecting a high biological oxygen
demand.

Chapter 6: Comparing two substrates in reducing nutrient loading
91
Table 6.1: Mean ± standard error and range of the physico-chemical parameters
measured in all tanks throughout the experiment.
pH Temp (°C) DO (mg/L)
Mean 7.57 ± 0.01 17.0 ± 0.06 9.41 ± 0.02
Min 7.0 14.0 7.0
Max 8.0 20.0 10.0
Table 6.2: Mean DO between low (SD1) and high (SD2) stocking density, in weeks 4
and 8.
Control BM TWC
DO (mg/L) SD1 SD2 SD1 SD2 SD1 SD2
Week 4 9.42m ± 0.03 9.17n ± 0.09 9.36 ± 0.06 9.26 ± 0.04 9.41 ± 0.06 9.26 ± 0.04
Week 8 9.86m ± 0.09 9.72n ± 0.12 9.78 ± 0.11 9.86 ± 0.12 9.86 ± 0.09 9.78 ± 0.11
Superscript letters m, n indicate significant differences between SD (stocking density) (p<0.05).
The NH3, NO2, NO3, and PO4 concentrations were periodically high during the
experiment (Table 6.3).
Table 6.3: Mean ± standard error and range for nutrient concentrations in all tanks
throughout the experiment.
NH3 (mg/L) NO2 (mg/L) NO3 (mg/L) PO4 (mg/L)
Mean 0.06 ± 0.01 0.68 ± 0.04 11.26 ± 0.36 1.07 ± 0.07
Min <0.01 <0.01 <0.01 <0.01
Max 3.00 5.00 40.00 6.00
In terms of grand means, water quality and bacterial abundance and diversity were
similar between treatments, though NO2 concentration was significantly lower in tanks
with substrate, at SD1 (Table 6.4). In comparison to SD1, SD2 resulted in a significant
increase in the concentration of NH3 in TWC tanks, NO3 in tanks without substrate,
and PO4 in all treatments.

Chapter 6: Comparing two substrates in reducing nutrient loading
92
Table 6.4: Mean ± standard error for water quality and bacteria parameters in all tanks
throughout the experiment (n=24 x no. of samplings).
Variable Control BM TWC
SD1 SD2 SD1 SD2 SD1 SD2
NH3
(mg/L)
0.06 ± 0.02 0.07 ± 0.02 0.05 ± 0.01 0.12 ± 0.04 0.02m ± 0.00 0.05n ± 0.01
NO2
(mg/L)
a0.77 ± 0.11 0.80 ± 0.10 ab0.65 ± 0.10 0.74 ± 0.09 b0.43 ± 0.08 0.67 ± 0.10
NO3
(mg/L)
10.57m ± 0.77 13.94n ± 1.15 11.35 ± 0.79 10.30 ± 0.73 9.62 ± 0.69 11.80 ± 0.96
PO4
(mg/L)
0.69m ± 0.11 1.34n ± 0.21 0.94m ± 0.14 1.72n ± 0.26 0.50m ± 0.08 1.22n ± 0.18
pH 7.57 ± 0.03 7.57 ± 0.03 7.58 ± 0.03 7.57 ± 0.03 7.58 ± 0.03 7.56 ± 0.03
Temp
(°C)
16.98 ± 0.14 17.04 ± 0.14 17.01 ± 0.14 16.88 ± 0.14 16.97 ± 0.14 16.98 ± 0.14
DO
(mg/L)
9.47 ± 0.05 9.33 ± 0.06 9.40 ± 0.06 9.41 ± 0.06 9.48 ± 0.06 9.37 ± 0.06
HPC
(CFU/mLx103)
14.52 ± 2.07 16.88 ± 3.84 13.57 ± 2.11 13.59 ± 2.03 11.64 ± 1.91 18.76 ± 2.95
Bacillus sp.
(CFU/mLx103)
0.64 ± 0.54 0.20 ± 0.06 0.20 ± 0.11 0.03 ± 0.03 0.06 ± 0.03 0.14 ± 0.09
Colony
Diversity
8.25 ± 0.51 8.25 ± 0.72 8.38 ± 0.55 7.36 ± 0.44 7.63 ± 0.18 8.75 ± 0.57
Superscript letters a, b indicate differences between treatment, letters m, n indicate differences between SD
(stocking density) (p<0.05).
6.3.4. Nutrient Concentrations
A two-way ANOVA found significant differences between substrate type and stocking
density in all nutrient concentrations measured (α=0.05). Though no interaction effects
were present for NH3, NO2, or PO4, a significant interaction was found for NO3 (Table
6.5). A repeated measures ANOVA found NH3, NO2, and total PO4 to change
significantly over time (α=0.05). In general, nutrient concentrations were frequently
higher in tanks without substrate, and higher at high stocking density, signifying a
higher rate of nutrient loading.

Chapter 6: Comparing two substrates in reducing nutrient loading
93
Table 6.5: Results of 3-factor mixed model ANOVA on concentrations of NH3, NO2,
NO3, & PO4 with different substrate treatments and stocking densities over 13 weeks.
All factors are fixed. Significant differences at α=0.05 are shown in bold.
df SS F p
NH3
Substrate Type 2 0.209 3.44 0.033
SD 1 0.173 5.68 0.018
Week 10 3.121 10.26 <0.001
ST*SD 2 0.091 1.49 0.227
NO2
Substrate Type 2 5.104 8.75 <0.001
SD 1 1.867 6.40 0.012
Week 12 295.481 84.44 <0.001
ST*SD 2 1.034 1.77 0.171
NO3
Substrate Type 2 178.422 89.21 0.010
SD 1 203.100 203.10 0.001
Week 12 9275.321 772.94 <0.001
ST*SD 2 313.599 156.80 <0.001
PO4
Substrate Type 2 13.971 16.16 <0.001
SD 1 46.189 106.88 <0.001
Week 12 481.641 92.88 <0.001
ST*SD 2 0.271 0.31 0.731
ST=Substrate Type, SD=Stocking Density, SS=sum of squares.
There were weekly fluctuations in the concentration of NH3, and these patterns were
generally similar between treatments, although the scale of fluctuation differed.
Stocking density had no significant effect on the concentration of NH3 in tanks with
BM or control, however NH3 was higher at higher stocking density in TWC tanks after
three weeks. Figure 6.1 compares the effects of substrate on NH3, at different stocking
densities. The NH3 and NO2 levels remained <1.0 mg/L after seven weeks, signifying
that nitrifying bacteria had become established in all tanks.
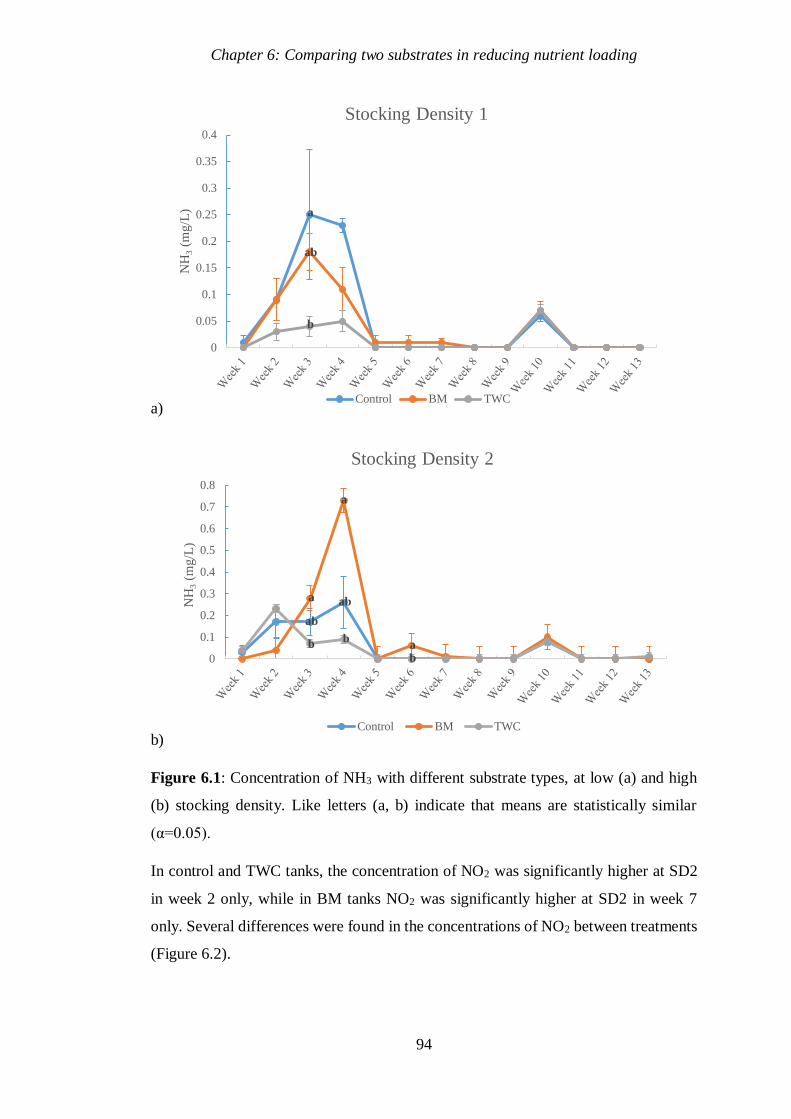
Chapter 6: Comparing two substrates in reducing nutrient loading
94
a)
b)
Figure 6.1: Concentration of NH3 with different substrate types, at low (a) and high
(b) stocking density. Like letters (a, b) indicate that means are statistically similar
(α=0.05).
In control and TWC tanks, the concentration of NO2 was significantly higher at SD2
in week 2 only, while in BM tanks NO2 was significantly higher at SD2 in week 7
only. Several differences were found in the concentrations of NO2 between treatments
(Figure 6.2).
a
ab
b
0
0.05
0.1
0.15
0.2
0.25
0.3
0.35
0.4
NH
3(m
g/L
)
Stocking Density 1
Control BM TWC
ab
aba
a
abb
b0
0.1
0.2
0.3
0.4
0.5
0.6
0.7
0.8
NH
3(m
g/L
)
Stocking Density 2
Control BM TWC

Chapter 6: Comparing two substrates in reducing nutrient loading
95
a)
a)
Figure 6.2: Concentration of NO2 with different substrate types, at low stocking
density (a) and high stocking density (b). Like letters (a, b) indicate that means are
statistically similar (α=0.05).
The concentration of NO3 was not affected by substrate type or stocking density for
the first 8 weeks. The water exchange after four weeks had no significant effect on the
concentration of NO3. NO3 was significantly higher at SD2 than at SD1 several times
throughout the experiment (Figure 6.3). The addition of substrates had a significant
effect on NO3 at SD2, but not at SD1 (Figure 6.4).
aab
b0
0.5
1
1.5
2
2.5
3
3.5
4
NO
2(m
g/L
)
Stocking Density 1
Control BM TWC
aaaa
ab bb0
0.5
1
1.5
2
2.5
3
3.5
4
NO
2(m
g/L
)
Stocking Density 2
Control BM TWC
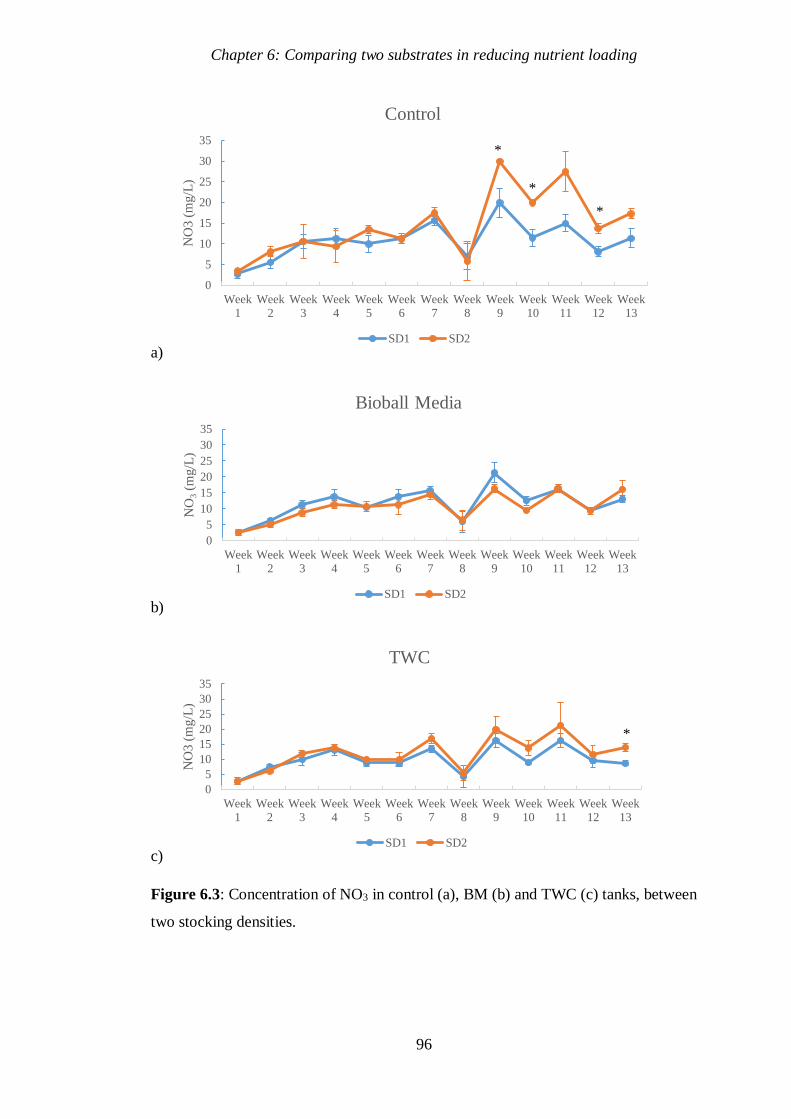
Chapter 6: Comparing two substrates in reducing nutrient loading
96
a)
b)
c)
Figure 6.3: Concentration of NO3 in control (a), BM (b) and TWC (c) tanks, between
two stocking densities.
0
5
10
15
20
25
30
35
Week1
Week2
Week3
Week4
Week5
Week6
Week7
Week8
Week9
Week10
Week11
Week12
Week13
NO
3 (
mg/L
)
Control
SD1 SD2
0
5
10
15
20
25
30
35
Week1
Week2
Week3
Week4
Week5
Week6
Week7
Week8
Week9
Week10
Week11
Week12
Week13
NO
3(m
g/L
)
Bioball Media
SD1 SD2
0
5
10
15
20
25
30
35
Week1
Week2
Week3
Week4
Week5
Week6
Week7
Week8
Week9
Week10
Week11
Week12
Week13
NO
3 (
mg
/L)
TWC
SD1 SD2
*
*
*
*

Chapter 6: Comparing two substrates in reducing nutrient loading
97
a)
b)
Figure 6.4: Concentration of NO3 with different substrate types at low (a) and high (b)
stocking density. Like letters (a, b) indicate that means are statistically similar
(α=0.05).
The concentration of total phosphate steadily increased for the first four weeks, and
then fell after the 90% water exchange, before increasing once more (Figure 6.5;
Figure 6.6). Substrate had a significant effect on PO4 at low stocking density, but not
at high stocking density (Figure 6.6).
0
5
10
15
20
25
30
35N
O3 (
mg/L
)
Stocking Density 1
Control BM TWC
a
a
b
b
b
ab
0
5
10
15
20
25
30
35
NO
3 (
mg
/L)
Stocking Density 2
Control BM TWC
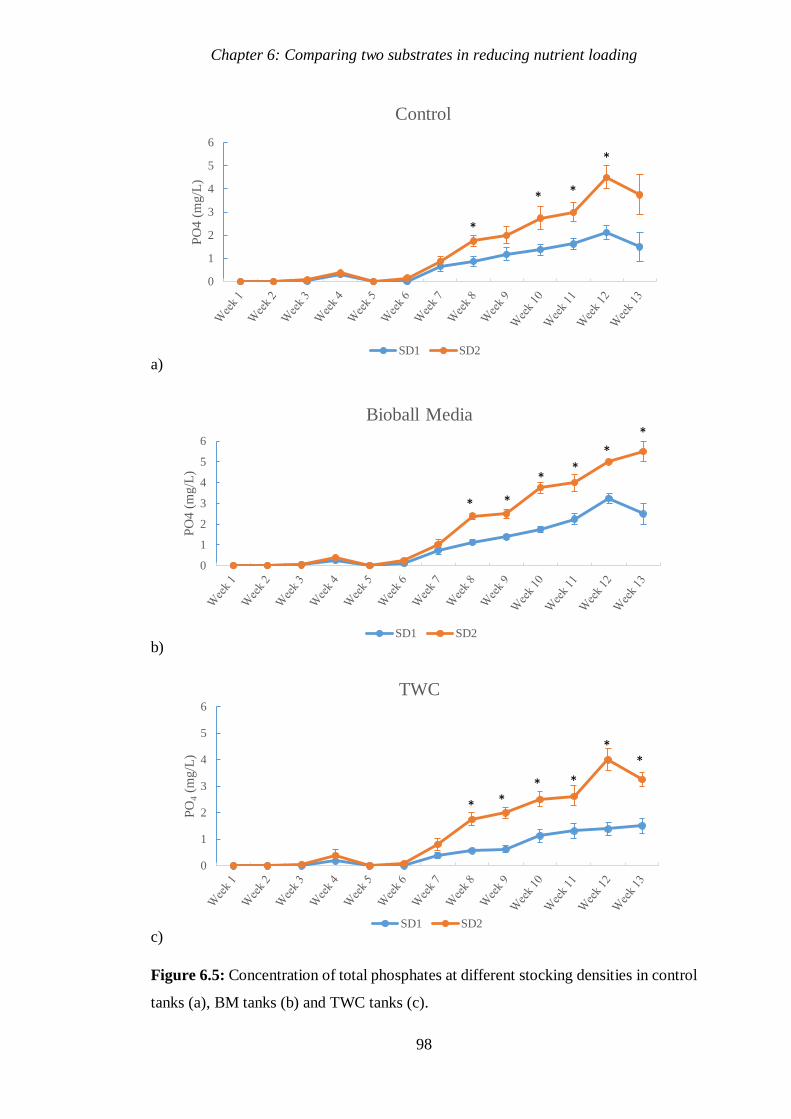
Chapter 6: Comparing two substrates in reducing nutrient loading
98
a)
b)
c)
Figure 6.5: Concentration of total phosphates at different stocking densities in control
tanks (a), BM tanks (b) and TWC tanks (c).
0
1
2
3
4
5
6
PO
4 (
mg/L
)
Control
SD1 SD2
0
1
2
3
4
5
6
PO
4 (
mg
/L)
Bioball Media
SD1 SD2
0
1
2
3
4
5
6
PO
4(m
g/L
)
TWC
SD1 SD2
*
* *
*
* *
* *
*
*
* * * *
* *

Chapter 6: Comparing two substrates in reducing nutrient loading
99
a)
b)
Figure 6.6: Concentration of total phosphates between different substrate types at low
(a) and high (b) stocking density. Like letters (a, b) indicate that means are statistically
similar (α=0.05).
The concentration of orthophosphate mid-experiment, after seven weeks, was
significantly lower in TWC tanks than in BM tanks at SD1 (Figure 6.7).
a
b
b
a
b
0
1
2
3
4
5
6
PO
4(m
g/L
)
Stocking Density 1
Control Bio-balls TWC
0
1
2
3
4
5
6
PO
4(m
g/L
)
Stocking Density 2
Control BM TWC

Chapter 6: Comparing two substrates in reducing nutrient loading
100
Figure 6.7: Concentrations of orthophosphate with different substrates at low and high
stocking density, after seven weeks. Like letters (a, b) indicate that the means are
statistically similar between treatments, an asterisk represents a significant difference
between SD1 and SD2 (α=0.05).
6.3.5. THC and DHC
Initially, the total haemocyte count (THC) and differential haemocyte count (DHC)
were 3.54 ± 0.437 (cells x 106) and 17.50 ± 2.98 (%) respectively, indicating that
marron were in good condition. Throughout the experiment there were no significant
differences between treatments, stocking densities, sexes, or times (Table 6.6). No
strong correlations were found between THC, DHC and any water quality parameters.
The THC of marron in experiment 2 was similar to that of experiment 3, the former
ranging from a mean of 1.13x10⁶ to 4.96x10⁶ in control tanks. The marron THC in
experiment fluctuated more in experiment 2 however.
ab a b
0
0.5
1
1.5
2
2.5
Control BM TWC
Orth
op
hosp
hate
(m
g/L
)
SD1 SD2
* *

Chapter 6: Comparing two substrates in reducing nutrient loading
101
Table 6.6: THC (cells x 106) and DHC (% proportion of granulocytes) between
substrate type and stocking density over time.
Control BM TWC
SD1 SD2 SD1 SD2 SD1 SD2
THC (x106)
Week 3 2.68 ± 0.71 2.53 ± 0.28 2.28 ± 0.37 3.06 ± 0.36 1.91 ± 0.30 3.06 ± 0.67
Week 5 3.95 ± 1.53 2.98 ± 0.24 1.78 ± 0.27 3.05 ± 1.33 2.34 ± 0.40 2.02 ± 0.38
Week 7 2.87 ± 0.72 3.05 ± 0.16 2.74 ± 0.41 2.51 ± 0.38 2.54 ± 0.14 2.22 ± 0.09
Week 9 4.24 ± 1.87 2.98 ± 1.34 3.02 ± 1.11 3.64 ± 1.04 2.39 ± 0.79 2.11 ± 0.37
Week 13 3.11 ± 0.94 2.41 ± 0.38 1.74 ± 0.53 2.20 ± 0.57 2.84 ± 0.47 2.18 ± 0.43
DHC
Week 3 14.3 ± 6.17 18.3 ± 2.06 22.4 ± 2.84 24.4 ±0.90 22.8 ± 3.15 24.1 ± 3.37
Week 5 25.5 ± 2.09 20.6 ± 3.82 25.9 ± 4.41 23.6 ± 3.78 24.6 ± 4.66 22.3 ± 2.46
Week 7 23.0 ± 3.46 24.5 ± 6.50 21.6 ± 1.95 23.0 ± 0.54 28.5 ± 1.62 21.0 ± 1.14
Week 9 - - - - - -
Week 13 20.9 ± 0.47 22.3 ± 2.60 21.6 ± 2.70 22.5 ± 4.13 32.5 ± 4.80 24.5 ± 2.50
6.3.6. Organosomatic Indices
The hepatosomatic condition indices (HM%, Hiw, Hid) were not significantly
different between substrate type or stocking density at the end of experiment.
However, the mean tail moisture content (TM%), wet tail muscle to body ratio (Tbw)
and dry tail muscle to body ratio (Tbd) were not the same (Table 6.7). The tail muscle
may have been in poorer condition in marron in TWC tanks at SD2. The Tbw of
marron was significantly lower at SD2 than at SD1, irrespective of treatment.
Table 6.7: Organosomatic indices of marron at end of experiment 3, after 13 weeks.
Control BM TWC
SD1 SD2 SD1 SD2 SD1 SD2
HM% 77.6 ± 4.18 62.1 ± 2.98 68.4 ± 5.42 62.4 ± 1.73 69.0 ± 2.01 76.1 ± 4.85
TM% 80.1 ± 0.78 78.5a ± 0.44 76.7 ± 1.05 78.5a ± 0.27 79.4 ± 0.51 80.4b ± 0.68
Tbw 32.6 ± 2.17 28.2 ± 1.31 29.9 ± 1.71 30.0 ± 1.18 31.5 ± 1.07 27.5 ± 0.68
Tbd 6.49 ± 0.49 6.06ab ± 0.20 6.09 ± 0.48 6.43a ± 0.29 6.49 ± 0.22 5.38b ± 0.15
Hiw 4.19 ± 0.34 4.43 ± 0.31 4.16 ± 1.08 5.14 ± 1.29 5.50 ± 0.84 4.37 ± 0.66
Hid 0.970 ± 0.24 1.70 ± 0.23 1.38 ± 0.48 1.87 ± 0.40 1.69 ± 0.25 1.02 ± 0.25
Superscript letters a, b indicate differences between treatment (p<0.05).

Chapter 6: Comparing two substrates in reducing nutrient loading
102
6.3.7. Bacteria
Stocking density and substrate type had no significant effect on heterotrophic plate
count (HPC), however there was a fluctuation over time (Table 6.8). Colony diversity
ranged from 4 to 13, and after six weeks was significantly higher at SD1 than SD2 in
BM tanks (10.50 and 8.50 respectively). Bacillus sp. were found in the water column
in tanks with TWC, BM, and without substrate (Plate 6.4). The Bacillus sp. count in
water was not significantly different between treatment or stocking density, due to the
high variability within treatments. HPC and colony diversity were not significantly
different between TWC and BM surfaces, while Bacillus sp. were only found on TWC
surface (Table 6.9). Fungal growth on agar was found in one sample only.
Table 6.8: Heterotrophic Plate Count (HPC) and Bacillus sp. count between treatments
and stocking densities.
Control BM TWC
SD1 SD2 SD1 SD2 SD1 SD2
HPC
(CFU/mLx103)
Week 2 9.3 ± 1.1 6.4 ± 3.3 6.2x ± 2.2 5.8x ± 2.9 8.0 ± 1.5 7.9x ± 2.4
Week 6 16.1 ± 5.4 26.0 ± 8.3 16.7y ± 3.0 18.5y ± 0.6 11.3 ± 3.0 25.7y ± 5.0
Week 11 18.2 ± 1.6 18.3 ± 4.2 17.9y ± 2.8 16.5y ± 2.4 15.6 ± 4.4 22.7y ± 2.2
Bacillus sp.
Week 2 50.0 ± 25.0 75.0 ± 75.0 0.0 ± 0.0 25.0 ± 25.0 0.0 ± 0.0 25.0 ± 25.0
Week 6 50.0 ± 28.9 50.0 ± 50.0 75.0 ± 47.9 0.0 ± 0.0 0.0 ± 0.0 225.0 ± 143.6
Week 11 725.0 ± 692.1 25.0 ± 25.0 125.0 ± 125.0 0.0 ± 0.0 100.0 ± 40.8 0.0 ± 0.0
Superscript letters x, y indicate significant differences between weeks (p<0.05).
Table 6.9: Bacterial plate counts and diversity on different substrates after nine weeks,
n=number of samples analysed.
BM TWC
SD1 (n=1) SD2 (n=1) SD1 SD2
HPC (CFU/cm3) 289.0 478.0 611.0 ± 184.1 520.0 ± 69.8
Bacillus sp. 0.0 0.0 1.5 ± 1.5 2.5 ± 1.0
Colony Diversity 8.0 9.0 8.0 ± 0.6 9.0 ± 1.1

Chapter 6: Comparing two substrates in reducing nutrient loading
103
Plate 6.4: Bacillus sp. stained with crystal violet, at 1000x magnification.
6.3.8. Marron Growth
The specific growth rates (SGR) of marron in this study, Table 6.9, were relatively low
compared to those found by Ambas et al. (2013), ranging from 0.27±0.09 to
0.51±0.35%, and by Nugroho & Fotedar (2013) of 0.19±0.01% in the control group.
The highest SGR for the duration of the study was only 0.11 ± 0.03%. Meanwhile,
there was no significant effect of stocking density on growth. Substrate type and time
both had significant effects on SGR (Table 6.10). The reduction in feeding after the
first month had no significant effect on growth. Marron in control tanks were
significantly larger at SD2 initially and at the end of trial (p<0.05). Moults were not
recorded, therefore no moult increment or moult frequency data are present.

Chapter 6: Comparing two substrates in reducing nutrient loading
104
Table 6.10: Marron specific growth rate (SGR) and mean weight between treatment
and stocking density.
Control BM TWC
SD1 SD2 SD1 SD2 SD1 SD2
SGR
0-30 Days 0.03 ± 0.03 0.04 ± 0.02 x0.02 ± 0.02 0.02 ± 0.01 0.06 ± 0.05 0.08 ± 0.10
30-60 Days 0.13 ± 0.07 0.20 ± 0.11 x0.07 ± 0.03 0.16 ± 0.06 0.19 ± 0.11 0.12 ± 0.07
60-90 Days -0.01 ± 0.02 -0.05a ± 0.04 y0.18 ± 0.23 0.16b ± 0.06 0.08 ± 0.12 0.05ab ± 0.03
0-60 Days 0.08 ± 0.03 0.11 ± 0.06 0.04 ± 0.01 0.09 ± 0.03 0.13 ± 0.04 0.06 ± 0.04
0-90 Days 0.05 ± 0.02 0.06 ± 0.05 0.09 ± 0.08 0.11 ± 0.03 0.11 ± 0.04 0.06 ± 0.03
Mean weight (g)
Initial weight 51.42m ± 2.89 66.60n ± 3.77 53.90 ± 1.45 57.30 ± 4.27 56.30 ± 2.32 66.50 ± 3.85
Final weight 54.05m ± 3.59 69.90n ± 2.23 58.60 ± 3.48 63.60 ± 5.11 62.02 ± 3.18 70.20 ± 4.20
Superscript letters a, b indicate significant differences between treatment, letters m, n indicate differences between
SD, letters x,y indicate differences between monthly SGR (p<0.05).
6.4. Discussion
The concentrations of ammonia, nitrite, nitrate and orthophosphates were significantly
reduced by using The Water Cleanser™ at times where these concentrations peaked
with Bioball® media (BM) or without substrate, while both TWC and BM were
effective in reducing the concentration of nitrate. Substrates and filter media have
previously been effective in improving the water quality of culture systems (Viau et
al. 2012; Thompson et al. 2002; Lezama-Cervantes & Paniagua-Michel 2010; Masłoń
& Tomaszek 2015). The use of substrates with attached biofilm has also been shown
to improve the survival rate of juvenile redclaw crayfish (Cherax quadricarinatus), via
maintenance of good water quality (Viau et al. 2012). High concentrations of
ammonia, nitrite and nitrate are toxic to aquatic animals, including decapod
crustaceans (Jensen 1996; Jensen 2003; Romano & Zeng 2007). However, the
mortality rate of marron in this study was less than 11% overall (~89% survival rate),
and neither substrate type nor stocking density had a significant effect. These factors
can have varied effects on the survival rate; for example Jones et al. (2002) found that
a synthetic substrate (Aquamat®) resulted in no significant improvement of crayfish
(Cherax destructor) survival (86.3% with food and no Aquamat, and 85.0% with food

Chapter 6: Comparing two substrates in reducing nutrient loading
105
and conditioned Aquamat), while Rodgers et al. (2006) found that stocking density
had no effect on the survival rate of juvenile C. quadricarinatus (47.8% at 4/m2 and
44.2% at 6/m2) in earthen ponds. Conversely, Fotedar et al. (1999) showed that
survival rate of juvenile marron in tanks can be significantly lower at a high stocking
density of 13/m2 than at lower stocking densities of 3 and 6/m2. This compares to the
stocking densities of ~7.5 and 14/m2 (adult marron) at SD1 and SD2 in the current
trial. The different densities used, life stage of crayfish, and culture conditions may
explain the disparity in results.
Growth of freshwater crayfish is inversely related to density (Verhoef & Austin 1999;
Mills & McCloud 1983; Mazlum 2007; Morrissy 1979). There was no significant
effect of stocking density or substrate on marron growth in the current trial. The
presence of containers could have lessened the detrimental effects of stocking density
by reducing fighting and competition between marron. Geddes et al. (1988) found that
C. destructor had depressed growth held communally and at high density, compared
with those held individually in containers. Mills & McCloud (1983) attributed lower
growth of C. destructor held communally at high stocking density to aggressive
interactions leading to stunted growth. Water quality also influences growth rate, for
example Björnsson & Ólafsdóttir (2006) showed that growth of finfish (Gadus
morhua) has been linked to deterioration of water quality at high stocking density. In
addition to these factors, the marron growth rate in experiments 2 and 3 was probably
influenced by the different protein concentrations in feed. In both experiments, TWC
had no significant effect on growth, while in this study growth was improved with BM
in the final month, compared to control. This may indicate suppressed growth in
control tanks, probably relating to poor water quality. While SGR was equivalent to
that found by Nugroho & Fotedar (2013) in control tanks after 30-60 days, after 60-90
days no growth was observed in control tanks, indicating a deterioration in water
quality and/or marron health. Poor water quality can induce stress in aquatic animals
(Mazlum 2007), affecting growth. Overall, the marron growth rate was slow, as
compared to other laboratory studies (Ambas et al. 2013; Nugroho & Fotedar 2013).
This may have been due to a lack of filtration, resulting in a build-up of organic matter
and poor water quality, or a lower feeding rate.
The level of dissolved oxygen was higher at the higher stocking density, signifying a
higher biochemical oxygen demand (BOD) (Jouanneau et al. 2014). High feeding

Chapter 6: Comparing two substrates in reducing nutrient loading
106
rates, and the resulting build-up of organic matter, could have increased the BOD
(Morrissy et al. 1986). Tanks with substrates showed no significant difference in DO
levels, indicative of lower concentrations of organic matter, despite the same level of
nutrient loading. The substrates increased habitat availability for microbes, which play
a key role in the decomposition of organic matter (Meyer-Reil 1994), while TWC also
provides hydrocarbon, which can be utilised by certain bacteria as a source of carbon
(Zhou et al. 2009).
Intensive culture of crustaceans requires increased feed inputs, resulting in higher
nutrient loading. NH3-N, NO2-N, total nitrogen and total phosphorous have increased
with increasing stocking density of Kuruma prawns (Marsupenaeus japonicus) (Li et
al. 2013b). And in Recirculating Aquaculture Systems (RAS) with teleost fishes (Lates
calcarifer), total nitrogen and total phosphorous have increased at higher stocking
density (Ardiansyah & Fotedar 2016a). Similarly, the higher stocking density of
marron also increased nutrient concentrations in the current experiment. TWC and the
BM were unable to maintain ammonia, nitrite, and phosphate concentrations at similar
levels between stocking densities, however the effect of density on nitrate
concentrations was reduced. TWC may have enhanced denitrification by providing a
carbon source for bacteria (Robinson et al. 2017).
Heterotrophic bacteria, including Bacillus sp., are effective in the oxidation of
ammonia in aquaculture (Nimrat et al. 2012). The culturing of bacteria on TWC
surface may have been key to its effectiveness in maintaining low ammonia
concentrations during this study. A variety of heterotrophic bacteria, including B.
lecheniformis and B. subtilis, have been described attached to duckweed (Lemna
minor) in an RAS system, contributing to the removal of nutrients (Ardiansyah &
Fotedar 2016b). Similarly, microbial mats have been shown to increase ammonia
oxidation rates in shrimp (Litopenaeus vannamei) culture (Lezama-Cervantes &
Paniagua-Michel 2010). Microscopy suggests that TWC cultures primarily
heterotrophic bacteria and various microbes (Personal observations). The BM, when
placed in a sequencing batch reactor, has been used in the removal of ammonium via
nitrification (Masłoń & Tomaszek 2015). However, when placed freely in tanks in the
current experiment, the concentration of ammonia rose to higher levels with BM than
with TWC or without substrate.

Chapter 6: Comparing two substrates in reducing nutrient loading
107
TWC resulted in the highest rates of nitrite oxidation, in weeks 5, 6, and 8, probably
due to the addition of a carbon source. Carbon sources can be limiting in aquaculture
systems, resulting in incomplete denitrification and accumulation of nitrite (Hamlin et
al. 2008). Increased denitrification would have removed nitrogen from the system, as
nitrogen gas and nitrous oxide (Wang et al. 2011). Substrates often have varied results
on nutrient concentrations, for example substrates with attached biofilm have been
used to reduce nutrient concentrations in C. quadricarinatus culture (Viau et al. 2012),
whereas in a similar study substrates increased the nitrite concentration compared to
control, perhaps due to enhanced ammonia oxidation (Bratvold & Browdy 2001). In
another study, biofilm attached to substrate increased the concentrations of nitrite and
nitrate compared to the control, due to a greater release of nitrite than ammonium
(Thompson et al. 2002), while microbial mats can have a similar effect (Lezama-
Cervantes et al. 2010). TWC may function differently, by increasing the rate of
denitrification with the addition of a carbon source.
TWC reduced the concentration of orthophosphates mid-experiment, attributed to the
development of bacterial biomass, however the concentration of total phosphate was
not reduced. Density effects were also more evident for total phosphate than
orthophosphate in TWC tanks, while the increase in nutrient inputs led to an increase
in orthophosphate in BM and control tanks. This same effect on orthophosphate was
found in experiments 1 & 2, and in the field trial, probably due to an increased rate of
conversion of orthophosphate into polyphosphate, by bacteria. Bacteria attached to
TWC may include polyphosphate accumulating organisms, which play a key role in
phosphate removal (Masłoń & Tomaszek 2015). As polyphosphates are stored in
sediments and soils, the lack of sediment may have limited polyphosphate deposition
(Kirchman 2012). Moreover, the biomass of polyphosphate accumulating organisms
may have been too low to contain the high amounts of phosphates in intensive culture
(Wang et al. 2011; Lananan et al. 2014). Substrate can be effective bioremediators of
total phosphate, however. In one study, biofilm attached to substrate was used to
remove 33% of phosphorous in an aquaculture system (Thompson et al. 2002). BM in
a filtration system has also been used to remove phosphorous (Masłoń & Tomaszek
2015). The use of TWC and BM within filters, or in areas of greater water flow, may
improve phosphate reduction. In this study, BM was the least effective treatment in
reducing phosphates, as it hampered removal of excess feed. Research has shown

Chapter 6: Comparing two substrates in reducing nutrient loading
108
substrates to be ineffective in reduction of orthophosphate in certain aquaculture
systems, including biofloc (Schveitzer et al. 2013), largely due to the high microbial
biomass in the water column. In experiment 2 the concentrations of nutrients remained
lower than in experiment 3, due to the large biomass of phytoplankton present. High
nutrient loading did not cause a significant stress response of marron in either
experiment.
THC and DHC are indicators of stress response, health and immunity of crustaceans,
including marron (Sang et al. 2009; Nugroho & Fotedar 2014; Ambas et al. 2013; Le
Moullac & Haffner 2000). The THC and DHC of marron were not significantly
affected by substrate type or nutrient loading. TWC had no significant ill effects on
the haemolymph of marron, similar to the results of Chapter 4. In contrast to findings
from previous studies (Le Moullac & Haffner 2000; Jensen 1996; Yildiz & Benli
2004), elevated concentrations of ammonia (1mg/L), nitrite (3mg/L), nitrate, and
phosphates did not have any acute toxic effects on marron, as determined by THC and
DHC. However, the high nutrient loading may have caused chronic toxicity, as
determined by the organosomatic indices. Marron in tanks with TWC held at high
density were in poor physiological condition at the end of the experiment; determined
by the high tail muscle moisture content and low Tbd. The organosomatic indices have
been used as measures of physiological response in marron (Ambas et al. 2013). High
stocking density also resulted in low Tbw irrespective of treatment, indicating poor
physiological condition and stress (Sang & Fotedar 2004). TWC itself was unlikely to
have caused loss of physiological condition, as no effect was present at low stocking
density. While bacterial populations attached to TWC were diverse, any pathogenic
bacteria present would face competition with less pathogenic species, and can be
controlled by protozoa through grazing (Thompson et al. 2002). Ambas et al. (2013)
found that application of probiotics improved physiological condition of marron, yet
TWC had no similar effect, despite harbouring Bacillus sp. Nutrient concentrations
fluctuated to periodically high levels, although no acute toxic effects were found on
marron. The results suggest that there were some chronic toxic effects at higher
stocking density, which neither substrate was able to mitigate.
Populations of heterotrophic bacteria, including Bacillus sp., developed on the surface
of TWC. Bacteria are important in the control of ammonia, nitrite, nitrate and
phosphate in water (Schveitzer et al. 2013; Thompson et al. 2002; Browdy & Hopkins

Chapter 6: Comparing two substrates in reducing nutrient loading
109
1995), and play an important role in nutrient cycling and decomposition (Anderson et
al. 1987, Sorokin 1999, Kirchman 2012). Bacterial abundance is also related to system
function (Ray et al. 2010). The increase in bacterial abundance in the water column of
marron tanks was triggered by a build-up of nutrients and organic matter, while the
higher nutrient inputs at SD2 resulted in higher bacterial abundance than at SD1.
Populations of heterotrophic bacteria and periphyton within the biofilm are highly
dependent on nutrient availability (Pradeep et al. 2004; Pandey et al. 2014).
Meanwhile, biofilm on TWC surface differed greatly to that on BM, and Bacillus sp.
was only present on TWC biofilm, probably due to the provision of a carbon source in
this substrate.
6.5 Conclusions
The concentrations of ammonia, nitrite, nitrate and orthophosphate were periodically
reduced in tanks with TWC compared to tanks without substrate, while BM reduced
the concentration of nitrate only. In addition, the BM and TWC both resulted in a
lessened effect of density on nitrate concentrations and dissolved oxygen levels. TWC
was also a suitable substrate for the growth of Bacillus sp. However, the concentration
of total phosphate was not reduced by either treatment, and increased at higher
stocking density in all treatments. There was no improvement in the survival or growth
of adult marron with TWC. Furthermore, the THC, DHC and organosomatic indices
of marron were not improved with TWC or BM, and Tbw was negatively impacted by
high stocking density. Even so, no negative effects on marron were present with the
use of substrates. This study shows that TWC may be placed freely in tank culture to
reduce concentrations of ammonia, nitrite, nitrate and orthophosphate, and to reduce
the effects of high stocking density on water quality, with no negative effects on
marron growth, survival, or physiological condition.

Chapter 7: General Discussion
Chapter 7 presents a general discussion of the study. Here the findings of the three
laboratory experiments and the field experiment are compared and summarised. The
main conclusions of the effects of The Water Cleanser™ on water quality, microbial
ecology, natural productivity and marron health and productivity are given, followed
by recommendations for further research, summarised in Figure 7.1.

Chapter 7: General Discussion
111
7.1 Introduction
Substrates have been used in aquaculture to promote microbial growth, improve water
quality and affect the growth and survival of cultured animals (Viau et al. 2012;
Bratvold & Browdy 2001; Thompson et al. 2002; Schveitzer et al. 2013). Maintaining
good water quality is crucial for the health, survival and growth performance of all
crustaceans (Smith et al. 2002; Stumpf et al. 2014). The Water Cleanser™ (TWC) is
thought to provide a habitat and carbon source for heterotrophic bacteria, including
those important in the improvement of water quality (Marine Easy Clean 2015).
However, no peer-reviewed research has investigated the effects of oil-based
substrates, such as TWC, in aquaculture.
This study investigated the effects of TWC on water quality (Chapter 3, 4, 5, & 6;
Objective 2), natural productivity (Chapter 4 & 5; Objective 2), marron growth and
health (Chapter 4, 5 & 6; Objective 2 & 3), and bacterial abundance and diversity of
colony types (Chapter 3, 4, 5 & 6; Objective 1) in marron culture. The impact of TWC
on water quality, bacteria and marron at different stocking densities was assessed
(Chapter 6; Objective 3), and the relationships between nutrient concentrations,
phytoplankton, zooplankton, bacteria and marron health and productivity were studied
(Chapter 3, 4 & 5, Objective 4). The conditions of each experiment in these chapter,
and the main findings, are summarised in Figure 7.1.
The results of this study suggest that TWC provides habitat for a high abundance of
heterotrophic bacteria, including Bacillus sp., and therefore may function differently
from previously used substrates. Bacillus sp. are associated with good water quality
(Wang et al. 2005), and health of marron (Ambas et al. 2013), however they require a
carbon source for processes including denitrification (Hamlin et al. 2008). An oil-
based substrate such as TWC would provide a carbon source in the form of
hydrocarbon (Hu et al. 2017; Sakthipriya et al. 2015), and therefore promote the
growth of denitrifying bacteria. Bacteria are known to affect the water quality and
natural productivity of aquatic systems (Wang et al. 2015; Zhou et al. 2009), are
essential in aquaculture for removal of excess nitrogen and phosphorous, and are key
components of the nitrogen, phosphorous and carbon cycles (Sorokin 1999). Bacteria
also play a major role in recycling nutrients locked in organic matter to stimulate
primary productivity (Moriarty 1997). High concentrations of ammonia and nitrite can

Chapter 7: General Discussion
112
cause physiological problems for aquatic animals, including crayfish (Jensen 1996;
Harris 2001; Jussila & Evans 1996). In marron ponds, poor water quality can adversely
affect marron (Morrissy et al. 1984), while eutrophication can trigger algal blooms
(Seymour 1980). However, nutrients are required for promoting phytoplankton and
zooplankton communities, to provide a natural food source for crayfish, especially for
juveniles (Jones 1995). Freshwater crayfish are known to feed on both artificial feed
and natural sources of feed including macrophytes, benthic invertebrates, zooplankton,
algae and detritus (Saoud et al. 2012). The culture environment and in turn the health,
survival and growth of marron could be impacted by the addition of an oil-based
substrate, such as TWC.

Chapter 7: General Discussion
113
Figure 7.1: Summary diagram of the study, showing the different objectives and
conditions in each Chapter, as illustrated in Figure 1.1. The main findings of each
experiment are summarised, and the main recommendations for further research given.
Chapter 3
-Experiment 1
-Laboratory
-Indoor
-Nutrients added
-No marron or plankton
-Treatment: TWC,
TWC+, probiotic
-Efficacy in removal of N
& P?
Chapter 4
-Experiment 2
-Laboratory
-Outdoor
-Nutrients added
-Marron and phytoplankton
-Treatment: TWC, probiotic,
combination
-What are the effects on
water quality, marron,
bacteria and phytoplankton?
Chapter 5
-Field experiment
-Commercial marron
ponds
-Marron, phytoplankton
and zooplankton
-Treatment: TWC, pond
age
-What are the effects in
pond culture?
Chapter 6
-Experiment 3
-Laboratory
-Indoor
-No nutrients added
-Marron, no plankton
-2 stocking densities
-Treatment: TWC, Bioball
Media
-Efficacy of substrates in
reducing nutrient loading?
Chapter 3
-TWC, TWC+ reduced
nitrite, nitrate,
orthophosphate
-Probiotic reduced
ammonia
-Thick layer of Biofilm
grew on TWC surface
-No significant effect on
bacterial abundance in
water
Chapter 4
-No significant effects of TWC
or probiotic on nutrient
concentrations
-The combination (TWC+B)
reduced nutrient
concentrations
-Biofilm grew on TWC
surface, Bacillus sp. found on
TWC surface where added
-No detrimental effects on
phytoplankton, marron
Chapter 5
-TWC reduced
orthophosphate
-Pond age had a significant
effect
-TWC improved final
biomass of juveniles in old
ponds
-Biofilm grew on TWC
surface
-no detrimental effects on
zooplankton
Chapter 6
-TWC reduced ammonia,
nitrite, nitrate,
orthophosphate
-Bioball Media reduced
nitrate
-Higher stocking density
increased nutrient loading
-No significant effects on
marron growth
-no detrimental effects of
TWC on marron in indoor
tank culture
Effects of TWC in bioremediation of marron
culture Effects on water quality, plankton, bacteria and marron under different conditions
Main Findings
TWC can be used for bioremediation Effects differ based on conditions
Heterotrophic bacteria grow on TWC, but no significant effect on bacterial abundance of water column
No detrimental effects on plankton, marron TWC can promote growth of Bacillus sp.
Future Research? -Marron survival rate and health -Different effects on different life stages
-Microbial composition on TWC -TWC Biofilm as a source of nutrition - TWC as a carbon source

Chapter 7: General Discussion
114
7.2 Effects of TWC on Water Quality
The Water Cleanser™ affected the water quality in all of the experiments, including
the field experiment. In the first experiment (Chapter 3), TWC and TWC+ significantly
reduced nitrite, nitrate and orthophosphate compared to aquaria without treatment.
TWC had a greater bioremediation effect than in following experiments, likely because
it was conducted under controlled conditions, with limited variables. The temperature
was also higher on average than in the second experiment (Chapter 4), with low
fluctuations in temperature compared to outdoor laboratory conditions. The mean
temperature in the third experiment of 17.0 ± 0.06°C was also higher than in the second
experiment, and it was under controlled conditions. The temperatures in the second
experiment were often lower than the optimum temperature for nitrification for
nitrifying bacteria and several Bacillus strains (Song et al. 2011; Hargreaves 1998).
The controlled conditions with higher temperatures in the first and third experiment
likely allowed for increased efficiency of the substrate compared to the second
experiment. In the second experiment (Chapter 4), held in outdoor conditions,
concentrations of nitrite and nitrate were similar between treatments. The high
abundance of microalgae could have led to enhanced phytoremediation (Lananan et
al. 2014), as suggested by the lower concentrations of NO3-N in experiment 2 and the
field experiment (Table 7.1), which may have also limited the effect of TWC on
nutrient concentrations. Meanwhile, in the third experiment (Chapter 6), TWC
maintained lower concentrations of ammonia, nitrite and nitrate compared to tanks
without substrate, while Bioball Media (BM) reduced concentrations of nitrate only.
Increasing stocking density increased the rate of nutrient loading both with and without
substrates. TWC reduced concentrations of nitrite and nitrate in experiments 1 and 3,
and reduced the concentration of ammonia in experiment 3 only. It is possible that the
addition of NH4Cl in experiment 1 reduced the rate of biofilm growth initially, as
shown in biofilm bioreactors (Singh et al. 2013), reducing the rate of ammonia
oxidation. In the field experiment (Chapter 5), there were no significant effects of
TWC on concentrations of ammonia, nitrite, or nitrate. The lower nutrient
concentrations in ponds may account for this (Table 7.1). In all experiments, the
control treatment had no addition of substrate or probiotic, though conditions differed
in each experiment. The indoor conditions varied to that of the outdoor culture largely
because of the high abundance of microalgae in the outdoor culture, while the marron
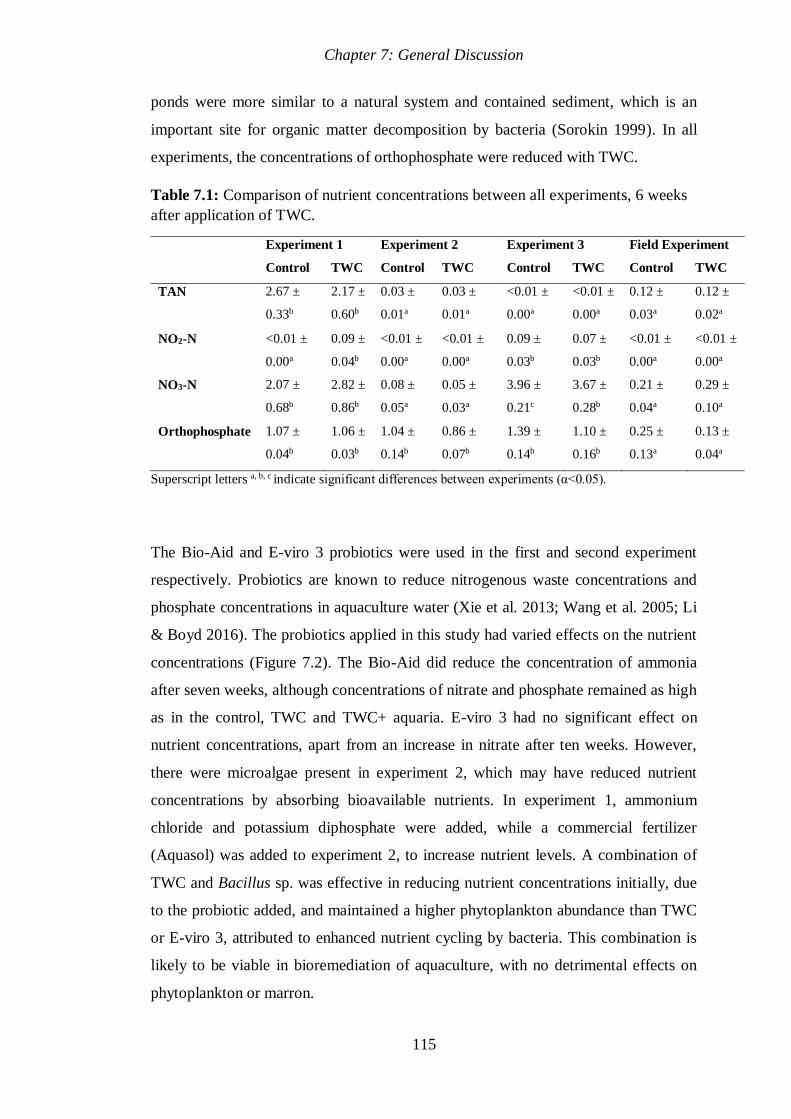
Chapter 7: General Discussion
115
ponds were more similar to a natural system and contained sediment, which is an
important site for organic matter decomposition by bacteria (Sorokin 1999). In all
experiments, the concentrations of orthophosphate were reduced with TWC.
Table 7.1: Comparison of nutrient concentrations between all experiments, 6 weeks
after application of TWC.
Experiment 1 Experiment 2 Experiment 3 Field Experiment
Control TWC Control TWC Control TWC Control TWC
TAN 2.67 ±
0.33b
2.17 ±
0.60b
0.03 ±
0.01a
0.03 ±
0.01a
<0.01 ±
0.00a
<0.01 ±
0.00a
0.12 ±
0.03a
0.12 ±
0.02a
NO2-N <0.01 ±
0.00a
0.09 ±
0.04b
<0.01 ±
0.00a
<0.01 ±
0.00a
0.09 ±
0.03b
0.07 ±
0.03b
<0.01 ±
0.00a
<0.01 ±
0.00a
NO3-N 2.07 ±
0.68b
2.82 ±
0.86b
0.08 ±
0.05a
0.05 ±
0.03a
3.96 ±
0.21c
3.67 ±
0.28b
0.21 ±
0.04a
0.29 ±
0.10a
Orthophosphate 1.07 ±
0.04b
1.06 ±
0.03b
1.04 ±
0.14b
0.86 ±
0.07b
1.39 ±
0.14b
1.10 ±
0.16b
0.25 ±
0.13a
0.13 ±
0.04a
Superscript letters a, b, c indicate significant differences between experiments (α<0.05).
The Bio-Aid and E-viro 3 probiotics were used in the first and second experiment
respectively. Probiotics are known to reduce nitrogenous waste concentrations and
phosphate concentrations in aquaculture water (Xie et al. 2013; Wang et al. 2005; Li
& Boyd 2016). The probiotics applied in this study had varied effects on the nutrient
concentrations (Figure 7.2). The Bio-Aid did reduce the concentration of ammonia
after seven weeks, although concentrations of nitrate and phosphate remained as high
as in the control, TWC and TWC+ aquaria. E-viro 3 had no significant effect on
nutrient concentrations, apart from an increase in nitrate after ten weeks. However,
there were microalgae present in experiment 2, which may have reduced nutrient
concentrations by absorbing bioavailable nutrients. In experiment 1, ammonium
chloride and potassium diphosphate were added, while a commercial fertilizer
(Aquasol) was added to experiment 2, to increase nutrient levels. A combination of
TWC and Bacillus sp. was effective in reducing nutrient concentrations initially, due
to the probiotic added, and maintained a higher phytoplankton abundance than TWC
or E-viro 3, attributed to enhanced nutrient cycling by bacteria. This combination is
likely to be viable in bioremediation of aquaculture, with no detrimental effects on
phytoplankton or marron.

Chapter 7: General Discussion
116
Figure 7.2: Effects of different probiotics on the reduction of nutrient concentrations
in two experiments (n=3), after one week, following a period when the probiotics were
most active. Different letters indicate significant differences between treatments
(α=0.05). Significant reductions in concentrations of TAN in experiment 2, and NO3-
N and PO4 in experiment 1, were not found. Error bars = Standard error of mean.
7.3 Effects of TWC on Phytoplankton and Zooplankton Communities
TWC had no positive or negative effects on plankton communities, though it likely
contributed to natural productivity to some extent by providing biofilm. Meanwhile,
TWC combined with Bacillus sp. increased the abundance of phytoplankton. The
added Bacillus sp. may have enhanced nutrient cycling, thereby preventing collapse of
the phytoplankton community after the initial consumption of nutrients. In another
study, Bacillus sp. and Lactobacillus sp. added to shrimp RAS increased the
abundance of Chlorophyta (De Paiva-Maia et al. 2013). Bacillus sp. can also play an
important role in nutrient cycling in shrimp (Penaeus vannamei) ponds (Wang & He
2009). Bacteria produce extracellular enzymes, which are important in the
environment for the degradation of macromolecular compounds in organic matter
(Wang & He 2009). Further research could investigate to what extent TWC enhances
the degradation of organic matter.
A B AA B A
-40
-20
0
20
40
60
80
100
120
Control Bio-Aid Control TWC+B E-viro3
Exp1 Exp1 Exp2 Exp2 Exp2Red
ucti
on
in
Nu
trie
nt
Con
cen
trati
on
s (%
)
TAN NO3-N PO4

Chapter 7: General Discussion
117
The phytoplankton and zooplankton abundance was not significantly affected by TWC
in tank or pond culture, suggesting that TWC and attached biofilm did not inhibit or
promote plankton growth. Artificial substrates often have limited effects on plankton
communities. For example, Schveitzer et al. (2013) found that gross primary
production was not affected by the use of substrates. Substrates can actually have a
negative effect, where lower concentrations of chlorophyll a in water can be present
in tanks with substrates than without (Schveitzer et al. 2013), while substrates can also
result in lower phytoplankton biomass (Bratvold & Browdy 2001). These results were
largely due to competition for nutrients between phytoplankton in the water column
and algae growing on substrates. The results of experiment 2 and the field experiment
did not show any strong competitive effect between the phytoplankton and the
microbes growing on TWC. There is limited research investigating the effects of
substrates on zooplankton, though attached periphyton can include zooplankton such
as rotifers, copepods, ciliates and cladocerans (Santhana Kumar et al. 2017).
Cladocerans and copepods are an important component of the diet of juvenile crayfish
(Jones 1995). Increased periphyton growth on the surface of TWC could potentially
provide a complementary food source for marron. In pond culture marron growth may
be affected, where TWC could provide a complementary food source as biofilm
(Personal observations).
7.4 Effects of TWC on Marron Health, Growth and Survival
In the laboratory experiments, there were no significant differences in the growth rate
of marron following application of TWC or probiotics. In another study, Ambas et al.
(2013) found no effects of growth rate with the use of a probiotic (varied species) in
marron diet. Marron growth can be relatively slow under laboratory conditions (Ambas
et al. 2013; Nugroho & Fotedar 2013). In experiment 3, stocking density had no effect
on marron growth, while SGR was similar between experiment 3 at SD2 (at 908.4g/m2
or 15/m2) and experiment 2 (at 568g/m2 or 11/m2), despite the higher stocking density
at SD2 (Table 7.2). Containers were present in experiment 3 however, limiting fighting
and competition between marron. The SGR of marron was significantly higher in
ponds than in laboratory conditions without substrate, partly due to the different
culture conditions (Figure 7.1), while growth was similar between ponds and
laboratory conditions with TWC (Table 7.2). Therefore, TWC may have had an
indeterminate effect on marron growth rate.
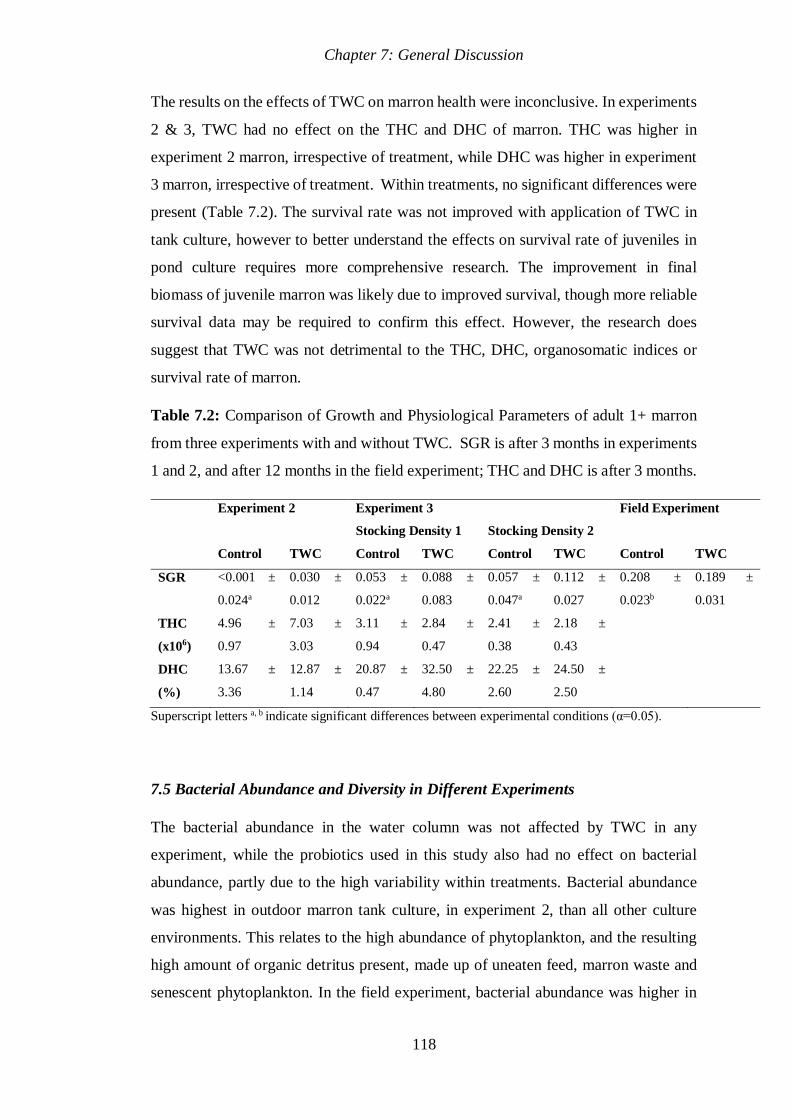
Chapter 7: General Discussion
118
The results on the effects of TWC on marron health were inconclusive. In experiments
2 & 3, TWC had no effect on the THC and DHC of marron. THC was higher in
experiment 2 marron, irrespective of treatment, while DHC was higher in experiment
3 marron, irrespective of treatment. Within treatments, no significant differences were
present (Table 7.2). The survival rate was not improved with application of TWC in
tank culture, however to better understand the effects on survival rate of juveniles in
pond culture requires more comprehensive research. The improvement in final
biomass of juvenile marron was likely due to improved survival, though more reliable
survival data may be required to confirm this effect. However, the research does
suggest that TWC was not detrimental to the THC, DHC, organosomatic indices or
survival rate of marron.
Table 7.2: Comparison of Growth and Physiological Parameters of adult 1+ marron
from three experiments with and without TWC. SGR is after 3 months in experiments
1 and 2, and after 12 months in the field experiment; THC and DHC is after 3 months.
Experiment 2 Experiment 3 Field Experiment
Stocking Density 1 Stocking Density 2
Control TWC Control TWC Control TWC Control TWC
SGR <0.001 ±
0.024a
0.030 ±
0.012
0.053 ±
0.022a
0.088 ±
0.083
0.057 ±
0.047a
0.112 ±
0.027
0.208 ±
0.023b
0.189 ±
0.031
THC
(x106)
4.96 ±
0.97
7.03 ±
3.03
3.11 ±
0.94
2.84 ±
0.47
2.41 ±
0.38
2.18 ±
0.43
DHC
(%)
13.67 ±
3.36
12.87 ±
1.14
20.87 ±
0.47
32.50 ±
4.80
22.25 ±
2.60
24.50 ±
2.50
Superscript letters a, b indicate significant differences between experimental conditions (α=0.05).
7.5 Bacterial Abundance and Diversity in Different Experiments
The bacterial abundance in the water column was not affected by TWC in any
experiment, while the probiotics used in this study also had no effect on bacterial
abundance, partly due to the high variability within treatments. Bacterial abundance
was highest in outdoor marron tank culture, in experiment 2, than all other culture
environments. This relates to the high abundance of phytoplankton, and the resulting
high amount of organic detritus present, made up of uneaten feed, marron waste and
senescent phytoplankton. In the field experiment, bacterial abundance was higher in

Chapter 7: General Discussion
119
old ponds, where nutrient concentrations were high, than new culture ponds. The
results suggest that although not increasing overall abundance, addition of TWC
increases Bacillus sp. numbers in marron ponds, while addition of Bacillus sp. can
maintain a continued population on TWC surface. This could be caused by TWC
supplying a carbon source, as Bacillus sp. are known to thrive with the presence of a
carbon source, and require one for many functions, such as denitrification (Hu et al.
2017; Robinson et al. 2017).
Heterotrophic plate counts revealed that high bacterial populations were inhabiting the
surface of TWC in all experiments. Plate counts were high on TWC and BM surfaces
in experiment 3, with no differences found between plate counts from different tank
environments or substrate types (Figure 7.3). Various microorganisms, including
protozoans, were found on TWC surface, which may have affected populations of
heterotrophic bacteria through grazing (Thompson et al. 2002). Autotrophic bacteria,
such as Nitrosomonas sp. and Nitrobacter sp., cyanobacteria, and microalgae on the
surfaces were not extensively studied here, though research could investigate if these
microbes are present on oil-based substrates.
Microbial mats (Lezama-Cervantes & Paniagua-Michel 2010), and other substrates
with attached biofilm have previously been used for bioremediation (Da Silva et al.
2008; Pandey et al. 2014; Schveitzer et al. 2013; Viau et al. 2012). In the current study,
the oil-based substrates (TWC, TWC+) had attached biofilm and microorganisms
therein, the composition of which largely depended on the environment and nutrient
concentrations. The taxonomic composition and biomass of periphyton is often
dependent on nutrient availability (Lu et al. 2016). The bacteria and biofilm attached
to TWC was promoted by the nutrient inputs in experiments 1, 2 and 3. In experiments
1 and 3, where nutrient concentrations were high, a thick layer of biofilm was present
(observations), while in experiment 2 where nutrient concentrations were low, thin
layer of biofilm was present (observations). The biofilm on TWC in experiment 2
contained microalgae, as determined by microscopy, though it is unclear whether algal
growth was enhanced by the substrate. The composition of biofilm attached to TWC
in marron ponds also differed. Overall, the substrate provided a suitable habitat for
various heterotrophic bacteria, and promoted the growth of a diverse biofilm.

Chapter 7: General Discussion
120
Figure 7.3: Comparison of bacterial abundance on the surface of TWC in experiment
2 (n=6) and TWC (n=8) and BM (Bioball Media) (n=3) in experiment 3. Error
bars=standard error of mean.
7.6 Conclusions
This study shows that, The Water Cleanser™ influences the concentrations of
ammonia, nitrite and nitrate, particularly under laboratory conditions, and reduces
concentrations of orthophosphate in tank and pond culture (Figure 7.1). The substrate
used in this study can be an effective bioremediator of marron culture. TWC can also
provide a habitat for microbes, promoting the growth of heterotrophic bacteria
including Bacillus species, however may not have a significant effect on bacterial
abundance in the water column. From this study, it can be concluded that TWC can
improve the growth of juvenile marron, with no detrimental effects to marron,
phytoplankton or zooplankton. Here are the main findings:
TWC, TWC+ and TWC+B were effective in reducing concentrations of
orthophosphate. Both TWC and the probiotics used reduced the concentrations
of nitrogenous metabolites under certain conditions.
TWC was more effective in bioremediation than BM. TWC and BM both
reduced the effects of density on concentrations of NO3.
0
100
200
300
400
500
600
700
800
TWC TWC BM
Chapter 4 Chapter 6 Chapter 6
Ba
cte
ria
l a
bu
nd
an
ce o
n s
urfa
ce
(CF
U/c
m3
)

Chapter 7: General Discussion
121
There were no discernible effects of any treatment on the bacterial abundance
in the water column.
TWC had no detrimental effects on natural productivity, while TWC+B
increased the abundance of phytoplankton.
TWC had no significant effects on the growth rate, survival rate or
haemolymph physiology of adult marron under laboratory conditions, however
it increased the final biomass of juvenile marron in old culture ponds.
Nutrient concentrations, turbidity, bacterial abundance and natural productivity
were periodically higher in old ponds than new ponds.
TAN was negatively correlated with THC, phytoplankton abundance was
positively correlated with pH, but negatively with TAN and NO3. There was a
relationship found between phytoplankton abundance and zooplankton species
richness, but not abundance. Experimental units with higher concentrations of
orthophosphate generally had a higher diversity of bacteria.
7.7 Recommendations for Further Research
Throughout this thesis, numerous possible avenues for further research have been
identified. Oil-based substrates are a relatively new topic in the field of aquaculture,
with little known so far. The findings of this thesis would suggest the following for
assessing the performance of substrates, including TWC, in improving water quality
in marron aquaculture:
The bio-availability of the oils present in TWC and other oil-based substrates
as a carbon source for heterotrophic bacteria should be evaluated further.
The mechanisms responsible for any improvement in marron health, growth or
survival could be further studied, including changes in microbial composition,
whether biofilm attached to TWC can be a viable source of nutrition, and
different effects on different life stages (e.g. juvenile, grow-out).

Chapter 7: General Discussion
122
More research is required to determine differences in quantity and quality of
bacteria cultured on the oil-based substrates compared to wooden substrates
(e.g. bamboo), Bioball Media®, Aquamat®, microbial mats, and polyethylene
substrates.
A sample was drilled inside of TWC to detect bacteria but produced no aerobic
or anaerobic growth. The inside of TWC is thought to contain numerous
capillaries, though no electron microscopy was carried out in this study to
confirm this. Further research could investigate the internal structure of TWC
and whether any microbes are present.
The role of nutrient concentrations and sources of nutrients on microbial
composition and biomass on TWC could be investigated.
Further research could investigate the effects of different bacterial species
assemblages on bioremediation using TWC and similar oil-based substrates.

123
References
(2015) ‘Enhancing nature to clean and restore nature’, the Water Cleanser by Marine
Easy Clean; Booklet. From: www.thewatercleanser.com.au
(2016) ‘The new way of thinking; restoration via bio-stimulation’, the Water Cleanser
by Marine Easy Clean; Booklet. From: www.thewatercleanser.com.au
ABARE (Australian Bureau of Agricultural and Resource Economics). 2003.
Australian aquaculture industry profiles for selected species eReport 03.8.
Commonwealth of Australia, Canberra.
Abdel-Tawwab, M. (2008). Effect of free-floating macrophyte, Azolla pinnata on
water physico-chemistry, primary productivity, and the production of nile
tilapia, Oreochromis niloticus (L.), and common carp, Cyprinus carpio L., in
fertilized earthen ponds. Journal of Applied Aquaculture, 18(1), 21-41.
Abu Hena, M. K., & Hishamuddin, O. (2014). Zooplankton community structure in
the tiger shrimp (Penaeus monodon) culture pond at Malacca, Malaysia.
International Journal of Agriculture and Biology, 16(5), 961–965.
Ackerfors, H. E. G. (2000). Freshwater crayfish farming technology in the 1990s : a
European and global perspective. Fish and Fisheries, 1, 337-359.
Acou, A., Rivot, E., Van Gils, J. A., Legault, A., Ysnel, F. & Feunteun, E. (2011).
Habitat carrying capacity is reached for the European eel in a small coastal
catchment: Evidence and implications for managing eel stocks. Freshwater
Biology, 56(5), 952–968.
Affan, A., Jewel, A. S., Haque, M., Khan, S., & Lee, J. (2005). Seasonal cycle of
phytoplankton in aquaculture ponds in Bangladesh. Algae, 20(1), 43–52.
https://doi.org/10.4490/ALGAE.2005.20.1.043
Ahern, M. D., & Morris, S. (1999). Respiratory, acid – base and metabolic responses
of the freshwater crayfish Cherax destructor to lead contamination.
Comparative Biochemistry and Physiology Part A: Molecular & Integrative
Physiology, 124(1999), 105–111.
Ahmad, I., Babitha Rani, A. M., Verma, A. K., & Maqsood, M. (2017). Biofloc
technology: an emerging avenue in aquatic animal healthcare and nutrition.
Aquaculture International, 25, 1215–1226. https://doi.org/10.1007/s10499-016-
0108-8
Aji, L. P. (2012). Metabolic rate of Cherax quadricarinatus. Jurnal Penelitian Sains,
15(1D), 31–34.
Allan, G. L., Moriarty, D. J. W., & Greg, G. B. (1995). Effects of pond preparation
and feeding rate on production of Penaeus monodon Fabricius, water quality,
bacteria and benthos in model farming ponds. Aquaculture, 130(4), 329–349.
https://doi.org/10.1016/0044-8486(94)00316-G
Alonso, A. D. (2009). Marron farming and environmental sustainability: Western
Australia’s case. Environmentalist, 29(4), 388–397.
https://doi.org/10.1007/s10669-008-9211-3

124
Ambas, I., Suriawan, A. & Fotedar, R. (2013). Immunological responses of
customised probiotics-fed marron, Cherax tenuimanus, (Smith 1912) when
challenged with Vibrio mimicus. Fish and Shellfish Immunology, 35(2), 262–270.
American Public Health Association (APHA). 1998. Standard methods for the
examination of water and wastewater. Twentieth ed. APHA, Washington DC.
Amin, S. A., Parker, M. S., & Armbrust, E. V. (2012). Interactions between diatoms
and bacteria. Microbiology and Molecular Biology Reviews, 76(3), 667–684.
Anderson, R. K., Parker, P. L., & Lawrence, A. (1987). A 13C/12C tracer study of the
utilization of presented feed by a commercially important shrimp Penaeus
vannamei in a pond growout system. Journal of the World Aquaculture Society,
18(3), 148–155. https://doi.org/10.1111/j.1749-7345.1987.tb00433
‘Aquasonic – Caring for aquatic life: Bio Aid 250 mL’, From:
http://www.aquasonic.com.au/product/bio-aid-250ml/
Ardiansyah, & Fotedar, R. (2016a). Water quality, growth and stress responses of
juvenile barramundi (Lates calcarifer Bloch), reared at four different densities
in integrated recirculating aquaculture systems. Aquaculture, 458, 113–120.
https://doi.org/10.1016/j.aquaculture.2016.03.001
Ardiansyah, A., & Fotedar, R. (2016b). The abundance and diversity of heterotrophic
bacteria as a function of harvesting frequency of duckweed (Lemna minor L) in
recirculating aquaculture systems. Letters in Applied Microbiology, 63(1), 53–
59. https://doi.org/10.1111/lam.12585
Armitage, K. B., Saxena, B., & Angino, E. E. (1973). Population dynamics of pond
zooplankton, I. Diaptomus pallidus Herrick. Hydrobiologia, 42(2-3), 295-333.
Astashkina, A. P., Bakibayev, A. A., Plotnikov, E. V, Kolbysheva, Y. V., &
Mukashev, A. B. (2015). Study of the hydrocarbon-oxidizing activity of bacteria
of the genera Pseudomonas and Rhodococcus. Procedia Chemistry, 15, 90–96.
https://doi.org/10.1016/j.proche.2015.10.014
Austin, C. M., Jones, P.L., Stagnitti, F. & Mitchell, B.D. (1997). Response of the
yabby, Cherax destructor Clark, to natural and artificial diets: phenotypic
variation in juvenile growth. Aquaculture, 149(1-2), 39–46.
Avnimelech, Y., Mozes, N., & Kochba, M. (1995). Rates of organic carbon and
nitrogen degradation in intensive fish ponds. Aquaculture, 134, 211–216.
Balcázar, J. L., Blas, I. de, Ruiz-Zarzuela, I., Cunningham, D., Vendrell, D., &
Múzquiz, J. L. (2006). The role of probiotics in aquaculture. Veterinary
Microbiology, 114(3–4), 173–186. https://doi.org/10.1016/j.vetmic.2006.01.009
Beatty, S. J., Morgan, D. L., & Gill, H. S. (2013). Biology of a translocated population
of the large freshwater crayfish, Cherax cainii Austin & Ryan, 2002, in a Western
Australian River. Crustaceana, 77(11), 1329–1351.
Bender, J., & Phillips, P. (2004). Microbial mats for multiple applications in
aquaculture and bioremediation. Bioresource Technology, 94(2004), 229–238.
https://doi.org/10.1016/j.biortech.2003.12.016

125
Bender, J., Lee, R., Sheppard, M., Brinkley, K., Phillips, P., Yeboah, Y., & Wah, R.
C. (2004). A waste effluent treatment system based on microbial mats for black
sea bass Centropristis striata recycled-water mariculture. Aquacultural
Engineering, 31(1–2), 73–82. https://doi.org/10.1016/j.aquaeng.2004.02.001
Björnsson, B., & Ólafsdóttir, S. R. (2006). Effects of water quality and stocking
density on growth performance of juvenile cod (Gadus morhua L.). ICES Journal
of Marine Science, 63(2), 326–334.
https://doi.org/10.1016/j.icesjms.2005.10.010
Blaas, H., & Kroeze, C. (2016). Excessive nitrogen and phosphorus in European
rivers: 2000-2050. Ecological Indicators, 67, 328–337.
Blackburn, N., Fenchel, T., & Mitchell, J. (1998). Microscale nutrient patches in
planktonic habitats shown by chemotactic bacteria. Science, 282, 2254–2257.
Bostock, J., McAndrew, B., Richards, R., Jauncey, K., Telfer, T., Lorenzen, K., Little,
D., Ross, L., Handisyde, N., Gatward, I. & Corner, R. (2010). Aquaculture:
global status and trends. Philosophical Transactions of the Royal Society B:
Biological Sciences, 365(1554), 2897–2912.
Boyd, C.E., Hollerman, W.D., Plumb, J.A., & Saeed, M. (1984). Effect of treatment
with a commercial bacterial suspension on water quality in channel catfish
ponds. The Progressive Fish-Culturalist, 46, 36-40.
Boyd, C. E., & Gross, A. (1998). Use of probiotics for improving soil and water quality
in aquaculture ponds. Department of Fisheries and Allied Aquacultures. In Flegel
TW (ed) Advances in shrimp biotechnology. National Center for Genetic
Engineering and Biotechnology, Bangkok.
Bratvold, D., & Browdy, C. L. (2001). Effects of sand sediment and vertical surfaces
(AquaMats™) on production, water quality, and microbial ecology in an intensive
Litopenaeus vannamei culture system. Aquaculture, 195(1–2), 81–94.
Browdy, C.L. & Hopkins, J.S. (eds) (1995). Swimming through troubled water,
Proceedings of the special session on shrimp farming, Aquaculture ’95. World
Aquaculture Society, Baton Rouge, Louisiana, USA, 183-199.
Browne, P. B., Wetzell II, J.E., Spacie, A., & Konopka, A. (1992). Evaluation of
naturally-occurring organisms as food for juvenile crayfish Procambarus clarkii.
Journal of the World Aquaculture Society, 23(3), 211-216.
Cabello, F. C., Godfrey, H. P., Buschmann, A. H., & Dölz, H. J. (2016). Aquaculture
as yet another environmental gateway to the development and globalisation of
antimicrobial resistance. The Lancet Infectious Diseases, 16(7), e127–e133.
https://doi.org/10.1016/S1473-3099(16)00100-6
Canovas, S., Picot, B., Casellas, C., Zulkifi, H., Dubois, A., & Bontoux, J. (1996).
Seasonal development of phytoplankton and zooplankton in a high-rate algal
pond. Water Science and Technology, 33(7), 199–206.
Caron, D.A. (1994). Inorganic nutrients, bacteria and the microbial loop. Microbial
Ecology, 28, 295–298.
Chabot, D., & Dutil, J. D. (1999). Reduced growth of Atlantic cod in non-lethal
hypoxic conditions. Journal of Fish Biology, 55(3), 472–491.

126
Chávez-Crooker, P., & Obreque-Contreras, J. (2010). Bioremediation of aquaculture
wastes. Current Opinion in Biotechnology, 21(3), 313–317.
Chiayvareesajja, S., Boyd, C. E. (1993). Effects of zeolite, formalin, bacterial
augmentation, and aeration on total ammonia nitrogen concentrations.
Aquaculture, 116, 33-45.
Correia, E. S., Pereira, J. A., Apolinário, M. O., Horowitz, A., & Horowitz, S. (2002).
Effect of pond aging on natural food availability and growth of the freshwater
prawn Macrobrachium rosenbergii. Aquacultural Engineering, 26(1), 61–69.
https://doi.org/10.1016/S0144-8609(02)00004-3
Da Silva, F. C., Ballester, E., Monserrat, J., Geracitano, L., Wasielesky, W., & Abreu,
P. C. (2008). Contribution of microorganisms to the biofilm nutritional quality:
Protein and lipid contents. Aquaculture Nutrition, 14(6), 507–514.
Danovaro, R., Corinaldesi, C., La Rosa, T., Luna, G. M., Mazzola, A., Mirto, S.,
Vezzulli, L. & Fabiano, M. (2003). Aquaculture impact on benthic microbes and
organic matter cycling in coastal Mediterranean sediments: A synthesis.
Chemistry and Ecology, 19(1), 59–65.
David, G. S., Carvalho, E. D., Lemos, D., Silveira, A. N., & Dall’Aglio-Sobrinho, M.
(2015). Ecological carrying capacity for intensive tilapia (Oreochromis niloticus)
cage aquaculture in a large hydroelectrical reservoir in Southeastern Brazil.
Aquacultural Engineering, 66, 30–40.
https://doi.org/10.1016/j.aquaeng.2015.02.003
De Paiva-Maia, E., Alves-Modesto, G., Otavio-Brito, L., Oliveira, A., & Vasconcelos-
Gesteira, T. C. (2013). Effect of a commercial probiotic on bacterial and
phytoplankton concentration in intensive shrimp farming (Litopenaeus
vannamei) recirculation systems. Latin American Journal of Aquatic Research,
41(1), 126–137.
De Souza, D. M., Suita, S. M., Leite, F. P. L., Romano, L. A., Wasielesky, W., &
Ballester, E. L. C. (2012). The use of probiotics during the nursery rearing of the
pink shrimp Farfantepenaeus brasiliensis (Latreille, 1817) in a zero exchange
system. Aquaculture Research, 43(12), 1828–1837.
Department of Fisheries Government of Western Australia. (2012). Prevention and
diagnosis of Epistylis and Temnocephala on freshwater crustaceans. (February
2005). Retrieved from
http://www.fish.wa.gov.au/Documents/aquatic_animal_health/prevention_and_
diagnosis_of_epistylis_and_temnocephala_on_freshwater_crustaceans.pdf
Deng, B., Fu, L., Zhang, X., Zheng, J., Peng, L., Sun, J., Zhu, H., Wang, Y., Li, W.,
Wu, X., & Wu, D. (2014). The denitrification characteristics of Pseudomonas
stutzeri SC221-M and its application to water quality control in grass carp
aquaculture. PLOS ONE, 9(12), e114886.
https://doi.org/10.1371/journal.pone.0114886
Ding, Z., Du, J., Ou, J., Li, W., Wu, T., Xiu, Y., Meng, Q., Ren, Q., Gu, W., Xue, H.,
Tang, G. & Wang, W. (2012) Classification of circulating hemocytes from the
red swamp crayfish Procambarus clarkii and their susceptibility to the novel
pathogen Spiroplasma eriocheiris in vitro. Aquaculture, 356–357, 371–380.

127
Downs, T. M., Schallenberg, M., & Burns, C. W. (2008). Responses of lake
phytoplankton to micronutrient enrichment: A study in two New Zealand lakes
and an analysis of published data. Aquatic Sciences, 70(4), 347–360.
Duyck, C., Miekeley, N., Porto da Silveira, C. L., Aucélio, R. Q., Campos, R. C.,
Grinberg, P., & Brandão, G. P. (2007). The determination of trace elements in
crude oil and its heavy fractions by atomic spectrometry. Spectrochimica Acta -
Part B Atomic Spectroscopy, 62(9), 939–951.
https://doi.org/10.1016/j.sab.2007.04.013
Duffy, R. E., Godwin, I., Nolan, J., & Purvis, I. (2010). The contribution of naturally
occurring food items to the diet of Cherax destructor when fed formulated diets
of differing protein levels. Aquaculture, 313(1–4), 107–114.
Environment Protection (Water Quality) Policy 2003 (South Australia). Schedule 2.
Environment Protection Authority, 2003.
FAO- Food and Agricultural Organization of the United Nations. Food and
Agricultural Organization Aquaculture Production Statistics 1988-1997, Rome,
1999.
FAO- Food and Agriculture Organization of the United Nations. The state of world
fisheries and aquaculture 2016, Rome, 2016.
Ferdoushi, Z., Haque, F., Khan, S. & Haque, M. (2008). The Effects of two aquatic
floating macrophytes (Lemna and Azolla) as biofilters of nitrogen and phosphate
in fish ponds. Turkish Journal of Fisheries and Aquatic Sciences, 8, 253–258.
Food and Agricultural Organization. (1999). Aquaculture Production Statistics 1988-
1997. Food and Agricultural Organization, Rome.
Fotedar, R. 1998. Nutrition of marron, Cherax tenuimanus (Smith), under different
culture treatments – a comparative study. Unpublished PhD thesis, Curtin
University of Technology, Perth, WA.
Fotedar, R., Knott, B, Evans, L. H. (1999). Effect of stocking density on growth and
survival of 3-month-old juvenile marron, Cherax tenuimanus, raised in a semi-
controlled environment. Journal of Applied Aquaculture, 8(4), 27-37.
https://doi.org/10.1300/J028v08n04
Fotedar, R. (2004). Effect of dietary protein and lipid source on the growth, survival,
condition indices, and body composition of marron, Cherax tenuimanus (Smith).
Aquaculture, 230(1–4), 439–455.
Gamboa-Delgado, J. (2014). Nutritional role of natural productivity and formulated
feed in semi-intensive shrimp farming as indicated by natural stable isotopes.
Reviews in Aquaculture, 6(1), 36–47.
García-Ulloa, G. M., Pérez-Moreno, M. R., Rodríguez-González, D., Gallo-García,
M. C., Ponce-Palafox, J. T., Rodríguez-González, H., & Góngora-Gómez, A. M.
(2012). Stocking density for nursery production of redclaw crayfish, Cherax
quadricarinatus, in a recirculating system. Journal of Applied Aquaculture,
24(1), 8–15. https://doi.org/10.1080/10454438.2012.650599
128
Gatune, C., Vanreusel, A., Cnudde, C., Ruwa, R., Bossier, P., & De Troch, M. (2012).
Decomposing mangrove litter supports a microbial biofilm with potential
nutritive value to penaeid shrimp post larvae. Journal of Experimental Marine
Biology and Ecology, 426–427, 28–38.
https://doi.org/10.1016/j.jembe.2012.05.015
Geddes, M. C., Mills, B. J., & Walker, K. F. (1988). Growth in the Australian
Freshwater Crayfish, Cherax destructor Clark, under Laboratory Conditions.
Australian Journal of Marine and Freshwater Research, 39(4), 555–568.
Geddes, M. C., & Smallridge, M. (1993). Survival, growth and yield of the Australian
freshwater crayfish Cherax destructor in extensive aquaculture ponds.
Aquaculture, 114, 51–70.
Ghanawi, J., & Saoud, I. P. (2012). Molting, reproductive biology, and hatchery
management of redclaw crayfish Cherax quadricarinatus (von Martens 1868).
Aquaculture, 358–359, 183–195.
https://doi.org/10.1016/j.aquaculture.2012.06.01
Hai, N. Van, Buller, N., & Fotedar, R. (2009). Effects of probiotics (Pseudomonas
synxantha and Pseudomonas aeruginosa) on the growth, survival and immune
parameters of juvenile western king prawns (Penaeus latisulcatus Kishinouye,
1896). Aquaculture Research, 40(5), 590–602.
Hamlin, H. J., Michaels, J. T., Beaulaton, C. M., Graham, W. F., Dutt, W., Steinbach,
P., Losordo T. M., Schrader, & Main K. K., K. L. (2008). Comparing
denitrification rates and carbon sources in commercial scale upflow
denitrification biological filters in aquaculture. Aquacultural Engineering, 38(2),
79–92.
Hargreaves, J. A. (1998). Nitrogen biogeochemistry of aquaculture ponds.
Aquaculture, 166 (3-4), 181–212.
Harris, R. R., Coley, S., & Collins, S. (2001). Ammonia uptake and its effects on
ionoregulation in the freshwater crayfish Pacifastacus leniusculus (Dana). J
Comp Physiol B, 171, 681–693. https://doi.org/10.1007/s003600100219
Herbert, B. (1987). Notes on diseases and epibionts of Cherax quadricarinatus and
C. tenuimanus (Decapoda: Parastacidae). Aquaculture, 64(3), 165–173.
https://doi.org/10.1016/0044-8486(87)90322-X
Holdich, D.M. (2002). Biology of freshwater crayfish. Blackwell Science Ltd, Oxford.
Holl, C. M., Otoshi, C., & Unabia, C.R. (2011). Nitrifying biofilms critical for water
quality in intensive shrimp RAS. Global Aquaculture Advocate, 14, 38–39.
Holmer, M. (1991). Impacts of aquaculture on surrounding sediments: Generation of
organic-rich sediments. Aquaculture and the Environment, 16, 155-175.
Hong, H. A., Le, H. D., & Cutting, S. M. (2005). The use of bacterial spore formers
as probiotics. FEMS Microbiology Reviews, 29(4), 813–835.
Hu, X., Cao, Y., Wen, G., Zhang, X., Xu, Y., Xu, W., Xu, L., & Li, Z. (2017). Effect
of combined use of Bacillus and molasses on microbial communities in shrimp
cultural enclosure systems. Aquaculture Research, 48(6), 2691–2705.

129
Huner, J. V., Lindqvist, O. V., & Könönen, H. (1988). Comparison of morphology
and edible tissues of two important commercial crayfishes, the noble crayfish,
Astacus astacus Linné, and the red swamp crayfish, Procambarus clarkii (Girard)
(Decapoda, Astacidae and Cambaridae). Aquaculture, 68(1), 45–57.
Huner, J.V. (1994). Freshwater crayfish aquaculture in North America, Europe and
Australia: families Astacidae, Cambaridae and Parastacidae. The Haworth Press,
Inc., New York.
Ingram, B.A., Hawking, J.H., & Shiel, R.J. 1997. Aquatic life in freshwater ponds: A
guide to the identification and ecology of life in aquaculture ponds and farm dams
in south eastern Australia. Albury, New South Wales: The Co-operative
Research Centre for Freshwater Ecology.
Itoi, S., Niki, A., & Sugita, H. (2006). Changes in microbial communities associated
with the conditioning of filter material in recirculating aquaculture systems of
the pufferfish Takifugu rubripes. Aquaculture, 256(1–4), 287–295.
https://doi.org/10.1016/j.aquaculture.2006.02.037
Jensen, F. B. (1996). Uptake, elimination and effects of nitrite and nitrate in
freshwater crayfish (Astacus astacus). Aquatic Toxicology, 34, 95–104.
Jensen, F. B. (2003). Nitrite disrupts multiple physiological functions in aquatic
animals. Comparative Biochemistry and Physiology - A Molecular and
Integrative Physiology, 135(1), 9–24. https://doi.org/10.1016/S1095-
6433(02)00323-9
Jones, C. M. (1995). Production of juvenile redclaw crayfish, Cherax quadricarinatus
(von Martens) (Decapoda, Parastacidae) II. Juvenile nutrition and habitat.
Aquaculture, 138, 239–245.
Jones, C. M., & Ruscoe, I. M. (2000). Assessment of stocking size and density in the
production of redclaw crayfish, Cherax quadricarinatus (von Martens)
(Decapoda: Parastacidae), cultured under earthen pond conditions. Aquaculture,
189(1–2), 63–71. https://doi.org/10.1016/S0044-8486(00)00359-8
Jones, P. L., Thanuthong, T., & Kerr, P. (2002). Preliminary study on the use of
synthetic substrate for juvenile stage production of the yabby. Cherax destructor
(Clark) (Decapoda: Parastacidae). Aquaculture Research, 33(10), 811–818.
Jørgensen, S. E. (2008). Freshwater lakes. In Jørgensen, S. E., & Faith, B. D. (eds)
Encyclopedia of Ecology 1st Edition. Elsevier, Oxford.
Jouanneau, S., Recoules, L., Durand, M.J., Boukabache, A., Picot, V., Primault, Y.,
Lake, A., Sengelin, M., Barillon, B., & Thouand, G. (2014). Methods for
assessing biochemical oxygen demand (BOD): A review. Water Research, 49,
62–82.
Jussila, J., & Evans, L. H. (1996). On the factors affecting marron growth in intensive
culture. Freshwater Crayfish, 11, 428–440.
Jussila, J. 1997a. Physiological responses of Astacid and Parastacid crayfishes
(Crustacea : Decapoda ) to conditions of intensive culture. Doctoral dissertation,
University of Kuopio, Kuopio, Finland.

130
Jussila, J. (1997b). Total and differential haemocyte counts in western rock lobsters
(Panulirus cygnus George) under post-harvest stress. Marine and Freshwater
Research, 48, 863–867.
Karadal, O., & Türkmen, G. (2017). Growth performance and substrate preference of
juvenile Mexican dwarf orange crayfish (Cambarellus patzcuarensis) in different
substrate types. Journal of Limnology and Freshwater Fisheries Research, 3(3),
167–173.
Karakassis, I., Tsapakis, M. & Hatziyanni, E. (1998). Seasonal variability in sediment
profiles beneath fish farm cages in the Mediterranean. Marine Ecology Progress
Series, 162, 243–252.
Khatoon, H., Yusoff, F. M., Banerjee, S., Shariff, M., & Mohamed, S. (2007). Use of
periphytic cyanobacterium and mixed diatoms coated substrate for improving
water quality, survival and growth of Penaeus monodon Fabricius postlarvae.
Aquaculture, 271(1–4), 196–205.
Khoi, L. Van, & Fotedar, R. (2010). Effects of stocking density on the nutrient budget
and growth of the western king prawn (Penaeus latisulcatus Kishinouye) in a
recirculating aquaculture system. Aquaculture Research, 41(10), 624–633.
https://doi.org/10.1111/j.1365-2109.2010.02580.x
Kirchman, D.L. 2012. Processes in microbial ecology. New York, United States:
Oxford University Press Inc.
La Rosa, T., Mirto, S., Mazzola, A., & Danovaro, R. (2001). Differential responses of
benthic microbes and meiofauna to fish-farm disturbance in coastal sediments.
Environmental Pollution, 112(3), 427–434.
Labbé, J. I., Ramos-Suárez, J. L., Hernández-Pérez, A., Baeza, A., & Hansen, F.
(2017). Microalgae growth in polluted effluents from the dairy industry for
biomass production and phytoremediation. Journal of Environmental Chemical
Engineering, 5(1), 635–643. https://doi.org/10.1016/j.jece.2016.12.040
Lalloo, R., Ramchuran, S., Ramduth, D., Gorgens, J., & Gardiner, N. (2007).
Isolation and selection of Bacillus spp. as potential biological agents for
enhancement of water quality in culture of ornamental fish. Journal of Applied
Microbiology, 103, 1471–1479. https://doi.org/10.1111/j.1365-
2672.2007.03360.x
Lananan, F., Abdul Hamid, S. H., Din, W. N. S., Ali, N., Khatoon, H., Jusoh, A., &
Endut, A. (2014). Symbiotic bioremediation of aquaculture wastewater in
reducing ammonia and phosphorus utilizing Effective Microorganism (EM-1)
and microalgae (Chlorella sp.). International Biodeterioration and
Biodegradation, 95(PA), 127–134. https://doi.org/10.1016/j.ibiod.2014.06.013
Le Moullac, G., & Haffner, P. (2000). Environmental factors affecting immune
responses in Crustacea. Aquaculture, 191(1–3), 121–131.
https://doi.org/10.1016/S0044-8486(00)00422-1
Leonard, N., Blancheton, J.P. and Guiraud, J.P. (2000). Populations of heterotrophic
bacteria in an experimental recirculating aquaculture system. Aquacultural
Engineering, 22, 109– 120.

131
Lezama-Cervantes, C., & Paniagua-Michel, J. (2010). Effects of constructed microbial
mats on water quality and performance of Litopenaeus vannamei post-larvae.
Aquacultural Engineering, 42(2), 75–81.
https://doi.org/10.1016/j.aquaeng.2009.12.002
Li, X., Li, G., Zhang, S. & Tao, L. (2013a). Effect of recirculating aquaculture system
(RAS) on growth performance, body composition and haematological indicators
of Allogynogenetic crucian Carp (Carassius auratus gibelio). Advanced Journal
of Food Science and Technology, 5(3), 348-355.
Li, Y., Wang, R., & Lingxu, J. (2013b). Effects of density-stress on water quality and
growth of Marsupenaeus japonicus. Marine sciences/Haiyang Kexue, 37(10),
53-57.
Li, Y., & Boyd, C. E. (2016). Laboratory tests of bacterial amendments for
accelerating oxidation rates of ammonia, nitrite and organic matter in aquaculture
pond water. Aquaculture, 460, 45–58.
Lu, H., Feng, Y., Wang, J., Wu, Y., Shao, H., & Yang, L. (2016). Responses of
periphyton morphology, structure, and function to extreme nutrient loading.
Environmental Pollution, 214, 878–884.
https://doi.org/10.1016/j.envpol.2016.03.069
Manthe, D. P., & Malone, R. F. (1987). Chemical addition for accelerated biological
filter acclimation in closed blue crab shedding systems. Aquacultural
Engineering, 6(3), 227–236. https://doi.org/10.1016/0144-8609(87)90006-9
Martinez-Porchas, M. & Martinez-Cordova, L.R. (2012). World aquaculture:
environmental impacts and troubleshooting alternatives. The Scientific World
Journal, 2012, ID: 389623.
Martinez-Porchas, M., Martinez-Cordova, L. R., Lopez-Elias, J. A. & Porchas-
Cornejo, M. A. (2014). Bioremediation of Aquaculture Effluents. Microbial
Biodegradation and Bioremediation, 2, 542-555.
Masłoń, A., & Tomaszek, J. A. (2015). A study on the use of the BioBall® as a biofilm
carrier in a sequencing batch reactor. Bioresource Technology, 196, 577–585.
https://doi.org/10.1016/j.biortech.2015.08.020
Mazlum, Y. (2007). Stocking Density affects the growth, survival, and cheliped
injuries of third instars of narrow-clawed crayfish Astacus Leptodactylus
Eschsholtz, 1823 juveniles. Crustaceana, 80(7), 803–815.
McKnight, D. M., Smith, R.L., Bradbury, J.P., Baron, J.S., & Spaulding, S. (1990).
Phytoplankton dynamics in three rocky mountain lakes, Colorado, U.S.A. Arctic
and Alpine Research, 22(3): 264-274.
Meyer-Reil, L. A. (1994). Microbial life in sedimentary biofilms - The challenge to
microbial ecologists. Marine Ecology Progress Series, 112(3), 303–311.
Mills, J., & McCloud, I. (1983). Effects of stocking and feeding rates on experimental
pond production of the crayfish Cherax destructor Clark (Decapoda:
Parastacidae). Fisheries Research, 34(2), 51–72.

132
Molony, B. W., & Bird, C. (2005). Are marron, Cherax tenuimanus (Crustacea:
Decapoda), populations in irrigation reservoirs habitat limited? A trial using
artificial habitats. Lakes and Reservoirs: Research and Management, 10(1), 39–
50. https://doi.org/10.1111/j.1440-1770.2005.00252.x
Moriarty, D. J. W. (1997). The role of microorganisms in aquaculture ponds.
Aquaculture, 151, 333–349.
Moriarty, D. J. W. (1999). Disease Control in Shrimp Aquaculture with Probiotic
Bacteria, Proceedings of the 8th International Symposium on Microbial
Ecology - Microbial Interactions in Aquaculture Disease, 2013, 424123.
Morrissy, N.M. (1979). Experimental pond production of marron, Cherax tenuimanus
(Smith) (Decapoda: Parastacidae). Aquaculture, 16, 319-344
Morrissy, N. M., Caputi, N., & House, R. R. (1984). Tolerance of marron.
Aquaculture, 41, 61–74.
Morrissy N M, Hall N, & Caputi, N. (1986). Bioeconomic model for semi-intensive
pond grow-out of marron (Cherax tenuimanus), Fisheries Research Division,
W.A. Marine Research Laboratories, Fisheries Department of Western Australia,
Fisheries Research Report No. 2.
Morrissy, N. M. (1990). Optimum and Favourable Temperatures for Growth of
Cherax tenuimanus (Smith 1912) (Decapoda: Parastacidae). Australian Journal
of Marine and Freshwater Research, 41, 735-46.
Morrissy, N. M. (2000). Culturing the marvellous marron in Western Australia: 1967–
1997. Freshwater Crayfish, 13, 13–38.
Moss, K., & Moss, S. (2004). Effects of Artificial Substrate and Stocking Density on
the Nursery Production of Pacific White Shrimp Litopenaeus vannamei. Journal
of the World Aquaculture Society, 35(4), 536–542.
Nadarajah, S., & Flaaten, O. (2017). Global aquaculture growth and institutional
quality. Marine Policy, 84(April), 142–151.
Naranjo-Páramo, J., Hernandez-Llamas, A., & Villarreal, H. (2004). Effect of stocking
density on growth, survival and yield of juvenile redclaw crayfish Cherax
quadricarinatus (Decapoda: Parastacidae) in gravel-lined commercial nursery
ponds. Aquaculture, 242(1–4), 197–206.
https://doi.org/10.1016/j.aquaculture.2004.05.017
Naylor, R. L., Goldburg, R. J., Primavera, J. H., Kautsky, N., Beveridge, M. C. M.,
Clay, J. & Troell, M. (2000). Effect of aquaculture on world fish supplies.
Nature, 405, 1017-1024.
Nimrat, S., Suksawat, S., Boonthai, T., & Vuthiphandchai, V. (2012). Potential
Bacillus probiotics enhance bacterial numbers, water quality and growth during
early development of white shrimp (Litopenaeus vannamei). Veterinary
Microbiology, 159(3–4), 443–450.
Nugroho, R. A., & Fotedar, R. (2013). Dietary organic selenium improves growth,
survival and resistance to Vibrio mimicus in cultured marron, Cherax cainii
(Austin, 2002). Fish and Shellfish Immunology, 35(1), 79–85.

133
O’Brien, W. & deNoyelles Jr, F. (1974). Relationship Between Nutrient
Concentration, Phytoplankton Density, and Zooplankton Density in Nutrient
Enriched Experimental Ponds. Hydrobiologia, 44(1), 105-125.
O'Brien, B.G. (1995). The natural diet of the freshwater crayfish Cherax tenuimanus
(Smith 1912) (Decapoda: Parastacidae) as determined by gut content analysis.
Louisiana State University, Baton Rouge, LA (USA).
Otoshi, C.A., Montgomery, A.D., Matsuda, E.M., & Moss, S.M. (2006). Effects of
artificial substrate and water source on growth of juvenile pacific white shrimp,
Litopenaeus vannamei. Journal of the World Aquaculture Society, 37, 210–213.
Pace, M. L., & Lovett, G. (2013). Primary production: the foundation of ecosystems.
Fundamentals of ecosystem science. Elsevier, Amsterdam, 27-51.
https://doi.org/10.1016/B978-0-08-091680-4.00002-0
Pandey, K. P., Vivekanand, B., & Kundan, K. (2014). Biofilm in aquaculture
production. African Journal of Microbiology Research, 8(13), 1434–1443.
Perumal, S., Thirunavukkarasu, A. R., & Pachiappan, P. (2015). Advances in marine
and brackishwater aquaculture. Springer, New Delhi.
Prabu, E., & Santhiya, A. A. V. (2016). An overview of bioremediation towards
aquaculture. J. Aqua Trop., 31(3-4), 155–164.
Pradeep B, Pandey PK, & Ayyappan S. (2004). Variations in bacterial biofilm with
reference to nutrient levels. Asian J. Microbial. Biotech. Environ. Sci., 6(4), 649-
652.
Prangnell, D. I., & Fotedar, R. (2006). The growth and survival of western king
prawns, Penaeus latisulcatus Kishinouye, in potassium-fortified inland saline
water. Aquaculture, 259(1–4), 234–242.
Queiroz, J. F., & Boyd, C. E. (1998). Effects of a Bacterial Inoculum in Channel
Catfish Ponds. Journal of the World Aquaculture Society, 29(1), 67–73.
https://doi.org/10.1111/j.1749-7345.1998.tb00300.x
Ray, A. J., Seaborn, G., Leffler, J. W., Wilde, S. B., Lawson, A., & Browdy, C. L.
(2010). Characterization of microbial communities in minimal-exchange,
intensive aquaculture systems and the effects of suspended solids management.
Aquaculture, 310(1–2), 130–138.
Robinson, G., Mactavish, T., Savage, C., Caldwell, G. S., Jones, C. L. W., Probyn, T.,
Eyre, B. D., & Stead, S. M. (2018). Carbon amendment stimulates benthic
nitrogen cycling during the bioremediation of particulate aquaculture waste.
Biogeosciences, 15, 1863-1878.
Rodgers, L. J., Saoud, P. I., & Rouse, D. B. (2006). The effects of monosex culture
and stocking density on survival, growth and yield of redclaw crayfish (Cherax
quadricarinatus) in earthen ponds. Aquaculture, 259(1–4), 164–168.
https://doi.org/10.1016/j.aquaculture.2005.11.056
Romano, N., & Zeng, C. (2007). Acute toxicity of ammonia and its effects on the
haemolymph osmolality, ammonia-N, pH and ionic composition of early juvenile

134
mud crabs, Scylla serrata (Forskål). Comparative Biochemistry and Physiology,
148 (Part A), 278–285. https://doi.org/10.1016/j.cbpa.2007.04.018
Romano, N., & Zeng, C. (2012). Osmoregulation in decapod crustaceans: implications
to aquaculture productivity, methods for potential improvement and interactions
with elevated ammonia exposure. Aquaculture, 334–337, 12–23.
https://doi.org/10.1016/j.aquaculture.2011.12.035
Rouse, D.B. & Kartamulia, I. (1992). Influence of salinity and temperature on
moulting and survival of the Australian freshwater crayfish (Cherax tenuimanus).
Aquaculture, 105, 47–52.
Sakthipriya, N., Doble, M., & Sangwai, J. S. (2015). Action of biosurfactant producing
thermophilic Bacillus subtilis on waxy crude oil and long chain paraffins.
International Biodeterioration and Biodegradation, 105, 168–177.
https://doi.org/10.1016/j.ibiod.2015.09.004
Samocha, T. M., Hamper, L., Craig, R., Davis, A. D., McIntosh, D., Lawrence, A. L.,
& Van Wyk, P. M. (2002). Review of Some Recent Developments in Sustainable
Shrimp Farming Practices in Texas, Arizona, and Florida. Journal of Applied
Aquaculture, 12(1), 1–42.
Samocha, T. M., Fricker, J., Ali, A. M., Shpigel, M. & Neori, A. (2015). Growth and
nutrient uptake of the macroalga Gracilaria tikvahiae cultured with the shrimp
Litopenaeus vannamei in an Integrated Multi-Trophic Aquaculture (IMTA)
system. Aquaculture, 446, 263–271.
Sang, H. M., & Fotedar, R. (2004). Growth, survival, haemolymph osmolality and
organosomatic indices of the western king prawn (Penaeus latisulcatus
Kishinouye, 1896) reared at different salinities. Aquaculture, 234(1–4), 601–614.
https://doi.org/10.1016/j.aquaculture.2004.01.008
Sang, H. M., Ky, L. T., & Fotedar, R. (2009). Dietary supplementation of mannan
oligosaccharide improves the immune responses and survival of marron, Cherax
tenuimanus (Smith, 1912) when challenged with different stressors. Fish and
Shellfish Immunology, 27(2), 341–348.
Santhana Kumar, V., Pandey, P. K., Anand, T., Bhuvaneswari, R., & Kumar, S.
(2017). Effect of periphyton (aquamat) on water quality, nitrogen budget,
microbial ecology, and growth parameters of Litopenaeus vannamei in a semi-
intensive culture system. Aquaculture, 479(May), 240–249.
https://doi.org/10.1016/j.aquaculture.2017.05.048
Saoud, I. P., Garza de Yta, A., & Ghanawi, J. (2012). A review of nutritional biology
and dietary requirements of redclaw crayfish Cherax quadricarinatus (von
Martens 1868). Aquaculture Nutrition, 18(4), 349-368.
Schveitzer, R., Arantes, R., Baloi, M. F., Costódio, P. F. S., Arana, L. V., Seiffert, W.
Q., & Andreatta, E. R. (2013). Use of artificial substrates in the culture of
Litopenaeus vannamei (Biofloc System) at different stocking densities: Effects
on microbial activity, water quality and production rates. Aquacultural
Engineering, 54, 93–103. https://doi.org/10.1016/j.aquaeng.2012.12.003

135
Seymour, E. A. (1980). The effects and control of algal blooms in fish ponds.
Aquaculture, 19, 55–74.
Singh, S., Adapa, L. M., & Hankins, N. (2017). Influences of ammonium and
phosphate stimulation on metalworking fluid biofilm reactor development and
performance. New Biotechnology, 39(August), 240–246.
https://doi.org/10.1016/j.nbt.2017.09.002
Siriwardena, P.P.G.S.N. (1997). Disease prevention and health management in
coastal shrimp culture. Food and Agriculture Organization of the United
Nations, Technical Cooperation Programme, TCP/BGD/6714(A), Field Doc.
No. 2, pp. 38.
Smith, D., Burford, M. A., Tabrett, S. J., Irvin, S. J., & Ward, L. (2002). The effect
of feeding frequency on water quality and growth of the black tiger shrimp
(Penaeus monodon). Aquaculture, 207(1–2), 125–136.
https://doi.org/10.1016/S0044-8486(01)00757-8
Sommer, T. R., Morrissy, N. M., & Potts, W. T. (1991). Growth and pigmentation of
marron (Cherax tenuimanus) fed a reference ration supplemented with the
microalga Dunaliella salina. Aquaculture, 99, 285–295.
Song, Z. F., An, J., Fu, G. H., & Yang, X. L. (2011). Isolation and characterization
of an aerobic denitrifying Bacillus sp. YX-6 from shrimp culture ponds.
Aquaculture, 319(1–2), 188–193.
https://doi.org/10.1016/j.aquaculture.2011.06.018
Sorokin, Y. 1999. Aquatic microbial ecology. Leiden, The Netherlands: Backhuys
Publishers.
Soucek, D. J., & Dickinson, A. (2012). Acute toxicity of nitrate and nitrite to
sensitive freshwater insects, mollusks, and a crustacean. Archives of
Environmental Contamination and Toxicology, 62(2), 233–242.
https://doi.org/10.1007/s00244-011-9705-8
Stumpf, L., Díaz, F. C., Viau, V. E., Valenti, W. C., & López Greco, L. S. (2014).
Effect of food shortage on growth, energetic reserves mobilization, and water
quality in juveniles of the redclaw crayfish, Cherax quadricarinatus, reared in
groups. Journal of Crustacean Biology, 34(5), 639–646.
https://doi.org/10.1163/1937240X-00002259
Subashchandrabose, S. R., Ramakrishnan, B., Megharaj, M., Venkateswarlu, K., &
Naidu, R. (2011). Consortia of cyanobacteria/microalgae and bacteria:
Biotechnological potential. Biotechnology Advances, 29(6), 896–907.
https://doi.org/10.1016/j.biotechadv.2011.07.009
Sun, H., Li, J., Tang, L., & Yang, Z. (2012). Responses of crucian carp Carassius
auratus to long-term exposure to nitrite and low dissolved oxygen levels.
Biochemical Systematics and Ecology, 44(2), 224–232.
Tay, M. Y., Lymbery, A. J., Beatty, S. J., & Morgan, D. L. (2007). Predation by
rainbow trout (Oncorhynchus mykiss) on a Western Australian icon: Marron

136
(Cherax cainii). New Zealand Journal of Marine and Freshwater Research,
41(2), 197–204.
Thakur, D. P., & Lin, C. K. (2003). Water quality and nutrient budget in closed
shrimp (Penaeus monodon) culture systems, 27, 159-176.
Thompson, F. L., Abreu, P. C., & Wasielesky, W. (2002). Importance of biofilm for
water quality and nourishment in intensive shrimp culture. Aquaculture, 203(3–
4), 263–278. https://doi.org/10.1016/S0044-8486(01)00642-1
Tidwell, J. H., Coyle, S. D., & Schulmeister, G. (1998). Effects of added substrate on
the production and population characteristics of freshwater prawns
Macrobrachium rosenbergii in ponds. Journal of the World Aquaculture Society,
29(1), 17–22.
Tissot, B.P., & Welte, D.H. 1984. Petroleum Formation and Occurrence, 1st ed.
Berlin, Germany: Springer-Verlag.
Uddin, M. S., Azim, M. E., Wahab, M. A., & Verdegem, M. C. J. (2009). Effects of
substrate addition and supplemental feeding on plankton composition and
production in tilapia (Oreochromis niloticus) and freshwater prawn
(Macrobrachium rosenbergii) polyculture. Aquaculture, 297(1–4), 99–105.
Ulikowski, D., Chybowski, Ł., & Traczuk, P. (2015). Harmful impact of filamentous
algae (Spirogyra sp.) on juvenile crayfish. Archives of Polish Fisheries, 23(4),
223–226.
Uma Devi, K., Swapna, G., & Suneetha, S. (2014). Microalgae in bioremediation:
Sequestration of greenhouse gases, clearout of fugitive nutrient minerals, and
subtraction of toxic elements from waters. Microbial Biodegradation and
Bioremediation, Elsevier Inc. https://doi.org/10.1016/B978-0-12-800021-
2.00019-4
Verdegem, M. C. J. (2013). Nutrient discharge from aquaculture operations in function
of system design and production environment. Reviews in Aquaculture, 5(3),
158–171. https://doi.org/10.1111/raq.12011
Verhoef, G. D., & Austin, C. M. (1999). Combined effects of shelter and density on
the growth and survival of juveniles of the Australian freshwater crayfish, Cherax
destructor Clark, Part 2. Aquaculture, 170, 49-57.
Viau, V. E., Ostera, J. M., Tolivia, A., Ballester, E. L. C., Abreu, P. C., & Rodriguez,
E. M. (2012). Contribution of biofilm to water quality, survival and growth of
juveniles of the freshwater crayfish Cherax quadricarinatus (Decapoda,
Parastacidae). Aquaculture, 324-325, 70–78.
Viau, V. E., De Souza, D. M., Rodríguez, E. M., Wasielesky, W., Abreu, P. C., &
Ballester, E. L. C. (2013). Biofilm feeding by postlarvae of the pink shrimp
Farfantepenaeus brasiliensis (Decapoda, Penaidae). Aquaculture Research,
44(5), 783–794.

137
Villarreal, H. & Peláez, J. (1999). Biología y cultivo de langosta de agua dulce, Cherax
quadricarinatus, Manual de producción. Centro de Investigaciones Biológicas del
Noroeste y Acuacultivos Santo Domingo, La Paz, B.C.S., Mexico, pp. 250.
Wallen, D. G. (1979). Nutrients limiting phytoplankton production in ice-covered
Lake St, Clair. J. Great Lakes Res., 5(2): 91-98.
Wang, W.-N., Wang, A.-L., Zhang, Y.-J., Li, Z.-H., Wang, J.-X., & Sun, R.-Y.
(2004). Effects of nitrite on lethal and immune response of Macrobrachium
nipponense. Aquaculture, 232(1–4), 679–686.
https://doi.org/10.1016/j.aquaculture.2003.08.018
Wang,Y. B., Xu, Z. R. & Xia, M. S. (2005). The effectiveness of commercial
probiotics in northern white shrimp Penaeus vannamei ponds. Fisheries Science,
71(5), 1036–1041.
Wang, Y., & He, Z. (2009). Effect of probiotics on alkaline phosphatase activity and
nutrient level in sediment of shrimp, Penaeus vannamei, ponds. Aquaculture,
287(1–2), 94–97. https://doi.org/10.1016/j.aquaculture.2008.10.022
Wang, Y., Geng, J., Guo, G., Wang, C., & Liu, S. (2011). N2O production in
anaerobic/anoxic denitrifying phosphorus removal process: The effects of carbon
sources shock. Chemical Engineering Journal, 172(2–3), 999–1007.
https://doi.org/10.1016/j.cej.2011.07.014
Wang, Z., Meng, Y., Fan, T., Du, Y., Tang, J. & Fan, S. (2015). Phosphorus removal
and N2O production in anaerobic/anoxic denitrifying phosphorus removal
process: Long-term impact of influent phosphorus concentration. Bioresource
Technology, 179, 585–594.
Xie, F., Zhu, T., Zhang, F., Zhou, K., Zhao, Y., & Li, Z. (2013). Using Bacillus
amyloliquefaciens for remediation of aquaculture water. SpringerPlus, 2(119),
1–5.
Yildiz, H. Y., & Benli, A. C. K. (2004). Nitrite toxicity to crayfish, Astacus
leptodactylus, the effects of sublethal nitrite exposure on hemolymph nitrite, total
hemocyte counts, and hemolymph glucose. Ecotoxicology and Environmental
Safety, 59(3), 370–375. https://doi.org/10.1016/j.ecoenv.2003.07.007
Zhao, P., Huang, J., Wang, X. H., Song, X. L., Yang, C. H., Zhang, X. G., & Wang,
G. C. (2012). The application of bioflocs technology in high-intensive, zero
exchange farming systems of Marsupenaeus japonicus. Aquaculture, 354–355,
97–106. https://doi.org/10.1016/j.aquaculture.2012.03.034
Zhihong, W., Shiguang, C., & Xin, C. (2010). Micro-nutrients effects on algae colony:
Growth rate and biomass response to various micro-nutrients and competitive
inhibitions among multi-microelements. 2010 4th International Conference on
Bioinformatics and Biomedical Engineering, ICBBE 2010,
(9151009001000048), 1–8. https://doi.org/10.1109/ICBBE.2010.5516174
Zhou, Q., Li, K., Jun, X., & Bo, L. (2009). Role and functions of beneficial
microorganisms in sustainable aquaculture. Bioresource Technology, 100(16),
3780–3786. https://doi.org/10.1016/j.biortech.2008.12.037

138
Ziaei-Nejad, S., Rezaei, M. H., Takami, G. A., Lovett, D. L., Mirvaghefi, A. R., &
Shakouri, M. (2006). The effect of Bacillus spp. bacteria used as probiotics on
digestive enzyme activity, survival and growth in the Indian white shrimp
Fenneropenaeus indicus. Aquaculture, 252(2–4), 516–524.
https://doi.org/10.1016/j.aquaculture.2005.07.021
Zimba, P. V, Mischke, C. C., & Brashear, S. S. (2003). Pond age–water column trophic
relationships in channel catfish Ictalurus punctatus production ponds.
Aquaculture, 219, 291–301.
Zokaeifar, H., Babaei, N., Saad, C. R., Kamarudin, M. S., Sijam, K., & Balcazar, J. L.
(2014). Administration of Bacillus subtilis strains in the rearing water enhances
the water quality, growth performance, immune response, and resistance against
Vibrio harveyi infection in juvenile white shrimp, Litopenaeus vannamei. Fish
and Shellfish Immunology, 36(1), 68–74.
https://doi.org/10.1016/j.fsi.2013.10.007
Every reasonable effort has been made to acknowledge the owners of copyright
material. I would be pleased to hear from any copyright owner who has been omitted
or incorrectly acknowledged.

139
Appendix A
A) Marron tanks in experiment 2, showing presence of phytoplankton, and mesh
covering.
B) Marron weighing in experiment 2.
C) Marron used in experiment 3.
D) Cocci-shaped bacteria stained with crystal violet, at 1000x magnification.

140
Appendix B
Statement of Author Contribution
Title of Manuscript: Effects of pond age and a commercial substrate (the water
cleanser™) on natural productivity, bacterial abundance, nutrient concentrations, and
growth and survival of marron (Cherax cainii Austin, 2002) in semi-intensive pond
culture.
Status: Published.
Included in Chapter 5 of Thesis.
Publication Details:
Cole, A. J., Tulsankar, S. S., Saunders, B. J., & Fotedar, R. (2019). Effects of pond
age and a commercial substrate (the water cleanser™) on natural productivity,
bacterial abundance, nutrient concentrations, and growth and survival of
MARRON (CHERAX CAINII Austin, 2002) in semi-intensive pond culture.
Aquaculture, 502. https://doi.org/10.1016/j.aquaculture.2018.12.046
Author Contribution to Paper Contribution
Percentage
(%)
Anthony J. Cole Developed the experimental design,
performed data collection, data
analysis, writing and reviewing of
manuscript, and acted as
corresponding author.
81%
Ravi Fotedar Supervised development of work,
including experimental design, and
reviewed and edited the manuscript.
10%
Smita S. Tulsankar Helped in data collection and editing
of manuscript.
7.5%
Benjamin J. Saunders Helped in editing of manuscript. 1.5%