T875.pdf - Espace INRS
418
Université du Québec Institut National de la Recherche Scientifique Centre Eau Terre Environnement DÉVELOPPEMENT DE MICRO-SYSTÈME IMPRÉGNÉ DE BIOCHARBON-ENZYME (BEMS) POUR LA DÉGRADATION DU CONTAMINANT ÉMERGENT – DICLOFÉNAC Par LINSON LONAPPAN Thèse présentée pour l’obtention du grade de Philosophiae Doctor (Ph.D.) en sciences de l’eau Jury d’évaluation © Droits réservés de (Linson Lonappan), 2018 Président du jury et examinateur interne Dr. Gerardo Buelna, Chercheur Centre de Recherche Industrielle Québec Québec, Canada Examinateurs externes Prof. Hubert Cabana, Professeur Université de Sherbrooke, Canada Prof. Trong-On Do, Professeur Université Laval, Québec, Canada Directeur de recherche Prof. Satinder Kaur Brar, Professeure INRS-ETE, Québec, Canada
-
Upload
khangminh22 -
Category
Documents
-
view
0 -
download
0
Transcript of T875.pdf - Espace INRS

Université du Québec
Institut National de la Recherche Scientifique
Centre Eau Terre Environnement
DÉVELOPPEMENT DE MICRO-SYSTÈME IMPRÉGNÉ DE BIOCHARBON-ENZYME (BEMS) POUR LA DÉGRADATION DU
CONTAMINANT ÉMERGENT – DICLOFÉNAC
Par
LINSON LONAPPAN
Thèse présentée
pour l’obtention du grade de Philosophiae Doctor (Ph.D.) en sciences de l’eau
Jury d’évaluation
© Droits réservés de (Linson Lonappan), 2018
Président du jury et
examinateur interne
Dr. Gerardo Buelna, Chercheur
Centre de Recherche Industrielle Québec
Québec, Canada
Examinateurs externes Prof. Hubert Cabana, Professeur
Université de Sherbrooke, Canada
Prof. Trong-On Do, Professeur
Université Laval, Québec, Canada
Directeur de recherche Prof. Satinder Kaur Brar, Professeure
INRS-ETE, Québec, Canada


DÉDICACE
To my mother for her love, sacrifices, endless motivation and support
In memory of my late father and grandparents
To all my teachers

iv
V
REMERCIEMENTS
Immeasurable appreciation and deepest gratitude for the help and support are extended to
everyone who were with me, in one or another way contributed and making this study
possible.
It is a genuine pleasure to express my deep sense of gratitude to my mentor and thesis
supervisor Prof. Satinder Kaur Brar. I have always admired her dedication and hard work. I
am thankful for her timely scholarly advices, meticulous scrutiny, constructive criticism and
continuing encouragement and support. Sincere thanks to all of my examiners (Dr. Gerardo
Buelna, Prof. Hubert Cabana and Prof. Trong-On Do) who have played an important role in
contributing to my doctoral project through their excellent suggestions.
I owe a deep sense of gratitude to Dr. Tarek Rouissi for his keen interest on the research
project at every stage. His prompt inspirations, dynamic enthusiasm and scholarly advices in
particular with research articles are thankfully acknowledged. I am thankful to the assistance
provided by all INRS laboratory personnel in particular Stéphane Moïse, Stéfane Prémont,
Sebastien Duval, Lise Rancourt, Philippe Girard and Arnaud De Coninck and in addition
sincere thanks to Serge Auger (Phytronix Technologies Inc.) for analytical supports. I would
like to express my sincere gratitude to interns/ exchange students whom I worked with at
various stages my thesis (Dr. Yuxue Liu, Marthe Sterlie Latour, Dr. Leticia Hernández-Galán
and Florent Pourcel). I equally acknowledge the translation efforts from Mouna Doghri, Dany
Roy, Dhouha Ayed, Mona Chaali, Mohamed Amine Laadila and Tayssir Guedri.
Furthermore, thanks to Linda Aubert and Suzanne Dussault who has been very patient and
prompt in any kind of administrative help when required.
It was a great experience to work in a good team and I am thankful to each and every one
from Prof.Brar’s laboratory who had helped and encouraged me during my time at INRS. It

VI
will be rather very difficult for me to name each and every one, so thanks every one.
Moreover, I owe a great debt of gratitude to the senior students of Prof.Brar’s lab who were
there for me particularly during the initial stages of my PhD. I am also thankful to my office
colleagues, all of the friends from INRS, friends from Quebec in particular from Laval
University for their love, care and support.
Finally, I would like to thank my mother (Alphonsa Lonappan) for her constant
encouragement, sacrifices and support. In addition would like to express my sincere
gratitude to my entire family and friends in India particularly my cousins who were/are there
for me for everything. I am also thankful to all of priest friends back in India and Quebec for
all your moral supports and encouragements. I thank the Almighty, whose blessings have
enabled me to accomplish the research work.

VII
RÉSUMÉ
Les contaminants émergents attirent de plus en plus l’attention en raison de leur
omniprésence dans les milieux naturels, leur impact sur l'environnement ainsi que de leurs
effets toxiques sur divers organismes. Le Diclofénac (DCF) est un médicament anti-
inflammatoire largement utilisé dans le monde entier. Plusieurs recherches menées au cours
des dernières décennies ont confirmé l'ubiquité mondiale de DCF dans l'environnement.
Pour le DCF, 30 à 70% sont éliminées par le système de traitement classique dans les
stations d'épuration des eaux usées (qui est le principal récepteur primaire du contaminant).
Ainsi, le DCF résiduel a été fréquemment détecté dans les eaux douces et connu et sa
toxicité a été observée pour plusieurs organismes aquatiques. À titre d’exemple, à une
concentration de 1 µg L-1
, le DCF induits des altérations physiologiques et cause des
dommages aux reins et au foie. Le développement de méthodes de traitement efficace des
composés pharmaceutiques est donc nécessaire.
L'identification et la quantification des DCF au Québec au niveau de la station de traitement
des eaux usées de la Communauté urbaine (ville de Québec, Canada) est une étape clef
pour étudier le devenir du DCF dans l'environnement. A cet effet, un procédé rapide et
indépendant de la matrice a été développé en utilisant LDTD-APCI-MS / MS (ionisation
chimique à pression atmosphérique désorption thermique diode laser (LDTD-APCI) couplée
à une spectrométrie de masse tandem (MS / MS). Le procédé réduit le temps d'analyse par
échantillon à 12 secondes comparativement à la méthode conventionnelle LC-ESI-MS / MS
qui prend jusqu’à 12 minutes. Les eaux usées non traitées contenaient 64,89 ± 6.7μg L-1
de
DCF et l'effluent contenait 15,95 ± 3.7μ g L-1
. La quantification du DCF dans les boues des
eaux usées a également été réalisée et pour lesquelles, deux méthodes d'extraction ont été
étudiées. L’extraction par solvant accélérée (ASE) a été la plus efficace comparée à
l’extraction assistée par ultrasons (USE) avec 95,6 ± 7% de récupération. Les boues
primaires (1,10 ± 0,15 µg g-1
) et boues secondaires (0,90 ± 0,15 µg g-1
) contenaient des

VIII
concentrations importantes de DCF et qui est en outre dirigé vers la sorption du DCF dans
les eaux usées. Dans l'ensemble, un enlèvement de près de 76% du DCF a été observé
dans la station d'épuration des eaux usées. Cependant, une grande partie de cet
enlèvement est due à l’adsorption du contaminant sur les boues des eaux usées. Après
avoir déterminé la répartition du DCF tout au long des différentes opérations unitaires de la
station d'épuration, il était important de mettre au point des méthodes de traitement.
Le traitement par adsorption a été proposé comme étant un procédé d'élimination efficace
de divers contaminants émergents. Dans cette étude, les microparticules de biochars ont été
produites à partir du biochar obtenu par broyage et tamisage. Les propriétés du biochar,
ainsi que ses capacités d'adsorption sont fortement dépendantes du choix de la matière
première agricole utilisée et des conditions de sa production. Les microbiochars ont été
caractérisés pour leurs capacités d'adsorption en utilisant le bleu de méthylène comme
contaminant organique modèle. Pour le DCF, le microbiochar produit à partir de fumier de
porc (BC-PM) a montré d’excellente efficacité d'élimination (99,6%) comparativement à celui
obtenu à partir de bois de pin (BC-PW). La diffusion intraparticulaire est considérée l’élément
limitant dans le processus d’adsorption. La température, la présence d'ions co-existants, la
concentration initiale d'adsorbat et les particules ont joué tous un rôle important dans
l'adsorption.
Afin d’améliorer leurs capacités d’adsorption pour le DCF, les microbiochars ont été
fonctionnalisées en utilisant divers acides organiques. La fonctionnalisation a augmenté les
groupes fonctionnels acides de 23,6%, 10,2% et 26,2%, respectivement pour le bois de pin,
le fumier de porc et les microbiochars de coquille d'amande. Les biochars fonctionnalisés à
l’acide citrique avaient la capacité la plus élevée pour éliminer le DCF. Pour le biochar à
base de bois de pin, l’équilibre est passé de 65 à 80% lors du traitement des eaux
contaminées avec le DCF Pour le biochar à base de coquilles d'amande (BC-AS) et dans
des conditions similaires, l'efficacité d'élimination de diclofénac est passée de 58 à 84%.

IX
Les enzymes lignolytiques, particulièrement la laccase en, a été démontrée efficace pour la
dégradation de plusieurs contaminants émergents. Des essais ont été menés pour une
production rentable de laccase via l'utilisation des résidus agro-industriels comme substrats.
Les résidus d’industrie de jus de fruit (49.16 ± 2,5 U gds -1
) et de l’industrie de pâte et papier
(52,4 ± 2,2 U gds-1
) se sont avérés être des substrats efficaces comparés aux fibres d’alfa
séchées (14,26 ± 0,8 U gds-1
). Une dégradation presque totale (99%) a été obtenue après
une période de 5 heures lorsque le pH et la température sont fixés respectivement à 4,5 et à
50ºC. L’immobilisation de la laccase sur des supports solides permet d'améliorer sa stabilité
et de renforcer le potentiel d'application dans des conditions environnementales réelles. Les
procédés d'immobilisation par adsorption et covalente ont été étudiés en utilisant de la
laccase brute sur divers microbiochars. Avec tous les types de biochars, et comme l'activité
initiale de la laccase est élevée dans la solution brute, l'efficacité de l'immobilisation était
élevée aussi. Le modèle qui décrit le mieux à liaison enzymes-micro-biochars est la forme
d’une monocouche homogène La laccase immobilisée par des liaisons covalentes a montré
une stabilité supérieure à différentes conditions (pH, température et durée de stockage).
Avec l'immobilisation covalente de la laccase en utilisant du glutaraldéhyde (5% v / v), le
microbiochar à base de lisier de porc a montré l’efficacité d’adsorption la plus élevée (34,1 ±
1. 1 U g-1
), suivie par microbiochar de coquille d'amande (25,3 ± 2,8 U g-1
) et celui de bois de
pin (16,18 ± 0,3 U g-1
). En outre, le prétraitement avec de l'acide citrique améliore les
interactions de la laccase avec tous les microbiochars et a montré une amélioration
particulière de l’ordre de 20% pour le microbiochar à base de coquille d'amandes. À une
concentration de 500 µgL-1
, l’élimination totale du DCF a été observée avec le complexe
micro biochar de lisier de porc-laccase au bout de 3 heures. Plus de 40% de l'activité de la
laccase a été maintenue avec tous les systèmes micro-biochars-laccase-après 5 cycles de
traitement de DCF d’une durée 6 heures.
Les nouveaux microsystèmes imprégnés biochar-enzyme laccase (BEMS) ont été exploités
pour la fabrication d’un bioréacteur à colonne sur lit fixe. Le biochar-la laccase a démontré

X
une efficacité de traitement plus élevé que le biochar brut. De plus, le biochar-laccase a
permis une amélioration significative pour le temps de résidence grâce à la biodégradation
en parallèle du DCF dans la colonne. Le microsystème biochar imprégné d'enzyme (BEMS)
est une approche efficace, durable, verte et rentable pour le traitement des DCF et d'autres
contaminants émergents dans divers environnements.

XI
ABSTRACT
Emerging contaminants are gaining wide attention due to their omnipresence in
environmental compartments and their potential environmental as well as toxic effects on
various organisms. Diclofenac (DCF) is a prevalent anti-inflammatory drug used throughout
the world. Intensive researches carried out in the past few decades have confirmed the
global ubiquity of DCF in various environmental compartments. For DCF, about 30–70%
removal has been obtained through the conventional treatment system in wastewater
treatment plant is the major primary sink. Thus, the untreated DCF has frequent occurrence
in freshwater environments and known for its potential toxicity towards several aquatic
organisms. At 1 µg L-1
, DCF induces physiological alterations and kidney and liver damages
in some aquatic organisms and which call up for effective treatment methods for the removal
of the pharmaceuticals.
The identification and quantification of DCF in Quebec Urban Community wastewater
treatment (Quebec city, Canada) was performed to study the fate of DCF in the environment.
For this purpose, a rapid and less matrix-prone method was developed using LDTD-APCI-
MS/MS (laser diode thermal desorption-atmospheric pressure chemical ionization (LDTD-
APCI) coupled to tandem mass spectrometry (MS/MS). The method reduced the analysis
time per sample to 12 seconds when compared with the conventional LC-ESI–MS/MS
method (12 minutes). The wastewater influent contained 64.89±6.7µg L−1
of DCF and the
effluent contained 15.95±3.7µg L−1
. Quantification of DCF in wastewater sludge was also
carried out and for the which, two extraction methods were studied. Accelerated solvent
extraction (ASE) was found to be effective over ultrasonic-assisted extraction (USE) for the
extraction of DCF from wastewater sludge with 95.6 ± 7% recovery. Primary sludge (1.10 ±
0.15 µg g−1
) and secondary sludge (0.90 ± 0.15 µg g−1
) contained significant amounts of
DCF and which further pointed towards the sorption of DCF in wastewater sludge. Overall,
nearly 76 % removal of DCF was observed in the wastewater treatment plant; however, a

XII
major portion of this was accounted through sorption onto the wastewater sludge. After
having determined the partitioning of DCF in different wastewater treatment plant unit
operations, it was important to devise treatment methods.
Adsorptive removal has been recognized as an effective removal method for various
emerging contaminants. In this study, the micro-biochars were produced from the biochar
obtained from pyrolysis reactor outlet through size reduction. Feedstock selection and
method of production had significant effects on the biochar properties as well as adsorption
capacities. Micro-biochars were characterized for the adsorption experiments using the
model organic contaminant methylene blue. For emerging contaminant DCF, Pig manure
micro-biochar (BC-PM) showed excellent removal efficiency (99.6%) over pine wood micro-
biochar (BC-PW) at 500 µg L-1
of DCF (environmentally significant concentration).
Intraparticle diffusion was found to be the major process facilitated the adsorption.
Thermodynamics, the presence of co-existing ions, initial adsorbate concentration and
particles size played a substantial role in adsorption. Further, the micro-biochars were
functionalized using various organic acids for enhanced removal of DCF. The
functionalization increased total acidic functional groups by 23.6 %, 10.2 %, and 26.2 %,
respectively for pine wood, pig manure, and almond shell micro-biochars. Citric acid
functionalized biochars showed the higher removal of the environmentally relevant
concentration (500 µg L-1
) of emerging contaminant, diclofenac. For pinewood biochar, at
equilibrium diclofenac removal increased from 65 to 80 %. For almond shell biochar (BC-
AS), under similar conditions, the diclofenac removal efficiency increased from 58 to 84 %.
Ligninolytic enzymes, laccase, in particular, were found to be effective for the degradation of
several emerging contaminants. In this study, an attempt has been made for the cost-
effective production of laccase through the application of agro-industrial residues as
substrates (using Tremetes versicolor (ATCC 20869)). Apple juice industry residue, apple
pomace (49.16±2.5 U gds -1
) and pulp and paper solid waste (52.4±2.2 U gds-1
) were found
to be the efficient substrates for laccase production over dried alfa fibers (14.26±0.8 U gds-1
).

XIII
At environmentally relevant concentrations (500 µg L-1
of DCF), pH of 4.5 and temperature of
50 °C was found to be optimal for the effective degradation of DCF with laccase. Under
optimized conditions, up to 99 % degradation was observed for DCF within 5 hours.
Immobilization of laccase on solid supports will enhance its stability and further application
potential in real environmental conditions. Adsorptive and covalent immobilization methods
were studied for the immobilization of crude laccase on various micro-biochars. With all
biochars, as the initial activity of laccase increased in the crude solution, the adsorptive
immobilization efficiency also increased. Homogeneous monolayer adsorption was found to
be the major mechanism of enzyme binding on micro-biochars. Covalently immobilized
laccase (using glutaraldehyde as cross linker) showed superior pH, thermal, storage and
operational stability. With covalent immobilization of laccase using glutaraldehyde ( 5% w/v),
pig manure micro-biochar showed highest laccase binding (34.1±1.1 U g-1
) followed by
almond shell micro-biochar (25.3±2.8 U g-1
) and pine wood micro-biochar (16.18±0.3 U g-1
).
Further, citric acid pretreatment improved the laccase binding capacity of all the micro-
biochars and showed up to 20 % improvement in laccase binding with almond shell micro-
biochar. At environmentally relevant concentration (500 µg L-1), the complete removal of
DCF was observed with pig manure micro biochar bound laccase within 3 hours under batch
mode operating conditions. More than 40 % of the laccase activity was retained with all the
laccase-bound micro-biochars after 5 cycles of diclofenac treatment in which each cycle
lasted for 6 hours.
Laccase-bound micro-biochars were developed into novel biochar-enzyme impregnated
microsystem (BEMS) by developing a fixed-bed column bioreactor. Laccase bound biochar
exhibited higher removal efficiency over the raw biochar and significant improvement in
breakthrough time was observed which was attributed to the biodegradation of DCF in the
column. The biochar-enzyme impregnated microsystem (BEMS) will be promising as an
efficient, sustainable, green and cost-effective approach for the treatment of DCF and other
emerging contaminants in diverse environments.

XIV

XV
PUBLICATIONS DE CETTE THÈSE
1. L. Lonappan, S.K. Brar, R.K. Das, M. Verma, R.Y. Surampalli, Diclofenac and its
transformation products: Environmental occurrence and toxicity - A review, Environment
International, 96 (2016) 127-138.
2. L. Lonappan, R. Pulicharla, T. Rouissi, S.K. Brar, M. Verma, R.Y. Surampalli, J.R.
Valero, Diclofenac in municipal wastewater treatment plant: quantification using laser
diode thermal desorption—atmospheric pressure chemical ionization—tandem mass
spectrometry approach in comparison with an established liquid chromatography-
electrospray ionization–tandem mass spectrometry method, Journal of Chromatography
A 1433 (2016) 106-113.
3. L. Lonappan, T. Rouissi, R.K. Das, S.K. Brar, A.A. Ramirez, M. Verma, R.Y.
Surampalli, J.R. Valero, Adsorption of methylene blue on biochar microparticles derived
from different waste materials, Waste Management 49 (2016) 537-544.
4. L. Lonappan, T. Rouissi, S.K. Brar, M. Verma , R.Y Surampalli, An insight into the
adsorption of diclofenac onto biochars: thermodynamics,mechanisms and surface
chemistry, Bioresource Technology,249 (2018) 386-394.
5. L. Lonappan, T. Rouissi, S.K. Brar, M. Verma, R.Y. Surampalli, Adsorption of
diclofenac onto different biochar microparticles: Dataset–Characterization and dosage
of biochar, Data in Brief, 16 (2018) 460-465.
6. L. Lonappan, Y. Liu, T. Rouissi, S.K. Brar, M.Verma , R.Y. Surampalli, Development of
biochar based green functional materials using organic acids - adsorption of diclofenac,
Journal of Hazardous Materials ( under review)
7. L. Lonappan, T. Rouissi, M.A. Laadila, S.K. Brar, L. Hernández-Galán, M. Verma, R.Y.
Surampalli, Agro-industrial produced laccase for degradation of diclofenac and
identification of transformation products, ACS Sustainable Chemistry & Engineering, 5
(7) (2017) 5772–5781.
8. L. Lonappan, Y. Liu, T. Rouissi, S.K. Brar, M. Verma, R.Y. Surampalli, Adsorptive
immobilization of agro-industrially produced crude laccase on various micro-biochars
and degradation of diclofenac, Science of the Total Environment (under review)

XVI
9. L. Lonappan, Y. Liu, F. Pourcel, T. Rouissi, S.K. Brar, R.Y. Surampalli, Covalent
immobilization of laccase on citric acid functionalized micro-biochars derived from
different feedstock and removal of diclofenac, Water Research ( under review)
10. L. Lonappan, T. Rouissi, Y. Liu, S.K. Brar, M. Verma, R.Y. Surampalli, Removal of
diclofenac using micro-biochar fixed-bed column bioreactor, Journal of Environmental
Chemical Engineering ( submitted )

XVII
PUBLICATIONS EN DEHORS DE CETTE THÈSE
1. R.K. Das, L. Lonappan, S.K. Brar, M. Verma, Bio-conversion of apple pomace into
fumaric acid in a rotating drum type solid-state bench scale fermenter and study of the
different underlying mechanisms, RSC Advances 5 (2015) 104472-104479.
2. M. Taheran, S. Komtchou, L. Lonappan, T. Naji, S. K. Brar, M. Cledon, Environmental
Issues of Polybrominated Diphenyl Ethers – a review, Critical Reviews in Environmental
Science and Technology, 47(2017) 1107-1142.
3. R.K Das, V. L Pachapur, L. Lonappan, R. Pulicharla, S. Maiti, M. Cledon, L. M. A.
Dalila, S. J. Sarma , S.K Brar Biological Synthesis of Metallic Nanoparticles: Plants,
Animals and Microbial Aspects, Nano Technology for Environmental Engineering, 2
(2017) 1-18.
4. Y. Liu, Y. Wang, H. Lu, L. Lonappan, S.K. Brar, L. He, J. Chen, S. Yang, Biochar
application as a soil amendment for decreasing cadmium availability in soil and
accumulation in Brassica chinensis , Journal of Soils and Sediments (accepted for
publication).
5. R. Pulicharla, L. Lonappan, S.K. Brar, M. Verma. Production of renewable C5 platform
chemicals and potential applications, chapter in Platform Chemical Biorefinery: Future
Green Chemistry, Elsevier, 2016.
6. L. Lonappan, S.K Brar, R.Y. Surampalli Developments in Radioactive Waste
Management: Storage and Disposal and Impact on Human and Ecosystems, chapter in
Handbook of Environmental Engineering, McGraw-Hill Education (in press), 2017.
7. L. Lonappan, T.Guedri, T. Rouissi, S.K. Brar, R.Galvez, Chlorpyrifos degradation by
crude enzyme extracts obtained from Alcanivorax borkumensis, ACS Symposium
Series : Integrated and Sustainable Environmental Remediation (accepted for
publication ).
8. Y. Liu, L. Lonappan, S.K Brar, S. Yang, Impact of biochar amendment in agricultural
soils on the adsorption, desorption and degradation of pesticides: A review, Science of
the Total Environment (under review)

XVIII
CONGRES ET CONFÉRENCES
1. L. Lonappan, R. Pulicharla, S. Auger, S.K. Brar, M. Verma, R.Y. Surampalli, Fate of
anti-inflammatory drug diclofenac in municipal wastewater treatment plant:
quantification using LDTD coupled with tandem mass spectrometry. 63rd ASMS
Conference on Mass Spectrometry and Allied Topics; May 31 - June 4, 2015 -
America's Center, St. Louis, Missouri
2. L. Lonappan, R. Pulicharla, M. Naghdi, S.K Brar, An efficient and sustainable approach
for remediation of emerging contaminants in soil through biochar enzyme immobilized –
system. 5th
international Eco summit; 29 August-1 September 2016, Montpellier,
France
3. L. Lonappan, T. Rouissi, S.K. Brar, Eco-friendly degradation of diclofenac by
ligninolytic enzyme laccase and identification of transformation products. 31st
Eastern
Canadian Symposium on water quality research; 19 May 2017, Laval University,
Quebec,Canada

XIX
TABLE DES MATIÈRES
REMERCIEMENTS .................................................................................................................... V
RÉSUMÉ ................................................................................................................................ VII
ABSTRACT .............................................................................................................................. XI
PUBLICATIONS DE CETTE THÈSE ............................................................................................. XV
PUBLICATION EN DEHORS DE CETTE THÈSE .......................................................................... XVII
CONGRES ET CONFÉRENCES ................................................................................................ XVIII
TABLE DES MATIÈRES ........................................................................................................... XIX
LISTE DES TABLEAUX ........................................................................................................... XXV
LISTE DES FIGURES............................................................................................................. XXVII
LISTE DES ABRÉVIATIONS .................................................................................................... XXXI
CHAPTER 1 SYNTHÈSE ...............................................................................................................1 PARTIE 1: INTRODUCTION ............................................................................................................................. 3 PARTIE 2: REVUE DE LITTÉRATURE ................................................................................................................ 5
2.1 Les contaminants préoccupants - composés pharmaceutiquement actifs (PhACs) ............................ 5 2.2 Les anti-inflammatoires non stéroïdiens (NSAIDs) - Diclofenac (DCF) ................................................ 6 2.3. Devenir du DCF dans l'environnement ............................................................................................... 9 2.4 Préoccupations concernant la toxicité du DCF .................................................................................. 11 2.5 Métabolites DCF et produits de transformation ............................................................................... 14 2.6 Scénario de traitement actuel pour l’enlèvement du DCF de l'environnement ............................... 15
PARTIE 3: PROBLÉMATIQUE ........................................................................................................................ 26 PARTIE 4: HYPOTHÈSES, OBJECTIFS ET ORIGINALITÉ ................................................................................... 29
4.1 Hypothèses ........................................................................................................................................ 29 4.2 Objectifs de recherche ...................................................................................................................... 31 4.3 Originalité du travail .......................................................................................................................... 34
PARTIE 5: SOMMAIRE DES DIFFÉRENTS VOLETS DE RECHERCHE EFFECTUÉS DANS CETTE ÉTUDE ............. 36 5.1 Le devenir de DCF dans les stations d'épuration et la méthode novatrice et rapide pour la
quantification du DCF dans des eaux usées et des boues d’épuration .......................................................... 37 5.2. Identification et caractérisation des microbiochars et des études d'adsorption pour l'élimination
du DCF ............................................................................................................................................................ 39 5.3 La production et l'immobilisation de laccase sur les microbiochars pour le retrait du diclofenac ... 41 5.4 Élimination du Diclofenac par le bioréacteur sur colonne à lit fixe ................................................... 43
BIBLIOGRAPHIE ............................................................................................................................................ 46
CHAPTER 2 DICLOFENAC: OCCURRENCE, FATE AND ANALYSIS .................................................. 55 PART 1 DICLOFENAC AND ITS TRANSFORMATION PRODUCTS: ENVIRONMENTAL OCCURRENCE AND
TOXICITY - A REVIEW ........................................................................................................................................... 57 RÉSUMÉ............................................................................................................................................... 58 ABSTRACT ............................................................................................................................................ 59
1. Introduction ................................................................................................................................ 60 2. Global consumption .................................................................................................................... 62 3. Legislation ................................................................................................................................... 63 4. Environmental fate ..................................................................................................................... 65

XX
5. Toxicity ........................................................................................................................................ 69 6. Metabolites ................................................................................................................................. 73 7. Interactions with other pollutants- proposed approach ........................................................... 75 8. Conclusions ................................................................................................................................. 79 Acknowledgements ........................................................................................................................ 80 References ...................................................................................................................................... 81
PART 2 DICLOFENAC IN MUNICIPAL WASTEWATER TREATMENT PLANT: QUANTIFICATION USING LASER DIODE THERMAL DESORPTION- ATMOSPHERIC PRESSURE CHEMICAL IONIZATION- TANDEM MASS SPECTROMETRY APPROACH IN COMPARISON WITH AN ESTABLISHED LIQUID CHROMATOGRAPHY-ELECTROSPRAY IONIZATION-TANDEM MASS SPECTROMETRY METHOD ......................................................... 103
RÉSUMÉ............................................................................................................................................. 104 ABSTRACT .......................................................................................................................................... 105
1. Introduction .............................................................................................................................. 106 2. Materials and methods ............................................................................................................. 107
2.1. Reagents ............................................................................................................................ 107 2.2 Wastewater treatment plant, sampling and sample storage ............................................. 108 2.3 Sample preparation ............................................................................................................ 109 2.4 Extraction ........................................................................................................................... 109 2.5 Solid phase extraction ........................................................................................................ 110 2.6 LDTD-APCI-MS/MS analysis ................................................................................................ 111 2.7 LC-ESI-MS/MS analysis ....................................................................................................... 112 2.8 Data and statistical analysis ............................................................................................... 113
3. Results and Discussion .............................................................................................................. 113 3.1 Quality assurance ............................................................................................................... 113 3.2 LDTD –APCI –MS/MS method ............................................................................................ 114 3.3 Comparison of measured DCF levels in WW and WWS using an established LC-ESI MS/MS
method versus LDTD-APCI -MS/MS approach ................................................................................. 115 3.4 Comparison of USE and ASE methods ................................................................................ 117 3.5 Application of optimized method for the fate study of DCF in WWTP .............................. 118
4. Conclusion ................................................................................................................................ 120 Acknowledgements ...................................................................................................................... 120 References .................................................................................................................................... 121
CHAPTER 3 IDENTIFICATION AND CHARACTERIZATION OF MICRO-BIOCHARS AND ADSORPTION STUDIES FOR THE REMOVAL OF DICLOFENAC .............................................................................. 129
PART 1 ADSORPTION OF METHYLENE BLUE ON BIOCHAR MICROPARTICLES DERIVED FROM DIFFERENT WASTE MATERIALS ........................................................................................................................................... 131
RÉSUMÉ............................................................................................................................................. 132 ABSTRACT .......................................................................................................................................... 133
1. Introduction .............................................................................................................................. 134 2. Materials and Methods ............................................................................................................ 136
2.1 Materials ............................................................................................................................ 136 2.2 Biochar microparticles preparation .................................................................................... 137 2.3 Biochar and microparticles characterization ...................................................................... 137 2.4 Adsorption studies ............................................................................................................. 138
3. Results and Discussion .............................................................................................................. 140 3.1 Biochar characterization .................................................................................................... 140 3.2 Adsorption studies ............................................................................................................. 143
4. Conclusions ............................................................................................................................... 147 Acknowledgement(s): ................................................................................................................... 147 References .................................................................................................................................... 148
PART 2 AN INSIGHT INTO THE ADSORPTION OF DICLOFENAC ON DIFFERENT BIOCHARS: MECHANISMS, SURFACE CHEMISTRY, AND THERMODYNAMICS .............................................................................................. 161

XXI
RÉSUMÉ............................................................................................................................................. 162 ABSTRACT .......................................................................................................................................... 163
1. Introduction .............................................................................................................................. 164 2. Material and methods .............................................................................................................. 166
2.1. Materials ........................................................................................................................... 166 2.2 Methods ............................................................................................................................. 167
3 Results and discussion ............................................................................................................... 170 3.1 Physico-chemical properties of biochar ............................................................................. 170 3.2 Microparticles and adsorption ........................................................................................... 173 3.3 Equilibrium studies and kinetic models .............................................................................. 176 3.4 Adsorption isotherm modeling .......................................................................................... 177 3.5 pH effect on adsorption of DCF .......................................................................................... 178 3.6 Thermodynamics of DCF adsorption .................................................................................. 180
4. Conclusions ............................................................................................................................... 182 Acknowledgement(s) .................................................................................................................... 182 References .................................................................................................................................... 183
PART 3 ADSORPTION OF DICLOFENAC ONTO DIFFERENT BIOCHAR MICROPARTICLES: DATASET - CHARACTERIZATION AND DOSAGE OF BIOCHAR .............................................................................................. 193
RÉSUMÉ............................................................................................................................................. 194 ABSTRACT .......................................................................................................................................... 195
Specifications ................................................................................................................................ 196 Value of the data .......................................................................................................................... 197 1. Data........................................................................................................................................... 197 2. Experimental Design, Materials and Methods ......................................................................... 197
2.1 Biochar microparticle preparation ..................................................................................... 197 2.2 Characterization of biochar microparticles ........................................................................ 198 2.3 Adsorption studies ............................................................................................................. 198
Acknowledgements ...................................................................................................................... 199 References .................................................................................................................................... 200
PART 4 DEVELOPMENT OF BIOCHAR BASED GREEN FUNCTIONAL MATERIALS USING ORGANIC ACIDS FOR THE REMOVAL OF DICLOFENAC ........................................................................................................................ 205
RÉSUMÉ............................................................................................................................................. 206 ABSTRACT .......................................................................................................................................... 207
1. Introduction .............................................................................................................................. 208 2. Materials and Methods ............................................................................................................ 210
2.1 Materials ............................................................................................................................ 210 2.2 Methods ............................................................................................................................. 211
3. Results and discussion .............................................................................................................. 214 3.1 Characterization of non-functionalized and functionalized biochars ................................ 214 3.2 Functionalization effect on different Biochars ................................................................... 215 3.3 Diclofenac removal by functionalized biochars .................................................................. 219
4. Conclusions ............................................................................................................................... 220 Acknowledgements ...................................................................................................................... 221 References .................................................................................................................................... 222
CHAPTER 4 LACCASE ENZYMES: PRODUCTION; IMMOBILIZATION OF ENZYMES ON MICRO-BIOCHARS AND DEGRADATION OF DICLOFENAC ......................................................................... 235
PART 1 AGRO-INDUSTRIAL PRODUCED LACCASE FOR DEGRADATION OF DICLOFENAC AND IDENTIFICATION OF TRANSFORMATION PRODUCTS ........................................................................................ 237
RÉSUMÉ............................................................................................................................................. 238 ABSTRACT .......................................................................................................................................... 239
1. Introduction .............................................................................................................................. 240 2. Materials and methods ............................................................................................................. 242

XXII
2.1 Chemicals and reagents ..................................................................................................... 242 2.2 Production of laccase ......................................................................................................... 242 2.3 DCF degradation experiments - methodology ................................................................... 244 2.4 DCF analysis and identification of transformation products .............................................. 246 2.5 Statistical analysis ............................................................................................................... 247
3. Results and Discussion .............................................................................................................. 247 3.1 Laccase production ............................................................................................................. 247 3.2 Effect of various inducers ................................................................................................... 248 3.3 Degradation of DCF ............................................................................................................ 251
4. Conclusions ............................................................................................................................... 255 Acknowledgement(s): ................................................................................................................... 255 References .................................................................................................................................... 256
PART 2 ADSORPTIVE IMMOBILIZATION OF AGRO-INDUSTRIALLY PRODUCED CRUDE LACCASE ON VARIOUS MICRO-BIOCHARS AND DEGRADATION OF DICLOFENAC ................................................................. 269
RÉSUMÉ............................................................................................................................................. 270 ABSTRACT .......................................................................................................................................... 271
1. Introduction .............................................................................................................................. 272 2. Materials and Methods ............................................................................................................ 273
2.1 Materials ............................................................................................................................ 273 2.2 Methods ............................................................................................................................. 274
3. Results and discussion .............................................................................................................. 277 3.1 Laccase: concentration by ultrafiltration and enzyme activity .......................................... 277 3.2 Characterization of laccase-immobilized biochar .............................................................. 278 3.3 Adsorptive immobilization of laccase onto micro-biochars ............................................... 279 3.4 Loading efficiency and isotherms ....................................................................................... 281 3.5 Release kinetics (de-immobilization) of immobilized laccase ............................................ 283 3.6 Removal of DCF using laccase immobilized biochars ......................................................... 284 3.7 Storage and stability and shelf-life of immobilized laccase ................................................ 285
4. Conclusions ............................................................................................................................... 286 Acknowledgement(s) .................................................................................................................... 286 References .................................................................................................................................... 287
PART 3 COVALENT IMMOBILIZATION OF LACCASE ON CITRIC ACID FUNCTIONALIZED MICRO-BIOCHARS DERIVED FROM DIFFERENT FEEDSTOCKS AND REMOVAL OF DICLOFENAC ..................................................... 299
RÉSUMÉ............................................................................................................................................. 300 ABSTRACT .......................................................................................................................................... 301
1. Introduction .............................................................................................................................. 302 2. Materials and Methods ............................................................................................................ 304
2.1 Materials ............................................................................................................................ 304 2.2 Enzyme assay ...................................................................................................................... 305 2.3 Covalent immobilization of concentrated crude laccase on micro-biochars ..................... 305 2.4 Stability, release and reusability of laccase immobilized on micro-biochars ..................... 307 2.5 Characterization of micro-biochars with covalently bound laccase ................................... 307 2.6 Diclofenac degradation experiments ................................................................................. 308 2.7 Quality control .................................................................................................................... 309
3. Results and discussion .............................................................................................................. 309 3.1 Characterization of micro-biochars covalently bound with laccase ................................... 309 3.2 Covalent immobilization of laccase on untreated micro-biochars ..................................... 310 3.3 Citric acid functionalized micro-biochars and glutaraldehyde ........................................... 313 3.4 Stability of immobilized laccase ......................................................................................... 314 3.5 Application of laccase immobilized micro-biochars for removal of DCF ............................ 317
4. Conclusions ............................................................................................................................... 319 Acknowledgements ...................................................................................................................... 320 References .................................................................................................................................... 320

XXIII
CHAPTER 5 THE BIOCHAR- ENZYME IMPREGNATED MICROSYSTEM ....................................... 331 REMOVAL OF DICLOFENAC USING MICROBIOCHAR FIXED-BED COLUMN BIOREACTOR .......................... 333
RÉSUMÉ............................................................................................................................................. 334 ABSTRACT .......................................................................................................................................... 335
1. Introduction .............................................................................................................................. 336 2. Material and methods .............................................................................................................. 338
2.1 Materials ............................................................................................................................ 338 2.2 Methods ............................................................................................................................. 339
3. Results and discussion .............................................................................................................. 342 3.1 Characterization of biochars and immobilization of laccase on microbiochars ................. 342 3.2 Adsorption of diclofenac onto biochars ............................................................................. 344 3.3 Fixed bed adsorption columns under various experimental conditions ............................ 345 3.4 Dynamic modeling of breakthrough curves ....................................................................... 346 3.5 Microbiochar fixed-bed column bioreactor ....................................................................... 349
4. Conclusions ............................................................................................................................... 350 Acknowledgement(s) .................................................................................................................... 350 References .................................................................................................................................... 351
CHAPTER 6 CONCLUSIONS ET RECOMMANDATIONS .............................................................. 363 CONCLUSIONS............................................................................................................................... 365 RECOMMANDATIONS ................................................................................................................... 368
ANNEXES ............................................................................................................................. 371

XXIV

XXV
LISTE DES TABLEAUX
CHAPTER 1
Tableau 1: Les propriétés physico-chimiques et les propriétés pharmacologiques de diclofénac ....... 7
Tableau 2: Devenir du Diclofénac dans les usines de traitement des eaux usées ............................. 17
CHAPTER 2
PART 1
Table 1: Physico-chemical and pharmacological properties of diclofenac (in unionized form) .......... 91
Table 2: Removal of diclofenac in wastewater treatment plants ......................................................... 92
Table 3: Recent occurrences of diclofenac in aquatic environment .................................................... 96
Table 4: Human metabolites of diclofenac .......................................................................................... 99
PART 2
Table 1: Physico-chemical and pharmacological properties of diclofenac ........................................ 124
CHAPTER 3
PART 1
Table 1: Ash content and moisture content ....................................................................................... 151
Table 2: Micro particles- Particle size distribution ............................................................................. 152
Table 3: Langmuir and Freundlich adsorption isotherm constants ................................................... 153
Table 4: Specific surface area of various biochars ............................................................................ 154
PART 2
Table 1: Kinetic parameters for the adsorption of DCF onto biochar microparticles, BC-PW and BC-
PM ...................................................................................................................................................... 186
Table 2: Isotherm parameters adsorption of DCF onto biochar microparticles, BC-PW and BC-PM at
equilibrium conditions ........................................................................................................................ 187
XXVI
Table 3: Thermodynamic parameters for the adsorption of DCF onto biochar microparticles, BC-PW
and BC-PM ......................................................................................................................................... 188
PART 3
Table 1: Effect of adsorbent dosage on adsorption amount and removal efficiency ........................ 201
PART 4
Table 1: Molarities of various acids used for functionalization of biochars ....................................... 225
Table 2: Elemental composition of biochars - before and after functionalization .............................. 226
Table 3: Total acidic functional groups, zeta potential and shift in FTIR peaks in functionalized and
non-functionalized biochars ............................................................................................................... 228
CHAPTER 4
PART 1
Table 1: Effect of various inducers on laccase production ................................................................ 260
Table 2: Diclofenac major transformation products- initial hours ...................................................... 262
PART 2
Table 1: Immobilization efficiency of laccase at various activities on micro-biochars ....................... 290
Table 2: Langmuir and Freundlich adsorption isotherm constants for micro-biochar for laccase
adsorption .......................................................................................................................................... 291
Table 3: Desorption kinetics of laccase from biochars ...................................................................... 292
CHAPTER 5
Table 1: Chemical composition of pinewood (BC-PW) and pig manure (BC-PM) biochars ............. 353
Table 2: Model parameters of fixed-bed column adsorption of DCF onto biochars; (BC-PW) and pig
manure (BC-PM) biochar ................................................................................................................... 355
XXVII
LISTE DES FIGURES
CHAPTER 1
Figure 1: Méthodes d'immobilisation des enzymes ............................................................................. 25
Figure 2: Grands escaliers dans le travail de recherche ..................................................................... 45
CHAPTER 2
PART 1
Figure 1: Entry routes of diclofenac to the environment ................................................................... 100
Figure 2: Hypothetical representation of a typical secondary treatment system in wastewater
treatment plant showing interaction of diclofenac with other pollutants ............................................ 101
PART 2
Figure 1: Chromatograms - representative peaks of diclofenac in: (a) wastewater with LC-ESI-
MS/MS; (b) wastewater sludge with LC-ESI-MS/MS ........................................................................ 125
Figure 2: Chromatogram – representative peaks of diclofenac in: (a) wastewater with LDTD-APCI-
MS/MS; (b) wastewater sludge with LDTD-APCI-MS/MS ................................................................. 126
Figure 3: Fate and partitioning of diclofenac (with mean concentration of DCF (mean± SD, n=3)) in
CUQ wastewater treatment plant ....................................................................................................... 127
CHAPTER 3
PART 1
Figure 1: Scanning electron microscopy images of biochars ............................................................ 155
Figure 2: Effect of adsorbent dosage on adsorption capacity ........................................................... 156
Figure 3: Adsorption capacity of Biochar microparticles ................................................................... 157
Figure 4: Adsorption isotherms of different biochar samples ............................................................ 158
Figure 5: Particle size distribution of biochar: (A) as obtained; (B) biochar microparticles ............... 159

XXVIII
PART 2
Figure 1: Particle size distribution of biochar microparticles ............................................................. 189
Figure 2: Biochar microparticles and diclofenac removal efficiency.................................................. 190
Figure 3: Effect of pH and zeta potential on removal efficiency of diclofenac.................................. 191
PART 3
Figure 1: Scanning electron micrographs of biochars ....................................................................... 202
Figure 2: Fourier transforms infra-red spectra and of biochars ........................................................ 203
Figure 3: X-ray diffraction curve of biochars ...................................................................................... 204
PART 4
Figure. 1: Particle size of biochars used ............................................................................................ 229
Figure 2: Representative scanning electron micrographs of non-functionalized and citric acid
functionalized biochars. ..................................................................................................................... 230
Figure 3: FTIR spectrum – functionalization of pinewood biochar using organic acids .................... 231
Figure 4: FTIR spectrum – functionalization of pig manure biochar using organic acids ................. 232
Figure 5: FTIR spectrum – functionalization of almond shell biochar using organic acids. .............. 233
Figure 6: Functionalized biochars and removal of diclofenac ........................................................... 234
CHAPTER 4
PART 1
Figure 1: Production of laccase using alfa plant fibers , apple pomace and pulp and paper solid
waste as substrates ........................................................................................................................... 263
Figure 2: Diclofenac degradation over time, laccase activity = 50 U L-1
; pH = 6.5 ........................... 264
Figure 3: Laccase mediated diclofenac degradation, (A) with pH (at a constant temperature, 25 °C);
(B) with temperature (at a constant pH, 6.5) ..................................................................................... 265
Figure 4: Laccase mediated diclofenac degradation at various laccase activities ............................ 266
Figure 5: Proposed laccase mediated diclofenac degradation pathway ........................................... 267

XXIX
PART 2
Figure 1: SEM of micro-biochars before and after laccase immobilization ....................................... 293
Figure 2: FTIR spectra of micro-biochars before and after laccase immobilization .......................... 294
Figure 3: Laccase loading on non-functionalized biochars at different laccase activities ................. 293
Figure 4: Laccase loading on functionalized biochars at 10 U mL-1
laccase activity ........................ 296
Figure 5: Release (de-immobilization) of immobilized laccase on micro-biochars ........................... 297
Figure 6: Removal of DCF using enzyme immobilized micro-biochar over time .............................. 298
PART 3
Figure 1: Scanning electron micrographs of biochars before (A (pinewood biochar), C (pig manure
biochar), E (almond shell biochar)) and after (B, D, and F respectively) laccase immobilization ..... 324
Figure 2: FTIR spectra of micro-biochars before and after laccase immobilization .......................... 325
Figure 3: Covalent-immobilization of laccase onto micro-biochars by different methods ................. 326
Figure 4: FTIR spectra of citric acid functionalized micro-biochars ................................................... 327
Figure 5: Covalent-immobilization of laccase onto citric acid functionalized micro-biochars ........... 328
Figure 6: Figure 6: Effect of A) pH; B) temperature and; C) 5 weeks storage on activity of covalently
immobilized laccase on citric acid functionalized micro-biochars ..................................................... 329
Figure 7: (A) Diclofenac removal by laccase immobilized micro-biochars and; (B) operational stability
of laccase immobilized micro-biochars .............................................................................................. 330
CHAPTER 5
Figure 1: Particle size distribution of biochar ..................................................................................... 356
Figure 2: Thermogravimetric profiles of biochar: Pinewood biochar (BC-PW), Pig Manure biochar
(BC-PM) ............................................................................................................................................. 357
Figure 3: Scanning electron micrographs of biochar: (A) Pinewood biochar (BC-PW), (B) Pig Manure
biochar (BC-PM) ................................................................................................................................ 358
XXX
Figure 4: Fourier transform infra-red spectra for biochar- pine wood biochar (BC-PW) and pig
manure biochar (BC-PM) ................................................................................................................... 359
Figure 5: Breakthrough curves with different initial diclofenac concentrations: (A) pinewood biochar
(BC-PW) and (B) pig manure biochar (BC-PM) ................................................................................. 360
Figure 6: Breakthrough curves with different bed heights: (A) pine wood biochar (BC-PW) and (B)
pig manure biochar (BC-PM) ............................................................................................................. 361
Figure 7: Degradation of diclofenac in microbiochar fixed bed column bioreactor ........................... 362
XXXI
LISTE DES ABRÉVIATIONS
ANOVA Analysis of variance
AOP Advanced oxidation processes
APCI Atmospheric pressure chemical ionization
ASE Accelerated solvent extraction
BC-AS Biochar- almond shell
BC-PM Biochar- pig manure
BC-PW Biochar- pine wood
BEMS Biochar-enzyme impregnated microsystem
BET Brunauer, Emmett and Teller
DCF Diclofenac
EC Emerging contaminant
EC50 Effective concentration- half maximal
EDTA Ethylenediaminetetraacetic acid
EMA European medicines agency
EML Emergency medical list
EQS Environmental quality standards
ESI Electrospray ionization
FTIR Fourier transform infrared spectroscopy
HRT Hydraulic retention time
IMS Intercontinental Marketing Services
IUCN International union for conservation of nature

XXXII
IUPAC International union of pure and applied chemistry
LC-MS/MS Liquid chromatography-tandem mass spectrometry
LDTD-MS/MS Laser diode thermal desorption-tandem mass spectrometry
LME Lignin-modifying enzyme
LPO Lipid peroxidation
MB Methylene blue
MBR Membrane bioreactor
MLSS Mixed liquor suspended solids
MWCNT Multiwalled carbon nanotubes
NSAID Non-steroidal anti-inflammatory drug
PhAC pharmaceutically active compound
SEM Scanning electron microscope
SRT Sedimentation retention Time
USE Ultrasonic extraction
WW Wastewater
WWS Wastewater sludge
WWTP Wastewater treatment plant
XRD X-ray diffraction
YES Yeast estrogen screen
1
CHAPTER 1
SYNTHÈSE

2

3
PARTIE 1: INTRODUCTION
Les contaminants d'intérêt émergent (CEC) ont attiré l'attention au cours des dernières décennies
en raison de leurs impacts négatifs sur les humains et l`écosystème. Les produits pharmaceutiques
et de soins personnels (PPCPs) représentent un large éventail de CECs et sont de plus en plus
détectés dans le milieu aquatique. Les composés pharmaceutiquement actifs (PhACs) forment l'une
des classes les plus remarquables des produits pharmaceutiques qui, par une voie ou par une autre,
entrent dans l'environnement en tant que composé parent ou en tant que métabolites
pharmacologiquement actifs. Parmi les PhACs, les anti-inflammatoires non stéroïdiens (NSAIDs)
sont largement utilisés dans le monde et détectés dans différents compartiments environnementaux
à des concentrations allant de ng L-1
à mg L-1
(Collins and Dobson, 1997; Halling-Sørensen et al.,
1998).
Le diclofénac (DCF), souvent reconnu comme l'analgésique le plus populaire au monde, est
également le médicament anti-inflammatoire non stéroïdien le plus utilisé (NSAID), avec une part de
marché proche de celle des trois médicaments les plus populaires (ibuprofène, méfénamique acide,
naproxène) (McGettigan and Henry, 2013). Des estimations récentes font état d'une consommation
mondiale de DCF de 1443 ± 58 tonnes/an (Acuña et al., 2015). Habituellement, les médicaments
sont développés dans l'intention d'avoir un effet biologique bénéfique sur l'organisme auquel ils sont
administrés, bien que beaucoup de ces composés passent souvent dans l'environnement où ils
peuvent exercer un effet biologique indésirable (Halling-Sørensen et al., 1998).
Souvent, le DCF n'est pas complètement éliminé des usines de traitement des eaux usées (WWTP)
en raison de sa faible dégradation et de ses taux de consommation plus élevés (Fatta-Kassinos et
al., 2011; Zorita et al., 2009). Par conséquent, le DCF est fréquemment détecté dans les eaux de
surface, les sédiments et les boues (Kunkel and Radke, 2012; Langford et al., 2011). Relativement
récemment, le DCF a attiré davantage l'attention en raison de sa présence fréquente dans les
sources d'eau potable et de ses effets nocifs sur de nombreux organismes à des concentrations

4
significatives (Cleuvers, 2004; Oaks et al., 2004). Les systèmes conventionnels de traitement des
eaux usées ont obtenu une efficacité d'élimination modérée à élever pour le DCF. L'efficacité
d'élimination du système conventionnel de traitement des eaux usées pour le diclofénac variait entre
30 et 70% et une grande partie de cette élimination est comptabilisée par l'adsorption sur les boues
(Vieno and Sillanpää, 2014; Zhang et al., 2008). Cependant, des concentrations de DCF aussi
basses que 1 μg L-1
peuvent entraîner des dommages environnementaux, tel que l'effet toxique
envers certaines espèces de poissons (Schwaiger et al., 2004; Triebskorn et al., 2004). Par
conséquent, il est nécessaire d'éliminer complètement et efficacement le DCF et ses résidus de
l'environnement.
Au cours des dernières décennies, l'adsorption est apparue comme une méthode de traitement
efficace pour l'élimination de divers contaminants, y compris les composés organiques traces
(contaminants émergents). Récemment, le biochar est devenu un adsorbant efficace et rentable
pour divers contaminants émergents. La structure poreuse et les caractéristiques chimiques de
surface, telles que la présence de divers groupes fonctionnels, font du biochar un excellent
adsorbant pour les PhAC’s et DCF en particulier. Les enzymes ligninolytiques, la laccase en
particulier, se sont également avérées efficaces pour le traitement de plusieurs contaminants
émergents (Gassara et al., 2013b). Plusieurs procédés d'oxydation avancés (AOPs) sont
actuellement appliqués pour le traitement des contaminants émergents. Cependant, ces processus
peuvent produire des produits de transformation qui peuvent être encore plus toxiques que le
composé d'origine. Malgré tout, il est peu probable qu'un traitement enzymatique conduise à la
formation d'un produit de transformation toxique. Dans les deux cas, une élucidation plus poussée
de la nature des produits de dégradation est nécessaire pour évaluer l'efficacité globale du
traitement.
Dans ce projet de recherche, un procédé hybride a été développé en immobilisant des enzymes sur
des microbiochars pour l'élimination du DCF. Cette thèse a été divisée en quatre sections
principales. La première section étudie l'occurrence, le devenir et la toxicité du DCF. En outre, la

5
sortie du DCF a été étudiée dans une station d'épuration conventionnelle et une nouvelle méthode a
été développée pour la quantification du DCF dans les eaux usées et les boues d'épuration. La
deuxième section illustre les propriétés d'adsorption de divers microbiochars. En particulier,
l'élimination du DCF a été étudiée par adsorption sur divers microbiochars et des microbiochar
fonctionnalisés à l'acide organique ont été testés pour une élimination améliorée du DCF. La
troisième section étudie la production rentable d'enzyme laccase ligninolytique pour la dégradation
du DCF. De plus, des méthodes d'adsorption ainsi que d'immobilisation covalente de la laccase sur
des microbiochars ont été étudiées dans cette section. Enfin, la quatrième section traite le
"développement d'un microsystème imprégné de biochar-laccase" pour l'adsorption continue ainsi
que la dégradation du DCF. L'hybride " microsystème imprégné de Biochar-Enzyme " en
encapsulant des enzymes sur le biochar sera prometteur comme une approche efficace,
durable, verte ainsi rentable pour le traitement de DCF, thème clé de cette thèse.
PARTIE 2: REVUE DE LITTÉRATURE
2.1 Les contaminants préoccupants - composés pharmaceutiquement actifs
(PhACs)
Les contaminants émergents comprennent : les produits pharmaceutiques et de soins personnels
(PPCPs), les herbicides, les pesticides et les perturbateurs endocriniens, etc. Ces produits
chimiques sont souvent détectés, comme éléments traces (micropolluants), dans divers
contaminants environnementaux. Pour beaucoup d'entre eux, le risque potentiel pour
l'environnement et la santé humaine est inconnu. Les composés pharmaceutiquement actifs
(PhACs) représentent une classe importante dans les produits pharmaceutiques qui par une façon
ou d'une autre se diffusent dans l’environnement en tant que composé parent ou sous forme de
métabolites pharmacologiquement actifs (Halling-Sørensen et al., 1998). La consommation
mondiale des composés actifs est estimée à 100.000 tonnes ou plus par an (Kummerer, 2004). La

6
mise au point des médicaments a pour objectif d’apporter un effet biologique bénéfique sur
l'organisme auquel ils sont administrés. Néanmoins, un effet biologique indésirable peut s’exercé par
ces composés sur l'environnement (Halling-Sørensen et al., 1998). La présence globale de
composés pharmaceutiques et de PhACs dans l’environnement aquatique est une problématique
émergente dont les conséquences demeurent inconnues.
2.2 Les anti-inflammatoires non stéroïdiens (NSAIDs) - Diclofenac (DCF)
Les médicaments anti-inflammatoires non stéroïdiens (NSAIDs) sont des PhACs largement utilisés
dans le monde entier. Ils sont détectés dans différents compartiments de l'environnement à des
concentrations allant de ng L-1
à faible mg L-1
(Halling-Sørensen et al., 1998; Khetan and Collins,
2007). De plus, les NSAIDs sont des médicaments <<over-the-counter >>(OTC) dans la plupart des
pays ce qui contribue à l’augmentation de la disponibilité et de la consommation. Le Diclofénac
(DCF), reconnu comme l’«antidouleur le plus populaire du monde», est aussi le NSAIDs le plus
couramment utilisé. Sa part de marché correspond presque à celle des trois autres médicaments les
plus répandus (ibuprofène, l'acide méfénamique, le naproxène) combinées (McGettigan and Henry,
2013). Le nom de diclofenac est dérivé de sa nomenclature: 2-(2,6-dichloranilino) acide
phénylacétique. Il a été découvert, en 1973, par la société pharmaceutique suisse Ciba-Geigy
(maintenant fusionné à Novartis). Le DCF est couramment utilisé pour réduire l'inflammation et pour
soulager la douleur dans des cas, tels que l'arthrite ou les blessures graves. Il fonctionne aussi
comme anti-uricosurique et analgésique.

7
Tableau 1: Les propriétés physico-chimiques et les propriétés pharmacologiques de
diclofénac
Structure
Formule moléculaire et poids moléculaire
C14H11Cl2NO2; 296,16 g mol-1
N ° CAS
15307-86-5
15307-79-6 (sel disodique)
Solubilité dans l'eau
2,37 mg L-1
(25 ° C)
Constante de la loi de Henry
4,79 × 10⁻⁷
Pa m3 mol
-1 (25 ° C)
Les points de fusion et d'ébullition
283-285 °C et 412 °C à 760 mm Hg (prédite),
respectivement
pKa
4.15
Log Kow (logarithme du coefficient de partage
octanol-eau)
4.51
Référence : syrres.com, www.sigmaaldrich.com, www.drugbank.ca, www.scbt.com
Le médicament présente une mauvaise solubilité dans l'eau dans son état libre. En général, il est
utilisé sous forme de sels de sodium ou de potassium pour améliorer la solubilité et l'absorption. En
outre, la faible constante de Henry (tableau 1) est un indicateur de la mauvaise élimination du
médicament des eaux usées.
8
2.2.1 La consommation mondiale et de la législation
Pour diverses raisons, il est pratiquement impossible de calculer la consommation globale exacte de
diclofénac. En autres, l'utilisation des différents noms commerciaux pour le DCF, les diverses
applications (p. ex. la médecine humaine et vétérinaire) et le fait qu’il soit un médicament en vente
libre. Cependant, Zhang et al. (2008) ont estimé, sur une base annuelle, qu'environ 940 tonnes de
DCF sont consommées dans le monde à partir des données de santé de l’Intercontinental Marketing
Services (IMS). Dans 76 pays, représentant environ 96% du marché pharmaceutique mondial de
diclofénac, environ 877 tonnes de diclofénac ont été vendues en 2007 (Zhang et al., 2008).Dans un
rapport de « Fierce Pharma » en 2012, le diclofénac a été répertorié comme la 12e molécule
générique best-seller à l'échelle mondiale. Le total des ventes de diclofenac en 2011 a été estimé à
1,61 milliard de dollars avec une charge des ventes annuelles de 15,5% (Palmer, 2012). De plus,
une étude récente a estimé la consommation mondiale du DCF à 1443 ± 58 tonnes (Acuña et al.,
2015).
La présence du DCF dans l'environnement a été reconnue récemment comme un risque pour la
santé des organismes terrestres. Il est extrêmement toxique pour les vautours, même si elles ne le
consomment pas directement, c’est son utilisation pour le bétail qui a anéanti et menacé les
populations de vautours en Inde, au Pakistan et au Népal puisqu’ils consomment les carcasses de
bétail. L'Inde a été le premier pays à imposer des réglementations sur la consommation du DCF. En
2006, la fabrication et l'utilisation vétérinaire du DCF ont été interdites en Inde (The Drug controller
general, 2006). De plus, en 2008, l'Inde a imposé des restrictions supplémentaires sur l'utilisation du
diclofénac pour les animaux. Une contravention est passible d'une peine d'emprisonnement. En
cette même année, le Népal et le Pakistan ont interdit la drogue à usage vétérinaire suivie par le
Bangladesh en 2010 (K.Venkateshwarlu, 2011). Pour l'usage vétérinaire, le diclofénac ne dispose
pas d'une autorisation de commercialisation centralisée de l'Agence européenne des médicaments
(AEM) et il est autorisé de façon indépendante dans chaque État membre. En outre, l'AEM a fixé
une limite maximale de résidus pour le DCF dans les espèces bovine et porcine. Depuis 2013, la
9
production commerciale du DCF a commencé en Espagne et en Italie et l’exportation s’est effectuée
vers les autres pays de l'Union européenne. Une coalition de célèbres organisations, dont la
Fondation pour la conservation des Vautours, La Société royale pour la protection des oiseaux,
BirdLife Europe, et le Groupe de spécialistes de l'IUCN Vautour, font campagne pour mettre en
place un imposé qui interdit, à l'échelle du continent européen et suivant les leçons de l’expérience
indienne, le diclofénac vétérinaire (BirdLife, 2013; Tavares, 2014a; Tavares, 2014b). Récemment, le
Diclofénac a été ajouté aux normes de qualité environnementale (NQE) de l'Europe. Selon le
document de la Communauté européenne (COM (2011) 876), la valeur moyenne annuelle de la
NQE (évaluation des normes de qualité) pour le DCF était de 0,1 μg L-1
. Toutefois, ce document a
été modifié et le DCF est mis sur la liste de surveillance jusqu'à prochaine révision (Johnson et al.,
2013). En 2013, le DCF a été inclus dans la liste de surveillance de la « directive-cadre sur l'eau »
afin de recueillir suffisamment de données de surveillance dans le but de la détermination des
mesures de réduction des risques. Selon le document NQE proposé, les concentrations maximales
admissibles sont 0,1 μg L-1
dans les eaux douces et 0,01 μg L-1
dans les eaux marines. Le
Royaume-Uni (RU) a placé le DCF dans « la liste des substances prioritaires » ce qui oblige les
industries de l'eau à mettre en place des technologies de recherche pour enlever le DCF des eaux
usées.
2.3. Devenir du DCF dans l'environnement
2.3.1 Devenir dans l'environnement
Bien qu’ils aient, à la base, une influence positive sur la santé humaine ou animale, les produits
pharmaceutiques ont souvent des effets néfastes sur l'environnement. Lorsqu’ils rentrent en contact
avec ce dernier, ils peuvent affecter les mêmes voies biologiques chez les animaux ayant des
organes cibles, des tissus, des cellules ou biomolécules identiques ou similaires (Fent et al., 2006).
Des études ont démontré les effets négatifs potentiels de diclofénac dans l'environnement
(Cleuvers, 2004; Gros et al., 2010; Kunkel and Radke, 2012; Oaks et al., 2004). Par conséquent, il
10
est important de comprendre l'origine et le devenir des produits pharmaceutiques, et du diclofénac
en particulier, dans l'environnement pour concevoir des mesures appropriées correctives de
pollution. Étant un polluant d'origine anthropique, la source de diclofénac est l'industrie
pharmaceutique, et il est utilisé à la fois pour des fins humaine et vétérinaire. Suite à ces utilisations,
le DCF se retrouve dans les stations d'épuration des eaux usées ou dans les décharges sous forme
de DCF ou un de ses métabolites. De même, le procédé de traitement conventionnel du DCF dans
les stations d'épuration des eaux usées est inefficace (Fatta-Kassinos et al., 2011; Zorita et al.,
2009) et donc le DCF peut se retrouver dans l'eau de surface et la possibilité pour sa percolation
aux sources d'eau potable ne peut pas être annulée. En outre, les probabilités de percolation du
DCF, des décharges jusqu’à l'eau de surface, sont assez élevées. L'effet potentiel néfaste du DCF
dans le milieu aquatique a été révélé dans de nombreuses études (Cleuvers, 2003; Fent et al.,
2006; Jones et al., 2002; Lee et al., 2011).
2.3.2 Présence dans les milieux naturels
Le DCF a été largement détecté dans divers milieux aquatiques. Dans les eaux de surface, il a été
détecté en nano grammes par litre alors que, dans les eaux usées, la concentration était aussi
élevée que des microgrammes par litre. La diminution de la concentration par des processus
naturels, tels que la rétention des sols, la biodégradation et la photo-transformation et également par
des procédés physico-chimiques dans les usines de traitement des eaux usées. Dans les eaux de
surface, la contamination par le DCF a eu lieu dans les rivières, les estuaires et les lacs (Buser et
al., 1998; Kim et al., 2007; Metcalfe et al., 2003; Öllers et al., 2001). En outre, il y a quelques
rapports sur sa détection dans les eaux souterraines et l'eau potable (Benotti et al., 2008; Rabiet et
al., 2006). La plupart des cas de détection concernent les pays de l'UE; toutefois, cela ne signifie
pas que le DCF était présent dans les pays européens. En Asie, les données disponibles étaient
insuffisantes pour prédire les concentrations dans l'environnement, car il n'y avait pas de données
annuelles systématiques. Par rapport à l'Europe, la consommation du DCF en Amérique du Nord

11
était plus faible. Cependant, il n’y a que quelques cas de détection du DCF dans l'environnement qui
soient signalés (Metcalfe et al., 2003; Sosiak and Hebben, 2005).
Plus de 4900 ng L-1 des concentrations en Diclofenac a été détecté au Pakistan dans l'eau des
rivières (Scheurell et al., 2009) et cela peut être dû à un manque de traitement approprié des eaux
usées dans les pays asiatiques. Les masses d'eau allemandes ont également été fortement
polluées par le DCF et des concentrations aussi élevées que 1 030 ng L-1 ont été détectées dans
l'eau des rivières (Heberer, 2002a). De plus, les résidus de DCF ont été détectés dans presque tous
les pays de l'UE (Hernando et al., 2006; Loos et al., 2010). Aux États-Unis et en Allemagne, le DCF
a même été détecté dans l'eau potable ce qui a mérité de l’attention (Benotti et al., 2008; Heberer,
2002b).
Il y a quelques cas signalés de détection du DCF dans le sol. Le Diclofénac pourrait atteindre les
terres agricoles par l'application des boues d'épuration municipales en tant que source de
nutriments dans le sol ou par les eaux usées et il a été détecté dans la province canadienne de
l'Ontario (Al-Rajab et al., 2010). Des études sur le coefficient de sorption de diclofénac ont prouvé
que la sorption, même dans les sédiments sableux, était pertinente et donc le diclofénac était moins
mobile dans les eaux souterraines (Scheytt et al., 2005). D'autre part, des études d'Israël ont
rapporté que le DCF montre une mobilité plus lente dans les sols agricoles riches en matières
organiques et une plus grande mobilité dans les colonnes d'eau douce ce qui a provoqué son
lessivage jusqu’aux eaux souterraines et, en fin de compte, jusqu’à l'eau potable après les
événements de pluie (Chefetz et al., 2008; Drillia et al., 2005). Peu d'autres études ont également
souligné la même possibilité (Chefetz et al., 2008; Xu et al., 2009).
2.4 Préoccupations concernant la toxicité du DCF
De nombreuses études ont été menées dans le monde entier pour évaluer la toxicité des DCF dans
les organismes aquatiques. L'une des méthodes largement utilisées et très standardisées pour

12
mesurer la toxicité était les tests d'immobilisation aiguë. Ce sont eux (Ferrari et al., 2003) qui ont
mené l'une des premières études sur les effets toxiques du DCF. Cette étude a été sur les bactéries,
les algues, les microcrustacés, et les poissons, et a montré des effets relativement moins toxiques,
même à des concentrations environnementales. Au contraire, des études ultérieures ont révélé les
impacts potentiels de diclofénac sur l'environnement. Selon les études d'évaluation des risques, le
risque écologique potentiel du diclofénac dans les eaux de surface était plus élevé(Hernando et al.,
2006). Cleuvers (2004) a mené des études d'écotoxicité en utilisant des tests sur Daphnie aiguë et
les algues et a révélé que le DCF était potentiellement dangereux pour les organismes aquatiques.
Dans la même étude, Cleuvers (2004) révèle également que, sous champs ou sous des
concentrations environnementales, les effets indésirables ont été minimes ou négligeables et qu’un
mélange de produits pharmaceutiques peut être considéré comme toxique, même à des
concentrations plus faibles. Dans les crustacés (Daphnia magna sp.), des concentrations aiguës de
DCF, telles que des mg L-1
, induisent des taux de mortalité élevés. À la base de différentes études
sur l'exposition de 48h, la présence de DCF produit une mortalité élevée et les valeurs de CE50 ont
été signalées à 22,4 mg L-1
et 39,9 mg L-1
(Ferrari et al., 2003; Haap et al., 2008). En outre, pour
Ceriodaphnia dubia sp., la mortalité a été observée et la CE50 était de 22,7 mg L-1
(Ferrari et al.,
2003). Au contraire(Lee et al., 2011) ont rapporté 3 fois des valeurs élevées pour les tests de 48h
EC50 pour la même espèce. Étonnamment, des études de 2007 réalisées au Canada ont signalé
que le DCF était un risque majeur, même à des concentrations prévues dans l'environnement
(Lawrence et al., 2007). Ces études sur les communautés biofilm de rivière ont révélé des impacts
significatifs des DCFs sur la structure des communautés et leurs fonctions sous mêmes
concentrations plus faibles que 100 ng L-1
.
Le DCF était connu pour exercer des effets mortels en endommageant les tissus rénaux et gastro-
intestinaux dans plusieurs vertébrés, tels que les poissons. Dans une étude d'évaluation de
l'exposition (Letzel et al., 2009) ont constaté que, à des concentrations pertinentes pour
l'environnement, telles que nanogrammes par litre, le DCF peut entraîner des effets néfastes

13
chroniques sur les populations de poissons. Chez les poissons, medaka japonaise (Oryzias latipes),
le DCF affecte négativement la croissance en phase d'oeufs et entraîne une réduction significative
des taux d'éclosion et un retard dans l'éclosion (Lee et al., 2011). Dans une étude sur le poisson-
zèbre (Hallare et al., 2004) ont observé les mêmes résultats. L'éclosion a été retardée lorsque
l'éclosion des embryons a été exposée à 2000 µg L-1
. Dans la truite brune, le DCF n'a pas été
complètement éliminé par métabolisme du premier passage, mais une partie importante de DCF est
entrée dans la circulation entéro-hépatique. La résultante prolongeait la disponibilité du DCF dans
l'organisme qui favorise son accumulation (Hoeger et al., 2008). Pour la même espèce, un des
dommages importants sur les branchies, le foie et le rein a été observé à 50 µg L-1
(Hoeger et al.,
2005). Pour la truite arc-en-ciel, même à des concentrations observées pour l'environnement, le
DCF a gêné le fonctionnement biochimique et a conduit à des lésions tissulaires (Mehinto et al.,
2010; Schwaiger et al., 2004). Le DCF peut s'accumuler dans le foie, les reins et les branchies des
tissus musculaires de la truite arc-en-ciel et il peut provoquer des altérations cytologiques même à
1 µg L-1
(Schwaiger et al., 2004; Triebskorn et al., 2004). Les moules sont affectées par le DCF à
des concentrations qui sont répandues dans l'environnement. À des niveaux de concentration de
nanogrammes par litres, le DCF induite significativement à la peroxydation lipidique (POL) indiquant
une lésion tissulaire dans les moules (Schmidt et al., 2011). Une étude relativement récente de
(Gonzalez-Rey and Bebianno, 2014) a démontré qu’à 250 ng L-1
, ce qui est très proche des
concentrations de certains cours d'eau allemandes, le DCF induit à des réponses de biomarqueurs
spécifiques conduisant à l'endommagement des tissus. Il a également une incidence négative sur le
métabolisme et la croissance des moules bleues qui sont communs dans la mer baltique (Ericson et
al., 2010).
C’est l'effondrement soudain de vautour en raison de la consommation de carcasses contenant des
résidus de DCF qui a été le premier cas largement signalé sur les produits pharmaceutiques
causant des dommages écologiques, et qui menace d'extinction plusieurs espèces de vautours
(Oaks et al., 2004; Taggart et al., 2007). Le DCF a été la principale cause de l'effondrement de la

14
population de trois espèces de vautours Gyps (Gyps bengalensis, Gyps indicus, Gyps tenuirostris).
Ces espèces ont été sévèrement touchées. En effet, une réduction de 98% dans le sous-continent
indien a été constatée et il a été inclus pour les espèces, listées par l'IUCN, « en danger critique »
(Das et al., 2010).
2.5 Métabolites DCF et produits de transformation
Après sa consommation par les animaux, le DCF est principalement dégradé en dérivés hydroxylés.
Il est dégradé assez facilement pour des produits de transformation dans l'environnement. Le
principal processus naturel de dégradation est la phototransformation par la lumière du soleil. Le
DCF est l'un des résidus pharmaceutiques le mieux étudiés dans l'environnement; cependant, des
études sur l'apparition et la toxicité de ses métabolites dans l'environnement sont encore mal
comprises.
Dans le corps humain, le dérivé du DCF est trouvé dans l'urine et le plasma. Les dérivés hydroxylés
et méthoxylés de DCF sont présents sous leurs formes libres ainsi que des formes glucuronide
conjuguées. Dans une étude antérieure, Stierlin et al. identifiaient les métabolites du DCF dans le
corps humain et le métabolite principal a été le 4'-hydroxydiclofenac (2-[2,6-dichloro-4
hydroxyphénylamino] d'acide phenylethanoic) (30%) et d'autres métabolites majeurs sont le 5'-
hydroxydiclofenac (2-[2,6-dichlorophénylamino]-5-hydroxyphe acide nylethanoique) (10%), 3'-
hydroxydiclofenac (2-[2,6-dichloro-3-hydro xyphenylamino] acide phenylethanoique) et 4',5-
dihydroxydiclofenac (2-[2,6-dichloro-4-hydroxyphénylamino]-5-acide hydroxyphenylethanoique)
(15%) (Boettcher et al., 1991; Stierlin et al., 1979). Récemment, certains métabolites mineurs ont
également été identifiés dans le corps humain (Stulten et al., 2008a). En plus des dérivés
d'hydroxyle des DCFs, l’acyle glucuronide et l’acyle glucuronide hydroxyle ont également été trouvés
chez les souris et les poissons (Kallio et al., 2010; Naisbitt et al., 2007). La grande présence dans
métabolites humains du diclofénac dans l'eau et sa similitude structurelle au diclofénac est un sujet
de préoccupation pour des raisons de toxicité et doit être étudiée de façon plus poussée.

15
Le DCF est facilement dégradé dans la lumière du soleil. La demi-vie était inférieure à 3,3 h
(Schmitt-Jansen et al., 2007). Il suit une cinétique du premier ordre au cours de la photodégradation
et a été détecté dans le cycle de l'eau.(Qin and Yang, 2012). La photodégradation a été identifiée
comme le principal processus de la dégradation des DCF dans les lacs et il a été estimé qu'environ
90% des DCF ont été éliminés par ce processus (Buser et al., 1998). De nombreux produits issus de
la phototransformation du DCF ont été identifiés par divers chercheurs (Agüera et al., 2005; Moore
et al., 1990; Qin and Yang, 2012). Le procédé le plus important de la phototransformation du DCF a
été identifié comme étant la photocyclisation au carbazole monohalogéné correspondant (Eriksson
et al., 2010). La plupart des produits de décomposition photochimiques se sont produits comme
deux sous-structures principales: 2-chloro- et 2,6-dichlorodiphenylamine et également des dérivés
de 8-hydroxy et 8-chlorocarbazole dérivé (Agüera et al., 2005; Moore et al., 1990).
Le diclofénac ainsi que ses métabolites entrent dans le monde de l'environnement aqueux. Il a été
rapporté que certains des métabolites du DCF sont encore plus toxiques que le DCF. Certains des
produits de phototransformation ont montré une augmentation de six fois la toxicité dans les tests de
reproduction des algales (Schmitt-Jansen et al., 2007; Schulze et al., 2010). Compte tenu des effets
toxiques du diclofénac sur plusieurs organismes aquatiques, il semble très probable que les
métabolites ont également induit des réactions indésirables sur d'autres organismes et nécessitent
une stricte surveillance au cours des expériences de surveillance toxicologique et environnementale
des médicaments(Stulten et al., 2008b).
2.6 Scénario de traitement actuel pour l’enlèvement du DCF de l'environnement
2.6.1 Le traitement conventionnel de DCF dans les stations d'épuration des eaux usées
Le système de traitement classique, dans les stations de traitement des eaux usées, présente une
efficacité entre modérée et élevée de la élimination de DCF (tableau 2). Le DCF est modérément
persistant dans l'environnement. Dans les études examinées, la suppression maximale obtenue est
d'environ 93% par adsorption sur charbon actif suivi par l’ozonation (Beltran et al., 2009). Le

16
traitement primaire a également été efficace avec des agents coagulants et floculants, tels que
FeCl3, Al2(SO4)3, mais n'a pas capable d’éliminer complètement le médicament des eaux usées
(Carballa et al., 2005). Le processus de boues activées classiques a montré une meilleure efficacité
par rapport au BRM. En moyenne, la suppression de 30-70% peut être obtenue par les méthodes
d'élimination existantes (Vieno and Sillanpää, 2014; Zhang et al., 2008). Une vue d'ensemble des
méthodes de traitement est donnée dans le tableau 2. L'efficacité d'élimination dépend
principalement des méthodes de traitement. Par exemple, le procédé des boues activées classiques
assure l'élimination de 75% (Kimura et al., 2005), mais la plupart du temps ce retrait a été réalisé
par le transfert de masse. Par conséquent, l'élimination efficace ou une dégradation du médicament
est minime dans le système de traitement classique des eaux usées. Plusieurs autres options de
traitement qui sont basées sur le processus de sorption ont été récemment proposées par divers
chercheurs (Sotelo et al., 2014; Sotelo et al., 2012; Suriyanon et al., 2013). Même si divers
matériaux adsorbants naturels et synthétiques, tels que le charbon actif, le biochar, adsorbants à
base de polymère à base de silice, présentent une excellente efficacité d'élimination du DCF, dans
l’ensemble, ces processus ne peuvent pas être considérés comme des méthodes durables; parce
que ces processus ne suppriment pas complètement le DCF de l'environnement; le DCF lié à
l’eau /aux eaux usées est accumulée sur l'adsorbant. Un autre procédé, le plus largement utilisé
pour le traitement de DCF, est basé sur des procédés d'oxydation avancée tels que l'ozonation
(Beltran et al., 2009); cependant, ces méthodes ont aussi reçu des retombées. Ces processus
peuvent créer sous-produits à effet indésirable et toxique. Néanmoins, quelques développements
récents sont prometteurs et durables. Des études ont démontré l'utilisation efficace des enzymes
pour la dégradation complète du DCF de l'eau (Marco-Urrea et al., 2010) qui ne créera pas des
sous-produits nocifs.
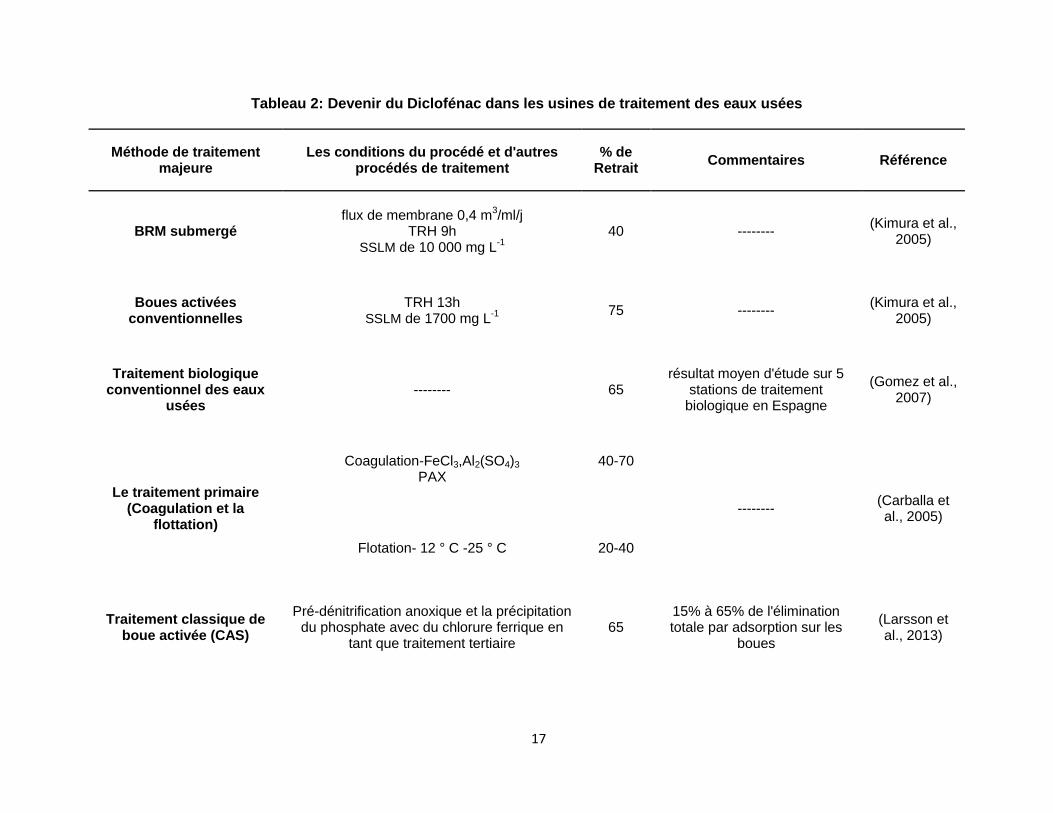
17
Tableau 2: Devenir du Diclofénac dans les usines de traitement des eaux usées
Méthode de traitement majeure
Les conditions du procédé et d'autres procédés de traitement
% de Retrait
Commentaires Référence
BRM submergé flux de membrane 0,4 m
3/ml/j
TRH 9h SSLM de 10 000 mg L
-1
40 -------- (Kimura et al.,
2005)
Boues activées conventionnelles
TRH 13h SSLM de 1700 mg L
-1
75 -------- (Kimura et al.,
2005)
Traitement biologique conventionnel des eaux
usées -------- 65
résultat moyen d'étude sur 5 stations de traitement
biologique en Espagne
(Gomez et al., 2007)
Le traitement primaire (Coagulation et la
flottation)
Coagulation-FeCl3,Al2(SO4)3 PAX
40-70
-------- (Carballa et al., 2005)
Flotation- 12 ° C -25 ° C 20-40
Traitement classique de boue activée (CAS)
Pré-dénitrification anoxique et la précipitation du phosphate avec du chlorure ferrique en
tant que traitement tertiaire 65
15% à 65% de l'élimination totale par adsorption sur les
boues
(Larsson et al., 2013)

18
Tableau 2: Devenir du Diclofénac dans les usines de traitement des eaux usées (suite)
Méthode de traitement majeure
Les conditions du procédé et d'autres procédés de traitement
% de Retrait
Commentaires Référence
Traitement biologique classique des eaux usées
Traitement par biofiltration des eaux usées et composé de 30 filtres biologiques
75
Certains % de retrait ont été produits par l’adsorption sur les
boues
(Lonappan et al., 2016)
Processus de boues activées
-------- 25 -------- (Martín et al.,
2012)
BRM TRS (j) - 10-55 TRH (j) -0,5-4
<50 -------- (Clara et al.,
2005)
Traitement biologique conventionnel des eaux
usées
STEP TRS TRH Étude sur 2 STEPs. L'accumulation sur les boues
était mineure.
(Samaras et al., 2013)
1 8 j 9 h 75
2 18 j 23 h 39
Les abréviations - BRM: bioréacteur à membrane, TRH: temps de rétention hydraulique, TRS: Temps de rétention de la sédimentation,
SSLM: solides en suspension dans la liqueur mixte, STEP: Station d’Épuration des eaux usées.

19
2.6.2 Enlèvement par adsorption- une introduction à l’adsorption biochar
Au cours des dernières décennies, l'adsorption est apparue comme une méthode de traitement
efficace pour l'élimination de divers contaminants organiques émergents, tels que les produits
pharmaceutiques (Nam et al., 2014; Westerhoff et al., 2005) et des adsorbants classiques, tels que
le charbon actif ont été largement étudiés pour l'élimination de CECs (Westerhoff et al., 2005). Les
propriétés physico-chimiques des adsorbants et des adsorbats (p. ex. l'hydrophobie des groupes
fonctionnels chimiques), la taille des pores, la surface externe et la composition chimique ainsi que
d'autres conditions de réaction (p. ex. le pH et la température) déterminent l'efficacité d'élimination
(Nam et al., 2014; Nielsen et al., 2014). Par conséquent, tous les adsorbants même après
l'activation de surface ne peuvent pas devenir un excellent adsorbant pour tous les contaminants en
général. Par exemple, la plupart des charbons actifs vont exclure des molécules grosses
(> 3000 Da), en raison de sa petite taille de pores (< 2 nm) (Kilduff et al., 1996). De plus, l'activation
est une étape supplémentaire et coûteuse. Ainsi, les adsorbants économiques et respectueux de la
nature doivent être identifiés spécifiquement pour le composé à éliminer.
En tant que solution de gestion des déchets, le biochar de matière carbonée a exposé son potentiel
dans le développement durable et a démontré son utilité en tant que produit de valeur ajoutée pour
plusieurs applications environnementales (Glaser et al., 2009; Lee et al., 2010; Woolf et al., 2010).
La production de matériaux durables et les pratiques de gestion avancée pour les déchets, tels que
la production de biochar, gagnent l'attention dans le monde entier. Le biochar est un matériel
négatif en carbone (Glaser et al., 2009) et par conséquent, sa production et sa consommation sont
attrayantes vers un avenir durable. En plus d'être une voie pratique et rentable pour l'élimination des
résidus organique. De plus, il trouve même ses applications dans l'atténuation du changement
climatique par la séquestration du carbone, les applications simultanées dans la production
d'énergie et l'augmentation du rendement des cultures (Woolf et al., 2010). La capacité et les
mécanismes d'adsorption varient de façon significative, avec la charge en matière première et la
méthode de production, suivant les changements dans les propriétés chimiques et de la chimie de

20
surface. Le biochar joue le rôle d’un excellent adsorbant pour plusieurs contaminants de
l'environnement grâce à la structure poreuse et la chimique de surface. Plusieurs facteurs tels que le
pH, la température, la surface spécifique, la porosité, la composition chimique, des charges de
surface et les groupes fonctionnels présents sur la surface auront une influence directe sur la
capacité d'adsorption ainsi que sur le mécanisme et le processus d'adsorption. Une bonne
compréhension de l'interaction entre adsorbat et adsorbant est nécessaire pour concevoir des
systèmes d'adsorption efficaces pour l'élimination des contaminants. En raison de l'aromaticité et
l'hydrophobie, le biochar est un excellent agent de sorption pour un certain nombre de composés
organiques hydrophobes et de composés inorganiques (Fang et al., 2014). Étant une option
respectueuse de l'environnement pour la gestion des déchets, le biochar est un adsorbant
prometteur pour l'élimination des micropolluants. Ce potentiel vient en raison de ses propriétés
supérieures, y compris une structure très condensée et la densité superficielle des groupes
fonctionnels (Jung et al., 2015). Par conséquent, il peut être utilisé comme un excellent adsorbant à
la fois pour les polluants cationiques et anioniques. Le potentiel d'adsorption peut être amélioré en
modifiant la surface du biocharbon et le traitement à l'acide organique peut être un outil efficace pour
modifier la surface. Récemment, l'adsorption du DCF a été étudiée par divers adsorbants, tels que
les nanotubes de carbone à parois multiples (MWCNT) (Czech and Oleszczuk, 2016), l'oxyde de
graphène (Nam et al., 2015) et le charbon actif (Jung et al., 2013). Cependant, le potentiel
d'adsorption du biochar pour « les micropolluants » tels que le DCF n'a pas été étudié. En raison de
ses propriétés de surface spécifique; qui peuvent être attribuées en grande partie à la sélection des
matières premières initiales et la méthode de production; les différents types de biochars peuvent
avoir un excellent potentiel d'adsorption pour le DCF.
2.6.3 La dégradation des procédés PhACs-enzymatiques
Les enzymes ligninolytiques, les laccases en particulier, sont connus pour transformer les
contaminants de l'environnement (Keum and Li, 2004; Youn et al., 1995). Ils présentent également
une excellente capacité de dégradation des contaminants émergents, tels que les produits

21
pharmaceutiques (Gassara et al., 2013b).Laccases (1.10.3.2,p-diphénol: oxydoréductases
dioxygène), les manganèse peroxydases et les lignine peroxydases sont connus comme des
enzymes ligninolytiques ou enzyme de modification de la lignine (EML). De toutes les enzymes
oxydatives, la laccases est celle qui peut être appliquées à la plus large gamme de substrats,
surtout pour la bioremédiation (Majeau et al., 2010). Laccases sont des glycoprotéines (monomère,
dimères ou tétramères) contenant quatre atomes de cuivre par monomère situé au niveau du site
catalytique. Avec les atomes de cuivre; il peut y avoir trois types: type 1, type 2 ou type 3. Le type 1
attire la plupart des études puisqu’il est responsable de l'oxydation du substrat, et il fournit en outre
une couleur bleue à l'enzyme (Majeau et al., 2010). L’important mécanisme impliqué dans l'action de
la laccase dans la dégradation des contaminants est l'oxydation par l'oxygène moléculaire. À l'aide
de mécanismes impliquant des radicaux, l'oxygène moléculaire, provenant de la laccase, oxyde les
contaminants qui contiennent des donneurs d'hydrogène. En outre, les radicaux produits peuvent
subir des réactions catalysées par la laccase et/ou des réactions non enzymatiques, tels que la
polymérisation, l'hydratation ou l'abstraction d'hydrogène (Majeau et al., 2010), ce qui contribuera à
faciliter le processus de dégradation. L'un des plus grands avantages de la laccase sur plusieurs
autres enzymes est sa stabilité. La stabilité de l'enzyme peut varier avec le micro-organisme qui est
utilisé pour la production de laccase. Par exemple, la demi-vie de la laccase purifiée à 50 °C peut
varier, en général, de quelques minutes pour l'enzyme produite par Botrytis cinerea (Slomczynski et
al., 1995) à plusieurs jours pour l'enzyme produite à partir de Trametes sp. (Smirnov et al.). En
outre, les exigences pour la catalyse par la laccase sont assez simples en raison de sa stabilité
apparente et le manque d'inhibition. De récentes études ont rapporté l'utilisation d'une enzyme
ligninolytique, en particulier la laccase, pour la dégradation de plusieurs CEC y compris PhACs
(Cruz-Morató et al., 2013; Rodríguez-Rodríguez et al., 2011; Tran et al., 2013; Wen et al., 2010).
Toutefois, pour des fins d'assainissement, de grandes quantités de l'enzyme sont nécessaires et
pour les méthodes classiques, le coût de production peut être très élevé (Majeau et al., 2010). En
vue de réduire le coût de production de la laccase, l'utilisation des déchets provenant de diverses

22
sources, tel que l'agriculture et les industries de transformation alimentaire peuvent être utilisées
comme substrat pour le micro-organisme (Songulashvili et al., 2006). Récemment, les déchets de
l'industrie de la pomme (de la purée de pommes) ont été identifiés comme un substrat approprié
pour produire différentes enzymes (Gassara et al., 2013a; Gassara et al., 2011). En 2011, au
Canada, la production totale de pommes commercialisées était de 390,362 tonnes métriques et dont
plus de 25% provenaient de la province de Québec seulement (Statistics, 2012). Par conséquent, le
Canada est l'un des plus grands producteurs de pommes. Il génère des milliers de tonnes de
déchets chaque année compte tenu du fait que l'industrie de transformation de jus de pomme
génère 25% à 30% de purée de pommes (Ajila et al., 2015; Dhillon et al., 2011). À l'heure actuelle,
une grande partie de la pulpe de pomme produite à partir de l'industrie du jus de fruits a été utilisée
comme aliment pour animaux ou d'engrais au sol. En fait, l'option d'élimination de la purée de
pommes via l’alimentation des animaux est assez limitée puisqu’ils présentent une faible
digestibilité. En effet, ce type de déchet présente une forte proportion de lignine/cellulose et de
faibles quantités de nutriments comme les protéines, les vitamines et autres minéraux essentiels
pour la croissance des animaux (Ajila et al., 2015; Rumsey, 1978). Par conséquent, l'industrie de la
pomme peut être considérée comme un candidat potentiel pour fournir le substrat nécessaire pour la
production des EMLs.
2.6.4 Microsystèmes imprégné d’enzyme du Biochar (BEMS) pour le traitement du DCF
La réduction de la taille du biochar peut être une approche efficace pour l'élimination des
contaminants par le processus d'adsorption puisque la réduction de la taille augmentera la superficie
totale. En général, le biochar, préparé via le procédé de pyrolyse, est de grandes dimensions, soit
de l’ordre de micromètres ou de millimètres en fonction de la matière source et du procédé de
production. Il est, par la suite, utilisé comme obtenu par le procédé (Demirbas, 2004; Lei et al.,
2009). L'effort de classer les microparticules selon la taille est rare, sauf pour les nanoparticules
(Kambo and Dutta, 2015; Yan et al., 2013). La plupart des études d'adsorption précédentes se
concentraient sur le biochar (Ahmad et al, 2012; Cantrell et al, 2012; Gai et al, 2014.). Ces études,

23
qui visent l'élimination des contaminants organiques, ne sont pas en mesure de fournir une
excellente efficacité d'élimination. Peu d'études récentes ont évalué l'efficacité des nanoparticules
de biochar en tant qu’un adsorbant autonome pour les contaminants de l'eau et du sol en
combinaison avec d'autres nanomatériaux (Saxena et al, 2014; Yan et al, 2013), et aussi en tant
qu’un catalyseur au même temps que d'autres matériaux (Yan et al., 2013). Ces études ont montré
l'excellente capacité pour l'élimination des contaminants organiques. Par conséquent, il peut être
prévu que le nanobiochar présentera une excellente capacité d'adsorption, en comparaison avec le
biochar brut ou même le microbiochar, en raison de sa plus grande surface de contact, même si la
préparation de nanoparticule est un processus coûteux. D'autre part, avec des microparticules, une
augmentation du potentiel d'adsorption peut être attendue en comparaison avec le biochar obtenu
sous la forme brute sans implication importante des coûts. De plus, la synthèse et la caractérisation
de microparticules de biochar pour l'adsorption restent à étudier et des recherches supplémentaires
sont nécessaires dans ce domaine. D'une manière générale, les nanoparticules agglomèrent sous
forme de liquide ce qui est un facteur important. Cela permettra de réduire la capacité d'adsorption
puisque l’agglomération va réduire la surface effective des nanoparticules. En cas de
microparticules de biochar, la possibilité d'agglomération peut être exclue en comparaison avec des
nanoparticules. En outre, en raison de ses uniques propriétés environnementales, des
nanoparticules de carbone sont toxiques pour de nombreux organismes (Brar et al., 2010; Firme Iii
and Bandaru, 2010). Par conséquent, l'élimination des nanoparticules après l'utilisation peut être un
problème majeur. Tant que le biochar est considéré comme une option pour la gestion des déchets
et la production de « nanoparticules toxiques », cela ne constitue pas une méthode efficace pour la
réduction des déchets et d’autre part les microparticules de biochar ne sont pas encore révélées
être toxiques. Par conséquent, l’option d’utilisation des microparticules de biochar pour l’adsorption
et la gestion des déchets peut être considérée.
Les enzymes telles que les laccases sont utilisées à des fins d'assainissement. Cependant, le fait
que ces enzymes libres ne soient pas réutilisables et soient sensibles aux agents dénaturants
24
présente des inconvénients majeurs. Par conséquent, leurs utilisations sans aucun support
nécessitent beaucoup plus d’activité enzymatique et ne peuvent pas être réutilisées, car l'enzyme ne
peut pas être récupérée. En outre, la plupart des enzymes qui ont la forme libre sont beaucoup plus
sensibles au pH, à la température et aux agents dénaturants que ceux sous forme immobilisée.
L'immobilisation d'enzymes va augmenter sa stabilité et va fournir une protection supplémentaire par
rapport à la dénaturation par un ensemble de co-solvants organiques (D’Annibale et al., 2000). Elle
fournit, en plus, une excellente efficacité catalytique même après plusieurs cycles de réaction
(Palmieri et al., 2005) et aide à séparer les produits de la réaction (Durán et al., 2002). En plus de
ces avantages, les enzymes immobilisées assurent une utilisation en continu puisqu’elle sont
lentement libérés du biochar ce qui assure une plus grande efficacité fonctionnelle, une rentabilité,
moins de risque de contamination et un meilleur contrôle du procédé.
Plusieurs matériaux de soutien ont été utilisés dans le passé par plusieurs chercheurs pour
l'immobilisation d'enzymes. Le support solide le plus largement et couramment utilisé est l’alginate
(Datta et al., 2012; Flores-Maltos et al., 2011). L'utilisation de polymères naturels, tels que la chitine
et le chitosane est également fréquente (Kapoor and Kuhad, 2007; Vaillant et al., 2000).Les
supports d'immobilisation généralement utilisés sont, entre autres, le collagène, la carraghénine, la
gélatine, la cellulose, l'amidon, la pectine, la sépharose, les zéolites, la silice et la céramique (Datta
et al., 2012). Pour les applications environnementales, telles que le traitement de l'eau, les supports
solides pour l'immobilisation d'enzymes doivent être biocompatibles, constituent un
microenvironnement de protection et présentent une grande surface spécifique, un gonflement
négligeable, une grande stabilité et doivent être rentables. Peu d'études ont rapporté l'utilisation du
carbone et du charbon actif comme support solide pour l'immobilisation enzyme (Ganesh Kumar et
al., 2010; Ramani et al., 2012). En outre, les lipases et les protéases immobilisées sur du charbon
actif ont montré une excellente capacité catalytique, même après 21 cycles de réutilisation pour des
applications industrielles alimentaires (Ramani et al., 2012).

25
Divers procédés d'immobilisation peuvent ainsi être utilisés pour l'immobilisation d'enzymes sur des
supports solides. Une figure illustrant ces procédés est donnée dans la figure 1. Pour l'adsorption
par le processus d'immobilisation, soit un processus d'adsorption physique ou chimique est utilisé.
Le procédé d'adsorption est le résultat des interactions hydrophobes et /ou des liaisons salines entre
l'enzyme et le support solide (Datta et al., 2012). L’amyloglucosidase immobilisé sur support de
charbon de bois par adsorption présente une activité catalytique de 90% et une excellente efficacité
d'immobilisation sur le support solide (Rani et al., 2000). Un autre procédé d'immobilisation
largement utilisé est l’association covalente des enzymes sur le support. Des agents de réticulation,
tels que le glutaraldéhyde peuvent être utilisé à cette fin. La protection et le maintien des propriétés
fonctionnelles et structurales des enzymes sont des défis majeurs pour des agents de réticulation
(Datta et al., 2012). Des études antérieures ont rapporté une augmentation de la demi-vie et de la
stabilité thermique des enzymes par liaison covalente des supports tels que la silice mésoporeuse et
le chitosane (Ispas et al., 2008). Un autre grand procédé d'immobilisation d'enzyme est le piégeage.
Dans ce procédé, les enzymes sont mis en cage par des liaisons covalentes ou non covalentes au
sein du support solide. Le support solide pour ce type d'immobilisation est généralement des gels ou
des fibres (Datta et al., 2012).
Figure 1: Méthodes d'immobilisation des enzymes

26
Le microbiochar peut être un excellent support pour l'immobilisation d'enzymes ligninolytiques. Les
microparticules de biochar sont biocompatibles, ont une grande surface spécifique, un gonflement
négligeable, une grande stabilité et sont très rentables à produire. De plus, le biochar peut adsorber
le DCF ce qui va l’éliminer des eaux usées et également va fournir suffisamment de temps pour que
les enzymes agissent. En outre, les surfaces copieuses groupes fonctionnels sur le biochar peuvent
fournir un support étendu pour des enzymes. L’immobilisation par adsorption et la liaison covalente
par des polymères de réticulation peuvent, toutes les deux, être utilisées pour une immobilisation
efficace. Par conséquent, l'utilisation de la laccase immobilisée dans des microparticules de biochar
peut être une potentielle approche hybride pour l'élimination des produits pharmaceutiques, tels que
le DCF dans ce cas.
PARTIE 3: PROBLÉMATIQUE
La problématique de ces travaux de recherche a été identifiée en se basant sur la revue de la
littérature :
1. Environ 1443 tonnes de DCF sont consommées dans le monde chaque année et le DCF est
considéré comme la 12ème
molécule générique meilleur vendu dans le monde entier. En tant que
médicament vétérinaire, le DCF peut avoir des effets néfastes sur les consommateurs secondaires,
tels que les vautours qui consomment les carcasses de bovins. De plus, les résidus de DCF dans
l'environnement, en particulier dans l'environnement aquatique, ont un impact négatif sur plusieurs
organismes, tels que les moules et les poissons. Cependant, les mesures réglementaires /
législatives visant à contrôler le DCF dans l'environnement restent minimes.
2. Indépendamment de l'emplacement géographique, les résidus de DCF ont été détectés dans les
eaux de surface ainsi que dans l'eau potable dans le monde entier. De plus, la présence de DCF a
également été détectée dans le sol. Dans les stations d'épuration, la dégradation (dans le
système de traitement secondaire) et l'accumulation de DCF dans les boues d'épuration ont

27
également été observées à différents niveaux. Le DCF est détectable en très petites
concentrations, telles que μg L-1
à ng L-1
dans les eaux usées. Les interférences dues aux effets
de matrice et aux méthodes analytiques longues sont les principaux défis analytiques de
l'analyse du DCF. Une méthode rapide, sensible et moins encline aux matrices pour le DCF se doit
d’être développée.
3. À travers diverses sources, le DCF finit dans une usine de traitement des eaux usées. Étant le
principal puits de DCF, l'usine de traitement des eaux usées joue un rôle clé dans l'élimination des
DCF de l'environnement. Néanmoins, dans le système de traitement conventionnel, le DCF n'est
pas efficacement éliminé de l'usine de traitement des eaux usées. En général, environ 30 à
70% d'élimination du DCF sont observés dans les usines de traitement des eaux usées. De plus, les
sous-produits potentiels sont rarement étudiés.
4. Au cours des dernières décennies, l'adsorption est apparue comme une méthode de traitement
efficace pour l'élimination de divers contaminants organiques émergents, tels que les produits
pharmaceutiques et les adsorbants classiques, comme le charbon actif qui a été largement étudié.
Cependant, ces études ont été réalisées à des concentrations élevées, telles que le niveau de mg L-
1; bien que les contaminants émergents, tels que les DCF sont présents en μg L
-1 à ng L
-1. De plus,
les adsorbants sont spécifiques et sélectifs aux contaminants en raison de la porosité et des
restrictions de surface. Les nanoadsorbants peuvent être des adsorbants efficaces pour de
nombreux contaminants; cependant, le coût de production et les préoccupations récentes sur la
toxicité des nanoparticules d'ingénierie sont un inconvénient des nanoadsorbants. En tant
qu'alternative à la gestion des déchets, le biocharbon à base de matière carbonée a démontré son
potentiel de durabilité et a démontré son utilité en tant que produit à valeur ajoutée pour plusieurs
applications environnementales. La réduction de la taille du biocharbon peut être une approche
efficace pour l'élimination des contaminants par le processus d'adsorption puisque la réduction de la
taille augmentera la surface totale. Avec les microparticules, on peut s'attendre à une augmentation
du potentiel d'adsorption par rapport au biocharbon obtenu sous forme brute sans implication de

28
coût majeur. De plus, la synthèse, la caractérisation et l'utilisation des microparticules de biocharbon
pour l'adsorption ne sont pas encore étudiées et des recherches supplémentaires sont nécessaires
dans ce domaine. Les études doivent donc se concentrer sur la recherche d'adsorbants
rentables, écologiques et efficaces pour les micropolluants, comme le DCF.
5. Le traitement des contaminants émergents à l'aide d'enzymes est un nouveau domaine de
recherche. Les enzymes ligninolytiques, en particulier la laccase, ont fait preuve d'une excellente
capacité de dégradation vis-à-vis des contaminants émergents, tels que les produits
pharmaceutiques. Cependant, pour l'assainissement, de grandes quantités d'enzymes sont
nécessaires et par les méthodes conventionnelles, le coût de production peut être très élevé.
Il faut donc étudier d'autres substrats efficaces et rentables pour produire des enzymes.
6. L'utilisation d'enzymes libres pour le traitement des contaminants présente plusieurs
inconvénients. L'utilisation d'enzymes libres n'est pas rentable et les enzymes libres sont non
réutilisables et sensibles aux agents de dénaturation. Par conséquent, l'utilisation de matériel
d'appui pour l'immobilisation sera une approche efficace. L'immobilisation des enzymes augmentera
sa stabilité et offrira une protection supplémentaire contre la dénaturation par une gamme de co-
solvants organiques. En plus de ces avantages que les enzymes immobilisées fourniront, l'utilisation
continue de l'enzyme à libération lente et donc une efficacité fonctionnelle accrue et une rentabilité
totale est nécessaire. L'utilisation de microparticules de biocharbon comme support solide
pour l'immobilisation enzymatique doit être étudiée. Les immobilisations d'enzymes sont
souvent chargées de défis tels que la résistance au lessivage et à la liaison. Par conséquent, pour
étudier les fixations d'immobilisation (résistance), il faut étudier diverses approches
d'immobilisation telles que l'immobilisation adsorptive et covalente.
7. Les enzymes immobilisées sur le microbiocharbon auront l'avantage supplémentaire de
l'adsorption des contaminants par le biocharbon et de la dégradation à médiation enzymatique. De
plus, l'adsorption fournira suffisamment de temps pour l'action des enzymes. Toutefois,

29
l'application d'enzymes immobilisées sous forme de lots n'est pas pratique compte tenu des
volumes importants d'eaux usées à traiter et de la faisabilité industrielle. Il convient donc
d'étudier une alternative appropriée pour le mode d'application des enzymes immobilisées.
PARTIE 4: HYPOTHÈSES, OBJECTIFS ET ORIGINALITÉ
4.1 Hypothèses
«Le développement d'un microsystème imprégné de biocharbon-enzyme (BEMS) pour la
dégradation du contaminant émergent le diclofénac » repose sur les hypothèses suivantes :
1. Selon la littérature, la production et la consommation du DCF sont très élevées et les mesures
réglementaires/législatives pour contrôler la présence de DCF dans l'environnement sont minimes.
Une méthode rapide, sensible et moins matricielle permet de surmonter les difficultés
analytiques liées à la quantification des eaux usées et des boues d'épuration du DCF. Le DCF
n'est pas complètement éliminé dans les stations d'épuration des eaux usées et une grande partie
de l'élimination se produit par accumulation dans les boues d'épuration. L'estimation du DCF à
différents stades de la STEP facilitera le suivi du devenir du DCF.
2. La sélection des matières premières et la méthode de production du biocharbon ont un effet
significatif sur les propriétés de ce dernier. La production et l'application de microparticules de
biocharbon peuvent être une méthode rentable, écologique et efficace pour l'élimination des
micropolluants. Les études d'adsorption par des contaminants organiques modèles, comme le bleu
de méthylène, peuvent être un outil efficace pour caractériser le potentiel d'adsorption d'un
adsorbant. De plus, les échantillons de charbon bio provenant de différentes matières premières
et/ou méthodes de production auront une capacité d'adsorption variable vis-à-vis de polluants
organiques spécifiques.

30
3. Le potentiel d'adsorption ou l'efficacité de l'élimination d'un adsorbant dépend de divers facteurs,
tels que les propriétés physico-chimiques de l'adsorbant et les conditions environnementales. Par
conséquent, tout en étudiant le potentiel d'adsorption du biocharbon sur l'élimination du DCF, une
caractérisation physico-chimique adéquate du biocharbon doit être effectuée. Les études
d'adsorption par lots sont des outils efficaces pour étudier l'adsorption et les interactions adsorbant-
adsorbat. Il est important pour le DCF de réaliser des études d'adsorption à des
concentrations pertinentes pour l'environnement. Plusieurs autres paramètres, comme le pH et
la température, peuvent affecter l'adsorption et ces paramètres doivent être pris en compte lors
des expériences. De plus, les études sur les modèles cinétique et isotherme d'adsorption sont
importantes pour comprendre les mécanismes sous-jacents impliqués dans l'adsorption. Le
potentiel d'adsorption peut être amélioré en modifiant la surface du biocharbon et le
traitement à l'acide organique peut être un outil efficace pour modifier la surface.
4. L'application de matières résiduelles agro-industrielles peut effectivement réduire le coût
de production des enzymes. Les enzymes ligninolytiques peuvent dégrader efficacement le
DCF, car ce sont des enzymes oxydantes. Étant donné que les enzymes sont très sensibles aux
changements environnementaux, le pH et la température peuvent être pris en compte lors des
expériences et ces paramètres doivent être optimisés pour une élimination plus poussée. En outre, il
convient d'estimer la quantité d'enzyme nécessaire pour dégrader les concentrations de MDC dans
l'environnement. Les produits de transformation de la dégradation doivent être identifiés et la toxicité
du DCF et de ses produits de transformation doit être analysée.
5. L'immobilisation des enzymes ligninolytiques sur un support solide améliorera son efficacité et sa
stabilité. Les microparticules de biocharbon peuvent être utilisées comme support solide. Les
enzymes ligninolytiques immobilisées sur le biocharbon peuvent être utilisées comme
approche thérapeutique efficace pour le DCF. De plus, les études sur l'immobilisation
adsorbate et covalente de l'enzyme brute sur les microbiocharbons peuvent illustrer

31
davantage les mécanismes de liaison et la force. Cette information peut être utilisée pour étudier
la lixiviation et la stabilité des enzymes immobilisées.
6. Les enzymes immobilisées sur les microbiocharbons peuvent également être utilisées pour le
développement d'un microsystème imprégné de biocharbon-enzyme. On peut transformer la laccase
immobilisée sur microbiocharbon en bioréacteur à lit fixe en comprimant le microbiocharbon avec
laccase immobilisé dans une colonne de réaction de dimensions appropriées. On peut s'attendre à
une adsorption et une dégradation continues du DCF à l'intérieur du bioréacteur à lit fixe. Ce
mode d'application peut être facile à utiliser et efficace.
7. Le bioréacteur à colonne de biocharbon avec enzyme immobilisé peut être opéré à grande
échelle pour application dans les stations d'épuration des eaux usées. La production de
biocharbon et des enzymes à l'aide de déchets/matières résiduelles peut réduire
efficacement le coût. Par conséquent, dans l'ensemble, le bioréacteur à colonne fixe de
biocharbon-enzyme immobilisé présente un potentiel de rentabilité. De plus, l'utilisation de ce
système est durable et respectueuse de l'environnement ceci en éliminant les déchets/contaminants
aux deux extrémités (production et utilisation). Le bioréacteur à colonne de charbon-enzyme
immobilisé peut être opéré à grande échelle de façon efficace et peut être utilisé dans un système
de traitement tertiaire dans une station d'épuration des eaux usées.
4.2 Objectifs de recherche
L'objectif global de ce travail est "d'étudier le devenir du DCF dans les STEP et le développement
d'un microsystème des enzymes immobilisés sur biocharbon pour le traitement du DCF". Les
objectifs spécifiques de l'étude sont décrits ci-dessous :
32
1. Une méthode rapide de quantification du DCF et du devenir du DCF dans les STEP.
1.1 Une méthode rapide et sensible de détermination du diclofénac dans les eaux usées et les
boues d'épuration au moyen de la technique de désorption thermique par diode laser (LDTD) sera
mise au point.
1.2 Estimation du DCF dans les échantillons des eaux usées et des boues prélevés à différentes
étapes du traitement dans les stations d'épuration de la communauté urbaine de Québec.
1.3 Différentes méthodes d'extraction seront étudiées pour le DCF dans les boues d'épuration.
1.4 Une étude comparative d'une méthode existante de chromatographie liquide (CL) avec la
méthode LDTD nouvellement mise au point pour les échantillons environnementaux à matrice
élevée sera effectuée.
2. Préparation de microparticules de biocharbon, sa caractérisation pour le potentiel
d'adsorption par le composé organique modèle, le bleu de méthylène.
2.1 Les microparticules de biocharbon seront préparées à partir de biocharbon en utilisant
différentes méthodes de production.
2.2 Le potentiel d'adsorption de microparticules de biocharbon sera étudié en utilisant un
contaminant organique modèle, le bleu de méthylène.
3. Efficacité d'adsorption des microparticules de biochar pour l'enlèvement de DCF
3.1 L'efficacité de l'élimination du DCF des microparticules de biocharbon préparées à partir de
diverses matières premières (bois de pin et lisier de porc) sera étudiée.
3.2 La cinétique, la thermodynamique et les effets de l'adsorption sur le pH seront étudiés.

33
3.3 Des modèles isothermes d'adsorption seront étudiés pour comprendre les mécanismes sous-
jacents de l'adsorption et la caractérisation physico-chimique des microparticules de biocharbon.
4. Fonctionnalisation verte du microbiocharbon pour l'élimination améliorée du DCF
4.1 Différents acides organiques (acide acétique, acide citrique, acide tartrique, acide oxalique et
acide malique) à différentes concentrations et en utilisant la méthode catalytique par agitation ainsi
qu'en autoclave seront testés pour la fonctionnalisation efficace des microbiocharbon (biocharbons
de bois de pin et de porc et biocharbons de coquille d'amande).
4.2 Des microbiocharbons fonctionnalisés seront testés pour l'élimination du DCF.
5. Production de l'enzyme laccase et son utilisation pour la dégradation du DCF
5.1 Les résidus agro-industriels seront utilisés comme substrats pour la production de la laccase.
5.2 Le profilage de production sera effectué et divers inducteurs seront testés pour une production
améliorée de laccase.
5.3 Des études de dégradation du DCF seront effectuées dans diverses conditions expérimentales
en utilisant l'enzyme brute produite (enzymes libres non purifiées sans aucune immobilisation).
5.4 Les produits de transformation du DCF par dégradation enzymatique seront identifiés.
6. Immobilisation adsorptive de la laccase brute concentrée sur microbiocharbons
6.1 L'immobilisation adbsorbante de la laccase brute sera étudiée dans le cadre de diverses
activités de la laccase afin de tracer les isothermes d'adsorption et de découvrir ainsi les
mécanismes sous-jacents.
6.2 La cinétique de désorption de laccase sera étudiée pour étudier les mécanismes de désorption
ainsi que la force de liaison adsorbant.

34
6.3 La laccase immobilisée sera utilisée pour la dégradation du DCF.
7. Laccase brute d'immobilisation covalente sur microbiocharbon
7.1 Les microbiocharbon de bois de pin, de fumier de porc et de coquille d'amande ainsi que leurs
dérivés fonctionnalisés de l'acide citrique seront utilisés pour l'immobilisation covalente de la laccase
avec le glutaraldéhyde comme agent de réticulation.
7.2 Les microbiocharbon immobilisés par la laccase seront soumis à des tests pour l'élimination de
la DCF.
7.3 Les stabilités du pH, de la température, du stockage et du fonctionnement seront étudiées pour
les enzymes immobilisées.
8. Le bioréacteur à colonne à lit compact avec laccase immobilisé sur biocharbon pour le
traitement de la DCF
8.1 Des essais d'efficacité d'adsorption du réacteur à colonne à lit rempli de biocharbon seront
effectués au moyen d'études d'adsorption.
8.2 Le bioréacteur à colonne de lit rempli de microbiocharbon avec laccase immobilisée sera testé
pour l'élimination continue du DCF.
8.3 Une évaluation préliminaire de l'estimation des coûts et de la faisabilité industrielle pour le
bioréacteur à colonne à lit compact avec laccase immobilisé sur biocharbon.
4.3 Originalité du travail
En se basant sur des hypothèses et des objectifs, l'originalité de la présente étude est la suivante :
1. Mise au point d'une méthode analytique novatrice, rapide et moins dépendante de la matrice pour
le DCF (LDTD-MS/MS) qui réduira le temps d'analyse de quelques minutes à quelques secondes.

35
2. Préparation de nouvelles microparticules de biocharbon qui étaient aussi efficaces que le charbon
actif à des concentrations plus faibles de contaminant organique modèle sans aucune
activation/modification de surface.
3. L'efficacité des microparticules de biocharbon de bois, de pin, de lisier et de porc sera étudiée
pour l'élimination du DCF dans diverses conditions expérimentales, et les mécanismes d’adsorption
impliqués seront étudiés. Les études pour l'élimination du DCF par adsorption sur biocharbon sont
minimes. De plus, le fumier de porc et les microparticules de biocharbon en bois de pin peuvent être
des adsorbants efficaces pour le DCF en raison de leurs propriétés de surface spécifiques, ce qui
n’a jamais été étudié auparavant. Par conséquent, les mécanismes d’adsorption sont inconnus et
doivent être étudiés.
4. Une nouvelle méthode de fonctionnalisation verte pour les microbiocharbons utilisant des acides
organiques.
5. Stratégie de production rentable pour produire de la laccase en utilisant des résidus agro-
industriels comme substrats et amélioration de la production de laccase à l'aide de divers
inducteurs. Les résidus agro-industriels de résidus de marc de pomme, de pulpe, de déchets solides
de papier et de fibres d'alfa n'ont jamais été étudiés auparavant en tant que substrats pour la
production de laccases utilisant les champignons, Trametes versicolor. Dégradation du DCF induite
par la laccase dans diverses conditions expérimentales et identification des produits de
transformation a été effectuée. L'utilisation de la transformation DCF à médiation laccase n'a jamais
été étudiée auparavant. De plus, les connaissances sur la cinétique, les effets du pH et de la
température et les produits de transformation de la transformation DCF à médiation laccase sont
minimes.
6. L'immobilisation des laccases brutes sur divers microbiocharbons (bois de pin, fumier de porc et
coquille d'amande) n'a jamais été étudiée auparavant. Le mécanisme sous-jacent d'adsorption ainsi
que la désorption de laccase sur toute surface de biocharbon est encore inconnu. La présente étude

36
examine ces mécanismes ainsi qu'une application potentielle de laccase immobilisée, soit
l’enlèvement du DCF.
7. L'immobilisation covalente peut éventuellement améliorer la stabilité de la laccase immobilisée
puisque les fixations chimiques sont le principal mécanisme en cause. De plus, la fonctionnalisation
de l'acide citrique peut augmenter la liaison covalente entre laccase et biocharbon. Ces deux
aspects n'ont jamais été étudiés auparavant et cela implique la nouveauté.
8. Le concept d’un bioréacteur à colonne à lit compact avec laccase immobilisée sur biocharbon,
écologique et durable pour le traitement de la DCF dans les eaux usées est nouveau. De plus, ce
bioréacteur à colonne peut être implanté dans l'étape tertiaire de la station d'épuration des eaux
usées.
Dans l'ensemble, l'originalité de la thèse est la suivante, "L’enlèvement d'un médicament
prioritaire - diclofénac des eaux usées à l'aide de nouveaux microsystèmes imprégnés de
biocharbon-enzyme".
PARTIE 5: SOMMAIRE DES DIFFÉRENTS VOLETS DE RECHERCHE
EFFECTUÉS DANS CETTE ÉTUDE
Cette section a été divisée en quatre sous-sections. La première section présente les résultats en ce
qui concerne le devenir de DCF dans une usine de traitement classique des eaux usées. De plus,
cette section présente également les résultats d'une méthode rapide et novatrice qui a été
développée pour la quantification des DCF dans les boues et des eaux usées. La deuxième section
illustre les propriétés d'adsorption de divers microbiochars. Particulièrement, la suppression du DCF
a été étudiée par adsorption sur divers microbiochars et acides organiques microbiochars
fonctionnalisés ont été testés pour l'élimination améliorée du DCF. La troisième section examine la
production rentable de l'enzyme lignolytique «laccase» pour la dégradation du DCF. Finalement, la
37
technique d’adsorption, ainsi que des procédés d'immobilisation covalente de laccase sur les
microbiochars ont été étudiés dans cette section.
5.1 Le devenir de DCF dans les stations d'épuration et la méthode novatrice et
rapide pour la quantification du DCF dans des eaux usées et des boues
d’épuration
5.1.1 Méthode rapide et sensible pour la quantification du DCF dans les eaux usées et les
boues d'eaux usées par désorption thermique de la diode laser - couplée à la
spectrométrie de masse en tandem (LDTD- MS / MS)
La quantification des micropolluants dans la matrice complexe de l'environnement est souvent
difficile analytiquement. Une méthode fiable, rapide et sensible sur la base de l'ionisation chimique
et de désorption thermique de la diode laser / pression atmosphérique (LDTD / APCI) couplée avec
spectrométrie de masse tandem (MS / MS) a été développée pour la quantification du DCF dans les
boues d'eaux usées et des eaux usées. La technique LDTD-APCI-MS / MS nouvellement mise au
point réduit le temps d'analyse de 12 secondes au lieu de 12 minutes pour la méthode classique LC-
ESI-MS / MS. Les limites de détection de la méthode (dans de l'eau MilliQ) pour la méthode LDTD-
APCI-MS / MS ont été calculé 270 ngL-1
(LOD) et 1000 ngL-1
(LOQ). La limite de détection de la
méthode (MDL) a été chiffrée à 300 ngL-1
pour des échantillons d'eaux usées et 75 ng g-1
pour les
échantillons de boues d'eaux usées. En outre, deux procédés d'extraction ont été comparés,
l'extraction assistée par ultrasons (USE) et l'extraction accélérée par solvant (ASE) pour traiter le
DCF à partir de boues des eaux usées et la méthode ASE s’est avéré plus efficace avec un taux de
récupération de 95 ± 7% comparativement au procédé USE avec 84 ± 5% de récupération.
L'approche LDTD remplace la séparation chromatographique par désorption thermique de la diode
laser, et permet donc d’éviter l'utilisation d'un solvant organique. Ceci constitue un saut vers des
principes de la chimie verte et réduit la matrice d’analyse relativement à l’approche de LC.

38
5.1.2 Le destin et la répartition des DCF à la Communauté urbaine épuration des eaux
usées au Québec
La nouvelle méthode a été utilisée pour la quantification ainsi que l'étude du devenir du DCF dans
l'usine de traitement des eaux usées des collectivités urbaines du Québec. Un pourcentage
d’enlèvement d'environ 76% a été obtenu avec le système de traitement conventionnel de la station
d'épuration des eaux usées. Lors de l'analyse de la répartition du DCF dans WWS et WW, DCF
présentait une affinité envers WW comparativement aux WWS. La concentration en matières solides
a été observée de 10 ± 0,5 gL-1
et de 8 ± 0,3 gL-1
pour la boue primaire et la boue secondaire,
respectivement. Par conséquent, l'élimination ou la dégradation aux niveaux primaire et secondaire
a été calculée. Environ 18% d'élimination / dégradation a été observée à l'étape de dessablage.
Environ 20% de cette concentration ont été accumulées dans la phase de dégradation de boues et
13% ont été observées. Le reste de la DCF a été transférée au système de traitement secondaire.
Le système secondaire a montré une dégradation ultérieure de 31% de la concentration reçue et le
surplus a été accumulé dans les boues et les eaux usées. Par conséquent, en dehors de
l'élimination ultérieure des boues, une dégradation globale d'environ 50% a été observée dans la
station d'épuration.
En conclusion, l’enlèvement par traitement du DCF n'a pas été très efficace et des traces de DCF
restant peuvent être potentiellement toxiques pour plusieurs organismes. Consécutivement, des
études ultérieures ont été planifiées pour un meilleur traitement des DCF pour une élimination
complète.

39
5.2. Identification et caractérisation des microbiochars et des études d'adsorption
pour l'élimination du DCF
5.2.1 Préparation et caractérisation des microbiochars
Le Biochar peut être considéré comme un excellent adsorbant pour divers contaminants, y compris
les micropolluants en raison de ses caractéristiques de surface. Des microparticules de biochar
peuvent être préparées en utilisant un procédé économiquement viable. Le bleu de méthylène a été
utilisé comme modèle d’adsorption pour la caractérisation du potentiel d'adsorption préparée
microbiochar. Dans cette étude, les microparticules préparées à partir de trois différents types de
biochar présentaient des capacités d'adsorption améliorées (0,975 mg g-1
) avec des concentrations
réduites de 10 mgL-1, ce qui était comparable avec le charbon actif disponible dans le commerce
(0,980 mg g-1
) utilisé pour l'étude. Les capacités d'adsorption de biochar varient avec le matériau
source et le procédé de préparation. La capacité d'adsorption du bleu de méthylène pour le colorant
cationique a également augmenté avec l'augmentation de la surface des microparticules. La
capacité d'adsorption maximale (Qmax) a été estimée à 3,99 mg g-1
, 16,30 mg g-1
, et 1,66 mg g-1
,
respectivement pour le bois de pin, le fumier de porc et de papier provenant des microparticules de
biochar à une concentration MB de 50 mg L-1
. Les modèles isothermes d'adsorption Langmuir et
Freundlich ont été utilisés pour indiquer l'adsorption du bleu de méthylène. Les données d'équilibre
ont été bien décrites par le modèle Langmuir pour le modèle BC-PM et BC-PD et Freundlich pour
BC-PW. À des concentrations plus faibles, les microbiochars ont montré d'excellents rendements
d'élimination pour le bleu de méthylène qui a servi comme un excellent adsorbant pour les
micropolluants. Les modèles isothermes d'adsorption Langmuir et Freundlich ont été utilisés pour
signaler l'adsorption du bleu de méthylène. Les données d'équilibre ont été bien décrites par le
modèle Langmuir pour le modèle BC-PM et BC-PD et Freundlich pour BC-PW.

40
5.2.2 Adsorption de diclofenac sur différents microbiochars
Les microbiochars ont été préparés à partir de matières premières de bois de pin (BC-PW) et de
fumier de porc (BC-PM). L'adsorption du DCF sur BC-PM a été jugée efficace sur BC-PW. À la suite
des études antérieures sur la caractérisation des microbiochars, ces derniers peuvent être des
excellents adsorbants de polluants organiques à des concentrations plus faibles. À propos de
l'efficacité de l'élimination, un taux de 99,6% a été observé pour BC-PM à une concentration de
l'environnement correspondant à 500 µg L-1
. Pour BC-PW, l'adsorption a été expliquée par le
modèle pseudo de premier ordre alors que pour BC-PM par modèle pseudo-second ordre. Pour les
deux adsorbants, la diffusion intrapparticulaire a été jugée le principal mécanisme expliquant le
comportement d'adsorption. L’adsorption sur BC-PW a été en grande partie affectée par le pH, alors
que la dépendance du pH d'adsorption de BC-PM était minime. Le comportement thermodynamique
des deux adsorbants nous mène à suggérer que l'adsorption de DCF sur BC-PW était
endothermique alors qu’elle est exothermique pour BC-PM.
5.2.3 Méthode écoresponsable (verte) pour la fonctionnalisation du biochar et
l'adsorption du diclofénac
Après avoir démontré que la microbiochars peut être utilisée comme un excellent adsorbant pour les
micropolluants et le DCF en particulier, nous avons testé le biochar activé. Malgré des résultats
d’élimination très satisfaisants, ce procédé implique l’usage de composés chimiques toxiques. Les
biochar produisent à partir de biomasse, tel que le bois de pin, de fumier de porc, et la coquille
d'amande ont été fonctionnalisés avec de l'acide acétique (CH3COOH), l'acide citrique (C6H8O7),
l'acide tartrique (C4H6O6), l'acide oxalique (C2H2O4) et l'acide malique (C4H6O5). Deux méthodes de
fonctionnalisation, une simple agitation pendant la nuit à température ambiante et l’autoclavage ont
été testées et comparées pour l'efficacité de fonctionnalisation. Pour le biochar en bois de pin, on a
trouvé que l'acide citrique est plus efficace de l’acide acétique (augmentation d'environ 40% des
groupes -COOH sur la surface). Les acides tartrique et oxalique se sont révélés efficaces pour le

41
fumier de porc biochar. Cependant, les effets des deux étaient minimes sur fonctionnalisation. Les
acides citrique et oxalique se sont montrés efficaces pour la coquille d'amande biochar et l'acide
citrique relativement plus efficace (augmentation d'environ 45% des groupes -COOH sur la surface).
La composition de Biochar (matière première) avait un effet significatif sur l’efficacité de
fonctionnalisation alors que pour la réaction avec les acides organiques, les surfaces de biochar ont
répondu de manière différente avec tous les acides. En outre, la concentration (molarité) d'acides a
eu peu ou pas d'effets sur l'ampleur de la fonctionnalisation. Une simple agitation sur une longue
période a été jugée efficace comparativement à l’autoclavage à une température élevée pour courte
période. Dans l'ensemble, on constate que l'acide citrique est adéquat pour une fonctionnalisation
efficace (COOH) sur la surface de biochar. La fonctionnalisation d'acide citrique a augmenté au total
des groupes fonctionnels acides de 23,6%, 10,2% et 26,2% pour le bois de pin, fumier de porc et la
coquille d'amande, respectivement. Les biochars fonctionnalisé avec l’acide citrique à donner une
élimination significative (p <0,05) du DCF à l'équilibre.
5.3 La production et l'immobilisation de laccase sur les microbiochars pour le
retrait du diclofenac
5.3.1 Production de laccase par voie agro-industrielle et de la dégradation de diclofénac
Les enzymes lignolytiques et la laccase, en particulier, ont montré leur potentiel pour la restauration
de plusieurs contaminants à haute concentration. Cependant, les méthodes classiques de
production sont généralement coûteuses. Dans cette étude, les résidus agro-industriels ont été
utilisés comme substrats pour la production de laccase. Les résidus de l’industrie de jus de pomme,
purée de pommes (49,16 ± 2,5 U/gds) et de déchets solides de l’industrie de pâte et papier (52,4 ±
2,2 U / gds) se sont révélés les substrats les plus efficaces pour la production de laccase par rapport
aux fibres sèches (alfa14,26 ± 0,8 U / gds). Le sulfate de cuivre a été jugé efficace comme inducteur
de production de laccase sur tween 80, l’alcool vératrylique le rouge de phénol. Cependant, l'effet
inducteur des éléments étudiés a été plutôt limité avec tous les supports. La laccase brute produite à

42
partir d’agro-éléments a été utilisée pour la dégradation du DCF. Pour des concentrations dans
l'environnement (500 µg L-1
de DCF), pH de 4,5 et à une température de 50°C, on a retrouvé a été,
la dégradation de DCF avec laccase est jugée efficace. Pour la dégradation médiée par la laccase,
la vitesse de réaction a été jugée d’ordre zéro à des concentrations de substrat supérieur et de
premier ordre, à des concentrations de substrat inférieures (pertinentes pour l'environnement). Dans
des conditions favorables, la dégradation a été observée jusqu'à 99% pour DCF dans les 5 heures.
Les produits de transformation initiaux ont été identifiés par LC-MS / MS et identifiés comme 3'-
hydroxydiclofenac, 4'-hydroxydiclofenac, et 5-hydroxydiclofenac. Le mécanisme de dégradation de
DCF catalysée par laccase a été proposé comme un déclenchement de cycle d'hydroxylation et de
minéralisation finale de CO2, NH3, H2O et du chlore.
5.3.2 Immobilisation par adsorption de laccase brute sur les microbiochars
Même si la laccase d’origine agro-industrielle a montré une excellente efficacité pour la dégradation
des DCF, l'application de laccase sous forme libre fait face à des défis en ce qui concerne
l'application pratique en raison de problèmes de stabilité liés à l'enzyme. L’immobilisation d'enzymes
sur des supports solides peut être une excellente mesure corrective. L’immobilisation de laccase
brute adsorbate sur le bois de pin (BC-PW), le fumier de porc (BC-PM) et la coquille d'amande (BC-
AS) microbiochars a été étudiée en utilisant les principes de la chimie physique et à travers les
isothermes. Avec tous les biochars, comme l'activité initiale de laccase de l'augmente dans la
solution brute, la capacité de liaison a également augmenté et par conséquent l'efficacité
d'immobilisation. BC-PM a été jugée la plus efficace (31,4 ± 3,1 U g-1
) à 10 U mL-1
d’activité
enzymatique suivie par BC-AS (24,3 ± 4,8 U g-1
) et BC-PW (14,58 ± 3,3 U g-1
). L’adsorption
monocouche homogène conçoit le mécanisme clé de la liaison enzyme-biochar. La laccase
immobilisée possède une viabilité et une stabilité 3 fois plus élevée que celle de l’enzyme libre en
termes de durée d’exposition. La laccase immobilisée est capable de dégrader le diclofenac avec
près de 100% d’efficacité au bout de 5 heures en considérant des concentrations semblables à
celles retrouvées dans l’environnement (500 µg L-1
).

43
5.3.3 Immobilisation covalente de la laccase brute sur les microbiochars
Un second mode opératoire d'immobilisation; l'immobilisation covalente a également été étudiée
pour l'immobilisation efficace et améliorée de la laccase. En partie (concentré) la laccase brute
purifiée a été immobilisée de manière covalente sur BC-PW, BC-PM, et BC-AS en utilisant 5% de
glutaraldéhyde. BC-PM (34,1 ± 1,1 U g-1
) a montré la capacité de liaison la plus élevée de la laccase
suivie BC-AS (25,3 ± 2,8 U g-1
) et BC-PW (16,18 ± 0,3 U g-1
). Le prétraitement à l'acide citrique a
amélioré la capacité de liaison de la laccase avec tous les microbiochars et a montré une
amélioration de 20% de la liaison Laccase et BC-AS. La surface améliorée et du CEC biochars à
base biochar de fumier de porc comparativement au biochar de bois a généré une meilleure liaison
de laccase sur BC-PM. Cependant, le biochars dérivé du bois (BC-PW et BC-AS) ont montré une
meilleure stabilité de pH, température, de stockage et de stabilité opérationnelle relativement aux
biochars dérivés de fumier (BC-PM). Le complexe laccase microbiochars immobilisées a été utilisé
pour l'élimination des micropolluants, en particulier le diclofénac et l'élimination complète de cet
élément a été observée au bout de 2 heures sous le mode discontinu avec 0,5 g de BC-PM lié
laccase à une concentration pertinente de l'environnement de 500 µgL-1
dans les effluents des eaux
usées.
5.4 Élimination du Diclofenac par le bioréacteur sur colonne à lit fixe
L’application des enzymes immobilisées sous forme de lot est pratiquement non viable en tenant
compte des grands volumes d'eaux usées qui doivent être traitées. Le bioréacteur sur colonne à lit
fixe peut être une alternative. L’adsorption continue et la dégradation des DCF peuvent être
considérées à l'intérieur du bioréacteur à lit fixe. Ce mode d'application peut être ergonomique et
efficace. Les microbiochar préparés à partir de bois de pin (BC-PW) fumier de porc (BC-PM) et la
coquille d'amande (BC-AS) ont été évalués pour l'élimination des DCF à des concentrations
pertinentes en environnement, dans des conditions de fonctionnement continu de colonne à bobines
fixes. BC-PM s’est avéré un adsorbant efficace sur BC-PW et BC-AS et qui a été attribué à la zone

44
de surface plus élevée, la porosité, et la présence de divers groupes fonctionnels contenant des
métaux. À une concentration dans l'environnement (500g L-1
), BC-PM présentait une capacité
d'adsorption de 4,10 mg g-1
de masse de lit: 2 g, débit: 2 mL min-1
et à pH 6,5. Pour tous les
biochars, l'adsorption du DCF dans une colonne à lit fixe était dépendante de la masse d'adsorbant
(hauteur du lit) et de la concentration du DCF. La capacité d'adsorption diminue de plus en plus avec
la hauteur du lit tandis qu’elle augmente avec la concentration de DCF. Les modèles Thomas et
Yoon-Nelson ont été appliqués avec succès pour prédire les courbes de percée, ce qui indique que
ces modèles ont été utiles pour la conception et la mise à l'échelle de biochar en colonnes à lit fixe.
Le biochar lié à la laccase a démontré une efficacité de traitement ou d’enlèvement plus élevé sur le
biochar non lié et une amélioration significative dans le temps de pénétration a été observée
contribuant ainsi à la biodégradation du DCF dans la colonne. Le microsystème (BEMS) imprégné
biochar-enzyme a montré un potentiel de rentabilité et de valorisation des déchets à partir de
déchets ou de matières résiduelles pour le développement de BEMS.

45
Figure 2: Principales étapes dans le travail de recherche

46
BIBLIOGRAPHIE
Acuña V, Ginebreda A, Mor JR, Petrovic M, Sabater S, Sumpter J, et al. Balancing the health benefits and environmental risks of pharmaceuticals: Diclofenac as an example. Environment International 2015; 85: 327-333.
Agüera A, Pérez Estrada LA, Ferrer I, Thurman EM, Malato S, Fernández-Alba AR. Application of time-of-flight mass spectrometry to the analysis of phototransformation products of diclofenac in water under natural sunlight. Journal of Mass Spectrometry 2005; 40: 908-915.
Ajila C, Sarma S, Brar S, Godbout S, Cote M, Guay F, et al. Fermented Apple Pomace as a Feed Additive to Enhance Growth Performance of Growing Pigs and Its Effects on Emissions. Agriculture 2015; 5: 313.
Al-Rajab AJ, Sabourin L, Lapen DR, Topp E. The non-steroidal anti-inflammatory drug diclofenac is readily biodegradable in agricultural soils. Sci Total Environ 2010; 409: 78-82.
Beltran FJ, Pocostales P, Alvarez P, Oropesa A. Diclofenac removal from water with ozone and activated carbon. J Hazard Mater 2009; 163: 768-76.
Benotti MJ, Trenholm RA, Vanderford BJ, Holady JC, Stanford BD, Snyder SA. Pharmaceuticals and Endocrine Disrupting Compounds in U.S. Drinking Water. Environmental Science & Technology 2008; 43: 597-603.
BirdLife I. Vultures are under threat from the veterinary drug diclofenac. Presented as part of the BirdLife State of the world's birds website. 2016, 2013.
Boettcher IW, Pfeilschifter J, Schweizer A, Sallmann A, Wenk P. Pharmacological properties of five diclofenac metabolites identified in human plasma. Agents and Actions 1991; 34: 135-137.
Brar SK, Verma M, Tyagi RD, Surampalli RY. Engineered nanoparticles in wastewater and wastewater sludge – Evidence and impacts. Waste Management 2010; 30: 504-520.
Buser H-R, Poiger T, Müller MD. Occurrence and Fate of the Pharmaceutical Drug Diclofenac in Surface Waters: Rapid Photodegradation in a Lake. Environmental Science & Technology 1998; 32: 3449-3456.
Carballa M, Omil F, Lema JM. Removal of cosmetic ingredients and pharmaceuticals in sewage primary treatment. Water Res 2005; 39: 4790-6.
Chefetz B, Mualem T, Ben-Ari J. Sorption and mobility of pharmaceutical compounds in soil irrigated with reclaimed wastewater. Chemosphere 2008; 73: 1335-43.
Clara M, Strenn B, Gans O, Martinez E, Kreuzinger N, Kroiss H. Removal of selected pharmaceuticals, fragrances and endocrine disrupting compounds in a membrane bioreactor and conventional wastewater treatment plants. Water Res 2005; 39: 4797-807.
Cleuvers M. Aquatic ecotoxicity of pharmaceuticals including the assessment of combination effects. Toxicology Letters 2003; 142: 185-194.

47
Cleuvers M. Mixture toxicity of the anti-inflammatory drugs diclofenac, ibuprofen, naproxen, and acetylsalicylic acid. Ecotoxicology and Environmental Safety 2004; 59: 309-315.
Collins PJ, Dobson A. Regulation of Laccase Gene Transcription in Trametes versicolor. Appl Environ Microbiol 1997; 63: 3444-50.
Cruz-Morató C, Ferrando-Climent L, Rodriguez-Mozaz S, Barceló D, Marco-Urrea E, Vicent T, et al. Degradation of pharmaceuticals in non-sterile urban wastewater by Trametes versicolor in a fluidized bed bioreactor. Water Research 2013; 47: 5200-5210.
Czech B, Oleszczuk P. Sorption of diclofenac and naproxen onto MWCNT in model wastewater treated by H2O2 and/or UV. Chemosphere 2016; 149: 272-278.
D’Annibale A, Stazi SR, Vinciguerra V, Giovannozzi Sermanni G. Oxirane-immobilized Lentinula edodes laccase: stability and phenolics removal efficiency in olive mill wastewater. Journal of Biotechnology 2000; 77: 265-273.
Das D, Cuthbert RJ, Jakati RD, Prakash V. Diclofenac is toxic to the Himalayan Vulture Gyps himalayensis. Bird Conservation International 2010; 21: 72-75.
Datta S, Christena LR, Rajaram YRS. Enzyme immobilization: an overview on techniques and support materials. 3 Biotech 2012; 3: 1-9.
Demirbas A. Effects of temperature and particle size on bio-char yield from pyrolysis of agricultural residues. Journal of Analytical and Applied Pyrolysis 2004; 72: 243-248.
Dhillon GS, Brar SK, Verma M, Tyagi RD. Utilization of different agro-industrial wastes for sustainable bioproduction of citric acid by Aspergillus niger. Biochemical Engineering Journal 2011; 54: 83-92.
Drillia P, Stamatelatou K, Lyberatos G. Fate and mobility of pharmaceuticals in solid matrices. Chemosphere 2005; 60: 1034-44.
Durán N, Rosa MA, D’Annibale A, Gianfreda L. Applications of laccases and tyrosinases (phenoloxidases) immobilized on different supports: a review. Enzyme and Microbial Technology 2002; 31: 907-931.
Ericson H, Thorsen G, Kumblad L. Physiological effects of diclofenac, ibuprofen and propranolol on Baltic Sea blue mussels. Aquat Toxicol 2010; 99: 223-31.
Eriksson J, Svanfelt J, Kronberg L. A Photochemical Study of Diclofenac and Its Major Transformation Products. Photochemistry and Photobiology 2010; 86: 528–532.
Fang Q, Chen B, Lin Y, Guan Y. Aromatic and Hydrophobic Surfaces of Wood-derived Biochar Enhance Perchlorate Adsorption via Hydrogen Bonding to Oxygen-containing Organic Groups. Environmental Science & Technology 2014; 48: 279-288.
Fatta-Kassinos D, Hapeshi E, Achilleos A, Meric S, Gros M, Petrovic M, et al. Existence of Pharmaceutical Compounds in Tertiary Treated Urban Wastewater that is Utilized for Reuse Applications. Water Resources Management 2011; 25: 1183-1193.
Fent K, Weston AA, Caminada D. Ecotoxicology of human pharmaceuticals. Aquat Toxicol 2006; 76: 122-59.

48
Ferrari Bt, Paxéus N, Giudice RL, Pollio A, Garric J. Ecotoxicological impact of pharmaceuticals found in treated wastewaters: study of carbamazepine, clofibric acid, and diclofenac. Ecotoxicology and Environmental Safety 2003; 55: 359-370.
Firme Iii CP, Bandaru PR. Toxicity issues in the application of carbon nanotubes to biological systems. Nanomedicine: Nanotechnology, Biology and Medicine 2010; 6: 245-256.
Flores-Maltos A, Rodríguez-Dur, #xe1, n LV, Renovato J, Contreras JC, et al. Catalytical Properties of Free and Immobilized Aspergillus niger Tannase. Enzyme Research 2011; 2011: 6.
Ganesh Kumar A, Perinbam K, Kamatchi P, Nagesh N, Sekaran G. In situ immobilization of acid protease on mesoporous activated carbon packed column for the production of protein hydrolysates. Bioresource Technology 2010; 101: 1377-1379.
Gassara F, Ajila CM, Brar SK, Tyagi RD, Verma M, Valero J. Influence of aeration and agitation modes on solid-state fermentation of apple pomace waste by Phanerochaete chrysosporium to produce ligninolytic enzymes and co-extract polyphenols. International Journal of Food Science & Technology 2013a; 48: 2119-2126.
Gassara F, Brar SK, Pelletier F, Verma M, Godbout S, Tyagi RD. Pomace waste management scenarios in Québec—Impact on greenhouse gas emissions. Journal of Hazardous Materials 2011; 192: 1178-1185.
Gassara F, Brar SK, Verma M, Tyagi RD. Bisphenol A degradation in water by ligninolytic enzymes. Chemosphere 2013b; 92: 1356-1360.
Glaser B, Parr M, Braun C, Kopolo G. Biochar is carbon negative. Nature Geosci 2009; 2: 2-2.
Gomez MJ, Martinez Bueno MJ, Lacorte S, Fernandez-Alba AR, Aguera A. Pilot survey monitoring pharmaceuticals and related compounds in a sewage treatment plant located on the Mediterranean coast. Chemosphere 2007; 66: 993-1002.
Gonzalez-Rey M, Bebianno MJ. Effects of non-steroidal anti-inflammatory drug (NSAID) diclofenac exposure in mussel Mytilus galloprovincialis. Aquat Toxicol 2014; 148: 221-30.
Gros M, Petrovic M, Ginebreda A, Barcelo D. Removal of pharmaceuticals during wastewater treatment and environmental risk assessment using hazard indexes. Environ Int 2010; 36: 15-26.
Haap T, Triebskorn R, Kohler HR. Acute effects of diclofenac and DMSO to Daphnia magna: immobilisation and hsp70-induction. Chemosphere 2008; 73: 353-9.
Hallare AV, Kohler HR, Triebskorn R. Developmental toxicity and stress protein responses in zebrafish embryos after exposure to diclofenac and its solvent, DMSO. Chemosphere 2004; 56: 659-66.
Halling-Sørensen B, Nors Nielsen S, Lanzky PF, Ingerslev F, Holten Lützhøft HC, Jørgensen SE. Occurrence, fate and effects of pharmaceutical substances in the environment- A review. Chemosphere 1998; 36: 357-393.
Heberer T. Occurrence, fate, and removal of pharmaceutical residues in the aquatic environment: a review of recent research data. Toxicology Letters 2002a; 131: 5-17.

49
Heberer T. Tracking persistent pharmaceutical residues from municipal sewage to drinking water. Journal of Hydrology 2002b; 266: 175-189.
Hernando MD, Mezcua M, Fernández-Alba AR, Barceló D. Environmental risk assessment of pharmaceutical residues in wastewater effluents, surface waters and sediments. Talanta 2006; 69: 334-342.
Hoeger B, Dietrich DR, Schmid D, Hartmann A, Hitzfeld B. Distribution of intraperitoneally injected diclofenac in brown trout (Salmo trutta f. fario). Ecotoxicol Environ Saf 2008; 71: 412-8.
Hoeger B, Kollner B, Dietrich DR, Hitzfeld B. Water-borne diclofenac affects kidney and gill integrity and selected immune parameters in brown trout (Salmo trutta f. fario). Aquat Toxicol 2005; 75: 53-64.
Ispas C, Sokolov I, Andreescu S. Enzyme-functionalized mesoporous silica for bioanalytical applications. Analytical and Bioanalytical Chemistry 2008; 393: 543-554.
Johnson AC, Dumont E, Williams RJ, Oldenkamp R, Cisowska I, Sumpter JP. Do concentrations of ethinylestradiol, estradiol, and diclofenac in European rivers exceed proposed EU environmental quality standards? Environ Sci Technol 2013; 47: 12297-304.
Jones OA, Voulvoulis N, Lester JN. Aquatic environmental assessment of the top 25 English prescription pharmaceuticals. Water Research 2002; 36: 5013-5022.
Jung C, Boateng LK, Flora JRV, Oh J, Braswell MC, Son A, et al. Competitive adsorption of selected non-steroidal anti-inflammatory drugs on activated biochars: Experimental and molecular modeling study. Chemical Engineering Journal 2015; 264: 1-9.
Jung C, Park J, Lim KH, Park S, Heo J, Her N, et al. Adsorption of selected endocrine disrupting compounds and pharmaceuticals on activated biochars. Journal of Hazardous Materials 2013; 263, Part 2: 702-710.
K.Venkateshwarlu. Drug being purchased by farmers illegally to treat their cattle: study. The Hindu. The Hindu, Hyderabad, 2011.
Kallio J-M, Lahti M, Oikari A, Kronberg L. Metabolites of the Aquatic Pollutant Diclofenac in Fish Bile. Environmental Science & Technology 2010; 44: 7213-7219.
Kambo HS, Dutta A. A comparative review of biochar and hydrochar in terms of production, physico-chemical properties and applications. Renewable and Sustainable Energy Reviews 2015; 45: 359-378.
Kapoor M, Kuhad RC. Immobilization of Xylanase from Bacillus pumilus Strain MK001 and its Application in Production of Xylo-oligosaccharides. Applied Biochemistry and Biotechnology 2007; 142: 125-138.
Keum YS, Li QX. Fungal laccase-catalyzed degradation of hydroxy polychlorinated biphenyls. Chemosphere 2004; 56: 23-30.
Khetan SK, Collins TJ. Human Pharmaceuticals in the Aquatic Environment: A Challenge to Green Chemistry. Chemical Reviews 2007; 107: 2319-2364.

50
Kilduff JE, Karanfil T, Chin Y-P, Weber WJ. Adsorption of Natural Organic Polyelectrolytes by Activated Carbon: A Size-Exclusion Chromatography Study. Environmental Science & Technology 1996; 30: 1336-1343.
Kim SD, Cho J, Kim IS, Vanderford BJ, Snyder SA. Occurrence and removal of pharmaceuticals and endocrine disruptors in South Korean surface, drinking, and waste waters. Water Res 2007; 41: 1013-21.
Kimura K, Hara H, Watanabe Y. Removal of pharmaceutical compounds by submerged membrane bioreactors (MBRs). Desalination 2005; 178: 135-140.
Kummerer K. Pharmaceuticals in the Environment – A Brief Summary In: K. K, editor. Pharmaceuticals in the Environment. Springer-Verlag, Heidelberg,Berlin, 2004.
Kunkel U, Radke M. Fate of pharmaceuticals in rivers: Deriving a benchmark dataset at favorable attenuation conditions. Water Research 2012; 46: 5551-5565.
Langford KH, Reid M, Thomas KV. Multi-residue screening of prioritised human pharmaceuticals, illicit drugs and bactericides in sediments and sludge. J Environ Monit 2011; 13: 2284-91.
Larsson E, Rabayah A, J?nsson Jk. Sludge Removal of Nonsteroidal Anti-Inflammatory Drugs during Wastewater Treatment Studied by Direct Hollow Fiber Liquid Phase Microextraction. Journal of Environmental Protection 2013; Vol.04No.09: 10.
Lawrence JR, SWERHONE GDW, TOPP E, KORBER DR, NEU TR, WASSENAAR LI. Structural and functional responses of river biofilm communities to the nonsteroidal anti-inflammatory diclofenac Environ Toxicol Chem 2007; 26: 573-582.
Lee J, Ji K, Lim Kho Y, Kim P, Choi K. Chronic exposure to diclofenac on two freshwater cladocerans and Japanese medaka. Ecotoxicol Environ Saf 2011; 74: 1216-25.
Lee JW, Hawkins B, Day DM, Reicosky DC. Sustainability: the capacity of smokeless biomass pyrolysis for energy production, global carbon capture and sequestration. Energy & Environmental Science 2010; 3: 1695-1705.
Lei H, Ren S, Julson J. The Effects of Reaction Temperature and Time and Particle Size of Corn Stover on Microwave Pyrolysis. Energy & Fuels 2009; 23: 3254-3261.
Letzel M, Metzner G, Letzel T. Exposure assessment of the pharmaceutical diclofenac based on long-term measurements of the aquatic input. Environ Int 2009; 35: 363-8.
Lonappan L, Pulicharla R, Rouissi T, Brar SK, Verma M, Surampalli RY, et al. Diclofenac in municipal wastewater treatment plant: quantification using laser diode thermal desorption—atmospheric pressure chemical ionization—tandem mass spectrometry approach in comparison with an established liquid chromatography-electrospray ionization–tandem mass spectrometry method. Journal of Chromatography A 2016; 1433: 106-113.
Loos R, Locoro G, Comero S, Contini S, Schwesig D, Werres F, et al. Pan-European survey on the occurrence of selected polar organic persistent pollutants in ground water. Water Res 2010; 44: 4115-26.
Majeau J-A, Brar SK, Tyagi RD. Laccases for removal of recalcitrant and emerging pollutants. Bioresource Technology 2010; 101: 2331-2350.
51
Marco-Urrea E, Pérez-Trujillo M, Cruz-Morató C, Caminal G, Vicent T. Degradation of the drug sodium diclofenac by Trametes versicolor pellets and identification of some intermediates by NMR. Journal of Hazardous Materials 2010; 176: 836-842.
Martín J, Camacho-Muñoz D, Santos JL, Aparicio I, Alonso E. Occurrence of pharmaceutical compounds in wastewater and sludge from wastewater treatment plants: Removal and ecotoxicological impact of wastewater discharges and sludge disposal. Journal of Hazardous Materials 2012; 239–240: 40-47.
McGettigan P, Henry D. Use of Non-Steroidal Anti-Inflammatory Drugs That Elevate Cardiovascular Risk: An Examination of Sales and Essential Medicines Lists in Low-, Middle-, and High-Income Countries. PLoS Med 2013; 10: e1001388.
Mehinto AC, Hill EM, Tyler CR. Uptake and Biological Effects of Environmentally Relevant Concentrations of the Nonsteroidal Anti-inflammatory Pharmaceutical Diclofenac in Rainbow Trout (Oncorhynchus mykiss). Environ. Sci. Technol 2010; 44: 2176-2182.
Metcalfe CD, Miao X-S, G.Koenig B, Struger J. Distribution of acidic and neutral drugs in surface waters near sewage treatment plants in the lower great lakes, Canda. Environmental Toxicology and Chemistry 2003; 22: 2881–2889.
Moore DE, Roberts-Thomson S, Zhen D, Duke CC. PHOTOCHEMICAL STUDIES ON THE ANTIINFLAMMATORY DRUG DICLOFENAC. Photochemistry and Photobiology 1990; 52: 685-690.
Naisbitt DJ, Sanderson LS, Meng X, Stachulski AV, Clarke SE, Park BK. Investigation of the immunogenicity of diclofenac and diclofenac metabolites. Toxicol Lett 2007; 168: 45-50.
Nam S-W, Choi D-J, Kim S-K, Her N, Zoh K-D. Adsorption characteristics of selected hydrophilic and hydrophobic micropollutants in water using activated carbon. Journal of Hazardous Materials 2014; 270: 144-152.
Nam S-W, Jung C, Li H, Yu M, Flora JRV, Boateng LK, et al. Adsorption characteristics of diclofenac and sulfamethoxazole to graphene oxide in aqueous solution. Chemosphere 2015; 136: 20-26.
Nielsen L, Biggs MJ, Skinner W, Bandosz TJ. The effects of activated carbon surface features on the reactive adsorption of carbamazepine and sulfamethoxazole. Carbon 2014; 80: 419-432.
Oaks JL, Gilbert M, Virani MZ, Watson RT, Meteyer CU, Rideout BA, et al. Diclofenac residues as the cause of vulture population decline in Pakistan. natute 2004; 427: 630-633.
Öllers S, Singer HP, Fässler P, Müller SR. Simultaneous quantification of neutral and acidic pharmaceuticals and pesticides at the low-ng/l level in surface and waste water. Journal of Chromatography A 2001; 911: 225-234.
Palmer E. Top 20 generic molecules worldwide. www.fiercepharma.com. 2015, 2012, pp. special report.
Palmieri G, Giardina P, Sannia G. Laccase-Mediated Remazol Brilliant Blue R Decolorization in a Fixed-Bed Bioreactor. Biotechnology Progress 2005; 21: 1436-1441.

52
Qin M, Yang H. PHOTOCHEMICAL CHARACTERISTICS OF DICLOFENAC AND ITS PHOTODEGRADATION OF INCLUSION COMPLEXES WITH β-CYCLODEXTRINS. Quim. Nova 2012; 35: 559-562.
Rabiet M, Togola A, Brissaud F, Seidel J-L, Budzinski H, Elbaz-Poulichet F. Consequences of Treated Water Recycling as Regards Pharmaceuticals and Drugs in Surface and Ground Waters of a Medium-sized Mediterranean Catchment. Environmental Science & Technology 2006; 40: 5282-5288.
Ramani K, Karthikeyan S, Boopathy R, Kennedy LJ, Mandal AB, Sekaran G. Surface functionalized mesoporous activated carbon for the immobilization of acidic lipase and their application to hydrolysis of waste cooked oil: Isotherm and kinetic studies. Process Biochemistry 2012; 47: 435-445.
Rani AS, Das MLM, Satyanarayana S. Preparation and characterization of amyloglucosidase adsorbed on activated charcoal. Journal of Molecular Catalysis B: Enzymatic 2000; 10: 471-476.
Rodríguez-Rodríguez CE, Jelić A, Llorca M, Farré M, Caminal G, Petrović M, et al. Solid-phase treatment with the fungus Trametes versicolor substantially reduces pharmaceutical concentrations and toxicity from sewage sludge. Bioresource Technology 2011; 102: 5602-5608.
Rumsey TS. Ruminal Fermentation Products and Plasma Ammonia of Fistulated Steers Fed Apple Pomace-Urea Diets. Journal of Animal Science 1978; 47: 967-976.
Samaras VG, Stasinakis AS, Mamais D, Thomaidis NS, Lekkas TD. Fate of selected pharmaceuticals and synthetic endocrine disrupting compounds during wastewater treatment and sludge anaerobic digestion. Journal of Hazardous Materials 2013; 244–245: 259-267.
Scheurell M, Franke S, Shah RM, Huhnerfuss H. Occurrence of diclofenac and its metabolites in surface water and effluent samples from Karachi, Pakistan. Chemosphere 2009; 77: 870-6.
Scheytt T, Mersmann P, Lindstadt R, Heberer T. Determination of sorption coefficients of pharmaceutically active substances carbamazepine, diclofenac, and ibuprofen, in sandy sediments. Chemosphere 2005; 60: 245-53.
Schmidt W, O'Rourke K, Hernan R, Quinn B. Effects of the pharmaceuticals gemfibrozil and diclofenac on the marine mussel (Mytilus spp.) and their comparison with standardized toxicity tests. Mar Pollut Bull 2011; 62: 1389-95.
Schmitt-Jansen M, Bartels P, Adler N, Altenburger R. Phytotoxicity assessment of diclofenac and its phototransformation products. Analytical and Bioanalytical Chemistry 2007; 387: 1389-1396.
Schulze T, Weiss S, Schymanski E, von der Ohe PC, Schmitt-Jansen M, Altenburger R, et al. Identification of a phytotoxic photo-transformation product of diclofenac using effect-directed analysis. Environ Pollut 2010; 158: 1461-6.
Schwaiger J, Ferling H, Mallow U, Wintermayr H, Negele RD. Toxic effects of the non-steroidal anti-inflammatory drug diclofenac. Part I: histopathological alterations and bioaccumulation in rainbow trout. Aquat Toxicol 2004; 68: 141-50.
53
Slomczynski D, Nakas JP, Tanenbaum SW. Production and Characterization of Laccase from Botrytis cinerea 61-34. Applied and Environmental Microbiology 1995; 61: 907-912.
Smirnov SA, Koroleva OV, Gavrilova VP, Belova AB, Klyachko NL. Laccases from Basidiomycetes: Physicochemical Characteristics and Substrate Specificity towards Methoxyphenolic Compounds. Biochemistry (Moscow); 66: 774-779.
Songulashvili G, Elisashvili V, Wasser S, Nevo E, Hadar Y. Laccase and Manganese Peroxidase Activities of Phellinus Robustus and Ganoderma Adspersum Grown on Food Industry Wastes in Submerged Fermentation. Biotechnology Letters 2006; 28: 1425-1429.
Sosiak Al, Hebben T. A Preliminary Survey of Pharmaceuticals and Endocrine Disrupting Compounds in Treated Municipal Wastewaters and Receiving Rivers of Alberta. In: Sosiak Al, Hebben T, editors. Monitoring and Evaluation Branch Environmental Assurance, Alberta, 2005.
Sotelo JL, Ovejero G, Rodríguez A, Álvarez S, Galán J, García J. Competitive adsorption studies of caffeine and diclofenac aqueous solutions by activated carbon. Chemical Engineering Journal 2014; 240: 443-453.
Sotelo JL, Rodríguez A, Álvarez S, García J. Removal of caffeine and diclofenac on activated carbon in fixed bed column. Chemical Engineering Research and Design 2012; 90: 967-974.
Statistics. Fruit and Vegetable Production. In: Canada S, editor. 80-2. Statistics Canada, Agriculture Division Crops Section, Ottava, 2012.
Stierlin H, Faigle JW, Sallmann A, Kung W, Richter WJ, Kriemler HP, et al. Biotransformation of diclofenac sodium (Voltaren®) in animals and in man. Xenobiotica 1979; 9: 601-610.
Stulten D, Lamshoft M, Zuhlke S, Spiteller M. Isolation and characterization of a new human urinary metabolite of diclofenac applying LC–NMR–MS and high-resolution mass analyses. Journal of Pharmaceutical and Biomedical Analysis 2008a; 47: 371–376.
Stulten D, Zuhlke S, Lamshoft M, Spiteller M. Occurrence of diclofenac and selected metabolites in sewage effluents. Sci Total Environ 2008b; 405: 310-6.
Suriyanon N, Punyapalakul P, Ngamcharussrivichai C. Mechanistic study of diclofenac and carbamazepine adsorption on functionalized silica-based porous materials. Chemical Engineering Journal 2013; 214: 208-218.
Taggart MA, Senacha KR, Green RE, Jhala YV, Raghavan B, Rahmani AR, et al. Diclofenac residues in carcasses of domestic ungulates available to vultures in India. Environ Int 2007; 33: 759-65.
Tavares J. Diclofenac in Europe – current situation, legal aspects, potential impacts and required actions. Technical Dossier. http://www.4vultures.org, Switzerland, 2014a, pp. 1-12.
Tavares J. Diclofenac: drug causing wildlife catastrophe in South Asia is available on EU market. Vulture Conservation Foundation, Brussels, 2014b.
The Drug controller general I. Diclofenac for veterinary use : regarding. In: Services DGoH, editor. F.No.18-03/2006-DC, New Delhi, 2006, pp. 1.

54
Tran NH, Urase T, Ngo HH, Hu J, Ong SL. Insight into metabolic and cometabolic activities of autotrophic and heterotrophic microorganisms in the biodegradation of emerging trace organic contaminants. Bioresource Technology 2013; 146: 721-731.
Triebskorn R, Casper H, Heyd A, Eikemper R, Kohler HR, Schwaiger J. Toxic effects of the non-steroidal anti-inflammatory drug diclofenac. Part II: cytological effects in liver, kidney, gills and intestine of rainbow trout (Oncorhynchus mykiss). Aquat Toxicol 2004; 68: 151-66.
Vaillant F, Millan A, Millan P, Dornier M, Decloux M, Reynes M. Co-immobilized pectinlyase and endocellulase on chitin and Nylon supports. Process Biochemistry 2000; 35: 989-996.
Vieno N, Sillanpää M. Fate of diclofenac in municipal wastewater treatment plant — A review. Environment International 2014; 69: 28-39.
Wen X, Jia Y, Li J. Enzymatic degradation of tetracycline and oxytetracycline by crude manganese peroxidase prepared from Phanerochaete chrysosporium. Journal of Hazardous Materials 2010; 177: 924-928.
Westerhoff P, Yoon Y, Snyder S, Wert E. Fate of Endocrine-Disruptor, Pharmaceutical, and Personal Care Product Chemicals during Simulated Drinking Water Treatment Processes. Environmental Science & Technology 2005; 39: 6649-6663.
Woolf D, Amonette JE, Street-Perrott FA, Lehmann J, Joseph S. Sustainable biochar to mitigate global climate change. Nat Commun 2010; 1: 56.
Xu J, Wu L, Chang AC. Degradation and adsorption of selected pharmaceuticals and personal care products (PPCPs) in agricultural soils. Chemosphere 2009; 77: 1299-305.
Yan Q, Wan C, Liu J, Gao J, Yu F, Zhang J, et al. Iron nanoparticles in situ encapsulated in biochar-based carbon as an effective catalyst for the conversion of biomass-derived syngas to liquid hydrocarbons. Green Chemistry 2013; 15: 1631.
Youn H-D, Hah YC, Kang S-O. Role of laccase in lignin degradation by white-rot fungi. FEMS Microbiology Letters 1995; 132: 183-188.
Zhang Y, Geissen SU, Gal C. Carbamazepine and diclofenac: removal in wastewater treatment plants and occurrence in water bodies. Chemosphere 2008; 73: 1151-61.
Zorita S, Martensson L, Mathiasson L. Occurrence and removal of pharmaceuticals in a municipal sewage treatment system in the south of Sweden. Sci Total Environ 2009; 407: 2760-70.

55
CHAPTER 2
DICLOFENAC: OCCURRENCE, FATE AND ANALYSIS

56
57
PART 1
DICLOFENAC AND ITS TRANSFORMATION PRODUCTS:
ENVIRONMENTAL OCCURRENCE AND TOXICITY - A REVIEW
Linson Lonappan a, Satinder Kaur Brar a*, Ratul Kumar Das a, Mausam Verma b,
Rao .Y. Surampalli c
a INRS-ETE, Université du Québec, 490, Rue de la Couronne, Québec, Canada, G1K 9A9
b CO2 Solutions Inc., 2300, rue Jean-Perrin, Québec, Québec, G2C 1T9, Canada
c Department of Civil Engineering, University of Nebraska-Lincoln, N104 SEC, PO Box 886105,
Lincoln, NE 68588-6105, USA
ENVIRONMENT INTERNATIONAL 96 (2016), 127-138

58
RÉSUMÉ
Le Diclofenac (DCF) est un anti-inflammatoire commun utilisé à travers le monde. Les
recherches intensives menées au cours des dernières décennies ont confirmé la présence
ubiquitaire du DCF dans différents milieux environnementaux. Sa présence fréquente dans les
cours d’eau fraîches et sa toxicité potentielle envers différents organismes tels que les poissons
et les mollusques font du DCF un contaminant environnemental émergent. Aux concentrations
généralement mesurées dans l’environnement, le DCF ne présente pas d’effet toxique pour les
organismes vivants, cependant l’exposition chronique peut mener à des effets plus sévères.
Pour le DCF, la principale méthode d’élimination sont les systèmes d’épuration conventionnels
des eaux usées qui sont en mesure de réduire la concentration de 30 à 70%. La fraction non
traité se retrouve par la suite dans les eaux de surface. Le DCF peut interagir avec différent
contaminants dans l’environnement et dans les stations d’épuration des eaux. Ces contaminants
sont les métaux, la matière organiques et même les métabolites associés au DCF. Ces
interactions peuvent mener à la possible création de d’autres contaminants émergents. Dans le
contexte actuel, le destin environnemental du DCF dans les différents milieux tel que le sol et
l’eau a été adressé avec un survol des méthodes de traitement actuelles. De plus, les
préoccupations liées à la toxicité du DCF dans les milieux aquatiques et terrestres ainsi que les
voies de dégradation abiotiques sont aussi discutées. Des études supplémentaires sont
requises pour mieux évaluer le destin et les effets écotoxicoligiques du DCF et ses métabolites.
Ces études devront considérer les interactions possibles du DCF avec d’autres contaminants
afin de développer une méthode de traitement efficace pour le DCF jusqu’à des concentrations
traces.
Mots clés : Diclofenac; destin environnemental; toxicité; interactions; métabolites; contaminants
émergents

59
ABSTRACT
Diclofenac (DCF) is a prevalent anti-inflammatory drug used throughout the world. Intensive
researches carried out in the past few decades have confirmed the global ubiquity of DCF in various
environmental compartments. Its frequent occurrence in freshwater environments and its potential
toxicity towards several organisms such as fish and mussels makes DCF an emerging
environmental contaminant. At typical detected environmental concentrations, the drug does not
exhibit toxic effects towards living organisms, albeit chronic exposure may lead to severe effects. For
DCF, about 30-70% removal has been obtained through the conventional treatment system in
wastewater treatment plant being the major primary sink. Thus, the untreated DCF will pass to
surface water. DCF can interact with other inorganic contaminants in the environment particularly in
wastewater treatment plant, such as metals, organic contaminants and even with DCF metabolites.
This process may lead to the creation of another possible emerging contaminant. In the present
context, environmental fate of DCF in different compartments such as soil and water has been
addressed with an overview of current treatment methods. In addition, the toxicity concerns
regarding DCF in aquatic as well as terrestrial environment along with an introduction to the
metabolites of DCF through consumption as well as abiotic degradation routes are also discussed.
Further studies are required to better assess the fate and toxicological effects of DCF and its
metabolites and must consider the possible interaction of DCF with other contaminants to develop
an effective treatment method for DCF and its traces.
Keywords: Diclofenac; Environmental fate; Toxicity; Interactions; Metabolites; Emerging
contaminant
60
1. Introduction
Pharmaceutical industry has emerged as one of the largest and prominent industry worldwide.
Large amount of pharmaceuticals of different categories are being used to cure and care human and
animal health. In general, pharmaceuticals comprise compounds which include materials extensively
used in medicine, agriculture and biotechnology, such as drugs, antibiotics and hormones. The
worldwide average per capita consumption of pharmaceuticals per year is estimated to be about 15
g. In industrialized countries, the usage is even as high as 50 to 150 g (Alder et al. 2006).
Pharmaceutically active compounds (PhACs) are one of the conspicuous classes of
pharmaceuticals which by one route or another, enter the environment as the parent compound or
as pharmacologically active metabolites (Halling-Sørensen et al. 1998). It is estimated that
worldwide consumption of active compounds amounts to 100,000 tons or more per annum
(Kummerer 2004). Usually, drugs are developed with an intention of having a beneficial biological
effect on the organism to which they are administered, though many such compounds will often pass
into the environment where they may exert an unwanted biological effect (Halling-Sørensen et al.
1998). The global occurrences of pharmaceuticals and PhACs in aquatic environment have been
arising as a problem with unknown consequences. PhACs have been reported to be present in
different environmental compartments and often the short term as well as long term effects are
obscure (Kunkel and Radke 2012; Langford et al. 2011) Hence, it has been relatively recently that
PhACs have become a subject of interest to environmentalists worldwide (Hao et al. 2007).
Among PhACs, non-steroidal anti-inflammatory drugs (NSAIDs) are widely used throughout the
world and detected in different environmental compartments at concentrations ranging from ng L-1
to
low mg L-1
(Halling-Sørensen et al. 1998; Khetan and Collins 2007). Moreover, NSAIDs are over-the-
counter (OTC) drugs in most of the countries and this in turn increases the chances for consumption
and hence, their presence in the environment. DCF is often recognized as the ‘world’s most popular
pain killer’ and is also the most commonly used NSAID, with a market share close to that of the next
three most popular drugs combined (ibuprofen, mefenamic acid, naproxen) (McGettigan and Henry

61
2013). The name diclofenac is derived from its chemical name: 2-(2,6-dichloranilino)phenylacetic
acid. Diclofenac was discovered by Ciba-Geigy, a Swiss pharmaceutical company in 1973 (now
merged to Novartis). Diclofenac is commonly used to reduce inflammation and to relieve pain in
diseased conditions, such as arthritis or acute injury. It also works as antiuricosurics and analgesic.
DCF can be applied to skin or it can be administered orally. DCF is supplied as or contained in
medications under a variety of trade names. In Canada, DCF is sold as Voltaren Emulgel and some
other common names are Votalin (China), Diclofenaco Normon (Spain), Volini (India), Diclofenac-
Asteria (USA and Korea), Diclo-Denk (Germany) Voltaren (Argentina, Australia, Belgium, Egypt,
France, Germany, Israel, New Zealand, Norway, Portugal, Russia, South Africa, Sweden, Turkey)
(sources - www.drugs.com/diclofenac, www.drugbank.ca, www.scbt.com).
Pharmacological and physico-chemical properties of DCF are listed in Table 1. Often DCF is not
completely removed from wastewater treatment plants (WWTP) due to its poor degradation and
higher consumption rates (Fatta-Kassinos et al. 2011; Zorita et al. 2009). Hence, DCF is frequently
detected in rivers, sediments and sludges (Kunkel and Radke 2012; Langford et al. 2011). Relatively
recently, DCF has drawn much more attention due to its frequent occurrence in drinking water
sources (Gros et al. 2010) and its potential harmful effects on many organisms at significant
concentration (Cleuvers 2004; Oaks et al. 2004).
Diclofenac is normally used as salt of sodium or potassium for improved solubility and absorption.
Until date, no literature is exclusively available on the environmental perspectives and concerns
regarding the drug, DCF. Most of the previously published reviews have discussed the fate of
diclofenac in WWTPs (Vieno and Sillanpää 2014; Zhang et al. 2008). The objective of this chapter is
to briefly summarize the current status of diclofenac in the environment, review the available
information about its consumption, occurrence, toxicity, resistance, persistence and metabolites. In
addition this review addresses the hypothetical possibility of potential interactions of DCF with other
organic and inorganic contaminants, emerging contaminants along with its own metabolites. Major

62
research gap in the current knowledge and future research need in diclofenac fate and transport in
environment have also been highlighted.
2. Global consumption
It is fairly impossible to calculate the exact global consumption of diclofenac because of various
reasons, such as use of different trade names for DCF, use for human and veterinary purposes and
that the drug is an over the counter drug. Nevertheless, Zhang et al. (2008) estimated that about 940
tons of diclofenac is consumed globally on an annual basis from Intercontinental Marketing Services
(IMS) health data (Zhang et al. 2008). About 877 tons of diclofenac were sold in 2007 in 76 major
countries which are believed to account for about 96% of the global diclofenac pharmaceutical
market (Zhang et al., 2008). In a 2012 report from “Fierce Pharma”, diclofenac was listed as the 12th
bestselling generic molecule globally. The total sales of diclofenac in 2011 were estimated to be
$1.61 billion dollars with a sales charge of 15.5% annually (Palmer 2012). While considering the
sales change information along with previously carried-out consumption estimation, there is high
probability that the annual consumption of DCF might have crossed 1000 tons. Moreover, recent
reports suggests that along with conventional and developed markets, such as United States,
emerging markets such as India, China and Brazil also consume more than 60 tons of DCF on
annual basis (Acuña et al. 2015). In addition, the consumption estimation of DCF does not cover the
veterinary consumption due to non-availability of data and hence the consumption can be even
higher while considering the veterinary usages.
Diclofenac is included in the emergency medical list (EML) of 74 countries. The exact annual
consumption of diclofenac in North America is not available, even though in North America, the
market shares of DCF in the drug market are on a continuous rise. In US, DCF contributes to about
5-6% of the total NSAID market while in Canada, 17% of NSAID consumed is DCF (Henry 2013).
According to the current trend, consumption of DCF will keep on increasing in North America since

63
lifestyle diseases, such as arthritis and heart diseases are now becoming common and the also the
ageing population will require medicines, such as pain killers.
The annual consumption or prescription data for diclofenac is available for some countries.
According to consumption estimation models, in Australia, it was estimated that 4 tons of DCF was
used annually (Khan and Ongerth 2004). In Europe, the largest user of DCF is Germany with 86
tons of usage in the year 2001 (Huschek et al. 2004). For rest of the European countries; the
consumption comprises for England 26.13 tons per year (Jones et al. 2002) , Austria 6.14 tons per
year (Strenn et al. 2004) and France 16 tons per year (Ferrari et al. 2003). The total consumption of
DCF in the entire European continent was estimated to be 179.8 tons per year (Ferrari et al. 2003).
For most of the Asian and African countries, data on consumption of DCF is not available due to the
lack of studies on consumption and also due to the absence of inventory of sales. With the frequent
reports on toxicological effects observed in these countries on vultures, it can be assumed that the
consumption can be colossal.
Recent studies based on IMS health data (which serves 82% of the global population) from 86
countries estimated that at present on an average 1443 ± 58 tons of DCF is consumed globally
(Acuña et al. 2015). In this study authors also indicated that 39.5% of DCF was consumed in Asia
and 28.7% Europe. However, this is only an indication on the consumption DCF for human health
related applications and does not include the consumption of DCF for veterinary uses. At present it
is impossible to calculate the total consumption of DCF since the data for veterinary consumption is
not available.
3. Legislation
DCF in environment has been lately acknowledged to constitute a health risk to terrestrial
organisms. DCF is extremely toxic to vultures (even though they do not consume DCF directly) and
its use on cattle has wiped out and threatened vulture populations in India, Pakistan and Nepal since
the vultures consume cattle carcasses. India was the first country to bring in regulations on the

64
consumption of DCF. In 2006, the manufacture and veterinary use of DCF was banned in India (The
Drug controller general 2006). Further in 2008, India placed additional restrictions on diclofenac for
animal use, with contravention punishable with imprisonment. Further, the same year, Nepal and
Pakistan banned the drug for veterinary use followed by Bangladesh in 2010 (K.Venkateshwarlu
2011).
For the veterinary use, diclofenac does not have a central marketing approval from the European
Medicines Agency (EMA) and it is authorized independently in each member state. Further, EMA
has set a Maximum Residue Limit for DCF in bovine and porcine species. Since 2013, the
commercial production of DCF started in Spain and Italy and is being exported to other European
Union countries. A coalition of famous organizations including the Vulture Conservation Foundation,
The Royal Society for the Protection of Birds, Bird Life Europe and the IUCN Vulture Specialist
Group are campaigning for an EU-imposed, continent-wide ban on veterinary diclofenac following
the lessons from India (BirdLife 2013; Tavares 2014a; Tavares 2014b). Diclofenac has been recently
added to Environmental Quality Standards (EQS) of Europe. According to the European Community
document (COM(2011)876), the annual average value of EQS (evaluation of quality standards) for
DCF was 0.1 μg L-1
. However, this document has been amended and DCF is put on watch list until
next review (Johnson et al. 2013). In 2013, DCF has been selected for inclusion in the watch list of
“EU Water Framework Directive” in order to collect sufficient monitoring data for the determination
of risk reduction measures. According to this proposed EQS document , the maximimum alloable
concentrations are 0.1 μg L-1
in fresh waters and 0.01 μg L-1
in marine waters . Another European
coutry, United Kingdom (UK) has placed DCF in ‘the list of priority substances’ which forced the
water industries to search technologies to remove DCF from wastewater.
Regulatory measures for the use of DCF has been imposed by few countries. Apart from very few
regional/country wise regulations in global scale scenario, strict legislation or directives does not
exist to regulate the production and consumption of DCF to control environmental presence of
diclofenac. Since DCF is emerging as a contaminant of concern and has been acknowledged to

65
pose health risks towards terrestrial organisms, such as vultures, recent efforts have focussed on
survey on contamination of diclofenac in the environment and drafting the rules for the regulation of
the drug. However, there is a need to control the consumption of drug and thereby reduce the
environmental presence. Besides, it is important to set appropriate directives, such as setting a
maximum concentration limit in the environment.
4. Environmental fate
Even though the general purpose of the pharmaceuticals is to positively affect human or animal
health in a unique manner, they often have some adverse effects on the environment. When these
pharmaceuticals enter the environment, they may affect the same pathways in animals having
identical or similar target organs, tissues, cells or biomolecules (Fent et al. 2006). Studies have
demonstrated the potential adverse effects of diclofenac in the environment (Cleuvers 2004; Gros et
al. 2010; Kunkel and Radke 2012; Oaks et al. 2004). Hence, it is important to understand the origin
and fate of pharmaceuticals and diclofenac in particular in the environment for designing appropriate
pollution remedial measures.
Figure 1 demonstrates the possible entry routes of DCF to the environment. Being an anthropogenic
pollutant, the source of diclofenac is the drug industry, and it is used for both human and veterinary
purposes. Through both human and veterinary routes, DCF ends up in wastewater treatment plants
or in landfills as DCF or its metabolites. Also, there are fewer but considerable probabilities for the
drug to reach wastewater treatment plants directly from pharmaceutical industrial residues. Likewise,
the conventional treatment process of DCF in wastewater treatment plants are ineffective (Fatta-
Kassinos et al. 2011; Zorita et al. 2009) and hence DCF can end up in the surface water and the
possibility for the percolation of DCF to the drinking water sources cannot be overruled. In addition,
percolation probabilities for DCF from landfills to surface water are fairly higher. At present, none of
the studies reported DCF causing major risks to aquatic life at an environmentally relevant
concentration. The potential detrimental effect of DCF in the aquatic environment has been revealed

66
from many studies (Cleuvers 2003; Fent et al. 2006; Jones et al. 2002; Lee et al. 2011). The no
effect concentration (NEC) of DCF was calculated to be 100 μg L-1
for freshwater cladocerans and
Japanese medaka (Lee et al. 2011). Another study on rainbow trout and zebra fish , two typical
examples for freshwater organisms no observed effect concentration (NOEC) was observed to be
320 μg L-1
(Memmert et al. 2013).
4.1 Removal processes
The conventional treatment system including wastewater treatment plants exhibited a moderate to
higher degradation efficiency of DCF. DCF is moderately persistent in the environment. In the
reviewed studies, the maximum removal obtained was about 93% by adsorption on activated carbon
followed by ozonation (Beltran et al. 2009). Primary treatment was also efficient with coagulating and
flocculating agents, such as FeCl3, Al2(SO4)3 but did not remove the drug completely from
wastewater (Carballa et al. 2005). Conventional activated sludge processes showed better efficiency
when compared to the MBR. On an average, 30-70% removal can be obtained by the existing
removal methods (Vieno and Sillanpää 2014; Zhang et al. 2008). An overview of the treatment
methods is given in Table 2. The removal efficiency mostly depends upon the treatment methods.
For instance, the conventional activated sludge process exhibited about 75% removal (Kimura et al.
2005; Lonappan et al. 2016), however mostly this removal was achieved through sorption to the
sludge. This happened in conventional wastewater treatment plant where a certain percent of DCF
removal occurred through the accumulation of the drug in wastewater sludge (Lonappan et al. 2016).
Hence, the effective removal or degradation of the drug is minimal in conventional wastewater
treatment system. Several other treatment options which are based on sorption process have been
suggested by various researchers recently (Sotelo et al. 2014; Sotelo et al. 2012; Suriyanon et al.
2013). Even though various natural and synthetic adsorbent materials, such as activated carbon,
biochar, silica based polymer based adsorbents exhibited excellent removal efficiency towards DCF,
as a whole, these processes cannot be considered as sustainable methods; as they do not
completely remove DCF from the environment. Instead, water/wastewater bound DCF is

67
accumulated on the adsorbent. Another most widely used method for the treatment of DCF is based
on advanced oxidation processes, such as ozonation (Beltran et al. 2009). Few recent developments
are promising and sustainable. Studies demonstrated the effective use of enzymes for the complete
degradation of DCF from water (Marco-Urrea et al. 2010) which will create no harmful byproducts.
4.2 Presence in aquatic environment
The potential detrimental effect of DCF in the aquatic environment has been revealed from many
studies (Cleuvers 2003; Fent et al. 2006; Jones et al. 2002; Lee et al. 2011). However, all these
studies were conducted at laboratory scale. In surface water bodies, DCF has been detected in ng L-
1whereas in wastewater; the concentration has been as high as micrograms per liter. The
concentration decreased by natural processes, such as soil retention, biodegradation and photo-
transformation and also by physico-chemical processes in wastewater treatment plants. Table 3
presents the recent occurrence of diclofenac in the aquatic environment in different countries over a
time period of 15 years. In surface waters, DCF contamination occurred in rivers, estuaries and
lakes (Buser et al. 1998; Kim et al. 2007; Metcalfe et al. 2003; Öllers et al. 2001). Also, there are a
few reports of detection in groundwater and drinking water (Benotti et al. 2008; Rabiet et al. 2006).
Most of the detection has been from EU countries, but this does not indicate that DCF was only
present in European countries. In Asia, the available data was insufficient to predict the
environmental concentrations as there was no systematic annual data. When compared to Europe,
the consumption of DCF in North America was lower. However, there are a few reported cases of
DCF detection in the environment (Metcalfe et al. 2003; Sosiak and Hebben 2005).
In reviewed data, the highest concentration detected was in rivers and was in Pakistan as 4900 ng
L-1
(Scheurell et al. 2009) and one of the potential reason could be due to the absence of advanced
WWTPs in Asian countries. Meanwhile, recent reports from Canada showed that WWTP effluents
contain very high concentration of DCF such as 16 μg L−1
(Lonappan et al. 2016). German water
bodies have also been heavily polluted with DCF and maximum concentration detected was 1030
68
ng L-1
in river water (Heberer 2002a). In Spain, DCF residues were detected in river Delta (Lopez-
Serna et al. 2013). DCF residues were detected in almost all European Union countries (Hernando
et al. 2006; Loos et al. 2010). In US and Germany, DCF was even detected in drinking water which
warrants attention (Benotti et al. 2008; Heberer 2002b).
DCF has been detected mostly in fresh water bodies all over the world. Water containing DCF is
discharged to surface water from WWTPs after treatment. The concentration ranges from few
hundreds of ng L-1
to thousands of ng L-1
. In Asian countries, there are no strict measures to monitor
the concentration of DCF in aquatic environment. From the few available studies in rivers, it is clear
that DCF is discharged to surface water without proper treatment. Therefore, in this region, the load
of DCF into the aquatic environment could be reduced by proper treatment of wastewater. Mostly,
these wastewater treatment plants must be equipped with train of primary, secondary and tertiary
treatment for an effective removal.
4.3 Presence in soil
There are a few reported cases of detection in DCF in soil. Diclofenac could potentially reach
agricultural lands through the application of municipal sewage sludge as a source of nutrients in soil
or through wastewater and it has been detected in the Canadian province of Ontario (Al-Rajab et al.
2010). Studies on the sorption coefficient of diclofenac proved that sorption even in sandy sediment
was relevant and therefore diclofenac was less mobile in groundwater (Scheytt et al. 2005). On the
other hand, studies from Israel reported that DCF showed slower mobility in organic rich agricultural
soils and higher mobility in fresh water column and which caused its leaching to the ground water
and ultimately to drinking water after rain events (Chefetz et al. 2008; Drillia et al. 2005). Few other
studies also pointed to the same possibility. (Chefetz et al. 2008; Xu et al. 2009)
The toxicity of DCF in soil towards plants and soil organisms/microorganisms has been poorly
understood. More investigations must be carried out in this environmental compartment. The only
information that is available is that DCF has been readily degraded in soil and was highly adsorbed

69
by organic rich soil (Al-Rajab et al. 2010; Xu et al. 2009). DCF is less toxic towards leguminous
plants when compared to other pharmaceuticals, such as sulfamethazine (Ziółkowska et al. 2014)
and DCF does not show any harmful effect towards plant growth (Carter et al. 2014b). Also, DCF
does not show any toxic effects (behavior, weight change, mortality) towards soil organisms, such as
earthworms (Carter et al. 2014a). However, recent reports on soil application of wastewater sludge
containing DCF suggested medium risks towards soil microbes (Verlicchi and Zambello 2015).
From the little available information on the fate and toxicity of DCF in soil, DCF exhibits lower toxicity
and moderate persistence. However, in soils with large amount of organic matter, DCF gets
adsorbed to the soil and exhibited resistivity towards aerobic/anaerobic degradation and may leach
out to the groundwater causing accumulated toxic effects. Thus, future studies should focus on the
fate of DCF in agricultural lands with further monitoring of fate through groundwater aquifers.
5. Toxicity
Earlier, most of the studies on the toxic effects of DCF were focused on its adverse effects on the
aquatic animals. The toxic concerns regarding DCF in freshwater environment have been studied in
the laboratories with the help of model organism for toxicological studies. The first widely noted case
of pharmaceutical causing major ecological damage was the sudden collapse of vultures due to the
consumption of carcasses containing residues of DCF. After these consecutive incidents in the first
decade of 20th century, DCF has got much worldwide attention. The following section describes the
toxic concerns over DCF in aquatic environment; particularly in freshwater environment and the
events of DCF toxicity towards terrestrial animals.

70
5.1 Aquatic organisms
Many toxicity studies were conducted worldwide to evaluate the toxicity of DCF in aquatic
organisms. One of the widely used and highly standardized methods for measuring toxicity was the
acute immobilization tests. (Ferrari et al. 2003), conducted one of the first studies on the toxic effects
of DCF. This study was carried out on bacteria, algae, microcrustaceans and fish, and showed
relatively less toxic effects even at environmental concentrations. On the contrary, later studies
revealed the potential impacts of diclofenac on the environment. According to risk assessment
studies, the potential ecological risk of diclofenac in surface waters was higher (Hernando et al.
2006). (Cleuvers 2004), conducted ecotoxicity studies using acute Daphnia and algal tests and
revealed that DCF was potentially harmful to aquatic organisms. In the same study, Cleuvers (2004)
also reflected that under field or environmental concentrations, the adverse effects were either less
or negligible and a mixture of pharmaceuticals can be considerably toxic even at lower
concentrations. In crustacea (Daphnia magna sp.), at acute concentrations, such as mg L-1
, DCF
induced high mortality rate. From different studies for 48h exposure, the presence of DCF produced
higher mortality and the EC50 values were reported to be 22.4 mg L-1
and 39.9 mg L-1
(Ferrari et al.
2003; Haap et al. 2008). Also, for Ceriodaphnia dubia sp., mortality was observed and the EC50 was
22.7 mg L-1
(Ferrari et al. 2003). On the contrary, (Lee et al. 2011) reported 3 times higher values for
48 h EC50 tests for the same species. Surprisingly, studies from Canada reported that DCF was a
major risk even at predicted environmental concentrations (10-100 ng L-1
) (Lawrence et al. 2007).
These studies in river biofilm communities revealed the significant impacts of DCF on community
structure and function at even lower concentrations of 100 ng L-1
.
DCF was known to exert deadly effects by damaging renal and gastrointestinal tissue in several
vertebrates, such as fishes. In an exposure assessment study, (Letzel et al. 2009) found that at
environmentally relevant concentrations, such as nanograms per liter, DCF may cause chronic
adverse effects on fish populations. In fish, Japanese medaka (Oryzias latipes), DCF adversely
affected the growth in egg phase and resulted in significant reduction of hatchability and delay in

71
hatching (Lee et al. 2011). In a study on zebra fish, (Hallare et al. 2004) observed the same results.
Hatching was delayed when the embryos were exposed to 2000 µg L-1
. In brown trout, DCF was not
completely excreted through first pass metabolism, but a significant part of the DCF entered
enterohepatic circulation. The resulting prolonged availability of DCF in the organism possibly
promoted accumulation of DCF (Hoeger et al. 2008). For the same species, a heavy damage of gill,
liver and kidney was observed at 50 µg L-1
(Hoeger et al. 2005). For rainbow trout, even at
environmentally observed concentrations, DCF interfered with the biochemical functions and lead to
tissue damage (Mehinto et al. 2010; Schwaiger et al. 2004). DCF may accumulate in liver kidney,
gills and muscle tissues of rainbow trout and can cause cytological alterations even at 1 µg L-1
(Schwaiger et al. 2004; Triebskorn et al. 2004).
Mussels got affected by DCF at concentrations that are prevalent in the environment. At nanograms
per liter level concentrations, DCF significantly induced lipid peroxidation (LPO) in mussels indicating
tissue damage (Schmidt et al. 2011). A relatively recent study (Gonzalez-Rey and Bebianno 2014)
proved that at 250 ng L-1
, which came very close to the concentrations in certain German rivers,
DCF induced tissue specific biomarker responses leading to the tissue damage. DCF was also
adversely affecting the metabolism and growth of the blue mussels which are common in Baltic Sea
(Ericson et al. 2010).
Except for mussels, environmentally relevant concentrations appeared to be less toxic for aquatic
animals. Most of the studies suggested that continuous exposure to DCF even at very low
concentrations may lead to some adverse effects in aquatic animals. It was estimated that the no
effect concentration of DCF was 0.1 mg L-1
(Lee et al. 2011), which is very high when compared to
those observed in aquatic systems/ real environmental conditions (Table 3). Moreover, DCF and its
metabolites were observed in fish bile (Kallio et al. 2010). Several photo-transformation products can
be more toxic than DCF at the concentration that may come close to the environmental
concentrations (Schmitt-Jansen et al. 2007). However, the toxicity of metabolites of DCF was poorly
understood in the environment. The future studies may include the toxicity studies of photo-

72
transformation products of DCF and mixture toxicity studies. Also, the future studies should
concentrate on the bioaccumulation of DCF in the food web and chronic exposure studies at lower
but environmentally relevant concentrations since the DCF residue is continuously introduced and
dynamically increasing in the environment.
5.2 Terrestrial organisms
The first widely noted case of pharmaceutical causing major ecological damage was the sudden
collapse of vultures due to the consumption of carcasses containing residues of DCF, and this
threatened several vulture species to extinction (Oaks et al. 2004; Taggart et al. 2007b). DCF was
the major cause of collapse of population of three Gyps vulture species (Gyps bengalensis, Gyps
indicus, Gyps tenuirostris) which were severely affected, reduced by 98% in the Indian sub-continent
and was included in “critically endangered” species list of IUCN (Das et al. 2010).
In 2003, studies reported the catastrophic collapse of Indian white-backed Gyps bengalensis and
long-billed Gyps indicus vulture populations due to some unknown reason or epidemics (Ferrari et
al. 2004; Prakash et al. 2003). However, the exact reason for this sudden collapse was discovered
by Oaks et al in 2004, and it was found to be the renal portal vasoconstriction caused by DCF. On
the contrary, another study reported the cause of death as decreased uric acid excretion (Naidoo
and Swan 2009). Most of the investigations led to the probability of renal failure due to the
consumption of DCF (Sharma et al. 2014; Swan et al. 2006; Taggart et al. 2007a). The major food
source of vultures was the livestock from cows and goats. These animals were treated with DCF and
although DCF was short lived in these animals, the prevalence in carcasses available to vultures
may still be very high (Taggart et al. 2007a) and Gypes vultures were extremely susceptible to very
lower doses of DCF (Swan et al. 2006). These events even affected the ecosystem. DCF did not
only affect the population of vultures but also the community structure of the ecosystem. Vultures are
keystone species and their decline has a range of socio-economic as well as culture and biodiversity
impacts. As an example, the rabies causing dogs and vultures were having same food source. The

73
decrease in the number of vultures increased the availability of food for dogs by reducing
competition over food (Markandya et al. 2008). Hence, the decline in vultures had a biological and
social effect in the specific region of concern.
The veterinary application of DCF is also threatening the vulture species in Africa (Naidoo et al.
2009; Virani et al. 2011). There are reported cases of major decline in the abundance of vultures and
other scavenging raptors from Kenya and the reason was suspected to be DCF (Virani et al. 2011).
Moreover, relatively recently, DCF has been reported to be fatal for eagles which widens the
diversity of raptors threatened by DCF (Sharma et al. 2014).
Recent studies reported that the ban of DCF for veterinary use in south Asian countries was an
effective measure and the vulture population is on rise now (Khadka and Mandal 2013; Prakash et
al. 2012). Hence, legislative measures succeeded for DCF in South Asia through its ban for
veterinary use. Nevertheless, there are DCF residues already present in the environment, especially
those that pass through the soil into groundwater which need to be investigated to avoid any future
chronic toxicity effects on organisms. However, there are other terrestrial animals which feed on the
carcasses of cattle and which need to be studied as they are the intermediate transporters of DCF
during its veterinary use.
6. Metabolites
In animals, after consumption, DCF is mostly degraded into hydroxyl derivatives. DCF is easily
degraded to its transformation products in the environment. The major natural process of
degradation is photo-transformation by sunlight. DCF is one of the best investigated pharmaceutical
residues in the environment (Vieno and Sillanpää 2014; Zhang et al. 2008). However, studies on the
occurrence and toxicity of its metabolites in the environment are not well understood.

74
6.1 Via consumption routes
In human body, DCF derivative is found in urine and plasma. The hydroxylated and methoxylated
derivatives of DCF are present in their free forms well as glucuronide-conjugated forms. In an earlier
study, Stierlin et al. identified the metabolites of DCF in human body and the main metabolite was
identified to be 4'-hydroxydiclofenac (2-[2,6-dichloro-4 hydroxyphenylamino] phenylethanoic acid)
(30%) and other major metabolites are 5'-hydroxydiclofenac (2-[2,6-dichlorophenylamino]-5-
hydroxyphe nylethanoic acid) (10 %) , 3'-hydroxydiclofenac (2-[2,6-dichloro-3-hydro xyphenylamino]
phenylethanoic acid) and 4',5-dihydroxydiclofenac (2-[2,6-dichloro-4-hydroxyphenylamino]-5-
hydroxyphenylethanoic acid) (15%) (Boettcher et al. 1991; Stierlin et al. 1979). Recently, some
minor metabolites were also identified in human body (Stulten et al. 2008a). Along with hydroxyl
derivatives of DCF, acyl glucuronide and hydroxyl acyl glucuronide were also found in mouse and
fish (Kallio et al. 2010; Naisbitt et al. 2007).The identified human metabolites of DCF are depicted in
table 4. The wide occurrence of human metabolites of diclofenac in water and its structural similarity
towards diclofenac is a matter of concern on toxicity grounds and needs to be investigated further.
6.2 Via abiotic degradation route
DCF was readily degraded in the sunlight. The half-life of DCF is estimated to be 3.3 h (Schmitt-
Jansen et al. 2007). DCF followed first order kinetics during photodegradation and was detected in
water cycle. (Qin and Yang 2012). Photodegradation was identified as the main removal process for
the degradation of DCF in lakes and it was estimated that about 90% of DCF was eliminated by this
process (Buser et al. 1998). Many phototransformation products of DCF were identified by various
researchers (Agüera et al. 2005; Moore et al. 1990; Qin and Yang 2012). Most significant process of
DCF phototransformation was identified as the photocyclisation to the corresponding
monohalogenated carbazole (Eriksson et al. 2010). Most of the photochemical decomposition
products occurred as two main sub-structures: 2-Chloro- and 2,6-Dichlorodiphenylamine derivatives
and also 8-Hydroxy- and 8-Chlorocarbazole derivatives (Agüera et al. 2005; Moore et al. 1990).

75
Not only diclofenac, but also its metabolites are globally entering the aqueous environment. There
are reports that some of the DCF metabolites are even more toxic than DCF. Some of the
phototransformation products exhibited a six fold increase in toxicity in algal reproduction tests
(Schmitt-Jansen et al. 2007; Schulze et al. 2010). In view of the toxic effects of diclofenac on
several water organisms, it appeared that the metabolites also initiated objectionable reactions in
other organisms and needed strict surveillance during drug toxicological and environmental
monitoring experiments (Stulten et al. 2008b). Therefore, future studies need to investigate the
potential toxicity of DCF metabolites. However, the analysis of DCF transformation products is often
laden with challenges. For example, unavailability of metabolite standards obstructs the exact
quantification of DCF transformation products. Another analytical challenge is the low level (often
nanograms per liter) occurrence of the drug and its transformation products. Hence, MS/MS
instruments with high sensitivity and appropriate methods are needed to quantify this “micro-
pollutant”.
7. Interactions with other pollutants- proposed approach
For diclofenac, WWTPs being one of the major sink; interaction with other contaminants is a
possibility that has to be studied. A hypothetical representation of a typical secondary treatment
system in wastewater treatment plant depicting interaction of diclofenac with other pollutants is
shown in Figure 2. Municipal wastewater treatment plants are complex systems that receive
contaminants from a variety of sources. These include contaminants, such as suspended solids,
biodegradable organics such as proteins, carbohydrates and fats (particularly in hospital
wastewater), nutrients, such as nitrogen, phosphorus and carbon -(from various origin), refractory
organics, such as pesticides, phenols, surfactants, heavy metals, dissolved organics, and
pathogens of various category (bacteria, viruses, protozoa etc.). In addition, they also receive
various pharmaceuticals and personal care products (PPCPs) termed as emerging contaminants.
Often emerging contaminants are detected in minute concentrations, such as ng L-1
or μg L-1
. These
lower concentrations are even undetectable without specific sensitive methods. Moreover, for

76
pharmaceuticals, corresponding metabolites are formed during in vivo human/veterinary metabolism
and they could become a new category of potential emerging contaminants.
Micro-pollutants, such as pharmaceuticals are present in ‘micro’ concentrations. However, even at
this micro concentration, they can cause adverse impacts in the environment. In addition, these
contaminants can interact/combine/aggregate with other pollutants of the same or different class.
For example, for pharmaceuticals, including DCF, it is proven that in a mixture of pharmaceuticals,
considerable combination effects could also occur if some or even all substances were applied in
concentrations below their NOEC (No Observed Effect Concentration) (Cleuvers 2004; Cleuvers
2008).
As described in section 5, many studies already evaluated the toxic concerns regarding DCF in
various environmental compartments. However, very few studies have examined the mixture toxicity
concerns regarding DCF along with other pharmaceuticals. A recent study suggested antagonistic
interactions between nutrients and emerging contaminants including DCF in stream biofilms (Aristi et
al. 2016); however long term real exposure experiments are required to bring out actual mixture
toxicity effects. Hence, to interpose realism into future risk assessment studies, mixture toxicity
studies must focus on: (i) whether ecotoxicity of a pharmaceutical mixture is higher than that of the
toxicity of each individual pharmaceutical; and (ii) if acting singly at lower concentrations what will
be the toxicity of the individual drug, DCF (Backhaus 2014). These studies will thus need efforts from
environmental exposure assessment studies for toxicity evaluation. Furthermore, since the number
of drugs and its varieties are on an increase along with hundreds of existing pharmaceuticals, the
need for creating database for the mixture toxicity concerns of DCF along with other
pharmaceuticals is vital. These interactions and mixture toxicity studies must consider toxicokinetic
and toxicodynamic interactions in test organisms along with ecological interactions for real scale
studies (Backhaus 2014) .

77
7.1 Proposed interactions of DCF with metals, other inorganics and organics
Conventionally, diclofenac treatment occurs in the wastewater treatment plant. WWTP receive
wastewater from various sources, such as industries, hospitals, households and municipal
wastewater, among others. Because of the differences in origin, the contaminants are also diverse.
Metals and heavy metals, in particular is a major class of contaminants that are usually present
(Barakat 2011; da Silva Oliveira et al. 2007; Karvelas et al. 2003). Various physico-chemical
conditions in a conventional wastewater treatment plant can catalyze this process. Previous studies
already proved that DCF along with certain metals possess higher anti-inflammatory activity and
antioxidant property than DCF alone (Kovala-Demertzi 2000). Moreover, DCF has active groups
such as amino, hydroxyl, carbonyl, and carboxyl groups in its structure. These groups can enhance
the metal complexation/binding properties with most of the metals. Hence, organometallic
complexation of drugs via chelation is a possibility that can happen in WWTP. DCF can act as ligand
coordinated to the metal ions via the deprotonated functional groups present on it. Moreover, DCF
complexes with Hg(II), Pb(II), and Sn(II) are already known to be antibacterial agents (Refat et al.
2014) while Cu(II) complex of DCF can cleave DNA (Theodorou et al. 1999). Hence, on reaction with
metal complexes, the properties of DCF can change completely and become another potential
pollutant possessing antibacterial and cell destruction capacity. Until date, most of the metal
complexation studies of DCF commonly have been used to uncover its novel therapeutic values and
underlying mechanisms. However, to the best of our knowledge, none of the studies focused on
DCF metal complexes and its toxicity concerns in wastewater effluent. Hence, while considering
DCF as an emerging contaminant having potential toxic concerns towards several organisms, the
metal complexes of DCF must be considered as an emerging contaminant and must be treated with
care while considering its antibacterial properties. The metal complexes of DCF add another
chemical complexity raising toxicity concerns for several organisms.
Moreover, because of the structural properties, DCF can act as a ligand for other inorganic
elements/groups. This property of DCF, particularly in WWTP is crucial from toxicological point of

78
view. Unfortunately, none of the published studies investigated these aspects on DCF toxicity.
Theoretically, the interactions with other inorganic pollutants, such as sulfates, nitrates chlorides are
a certain possibility for DCF along with possible complexation/ aggregation with other numerous
organic pollutants in wastewater matrix
7.2 Proposed interactions of DCF with other ECs and DCF metabolites
Although mixture toxicity concerns with other pharmaceuticals are already established and studied,
the toxicity concerns over DCF metabolites are still valid. The major metabolites of DCF are hydroxy-
metabolites (3'-hydroxydiclofenac, 4’-hydroxydiclofenac, 5’-hydroxydiclofenac). The mixture toxicity
effects of these metabolites are still unknown. There is a possibility for the mixture toxic effect of
DCF and these metabolites similar to one reported with other pharmaceuticals. In addition, various
conditions existing in WWTP can catalyze the effective combination of these metabolites and DCF,
and it may leads to the creation of another potential contaminant. In addition, about 65% percent of
DCF is present as DCF metabolites (Boettcher et al. 1991) and this increases the availability for all
metabolites and DCF.
The reported metabolites of DCF have -OH groups at various positions in the DCF structure. Hence,
the basic molecular structure of DCF largely remains unaltered. The presence of hydroxyl groups on
the structure can enhance the interactions with metals through π- π interactions. (Yamada et al.
1990); applied this principle to DCF metabolites which can easily form metal complexes since the
DCF metabolites are the hydroxyl derivatives of DCF. Moreover, due to the presence of active
groups, such as amino, hydroxyl, carbonyl, and carboxyl groups in metabolites of DCF, there is a
possibility of interaction between these molecules. Hence, these possibilities point toward creation of
“new emerging contaminant” of unknown properties. Likewise, for DCF, it is possible to have
interactions with other ECs. Several other ECs, such as pesticides, surfactants, PPCPs are present
in wastewater (Petrović et al. 2003). Often these ECs are compounds having several active groups
in their structure. Thus, it is possible to have multiple interactions with one or many other ECs and
79
DCF along with its metabolites. These interactions could be with other ECs and/or its
metabolites/transformation products during treatment process.” Recently, the synergistic effect of
DCF and its nitrogen transformation products were studied along with sulfamethoxazole and its
transformation products (Osorio et al. 2016) suggesting that contribution of these compounds to
overall toxicity of complex environmental samples, should not be dismissed.
Hence, experimental evidence is necessary for these interactions to perform toxicity studies and
drafting adequate risk assessment for DCF. However, the existing ecotoxicological and
environmental exposure data is not sufficient and realistic while considering WWTP as the major
sink for DCF. Future studies, particularly toxicity focus on these mixtures of ECs, metabolites, metals
and DCF that are either proven or likely to form new products. To further increase the realism of
ecotoxicological studies, investigation based on these approaches is necessary with overwhelming
number of emerging contaminants being added each day.
8. Conclusions
Diclofenac is one of the major PhACs which has a far flung usage throughout the world. The
residues of diclofenac are found worldwide in surface, ground and drinking water. Even though
diclofenac is removed by natural processes, such as photodegradation, the residue still remains in
the environment as potential toxic metabolites and as diclofenac. Diclofenac in the environment is
detected in lower concentrations, such as nanograms per liter to micro grams per liter and from the
available ecotoxicology data, it is apparent that these lower concentrations can cause acute toxic
effects to many organisms, such as mussels. At lower measured concentrations, there are fewer
chances of acute toxicity. However, extended exposure to lower concentrations may lead to chronic
toxicological effects In the case of diclofenac, continuous entry into the environment due to the year
–round use of medication is increasing the diclofenac residue in the environment. The fate of
diclofenac in soil is poorly understood. In soils, with large amount of organic matter, diclofenac gets
adsorbed to the soil and shows resistivity towards aerobic/anaerobic degradation and may leach out

80
to the groundwater causing toxic effects. The toxicity of diclofenac metabolites is not well
investigated and some studies suspected that few metabolites can be potentially more toxic than the
parent compound. There still remains a lacuna for investigating the environmental impact of
metabolites and also the toxicological effects if any, on the flora and fauna. Diclofenac can interact
with other inorganic contaminants, such as metals, organic contaminants and even with diclofenac
metabolites as they all are present in a complex wastewater matrix in wastewater treatment plant.
This process may lead to the formation of another possible emerging contaminant. Further studies
are required to better assess the fate and toxicological effects of diclofenac and its metabolites and
must consider the possible interaction of diclofenac with other contaminants to develop an effective
treatment method for diclofenac and transformation products. Moreover along with DCF, DCF
metabolites must be considered as another emerging contaminant and treatment methods must
emphasize metabolites as well. The tertiary treatment system must be equipped with more
advanced treatment methods, such as advanced oxidation and environmental friendly enzymatic
treatment methods which are known to be effective for several contaminants including DCF.
Acknowledgements
The authors are sincerely thankful to the Natural Sciences and Engineering Research Council of
Canada (Discovery Grant 355254 and Strategic Grants), and Ministère des Relations internationales
du Québec (coopération Québec-Catalanya 2012-2014) for financial support. The views or opinions
expressed in this article are those of the authors.

81
References
Acuña, V.,Ginebreda, A.,Mor, J.R.,Petrovic, M.,Sabater, S.,Sumpter, J.,Barceló, D., 2015. Balancing the health benefits and environmental risks of pharmaceuticals: Diclofenac as an example. Environment International. 85, 327-333.
Agüera, A.,Pérez Estrada, L.A.,Ferrer, I.,Thurman, E.M.,Malato, S.,Fernández-Alba, A.R., 2005. Application of time-of-flight mass spectrometry to the analysis of phototransformation products of diclofenac in water under natural sunlight. Journal of Mass Spectrometry. 40, 908-915.
Ahrer, W.,Scherwenk, E.,Buchberger, W., 2001. Determination of drug residues in water by the combination of liquid chromatography or capillary electrophoresis with electrospray mass spectrometry. Journal of Chromatography A. 910, 69-78.
Al-Rajab, A.J.,Sabourin, L.,Lapen, D.R.,Topp, E., 2010. The non-steroidal anti-inflammatory drug diclofenac is readily biodegradable in agricultural soils. Sci Total Environ. 409, 78-82.
Alder, A.C.,Bruchet, A.,Carballa, M.,Clara, M.,Joss, A.,Löffler, D.,McArdell, C.S.,Miksch, K.,Omil, F.,Tuhkanen, T.,Ternes, T.A. 2006. Consumption and Occurrence. in: Ternes T.A., Joss A., eds, Human Pharmaceuticals, Hormones and Fragrances The Challenge of Micropollutants in Urban Water Management.IWA Publishing
Anumol, T.,Vijayanandan, A.,Park, M.,Philip, L.,Snyder, S.A., 2016. Occurrence and fate of emerging trace organic chemicals in wastewater plants in Chennai, India. Environment International. 92–93, 33-42.
Aristi, I.,Casellas, M.,Elosegi, A.,Insa, S.,Petrovic, M.,Sabater, S.,Acuña, V., 2016. Nutrients versus emerging contaminants–Or a dynamic match between subsidy and stress effects on stream biofilms. Environmental Pollution. 212, 208-215.
Backhaus, T., 2014. Medicines, shaken and stirred: a critical review on the ecotoxicology of pharmaceutical mixtures. Philosophical Transactions of the Royal Society of London B: Biological Sciences. 369,
Barakat, M.A., 2011. New trends in removing heavy metals from industrial wastewater. Arabian Journal of Chemistry. 4, 361-377.
Behera, S.K.,Kim, H.W.,Oh, J.-E.,Park, H.-S., 2011. Occurrence and removal of antibiotics, hormones and several other pharmaceuticals in wastewater treatment plants of the largest industrial city of Korea. Science of The Total Environment. 409, 4351-4360.
Beltran, F.J.,Pocostales, P.,Alvarez, P.,Oropesa, A., 2009. Diclofenac removal from water with ozone and activated carbon. J Hazard Mater. 163, 768-776.
Bendz, D.,Paxeus, N.A.,Ginn, T.R.,Loge, F.J., 2005. Occurrence and fate of pharmaceutically active compounds in the environment, a case study: Hoje River in Sweden. J Hazard Mater. 122, 195-204.
Benotti, M.J.,Trenholm, R.A.,Vanderford, B.J.,Holady, J.C.,Stanford, B.D.,Snyder, S.A., 2008. Pharmaceuticals and Endocrine Disrupting Compounds in U.S. Drinking Water. Environmental Science & Technology. 43, 597-603.

82
BirdLife, I. Vultures are under threat from the veterinary drug diclofenac. Presented as part of the BirdLife State of the world's birds website. 2013
Boettcher, I.W.,Pfeilschifter, J.,Schweizer, A.,Sallmann, A.,Wenk, P., 1991. Pharmacological properties of five diclofenac metabolites identified in human plasma. Agents and Actions. 34, 135-137.
Buser, H.-R.,Poiger, T.,Müller, M.D., 1998. Occurrence and Fate of the Pharmaceutical Drug Diclofenac in Surface Waters: Rapid Photodegradation in a Lake. Environmental Science & Technology. 32, 3449-3456.
Carballa, M.,Omil, F.,Lema, J.M., 2005. Removal of cosmetic ingredients and pharmaceuticals in sewage primary treatment. Water Res. 39, 4790-4796.
Carmona, E.,Andreu, V.,Picó, Y., 2014. Occurrence of acidic pharmaceuticals and personal care products in Turia River Basin: From waste to drinking water. Science of The Total Environment. 484, 53-63.
Carter, L.J.,Garman, C.D.,Ryan, J.,Dowle, A.,Bergstrom, E.,Thomas-Oates, J.,Boxall, A.B., 2014a. Fate and uptake of pharmaceuticals in soil-earthworm systems. Environ Sci Technol. 48, 5955-5963.
Carter, L.J.,Harris, E.,Williams, M.,Ryan, J.J.,Kookana, R.S.,Boxall, A.B., 2014b. Fate and uptake of pharmaceuticals in soil-plant systems. J Agric Food Chem. 62, 816-825.
Chefetz, B.,Mualem, T.,Ben-Ari, J., 2008. Sorption and mobility of pharmaceutical compounds in soil irrigated with reclaimed wastewater. Chemosphere. 73, 1335-1343.
Clara, M.,Strenn, B.,Gans, O.,Martinez, E.,Kreuzinger, N.,Kroiss, H., 2005. Removal of selected pharmaceuticals, fragrances and endocrine disrupting compounds in a membrane bioreactor and conventional wastewater treatment plants. Water Res. 39, 4797-4807.
Cleuvers, M., 2003. Aquatic ecotoxicity of pharmaceuticals including the assessment of combination effects. Toxicology Letters. 142, 185-194.
Cleuvers, M., 2004. Mixture toxicity of the anti-inflammatory drugs diclofenac, ibuprofen, naproxen, and acetylsalicylic acid. Ecotoxicology and Environmental Safety. 59, 309-315.
Cleuvers, M. 2008. Chronic Mixture Toxicity of Pharmaceuticals to Daphnia – The Example of Nonsteroidal Anti-Inflammatory Drugs. in: Kümmerer K., ed, Pharmaceuticals in the Environment: Sources, Fate, Effects and Risks.Springer Berlin Heidelberg, Berlin, Heidelberg, 277-284.
da Silva Oliveira, A.,Bocio, A.,Beltramini Trevilato, T.M.,Magosso Takayanagui, A.M.,Domingo, J.L.,Segura-Muñoz, S.I., 2007. Heavy metals in untreated/treated urban effluent and sludge from a biological wastewater treatment plant. Environmental Science and Pollution Research - International. 14, 483-489.
Dai, G.,Wang, B.,Huang, J.,Dong, R.,Deng, S.,Yu, G., 2015. Occurrence and source apportionment of pharmaceuticals and personal care products in the Beiyun River of Beijing, China. Chemosphere. 119, 1033-1039.

83
Das, D.,Cuthbert, R.J.,Jakati, R.D.,Prakash, V., 2010. Diclofenac is toxic to the Himalayan Vulture Gyps himalayensis. Bird Conservation International. 21, 72-75.
Drillia, P.,Stamatelatou, K.,Lyberatos, G., 2005. Fate and mobility of pharmaceuticals in solid matrices. Chemosphere. 60, 1034-1044.
Ericson, H.,Thorsen, G.,Kumblad, L., 2010. Physiological effects of diclofenac, ibuprofen and propranolol on Baltic Sea blue mussels. Aquat Toxicol. 99, 223-231.
Eriksson, J.,Svanfelt, J.,Kronberg, L., 2010. A Photochemical Study of Diclofenac and Its Major Transformation Products. Photochemistry and Photobiology. 86, 528–532.
Fatta-Kassinos, D.,Hapeshi, E.,Achilleos, A.,Meric, S.,Gros, M.,Petrovic, M.,Barcelo, D., 2011. Existence of Pharmaceutical Compounds in Tertiary Treated Urban Wastewater that is Utilized for Reuse Applications. Water Resources Management. 25, 1183-1193.
Fent, K.,Weston, A.A.,Caminada, D., 2006. Ecotoxicology of human pharmaceuticals. Aquat Toxicol. 76, 122-159.
Ferrari, B.,Mons, R.,Vollat, B.,Fraysse, B.,Paxēaus, N.,Giudice, R.L.,Pollio, A.,Garric, J., 2004. Environmental risk assessment of six human pharmaceuticals: Are the current environmental risk assessment procedures sufficient for the protection of the aquatic environment? Environmental Toxicology and Chemistry. 23, 1344–1354.
Ferrari, B.t.,Paxéus, N.,Giudice, R.L.,Pollio, A.,Garric, J., 2003. Ecotoxicological impact of pharmaceuticals found in treated wastewaters: study of carbamazepine, clofibric acid, and diclofenac. Ecotoxicology and Environmental Safety. 55, 359-370.
Gomez, M.J.,Martinez Bueno, M.J.,Lacorte, S.,Fernandez-Alba, A.R.,Aguera, A., 2007. Pilot survey monitoring pharmaceuticals and related compounds in a sewage treatment plant located on the Mediterranean coast. Chemosphere. 66, 993-1002.
Gonzalez-Rey, M.,Bebianno, M.J., 2014. Effects of non-steroidal anti-inflammatory drug (NSAID) diclofenac exposure in mussel Mytilus galloprovincialis. Aquat Toxicol. 148, 221-230.
Gros, M.,Petrovic, M.,Ginebreda, A.,Barcelo, D., 2010. Removal of pharmaceuticals during wastewater treatment and environmental risk assessment using hazard indexes. Environ Int. 36, 15-26.
Haap, T.,Triebskorn, R.,Kohler, H.R., 2008. Acute effects of diclofenac and DMSO to Daphnia magna: immobilisation and hsp70-induction. Chemosphere. 73, 353-359.
Hallare, A.V.,Kohler, H.R.,Triebskorn, R., 2004. Developmental toxicity and stress protein responses in zebrafish embryos after exposure to diclofenac and its solvent, DMSO. Chemosphere. 56, 659-666.
Halling-Sørensen, B.,Nors Nielsen, S.,Lanzky, P.F.,Ingerslev, F.,Holten Lützhøft, H.C.,Jørgensen, S.E., 1998. Occurrence, fate and effects of pharmaceutical substances in the environment- A review. Chemosphere. 36, 357-393.
Hao, C.,Clement, R.,Yang, P., 2007. Liquid chromatography–tandem mass spectrometry of bioactive pharmaceutical compounds in the aquatic environment—a decade’s activities. Analytical and Bioanalytical Chemistry. 387, 1247-1257.

84
Heberer, T., 2002a. Occurrence, fate, and removal of pharmaceutical residues in the aquatic environment: a review of recent research data. Toxicology Letters. 131, 5-17.
Heberer, T., 2002b. Tracking persistent pharmaceutical residues from municipal sewage to drinking water. Journal of Hydrology. 266, 175-189.
Heberer, T.,Schmidt-Baumler, K.,Stan, H.J., 1998. Occurrence and distribution of organic contaminants in the aquatic system in Berlin. Part I: Drug residues and other polar contaminants in Berlin surface and groundwater. Acta Hydrochim Hydrobiol. 26, 272-278.
Henry, D. Widely Used Diclofenac Associated With Increased Risk for Cardiovascular Events. in: O’Riordan M., ed. Heartwire. Toronto: www.medscape.com; 2013
Hernando, M.D.,Mezcua, M.,Fernández-Alba, A.R.,Barceló, D., 2006. Environmental risk assessment of pharmaceutical residues in wastewater effluents, surface waters and sediments. Talanta. 69, 334-342.
Hilton, M.J.,Thomas, K.V., 2003. Determination of selected human pharmaceutical compounds in effluent and surface water samples by high-performance liquid chromatography–electrospray tandem mass spectrometry. Journal of Chromatography A. 1015, 129-141.
Hoeger, B.,Dietrich, D.R.,Schmid, D.,Hartmann, A.,Hitzfeld, B., 2008. Distribution of intraperitoneally injected diclofenac in brown trout (Salmo trutta f. fario). Ecotoxicol Environ Saf. 71, 412-418.
Hoeger, B.,Kollner, B.,Dietrich, D.R.,Hitzfeld, B., 2005. Water-borne diclofenac affects kidney and gill integrity and selected immune parameters in brown trout (Salmo trutta f. fario). Aquat Toxicol. 75, 53-64.
Huschek, G.,Hansen, P.D.,Maurer, H.H.,Krengel, D.,Kayser, A., 2004. Environmental risk assessment of medicinal products for human use according to European Commission recommendations. Environmental Toxicology. 19, 226-240.
Johnson, A.C.,Dumont, E.,Williams, R.J.,Oldenkamp, R.,Cisowska, I.,Sumpter, J.P., 2013. Do concentrations of ethinylestradiol, estradiol, and diclofenac in European rivers exceed proposed EU environmental quality standards? Environ Sci Technol. 47, 12297-12304.
Jones, O.A.,Voulvoulis, N.,Lester, J.N., 2002. Aquatic environmental assessment of the top 25 English prescription pharmaceuticals. Water Research. 36, 5013-5022.
K.Venkateshwarlu. Drug being purchased by farmers illegally to treat their cattle: study. The Hindu. Hyderabad: The Hindu; 2011
Kallio, J.-M.,Lahti, M.,Oikari, A.,Kronberg, L., 2010. Metabolites of the Aquatic Pollutant Diclofenac in Fish Bile. Environmental Science & Technology. 44, 7213-7219.
Karvelas, M.,Katsoyiannis, A.,Samara, C., 2003. Occurrence and fate of heavy metals in the wastewater treatment process. Chemosphere. 53, 1201-1210.
Kasprzyk-Hordern, B.,Dinsdale, R.M.,Guwy, A.J., 2008. The occurrence of pharmaceuticals, personal care products, endocrine disruptors and illicit drugs in surface water in South Wales, UK. Water Res. 42, 3498-3518.

85
Khadka, K.K.,Mandal, R.K., 2013. Understanding the Efficacy of Diclofenac Use-ban and its Aftermath Effect on Gyps Vulture in Koshi Tappu Wildlife Reserve, Nepal. Journal of Entomology and Zoology Studies. 1, 20-22.
Khan, S.J.,Ongerth, J.E., 2004. Modelling of pharmaceutical residues in Australian sewage by quantities of use and fugacity calculations. Chemosphere. 54, 355–367.
Khetan, S.K.,Collins, T.J., 2007. Human Pharmaceuticals in the Aquatic Environment: A Challenge to Green Chemistry. Chemical Reviews. 107, 2319-2364.
Kim, S.D.,Cho, J.,Kim, I.S.,Vanderford, B.J.,Snyder, S.A., 2007. Occurrence and removal of pharmaceuticals and endocrine disruptors in South Korean surface, drinking, and waste waters. Water Res. 41, 1013-1021.
Kimura, K.,Hara, H.,Watanabe, Y., 2005. Removal of pharmaceutical compounds by submerged membrane bioreactors (MBRs). Desalination. 178, 135-140.
Kosjek, T.,Heath, E.,Krbavcic, A., 2005. Determination of non-steroidal anti-inflammatory drug (NSAIDs) residues in water samples. Environ Int. 31, 679-685.
Kovala-Demertzi, D., 2000. Transition metal complexes of diclofenac with potentially interesting anti-inflammatory activity. Journal of Inorganic Biochemistry. 79, 153-157.
Kummerer, K. 2004. Pharmaceuticals in the Environment – A Brief Summary in: K. K., ed, Pharmaceuticals in the Environment.Springer-Verlag, Heidelberg,Berlin,
Kunkel, U.,Radke, M., 2012. Fate of pharmaceuticals in rivers: Deriving a benchmark dataset at favorable attenuation conditions. Water Research. 46, 5551-5565.
Langford, K.H.,Reid, M.,Thomas, K.V., 2011. Multi-residue screening of prioritised human pharmaceuticals, illicit drugs and bactericides in sediments and sludge. J Environ Monit. 13, 2284-2291.
Larsson, E.,Rabayah, A.,J?nsson, J.k., 2013. Sludge Removal of Nonsteroidal Anti-Inflammatory Drugs during Wastewater Treatment Studied by Direct Hollow Fiber Liquid Phase Microextraction. Journal of Environmental Protection. Vol.04No.09, 10.
Lawrence, J.R.,SWERHONE, G.D.W.,TOPP, E.,KORBER, D.R.,NEU, T.R.,WASSENAAR, L.I., 2007. Structural and functional responses of river biofilm communities to the nonsteroidal anti-inflammatory diclofenac Environ Toxicol Chem. 26, 573-582.
Lee, J.,Ji, K.,Lim Kho, Y.,Kim, P.,Choi, K., 2011. Chronic exposure to diclofenac on two freshwater cladocerans and Japanese medaka. Ecotoxicol Environ Saf. 74, 1216-1225.
Letzel, M.,Metzner, G.,Letzel, T., 2009. Exposure assessment of the pharmaceutical diclofenac based on long-term measurements of the aquatic input. Environ Int. 35, 363-368.
Lindqvist, N.,Tuhkanen, T.,Kronberg, L., 2005. Occurrence of acidic pharmaceuticals in raw and treated sewages and in receiving waters. Water Res. 39, 2219-2228.
Lonappan, L.,Pulicharla, R.,Rouissi, T.,Brar, S.K.,Verma, M.,Surampalli, R.Y.,Valero, J.R., 2016. Diclofenac in municipal wastewater treatment plant: quantification using laser diode thermal desorption—atmospheric pressure chemical ionization—tandem mass spectrometry

86
approach in comparison with an established liquid chromatography-electrospray ionization–tandem mass spectrometry method. Journal of Chromatography A. 1433, 106-113.
Loos, R.,Locoro, G.,Comero, S.,Contini, S.,Schwesig, D.,Werres, F.,Balsaa, P.,Gans, O.,Weiss, S.,Blaha, L.,Bolchi, M.,Gawlik, B.M., 2010. Pan-European survey on the occurrence of selected polar organic persistent pollutants in ground water. Water Res. 44, 4115-4126.
Lopez-Serna, R.,Jurado, A.,Vazquez-Sune, E.,Carrera, J.,Petrovic, M.,Barcelo, D., 2013. Occurrence of 95 pharmaceuticals and transformation products in urban groundwaters underlying the metropolis of Barcelona, Spain. Environ Pollut. 174, 305-315.
López-Serna, R.,Petrović, M.,Barceló, D., 2012. Occurrence and distribution of multi-class pharmaceuticals and their active metabolites and transformation products in the Ebro River basin (NE Spain). Science of The Total Environment. 440, 280-289.
Ma, R.,Wang, B.,Lu, S.,Zhang, Y.,Yin, L.,Huang, J.,Deng, S.,Wang, Y.,Yu, G., 2016. Characterization of pharmaceutically active compounds in Dongting Lake, China: Occurrence, chiral profiling and environmental risk. Science of The Total Environment. 557–558, 268-275.
Marco-Urrea, E.,Pérez-Trujillo, M.,Cruz-Morató, C.,Caminal, G.,Vicent, T., 2010. Degradation of the drug sodium diclofenac by Trametes versicolor pellets and identification of some intermediates by NMR. Journal of Hazardous Materials. 176, 836-842.
Markandya, A.,Taylor, T.,Longo, A.,Murty, M.N.,Murty, S.,Dhavala, K., 2008. Counting the cost of vulture decline—An appraisal of the human health and other benefits of vultures in India. Ecological Economics. 67, 194-204.
Martín, J.,Camacho-Muñoz, D.,Santos, J.L.,Aparicio, I.,Alonso, E., 2012. Occurrence of pharmaceutical compounds in wastewater and sludge from wastewater treatment plants: Removal and ecotoxicological impact of wastewater discharges and sludge disposal. Journal of Hazardous Materials. 239–240, 40-47.
McGettigan, P.,Henry, D., 2013. Use of Non-Steroidal Anti-Inflammatory Drugs That Elevate Cardiovascular Risk: An Examination of Sales and Essential Medicines Lists in Low-, Middle-, and High-Income Countries. PLoS Med. 10, e1001388.
Mehinto, A.C.,Hill, E.M.,Tyler, C.R., 2010. Uptake and Biological Effects of Environmentally Relevant Concentrations of the Nonsteroidal Anti-inflammatory Pharmaceutical Diclofenac in Rainbow Trout (Oncorhynchus mykiss). Environ Sci Technol. 44, 2176-2182.
Memmert, U.,Peither, A.,Burri, R.,Weber, K.,Schmidt, T.,Sumpter, J.P.,Hartmann, A., 2013. Diclofenac: New data on chronic toxicity and bioconcentration in fish. Environmental Toxicology and Chemistry. 32, 442-452.
Metcalfe, C.D.,Miao, X.-S.,G.Koenig, B.,Struger, J., 2003. Distribution of acidic and neutral drugs in surface waters near sewage treatment plants in the lower great lakes, Canda. Environmental Toxicology and Chemistry. 22, 2881–2889.
Moore, D.E.,Roberts-Thomson, S.,Zhen, D.,Duke, C.C., 1990. PHOTOCHEMICAL STUDIES ON THE ANTIINFLAMMATORY DRUG DICLOFENAC. Photochemistry and Photobiology. 52, 685-690.

87
Naidoo, V.,Swan, G.E., 2009. Diclofenac toxicity in Gyps vulture is associated with decreased uric acid excretion and not renal portal vasoconstriction. Comp Biochem Physiol C Toxicol Pharmacol. 149, 269-274.
Naidoo, V.,Wolter, K.,Cuthbert, R.,Duncan, N., 2009. Veterinary diclofenac threatens Africa's endangered vulture species. Regul Toxicol Pharmacol. 53, 205-208.
Naisbitt, D.J.,Sanderson, L.S.,Meng, X.,Stachulski, A.V.,Clarke, S.E.,Park, B.K., 2007. Investigation of the immunogenicity of diclofenac and diclofenac metabolites. Toxicol Lett. 168, 45-50.
Oaks, J.L.,Gilbert, M.,Virani, M.Z.,Watson, R.T.,Meteyer, C.U.,Rideout, B.A.,Shivaprasad, H.L.,Ahmed, S.,Iqbal Chaudhry, M.J.,Arshad, M.,Mahmood, S.,Ali, A.,Ahmed Khan, A., 2004. Diclofenac residues as the cause of vulture population decline in Pakistan. natute. 427, 630-633.
Öllers, S.,Singer, H.P.,Fässler, P.,Müller, S.R., 2001. Simultaneous quantification of neutral and acidic pharmaceuticals and pesticides at the low-ng/l level in surface and waste water. Journal of Chromatography A. 911, 225-234.
Osorio, V.,Sanchís, J.,Abad, J.L.,Ginebreda, A.,Farré, M.,Pérez, S.,Barceló, D., 2016. Investigating the formation and toxicity of nitrogen transformation products of diclofenac and sulfamethoxazole in wastewater treatment plants. Journal of Hazardous Materials. 309, 157-164.
Palmer, E. Top 20 generic molecules worldwide. wwwfiercepharmacom; 2012
Pereira, A.M.P.T.,Silva, L.J.G.,Meisel, L.M.,Lino, C.M.,Pena, A., 2015. Environmental impact of pharmaceuticals from Portuguese wastewaters: geographical and seasonal occurrence, removal and risk assessment. Environmental Research. 136, 108-119.
Pereira, C.D.S.,Maranho, L.A.,Cortez, F.S.,Pusceddu, F.H.,Santos, A.R.,Ribeiro, D.A.,Cesar, A.,Guimarães, L.L., 2016. Occurrence of pharmaceuticals and cocaine in a Brazilian coastal zone. Science of The Total Environment. 548–549, 148-154.
Petrović, M.,Gonzalez, S.,Barceló, D., 2003. Analysis and removal of emerging contaminants in wastewater and drinking water. TrAC Trends in Analytical Chemistry. 22, 685-696.
Prakash, V.,Bishwakarma, M.C.,Chaudhary, A.,Cuthbert, R.,Dave, R.,Kulkarni, M.,Kumar, S.,Paudel, K.,Ranade, S.,Shringarpure, R.,Green, R.E., 2012. The population decline of Gyps vultures in India and Nepal has slowed since veterinary use of diclofenac was banned. PLoS One. 7, e49118.
Prakash, V.,Pain, D.J.,Cunningham, A.A.,Donald, P.F.,Prakash, N.,Verma, A.,Gargi, R.,Sivakumar, S.,Rahmani, A.R., 2003. Catastrophic collapse of Indian white-backed Gyps bengalensis and long-billed Gyps indicus vulture populations. Biological Conservation. 109, 381-390.
Qin, M.,Yang, H., 2012. PHOTOCHEMICAL CHARACTERISTICS OF DICLOFENAC AND ITS PHOTODEGRADATION OF INCLUSION COMPLEXES WITH β-CYCLODEXTRINS. Quim Nova. 35, 559-562.
Rabiet, M.,Togola, A.,Brissaud, F.,Seidel, J.-L.,Budzinski, H.,Elbaz-Poulichet, F., 2006. Consequences of Treated Water Recycling as Regards Pharmaceuticals and Drugs in

88
Surface and Ground Waters of a Medium-sized Mediterranean Catchment. Environmental Science & Technology. 40, 5282-5288.
Refat, M.S.,Mohamed, G.G.,Ibrahim, M.Y.S.,Killa, H.M.A.,Fetooh, H., 2014. Synthesis and Characterization of Coordination Behavior of Diclofenac Sodium Drug Toward Hg(II), Pb(II), and Sn(II) Metal Ions: Chelation Effect on Their Thermal Stability and Biological Activity. Synthesis and Reactivity in Inorganic, Metal-Organic, and Nano-Metal Chemistry. 44, 161-170.
Sacher, F.,Lange, F.T.,Brauch, H.-J.,Blankenhorn, I., 2001. Pharmaceuticals in groundwaters: Analytical methods and results of a monitoring program in Baden-Württemberg, Germany. Journal of Chromatography A. 938, 199-210.
Samaras, V.G.,Stasinakis, A.S.,Mamais, D.,Thomaidis, N.S.,Lekkas, T.D., 2013. Fate of selected pharmaceuticals and synthetic endocrine disrupting compounds during wastewater treatment and sludge anaerobic digestion. Journal of Hazardous Materials. 244–245, 259-267.
Scheurell, M.,Franke, S.,Shah, R.M.,Huhnerfuss, H., 2009. Occurrence of diclofenac and its metabolites in surface water and effluent samples from Karachi, Pakistan. Chemosphere. 77, 870-876.
Scheytt, T.,Mersmann, P.,Lindstadt, R.,Heberer, T., 2005. Determination of sorption coefficients of pharmaceutically active substances carbamazepine, diclofenac, and ibuprofen, in sandy sediments. Chemosphere. 60, 245-253.
Schmidt, W.,O'Rourke, K.,Hernan, R.,Quinn, B., 2011. Effects of the pharmaceuticals gemfibrozil and diclofenac on the marine mussel (Mytilus spp.) and their comparison with standardized toxicity tests. Mar Pollut Bull. 62, 1389-1395.
Schmitt-Jansen, M.,Bartels, P.,Adler, N.,Altenburger, R., 2007. Phytotoxicity assessment of diclofenac and its phototransformation products. Analytical and Bioanalytical Chemistry. 387, 1389-1396.
Schulze, T.,Weiss, S.,Schymanski, E.,von der Ohe, P.C.,Schmitt-Jansen, M.,Altenburger, R.,Streck, G.,Brack, W., 2010. Identification of a phytotoxic photo-transformation product of diclofenac using effect-directed analysis. Environ Pollut. 158, 1461-1466.
Schwaiger, J.,Ferling, H.,Mallow, U.,Wintermayr, H.,Negele, R.D., 2004. Toxic effects of the non-steroidal anti-inflammatory drug diclofenac. Part I: histopathological alterations and bioaccumulation in rainbow trout. Aquat Toxicol. 68, 141-150.
Sharma, A.K.,Saini, M.,Singh, S.D.,Prakash, V.,Das, A.,Bharathi Dasan, R.,Pandey, S.,Bohara, D.,Galligan, T.H.,Green, R.E.,Knopp, D.,Cuthbert, R.J., 2014. Diclofenac is toxic to the Steppe Eagle Aquila nipalensis: widening the diversity of raptors threatened by NSAID misuse in South Asia. Bird Conservation International. 1-5.
Sosiak, A.l.,Hebben, T. A Preliminary Survey of Pharmaceuticals and Endocrine Disrupting Compounds in Treated Municipal Wastewaters and Receiving Rivers of Alberta. in: Sosiak A.l., Hebben T., eds. Alberta: Monitoring and Evaluation Branch Environmental Assurance; 2005

89
Sotelo, J.L.,Ovejero, G.,Rodríguez, A.,Álvarez, S.,Galán, J.,García, J., 2014. Competitive adsorption studies of caffeine and diclofenac aqueous solutions by activated carbon. Chemical Engineering Journal. 240, 443-453.
Sotelo, J.L.,Rodríguez, A.,Álvarez, S.,García, J., 2012. Removal of caffeine and diclofenac on activated carbon in fixed bed column. Chemical Engineering Research and Design. 90, 967-974.
Stierlin, H.,Faigle, J.W.,Sallmann, A.,Kung, W.,Richter, W.J.,Kriemler, H.P.,Alt, K.O.,Winkler, T., 1979. Biotransformation of diclofenac sodium (Voltaren®) in animals and in man. Xenobiotica. 9, 601-610.
Strenn, B.,Clara, M.,Gans, O.,Kreuzinger, N., 2004. Carbamazepine, diclofenac, ibuprofen and bezafibrate - investigations on the behaviour of selected pharmaceuticals during wastewater treatment. Water Science and Technology. 50, 269-276.
Stulten, D.,Lamshoft, M.,Zuhlke, S.,Spiteller, M., 2008a. Isolation and characterization of a new human urinary metabolite of diclofenac applying LC–NMR–MS and high-resolution mass analyses. Journal of Pharmaceutical and Biomedical Analysis. 47, 371–376.
Stulten, D.,Zuhlke, S.,Lamshoft, M.,Spiteller, M., 2008b. Occurrence of diclofenac and selected metabolites in sewage effluents. Sci Total Environ. 405, 310-316.
Suriyanon, N.,Punyapalakul, P.,Ngamcharussrivichai, C., 2013. Mechanistic study of diclofenac and carbamazepine adsorption on functionalized silica-based porous materials. Chemical Engineering Journal. 214, 208-218.
Swan, G.E.,Cuthbert, R.,Quevedo, M.,Green, R.E.,Pain, D.J.,Bartels, P.,Cunningham, A.A.,Duncan, N.,Meharg, A.A.,Oaks, J.L.,Parry-Jones, J.,Shultz, S.,Taggart, M.A.,Verdoorn, G.,Wolter, K., 2006. Toxicity of diclofenac to Gyps vultures. Biol Lett. 2, 279-282.
Taggart, M.A.,Cuthbert, R.,Das, D.,Sashikumar, C.,Pain, D.J.,Green, R.E.,Feltrer, Y.,Shultz, S.,Cunningham, A.A.,Meharg, A.A., 2007a. Diclofenac disposition in Indian cow and goat with reference to Gyps vulture population declines. Environ Pollut. 147, 60-65.
Taggart, M.A.,Senacha, K.R.,Green, R.E.,Jhala, Y.V.,Raghavan, B.,Rahmani, A.R.,Cuthbert, R.,Pain, D.J.,Meharg, A.A., 2007b. Diclofenac residues in carcasses of domestic ungulates available to vultures in India. Environ Int. 33, 759-765.
Tavares, J. Diclofenac in Europe – current situation, legal aspects, potential impacts and required actions. Technical Dossier. Switzerland: http://www.4vultures.org; 2014a
Tavares, J. Diclofenac: drug causing wildlife catastrophe in South Asia is available on EU market. Brussels: Vulture Conservation Foundation; 2014b
The Drug controller general, I. Diclofenac for veterinary use : regarding. in: Services D.G.o.H., ed. FNo18-03/2006-DC. New Delhi; 2006
Theodorou, A.,Demertzis, M.A.,Kovala-Demertzi, D.,Lioliou, E.E.,Pantazaki, A.A.,Kyriakidis, D.A., 1999. Copper(II) complexes of diclofenac: Spectroscopic studies and DNA strand breakage. Biometals. 12, 167-172.

90
Thomas, K.V.,Hilton, M.J., 2004. The occurrence of selected human pharmaceutical compounds in UK estuaries. Marine Pollution Bulletin. 49, 436-444.
Triebskorn, R.,Casper, H.,Heyd, A.,Eikemper, R.,Kohler, H.R.,Schwaiger, J., 2004. Toxic effects of the non-steroidal anti-inflammatory drug diclofenac. Part II: cytological effects in liver, kidney, gills and intestine of rainbow trout (Oncorhynchus mykiss). Aquat Toxicol. 68, 151-166.
Valdés, M.E.,Amé, M.V.,Bistoni, M.d.l.A.,Wunderlin, D.A., 2014. Occurrence and bioaccumulation of pharmaceuticals in a fish species inhabiting the Suquía River basin (Córdoba, Argentina). Science of The Total Environment. 472, 389-396.
Verlicchi, P.,Zambello, E., 2015. Pharmaceuticals and personal care products in untreated and treated sewage sludge: Occurrence and environmental risk in the case of application on soil — A critical review. Science of The Total Environment. 538, 750-767.
Vieno, N.,Sillanpää, M., 2014. Fate of diclofenac in municipal wastewater treatment plant — A review. Environment International. 69, 28-39.
Virani, M.Z.,Kendall, C.,Njoroge, P.,Thomsett, S., 2011. Major declines in the abundance of vultures and other scavenging raptors in and around the Masai Mara ecosystem, Kenya. Biological Conservation. 144, 746-752.
Weigel, S.,Kuhlmann, J.,Hühnerfuss, H., 2002. Drugs and personal care products as ubiquitous pollutants: occurrence and distribution of clofibric acid, caffeine and DEET in the North Sea. Science of The Total Environment. 295, 131-141.
Willis, J.V.,Kendall, M.J.,Flinn, R.M.,Thornhill, D.P.,Welling, P.G., 1979. The pharmacokinetics of diclofenac sodium following intravenous and oral administration. European Journal of Clinical Pharmacology. 16, 405-410.
Xu, J.,Wu, L.,Chang, A.C., 2009. Degradation and adsorption of selected pharmaceuticals and personal care products (PPCPs) in agricultural soils. Chemosphere. 77, 1299-1305.
Yamada, T.,Kuroda, Y.,Fukuoka, A.,Ichikawa, M.,Tanaka, K., 1990. Reactivity of surface hydroxyl groups with metal complex compounds. Journal of Electron Spectroscopy and Related Phenomena. 54–55, 845-854.
Yoon, Y.,Ryu, J.,Oh, J.,Choi, B.-G.,Snyder, S.A., 2010. Occurrence of endocrine disrupting compounds, pharmaceuticals, and personal care products in the Han River (Seoul, South Korea). Science of The Total Environment. 408, 636-643.
Zhang, Y.,Geissen, S.U.,Gal, C., 2008. Carbamazepine and diclofenac: removal in wastewater treatment plants and occurrence in water bodies. Chemosphere. 73, 1151-1161.
Ziółkowska, A.,Piotrowicz-Cieślak, A.I.,Rydzyński, D.,Adomas, B.,Nałęcz-Jawecki, G., 2014. Biomarkers of Leguminous Plant Viability in Response to Soil Contamination with Diclofenac. Pol J Environ Stud. 23, 263-269.
Zorita, S.,Martensson, L.,Mathiasson, L., 2009. Occurrence and removal of pharmaceuticals in a municipal sewage treatment system in the south of Sweden. Sci Total Environ. 407, 2760-2770.

91
Table 1: Physico-chemical and pharmacological properties of diclofenac (in unionized form)
Properties Reference
Structure
www. pubchem.ncbi.nlm.nih.gov,
www.chemspider.com
Molecular formula and
molecular weight
C14H11Cl2NO2, 296.16 g mol-1
www.drugbank.ca,
www.pubchem.ncbi.nlm.nih.gov
CAS no.
15307-86-5
15307-79-6 (disodium salt)
www.drugbank.ca,
www.pubchem.ncbi.nlm.nih.gov
Water solubility
2.37 mg L
−1 (25 °C)
www.drugbank.ca,
www.chemspider.com
Henry’s law constant
4.79×10
−7 Pa m
3 mol
−1 (25 °C)
www.scbt.com, www.pubchem.ncbi.nlm.nih.gov
Melting and boiling
points
283-285
0C and 412 °C at 760 mm Hg
(Predicted) respectively
www.drugbank.ca,
www.chemspider.com
pKa
4.15
www.drugbank.ca,
www.chemspider.com
Log Kow (logarithm of octanol-water partition
coefficient)
4.51
www.scbt.com,
www.pubchem.ncbi.nlm.nih.gov
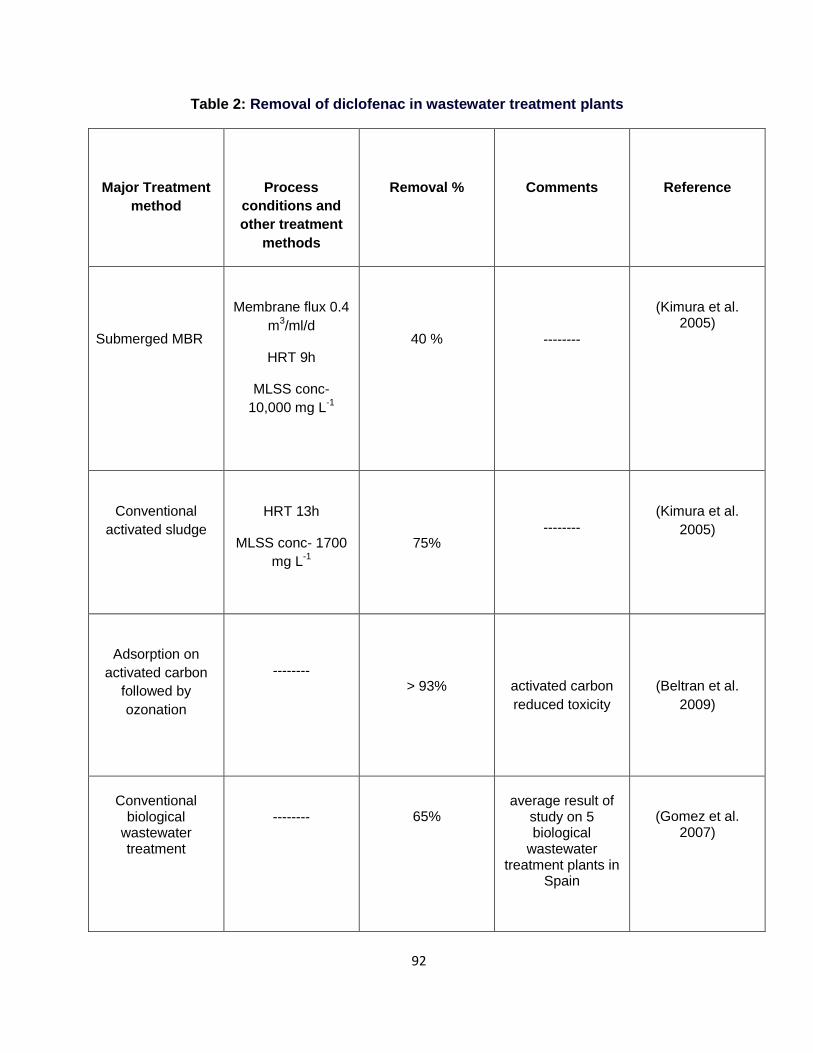
92
Table 2: Removal of diclofenac in wastewater treatment plants
Major Treatment
method
Process
conditions and
other treatment
methods
Removal %
Comments
Reference
Submerged MBR
Membrane flux 0.4
m3/ml/d
HRT 9h
MLSS conc-
10,000 mg L-1
40 %
--------
(Kimura et al. 2005)
Conventional
activated sludge
HRT 13h
MLSS conc- 1700
mg L-1
75%
--------
(Kimura et al.
2005)
Adsorption on
activated carbon
followed by
ozonation
--------
> 93%
activated carbon
reduced toxicity
(Beltran et al.
2009)
Conventional
biological wastewater treatment
--------
65%
average result of
study on 5 biological
wastewater treatment plants in
Spain
(Gomez et al. 2007)

93
Primary treatment
( coagulation and
flotation)
Coagulation-
FeCl3,Al2(SO4)3
PAX
Flotation- 12 oC -
25oC
40-70%
20-40%
--------
(Carballa et al. 2005)
Conventional
active sludge
(CAS) treatment
anoxic pre-
denitrification and
phosphate
precipitation with
ferric chloride as
tertiary treatment
65%
About 15% in 65% of total removal
was through adsorption on to
sludge
(Larsson et al. 2013)
Conventional biological
wastewater treatment
bio filtration type
wastewater
treatment and
consists of 30 bio
filters
75%
Some percent of
removal was
occurred through
adsorption onto
sludge
(Lonappan et al. 2016)
Activated sludge
process
--------
25%
--------
(Martín et al. 2012)
MBR
SRT(d)- 10-55
HRT(d) -0.5-4
<50%
--------
(Clara et al. 2005)

94
Conventional biological
wastewater treatment
WWTP :1
SRT- 8days
HRT- 9h
WWTP : 2
SRT-18days
HRT-23h
75%
39%
Study on 2
WWTPs.
accumulation on
sludge was of
minor
(Samaras et al. 2013)
Conventional
activated sludge with chemical phosphorous
removal
HRT (h) 15-16
22%
---------
(Bendz et al. 2005)
conventional activated sludge
with UV treatment as tertiary treatment
-------
81.4 %
---------
(Behera et al. 2011)
Conventional activated sludge with maturation
pond
Conventional activated sludge with chlorination
Aerated lagoon with filtration and
with chlorine addition
WWTP :1
SRT- 10days
HRT- 6h
WWTP : 2
SRT-6days
HRT-6h
≈70% in all the 3 WWTPs
Study of 3 WWTPs.
(Anumol et al. 2016)

95
WWTP : 2
SRT-3.1days
HRT-74h
Activated sludge
-----
45.6%
Average result for 15 different
WWTPs
(Pereira et al. 2015)
Abbreviations - MBR: Membrane bioreactor, HRT: Hydraulic retention Time, SRT: Sludge retention
time, MLSS: Mixed liquor suspended solids, WWTP: Wastewater treatment plant

96
Table 3: Recent occurrences of diclofenac in aquatic environment
Environmental medium
Concentration
(ng L-1
)
Country Reference
River 2-3 Finland (Lindqvist et al. 2005)
River 21-90 Canada (Sosiak and Hebben 2005)
River 18-50 Canada (Metcalfe et al. 2003)
Estuary 195 UK (Thomas and Hilton 2004)
River 6.2 Germany (Weigel et al. 2002)
River 1030 Germany (Heberer 2002a)
Ground water/wells 2 Mediterranean region (Rabiet et al. 2006)
Wells 380 Germany (Heberer et al. 1998)
Drinking water tap 10 Germany (Heberer 2002b)
River 100-200 Germany (Letzel et al. 2009)
River 100-4900 Pakistan (Scheurell et al. 2009)
Lake 370 Switzerland (Buser et al. 1998)
River 5-40 UK (Kasprzyk-Hordern et al. 2008)
River 26-72 Spain, Belgium, Germany, Slovenia
(Hernando et al. 2006)

97
River 20-91 UK (Hilton and Thomas 2003)
Rivers and lakes 1.1-6.8 South Korea (Kim et al. 2007)
River 0.7 France (Rabiet et al. 2006)
Well 0.9 France (Rabiet et al. 2006)
River 9-282 Slovenia (Kosjek et al. 2005)
River 20-150 Switzerland (Öllers et al. 2001)
Well 4.9-24 European Union (23 countries)
(Loos et al. 2010)
Aquifer 1.7 Spain (Lopez-Serna et al. 2013)
Well 3.1 Spain (Lopez-Serna et al. 2013)
River delta 29.5-380 Spain (Lopez-Serna et al. 2013)
Drinking water 1.2 US (Benotti et al. 2008)
River 15.8-35.5 Austria (Ahrer et al. 2001)
River 7.8-64.8 China (Dai et al. 2015)
Harbor lagoon 100 Pakistan (Scheurell et al. 2009)
Well 590 ( max. observed) Germany (Sacher et al. 2001)
River 260 ( max. observed ) Spain (López-Serna et al. 2012)

98
River 15 South Korea (Yoon et al. 2010)
River 49 Spain (Carmona et al. 2014)
Tap water 18 Spain (Carmona et al. 2014)
River 34-145 Argentina (Valdés et al. 2014)
Seawater (subtropical coastal zone)
19.4 Brazil (Pereira et al. 2016)
River 230 (max. observed) China (Ma et al. 2016)

99
Table 4: Human metabolites of diclofenac
Metabolite
Molecular structure
Reference
4'-hydroxydiclofenac
(Boettcher et al. 1991; Stierlin et
al. 1979; Stulten et al. 2008a)
5'-hydroxydiclofenac
(Boettcher et al. 1991; Stierlin et
al. 1979; Stulten et al. 2008a)
3'-hydroxydiclofenac
(Boettcher et al. 1991; Stierlin et
al. 1979)
4',5-dihydroxydiclofenac
(Boettcher et al. 1991; Stierlin et
al. 1979)
3'-hydroxy-4'-methoxy diclofenac
(Boettcher et al. 1991)
4'-hydroxy diclofenac dehydrate
(Stulten et al. 2008a)
1-O-acyl glucuronide (DCF-gluc)
(Willis et al. 1979)

100
Figure 1: Entry routes of diclofenac to the environment

101
Figure 2: Hypothetical representation of a typical secondary treatment system in wastewater treatment plant showing
interaction of diclofenac with other pollutants

102

103
PART 2
DICLOFENAC IN MUNICIPAL WASTEWATER TREATMENT PLANT:
QUANTIFICATION USING LASER DIODE THERMAL DESORPTION-
ATMOSPHERIC PRESSURE CHEMICAL IONIZATION- TANDEM MASS
SPECTROMETRY APPROACH IN COMPARISON WITH AN
ESTABLISHED LIQUID CHROMATOGRAPHY-ELECTROSPRAY
IONIZATION-TANDEM MASS SPECTROMETRY METHOD
Linson Lonappan a, Rama Pulicharla a, Tarek Rouissi a, Satinder. K. Brar a*,
Mausam Verma b, Rao. Y. Surampalli c, José R. Valero a
a INRS-ETE, Université du Québec, 490, Rue de la Couronne, Québec, Canada, G1K 9A9
b CO2 Solutions Inc., 2300, rue Jean-Perrin, Québec, Québec, G2C 1T9, Canada
c Department of Civil Engineering, University of Nebraska-Lincoln, N104 SEC, PO Box 886105,
Lincoln, NE 68588-6105, USA
JOURNAL OF CHROMATOGRAPHY A 1433 (2016), 106-113

104
RÉSUMÉ
Le diclofenac, un anti-inflammatoire non-stéroïdien répandu, est souvent détecté dans les eaux
usées et les eaux de surface. L’analyse de composés pharmaceutique dans les matrices complexes
représente souvent un défi. Au cours de cette étude, une méthode fiable, rapide et sensible, basé
sur l’utilisation de la désorption thermique par diode laser/ ionisation chimique à pression
atmosphérique (LDTD/APCI-MS/MS) couplée avec la spectroscopie de masse en tandem (MS/MS),
a été développé pour la quantification du DCF dans les eaux usées et les boues d’épuration. La
méthode conventionnelle par LC-ESI-MS/MS (chromatographie liquide - ionisation par
électronébulisation - spectroscopie de masse en tandem) a été comparé à l’approche par
LDTD/APCI-MS/MS. La nouvelle méthode par LDTD/APCI-MS/MS permet d’effectuer l’analyse en
12 secondes par échantillon comparativement à 12 minutes pour la méthode par LC-ESI-MS/MS.
Les limites analytiques de la méthode par LDTD/APCI-MS/MS ont été évaluées à 270 ng L-1 (LOD)
and 1000 ng L-1 (LOQ). De plus, deux méthodes d’extraction du DCF à partir des boues
d’épurations, extraction assistée par des ultrasons (EAU) et extraction par solvant accélérée (ESA),
ont été comparées. L’ESA est la méthode la plus efficace avec 95.6 ± 7% de récupération en
comparaison à 86 ± 4% pour l’EAU. Le destin et la distribution du DCF dans les eaux usées
municipales et dans les boues d’épuration ont aussi été surveillés à différentes étapes de la station
d’épuration des eaux usées de la Ville de Québec (Canada). Le DCF a présenté une plus importante
affinité envers l’eau usée avec 60% de la quantité totale présente. Cette observation est contraire à
la prédiction théorique (Log Kow= 4.51).
Mots clés : Diclofenac; contaminant émergent; eau usée, boue d’épuration; LC-ESI-MS/MS; LDTD-
APCI-MS/MS; quantification

105
ABSTRACT
Diclofenac (DCF), a prevalent non-steroidal anti-inflammatory drug (NSAID) is often detected in
wastewater and surface water. Analysis of the pharmaceuticals in complex matrices is often laden
with challenges. In this study a reliable, rapid and sensitive method based on laser diode thermal
desorption/atmospheric pressure chemical ionization (LDTD/APCI) coupled with tandem mass
spectrometry (MS/MS) has been developed for the quantification of DCF in wastewater and
wastewater sludge. An established conventional LC-ESI-MS/MS (Liquid chromatography-
electrospray ionization- tandem mass spectrometry) method was compared with LDTD-APCI-MS/MS
approach. The newly developed LDTD-APCI-MS/MS method reduced the analysis time to 12
seconds compared with 12 minutes for LC-ESI-MS/MS method. The method detection limits for
LDTD-APCI-MS/MS method were found to be 270 ng L-1
(LOD) and 1000 ng L-1
(LOQ).
Furthermore, two extraction procedures, ultrasonic assisted extraction (USE) and accelerated
solvent extraction (ASE) for the extraction of DCF from wastewater sludge were compared and ASE
with 95.6 ±7% recovery was effective over USE with 86±4 % recovery. The fate and partitioning of
DCF in wastewater (WW) and wastewater sludge (WWS) in wastewater treatment plant was also
monitored at various stages of treatment in Quebec Urban community wastewater treatment plant.
DCF exhibited affinity towards WW than WWS with a presence about 60% of DCF in WW in contrary
with theoretical prediction (Log Kow = 4.51).
Keywords: Diclofenac- emerging contaminant, Wastewater, Wastewater sludge, LC-ESI-MS/MS,
LDTD-APCI-MS/MS, Quantification

106
1. Introduction
Pharmaceuticals are a class of emerging contaminants which have recently raised great public
concern due to its frequent occurrence in aquatic environment [1-3]. The consumption of these
diverse classes of chemicals is expected to rise with augmenting population trends and consumption
behavior of pharmaceuticals. Among pharmaceuticals, non-steroidal anti-inflammatory drugs
(NSAID) are widely used throughout the world and detected in different environmental compartments
at various concentrations ranging from ng L-1
to high µg L-1
[2, 4] since NSAID are over-the-counter
(OTC) drugs. In the global scenario most popular pain killer, diclofenac (DCF) is also the most
commonly used NSAID, with a market share close to that of the next three most popular drugs
combined (ibuprofen, mefenamic acid, naproxen) [5]. Moreover, diclofenac can also be used as an
anti-inflammatory agent, antiuricosurics and analgesic. A 2012 report from “Fierce Pharma” listed
diclofenac as the 12th bestselling generic molecule globally in a list topped by paracetamol. The total
sales of diclofenac in 2011 was estimated to be $1.61 billion with an annual sales change of 15.5%
[6]. Moreover, diclofenac is included in the emergency medical list (EML) of 74 countries. From
Intercontinental Marketing Services (IMS) health data, it is estimated that about 940 tons of
diclofenac is consumed globally on an annual basis [7]. This information proves that diclofenac is
largely consumed throughout the world. Table 1 presents the physico-chemical and pharmacological
properties of DCF.
Apart from the large volume consumption, DCF raises questions regarding environmental pollution.
DCF is not completely removed from wastewater treatment plants (WWTP) due to its poor
degradation and higher consumption rates which creates a continuous flow of the drug to the WWTP
[8, 9]. Hence, DCF was detected in surface waters, sediments and sludges [10, 11]. Moreover, for
the past several years, DCF has been an environmental concern due to its presence in drinking
water sources [11, 12] and its potential harmful effects on many organisms at a concentration
greater than 500 µg L-1
[13, 14]. Diclofenac has been to have potential toxicity towards aquatic life in
surface waters in risk assessment studies [15] and has been predicted to be a major risk at higher
107
µg L-1
concentrations [16]. Moreover, DCF was the first widely noted case of a pharmaceutical
causing major ecological damage [14] towards several vulture species in South Asia[17, 18].
Hence, it is important to remove the “potential” contaminant from its primary sink that is the
wastewater treatment plant itself. Therefore, studies must be carried out for the quantification of DCF
in the WWTP. The existing methods for the quantification of DCF are based on LC (liquid
chromatography), UFLC (Ultra-Fast Liquid Chromatography) and HPLC (High-performance liquid
chromatography). The major flaws of these methods are the prolonged time for analysis and matrix
interferences. In the present study, a new and rapid method was developed based on LDTD-APCI-
MS/MS for the quantification of DCF in WW and WWS and to the best of our knowledge, this study
reported rapid method for the quantification of DCF in wastewater matrix. The newly developed rapid
method was collated with an existing established LC-ESI-MS/MS method. Accelerated solvent
extraction (ASE) and ultrasonic extraction (USE) was studied using spiked recovery experiments for
the extraction of DCF from WWS using the newly developed LDTD approach and conventional
established LC approach. In addition, the fate and partitioning of DCF in WW and WWS in WWTP
was monitored at various stages of treatment in Quebec Urban community (CUQ) wastewater
treatment plant. To the extent of our knowledge, partitioning study of DCF at various stages of a
WWTP had never been carried out and this is the first study of its kind.
2. Materials and methods
2.1. Reagents
Diclofenac sodium salt (98%; CAS 15307-79-6), HPLC-grade methanol (MeOH, purity > 99.8%),
HPLC grade acetonitrile (ACN, assay 99.9%), glacial acetic acid (assay: ≥99.7% w/w) and
ammonium hydroxide (NH4OH, 28–30% w/w) were purchased from Fisher Scientific (Ottawa, ON,
Canada). Internal standard (IS), diclofenac-d4 was obtained from C/D/N isotopes Inc. (Montreal, QC,
Canada). Sep-Pak Plus C18 environmental cartridges used for solid phase extraction (SPE) and
clean-up was supplied by Waters (Milford, MA, USA). Disodium ethylenediaminetetraacetic acid

108
(Na2H2EDTA, 99%) was purchased from E-bay (Tokyo, Japan). Chromatography grade water was
prepared in the laboratory using Milli-Q/Milli-RO Millipore system (Milford, MA ,USA). Stock solutions
of diclofenac and diclofenac-d4 (1g L-1
) were prepared in methanol and stored in amber coloured
bottles at 4±1 º C, until use. Working standards were prepared on the days of analysis by diluting
stock solutions in acetonitrile.
2.2 Wastewater treatment plant, sampling and sample storage
The wastewater treatment plants in Quebec serve 7 million people and the network constitutes 702
treatment plants. These plants handle approximately 6.6 million m3 wastewater per day. Wastewater
and wastewater sludge samples were collected from eastern station of Quebec urban community
(CUQ) wastewater treatment plant located in Quebec City, Canada. The CUQ plant receives
wastewater from different sources of both domestic and industrial origin. The plant also receives
wastewater from different hospitals and commercial enterprises spread all over the city. The eastern
plant receives approximately 150,000 m3 of wastewater per day and has a treatment capacity of
400,000 m3 day
-1. The eastern plant belongs to biofiltration type wastewater treatment and consists
of 30 biofilters , 4 mechanical rake-cleaned bar screens, 5 aerated grit chambers, 7 laminar clarifiers
and 5 disinfecting channels with 8480 ultraviolet lamps.
Wastewater and sludge samples were collected as grab samples in February 2015. All the samples
were collected in triplicates and each sample was analyzed in duplicate. The collected samples were
influents from sewage network system, wastewater after grit removal, primary wastewater and
primary sludge, secondary wastewater and secondary sludge and the final effluent from the WWTP.
Samples were collected in pre-cleaned high-density polyethylene (HDPE) containers. The samples
were stored under dark conditions at 4±1 º C, until preparation for analysis which occurred within one
week after the sampling.

109
2.3 Sample preparation
The liquid fraction of the WWS (both primary and secondary) was separated from the WWS by
centrifugation at 7650 x g for 20 minutes. WWS and the solid fraction of the WWS samples were
frozen at -20 º C for 24 hours and later lyophilized using freeze-dry system (Scanvac CoolSafe 55-4,
Labogene, Lynge, Denmark). The solid obtained was gently ground using a mortar and pestle and
stored at 4±1ºC until analysis. Wastewater samples (influent, primary wastewater, secondary
wastewater, primary WWS-liquid fraction, secondary WWS-liquid fraction and the effluent) were
filtered through a 0.45 μm glass-fiber (G6 filter circles, Fisher brand) using filtration unit and stored at
4±1 º C in amber coloured glass bottles, until clean-up process.
2.4 Extraction
Accelerated solvent extraction (ASE) and ultrasonic extraction (USE) were utilized to study the
extraction efficiencies of the methods and to obtain a maximum recovery of DCF from WWS. About
0.5 g of sludge sample was optimized for the extraction and methanol was used as the solvent. In
order to study the extraction efficiency, WWS samples were spiked with known concentrations of
DCF at 10 μg g-1
and 1 μg g-1
before extraction.
2.4.1 Ultrasonic extraction (USE)
Ultrasonic extraction was carried out in an ultrasonic water bath (Fisher, FB 15069), which is preset
to produce a frequency of 37 kHz. About 0.5 g of sludge was transferred into a 50 ml glass tube
followed by the addition of 20 ml of methanol and shaken for 15 minutes in a vortex mixer at 1500
rpm. Sonication was employed for 15 minutes at 30±1 º C followed by degasing for 3 minutes. The
extract was separated by centrifugation at 37 000 x g for 20 minutes. The entire extraction procedure
was repeated twice. The extracts were combined and concentrated to approximately 1 mL with
gentle stream of nitrogen in a heating module evaporation unit (Reacti-Therm I, Fisher Scientific,
Canada) at 35 ±1 º C. Finally, the extracts were re-dissolved in 50 mL of chromatography grade

110
water and then subjected to solid phase extraction and clean-up process as discussed in section
2.5.
2.4.2 Accelerated solvent extraction (ASE)
Accelerated solvent extraction was carried out using Dionex ASE 350 accelerated solvent extractor
(Dionex, Sunnyvale, CA, USA). About 0.5 g of lyophilized and homogenized sludge sample was
extracted in a 34 mL stainless steel cell. The optimized extraction process was performed at 100±10
C and at 1500 psi for 10 minutes heat-up mode followed by 5 minutes of static extraction with
solvent saver mode. The extraction process was completed by 1 minute of nitrogen purge step.
Subsequently, the extracts were concentrated to approximately 1 mL using gentle stream of nitrogen
in a heating module evaporation unit (Reacti-Therm I, Fisher Scientific, Canada) at 35 ±1 ºC. Finally,
the extracts were re-dissolved in 50 mL of chromatography grade water and subjected to solid phase
extraction for clean-up as discussed in section 2.5.
2.5 Solid phase extraction
Solid phase extraction was employed for concentrating and cleaning up the extract obtained from
USE and ASE methods and also for wastewater samples. Sep-Pak C18 plus Short Cartridges (360
mg sorbent per cartridge, surface area 313 (m2 g
-1)) were used for extraction. Cartridges were fitted
into vacuum manifold (Welch, USA) which was connected to a vacuum pump (Welch Rietschle
Thomas, USA) for homogeneous extraction. The extraction process was started with pre-
conditioning of cartridges using 6 mL of methanol followed by 6 mL of chromatography grade water
at a flow rate of 2 mL min-1
. The filtered samples were loaded to the cartridges and extracted at a
flow rate of approximately 3 mL min-1
. After the extraction, the sorbents were dried at 15 psi in the
vacuum manifold for 15 minutes. The elution was performed by 3 x 4 mL of methanol/acetonitrile
mixture (50:50, v/v) solution at an approximate flow rate of 2 mL min-1
. Later, the extracts were
evaporated to dryness under gentle stream of nitrogen and reconstituted to 1 mL with acetonitrile.
The extracts were then analyzed using LDTD-MS/MS and LC-MS/MS.

111
2.6 LDTD-APCI-MS/MS analysis
Quantification of DCF in WW and WWS samples was achieved by newly developed LDTD-APCI-
MS/MS method. The instrument comprises LDTD–APCI (atmospheric pressure chemical ionization)
source (LDTD T-960, Phytronix Technologies, Quebec, Canada) mounted on a TSQ Quantum
access triple quadruple mass spectrometer (Thermo Scientific, Mississauga, Ontario, Canada). The
LDTD–APCI source was fitted with a compartment for bar coded LazWell TM plate (96-well plate) to
introduce liquid samples for analysis. Before spluttering the samples on the bottom of stainless steel
alloy based LazWell plate; samples were mixed with EDTA (0.1 mg/mL, prepared in a mixture of
methanol, water and ammonium hydroxide) solution for complete thermal desorption of DCF from
the LaZwell plate. About 4 μL of sample was spluttered carefully on to the well of the plate and left
to dry at 35±1 º C in an oven. The LazWell plate with dried samples was then transferred to an X–Y
movable stage of the LDTD sample compartment for LazWell plates. Thermal desorption was
achieved by infrared (IR) laser diode (980 nm, 20 W, continuous) which was focused on the back of
the plate of each wells. Carrier gas (compressed air stream, medical grade) carried the desorbed
sample through a glass tube which will carry the analyte to the corona discharge region where the
analyte was ionized by APCI. The ions were then introduced directly to the MS for analysis.
Quantification was carried out by internal standard method using diclofenac-d4 (10 μg L-1
) as internal
standard. Standards were prepared in acetonitrile supplemented with EDTA and 10 μg L-1
of internal
standard. The area ratio was plotted against the analyte concentration ratio to obtain the calibration
curve and excellent linearity was obtained with R2 value always greater than 0.990.
Temperature and kinetics of the thermal desorption was controlled by laser power and which was
optimized for optimal signal for the analysis. The laser power was ramped from 0 to 65 % in 8 s, and
maintained for 2 s. The APCI was carried out with a positive corona discharge, current of 3 μA, a
carrier gas temperature of 30±1 ºC and an air flow rate of 3 L min-1
. The mass spectrometer system
was operated in single reaction monitoring (SRM) mode. The optimized method resulted in rapid

112
analysis of sample in 12 s for LDTD process from sample to sample with no traces of carry-over.
The optimization was tested with four consecutive analytical replicates.
2.7 LC-ESI-MS/MS analysis
DCF in WW and WWS samples was also analyzed using LC-ESI-MS/MS method (Thermofisher
scientific, application Note 20569, www.thermoscientific.com). The LC-MS/MS system was
composed of Finnigan surveyor LC pump equipped with a 120-vial sample management system.
The LC pump was coupled with a TSQ Quantum access triple quadruple mass spectrometer
(Thermo Scientific, Mississauga, Ontario, Canada) and an electrospray ionization interface. The
analysis was carried out using ‘BetaBasic C18 LC column’ (3 μm,100 x 2.1mm,Thermo Scientific,
Peterborough, ON, Canada).
The LC-MS/MS method used in this study is a modified method developed from thermo fisher
scientific LC-MS/MS method for the determination of diclofenac in human plasma (Application Note
20569). For LC-MS/MS analysis standards, internal standard and samples were prepared in
chromatography grade water. About 500 μL of sample was prepared in amber coloured HPLC vial.
An amount of 1 mg L-1
of internal standard (diclofenac-d4) was used to get maximum signal intensity
for all samples. The mobile phase used was the mixture of water and 0.1% acetic acid (mobile
phase A) and acetonitrile and 0.1% acetic acid (mobile phase B). Other parameters comprised: flow
rate - 0.5 mL min-1
, column temperature - 35±1 º C and an injection volume of 20 µL. Electrospray
ionization (ESI) was set with a negative polarity and the collision gas pressure was optimized to be
1.4 mTorr. The mass spectrometer system was operated in a single reaction monitoring (SRM)
mode. The optimized method resulted in analysis time of 12 minutes from sample to sample with no
traces of carry-over.

113
2.8 Data and statistical analysis
Recovery experiments were carried out in duplicates with both primary and secondary sludge. The
recovery was calculated using equation (1)
𝑟𝑒𝑐𝑜𝑣𝑒𝑟𝑦 (%) =𝐶𝑓 − 𝐶𝑖
𝐶𝑠𝑝⁄ (1)
Where, Cf – final measured concentration of DCF in the spiked matrix, Ci - initial concentration of
DCF in the sludge matrix and Csp – actual calculated concentration of DCF spiked in the matrix.
Limit of detection (LOD) was calculated from the standard error of the intercept and the slope of the
calibration curve. The intra-day method repeatability (presented in % relative standard deviation)
was calculated with replicate analysis of secondary sludge sample spiked with DCF. Inter-day
precision (presented in % relative standard deviation) was calculated by freshly prepared sample of
known concentration in wastewater matrix.
To investigate the statistical significance of the measured values of the standard curve one way
ANOVA test has been carried out with 95% confidence level using Sigmaplot version 11.0 (Systat
Software GmbH, Germany). It was observed that there is no statistically significant difference (p <
0.05) between the same concentrations in the standard curve.
3. Results and Discussion
3.1 Quality assurance
Standards were analyzed 4 times and the relative standard deviation (RSD) was below 10% for
LDTD and LC method. Correlation coefficient (R2) obtained from standard curves of the replicates
were always greater than 0.990 for both methods. Use of internal standard, diclofenac-d4 further
enhanced the accuracy and precision. Limit of detection (LOD) and Limit of Quantification (LOQ)
was also calculated.

114
Internal calibration was carried out using internal standard DCF-d4. The precision and accuracy of
the methods were further studied using recovery experiments by spiking wastewater and sludge
samples with internal standard. Internal standard spiking was carried out using 10 µg L-1
of DCF-d4
before ASE. In addition, another set of experiments with wastewater influent samples and ASE
extracts were also carried out by spiking with 10 µg L-1
of DCF-d4 after extraction. The internal
standard area was monitored in both cases and no significant change (p < 0.05) in internal standard
concentration was observed.
3.2 LDTD –APCI –MS/MS method
Ultrafast quantification with high precision and accuracy was obtained using LDTD-MS/MS method
with APCI ionization. The peak with best intensity was obtained in APCI positive mode. MS/MS scan
was operated through available SRM mode in TSQ Quantum access triple quadruple mass
spectrometer. Sample volumes between 8 μL to 2 μL were tested and optimized to 4 μL for a sharp
peak. Other LDTD parameters, such as sample volume, laser power, carrier gas flow and laser
gradient were optimized which affect the analysis performance, such as sensitivity, reproducibility,
peak area and shape. For complete desorption of DCF from LaZwell plate EDTA (0.1 mg mL-1
,
prepared in a mixture of methanol, water and ammonium hydroxide) was added to all samples and
standards. In LDTD-APCI-MS/MS, LASER beam desorbs the compound from LaZwell plate and
which is ionized by APCI and transferred to MS/MS. LDTD is based on the principle of thermal
desorption of compounds from LaZwell plate by LASER beams. Hence, the LOQ and MDL of
compound depends on desorption capability of the compound from the LaZwell plate by LASER.
Compounds having carboxylic acid and chlorine atoms in their structures, such as DCF and
chlortetracycline [19] have shown higher LOQ with LDTD. Hence, for these classes of compounds,
EDTA has been used for the complete desorption of the compound from the plate. Methanol and
acetonitrile were tested as solvents to be used for analyte deposition on cavities in the sample well.
Maximum peak intensity was achieved with acentonitrile and hence acetonitrile was assigned to be
the preferred solvent for analyte deposition on the wells of LaZwell plate. The optimization of the

115
method was carried out following the previously reported studies for pharmaceuticals in WW and
WWS. C18 cartridges showed excellent recovery for diclofenac from previously reported studies
[20]. Hence, sep-pak C18 cartridges were chosen for SPE. For quantification and method validation,
LDTD-MS/MS optimized parameters were applied. Several calibration curves were prepared with a 7
point (1- 100 µ L-1
) calibration curve and a good linearity was observed (R2
> 0.990). Based on
signal-to-noise ratio of calibration, curve limits of detection (LOD) and limit of quantitation (LOQ)
were calculated. Intra-day repeatability and inter-day reproducibility are expressed as relative
standard deviation (% RSD) and was found to be 7.1 and 9.2, respectively. Hence, it is evident that
LDTD approach exhibited excellent sensitivity for DCF throughout the day. Limit of detection (LOD)
and limit of quantification (LOQ) was obtained as 270 ng L-1
and 1000 ng L-1
, respectively. The
method detection limit (MDL) was calculated to be 300 ng L-1
for wastewater samples and 75 ng g-1
for wastewater sludge samples. The experiment was carried out using 10 replicates and repeatability
and reproducibility (% RSD) was always observed to be less than 10 % throughout these repeated
experiments. For wastewater samples, the observed values were 7.3 % and 9.1 %, respectively for
repeatability and reproducibility and for wastewater sludge samples, it was 8.6 % and 9.8 %,
respectively. Previously reported studies in wastewater matrix exhibited LOQ values over a range
from 1 µg L-1
to 50 µg L-1
[21-24] and the present study also achieved an LOQ of 1 µg L-1
.
3.3 Comparison of measured DCF levels in WW and WWS using an established
LC-ESI MS/MS method versus LDTD-APCI -MS/MS approach
LC-ESI MS/MS method used for this study was an established method for the determination of DCF
in human plasma (Thermofisher scientific, application Note 20569, www.thermoscientific.com)
Further optimization of the method was carried out since the instrument used in this study are not
exactly same as the established method. In wastewater matrix, this optimized method achieved a
LOQ of 1 µ L-1
which is exactly same as that obtained for LDTD method. Several calibration curves
were prepared with a 7 point (1- 100µ L-1
) calibration to check the precision and accuracy of the
method and a good linearity was observed (R2 > 0.990).

116
Both LDTD and LC methods exhibited excellent ability for the analysis of DCF in WW.
Chromatograms for both of the methods with WW and WWS are given in Figure 1 and Figure 2.
From Figure 1(a) and Figure 2 (a), it is clear that for wastewater, matrix effect was negligible in both
LC and LDTD approaches. Both the methods showed excellent agreement (< 10%) in analytical
results for the quantification of DCF in WW. The difference in analytical values lies between 95 to
105 % for WW samples. Even though for WWS, LDTD exhibited advantages over LC method. There
was not a good correlation between the values obtained for the concentration of DCF in WWS using
LDTD-APCI-MS/MS method and LC-ESI-MS/MS method. The observed concentrations of DCF in
WWS matrix using LC-ESI-MS/MS method lay between 65 % to 90 % as compared to the values
observed with LDTD-APCI-MS/MS approach constituting an unacceptable difference of 35%. The
values were confirmed to be true by spiking the sludge samples with known concentration of DCF
and LDTD-APCI-MS/MS approach exhibited excellent agreement with the known spiked
concentrations. Since the difference was compared with WWS which is high organic matrix
environmental sample, the complexity of sample matrix in LC-MS/MS methods cannot be overruled
[22, 25, 26]. Also, it has to be noted that signal suppression due to unknown complex matrix
interferences is a common problem in quantitative analysis, especially in ESI which is used for the
present study with LC-MS/MS [27, 28]. Matrix effects, caused by analyte and matrix component
interactions, are unique to ESI-based LC- MS/MS approach and are one of the biggest challenges
when working with LC-MS/MS. In this study, Figure 1 represents the matrix interference
phenomenon. Figure 1(b) represents a noisy signal .The matrix effects can be classified into matrix
interference and signal alteration [26, 28]. The suppression could be due to the interactions (such
as, Van der Waals, dipole-dipole, dipole or electrostatic forces) between DCF and other co-extracted
compounds present in the sample that could suppress ionization of a DCF in the ESI source. This
must have resulted in a lower signal and ended up detecting false negative results. Further efforts to
enhance the signal were not carried out since it was not the major aim of the study and a suitable
method was already developed via LDTD-APCI-MS/MS approach. In LDTD-APCI-MS/MS, instead
chromatographic separation laser desorption of the sample has been employed along with less

117
matrix sensitive APCI which further improved the sensitivity (Figures 2(a) and 2(b)).From these
figures, it is evident that matrix interferences have not substantially affected the signal. Moreover,
time for the analysis per sample was reduced from 12 minutes in LC-ESI-MS/MS to 12 seconds in
LDTD-APCI-MS/MS. Furthermore, LDTD approach appeared to be sustainable and green since it
omitted the use of chromatographic solvents.
Throughout this study, inconsistencies associated with manual spotting to LaZwell plate for the
LDTD-APCI-MS/MS analysis was a major concern. The amount to be spotted to the LaZwell plate is
too small (4 µL) and which makes the LDTD-APCI-MS/MS method sensitive to manual error. The
rapidness in LDTD-APCI-MS/MS analysis has come with an expense. When comparing the cost of
analysis per sample for LDTD-APCI-MS/MS analysis with conventional LC-MS/MS analysis LDTD
approach appears to be more expensive particularly owing to the expense of LaZwell plate
(approximately 100 USD per single disposable 96-well LaZwell plate) along with other expenses.
Nevertheless, LDTD approach has its own advantage over other methods due to its ultrafast
quantification.
3.4 Comparison of USE and ASE methods
A series of experiments has been carried out to find the best extractive procedure for the extraction
of DCF from WWS. The extraction methods were evaluated and compared on the basis of recovery
efficiency of DCF from WWS. The recovery experiments were performed by spiking both primary
and secondary WWS using 10 µg g-1
and 1 µg g-1
of DCF. The extraction was carried out using
methanol as solvent following the previous studies. The solvent with considerable relative affinity
towards diclofenac has been chosen while reducing the dissolution of impurities and non-targeted
compounds [29-31]. The recovery using USE was 74±3 % and 86±4 % for primary and secondary
sludge, respectively. For ASE, the recovery obtained was 86±2 % for primary sludge and 95.6±7%
for secondary sludge. The difference in recovery for primary and secondary sludge might be due to
the difference in matrix and composition of the sludge. Primary sludge was composed of inorganic

118
matter and is fibrous in nature. This property gives better sorption strength and hence the extraction
from primary sludge becomes difficult. On the contrary, secondary sludge was composed of organic
matter. Even though, in general, organic matter is an effective adsorbent, yet desorption from
organic matrix is also comparatively a rapid process. Hence, better recoveries were obtained with
secondary sludge. The method recovery obtained by this study is in accordance with the recoveries
for DCF reported by previous studies for sludge in general [24, 30-33]. ASE exhibited better
extraction efficiency over USE. The desorption of DCF from the active spots of the matrix is the rate
limiting step in the extraction process. For ASE, the extraction was carried out at higher temperature
(100±1ºC) and pressure (1500 psi) followed by additional nitrogen purging. The higher temperature
and pressure lowered the surface tension and viscosity of the liquid and allowed better contact
between DCF and solvent. Moreover, higher temperature improved the dissolving capacity and
reduced the physical binding forces between analyte and binding spots in the matrix.
Recovery experiment was also carried out to study the solid phase extraction efficiency by C18
cartridges. Experiments were carried out using 5 replicates for wastewater samples (influent and
effluent) at 3 different spiking levels (5 µg L -1
, 10 µg L -1
and 50 µg L -1
). Excellent recoveries were
obtained ranging from 98.2 % to 104.6%. For spiking level of 5 µg L-1, a recovery of 100.4±2 % was
obtained. For spiking level of 10 µg L-1, a recovery of 98.2 ± 3% was obtained and for spiking level
of 50 µg L -1 recovery obtained was 104.6 ± 1%.
3.5 Application of optimized method for the fate study of DCF in WWTP
3.5.1 Partitioning of DCF in WWS
About 75 % removal was obtained with the conventional treatment system of the wastewater
treatment plant. Nevertheless, when analyzing the concentration of DCF in sludge, it can be
concluded that there is less degradation but accumulation in sludge. Both primary and secondary
sludge samples comprised higher DCF concentration as shown in Figure 3. The Kow values of DCF
(Table 1) suggest accumulation of DCF in sludge phase and previous studies observed an opposite

119
phenomenon [8, 23, 24, 34]. This study is also in line with the previously reported studies. When
analyzing the partitioning of DCF in WWS and WW, DCF exhibited affinity towards WW over WWS.
The solids concentration was observed to be 10±0.5 g L-1
and 8±0.3 g L-1
for primary and secondary
sludge, respectively. Hence, the removal/degradation at primary and secondary levels has been
calculated. About 18% removal/degradation was observed at the grit removal state. Wastewater with
about 52.75 µg L-1
of DCF has been transferred to the primary treatment system. About 20% of this
concentration was accumulated in the sludge and 13 % degradation was observed and the rest of
the DCF has been transferred to secondary treatment system. The secondary treatment system
exhibited higher degradation that is 31% of the received concentration and the rest was accumulated
in sludge and wastewater. Hence, apart from removal through sludge, an overall degradation of
about 50 % was observed in the WWTP.
3.5.2 Occurrence of DCF in WWTP
The occurrence of DCF at various stages of wastewater treatment process has been presented in
Figure 3. High concentration of DCF has been detected in CUQ wastewater treatment plant. The
concentration detected in the influent was 64.89 µg L-1
. Higher concentration of DCF can be
attributed to the consumption behavior of the drug. DCF is an over the counter drug along with its
direct application to the skin as pain reliever such as volteran gel. Furthermore, DCF has been
established as a veterinary medicine. Moreover, DCF is a drug which is associated with lifestyle
diseases and in a developed country such as Canada where lifestyle diseases are prevalent, higher
consumption of DCF can be expected. In addition, the Quebec Urban Community WWTP receives
wastewater from different hospitals in the vicinity of the Quebec City area. This fact validates high
detection of DCF in CUQ plant. The effluent from the wastewater treatment plant contains 15.95 µg
L-1
of DCF. Overall, the plant accounted for about 75 % removal of DCF from wastewater during the
treatment process. This removal efficiency was within the range of previously reported studies for
the removal of DCF in WWTP [34]. The effluent contaminated with DCF was the result of the
absence of UV treatment which is reported to be an effective method for the removal of DCF from

120
WW [35-37]. The CUQ plant employs the UV treatment system only during summer and the
sampling was carried out in winter and hence for the same wastewater treatment plant better
removal efficiency can be expected during summer period.
4. Conclusion
A novel rapid method for the quantification of diclofenac in wastewater and wastewater sludge has
been developed by LDTD-APCI MS/MS approach. Method was highly sensitive with limit of
quantitation of 1 µ L-1
and an ultrafast quantification time of 12 seconds. The LDTD-APCI-MS/MS
method can be effectively employed for the detection and quantification of DCF in WW and WWS
samples instead of traditional slow, matrix sensitive LC-ESI-MS/MS method. The LDTD approach
replaces chromatographic separation by laser diode thermal desorption and hence avoid the use of
organic solvent which is a leap towards green chemistry principles. Accelerated solvent extraction
was found to be effective extraction method over ultrasonic extraction for the extraction of DCF from
WWS. Higher concentration of 64.89 µg L-1
was detected in the wastewater influent. Accumulation of
DCF in primary sludge (1.10±0.15 µg g-1
) as well as secondary sludge (0.90±0.15 µg g-1
) was
observed along with the degradation of DCF in WWTP. Hence, both WW and WWS must be taken
into account while developing treatment methods for DCF in a typical wastewater treatment plant.
Acknowledgements
The authors are sincerely thankful to the Natural Sciences and Engineering Research Council of
Canada (Discovery Grant 355254and NSERC Strategic Grant), and Ministère des Relations
internationales du Québec (coopération Québec-Catalanya 2012-2014) for financial support. We
also would like to thank Mr. Stephane Moise and Mr. Serge Auger for their technical support during
analysis and “Fonds Québécois de la Recherche sur la Nature et les Technologies” scholarship for
the second author. The views or opinions expressed in this article are those of the authors.

121
References
[1] O.A. Jones, N. Voulvoulis, J.N. Lester, Human pharmaceuticals in the aquatic environment a review, Environmental technology, 22 (2001) 1383-1394. [2] B. Halling-Sørensen, S. Nors Nielsen, P.F. Lanzky, F. Ingerslev, H.C. Holten Lützhøft, S.E. Jørgensen, Occurrence, fate and effects of pharmaceutical substances in the environment- A review, Chemosphere, 36 (1998) 357-393. [3] P. Verlicchi, M. Al Aukidy, E. Zambello, Occurrence of pharmaceutical compounds in urban wastewater: Removal, mass load and environmental risk after a secondary treatment—A review, Sci. Total Environ., 429 (2012) 123-155. [4] S.K. Khetan, T.J. Collins, Human Pharmaceuticals in the Aquatic Environment: A Challenge to Green Chemistry, Chemical Reviews, 107 (2007) 2319-2364. [5] P. McGettigan, D. Henry, Use of Non-Steroidal Anti-Inflammatory Drugs That Elevate Cardiovascular Risk: An Examination of Sales and Essential Medicines Lists in Low-, Middle-, and High-Income Countries, PLoS Med, 10 (2013) e1001388. [6] E. Palmer, Top 20 generic molecules worldwide, in: www.fiercepharma.com, 2012, pp. special report. [7] Y. Zhang, S.U. Geissen, C. Gal, Carbamazepine and diclofenac: removal in wastewater treatment plants and occurrence in water bodies, Chemosphere, 73 (2008) 1151-1161. [8] S. Zorita, L. Martensson, L. Mathiasson, Occurrence and removal of pharmaceuticals in a municipal sewage treatment system in the south of Sweden, The Science of the total environment, 407 (2009) 2760-2770. [9] D. Fatta-Kassinos, E. Hapeshi, A. Achilleos, S. Meric, M. Gros, M. Petrovic, D. Barcelo, Existence of Pharmaceutical Compounds in Tertiary Treated Urban Wastewater that is Utilized for Reuse Applications, Water Resour Manage, 25 (2011) 1183-1193. [10] K.H. Langford, M. Reid, K.V. Thomas, Multi-residue screening of prioritised human pharmaceuticals, illicit drugs and bactericides in sediments and sludge, Journal of environmental monitoring : JEM, 13 (2011) 2284-2291. [11] U. Kunkel, M. Radke, Fate of pharmaceuticals in rivers: Deriving a benchmark dataset at favorable attenuation conditions, Water research, 46 (2012) 5551-5565. [12] M. Gros, M. Petrovic, A. Ginebreda, D. Barcelo, Removal of pharmaceuticals during wastewater treatment and environmental risk assessment using hazard indexes, Environment international, 36 (2010) 15-26. [13] M. Cleuvers, Mixture toxicity of the anti-inflammatory drugs diclofenac, ibuprofen, naproxen, and acetylsalicylic acid, Ecotoxicology and Environmental Safety, 59 (2004) 309-315. [14] J.L. Oaks, M. Gilbert, M.Z. Virani, R.T. Watson, C.U. Meteyer, B.A. Rideout, H.L. Shivaprasad, S. Ahmed, M.J. Iqbal Chaudhry, M. Arshad, S. Mahmood, A. Ali, A. Ahmed Khan, Diclofenac residues as the cause of vulture population decline in Pakistan, natute, 427 (2004) 630-633.
122
[15] M.D. Hernando, M. Mezcua, A.R. Fernández-Alba, D. Barceló, Environmental risk assessment of pharmaceutical residues in wastewater effluents, surface waters and sediments, Talanta, 69 (2006) 334-342. [16] J.R. Lawrence, G.D.W. SWERHONE, E. TOPP, D.R. KORBER, T.R. NEU, L.I. WASSENAAR, Structural and functional responses of river biofilm communities to the nonsteroidal anti-inflammatory diclofenac Environmental toxicology and chemistry / SETAC, 26 (2007) 573-582. [17] G.E. Swan, R. Cuthbert, M. Quevedo, R.E. Green, D.J. Pain, P. Bartels, A.A. Cunningham, N. Duncan, A.A. Meharg, J.L. Oaks, J. Parry-Jones, S. Shultz, M.A. Taggart, G. Verdoorn, K. Wolter, Toxicity of diclofenac to Gyps vultures, Biology letters, 2 (2006) 279-282. [18] V. Prakash, D.J. Pain, A.A. Cunningham, P.F. Donald, N. Prakash, A. Verma, R. Gargi, S. Sivakumar, A.R. Rahmani, Catastrophic collapse of Indian white-backed Gyps bengalensis and long-billed Gyps indicus vulture populations, Biological Conservation, 109 (2003) 381-390. [19] R. Puicharla, D.P. Mohapatra, S.K. Brar, P. Drogui, S. Auger, R.Y. Surampalli, A persistent antibiotic partitioning and co-relation with metals in wastewater treatment plant—Chlortetracycline, Journal of Environmental Chemical Engineering, 2 (2014) 1596-1603. [20] A.L. Spongberg, J.D. Witter, Pharmaceutical compounds in the wastewater process stream in Northwest Ohio, The Science of the total environment, 397 (2008) 148-157. [21] M.E. Abdel-Hamid, L. Novotny, H. Hamza, Determination of diclofenac sodium, flufenamic acid, indomethacin and ketoprofen by LC-APCI-MS, Journal of Pharmaceutical and Biomedical Analysis, 24 (2001) 587-594. [22] M. Caban, N. Migowska, P. Stepnowski, M. Kwiatkowski, J. Kumirska, Matrix effects and recovery calculations in analyses of pharmaceuticals based on the determination of β-blockers and β-agonists in environmental samples, Journal of Chromatography A, 1258 (2012) 117-127. [23] A. Langenhoff, N. Inderfurth, T. Veuskens, G. Schraa, M. Blokland, K. Kujawa-Roeleveld, H. Rijnaarts, Microbial Removal of the Pharmaceutical Compounds Ibuprofen and Diclofenac from Wastewater, BioMed Research International, 2013 (2013) 9. [24] E. Topuz, S. Sari, G. Ozdemir, E. Aydin, E. Pehlivanoglu-Mantas, D. Okutman Tas, Optimization of diclofenac quantification from wastewater treatment plant sludge by ultrasonication assisted extraction, Journal of chromatography. B, Analytical technologies in the biomedical and life sciences, 958 (2014) 48-54. [25] E. Rogatsky, D. Stein, Evaluation of Matrix Effect and Chromatography Efficiency: New Parameters for Validation of Method Development, Journal of the American Society for Mass Spectrometry, 16 (2005) 1757-1759. [26] B.K. Matuszewski, M.L. Constanzer, C.M. Chavez-Eng, Strategies for the Assessment of Matrix Effect in Quantitative Bioanalytical Methods Based on HPLC−MS/MS, Analytical Chemistry, 75 (2003) 3019-3030. [27] R. Leverence, M.J. Avery, O. Kavetskaia, H. Bi, C.E.C.A. Hop, A.I. Gusev, Signal suppression/enhancement in HPLC-ESI-MS/MS from concomitant medications, Biomedical Chromatography, 21 (2007) 1143-1150.
123
[28] E.T. Gangl, M. Annan, N. Spooner, P. Vouros, Reduction of Signal Suppression Effects in ESI-MS Using a Nanosplitting Device, Analytical Chemistry, 73 (2001) 5635-5644. [29] J. Martín, J.L. Santos, I. Aparicio, E. Alonso, Multi-residue method for the analysis of pharmaceutical compounds in sewage sludge, compost and sediments by sonication-assisted extraction and LC determination, Journal of Separation Science, 33 (2010) 1760-1766. [30] A. Göbel, A. Thomsen, C.S. McArdell, A.C. Alder, W. Giger, N. Theiß, D. Löffler, T.A. Ternes, Extraction and determination of sulfonamides, macrolides, and trimethoprim in sewage sludge, Journal of Chromatography A, 1085 (2005) 179-189. [31] Y. Yu, L. Wu, Analysis of endocrine disrupting compounds, pharmaceuticals and personal care products in sewage sludge by gas chromatography–mass spectrometry, Talanta, 89 (2012) 258-263. [32] O. Zuloaga, P. Navarro, E. Bizkarguenaga, A. Iparraguirre, A. Vallejo, M. Olivares, A. Prieto, Overview of extraction, clean-up and detection techniques for the determination of organic pollutants in sewage sludge: A review, Analytica Chimica Acta, 736 (2012) 7-29. [33] D. Löffler, T.A. Ternes, Determination of acidic pharmaceuticals, antibiotics and ivermectin in river sediment using liquid chromatography–tandem mass spectrometry, Journal of Chromatography A, 1021 (2003) 133-144. [34] N. Vieno, M. Sillanpää, Fate of diclofenac in municipal wastewater treatment plant — A review, Environ. Int., 69 (2014) 28-39. [35] I. Kim, N. Yamashita, H. Tanaka, Photodegradation of pharmaceuticals and personal care products during UV and UV/H2O2 treatments, Chemosphere, 77 (2009) 518-525. [36] I.-Y. Kim, M.-K. Kim, Y. Yoon, J.-K. Im, K.-D. Zoh, Kinetics and degradation mechanism of clofibric acid and diclofenac in UV photolysis and UV/H2O2 reaction, Desalination and Water Treatment, 52 (2013) 6211-6218. [37] D. Vogna, R. Marotta, A. Napolitano, R. Andreozzi, M. d’Ischia, Advanced oxidation of the pharmaceutical drug diclofenac with UV/H2O2 and ozone, Water Res., 38 (2004) 414-422.

124
Table 1: Physico-chemical properties of diclofenac
Structure
Molecular formula and molecular weight
C14H11Cl2NO2, 296.16 g mol
-1
Water solubility at 25 º C
2.37 mg L
−1 (Diclofenac)
50 g L-1
(Diclofenac Sodium)
Melting and boiling points
283-285 ºC and 412 º C at 760 mm Hg
(Predicted)
Henry’s law constant
4.79×10
−7 Pa m
3 mol
−1 (25 º C)
Log Kow 4.51
pKa 4.15
Mode of usage Oral, rectal and direct application to skin
Applications Both veterinary and human
References: syrres.com, www.sigmaaldrich.com, www.drugbank.ca, www.scbt.com

125
Figure 1: Chromatograms - representative peaks of diclofenac in: (a) wastewater with LC-ESI-MS/MS; (b) wastewater sludge with LC-ESI-MS/MS

126
Figure 2: Chromatogram – representative peaks of diclofenac in: (a) wastewater with LDTD-APCI-MS/MS; (b) wastewater sludge with LDTD-APCI-MS/M

127
Figure 3: Fate and partitioning of diclofenac (with mean concentration of DCF (mean± SD, n=3)) in CUQ wastewater treatment plant
UV disinfection
P-15
Public channel network
Storm water basin
Pump station
Screen
Grease & Grit removal
Primary clarifier Aeration
Sludge return
Secondary clarifier
Filter
Primary sludge Secondary
sludge
Sludge solidSludge liquid Sludge solidSludge liquid
64.89 ± 6.7 µg L-1
St. Lawrence river
34.91 ± 2.8 µg L-152.75 ± 4.7 µg L-1
1.10 ± 13.6 µg g-1
5.85 ± 17.9 % µg L-1 0.53 ± 17.3% µg g-1
24.48 ± 12.2 µg L-1
0.90 ± 16.6 µg g-1
1.97 ± 20 µg L-1 0.65 ± 14.4 µg g-1
15.95 ± 3.7 µg L-1

128

129
CHAPTER 3
IDENTIFICATION AND CHARACTERIZATION OF MICRO-
BIOCHARS AND ADSORPTION STUDIES FOR THE REMOVAL OF
DICLOFENAC

130

131
PART 1
ADSORPTION OF METHYLENE BLUE ON BIOCHAR
MICROPARTICLES DERIVED FROM DIFFERENT WASTE MATERIALS
Linson Lonappan a, Tarek Rouissi a, Ratul Kumar Das a, Satinder. K. Brar a*,
Antonio Avalos Ramirez b, Mausam Verma c, Rao. Y. Surampalli d, José R. Valero a
a INRS-ETE, Université du Québec, 490, Rue de la Couronne, Québec, Canada G1K 9A9
b Centre National en Électrochimie et en Technologie Environnementales Inc., 2263, avenue du
Collège, Shawinigan, Québec G9N 6V8 Canada
c CO2 Solutions Inc., 2300, rue Jean-Perrin, Québec, Québec G2C 1T9 Canada
d Department of Civil Engineering, University of Nebraska-Lincoln, N104 SEC PO Box 886105,
Lincoln, NE 68588-6105, US
WASTE MANAGEMENT 49 (2016), 537-544

132
RÉSUMÉ
Les microparticules de biochar ont été préparées à partir de trois différents types de biochar (biochar
de résidus de bois de pin (BC-PW), de fumier de cochon (BC-PM) et de carton (BC-PD)) sous
différentes condition pyrolytiques. Les particules ont été préparées par broyage à sec et tamisage
séquentiel sur différents tamis ASTM. La taille des particules et la surface spécifique ont été
analysés à l’aide d’une analyseur de taille de particule au laser. Les particules ont ensuite été
caractérisés par microscope à balayage électronique (SEM). La capacité d’adsorption de chacun
des biochar a été déterminée par des test d’adsorption au bleu méthylène et comparée aux
capacités des charbons activés commercialement disponibles. Les résultats expérimentaux
démontrent que la capacité d’adsorber le colorant augmente avec la concentration du colorant et le
dosage de biochar. Les microparticules de biochar préparées à partir de différents résidus ont
manifestées une capacité d’adsorption supérieure (7.8±0.5 mg g-1
to 25±1.3 mg g-1
) aux biochar brut
et aux charbons activés commercialement disponibles. La capacité d’adsorption du biochar varie
selon le type de résidus utilisé et la méthode de production. La capacité d’adsorption maximale (25
mg g-1
) a été obtenue avec les microparticules de BC-PM à 25°C pour une concentration de colorant
de 500 mg L-1
comparativement à 48.30±3.6 mg g-1
pour le charbon activé commercial. Les
cinétiques d’adsorption pour les biochar BC-PM et BC-PD respectent le model de Langmuir alors
que la cinétique d’adsorption pour le biochar BC-PW est mieux représentée par le model de
Freundlich.
Mots clés : Biochar; Adsorption; Microparticules; Bleu de méthylène; résidu

133
ABSTRACT
Biochar microparticles were prepared from three different types of biochar, derived from waste
materials, such as pine wood (BC-PW), pig manure (BC-PM) and cardboard (BC-PD) under various
pyrolysis conditions. The microparticles were prepared by dry grinding and sequential sieving
through various ASTM sieves. Particle size and specific surface area were analyzed using laser
particle size analyzer. The particles were further characterized using scanning electron microscope
(SEM). The adsorption capacity of each class of adsorbent was determined by methylene blue
adsorption tests in comparison with commercially available activated carbon. Experimental results
showed that dye adsorption increased with initial concentration of the adsorbate and biochar
dosage. Biochar microparticles prepared from different sources exhibited improvement in adsorption
capacity (7.8±0.5 mg g-1
to 25±1.3 mg g-1
) in comparison with raw biochar and commercially
available activated carbon. The adsorption capacity varied with source material and method of
production of biochar. The maximum adsorption capacity was 25 mg g-1
for BC-PM microparticles at
25 °C for an adsorbate concentration of 500 mg L-1
in comparison with 48.30±3.6 mg g-1
for
activated carbon. The equilibrium adsorption data were best described by Langmuir model for BC-
PM and BC-PD and Freundlich model for BC-PW.
Keywords: Biochar; Adsorption; Microparticles; Methylene blue; Waste material
134
1. Introduction
Disposal of solid waste materials is a cause for concern throughout the world. Recent developments
in environmental technology focused on the use of sustainable materials and advanced
management practices for waste materials such as production of value-added products from waste
materials. Biochar is a carbon-rich solid obtained by the pyrolysis of organic material. The organic
materials can be waste materials of municipal or agricultural origin. The unique and specific
properties of biochar include large surface area, highly porous structure, enriched surface functional
groups and mineral components. These unparalleled properties make biochar an effective material
for mitigating global warming, soil amendment, enhancement of crop yield, carbon storage and
removal of contaminants from water (Tan et al., 2015). Besides, biochar is being considered as a
waste disposal and recycling option (Gupta et al., 2009). The specific properties of biochar, such as
surface area and porous structure will depend upon the source material and method of production,
such as pyrolysis temperature, thermochemical conversion technology and residence time (Tan et
al., 2015).
Due to its economic feasibility and environmental relevance along with its physico-chemical
properties, biochar can be used for the removal of contaminants. The adsorption potential of biochar
is widely acknowledged with adsorption of wastewater pollutants, such as phenol (Tan et al., 2009),
dye (Cheng et al., 2013) and heavy metals (Kołodyńska et al., 2012; Mohan et al., 2007). Relatively
recently, biochar without any activation was identified as a ‘supersorbent’ for neutral organic
compounds (NOCs) (Yang and Sheng, 2003). A copiousness of polar functional groups on biochar
surface enhanced NOC adsorption by biochar compared to activated carbon (Yang et al., 2004).
Thus, biochar offers good opportunities for removal of various organic contaminants.
The behaviour of microparticles is unique and quite different since microparticles have a larger
surface-to-volume ratio than at the macro scale (Vert et al., 2012). According to International Union
of Pure and Applied Chemistry (IUPAC) guidelines “Terminology for biorelated polymers and

135
applications (IUPAC Recommendations 2012)”, microparticles are defined as particles with
dimensions between 1 × 10⁻⁷
and 1 × 10⁻⁴
m, even though the lower limit between micro sizing and
nanosizing is still a matter of debate since nanoparticles cover only the range of particle dimensions
with 0.1 nm to 100 nm (Vert et al., 2012). This study followed the IUPAC guidelines for
microparticles. Generally, biochar prepared via pyrolysis process are of larger dimensions, such as
millimeters and micrometers depending upon the source material and method of production and are
used as obtained from the process (Demirbas, 2004; Lei et al., 2009). The effort to classify micro
particles according to size is uncommon except for nanoparticles (Kambo and Dutta, 2015; Yan et
al., 2013). Hence, lacuna still exists in this field of research. Most of the previous studies were
carried out on crude biochar (Banerjee et al., 2014; Shih, 2012; Yao et al., 2012). Maximum removal
efficiencies for methylene blue observed in these studies were 4.58 mg g−1
for untreated saw dust
biochar (Banerjee et al., 2014) , 8.07 mg g−1
for rice husk biochar (Shih, 2012) and 16.75 mg g−1
for
pine sawdust biochar (Cheng et al., 2013). Few recent studies evaluated the efficiency of biochar
nanoparticles in combination with other nanomaterials used for various applications, such as a
catalyst (Saxena et al., 2014; Yan et al., 2013). No study data exists, to the best of our knowledge
for biochar nanoparticles as a standalone adsorbent for methylene blue. In a recent study, magnetic
Fe3O4 nanoparticles coated with sub-nano biochar exhibited excellent adsorption capacity of
349.40 mg g−1
for crystal violet (Sun et al., 2015). Crystal violet is a dye such as methylene blue,
used for the adsorption capacity characterization of newly synthesized adsorbents. It is expected
that nano biochar might exhibit excellent adsorption capacity over raw biochar or micro biochar
because of its largest surface area; however production costs and fouling at times can limit the
advantages. On the other hand with microparticles, an increase in adsorption potential can be
expected in comparison with biochar in as obtained form without a vast increase in production cost.
Moreover, synthesis and characterization of biochar microparticles for adsorption is a relatively
untouched area and further research is needed in this field. In general, nanoparticles agglomerate in
liquid and which will reduce the adsorption capacity since agglomeration will reduce the effective
surface area of the nanoparticles (Kalia et al., 2011). In the case of biochar microparticles, the

136
possibility for agglomeration can be ruled out in comparison with nanoparticles. In addition, because
of its unique environmental properties, carbon nanoparticles are toxic to many organisms (Brar et al.,
2010; Firme Iii and Bandaru, 2010). Hence, disposal of nanoparticles after utilization can be a major
issue. While considering biochar as a waste management option and further producing “toxic
nanoparticles”, it is not an effective method for waste reduction. Hence, biochar microparticles can
be used as an effective non-toxic adsorbent as well as a waste management option.
In this study, the focus was to evaluate the general adsorption potential of biochar microparticles
(derived from various sources) based on methylene blue (MB) adsorption experiments. MB was
considered as a model for visible pollution as a result of its strong adsorption onto solids and toxicity
to humans and animals (Sun et al., 2013). The equilibrium data of the adsorption process were used
to study the adsorption mechanism of the MB molecules. This study also aimed to check the
adsorption behavior of biochar microparticles.
2. Materials and Methods
2.1 Materials
Case studies of three biochar samples are presented. The first biochar sample (BC- PW) was
obtained from Pyrovac Inc. (Quebec (Qc), Canada). BC-PW was derived from pine white wood (80%
v/v) purchased from Belle-Ripe in Princeville and the rest was spruce and fir (20%). BC-PW was
produced at 525°C under atmospheric pressure for 2 minutes in the presence of nitrogen and used
as obtained from the reactor outlet. The second biochar sample (BC-PM) was obtained from
Research and Development Institute for Agri-Environment”(IRDA), Quebec (Qc), Canada. This
biochar was derived from solid fraction of pig slurry and prepared at 400 °C for 2 h at 15°C/min in the
presence of nitrogen at a flow rate of 2 L min-1
during heating. The third biochar sample (BC – PD)
was prepared at INRS – ETE (Quebec (Qc), Canada) and it was obtained from cardboard waste
material via pyrolysis technique. Pyrolysis was performed at 500°C at 15°C/minute in the presence
of nitrogen at a flow rate of 2 L min-1
and for 2 hours. Pine wood, pig manure and cardboard

137
materials commonly produced waste materials in Canada and which can be used for the production
of biochar without any further pre-treatment. Powdered activated carbon (AC) was used as positive
control for the adsorption studies to compare the adsorption results and was purchased from Fisher
scientific (Ottawa, Canada).
Methylene blue dye (MB) shows strong adsorption to solids and it is widely recognized for its
usefulness in characterizing materials (Cheng et al., 2013; Inyang et al., 2014) and the dye was
purchased from Fisher scientific (Ottawa, Canada). A stock solution of 1000 mg L−1
MB was
prepared in an amber colored volumetric flask and diluted to the required concentrations (500–10
mg L−1
) in deionized water. MB used in this study was analytical grade
2.2 Biochar microparticles preparation
Biochar microparticles were prepared from all the aforementioned biochar samples with a series of
size reduction using mortar and pestle. Subsequently, the particles were sequentially sieved through
ASTM 20, 50 and 200 numbered sieves for 10 minutes and particle size obtained was 850-300μm
(S1- large sized), 300-75μm (S2-medium sized) and less than 75μm ( S3- microparticles). In
comparison with other methods, such as vapour deposition method for nanoparticle production, dry
grinding method does have its own advantage, such as cost-effectiveness and simplicity.
2.3 Biochar and microparticles characterization
Particle size distribution analysis of microparticles was performed using a Horiba particle size
analyzer (LA-950 Laser Particle Size Analyzer, HORIBA, Edison, NJ, USA). The analysis was
carried out in triplicate and the mean value was taken. The specific surface area of each sample was
also obtained from microparticle size analyzer and was expressed in cm2/cm
3 of water. The surface
characteristics, such as porosity and pore distribution were analyzed using field emission-scanning
electron microscopy. Particles were coated with gold (plasma state) prior to the analysis to minimize
138
sample charging. The ash and moisture content of BC-PW, BC-PM, and BC-PD was analyzed as
per ASTM methods (ASTM D1762 – 84).
2.4 Adsorption studies
Adsorption experiments were performed to determine and compare the adsorption potential of
different biochar samples. Prior to analysis, the samples were dried overnight at 60 ±1°C in an oven
and then cooled in a desiccator to remove any moisture present and the final moisture content was
assumed to be negligible.
Initially, the effect of biochar dose of each biochar (BC-PW, BC-PM, and BC-PD) on the adsorption
process was investigated by using different biochar concentrations from 3-15 g L-1
at 50 mg L−1
of
MB concentration. The adsorption studies were carried out for 120 minutes in an incubator shaker at
25±1 °C and 150 rpm.
The effect of varying concentrations of MB on the adsorption process was studied using all the three
biochars and their corresponding size reduced particles and microparticles. Various concentrations
used for the study were 10 mg L -1
, 50 mg L−1,
100 mg L−1
and 500 mg L−1
and the experiments were
carried out in triplicate. In this study, other parameters, such as pH (6.5) and agitation speed were
kept constant (150 rpm) and 0.3 g of biochar was added to Erlenmeyer flasks containing 30 mL of
MB and the flasks were placed in incubator shaker for 120 minutes.
After 120 minutes, the suspensions were centrifuged at 37 000 x g for 15 minutes to get a clear
liquid and the supernatant was collected by decantation. The remaining concentration of MB in the
solution was measured at 665 nm using a UV–visible spectrophotometer (Epoch™-Biotek). The
amount of adsorbed MB at time t (mg g−1
) was calculated using Equation 1
𝑞𝑡 = 𝑉(𝐶0 − 𝐶𝑡) 𝑤⁄ (1)

139
Where, C0 and Ct (mg L−1
) are the liquid-phase initial and final concentrations of MB respectively. V
(L) is the volume of the MB solution, and w (g) is the mass of dry biochar used.
2.4.1 Adsorption isotherm models
Adsorption studies were carried out using 0.3 g of the raw biochar samples and activated carbon
with concentrations ranging from 10 to 500 mg L-1
at a constant temperature of 25 °C in an incubator
shaker at 150 rpm for 24 hours to get an equilibrium concentration. The obtained data were plotted
using Langmuir and Freundlich adsorption isotherm models. Linearized forms of the equations were
applied for the adsorption isotherms.
Langmuir isotherm model was constructed based on the assumption of homogeneous monolayer
adsorption onto the surface with no re-adsorption of adsorbate on the surface and can be written as
Equation 2 (Tan et al., 2009; Weber and Chakravorti, 1974).
𝐶𝑒𝑞𝑒
⁄ = 1𝑄0𝐾𝐿
⁄ +𝐶𝑒
𝑄0⁄ (2)
Where Ce (mg L-1
) is the equilibrium concentration of the adsorbate, qe (mg g-1
) is the amount of
adsorbate adsorbed per unit mass of adsorbent, Qo and KL are Langmuir constants related to
adsorption capacity and rate of adsorption, respectively. When Ce/qe is plotted against Ce, a straight
line with slope of 1/Q0 and intercept of 1/Q0KL is obtained.
Freundlich isotherm model assumes heterogeneous adsorption on the surface of the adsorbent.
According to Freundlich isotherm model, the stronger binding sites on the surface are occupied first
and that the binding strength decreases with the increasing degree of site occupancy and which
reduces the adsorption with time. The logarithmic form of the equation can be written as (Freundlich,
1906; Tan et al., 2009)

140
log 𝑞𝑒 = log 𝐾𝐹 + 1 𝑛 log 𝐶𝑒⁄ (3)
The plot of log qe versus log Ce gives a straight line with slope of 1/n and intercept of log KF. Where
KF is the adsorption capacity of the adsorbent and n is the favourability factor of the adsorption. The
adsorption process becomes more heterogeneous when the slope 1/n equals zero.
3. Results and Discussion
3.1 Biochar characterization
3.1.1 Moisture, ash content and chemical composition
The moisture and ash content of each biochar is given in Table 1. Biochar molecules show
hydrophobic character. On the contrary, at least in few cases biochar molecules are hygroscopic in
nature and most of the biochars exhibit significant adsorption capacity for water vapor (Ahmad et al.,
2012). The hygroscopic nature of biochar may be due to water of hydration within the ash present in
the biochar or it may also be due to water molecules associated with the organic portions of the
biochar, including adsorbed water vapor (Inyang and Dickenson, 2015). The amount of moisture in
biochar may vary according to its method of production and storage (Ahmad et al., 2012). In this
study, BC-PM (7.65%) exhibited maximum moisture content of the samples followed by BC-PD and
BC-PW (4.9 % and 1.5% respectively).
Biochar prepared from livestock manure, such as pig manure usually contains high ash content (Cao
and Harris, 2010; Cao et al., 2011) and in this study, pig manure biochar exhibited high amount of
ash content at 65.48 %. Plant derived biochar usually contains low amounts of ash (Ahmad et al.,
2014; Boateng et al., 2010). In this study, BC-PD and BC-PW originating from plant sources
exhibited lower amounts of ash contents, such as 12.45 % and 9.52 %, respectively. The impact of
ash content on adsorption was seldom studied and exact effects were not clearly understood for
each contaminant. It is reported that biochar with high ash content exhibited subdued adsorption

141
potential for organic pesticides, such as carbaryl and atrazine because adsorption sites of organic
moieties can be masked by ash (Inyang and Dickenson, 2015; Zhang et al., 2013).
Generally, the pine wood feedstock contains cellulose (about 40.7 %) hemicellulose (about 26.9%)
and lignin (about 27 %) (Wang et al., 2015). In this study, for preparing biochar sample BC-PW, the
feedstock used was scots red pine and typical composition included the previously mentioned
components. The chemical composition of the feedstock used for the preparation of pig manure
biochar (BC-PM) has been given in a previous publication (Fernandez-Lopez et al., 2015). The
chemical composition data of paper derived biochar (BC-PD) used for this study has also been given
in a previous publication (Ghorbel et al., 2015)
3.1.2 SEM analysis
SEM images of BC-PW, BC-PM and BC-PD and activated carbon are shown in Fig 1. Moreover,
SEM images of each subclass of biochar microparticle (S1, S2, S3 for BC-PW, BC-PM and BC-PD)
is given as supplementary data. A representative microparticle or a group of microparticles are used
for the SEM images. BC-PW displayed well-arranged pores on the surface in rows (Fig 1.A). On an
average, from the SEM visual data, the pore size appeared to be 5 μm (Fig 1.B). For BC-PM, the
pores were irregularly arranged (Fig 1.C) and the pore size varied between 4 and 5 μm (Fig 1.D).The
sample exhibited an uneven and rough surface texture. BC-PD exhibited a fibrous structure which
lacked the presence of proper pores (Fig 1.E) and these irregular cracked and short fibers mixed
with aggregates were typical for biochar derived from cellulose (Méndez et al., 2009). However, due
to the fibrous structure make-up, the total surface area will be very large. The criss-cross
arrangement of biochar fibers increases the total surface which in turn resulted in better surface area
as shown in Table 4. Even though BC-PD lacked the presence of well-defined pores, some pits and
pore like structures were visible on the surface due to criss-cross arrangement of fibers. All the
samples exhibited potential for the adsorbate molecules to be trapped and adsorbed by the biochars
with higher surface area and presence of pores.

142
3.1.3 Microparticles and particle size distribution
The biochar microparticles were prepared by size reduction and sequentially sieving through ASTM
sieves. The results obtained for particle size and size distribution are given in Table 2. Fig.5.A
presents particle size distribution of as obtained biochar and Fig.5.B presents the particle size
distribution of the microparticles (S3) prepared from each class of biochar sample.
For BC-PW sample, the microparticles (S3) were well within the size distribution defined by IUPAC.
The mean size of the particles was 55.66 ± 47.71. About 90% of the microparticles were lower than
118.08 µm and 10% of the particles were lower than 15.96 µm. The geometric mean of the particle
size was found to be 41.26 µm with a median size of 38.93 µm. Hence, the prepared particles were
confirmed to be microparticles. S1 and S2 samples were also well in the range of production with
mean sizes of 635.16±342.32 µm and 250.34±141.43 µm, respectively.
Microparticles (S3) prepared from BC-PM showed a mean size of 56.49 ±38.49 µm. About 90% of
the microparticles were lower than 105.49 µm and 10% of the particles were lower than 17.18 µm in
size. The geometric mean size was found to be 45.10 µm with a median size of 48.31 µm. S1 and
S2 class exhibited a mean size of 415.14 ±308.64 µm and 212.51± 141.27 µm, respectively.
Microparticles (S3) prepared from BC-PD were analyzed with a mean size of 61.33 ± 47.03 µm.
About 90% of the microparticles were lower than 121.33 µm and 10% of the particles were lower
than 20.61µm. The geometric mean size was found to be 48.45 µm with a median size of 46.84 µm.
The mode size of the particles was calculated to be 48.02 µm. S1 and S2 samples were also well in
the range of production with mean sizes of 382.53 ± 298.98 µm and 205.62± 138.41 µm,
respectively.

143
3.2 Adsorption studies
3.2.1 Effect of adsorbent dose
MB removal efficiencies with an initial MB concentration of 50 mg L−1
at 25 °C by BC-PW, BC-PM
and BC-PD are shown in Fig.2. The removal efficiency of MB increased with biochar dose at a
constant MB concentration. BC-PW exhibited almost 9 fold (885 %) increase in adsorption with a 5
folds increment in adsorbent dosage. For BC-PM and BC–PD, the effect of increase in adsorbent
dosage was clearly demonstrated, an increase in percent of adsorption being 14 times and 22 times
for BC-PM and BC–PD, respectively for the same increase in dosage. The increase in removal
efficiency can be attributed to the increase in available sorption surface (Ahmad et al., 2014). A
similar trend of increasing adsorption capacity with adsorbent dosage was shown in previous studies
with biochar prepared from palm bark and eucalyptus (Inyang et al., 2014; Sun et al., 2013). Due to
the fibrous surface (Fig 1.E) and hence increased surface area, BC-PD displayed good abilities for
adsorption with increased adsorbent dosage. As the particle size was kept constant, the surface
area was directly proportional to the mass of adsorbent in the solution and hence the adsorption was
increased.
3.2.2 Adsorption isotherms - data analysis
The adsorption data were analyzed using Langmuir and Freundlich adsorption isotherm models and
the data is given in Fig. 3. The isotherm parameters calculated from the models are given in Table 3.
Langmuir isotherm exhibited good agreement for BC-PM and BC-PD with R2
values 0.989 and
0.995, respectively. For the same adsorbents, the correlation with Freundlich isotherm model was
lower and the R2 values were 0.811 and 0.070 for BC-PM and BC-PD, respectively. This perfect fit of
the adsorption data with Langmuir isotherm model for BC-PM and BC-PD indicated that the
adsorption was monolayer which involved chemical and physical adsorption. From previously
reported studies (Kołodyńska et al., 2012; Mohan et al., 2014), biochar prepared from pig manure
exhibited excellent ability to remove metals from water and the mechanism was explained by

144
Langmuir adsorption models. This study also pointed towards the same mechanism for methylene
blue adsorption biochar prepared from the pig manure (BC-PM). To the best of our knowledge,
adsorption mechanism data was not available for the biochar derived from paper and related
materials and for the first time this study reported that the adsorption will be monolayer for
methylene blue.
For BC- PW and commercially obtained powdered activated carbon, the experimental data
presented good agreement with Freundlich isotherm models at R2 values of 0.997 and 0.955,
respectively. Meanwhile, the value of the exponent n was greater than 1 for both of the adsorbents
confirming the favorable adsorption conditions. These values pointed towards the possibility of
heterogeneous adsorption with physical forces of binding. The results obtained for pine wood
derived biochar (BC- PW) displayed good agreement with the mechanisms previously studied
(Cheng et al., 2013; Mohan et al., 2007) with possible heterogeneous adsorption.
3.2.3 Microparticles and adsorption
Biochar BC-PW
The adsorption data with varying MB concentrations for the microparticles is given in Fig 4.A .The
surface area of the adsorbents is given in Table 4 .The adsorption capacity (mg g-1
) was increased
when the MB concentration increased from 10 to 500 mg L-1
. This primarily showed physical
adsorption process. The size reduction of biochar increased adsorption capacity. The effective
surface area gradually increased with the size reduction and hence the available sites for adsorption
also increased. This trend can be seen with concentrations from 10 to 500 mg L-1
.
Also, the adsorption nearly increased 100 % in all cases when compared with the obtained biochar
and microparticle (S3). Hence, the microparticles clearly improved the surface area which in turn
increased the adsorption. A maximum of 16.75 mg g-1
adsorption capacity was observed in previous
studies for pine derived biochar (Cheng et al., 2013), whereas in this study, the maximum adsorption
capacity observed was 7.9±0.5 mg g-1
and activated carbon exhibited excellent adsorption with

145
48.3±3.6 mg g-1
at 500 mg L-1
initial concentration. This decrease can be due to the difference in
original materials and the preparation conditions. In fact, it was reported that feedstock and pyrolysis
conditions can influence molecular structure and pores size distribution of biochar, which
consequently affects biochar sorption characteristics (Ahmad et al., 2012; Cantrell et al., 2012; Gai
et al., 2014). Despite these limitations, significant enhancement in adsorption occurred with prepared
microparticles.
Biochar BC-PM
The data for BC-PM microparticles and varying MB concentrations is given in Fig. 4B and the
surface area of the adsorbents is provided in Table 4. As compared to BC- PW, this biochar
appeared to be more effective for MB adsorption. BC-PM exhibited similar trend in adsorption as
biochar BC-PW. An increasing trend was observed with increasing surface area along with
microparticles. Also the adsorption capacity (mg g-1
) was further increased with an increase in
adsorbate concentration (Fig. 4.B). Biochar with high ash content usually exhibits reduced
adsorption potential for organic contaminants. On the contrary, in this study, pig manure biochar
(BC-PM) with relatively higher ash content exhibited higher adsorption which can be attributed to the
cationic properties of methylene blue and the general anionic properties of biochar derived from pig
manure. The physico-chemical adsorption process via Langmuir model also points towards the
same possibility. The increase in concentration increased adsorption as the number of adsorbate
molecules were increased which produced enhanced interactions between the adsorbent and
adsorbate and hence the adsorption was increased. The increase in total surface area increased the
adsorption capacity of the size reduced particles (Inyang and Dickenson, 2015) .
On an average, microparticles (S3) showed 35% increase in adsorption efficiency (mg g-1
) despite
the initial concentration. When compared to BC-PW, the microparticles were not effective for an
enhanced adsorption. However, at a concentration ranging from 10 to 100 mg L-1
, BC-PM
microparticles exhibited almost same adsorption capacity as that of activated carbon. This indicated

146
that at lower initial concentrations, size reduction can be an effective process for adsorption with pig
manure derived biochar, and which can replace the expensive activation process (Kołodyńska et al.,
2012; Kambo and Dutta, 2015; Inyang et al., 2014).
Biochar BC-PD
The adsorption data for this category of biochar is given in Fig. 4.C and the surface area of the
adsorbents is entailed in Table 4. A similar trend in adsorption was observed for BC-PD as biochar
BC-PW and biochar BC-PM. The maximum adsorption capacity obtained was 8.9 ±0.9 mg g-1
.
Biochar BC-PD appeared to be very effective at lower concentrations and the microparticles (S3)
produced almost same results as the commercially available activated carbon at 10 mg L-1
concentration. Irrespective of the particle size at lower concentrations (10 mg L-1
and 50 mg L-1
), all
of them were very effective for MB adsorption so that equilibrium was attained within 120 minutes at
lower concentrations, such as 10 mg L-1
. Also, at higher concentrations, such as 500 mg L-1
, the
increase in adsorption capacity of microparticles from raw biochar was very high as 800 %, but the
total adsorption capacity (mg g-1
) was very less when compared to the commercially available
activated carbon. The increase in total surface area (microparticle) and number of adsorbate
molecules (elevated concentration) produced increased interactions between the adsorbent and
adsorbate and hence the adsorption was increased (Inyang and Dickenson, 2015).
In general, all biochar samples exhibited potential for adsorption. In addition, microparticles were
highly effective at lower concentrations, such as 10 mg L-1
and 50 mg L-1
when compared to
commercially available activated carbon. In this study, BC-PM and BC-PD microparticles exhibited
excellent abilities to adsorb organic contaminant (MB) from water at lower concentrations and which
is an important property since under actual problematic conditions, the concentrations of some
organic contaminants may be lower and toxicity at lower concentration was reported to be very high
for emerging contaminants. The mechanism of adsorption also varied with the source material for
the preparation of biochar and the method of production. From isotherm models, BC-PM and BC-PD

147
exhibited monolayer adsorption possibilities followed by perfect fit with Langmuir isotherm model
whereas BC-PW and activated carbon displayed heterogeneous adsorption corroborated by
Freundlich isotherm model.
4. Conclusions
Biochar microparticles can be prepared from biochar using economically feasible method. In this
study, the microparticles prepared from three different types of biochar exhibited enhanced
adsorption capacities (0.975 mg g-1
) at reduced concentrations of 10 mg L-1
, which were comparable
with the commercially available activated carbon (0.980 mg g-1
) used for the study. The adsorption
capacities of biochar varied with the source material and method of preparation. The adsorption
capacity for cationic dye methylene blue also increased with the increase in surface area of the
microparticles. Maximum adsorption capacity (Qmax) was observed to be 3.99 mg g-1
, 16.30 mg g-1
and 1.66 mg g-1
, respectively for pine wood, pig manure and paper derived biochar microparticles at
MB concentration of 50 mg L-1
. The Langmuir and Freundlich adsorption isotherm models were used
to denote the adsorption of the methylene blue. The equilibrium data were well described by
Langmuir model for BC-PM and BC-PD and Freundlich model for BC-PW.
Acknowledgement(s):
The authors are sincerely thankful to the Natural Sciences and Engineering Research Council of
Canada (Discovery Grant 355254 and NSERC Strategic Grant), and Ministère des Relations
internationales du Québec (coopération Québec-Catalanya 2012-2014) for financial support. The
views or opinions expressed in this article are those of the authors.

148
References
Ahmad, M., Lee, S.S., Dou, X., Mohan, D., Sung, J.-K., Yang, J.E., Ok, Y.S., 2012. Effects of pyrolysis temperature on soybean stover- and peanut shell-derived biochar properties and TCE adsorption in water. Bioresource technology 118, 536-544. Ahmad, M., Rajapaksha, A.U., Lim, J.E., Zhang, M., Bolan, N., Mohan, D., Vithanage, M., Lee, S.S., Ok, Y.S., 2014. Biochar as a sorbent for contaminant management in soil and water: A review. Chemosphere 99, 19-33. Banerjee, S., Chattopadhyaya, M.C., Srivastava, V., Sharma, Y.C., 2014. Adsorption studies of methylene blue onto activated saw dust: kinetics, equilibrium, and thermodynamic studies. Environmental Progress & Sustainable Energy 33, 790-799. Boateng, A.A., Mullen, C.A., Goldberg, N.M., Hicks, K.B., Devine, T.E., Lima, I.M., McMurtrey, a.J.E., 2010. Sustainable production of bioenergy and biochar from the straw of high-biomass soybean lines via fast pyrolysis. Environmental Progress & Sustainable Energy 29, 175-183. Brar, S.K., Verma, M., Tyagi, R.D., Surampalli, R.Y., 2010. Engineered nanoparticles in wastewater and wastewater sludge – Evidence and impacts. Waste Management 30, 504-520. Cantrell, K.B., Hunt, P.G., Uchimiya, M., Novak, J.M., Ro, K.S., 2012. Impact of pyrolysis temperature and manure source on physicochemical characteristics of biochar. Bioresource Technology 107, 419-428. Cao, X., Harris, W., 2010. Properties of dairy-manure-derived biochar pertinent to its potential use in remediation. Bioresource technology 101, 5222-5228. Cao, X., Ro, K.S., Chappell, M., Li, Y., Mao, J., 2011. Chemical Structures of Swine-Manure Chars Produced under Different Carbonization Conditions Investigated by Advanced Solid-State13C Nuclear Magnetic Resonance (NMR) Spectroscopy†. Energy & Fuels 25, 388-397. Cheng, G., Sun, L., Jiao, L., Peng, L.-x., Lei, Z.-h., Wang, Y.-x., Lin, J., 2013. Adsorption of methylene blue by residue biochar from copyrolysis of dewatered sewage sludge and pine sawdust. Desalination and Water Treatment 51, 7081-7087. Demirbas, A., 2004. Effects of temperature and particle size on bio-char yield from pyrolysis of agricultural residues. Journal of Analytical and Applied Pyrolysis 72, 243-248. Firme Iii, C.P., Bandaru, P.R., 2010. Toxicity issues in the application of carbon nanotubes to biological systems. Nanomedicine: Nanotechnology, Biology and Medicine 6, 245-256. Freundlich, H.M.F., 1906. Uber die adsorption in lasungen. Z Phys Chem 57, 385–470. Gai, X., Wang, H., Liu, J., Zhai, L., Liu, S., Ren, T., Liu, H., 2014. Effects of feedstock and pyrolysis temperature on biochar adsorption of ammonium and nitrate. PLoS ONE 9. Gupta, V.K., Carrott, P.J.M., Ribeiro Carrott, M.M.L., Suhas, 2009. Low-Cost Adsorbents: Growing Approach to Wastewater Treatment—a Review. Critical Reviews in Environmental Science and Technology 39, 783-842.
149
Inyang, M., Dickenson, E., 2015. The potential role of biochar in the removal of organic and microbial contaminants from potable and reuse water: A review. Chemosphere 134, 232-240. Inyang, M., Gao, B., Zimmerman, A., Zhang, M., Chen, H., 2014. Synthesis, characterization, and dye sorption ability of carbon nanotube–biochar nanocomposites. Chemical Engineering Journal 236, 39-46. Kalia, S., Dufresne, A., Cherian, B.M., Kaith, B.S., Av, #233, rous, L., Njuguna, J., Nassiopoulos, E., 2011. Cellulose-Based Bio- and Nanocomposites: A Review. International Journal of Polymer Science 2011. Kambo, H.S., Dutta, A., 2015. A comparative review of biochar and hydrochar in terms of production, physico-chemical properties and applications. Renewable and Sustainable Energy Reviews 45, 359-378. Kołodyńska, D., Wnętrzak, R., Leahy, J.J., Hayes, M.H.B., Kwapiński, W., Hubicki, Z., 2012. Kinetic and adsorptive characterization of biochar in metal ions removal. Chemical Engineering Journal 197, 295-305. Lei, H., Ren, S., Julson, J., 2009. The Effects of Reaction Temperature and Time and Particle Size of Corn Stover on Microwave Pyrolysis. Energy & Fuels 23, 3254-3261. Méndez, A., Fidalgo, J.M., Guerrero, F., Gascó, G., 2009. Characterization and pyrolysis behaviour of different paper mill waste materials. Journal of Analytical and Applied Pyrolysis 86, 66-73. Mohan, D., Pittman, C.U., Jr., Bricka, M., Smith, F., Yancey, B., Mohammad, J., Steele, P.H., Alexandre-Franco, M.F., Gomez-Serrano, V., Gong, H., 2007. Sorption of arsenic, cadmium, and lead by chars produced from fast pyrolysis of wood and bark during bio-oil production. Journal of colloid and interface science 310, 57-73. Mohan, D., Sarswat, A., Ok, Y.S., Pittman, C.U., Jr., 2014. Organic and inorganic contaminants removal from water with biochar, a renewable, low cost and sustainable adsorbent--a critical review. Bioresource technology 160, 191-202. Saxena, M., Maity, S., Sarkar, S., 2014. Carbon nanoparticles in ‘biochar’ boost wheat (Triticum aestivum) plant growth. RSC Adv. 4, 39948. Shih, M.-C., 2012. Kinetics of the batch adsorption of methylene blue from aqueous solutions onto rice husk: effect of acid-modified process and dye concentration. Desalination and Water Treatment 37, 200-214. Sun, L., Wan, S., Luo, W., 2013. Biochars prepared from anaerobic digestion residue, palm bark, and eucalyptus for adsorption of cationic methylene blue dye: characterization, equilibrium, and kinetic studies. Bioresource technology 140, 406-413. Sun, P., Hui, C., Azim Khan, R., Du, J., Zhang, Q., Zhao, Y.-H., 2015. Efficient removal of crystal violet using Fe3O4-coated biochar: the role of the Fe3O4 nanoparticles and modeling study their adsorption behavior. Scientific Reports 5, 12638. Tan, I.A., Ahmad, A.L., Hameed, B.H., 2009. Adsorption isotherms, kinetics, thermodynamics and desorption studies of 2,4,6-trichlorophenol on oil palm empty fruit bunch-based activated carbon. Journal of hazardous materials 164, 473-482.

150
Tan, X., Liu, Y., Zeng, G., Wang, X., Hu, X., Gu, Y., Yang, Z., 2015. Application of biochar for the removal of pollutants from aqueous solutions. Chemosphere 125, 70-85. Vert, M., Doi, Y., Hellwich, K.-H., Hess, M., Hodge, P., Kubisa, P., Rinaudo, M., Schué, F., 2012. Terminology for biorelated polymers and applications (IUPAC Recommendations 2012). Pure and Applied Chemistry 84. Weber, T.W., Chakravorti, R.K., 1974. Pore and solid diffusion models for fixed-bed adsorbers. AIChE Journal 20, 228-238. Yan, Q., Wan, C., Liu, J., Gao, J., Yu, F., Zhang, J., Cai, Z., 2013. Iron nanoparticles in situ encapsulated in biochar-based carbon as an effective catalyst for the conversion of biomass-derived syngas to liquid hydrocarbons. Green Chemistry 15, 1631. Yang, Y., Chun, Y., Sheng, G., Huang, M., 2004. pH-Dependence of Pesticide Adsorption by Wheat-Residue-Derived Black Carbon. Langmuir 20, 6736-6741. Yang, Y., Sheng, G., 2003. Enhanced Pesticide Sorption by Soils Containing Particulate Matter from Crop Residue Burns. Environmental Science & Technology 37, 3635-3639. Yao, S., Lai, H., Shi, Z., 2012. Biosorption of methyl blue onto tartaric acid modified wheat bran from aqueous solution. Iranian Journal of Environmental Health Science & Engineering 9, 16-16. Zhang, P., Sun, H., Yu, L., Sun, T., 2013. Adsorption and catalytic hydrolysis of carbaryl and atrazine on pig manure-derived biochars: impact of structural properties of biochars. Journal of hazardous materials 244-245, 217-224.
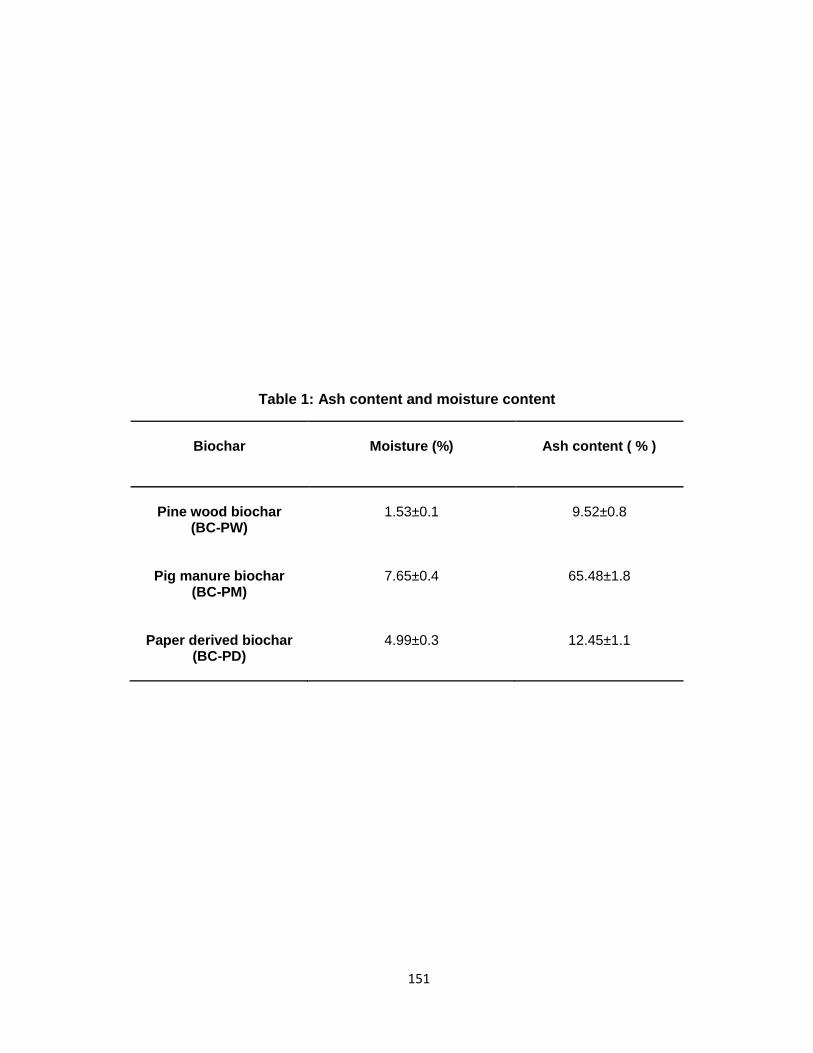
151
Table 1: Ash content and moisture content
Biochar
Moisture (%)
Ash content ( % )
Pine wood biochar
(BC-PW)
1.53±0.1
9.52±0.8
Pig manure biochar
(BC-PM)
7.65±0.4
65.48±1.8
Paper derived biochar
(BC-PD)
4.99±0.3
12.45±1.1

152
Table 2: Micro particles- Particle size distribution
Biochar
Mean size (μm)
D10 ( μm)
D90 (μm)
Pine wood biochar
(BC-PW)
850-300 μm
(S1)
635.16±342.32 277.29 1073.78
300-75 μm
(S2)
250.34±141.43 93.87 438.03
>75 μm
(S3)
55.66±47.71 15.96 118.08
Pig manure
biochar
(BC-PM)
850-300 μm
(S1)
415.14±308.64
76.28
833.27
300-75 μm
(S2)
212.51± 141.27 64.69
398.89
>75 μm
(S3)
56.49±38.49 17.18 105.49
Paper derived
biochar
(BC-PD)
850-300 μm
(S1)
382.53± 298.98 59.97 785.75
300-75 μm
(S2)
205.62±138.41 62.48 388.83
>75 μm
(S3)
61.33±47.03 20.61 121.33

153
Table 3: Langmuir and Freundlich adsorption isotherm constants
Biochar Sample
Langmuir constants
Freundlich constants
Qmax
(mg/g) KL
(L/mg) R
2 KF
(mg/g) n R
2
Pine wood
3.99
0.015
0.880
1.540
1.22
0.997
Pig manure
16.30
0.526
0.989
0.044
1.98
0.811
Paper derived
1.66
0.134
0.995
0.219
16.50
0.070
Activated
carbon
48.30
3.790
0.223
0.586
1.29
0.955

154
Table 4: Specific surface area of various biochars
Sample
Specific surface area obtained from
particle size analyzer ( cm
2/cm
3) in water
BC-PW 198.03±11.5
BC-PW S1 263.43±20.4
BC-PW S2 373.89±30.1
BC-PW S3 1894.2±55.6
BC-PM 346.97±18.4
BC-PM S1 384.45±31.3
BC-PM S2 569.60±48.3
BC-PM S3 1696.2±88.7
BC-PD 310.82±21.0
BC-PD S1 424.92±36.7
BC-PD S2 511.30±46.2
BC-PD S3 1530.8±88.3
AC 3130.3±67.6
BC-PW: Pine wood biochar; BC-PM: Pig manure biochar; BC-PD: Paper derived biochar; AC:
Activated carbon (microparticles S1: (850-300) μm; S2: (300-75) μm; S3: >75 μm)

155
Figure 1: Scanning electron microscopy images of biochar: (A) Pine wood biochar (BC-PW); (B) BC-PW
porosity; (C) Pig manure biochar (BC-PM); (D) BC-PM porosity; (E) Paper derived biochar (BC-PD); (F)
activated carbon

156
Figure 2: Effect of adsorbent dosage on adsorption capacity
0
5
10
15
20
25
0.1 0.3 0.5
Ad
sorp
tio
n (
mg/
g)
Dosage (g)
Pine wood biochar(BC-PW)
Pig manure biochar (BC-PM)
Paper derived biochar (BC-PD)

157
Figure 3 : Adsorption capacity of Biochar microparticles: (A) Pine wood biochar
(BC-PW); (B) Pig manure biochar (BC-PM); (C) Paper derived biochar (BC-PD);
microparticles S1: (850-300) μm; S2: (300-75) μm; S3: >75 μm

158
Figure 4: Adsorption isotherms of different biochar samples: (A) Langmuir
adsorption isotherm; (B) Freundlich adsorption isotherm (Ce : equilibrium
concentration of the adsorbate (mg L-1), qe : amount of adsorbate adsorbed per unit
mass of adsorbent (mg g-1))

159
Figure 5: Particle size distribution of biochar: (A) as obtained; (B) biochar microparticles
D ia m e te r (µ m )
0 .0 1 0 .1 1 1 0 1 0 0 1 0 0 0
q (%
)
0
2
4
6
8
1 0
Un
de
rs
ize
(%
)
0
1 0
2 0
3 0
4 0
5 0
6 0
7 0
8 0
9 0
1 0 0
P in e w o o d b io c h a r
P ig m a n u re b io c h a r
P a p e r d e r iv e d b io c h a r
D ia m e te r (µ m )
1 1 0 1 0 0 1 0 0 0 1 0 0 0 0
q (%
)
0
2
4
6
8
Un
de
rs
ize
(%
)
0
1 0
2 0
3 0
4 0
5 0
6 0
7 0
8 0
9 0
1 0 0
P in e w o o d b io c h a r
P ig m a n u re b io c h a r
P a p e r d e r iv e d b io c h a r
(A) (B)

160

161
PART 2
AN INSIGHT INTO THE ADSORPTION OF DICLOFENAC ON
DIFFERENT BIOCHARS: MECHANISMS, SURFACE CHEMISTRY, AND
THERMODYNAMICS
Linson Lonappan a, Tarek Rouissi a, Satinder Kaur Brar a*, Mausam Verma b, Rao
Y. Surampalli c
a INRS-ETE, Université du Québec, 490, Rue de la Couronne, Québec, Canada G1K 9A9
b CO2 Solutions Inc., 2300, rue Jean-Perrin, Québec, Canada G2C 1T9
c Department of Civil Engineering, University of Nebraska-Lincoln, N104 SEC P.O. Box 886105,
Lincoln, NE 68588-6105, United States
BIORESOURCE TECHNOLOGY 249 (2018), 386-394

162
RÉSUMÉ
Les biochars ont été préparés à partir de bois de pin et de fumier de cochons. Les microparticules
de biochar obtenues par broyage ont été évaluées pour l’enlèvement du contaminant émergent
diclofenac (DCF) et les mécanismes sous-jacents ont été étudiés en profondeur. La caractérisation
du biochar s’est effectué avec l’utilisation d’un analyseur de particules, des équipements SEM, BET,
FT-IR, XRD et XPS, et d’un potentiomètre. Le biochar de fumier de cochon (BC-PM) a manifesté
d’excellente capacité d’enlèvement (99.6%) en comparaison avec le biochar de bois de pin (BC-PW)
à des concentrations de 500 µg L-1 of DCF (concentration significative dans l’environnement). La
diffusion intraparticule s’est avérée être le processus de facilitation majeur de l’adsorption. Le BC-
PW a suivi une cinétique d’adsorption de premier ordre alors que le BC-PM a plutôt suivi une
cinétique de pseudo second ordre. Le biochar de bois de pin a été significativement affecté par les
variations de pH alors que pour le biochar de fumier de cochon, l’effet du pH était minime due à ses
groupes fonctionnels en surface et l’hydrophobicité du DCF. La thermodynamic, la présence d’ions
co-existant, la concentration initial de DCF and la taille des particules ont joué un rôle significatif
dans l’adsorption du DCF. Plusieurs modèles isothermes ont aussi été étudiés et les résultats sont
présentés dans l’étude.
Mots clés : Diclofenac; adsorption; biochar; chimie d’interface; thermodynamique; mécanisme

163
ABSTRACT
Biochars were prepared from feedstocks pinewood and pig manure. Biochar microparticles obtained
through grinding were evaluated for the removal of emerging contaminant diclofenac (DCF) and the
underlying mechanism were thoroughly studied. Characterization of biochar was carried out using
particle size analyzer, SEM, BET, FT-IR, XRD, XPS and zeta potential instrument. Pig manure
biochar (BC-PM) exhibited excellent removal efficiency (99.6%) over pine wood biochar (BC-PW) at
500 µg L-1 of DCF (environmentally significant concentration). Intraparticle diffusion was found to be
the rate limiting process. BC-PW followed pseudo first-order kinetics whereas BC-PM followed
pseudo second –order kinetics. Pine wood biochar was largely affected by pH variations whereas for
pig manure biochar, pH effects were minimal owing to its surface functional groups and DCF
hydrophobicity. Temperature, presence of co-existing ions, initial adsorbate concentration and
particles size played substantial role in adsorption. Various isotherms models were also studied and
results are presented.
Keywords: Diclofenac; Adsorption; Biochar; Interface chemistry; Thermodynamics; Mechanisms

164
1. Introduction
Emerging contaminants (ECs) are gaining wider attention nowadays due to their potential
environmental impacts. Even though ECs are detected at fairly low concentrations, the adverse
effects of ECs on several organisms are high and usually uncertain for several ECs. Among the
emerging contaminants, pharmaceutical, diclofenac (DCF) is often detected in wastewater treatment
plant influent, effluent, surface water and drinking water (Farré et al., 2008; Heberer, 2002; Stuart et
al., 2012). It is estimated that about 1443 ± 58 tons of DCF are consumed globally on an annual
basis (Acuña et al., 2015), which makes it as the 12th bestselling generic molecule globally worth
$1.61± 15% billion sales per year (Palmer, 2012). This large consumption, in turn, resulted in the
ubiquitous presence of DCF in wastewater. The incomplete degradation of DCF in wastewater
treatment plants leads to its presence in surface water and even in drinking water (Vieno &
Sillanpää, 2014). This presence in water resources causes toxic concerns towards several aquatic
and terrestrial organisms (Lonappan et al., 2016a). It has been reported that even at 250 ng L− 1
,
DCF can induce tissue damages in several mussel species and at 1 μg L− 1
, cytological alterations in
rainbow trout (Ericson et al., 2010). Thus, even very small concentrations of DCF can lead to a
considerable effect on the aquatic ecosystems.
In the recent decades, adsorption has emerged as an effective treatment method for the removal of
various organic emerging contaminants, such as pharmaceuticals (Nam et al., 2014; Westerhoff et
al., 2005). Activated carbons from the various origin are the conventional adsorbents studied for the
removal of ECs (Westerhoff et al., 2005). The physicochemical properties of adsorbents and
adsorbates, such as, hydrophobicity, surface functional groups, pore size, external surface area and
chemical composition determine the removal efficiency along with other experimental parameters,
such as pH and temperature (Lonappan et al., 2016c; Nam et al., 2014; Nielsen et al., 2014).
However, all adsorbents even after surface activation cannot become excellent adsorbents for all
contaminants. For instance, most of the activated carbons will exclude larger molecules (>3000 Da)
due to its small pore size (<2 nm) (Kilduff et al., 1996). Moreover, the activation process is an

165
additional procedure and incurs a cost. Thus, economical and eco-friendly adsorbents must be
specifically identified for the compounds of interest to be treated. As a waste management
alternative, carbonaceous material biochar exhibited its potential towards sustainability and
demonstrated its usefulness as a value-added product for several environmental applications
(Glaser et al., 2009; Lonappan et al., 2016c; Woolf et al., 2010). Biochar is carbon negative (Glaser
et al., 2009) material and hence the production and consumption are appealing towards a
sustainable future. For biochar, the adsorption mechanisms and adsorption capacity significantly
vary with feedstock and method of production as a result of changes in the chemical properties and
surface chemistry. Pinewood and pig manure are two of the largest produced agricultural and
farming industry residues in Quebec, Canada; which needed proper recycling/disposal. Hence,
production of biochar from these materials is an excellent waste management and valorization
alternative. Moreover, biochars of this category are well known for its richness in micropores and
adsorption abilities (Lonappan et al., 2016c). The porous structure and surface chemistry features
make biochar an excellent adsorbent for several environmental contaminants. Due to the aromaticity
and hydrophobicity, biochar is an excellent sorbent for a number of hydrophilic organic compound
and inorganic compounds(Fang et al., 2014). A proper understanding of the interactions between
adsorbate and adsorbent is necessary to design efficient adsorption systems for the removal of
contaminants.
The aim of this study is to evaluate the adsorption efficiency and adsorption processes of two
carbonaceous materials; biochar derived from pinewood and pig manure for the removal of a model
emerging contaminant, DCF for the first time. Biochar microparticles were prepared and
characterized by particle size analyzer, scanning electron microscope, Fourier transform infrared
spectroscopy, X-ray diffraction and Brunauer, Emmett and Teller (BET) analysis and zeta potential
instrument. The underlying sorption processes, such as adsorption rate, adsorption model, and
adsorbent/adsorbate interaction were studied using equilibrium adsorption data by various kinetic
and isotherm models. The effect of adsorbent dosage, particle size and thermodynamic behavior of

166
adsorption were also studied. Moreover, the effect of surface charges on adsorption was studied by
pH variations and zeta potential measurements. The result presented explains the effect of
feedstock, chemical and surface features of biochar for the effective removal of DCF.
2. Material and methods
2.1. Materials
Pinewood biochar sample (BC- PW) was obtained from Pyrovac Inc. (Quebec, Canada). BC-PW
was derived from pine white wood (80% v/v) purchased from Belle-Ripe in Princeville and the rest
was spruce and fir (20%). BC-PW was produced at 525±1°C under atmospheric pressure for 2
minutes in the presence of nitrogen (to create oxygen free environment) and used as obtained from
the reactor outlet. The second biochar sample prepared from pig manure (BC-PM) was obtained
from “Research and Development Institute for Agri-Environment” (IRDA), Quebec, Canada. BC-PM
was derived from the solid fraction of pig slurry and prepared at 400±1 °C for 2 h at 15°C min-1
in the
presence of nitrogen at a flow rate of 2 L min-1
during heating. Powdered activated carbon (AC) was
used as positive control for the adsorption studies to compare the adsorption results and was
purchased from Fisher scientific (Ottawa, Canada). At a time about 200 grams of raw biochar
samples was used for microparticle production. Samples were ground using ‘Retsch RS 200’
vibratory disc mill at 750 rpm for 2 minutes for BC-PW and 1 minute for BC-PM. Subsequently, the
obtained particles were sieved through ASTM 200 numbered sieve (corresponds to less than 75μm
particle size) for 10 minutes. The particle size and size distribution were further confirmed using
Horiba particle size analyzer (LA-950 Laser Particle Size Analyzer, Horiba, Japan).
Diclofenac sodium salt (98%; CAS 15307-79-6) was purchased from Fisher Scientific (Ottawa, ON,
Canada). An internal standard (IS), diclofenac-d4 was obtained from C/D/N isotopes Inc. (Montreal,
QC, Canada). The molecular weight of diclofenac is 296.14864 g/mol. Other properties are: log Kow
= 4.51 and pKa = 4.15.

167
All the experiments were carried out using Milli-Q water (18 MΩ cm-1
at 25 °C) and were prepared in
the laboratory using Milli-Q/Milli-RO Millipore system (Milford, MA, USA). All the reagents used for
analysis of DCF and for pH adjustment of samples were of analytical grade.
2.2 Methods
2.2.1 Physico-chemical properties of microparticles
Horiba particle size analyzer (LA-950 Laser Particle Size Analyzer, Horiba, Japan). was used to
measure the particle size distribution of microparticles. The analysis was carried out in duplicate and
the mean value was measured. Surface characteristics of prepared microparticles were investigated
by EVO®
50 smart scanning electron microscope (SEM) (Zeiss, Germany). Specific surface area
was obtained from Brunauer, Emmett and Teller (BET) N2 adsorption isotherms at 77 K (Autosorb-1,
Quantachrome, USA). The presence of functional groups on the surface of adsorbents was
investigated by Fourier transform infrared spectroscopy (FT-IR; Perkin Elmer, Spectrum RXI, FT-IR
instrument fitted with lithium tantalate (LiTaO3) detector. Powder x-ray diffraction (XRD) patterns of
the samples were recorded using Panalytical Empyrean XRD with monochromatized CuK alfa
radiation (1.5418 A). The surface charge properties of adsorbents were investigated by zeta
potential measurements, which were conducted at a different equilibrium pH using a Nano-ZS
Zetasizer (Malvern Instruments Inc., UK). Samples were pre-equilibrated to different pH (2, 5, 7, 10
and 13) maintaining a constant biochar dosage of 2 g L-1
. The zeta potential was measured in
duplicate at each pH and the mean was calculated.
2.2.2 Batch adsorption studies
Batch adsorption studies were carried out in 125 mL conical flasks with 50 ml of sample in an
INFORS HT - multitron standard shaking incubator (INFORS, Mississauga, Canada). The agitation
was carried out at 200 rpm and kept constant throughout the study. The temperature was set to be
25 ±1°C and 0.1g of biochar was used for the study at pH 6.5 (unless stated otherwise for a

168
particular study). Prior to analysis, the biochar samples were dried overnight at 60 ±1°C in an oven
and then cooled in a desiccator to remove any moisture present. After adsorption, DCF samples
were separated using centrifugation at 11600 x g for 10 minutes in a MiniSpin® plus centrifuge. Post
centrifugation, the supernatant was analyzed for DCF left in the liquid.
The adsorption capacity at time t (in μg g−1
) was calculated using Equation 1:
𝑞𝑡 = 𝑉(𝐶0 − 𝐶𝑡) 𝑤⁄ ----------------------------------------------------------- (1)
Percentage of DCF removal at time ‘t’ was calculated using Equation 2
% 𝑟𝑒𝑚𝑜𝑣𝑎𝑙 (%𝑅) = {(𝐶0−𝐶𝑒
𝐶0) 100}----------------------------------------- (2)
Where C0, Ct and Ce represent the concentrations of DCF (mg L-1
) at the beginning of the
experiment, at time t (min), and at equilibrium respectively; V is the volume of the solution used for
the study (L); and w is the mass of biochar used (g).
2.2.3 Equilibrium and kinetics of adsorption
Equilibrium adsorption studies were carried out for 2 mg L-1
of DCF for 48 h. Sampling was carried
out each hour for the first 12 hours and then for each 6-hour interval untilthe end of the experiment
(48 h). The data was used to study the kinetics and equilibrium of adsorption for BC-PW and BC-
PM. For this study, pH was kept constant at 6.5 and temperature was maintained at 25°C.
Adsorption process (adsorption rate, model, and information about adsorbent/adsorbate interaction
- physisorption or chemisorption) was evaluated by Pseudo-first-order rate equation, Pseudo-
second-order rate equation and Elovich equation. The theory behind each equation is given in
supplementary information (SI).

169
2.2.4 Varying DCF concentrations and adsorption isotherms
Adsorption studies were carried out using 0.1 g of biochar microparticles concentrations varied from
0.1 mg L-1
to 10 mg L-1
(0.1, 0.25, 0.5, 1, 3, 5 and 10 mg L-1
). The pH was kept constant at 6.5 and
temperature was maintained at 25°C. Equilibrium data were used to study the adsorption isotherm
models. Langmuir, Freundlich, Temkin, and Dubinin- Radushkevich (D-R) isotherm models were
used to study the adsorption process. The theory behind each model is given in supplementary
information (SI)
2.2.5 pH and adsorption
Adsorption studies were carried out at different pH, 2, 6.5, 10, and 12.5 to evaluate the effect of
varying pH on adsorption. In this experiment, studies were carried out using 1 mg L-1
of DCF
prepared in milli-Q water. The pH of biochar samples was analyzed using an independent method
(Nielsen et al., 2014). In short, biochar samples were added to milli-Q water containing DCF and the
pH of the sample was adjusted using 1N NaOH or HCl. Adsorption experiments were carried out
until reaching equilibrium and samples were analyzed for zeta potential and DCF.
2.2.6 Thermodynamics of adsorption
The thermodynamics of adsorption of DCF on BC-PW and BC-PM was evaluated by carrying out
adsorption study at 10°C, 20°C, 25°C, 30°C, 40°C and 50°C with 500 µg L-1
of DCF. The study on
the effect of temperature on adsorption will extend the knowledge of thermodynamic parameters,
such as Gibbs free energy of adsorption (ΔG°), heat of the adsorption (ΔH°) and standard entropy
changes (ΔS°) (Suriyanon et al., 2013). Thermodynamic equations used for these calculations are
given in Equations 3 and 4:
ln (𝑞𝑒
𝐶𝑒) =
ΔS°
𝑅−
ΔH°
𝑅𝑇 ------------------------------------------------- (3)
ΔG° = ΔH°- TΔS° -------------------------------------------------- (4)

170
Where R is the universal gas constant (8.314 J mol-1
K-1
) and T is the absolute temperature in Kelvin
(K). ΔH° and ΔS° can be determined from the slope and intercept of the plots between
𝑙𝑛 (𝑞𝑒
𝑐𝑒⁄ ) versus 1/T (equation 13). ΔG° can be calculated from equation 4.
2.2.7 Microparticles and adsorption
To study the effect of adsorption on biochar microparticles in comparison with raw biochar (as
obtained from: millimeters to high micrometers range) adsorption studies were carried out using
biochar as obtained. According to the International Union of Pure and Applied Chemistry (IUPAC)
guidelines (terminology for biorelated polymers and applications (IUPAC Recommendations, 2012),
microparticles are defined as particles with dimensions between 1 × 10⁻⁷
and 1 × 10⁻⁴
m. The
preparation technique for microparticles is described in section 2.1. The behavior of microparticles is
unique since microparticles have a larger surface-to-volume ratio than the macroscale. For further
comparison activated carbon was used as a positive control for this study.
2.2.8 DCF analysis
Stock solutions of diclofenac and diclofenac-d4 (1 g L-1
) were prepared in methanol and stored in
amber colored bottles at 4±1 ºC, until use. All the reagents used for analysis of DCF are of analytical
grade. Laser diode thermal desorption tandem mass spectroscopy (LDTD- MS/MS) was used for the
analysis of DCF samples(Lonappan et al., 2016b). The instrument comprised LDTD-APCI (Laser
diode thermal desorption - atmospheric pressure chemical ionization) source (LDTD T-960,
Phytronix Technologies, Quebec, Canada) mounted on a TSQ Quantum access triple quadruple
mass spectrometer (Thermo Scientific, Mississauga, Ontario, Canada).
3 Results and discussion
3.1 Physico-chemical properties of biochar
Scanning electron micrographs of biochar (Fig.1 in (Lonappan et al., 2017) and supplementary file)
showed rough and uneven surfaces with the presence of several pores. For both C-PM and BC-

171
PW, as per visual image data, pores are of the dimensions of micrometers (µm). For BC-PW, pores
are well arranged whereas, for BC-PM, the pores are unevenly distributed. However, these micro
and macro pores facilitate the adsorption of DCF having a molecular size in A° dimension(Jung et
al., 2015).
The Brunauer, Emmett, and Teller (BET) specific surface area of raw pine wood biochar (BC-PW-R)
was fairly very small at 0.18 m2 g
-1, whereas with microparticles of pinewood biochar (BC-PW-M) an
increase in surface area (13.3 m2 g
-1; about 75-fold) was observed. For raw pig manure biochar
(BC-PM-R) surface area was 21.4 m2 g
-1and with microparticles (BC-PM-M), it was increased to 43.5
m2 g
-1 (Nielsen et al., 2014). Thus, size reduction resulted in an increased surface area and this has
been discussed in a previous study (Lonappan et al., 2016c). The surface area of activated carbon
used was 900 m2 g
-1.Other properties, such as ash content and moisture content which can affect
adsorption properties are already given in a previous publication (Lonappan et al., 2016c). Fourier
transform infra-red (FTIR) spectra was recorded for both BC-PW and BC-PM (Fig. 2 in (Lonappan et
al., 2017) and supplementary file ). For pinewood biochar (BC-PW), wood cellulose is a polymer rich
material with hydroxyl groups and even after pyrolysis, some hydroxyl moiety remains in the
sample (Chia et al., 2012) and a sharp and medium peak near 3400 cm-1
indicated the presence of
O-H stretching in the plane with a free hydroxyl group. A medium and narrow peak at 2912 cm-1
showed the presence of alkanes with C-H stretching. The narrow peak at 2362 cm-1
was identified as
the presence of nitrile group (C=N). Since BC-PW is derived from a plant source, the presence of
lignin/cellulose-derived transformation products was observed (Keiluweit et al., 2010) (multiple peaks
starting around 1600 cm-1
to 700 cm-1
). A strong, but narrow peak at 1584 cm-1
was due to aromatic
ring modes which is characteristic for chars derived from lignocellulose materials, such as pinewood
(softwood) (Sharma et al., 2004). A medium peak at 1373 cm-1
was attributed to the presence of
alkane (C-H) bending. A strong peak at 1197 cm-1
was due to sulfonic acids with S=O stretching. A
peak at 873 cm-1
could be due to C-H bending (1, 2, 4-trisubstituted) and a medium peak at 812 cm-1
signified aromatic C-H bending (trisubstituted). Moreover, a medium peak at 750 cm-1
was due to

172
aromatic C-H bend (out of the plane). The FTIR spectra of pig manure biochar (BC-PM) revealed
their complex functional groups consisting of a mixture of mineral and organic matter. Generally,
biochar from pig manure feedstock consists of several inorganic functional groups, such as metals
(Zhang et al., 2013). For pig manure biochar, a narrow peak at 3400 cm-1
was identified as N-H
stretch which could be due to the presence of secondary amines. The narrow peak at 2533 cm-1
showed the presence of mercaptans (S-H stretch). A broad and strong peak of around 1422 cm-1
is
due to the C–C stretch (in the –ring) which confirmed the presence of aromatics. The broad and
strong peak around 1114 cm-1
was due to C-O stretch and pointed towards the presence of
carboxylic acid functional groups. Since pig manure is rich in phosphorus, a peak around 874 cm-1
and 563 cm-1
can be assigned to PO43−
group. The peak of around 712 cm-1
could be due to the
presence of calcium and peak around 617 cm-1
was assigned to the presence of disulfides (S-S)
stretching since pig manure is rich in minerals. Moreover, peak around 563 cm-1
was assigned to the
presence of alkyl halides.
X-ray diffraction (XRD) analysis was conducted for BC-PW and BC-PM to study the crystallinity
behaviour of the biochar (Fig. 3 in (Lonappan et al., 2017) and supplementary file). The chemical
structure of the adsorbent plays a key role in the interaction between adsorbent and adsorbate and
hence explains adsorption potential and mechanism. For BC-PW, distinct peaks of around 25 and
44, 2θ° angle were attributed to the presence of quartz (Zhang et al., 2015).
Particle size distribution of the prepared microparticles is given in Fig 1. The particle size distribution
was well within the defined microparticles range with a diameter of less than 100 µm. The mean
particle size of pig manure biochar microparticle (BC-PM) was observed to be ≈30.6 µm with 9.32
µm, 22.52 µm and 61.58 µm for D10 (particle diameter corresponding to 10% cumulative (from 0 to
100%) undersize particle size distribution), D50 (particle diameter corresponding to 50% cumulative
(from 0 to 100%) undersize particle size distribution) and D90(particle diameter corresponding to
90% cumulative (from 0 to 100%) undersize particle size distribution) values, respectively.

173
3.2 Microparticles and adsorption
Removal efficiencies of raw biochar, biochar microparticles and activated carbon under different
concentrations and at an initial hour and at equilibrium time is given in Fig.2. Adsorption studies
were focused on environmentally relevant concentrations of DCF such as 500 µg L-1.
. Pinewood
biochar as obtained- (BC-PW-R) showed the lowest removal efficiency for DCF at 10 mg L-1
and 500
µg L-1
. For both concentrations, the maximum removal efficiency was obtained at equilibrium which
was reached after 4.5 hours. The maximum removal efficiency obtained was 40 % for BC-PW-R,
whereas as with pine wood biochar microparticles (BC-PW-M), this removal efficiency was
enhanced to 68% and which was obtained for 500 µg L-1
of DCF at equilibrium. This enhancement in
removal efficiency is attributed towards the increase in surface area from 0.18 m2 g
-1 to 13.3 m
2 g
-1
which provided an increase in adsorption sites. Moreover, DCF being a molecule with a negative
charge; will be drawn towards the positive charges on the biochar surface. Functional groups, such
as a free hydroxyl group will create positive surface radicals on biochar that will assist in the overall
adsorption of DCF.
Biochar derived from pig manure exhibited higher adsorption potential and hence higher removal
efficiency over pine wood biochar. Even raw pig manure biochar (as obtained form) (BC-PM –R)
exhibited good removal efficiency of 61.8 % in the first hour of adsorption and which increased up to
80.8% at equilibrium at 10 mg L-1
DCF. Moreover, at an environmentally relevant concentration of
500 µg L-1
, the maximum removal efficiency obtained was 82%. With pig manure biochar
microparticles (BC-PM-M), the removal efficiency was enhanced up to 98% and 99.6%, respectively
at 10 mg L-1
and 500 µg L-1
and at equilibrium. This excellent removal efficiency of pig manure
biochar can be attributed to its surface area: 21.4 m2 g
-1 for raw biochar and 43.5 m
2 g
-1 for
microparticles. The increase in removal efficiency of microparticles (BC-PM-M) was due to the
availability of higher surface area for adsorption through size reduction. Moreover, FTIR analysis
proved the presence of inorganic surface functional groups and metals in pig manure biochar.
Presence of a variety of surface functional groups, such as halides, sulfides, carboxylic acids,

174
phosphates along with other organics enhanced the adsorption potential. Previous studies also
reported the specific ability of pig manure-derived biochar for the removal of herbicides (Zhang et al.,
2013). Furthermore, it is to be noted that at an environmentally relevant concentration, pig manure-
derived biochar microparticles exhibited removal efficiency near 100% (99.6 %) at equilibrium.
Commercially available activated carbon was effective at 10 mg L-1
DCF owing to its much larger
surface area. In addition, activated carbon exhibited its potential for rapid adsorption so that
equilibrium was attained in less than one hour with excellent removal efficiency (99.4 %). However,
at lower concentration (500 µg L-1
), the removal efficiency was 95% for activated carbon even after 5
hours of contact time. For biochar microparticles derived from pig manure, the removal efficiency
increased to 99.6% at equilibrium. Hence, pig manure biochar can be used as an effective adsorbent
for micropollutants and as a potential replacement for activated carbon.
Apart from the enhanced surface area, several other factors influenced and increased adsorption
potential/ removal efficiency of pig manure biochar in comparison with biochar derived from pine
wood. Previous molecular modeling studies reported the interactions between DCF and biochar
surfaces (Jung et al., 2015). In addition, depending upon the type of the adsorption, several
interactions, such as p-p electron donor-acceptor interactions, hydrophobic interactions, hydrogen
bonding and Van der Waal forces are involved in adsorption. The larger molecular butterfly structure
of DCF(Jung et al., 2015; Lonappan et al., 2016b) maximizes the p-p interactions between the
surface of biochar and DCF (Schames et al., 2004). The structure comprising one aromatic ring will
be always parallel to the adsorbent and other will be perpendicular and which will enhance the
interaction with biochar surface making DCF always available for biochar. In this study, biochar
derived from pig manure and pinewood is rich in organic functional groups evident from the available
FTIR results. The aromatic carbon will enhance the hydrophobic interactions owing to its component
ratio (Chen et al., 2007; Jung et al., 2015). Also, the effect of the copious presence of non-aromatic
carbon, aliphatic carbon, and other inorganic functional groups in pig manure biochar cannot be
overruled. The interactions between polarizable biochar surfaces will act as electron donors and

175
polar aromatic DCF (electron acceptors) can also be expected (Chen et al., 2007). Hence, these
interactions with aromatic groups in addition to inorganic functional groups make pig manure biochar
a better adsorbent for DCF over pine wood biochar. Moreover, these enhanced interactions due to
the presence of a large variety of inorganic and organic functional groups could be the reason for
enhanced adsorption potential for pig manure biochar at lower concentrations in comparison with
activated carbon despite lower surface area.
Co-existing ion effect also had a considerable effect on adsorption of DCF onto biochar. Zhang et
al,2013 reported that presence of metals, such as Ca and Mg can enhance DCF adsorption (Zhang
et al., 2013) by forming DCF- metal precipitates or complexes. Elemental and metal analysis
(supplementary data) showed that Mg (mg/kg) (PM- 10111.52±78.6, PW- 143.45±10.2) and Ca (PM-
45481.88±26.8 and PW- 1753.38±14.5) concentrations are much higher in PM than PW and thus
formed precipitates which in turn resulted in enhanced adsorption by BC-PM. Moreover, XPS
analysis has been conducted to confirm co-existing ion effect as well as further confirm the results
obtained from FTIR.
From XPS results, it is evident that the presence of other ions, such as metals enhanced the
adsorption potential of BC-PM. Detailed report on XPS analysis has been provided as
supplementary information. For pinewood biochar, the fit is not perfect with the function used for the
asymmetry, but as expected the main peak is highly asymmetrical and its width is very small; it can
be shown that the π-π* satellite has an intensity only between 2.6 and 4.6% of the total C1s
intensity, it is located at around 6 eV on the high BE side of the main peak and has a width larger
than 2eV. As there are no contaminants on this sample, especially oxygen, there are no peaks
associated with carbon-oxygen bonds.
For pig manure biochar, O1 and C1 spectrums showed the presence of various impurities and metal
oxides. Moreover, C=O and C-O bonding were predominant in these samples. 2p Ca was also
observed that can directly influence the DCF adsorption through metal complexation of DCF with Ca.

176
3.3 Equilibrium studies and kinetic models
The equilibrium time was determined based on adsorption studies on biochar microparticles across
time. Results showed that equilibrium was reached after 4.5 hours for BC-PW and after 5 hours for
BC-PM. The initial rapid adsorption for both biochars facilitated a rapid adsorption to reach
equilibrium. Moreover, nature and available sorption sites of adsorbents affected the adsorption
equilibrium (Bhattacharya et al., 2008).
Adsorption kinetic models can predict chemical reactions, reaction rate, and particle diffusion
mechanism of DCF onto biochar microparticles. However, elementary kinetic models, such as first
and second order rate equations are not applicable to the adsorption system with solid surfaces,
such as biochar, which are rarely homogeneous since the effects due to chemical reactions involved
and the transport phenomena are often experimentally inseparable (Sparks, 1989). In this study,
pseudo first-order, pseudo second-order, Elovich l and the intra-particle diffusion models were used.
Results (Table 1) showed that kinetics of DCF adsorption onto biochar microparticles were
correlated with the linear forms of these four models. Kinetic equations and theoretical aspects
involved in the models are given in supplementary information.
For BC-PW, all the studied models exhibited a good correlation with the experimental data
(correlation coefficients obtained were 0.93, 0.99 and 0.95 respectively for pseudo first-order, the
pseudo-second-order and Elovich kinetic). However, even with a correlation coefficient near to unity,
pseudo-second order failed to obtain a theoretical equilibrium concentration from a model which was
equal or comparable with the experimentally observed equilibrium concentration. With a correlation
coefficient of 0.938, calculated equilibrium concentration was comparable with experimentally
observed equilibrium concentration in pseudo-first-order model. Elovich model also gave a better
fitting to the experimental data with a correlation coefficient of 0.95. However, the pseudo first-order
model was selected as the model for the adsorption DCF on BC-PW due to its excellent agreement
with the experimental equilibrium concentration value. Hence during adsorption mass transfer from
the bulk to the adsorption sites are occurred driving and the driving force is the concentration
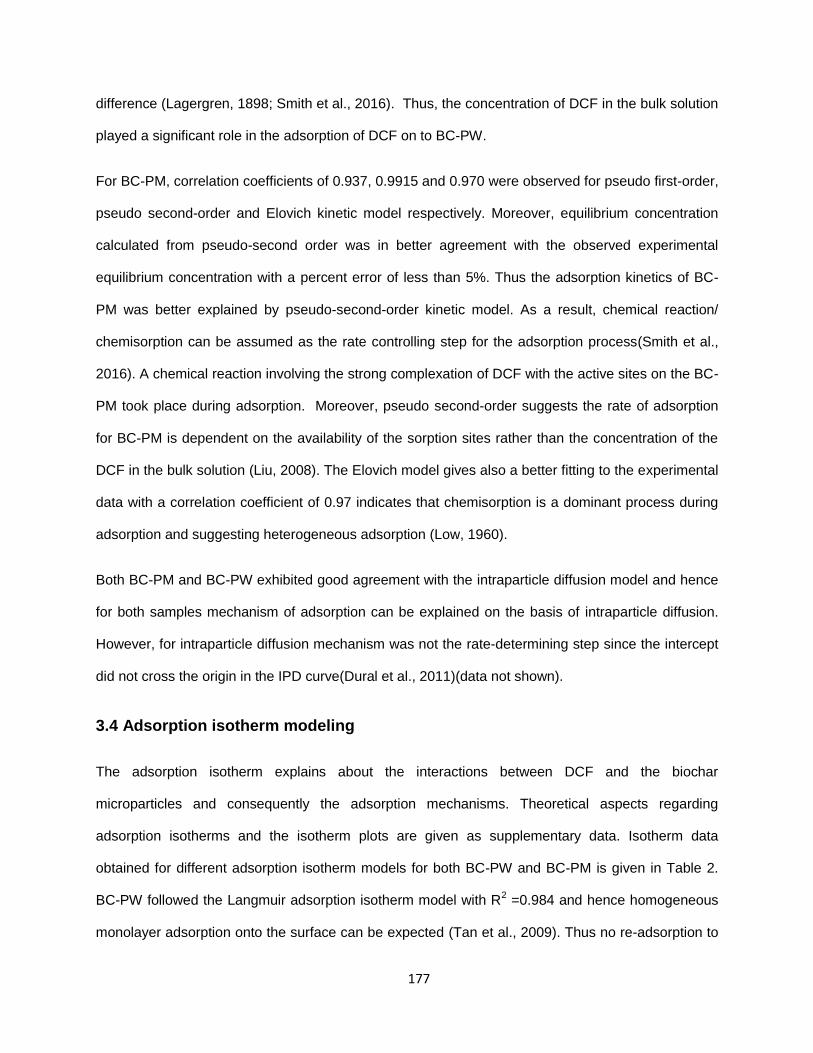
177
difference (Lagergren, 1898; Smith et al., 2016). Thus, the concentration of DCF in the bulk solution
played a significant role in the adsorption of DCF on to BC-PW.
For BC-PM, correlation coefficients of 0.937, 0.9915 and 0.970 were observed for pseudo first-order,
pseudo second-order and Elovich kinetic model respectively. Moreover, equilibrium concentration
calculated from pseudo-second order was in better agreement with the observed experimental
equilibrium concentration with a percent error of less than 5%. Thus the adsorption kinetics of BC-
PM was better explained by pseudo-second-order kinetic model. As a result, chemical reaction/
chemisorption can be assumed as the rate controlling step for the adsorption process(Smith et al.,
2016). A chemical reaction involving the strong complexation of DCF with the active sites on the BC-
PM took place during adsorption. Moreover, pseudo second-order suggests the rate of adsorption
for BC-PM is dependent on the availability of the sorption sites rather than the concentration of the
DCF in the bulk solution (Liu, 2008). The Elovich model gives also a better fitting to the experimental
data with a correlation coefficient of 0.97 indicates that chemisorption is a dominant process during
adsorption and suggesting heterogeneous adsorption (Low, 1960).
Both BC-PM and BC-PW exhibited good agreement with the intraparticle diffusion model and hence
for both samples mechanism of adsorption can be explained on the basis of intraparticle diffusion.
However, for intraparticle diffusion mechanism was not the rate-determining step since the intercept
did not cross the origin in the IPD curve(Dural et al., 2011)(data not shown).
3.4 Adsorption isotherm modeling
The adsorption isotherm explains about the interactions between DCF and the biochar
microparticles and consequently the adsorption mechanisms. Theoretical aspects regarding
adsorption isotherms and the isotherm plots are given as supplementary data. Isotherm data
obtained for different adsorption isotherm models for both BC-PW and BC-PM is given in Table 2.
BC-PW followed the Langmuir adsorption isotherm model with R2 =0.984 and hence homogeneous
monolayer adsorption onto the surface can be expected (Tan et al., 2009). Thus no re-adsorption to

178
the surface is taking place during the adsorption. Temkin (R2
= 0.92) and Dubinin- Radushkevich
(D-R) (R2=0.73) isotherm models were not linearly fitting the experimental data and thus were not
considered. However, Freundlich isotherm model resulted in R2 of 0.94. Even though, owing to
higher R2 obtained with Langmuir isotherm model and a Q0 (μg g-1) of 526.3 which was almost
equal to the Q0 observed in actual experimental conditions, Langmuir isotherm model has been thus
selected as the best fitting model. Hence, a maximum adsorption capacity of 526.3 μg g-1
can be
observed at 500 μg L-1
of DCF through isotherm models. Moreover, Langmuir isotherm model rate of
adsorption has been calculated as 1.39 x 10⁻³
L μg−1
(Kilduff et al., 1996; Tan et al., 2009).
BC-PM followed the Freundlich isotherm model (R2 = 0.99) which involved multilayer adsorption. All
the other models (Langmuir, Temkin, and D-R) resulted in poor R2 with the experimental values
(Table 1). Thus, the stronger binding sites on the surface are occupied first and that the binding
strength decreased with the increasing degree of site occupancy and which reduced the adsorption
with time. Hence, after an initial increase in adsorption capacity, adsorption decreased gradually due
to unavailability of adsorption sites (Freundlich, 1906; Tan et al., 2009). Moreover, Freundlich
isotherm model suggested the possibility of heterogeneous multilayer adsorption involving binding
by both physical and chemical forces. However, the high value of n (favorability factor for
heterogeneity; 1/n = 0.87) ruled out the possibility of heterogeneity in this study.
3.5 pH effect on adsorption of DCF
Effect of pH on adsorption is an important parameter to study as adsorption is being a surface
controlled process. The pH of BC-PW was found to be 8.5 and 11.22 for BC-PM. Thus, negative
surface charges are predominant on the surface of biochar. Fig.3 demonstrated a correlation
between pH, zeta potential and the adsorption of DCF on biochar. For BC-PW and BC-PM, higher
adsorption occurred at acidic pH. Moreover, BC-PW was significantly affected by pH (88.6±2 % at
pH 2 to 36±3 % at pH 12.5) as compared to BC-PM (about 99.8 ± 2 % at pH 2 to 88.8 ± 2 % at pH

179
12.5) for removal efficiency of DCF. Furthermore for both biochars removal was always favored by
acidic pH.
Ionizable micropollutants can interact with adsorbents through electrostatic attraction or repulsion,
and this interaction varied depending on their pKa values (Huerta-Fontela et al., 2011). DCF is
considered as a weak acid as its pKa is around 4.15 (Nam et al., 2014). For hydrophobic
compounds such as DCF, the adsorption could be largely affected by the pH changes. Hence,
electrostatic and specific sorbate-sorbent interactions (based on surface polarities, functional
groups, organic and inorganic components of biochars)(Nielsen et al., 2014) between DCF and
biochar surface do have an impact on adsorption.
The isoelectric point (pHIEP) of BC-PW was calculated to be 2.45 from zeta potential - pH curve (Fig
3). Excellent removal efficiency (88.6 %) and hence adsorption was exhibited by BC-PW at acidic
pH. DCF being a negative ion at acidic pH higher adsorption can be expected. Consequently, at
acidic pH and even pH near to pHIEP, excellent removal was obtained. This phenomenon can be
explained on the basis of electrostatic attraction between negatively charged DCF and positive
biochar surface. Further, removal efficiency was decreased by 60% with an increase in pH. The
electrostatic interactions played a major role in the adsorption of DCF onto BC-PW microparticles.
Adsorption of DCF onto BC-PW was mainly due to physical forces of attraction which may include
electrostatic interactions, Van der Waals forces, and hydrophobic interactions. In addition, both the
biochar and DCF are hydrophobic in nature and this factor might have facilitated the adsorption and
favorable pH. Excellent adsorption near to (pHIEP) is suggested the possibility of other mechanisms
involved in the adsorption process. This can be attributed to H- bonding possibility with oxygen-
containing groups, such as OH- on the surface of biochar (Fang et al., 2014; Nam et al., 2015) along
with hydrogen bonding with other aromatic functional groups, such as aromatic C-H which are
observed on the surface of biochar.
The isoelectric point (pHIEP) of BC-PM was calculated to be 2.15 from zeta potential - pH curve. For
BC-PM, the adsorption was also pH dependent, the maximum removal efficiency (99.8%) was

180
observed at pH of 2; while it decreased to 88.8% at pH 12.5. This decrease could be due to the
changes in the surface charge and hence the negative surface of biochar repelled DCF anion.
However, in comparison with BC-PW, the drastic decrease in removal efficiency was minimum and
even at unfavorable pH of 12.5; 88.8% of removal efficiency was observed. Physical processes,
such as electrostatic interactions are not the major process involved in the adsorption DCF onto BC-
PM. The removal process can be explained on the basis of electrostatic interactions, H- bonding,
hydrophobic effects, and π–π EDA interactions. The presence of oxygen-containing functional
groups, such as carboxylic acids facilitated the adsorption through H- bonding irrespective of pH
(Fang et al., 2014). Moreover, polar functional groups, such as hydroxyl and amine groups exhibited
electron-withdrawing effect at basic pH values(Ji et al., 2010) and these groups can interact with
aromatic rings (π electron acceptors) in BC-PM. Minerals and inorganic functional groups, such as
disulfides and halides are present in BC-PM and has positively affected the adsorption, irrespective
of the pH.
3.6 Thermodynamics of DCF adsorption
Adsorption studies were carried out at various temperatures: 10°C, 20°C, 25°C, 30°C, 40°C and
50°C. Thermodynamic parameters were calculated according to equations (13) and (14). Different
behaviors were observed for BC-PW and BC-PM with adsorption along with temperature (Table 3).
In the liquid phase adsorption, the adsorption of adsorbate occurred while solvent species were
removed from the sorption sites. Displacement enthalpies are the key factors in this process as they
balance different weak interactions between adsorbent, adsorbate, and solvent.
The thermodynamic factors affecting the adsorption process are summarized in Table 3. For BC-
PW, a decrease in adsorption capacity (µg g-1
) was observed along with an increase in temperature.
An adsorption capacity of 141.82 µg g-1
was observed at 10° C (283K) and which decreased along
with an increase in temperature to 75.34 µg g-1
at 50° C (323K) under equilibrium conditions.
Previously, similar results were observed for diclofenac adsorption on Isabel grape bagasse

181
(Antunes et al., 2012) and for the removal of other pharmaceuticals on carbon black (Cuerda-Correa
et al., 2010). In these studies, authors explained this phenomenon based on two processes: the
energy exchange between sorbate, sorbent and the solvent and the solubility of pharmaceuticals.
Elevated temperatures can increase the solubility of the pharmaceutical; hence in a better soluble
condition, pharmaceuticals will have a higher affinity towards the solvent than the adsorbent. In
addition, along with temperature, vapor pressure also increased and density of the adsorbate
decreased which will decrease the adsorption as a result of decreased interactions between DCF
and biochar surface (BC-PW). For BC-PW, adsorption was endothermic (ΔH° =1.130 KJ mol-1
)
Moreover, 1.130 KJ mol-1
for ΔH° indicated that the process is physisorption since the adsorption
energies for physisorption are lower than 40 KJ mol-1
. A negative value of ΔS° (-4.40 J mol-1
K-1
)
suggested that randomness at the solid –solution interface decreased during the adsorption. The
possible reason could be the formation of more than one layer of adsorption (Antunes et al., 2012).
Also, the total process was non-spontaneous (ΔG°= positive). A similar behavior was observed in a
previous study as well for dye adsorption onto activated bentonite(Özcan & Özcan, 2004). For DCF
adsorption, a similar behaviour was observed with adsorption of DCF on to Isabel grape bagasse
(Vitis labrusca)(Antunes et al., 2012). The positive value and thus non-spontaneity of the process
could be due to the presence of energy barrier which hindered the adsorption process. This could be
due to the repulsive electric charges (negative) (Antunes et al., 2012; Özcan & Özcan, 2004) which
were present on the surface of biochar. Adsorption of DCF on BC-PW was highly pH dependent
(section 3.5) and electrostatic attraction forces played a major role in the adsorption and hence
thermodynamic behaviour of DCF adsorption onto BC-PW is in good agreement with the
observations made using pH variable study.
A completely different behavior was obtained for BC-PM, a small increase in adsorption capacity (µg
g-1
) was observed along with an increase in temperature. An adsorption capacity of 236.53 µg g-1
was observed at 10° C (283K) and which increased along with an increase in temperature to 247
µg g-1
at 50° C (323K). Thus, the effect of temperature on adsorption was minimal. This increase can

182
be attributed to increased surface coverage of DCF at higher temperature due to the expansion and
creation of new active sites on BC-PM. The larger size of DCF and the possible presence of metal
oxide catalysts (creates active sites at a higher temperature, identified by FTIR) in BC-PM could be
the reason for slightly better adsorption at higher temperatures. For BC-PM, a value of ΔH° = -3.970
KJ mol-1
suggests adsorption process as exothermic. A positive value of ΔS° (16.13) suggested that
randomness at the solid-liquid interface increased during the adsorption. The whole process was
spontaneous; indicated by a negative ΔG° value. Similar results for spontaneity have been reported
for adsorption of anti-inflammatory pharmaceutical naproxen on activated carbon (Önal et al., 2007)
4. Conclusions
The adsorption of DCF onto BC-PM was found to be effective over BC-PW. About 99.6% removal
efficiency was observed for BC-PM at an environmentally relevant concentration of 500 µg L-1
. For
BC-PW, adsorption was explained by pseudo first-order model whereas for BC-PM by pseudo
second-order model. For both adsorbents, intraparticle diffusion was found to be the major
mechanism explaining the adsorption behavior. BC-PW adsorption was largely affected by the pH,
whereas pH dependency of adsorption of BC-PM was minimal. Thermodynamic behavior of both
adsorbents suggested adsorption of DCF on BC-PW was endothermic while exothermic for BC-PM.
Acknowledgement(s)
The authors are sincerely thankful to the Natural Sciences and Engineering Research Council of
Canada (Discovery Grant 355254 and NSERC Strategic Grant) and Ministère des Relations
internationales du Québec (coopération Québec-Catalanya 2012-2014; project 07.302). We would
like to thank Prof. Christian Roy (Pyrovac Inc., Quebec) and Dr. Stéphane Godbout (IRDA, Quebec)
for providing biochar samples. We would like to acknowledge Dr. Kshipra Misra (Defense Institute of
Physiology and Allied Sciences (DIPAS), India) for analytical supports. In addition, we would like to
thank Dr. Alain Adnot and Prof. Émile Knystautas (Université Laval) for analytical supports during
XPS analysis.

183
References
Acuña, V., Ginebreda, A., Mor, J.R., Petrovic, M., Sabater, S., Sumpter, J., Barceló, D. 2015. Balancing the health benefits and environmental risks of pharmaceuticals: Diclofenac as an example. Environ. Int. 85, 327-333.
Antunes, M., Esteves, V.I., Guégan, R., Crespo, J.S., Fernandes, A.N., Giovanela, M. 2012. Removal of diclofenac sodium from aqueous solution by Isabel grape bagasse. Chem. Eng. J. 192, 114-121.
Bhattacharya, A.K., Naiya, T.K., Mandal, S.N., Das, S.K. 2008. Adsorption, kinetics and equilibrium studies on removal of Cr(VI) from aqueous solutions using different low-cost adsorbents. Chem. Eng. J. 137(3), 529-541.
Chen, W., Duan, L., Zhu, D. 2007. Adsorption of polar and nonpolar organic chemicals to carbon nanotubes. Environ. Sci. Technol. 41(24), 8295-8300.
Chia, C.H., Gong, B., Joseph, S.D., Marjo, C.E., Munroe, P., Rich, A.M. 2012. Imaging of mineral-enriched biochar by FTIR, Raman and SEM–EDX. Vib. Spectrosc 62, 248-257.
Cuerda-Correa, E.M., Domínguez-Vargas, J.R., Olivares-Marín, F.J., de Heredia, J.B. 2010. On the use of carbon blacks as potential low-cost adsorbents for the removal of non-steroidal anti-inflammatory drugs from river water. J. Hazard. Mater. 177(1–3), 1046-1053.
Dural, M.U., Cavas, L., Papageorgiou, S.K., Katsaros, F.K. 2011. Methylene blue adsorption on activated carbon prepared from Posidonia oceanica (L.) dead leaves: Kinetics and equilibrium studies. Chem. Eng. J. 168(1), 77-85.
Ericson, H., Thorsen, G., Kumblad, L. 2010. Physiological effects of diclofenac, ibuprofen and propranolol on Baltic Sea blue mussels. Aquat Toxicol 99(2), 223-31.
Fang, Q., Chen, B., Lin, Y., Guan, Y. 2014. Aromatic and hydrophobic surfaces of wood-derived biochar enhance perchlorate adsorption via hydrogen bonding to oxygen-containing organic groups. Environ. Sci. Technol. 48(1), 279-288.
Farré, M.l., Pérez, S., Kantiani, L., Barceló, D. 2008. Fate and toxicity of emerging pollutants, their metabolites and transformation products in the aquatic environment. TrAC, Trends Anal. Chem. 27(11), 991-1007.
Freundlich, H.M.F. 1906. Uber die adsorption in lasungen. Z Phys Chem 57, 385–470.
Glaser, B., Parr, M., Braun, C., Kopolo, G. 2009. Biochar is carbon negative. Nature Geosci 2(1), 2-2.
Heberer, T. 2002. Tracking persistent pharmaceutical residues from municipal sewage to drinking water. Journal of Hydrology 266(3), 175-189.
Huerta-Fontela, M., Galceran, M.T., Ventura, F. 2011. Occurrence and removal of pharmaceuticals and hormones through drinking water treatment. Water Res. 45(3), 1432-1442.

184
Ji, L., Liu, F., Xu, Z., Zheng, S., Zhu, D. 2010. Adsorption of pharmaceutical antibiotics on template-synthesized ordered micro- and mesoporous carbons. Environ. Sci. Technol. 44(8), 3116-3122.
Jung, C., Boateng, L.K., Flora, J.R.V., Oh, J., Braswell, M.C., Son, A., Yoon, Y. 2015. Competitive adsorption of selected non-steroidal anti-inflammatory drugs on activated biochars: Experimental and molecular modeling study. Chem. Eng. J. 264, 1-9.
Keiluweit, M., Nico, P.S., Johnson, M.G., Kleber, M. 2010. Dynamic molecular structure of plant biomass-derived black carbon (biochar). Environ. Sci. Technol. 44(4), 1247-1253.
Kilduff, J.E., Karanfil, T., Chin, Y.-P., Weber, W.J. 1996. Adsorption of natural organic polyelectrolytes by activated carbon: a size-exclusion chromatography study. Environ. Sci. Technol. 30(4), 1336-1343.
Lagergren, S. 1898. About the theory of so-called adsorption of soluble substances. Kungliga Svenska Vetenskapsakademiens. Handlingar 24(4), 1-39.
Liu, Y. 2008. New insights into pseudo-second-order kinetic equation for adsorption. Colloids Surf. Physicochem. Eng. Aspects 320(1–3), 275-278.
Lonappan, L., Brar, S.K., Das, R.K., Verma, M., Surampalli, R.Y. 2016a. Diclofenac and its transformation products: Environmental occurrence and toxicity - A review. Environ. Int. 96, 127-138.
Lonappan, L., Pulicharla, R., Rouissi, T., Brar, S.K., Verma, M., Surampalli, R.Y., Valero, J.R. 2016b. Diclofenac in municipal wastewater treatment plant: quantification using laser diode thermal desorption—atmospheric pressure chemical ionization—tandem mass spectrometry approach in comparison with an established liquid chromatography-electrospray ionization–tandem mass spectrometry method. J. Chromatogr. A 1433, 106-113.
Lonappan, L., Rouissi, T., Brar, S.K., Verma, M., Surampalli, R.Y. 2017. Adsorption of diclofenac onto different biochar microparticles : data set- characterization and dosage of biochar Data in Brief Submitted
Lonappan, L., Rouissi, T., Das, R.K., Brar, S.K., Ramirez, A.A., Verma, M., Surampalli, R.Y., Valero, J.R. 2016c. Adsorption of methylene blue on biochar microparticles derived from different waste materials. Waste Manage. (Oxford) 49, 537-544.
Low, M.J.D. 1960. Kinetics of Chemisorption of Gases on Solids. Chem. Rev. 60(3), 267-312.
Nam, S.-W., Choi, D.-J., Kim, S.-K., Her, N., Zoh, K.-D. 2014. Adsorption characteristics of selected hydrophilic and hydrophobic micropollutants in water using activated carbon. J. Hazard. Mater. 270, 144-152.
Nam, S.-W., Jung, C., Li, H., Yu, M., Flora, J.R.V., Boateng, L.K., Her, N., Zoh, K.-D., Yoon, Y. 2015. Adsorption characteristics of diclofenac and sulfamethoxazole to graphene oxide in aqueous solution. Chemosphere 136, 20-26.
Nielsen, L., Biggs, M.J., Skinner, W., Bandosz, T.J. 2014. The effects of activated carbon surface features on the reactive adsorption of carbamazepine and sulfamethoxazole. Carbon 80, 419-432.

185
Önal, Y., Akmil-Başar, C., Sarıcı-Özdemir, Ç. 2007. Elucidation of the naproxen sodium adsorption onto activated carbon prepared from waste apricot: Kinetic, equilibrium and thermodynamic characterization. J. Hazard. Mater. 148(3), 727-734.
Özcan, A.S., Özcan, A. 2004. Adsorption of acid dyes from aqueous solutions onto acid-activated bentonite. J. Colloid Interface Sci. 276(1), 39-46.
Palmer, E.,2012. Top 20 generic molecules worldwide. in: Fiercepharma- Special report, Vol. 2016, FierceMarkets, pp. special report.
Schames, J.R., Henchman, R.H., Siegel, J.S., Sotriffer, C.A., Ni, H., McCammon, J.A. 2004. Discovery of a novel binding trench in HIV integrase. J. Med. Chem. 47(8), 1879-1881.
Sharma, R.K., Wooten, J.B., Baliga, V.L., Lin, X., Geoffrey Chan, W., Hajaligol, M.R. 2004. Characterization of chars from pyrolysis of lignin. Fuel 83(11–12), 1469-1482.
Smith, Y.R., Bhattacharyya, D., Willhard, T., Misra, M. 2016. Adsorption of aqueous rare earth elements using carbon black derived from recycled tires. Chem. Eng. J. 296, 102-111.
Sparks, D.L. 1989. Application of chemical kinetics to soil chemical reactions. in: Kinetics of Soil Chemical Processes, Academic Press. San Diego, pp. 4-38.
Stuart, M., Lapworth, D., Crane, E., Hart, A. 2012. Review of risk from potential emerging contaminants in UK groundwater. Sci. Total Environ. 416, 1-21.
Suriyanon, N., Punyapalakul, P., Ngamcharussrivichai, C. 2013. Mechanistic study of diclofenac and carbamazepine adsorption on functionalized silica-based porous materials. Chemical Engineering Journal 214, 208-218.
Tan, I.A., Ahmad, A.L., Hameed, B.H. 2009. Adsorption isotherms, kinetics, thermodynamics and desorption studies of 2,4,6-trichlorophenol on oil palm empty fruit bunch-based activated carbon. Journal of hazardous materials 164(2-3), 473-82.
Vieno, N., Sillanpää, M. 2014. Fate of diclofenac in municipal wastewater treatment plant — A review. Environ. Int. 69, 28-39.
Westerhoff, P., Yoon, Y., Snyder, S., Wert, E. 2005. Fate of endocrine-disruptor, pharmaceutical, and personal care product chemicals during simulated drinking water treatment processes. Environ. Sci. Technol. 39(17), 6649-6663.
Woolf, D., Amonette, J.E., Street-Perrott, F.A., Lehmann, J., Joseph, S. 2010. Sustainable biochar to mitigate global climate change. Nat Commun 1, 56.
Zhang, J., Lü, F., Zhang, H., Shao, L., Chen, D., He, P. 2015. Multiscale visualization of the structural and characteristic changes of sewage sludge biochar oriented towards potential agronomic and environmental implication. Sci. Rep. 5, 9406.
Zhang, P., Sun, H., Yu, L., Sun, T. 2013. Adsorption and catalytic hydrolysis of carbaryl and atrazine on pig manure-derived biochars: Impact of structural properties of biochars. J. Hazard. Mater. 244–245, 217-224.

186
Table 1: Kinetic parameters for the adsorption of DCF onto biochar microparticles, BC-PW and BC-PM
*BC-PW: Pine wood biochar microparticles, BC-PM: Pig manure biochar microparticles
𝑞𝑒 and 𝑞𝑡 are adsorbed (μg g-1
) DCF on biochar at equilibrium and at time t (min) respectively and 𝑘1 is the rate constant of
adsorption (min−1
). 𝑘2 (g μg-1
min-1
) is the adsorption rate constant of pseudo-second-order adsorption process. 𝛼 is the initial
sorption rate (μg g-1
min-1
) and 𝛽 is the desorption constant (g μg-1
). kid ((μg g-1
min-1/2
) is the intra-particle diffusion rate constant
obtained from the intercept.
Micro-particle sample
qe, experimental
(μg g-1
)
Pseudo-first order model
Pseudo-second order model
Elovich model
Intraparticle diffusion model
qe, cal. (μg g
-1)
k1
(min−1
)
R
2
qe, cal. (μg g
-1)
K2
(g μg-1
min-1
)
R
2
𝛼
(μg g-1
min-1
)
𝛽
(g μg-1
)
R
2
kid
(μg g-1
min-1/2
)
R
2
BC-PW
331
339.7
0.0133
0.938
400
3.82 x 10
-5
0.992
13.87
0.0117
0.9597
38.40
0.982
BC-PM
955
480.83
0.0175
0.937
1000
4.40 x 10
-5
0.991
5.07 x 10
6
0.0179
0.970
674.5
0.977

187
Table 2: Isotherm parameters adsorption of DCF onto biochar microparticles, BC-PW and BC-PM at equilibrium conditions
*BC-PW: pine wood biochar microparticles, BC-PM: Pig manure biochar microparticles
.
Qo and KL are Langmuir constants for adsorption capacity and rate of adsorption, respectively. KF is the adsorption capacity of the
adsorbent and n is the favourability factor of the adsorption. bT is the Temkin constant related to heat of sorption (J mol-1
) and AT is
the Temkin isotherm constant (L g-1
). 𝑞𝑚 is the amount of DCF adsorbed onto per unit dosage of biochar (μg g-1
), 𝑞𝑚 is the
theoretical monolayer sorption capacity (μg g-1
) and 𝛽 is the constant of the sorption energy (mol2 J
-2)
Micro-particle sample
Langmuir isotherm model
Freundlich isotherm model
Temkin isotherm
model
Dubinin- Radushkevich (D-R) isotherm model
Q0
(μg g-1
)
KL
(Lμg−1
)
R
2
KF
(μg g-1
)
n
R
2
AT
( Lμg−1
)
bT
B
R
2
qm
(μg g-1
)
β
(mol2 kJ -2)
E
(kJ mol-1
)
R
2
BC-PW
526.3
1.39x10
-3
0.984
6.774
1.919
0.939
0.027
27.63
89.64
0.924
236.27
0.0005
0.0316
0.735
BC-PM
12500
8.47X10
-4
0.891
16.61
1.145
0.995
0.035
2.023
1224.4
0.878
2184.18
0.0002
0.050
0.773
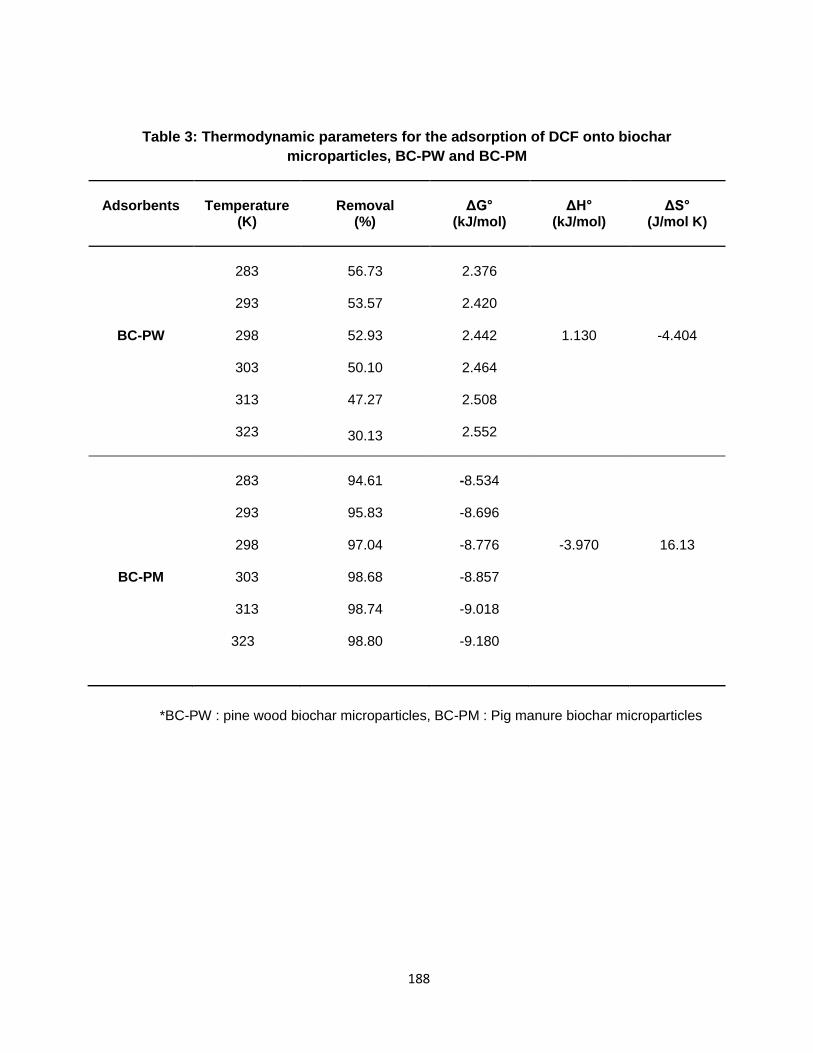
188
Table 3: Thermodynamic parameters for the adsorption of DCF onto biochar
microparticles, BC-PW and BC-PM
Adsorbents
Temperature
(K)
Removal
(%)
ΔG°
(kJ/mol)
ΔH°
(kJ/mol)
ΔS°
(J/mol K)
BC-PW
283
293
298
303
313
323
56.73
53.57
52.93
50.10
47.27
30.13
2.376
2.420
2.442
2.464
2.508
2.552
1.130
-4.404
BC-PM
283
293
298
303
313
323
94.61
95.83
97.04
98.68
98.74
98.80
-8.534
-8.696
-8.776
-8.857
-9.018
-9.180
-3.970
16.13
*BC-PW : pine wood biochar microparticles, BC-PM : Pig manure biochar microparticles

189
Figure 1: Particle size distribution of biochar microparticles

190
Figure 2: Biochar microparticles and diclofenac removal efficiency (BC-PW-R: raw
pinewood biochar, BC-PW-M : pinewood biochar microparticles, BC-PM-R : raw pig
manure biochar, BC-PM-M : pig manure biochar microparticles, AC : activated carbon)

191
Figure 3: Effect of pH and zeta potential on removal efficiency of diclofenac (1 mg L-1
concentration); BC-PW: pine wood biochar, BC-PM: pig manure biochar

192

193
PART 3
ADSORPTION OF DICLOFENAC ONTO DIFFERENT BIOCHAR
MICROPARTICLES: DATASET - CHARACTERIZATION AND
DOSAGE OF BIOCHAR
Linson Lonappan a, Tarek Rouissi a, Satinder Kaur Brar a*, Mausam Verma b, Rao
Y. Surampalli c
a INRS-ETE, Université du Québec, 490, Rue de la Couronne, Québec, Canada G1K 9A9
b CO2 Solutions Inc., 2300, rue Jean-Perrin, Québec, Canada G2C 1T9
c Department of Civil Engineering, University of Nebraska-Lincoln, N104 SEC P.O. Box 886105,
Lincoln, NE 68588-6105, United States
DATA IN BRIEF 16 (2018), 460 - 465

194
RÉSUMÉ
De par leur distribution importante dans les ressources en eau et leur toxicité, les composés
pharmaceutiques et les produits de soins personnels deviennent une préoccupation émergente à
travers le monde. L’application de résidus/déchets pour le traitement des eaux peut être une bonne
stratégie de gestion et de valorisation des déchets. Dans ce document, le jeu de données fourni de
l’information sur l’application du biochar pour l’enlèvement du diclofenac, un contaminant émergent
retrouvé dans les matrices d’eau. Les données présentés dans ce document sont une prolongation
d’un l’article de recherche expliquant les mécanismes d’adsorption du diclofenac sur le biochar .Cet
article de données fourni de l’information générale sur les particularités de surface des biochar de
bois de pin et de fumier de cochons mesurées avec un SEM et un FTIR. Ce jeu de données fourni
aussi de l’information sur les profiles XRD des biochars de bois de pin et de fumier de cochon. De
plus, différentes concentration de biochars ont été utilisées au cours de cette étude pour réduire une
concentration fixe de diclofenac et les résultats sont présentés dans ce jeu de données.
Mots clés : Adsorption; diclofenac; biochar; caractérisation

195
ABSTRACT
Due to its wide occurrence in water resources and toxicity, pharmaceuticals and personal care
products are becoming an emerging concern throughout the world. Application of residual/waste
materials for water remediation can be a good strategy in waste management as well as in waste
valorization. Herein, this dataset provides information on biochar application for the removal of
emerging contaminant, diclofenac from water matrices. The data presented here is an extension of
the research article explaining the mechanisms of adsorption diclofenac on biochars [1]. This data
article provides general information on the surface features of pine wood and pig manure biochar
with the help of SEM and FTIR data. This dataset also provides information on XRD profiles of pine
wood and pig manure biochars. In addition, different amounts of biochars were used to study the
removal of a fixed concentration of diclofenac and the data is provided with this data set.
Keywords: Adsorption; diclofenac; biochar; characterization

196
Specifications
Subject area
Chemistry/Chemical engineering
More specific subject area
Adsorption, Surface Chemistry, Environmental Engineering
Type of data
Table, image (XRD, SEM)), text file, figure(FTIR)
How data was acquired
SEM: Zeiss Evo®50 Smart SEM FTIR: Perkin Elmer, Spectrum RXI, FT-IR instrument fitted with lithium tantalate (LiTaO3) detector XRD: Panalytical Empyrean XRD with monochromatized CuK alfa radiation (1.5418 A). LDTD-MS/MS: Concentrations of diclofenac was measured using LDTD-APCI (atmospheric pressure chemical ionization) source (LDTD T-960, Phytronix Technologies, Quebec, Canada) mounted on a TSQ Quantum access triple quadruple mass spectrometer (Thermo Scientific, Mississauga, Ontario, Canada)
Data format
Pre-processed and analyzed
Experimental factors
Biochar samples (from pinewood and pig manure) were grounded to obtain microparticles and the data here is given is for characterization of biochar. Moreover, data for dosage effect of biochar on adsorption for diclofenac is given.
Experimental features
Characterization data of biochar microparticles obtained from SEM, XRD, and FTIR are given. Adsorption studies were carried out for the removal of diclofenac using biochar microparticles. Various biochar dosages ranging from 1g L
-1to 20
g L-1
were tested.
Data source location
Bioprocessing and NanoEnzyme Formulation Facility (BANEFF), INRS-
ETE, Université du Québec, 490, Rue de la Couronne, Québec, Canada
G1K 9A9

197
Data accessibility
Data presented in this article
Related research article
The associated research article related to this data set is [1]
Value of the data
Characterization data for biochar derived from two different feedstock (pine wood and pig
manure) are given.
Dataset provides an insight to the surface features of biochar.
Dataset gives information on the adsorption capacity of biochar for emerging contaminant
diclofenac.
Dataset would be useful to identify the dosage effect of biochar on the adsorption of
diclofenac.
1. Data
The dataset comprises characterization as well as experimental data. Figure 1 presents the
scanning electron micrographs (SEM) of pine wood and pig manure biochar microparticles. Figure 2
presents Fourier-transform infrared spectroscopy (FTIR) images of biochar microparticles. Figure 3
presents X-ray Diffraction (XRD) images of biochar microparticles. Table 1shows the effect of
adsorbent dosage on the removal of diclofenac and removal efficiency.
2. Experimental Design, Materials and Methods
2.1 Biochar microparticle preparation
Two types of biochars were prepared from pinewood and pig manure and named as BC-PW and
BC-PM, respectively. Preparation of biochar and microparticles are explained elsewhere [1, 2].

198
2.2 Characterization of biochar microparticles
Scanning electron micrographs of the biochar microparticles are recorded using Zeiss Evo®50
Smart SEM system. FTIR spectra of the adsorbents were recorded using Perkin Elmer, Spectrum
RXI, FT-IR instrument fitted with lithium tantalate (LiTaO3) detector. XRD spectra of the adsorbents
were recorded using Panalytical Empyrean XRD fitted with monochromatized CuK alfa radiation
(1.5418 A).
2.3 Adsorption studies
Adsorption studies were carried out using 50 mg ( 1 g L-1) , 0.1g (2 g L-1), 0.3g (6 g L-1), 0.5g (10 g
L-1), 0.7g (14 g L-1) and 1g (20 g L-1) of biochar samples with 50 mL of 500 µg L-1 of diclofenac
(DCF). Batch adsorption studies were carried out in an INFORS HT - multitron standard shaking
incubator (INFORS, Mississauga, Canada). Experimental conditions are as follows - shaking speed:
200 rpm; temperature: 25 ±1°C, pH: 6.5, centrifugation ( after adsorption studies): at 11600 x g for
10 minutes in a MiniSpin® plus centrifuge. The supernatant was analyzed for remaining DCF using
LDTD-MS/MS [3].
It was observed that for both BC-PW and BC-PM, increasing the adsorbent dosage considerably
enhanced the removal efficiency. BC-PM possessed better adsorbent properties than BC-PW and
showed higher potential for the removal of DCF compared to BC-PW. With a dosage of 2 g L-1, BC-
PM achieved a removal efficiency of 95.87 % and above 2 g L-1 dosage level, BC-PM always
achieved nearly 100% removal efficiency. For BC-PW, removal efficiency increased from 43 % to
98.8% with a dosage varying from 2 to 20 g L-1. However, the adsorption amount (µg g-1) on
biochar decreased with increase in adsorbent dosage. This observation can be explained as a
consequence of partial aggregation of biochar at higher concentrations of biochar which will
decrease the active sites on the surface of biochar [4, 5]. Adsorbent dosage experiment was carried
199
out at equilibrium time and samples were drawn. In the case of BC-PW, the complete removal might
have been obtained during any time of the adsorption. Therefore, adsorption amount cannot be
considered as the equilibrium adsorption capacity of the biochar BC-PM. As shown in Fig. 1, porous
structure of biochars probably had a positive effect on the adsorption of DCF [6]. Moreover, as
shown in Fig 2, both biochars are rich in surface functional groups which in turn can facilitate the
adsorption.
Acknowledgements
The authors are sincerely thankful to the Natural Sciences and Engineering Research Council of
Canada (Discovery Grant 355254 and NSERC Strategic Grant) and Ministère des Relations
Internationales du Québec (coopération Québec-Catalanya 2012-2014; project 07.302). We would
like to thank Prof. Christian Roy (Pyrovac Inc., Quebec) and Dr. Stéphane Godbout (IRDA, Quebec)
for providing biochar samples. We would like to acknowledge Dr. Kshipra Misra (Defense Institute of
Physiology and Allied Sciences (DIPAS), India) for analytical supports.

200
References
[1] L. Lonappan, T. Rouissi, S.K. Brar, M. Verma, R.Y. Surampalli, An insight into the adsorption of diclofenac on different biochars: mechanisms, surface chemistry and thermodynamics, Bioresource Technology (2017).
[2] L. Lonappan, T. Rouissi, R.K. Das, S.K. Brar, A.A. Ramirez, M. Verma, R.Y. Surampalli, J.R. Valero, Adsorption of methylene blue on biochar microparticles derived from different waste materials, Waste Management 49 (2016) 537-544.
[3] L. Lonappan, R. Pulicharla, T. Rouissi, S.K. Brar, M. Verma, R.Y. Surampalli, J.R. Valero, Diclofenac in municipal wastewater treatment plant: quantification using laser diode thermal desorption—atmospheric pressure chemical ionization—tandem mass spectrometry approach in comparison with an established liquid chromatography-electrospray ionization–tandem mass spectrometry method, J. Chromatogr. A 1433 (2016) 106-113.
[4] M.A. Hanif, R. Nadeem, H.N. Bhatti, N.R. Ahmad, T.M. Ansari, Ni(II) biosorption by Cassia fistula (Golden Shower) biomass, J. Hazard. Mater. 139(2) (2007) 345-355.
[5] H. Hu, B. Jiang, J. Zhang, X. Chen, Adsorption of perrhenate ion by bio-char produced from Acidosasa edulis shoot shell in aqueous solution, RSC Advances 5(127) (2015) 104769-104778.
[6] C. Jung, L.K. Boateng, J.R.V. Flora, J. Oh, M.C. Braswell, A. Son, Y. Yoon, Competitive adsorption of selected non-steroidal anti-inflammatory drugs on activated biochars: Experimental and molecular modeling study, Chemical Engineering Journal 264 (2015) 1-9.
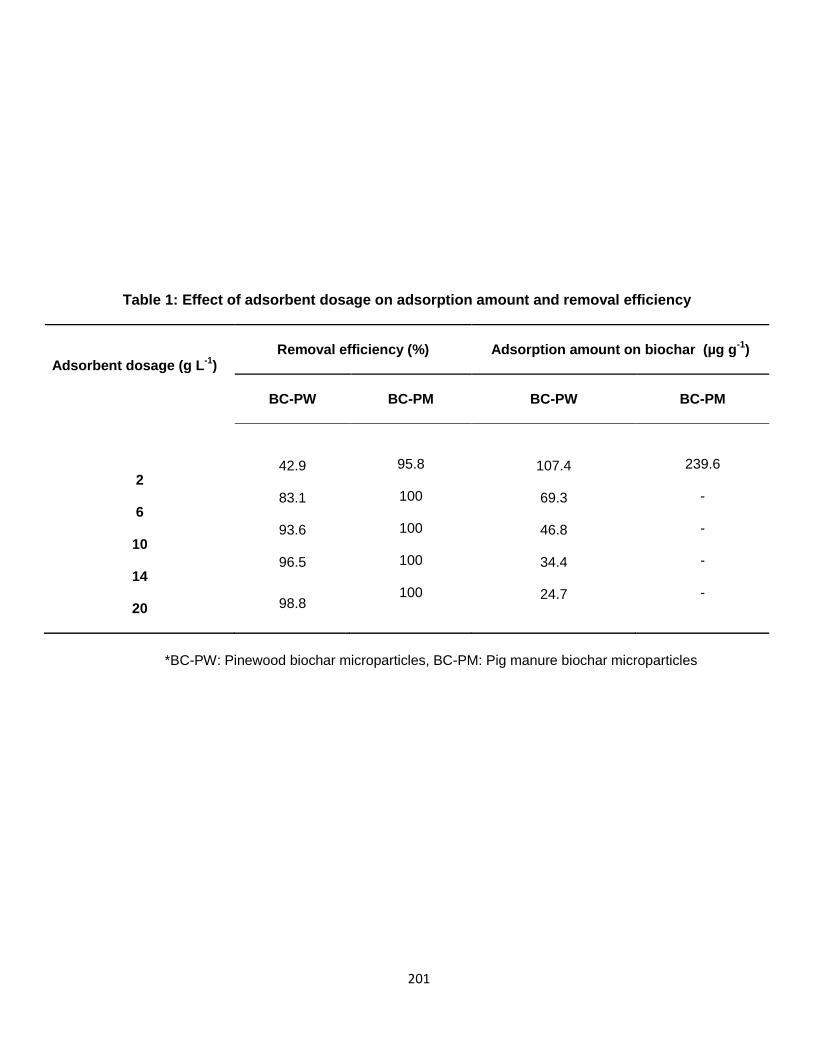
201
Table 1: Effect of adsorbent dosage on adsorption amount and removal efficiency
Adsorbent dosage (g L-1
)
Removal efficiency (%)
Adsorption amount on biochar (µg g
-1)
BC-PW
BC-PM
BC-PW
BC-PM
2
6
10
14
20
42.9
83.1
93.6
96.5
98.8
95.8
100
100
100
100
107.4
69.3
46.8
34.4
24.7
239.6
- - - -
*BC-PW: Pinewood biochar microparticles, BC-PM: Pig manure biochar microparticles

202
Figure 1: Scanning electron micrographs of biochar: (A) Pinewood biochar (BC-PW), (B)
Pig Manure biochar (BC-PM)

203
Figure 2: Fourier transform infra-red spectra and of biochar; BC-PW: pine wood biochar,
BC-PM: pig manure biochar

204
Figure 3: X-ray diffraction curve of biochar; BC-PW: pine wood biochar, BC-PM: pig manure biochar

205
PART 4
DEVELOPMENT OF BIOCHAR BASED GREEN FUNCTIONAL
MATERIALS USING ORGANIC ACIDS FOR THE REMOVAL OF
DICLOFENAC
Linson Lonappan a, Yuxue Liu a,b, Tarek Rouissi a, Satinder Kaur Brar a*, Mausam
Verma C, Rao Y. Surampalli d
a INRS-ETE, Université du Québec, 490, Rue de la Couronne, Québec, Canada G1K 9A9
b Institute of Environment Resources, Soil and Fertilizer, Zhejiang Academy of Agricultural
Sciences, 198 Shiqiao Road, Hangzhou 310021, P.R China
c CO2 Solutions Inc., 2300, rue Jean-Perrin, Québec, Canada G2C 1T9
d Department of Civil Engineering, University of Nebraska-Lincoln, N104 SEC P.O. Box 886105,
Lincoln, NE 68588-6105, United States
JOURNAL OF HAZARDOUS MATERIALS (UNDER REVIEW)

206
RÉSUMÉ
Les groupes fonctionnels de surface sur le biochar sont un des caractères clé pour déterminer les
propriétés des biochars et leurs applications potentielles. Les études précédentes ont étudié
l’amélioration des propriétés du biochar durant la production (pyrolyse) ou par activation en utilisant
des acides minérales. Dans cette étude, les biochar obtenus de différentes sources, telles que le
bois de pin, le fumier de porc et les coquilles d’amande, ont été fonctionnalisés en utilisant des
acides organiques (acide acétique, acide citrique, acide tartrique, acide oxalique et acide malique).
Deux méthodes de fonctionnalisation ont été comparées avec différentes concentrations d’acides
organiques. Une par mélange d’une durée de 12h à température pièce et l’autre en chauffant à
121°C à l’autoclave pendant 20 min. Pour le biochar de bois de pin, l’acide citrique et l’acide
acétique ont présenté la meilleure efficacité et l’acide citrique s’est montré plus efficace pour greffer
des groupements –COOH (amélioration de 40%). Les acides tartrique, oxalique et citrique se sont
montré efficace basé sur les données de FTIR avec le biochar de fumier de porc. Cependant, l’effet
des acides est minimal pour la fonctionnalisation. Similairement, les acides citrique et oxalique ont
été efficaces avec le biochar de coquille d’amande. Un simple mélange au cours d’une période
prolongée s’est avéré plus efficace que l’autoclavage à haute température pour une courte période.
La fonctionnalisation à l’acide citrique a augmenté le nombre total de groupes fonctionnels par
23.6%, 10.2% et 26.2% pour les biochars de bois de pin, de fumier de porc et de coquille d’amande,
respectivement. Les biochar fonctionnalisé avec l’acide citrique ont présentés un enlèvement
supérieur du diclofenac à des concentrations environnementales appropriées (500 µg L-1
). Pour le
biochar de bois de pin, l’enlèvement du diclofenac est passé de 65% à 80%. Pour le biochar de
coquille d’amande, sous des conditions similaires, l’enlèvement du diclofenac est passé de 58% à
84%.
Mots clés : Biochar; acide organique; fonctionnalisation; adsorption; diclofenac; acide carboxylique
207
ABSTRACT
Surface functional groups on biochars are one of the key features which determine biochar
properties and their potential applications. Previous studies investigated improving properties of
biochar during the production (pyrolysis) or by activation using minerals acids. In this study, biochars
obtained from various feedstocks, such as pine wood, pig manure, and almond shell were
functionalized using organic acids, such as acetic acid, citric acid, tartaric acid, oxalic acid and malic
acid. Two methods of shaking overnight at room temperature and heating at 121°C for 20 minutes
using an autoclave were tested and compared along with various concentrations of organic acids.
For pinewood biochar, citric and acetic acids were found to be effective and citric acid was more
efficient in terms of grafting –COOH groups (40% improvement). Tartaric, oxalic and citric acids
were found to be effective based on FTIR data for pig manure biochar; however, the effect of acids
was minimal on functionalization. Similarly, citric and oxalic acids were found to be effective for
almond shell biochar. Simple shaking over a long period was found to effective over autoclaving at
high temperature for short period. Citric acid functionalization increased total acidic functional groups
by 23.6 %, 10.2 %, and 26.2 %, respectively for pine wood, pig manure and almond shell. Citric acid
functionalized biochars showed higher removal of the environmentally relevant concentration (500
µg L-1
) of emerging contaminant, diclofenac. For pinewood biochar, at equilibrium diclofenac removal
increased from 65 to 80 %. For almond shell biochar, under similar conditions, the diclofenac
removal efficiency increased from 58 to 84 %.
Keywords: Biochar; Organic acids, Functionalization; Adsorption; Diclofenac; Carboxylic acid
208
1. Introduction
Biochar is a carbon-rich material produced through pyrolysis of various feedstock ranging from
agricultural residues to organic waste materials. For the past decades, application of biochar as a
method for mitigating global warming is steadily increasing (Woolf et al., 2010). Moreover,
preparation of biochar from waste materials is an excellent method of waste management and
valorization (Lonappan et al., 2016b). The diversity of biochar application ranges from carbon
sequestration, soil improvement and decontamination of various pollutants from the soil as well as
drinking/wastewater. Physico-chemical properties of biochar are the key factors while choosing its
applicability and which depends on pyrolysis conditions and the feedstock selection (Méndez et al.,
2009; Mohan et al., 2014; Sharma et al., 2004). The mechanism and processes behind the formation
of various functional groups during carbonization/pyrolysis is still being debated. However, studies
have suggested that carbonization is a dehydroxylation/dehydrogenation and aromatization process
involving the cleavage of O-alkylated carbons and anomeric O-C-O carbons along with the formation
of fused-ring aromatic structures and aromatic C-O groups(Li et al., 2013). High-temperature
pyrolyzed biochar is known to have higher number of surface functional groups (Jindo et al., 2014; Li
et al., 2013). It is rather difficult to engineer pyrolysis for specific functional groups on the biochar
surface than focusing on obtaining a better surface area and porosity. Thus, modifying biochar after
production can be an effective method for grafting specific surface functional groups on biochar
surface.
Achievement of desired physicochemical properties, such as high porosity, high surface area, and
specific surface functional groups are often laden with challenges. Therefore, several studies
proposed a pre-treatment/activation/ functionalization steps of biochar before the desired application
to enhance biochar effectiveness (Liu et al., 2015; Lonappan et al., 2017; Qian et al., 2007; Tan et
al., 2009; Yan et al., 2013). Majority of these studies focused on increasing the surface area during
activation, either more functional groups are added to the surface or certain functional groups will be
removed (A and Hegde, 2015; Mohamad Nor et al., 2013). In general, chemical activation involves

209
mineral acids raising toxicological and environmental concerns. Activation is generally energy and
cost-intensive. In addition, application of hazardous materials, such as mineral acids (for activation),
which is the most commonly used, are challenged based on the “green chemistry principles” since
biochar was already considered as a sustainable material(Liu et al., 2015; Naghdi et al., 2017).
Application of organic acids can be an effective method to graft specific functional groups, such as
carboxylic acid (-COOH) groups on biochar surface. Organic acids are produced by the catabolism
of amino acids and are intermediates in metabolic pathways. Due to their biological origin, the
organic acids can serve as green and sustainable material (Fischer and Bipp, 2005; Khan and Iqbal,
2016; Sauer et al., 2008).
It is hypothesized that carboxylic acids can functionalize the biochar surface. Carboxyl functional
groups are known to be effective in adsorbing/stabilizing several contaminants, such as heavy
metals (Uchimiya et al., 2012), pharmaceuticals (Guedidi et al., 2017) etc. Moreover, apart from
adsorption, biochar with the copious presence of carboxylic groups on the surface can be effectively
used forvarious other applications including catalysis, biochar supported nanostructures, energy
storage etc. (Liu et al., 2015). In this study, biochar produced from feedstock, such as pine wood, pig
manure, and almond shell were functionalized using acetic acid (CH3COOH), citric acid (C6H8O7),
tartaric acid (C4H6O6), oxalic acid (C2H2O4) and malic acid (C4H6O5). Two functionalization methods,
simple shaking overnight at room temperature and autoclaving (at 121°C and 15 psi for 20 minutes)
were tested and compared for the effectiveness of functionalization in terms of grafting biochar
surface with –COOH groups. Various concentrations (molarities) of organic acids were also tested.
Functionalization using organic acids followed several principles of green chemistry including
prevention; less hazardous chemical syntheses; designing safer chemicals; safer solvents and
auxiliaries and the use of renewable feedstocks. Functionalized biochar(s) obtained under optimal
conditions were tested for the adsorption of micropollutant, diclofenac (DCF) and the effectiveness of
removal (adsorption) was studied based on the –COOH group attached to the biochar surface.
Diclofenac was selected as the model contaminant since it is one of the top 20 generic molecules

210
sold worldwide and considered an emerging contaminant present in wastewater (Lonappan et al.,
2016a). To the best of our knowledge, the organic acids have never been used for the
functionalization of biochars and hence entail the novelty element of the present study.
2. Materials and Methods
2.1 Materials
Pinewood and almond shell biochar samples were obtained from Pyrovac Inc. (Quebec, Canada).
Pinewood biochar (BC-PW) was derived from pine white wood (80% v/v) spruce and fir (20% v/v)
and was produced at 525±1°C under atmospheric pressure by increasing the temperature of
biomass at the rate of 25 °C min-1
in the presence of nitrogen. Almond shell biochar (BC-AS) was
produced from almond shells through pyrolysis under atmospheric pressure at 520±1°C for 4h. Pig
manure biochar (BC-PM) was a gift sample from Research and Development Institute for Agri-
Environment” (IRDA), Quebec, Canada. BC-PM was derived from the solid fraction of pig slurry and
prepared at 400±1 °C for 2 h. All the biochars were ground and sieved to make biochar
microparticles of less than 75 μm and the detailed procedure was given in previous publications
(Lonappan et al., 2016b; Lonappan et al., 2017). This pre-treatment procedure produced compact,
almost uniformly sized (distributed) biochar with an increased surface area.
Acetic acid, citric acid, tartaric acid, oxalic acid and malic acid was obtained from Fisher Scientific
(Ottawa, ON, Canada). Diclofenac sodium salt (98%; CAS 15307-79-6) was purchased from Fisher
Scientific (Ottawa, ON, Canada) and internal standard (IS), diclofenac-d4 was obtained from C/D/N
Isotopes Inc. (Montreal, QC, Canada). Experiments were carried out in Milli-Q water and prepared
using Milli-Q/Milli-RO Millipore system (Milford, MA, USA).

211
2.2 Methods
2.2.1 Functionalization of biochar
Various concentrations of organic acids were tested for effective functionalization of biochars. The
concentrations used for various acids are given in Table 1. The solubility of the acid salts at ambient
temperature was the major criterion while selecting the molarities.
Two methods were employed for the functionalization of biochars:shaking at room temperature and
autoclaving. In the shaking method, 2 g biochar was mixed with 50 mL of respective organic acid
(with specific concentration -dissolved in milliQ water) and mixed for 24 hours in an INFORS HT -
multitron standard shaking incubator (INFORS, Mississauga, Canada) at 150 rpm. In the autoclave
method, 50 mL organic acid was mixed with 2 g of biochar and vortexed for 5 minutes. Later, the
mixture was autoclaved at 121±1 C and, 15 psi for 20 minutes (Heidolph™ Tuttnauer™ Vertical Top-
Loading Autoclave). After autoclaving, the biochar-acid mixture was cooled to room temperature for
15 minutes.
The biochar-acid mixture obtained after both procedures was centrifuged at 3000 x g for 15 minutes.
The excess acid was removed, and the biochar was washed using 15 mL milli-Q water (vortexing
milli-Q water-biochar mixture). This procedure was repeated three times to ensure the complete
removal of organic acids. After the washing procedure, the biochar was dried in a hot air oven (60± 1
C) overnight. The obtained biochar was subjected to characterization and was used for the
adsorption of DCF.
2.2.2 Characterization of functionalized biochar
Particle size distribution of raw and biochar microparticles was measured using Horiba particle size
analyzer (LA-950 Laser Particle Size Analyzer, Horiba, Japan).

212
Scanning electron micrographs of the functionalized biochars were obtained from EVO®
50 smart
scanning electron microscope (SEM) (Zeiss, Germany). Surface functional groups of functionalized
biochars were identified using Nicolet iS50 FT-IR Spectrometer (Thermo Scientific, USA). Elemental
composition (C, H, N, and S) of functionalized biochars were quantified using an elemental analyzer
(TruSpec® Micro-CHN, Michigan, USA). The oxygen (O) content (approximately) was calculated by
subtracting C, N, H, and S contents from the total biochar mass. The surface charge properties of
biochars were measured by zeta potential measurements, using a Nano-ZS Zetasizer (Malvern
Instruments Inc., UK) in de-ionized water. Samples with suitable FTIR peaks corresponding to –
COOH groups (Table 3) were subjected to acid-base titration to find out total acidity capacity (TAC)
and the experiment was carried out as described by (Chen and Wu, 2004; Hu et al., 2001) and the
results are presented in Table 3 in mmolg-1
of biochar. Initially, 50 mg of raw and acid treated
biochars were shaken with 25 mL, 0.01 M NaOH for 2 days in a 50-mL sealed Eppendorf tubes. The
excess NaOH left in the solution was determined by titrating against 0.01M HCl.
2.2.3 Batch adsorption studies using functionalized biochars
Batch adsorption studies were carried out in 125 mL conical flasks with 50 mL of DCF solution in an
INFORS HT - multitron standard shaking incubator (INFORS, Mississauga, Canada). Agitation
speed was always set at 200 rpm. The temperature was set to be 25 ±1°C and the pH was set at 6.5
(DCF solution). About 0.1 g of biochar was used for the adsorption of DCF. Concentrations of 500 µg
L-1
and 10 mg L-1
of DCF were used and the biochar-DCF mixture was shaken for 5 h. Afterwards,
the biochar was separated from the mixture by centrifugation at 11,600 x g for 10 minutes in a
MiniSpin® plus centrifuge. After the centrifugation step, the supernatant was analyzed for DCF left in
the liquid.
The adsorption capacity at time t (in μg g−1
) was calculated using Equation 1:
𝑞𝑡 = 𝑉(𝐶0 − 𝐶𝑡) 𝑤⁄ ----------------------------------------------------------- (1)

213
Percentage of DCF removal at time,‘t’ was calculated using Equation 2:
% 𝑟𝑒𝑚𝑜𝑣𝑎𝑙 (%𝑅) = {(𝐶0−𝐶𝑒
𝐶0) 100}----------------------------------------- (2)
Where, C0, Ct, and Ce represent the concentrations of DCF (mg L-1
) at the beginning of the
experiment, at time t (min), and at equilibrium, respectively; V is the volume of the solution used for
the study (L); and w is the mass of biochar used (g).
2.2.4 DCF Analysis
Analysis of DCF was performed by LDTD-MS/MS technique as described by Lonappan et. al
(Lonappan et al., 2016a). The analytical set-up consisted of LDTD-APCI (Laser diode thermal
desorption-atmospheric pressure chemical ionization) source (LDTD T-960, Phytronix Technologies,
Quebec, Canada) mounted on a TSQ Quantum access triple quadruple mass spectrometer (Thermo
Scientific, Mississauga, Ontario, Canada). Diclofenac-d4 was used as the internal standard and
quantification of DCF was carried out with the help of a calibration curve (1-1000 µg L-1
).
2.2.5 Statistical analysis
All of the adsorption related experiments were carried out in duplicates. Data presented are the
mean values with standard deviation (±SD). Statistical significance of the measured values was
analyzed using one-way ANOVA and analysis carried out with 95% confidence level using
Sigmaplot, version 11.0 (Systat Software Inc., Germany) and the results which had p < 0.05 were
considered as significant.

214
3. Results and discussion
3.1 Characterization of non-functionalized and functionalized biochars
Particle size distribution of biochars as obtained and micro-biochars are given in Fig.1. The mean
particle size of the particles was recorded to be ≈36.3 µm, ≈30.6 µm, and ≈ 32.6 µm, respectively for
BC-PW, BC-PM AND BC-AS. Particle size usually plays important role in properties, such as surface
area, zeta potential etc. Moreover, according to IUPAC (The International Union for Pure and
Applied Chemistry), particles having less than 100 µm, are microparticles (Lonappan et al., 2016b;
Vert et al., 2012). In this study, the particles used were clearly microparticles. Moreover, after
organic acid treatment, the samples were also subjected to particles size measurements. After
organic acid treatment and consecutive drying, the micro-biochars were mostly agglomerated (data
not shown). All the micro-biochars were having pH values ranging from 8.5-10 and mixing with
organic acids might have changed the surface charges. This can be due to the agglomeration of
micro-biochars after functionalization.
Figure 2 presents the scanning electron micrographs of micro-biochar and representative images
from biochar functionalized using citric acid. For pinewood biochar, the surface texture remained the
same; however, a more porous structure was observed. Previously, similar results were observed for
activation using phosphoric acid (Shamsuddin et al., 2016). Moreover, in comparison with raw micro-
biochar, the porous structures were more visible after acid treatment for all the biochars under study
and this could be due to the removal of impurities by acid washing (Gai et al., 2014). However, the
BC-PM biochar particles became clustered after citric acid treatment as observed through
micrographs. Further, this observation can be attributed to the change in zeta potential (Table 3).
Zeta potential changed from -39.8 mV to 3.1 mV after citric acid treatment. This change in surface
charges might have affected the charge distribution and density resulting in agglomeration of micro-
biochar.

215
3.2 Functionalization effect on different Biochars
Figures 3, 4 and 5 present the FTIR spectra of functionalized pine wood, pig manure, and almond
shell biochars, respectively using various acids by different methods. An FTIR image on the left-
hand side represents the results of functionalization by autoclaving whereas FTIR images on the
right-hand side show functionalization effects by shaking method. PW, PM and AS represents the
raw untreated pinewood, pig manure, and almond shell biochars and the number represents the
molarity of the acid used. In each notation, the first letter stands for the acid; A- acetic acid, C- citric
acid, M- maleic acid, O- oxalic acids and T- tartaric acid. The second letter in each notation stands
for autoclave or shaking method, respectively by A and S. Correlation between FTIR results, effect
of organic acids and changes in biochars surfaces has been explained in detail in the sections
following this section.
Table 2 presents the changes in the elemental composition of biochars before and after treatment
with various organic acids. In Table 3, results related to zeta potential, total acidic functional groups
and percent changes in FTIR peaks of biochars before and after citric acid treatment have been
tabulated.
3.2.1 Pinewood biochar
Previous studies reported similar FTIR profile as shown in Fig. 3 for the biochars derived from pine
wood (Domingues et al., 2017). Pinewood derived biochars are usually rich in –OH groups (at 3400
cm−1
) from H2O as well as from phenolic components), aliphatic functional groups and -CO
(oxygenated functional groups of cellulose, hemicellulose, and methoxy groups of lignin) (Bruun et
al., 2011; Domingues et al., 2017; Pradhan and Sandle, 1999). Treating pinewood biochar with
acetic acid at high temperatures (autoclaving) did not lead to significant changes in the biochar
surface chemistry. However, with simple shaking, a broad and strong peak was observed around
3300 cm-1
and which can be attributed to the O-H stretching possibly due to the formation of
carboxylic acid groups (George et al., 1971; Max and Chapados, 2004; Ojamäe et al., 2006).

216
Furthermore, a noticeable increase in peak intensity was observed after shaking with acetic acid and
which could be due to the increase in -COOH groups (Table 3). About 30% difference in peak
intensity was observed and which can be directly correlated to approximately 30% increase in -
COOH groups. Previous studies have also demonstrated the ability of oxidizing agents, such as
acids on the introduction of surface oxygen complexes on carbons(Pradhan and Sandle, 1999).
However, concentration (molarity) effect was minimal for acetic acid (approximately 30 % difference
in peak intensities with all molarities) for the functionalization of BC-PW. A similar observation was
made for citric acid as well. Instead of autoclaving, simple shaking resulted in a better result with
citric acid. With citric acid and under shaking conditions, about 40% difference in peak intensity was
observed and which can be directly correlated to approximately 40% increase in -COOH groups.
Similarly, previous studies also demonstrated the semi-quantification of functional groups using FTIR
(Haberhauer et al., 1998; He et al., 2018). Thus, organic acid treatment/functionalization required
extended contact periods than intense reaction conditions, such as high temperature.
Activation/mineral acid treatments are usually being carried out at very high temperatures and for a
very short period (Pradhan and Sandle, 1999; Shamsuddin et al., 2016; Tan et al., 2015).The
molarity of citric acid used had a positive impact on the grafting of COOH groups on the surface of
BC-PW. With high concentrations of citric acid, an increase in the intensity of the COOH peaks was
observed. For malic acid also, simple shaking resulted in better peak intensities. However, specific
COOH functional groups on biochar surface were not identified with malic acid treatment. The same
behavior as the malic acid was observed with oxalic acid and tartaric acid for BC-PW. Variation in
elemental composition was observed in almost all samples. In most of the cases, differences in “O”
content can be attributed to the formation of COOH group on biochar surface. Previous studies also
observed introduction of surface oxygen complexes with acid treatment (Pradhan and Sandle, 1999;
Shamsuddin et al., 2016). Moreover, as described in Table 3, considerable changes in properties,
such as zeta potential and quantity of total acid functional groups further provided insight into the
quantifiable effects of functionalization(Rouissi et al., 2011). For instance, 23.6% increase in total
acidic functional groups was observed after citric acid functionalization. It has been reported that,

217
similar changes can significantly improve the biochar properties for several applications ranging from
environmental remediation to energy storage and catalytic applications (Liu et al., 2015).
3.2.2 Pig manure biochar
A mixture of complex functional groups mainly composed of mineral and organic matter along with
the presence of heavy metals can be observed in biochar derived from pig manure (Lonappan et al.,
2017; Tsai et al., 2012). The similar observation was made with FTIR spectrum of BC-PM in this
study. From Fig.4, it can be observed that autoclaving or shaking with acetic acid did not make a big
difference in the biochar surface chemistry in comparison with the untreated biochar. However, with
citric acid, changes in peak intensities were observed even though the formation of new peaks or
peaks corresponding to COOH groups was not observed. The same trend was observed with malic
acid as well no significant change in surface chemistry was observed. From FTIR spectra, oxalic
acid was found to be effective for the functionalization of pig manure biochar. Peaks in FTIR
spectrum became much more visible and peak intensities increased while treating with oxalic acid.
Between autoclaving and shaking, shaking method was found to be effective for the
functionalization. Moreover, while shaking, a high concentration of oxalic acid turned out to be better.
This was further confirmed by the elemental composition (Table 2). About 42 %, oxygen was present
in the initial raw pig manure biochar and, which was decreased with most of the functionalization
methods. This factor points out the possibility of the addition of COOH groups on biochar.
Nevertheless, with oxalic acid, nearly 40 % oxygen was observed after functionalization which points
towards the possibility of preservation/addition of further COOH groups on biochar surface. On the
other hand, functionalization using tartaric acid did not lead to any changes in surface functional
groups.. The previous study on adsorption of carbaryl and atrazine on pig manure-derived biochars
proved a significant increase in surface area and pore volume after treatment with HCl (Zhang et al.,
2013).In addition, comparing with other two biochars, organic acids had minimal functionalization
effect on pig manure biochar. As tabulated in Table 4, only about 10% increase in total acid
functional groups was observed after citric acid functionalization with pig manure biochar whereas,

218
with other two biochars, it was more than 20%. These results were further confirmed by the minimal
to no change in peak intensities in FTIR spectra (Fig.4).
3.2.3 Almond shell biochar
From Fig.5, it is evident that neither autoclaving nor shaking with acetic acid result in a huge
difference in the biochar surface chemistry in comparison with the untreated biochar. However, while
shaking with citric acid, a broad and strong peak was observed around 3300 cm-1
and which can be
attributed towards the O-H stretch due to the formation of carboxylic acid groups. Furthermore, the
intensity of the peaks increased after shaking with acetic acid and which could be due to the
increase in COOH group. Instead of autoclaving, simple shaking gave better result with citric acid.
Approximately 45% increase in peak intensity was observed under shaking conditions with 0.5 M
citric acid. On performing semi-quantification with FTIR data, approximately 45% increase in –COOH
groups was observed. (Haberhauer et al., 1998; He et al., 2018) Moreover, the molarity of citric acid
used had a negative impact on the grafting of COOH groups on the surface of pine wood biochar. A
0.5 M citric acid was found to effective for optimal functionalization from peak intensities in FTIR
spectrum. For malic acid and oxalic acid also, simple shaking resulted in better peak intensities.
However, specific COOH functional groups on biochar surface were not identified with malic and
oxalic acid treatments. Also, tartaric acid was not effective agent for functionalization: peak
intensities were almost similar in comparison with untreated biochar. However, a peak around 2400
cm-1
was observed and which was attributed towards the presence of aldehyde groups. From Table
2, small variations in elemental composition were observed in almost all samples. However, these
very small differences cannot be attributed to the presence of any surface functional groups. For
most of the cases, differences in “O” content can be due to the formation of COOH groups on the
biochar surface. Moreover, 26.2% increase in total acidic functional groups were observed after citric
acid functionalization (2M; under shaking conditions) and which further confirmed the quantifiable
effects of functionalization.
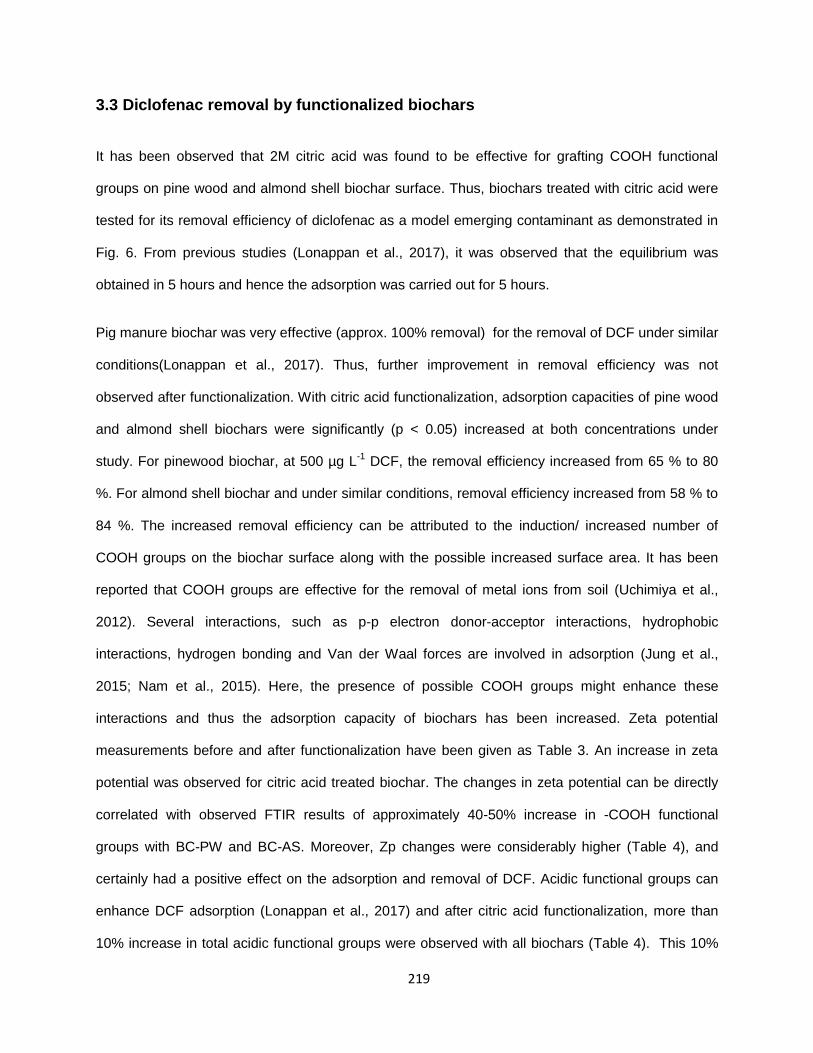
219
3.3 Diclofenac removal by functionalized biochars
It has been observed that 2M citric acid was found to be effective for grafting COOH functional
groups on pine wood and almond shell biochar surface. Thus, biochars treated with citric acid were
tested for its removal efficiency of diclofenac as a model emerging contaminant as demonstrated in
Fig. 6. From previous studies (Lonappan et al., 2017), it was observed that the equilibrium was
obtained in 5 hours and hence the adsorption was carried out for 5 hours.
Pig manure biochar was very effective (approx. 100% removal) for the removal of DCF under similar
conditions(Lonappan et al., 2017). Thus, further improvement in removal efficiency was not
observed after functionalization. With citric acid functionalization, adsorption capacities of pine wood
and almond shell biochars were significantly (p < 0.05) increased at both concentrations under
study. For pinewood biochar, at 500 µg L-1
DCF, the removal efficiency increased from 65 % to 80
%. For almond shell biochar and under similar conditions, removal efficiency increased from 58 % to
84 %. The increased removal efficiency can be attributed to the induction/ increased number of
COOH groups on the biochar surface along with the possible increased surface area. It has been
reported that COOH groups are effective for the removal of metal ions from soil (Uchimiya et al.,
2012). Several interactions, such as p-p electron donor-acceptor interactions, hydrophobic
interactions, hydrogen bonding and Van der Waal forces are involved in adsorption (Jung et al.,
2015; Nam et al., 2015). Here, the presence of possible COOH groups might enhance these
interactions and thus the adsorption capacity of biochars has been increased. Zeta potential
measurements before and after functionalization have been given as Table 3. An increase in zeta
potential was observed for citric acid treated biochar. The changes in zeta potential can be directly
correlated with observed FTIR results of approximately 40-50% increase in -COOH functional
groups with BC-PW and BC-AS. Moreover, Zp changes were considerably higher (Table 4), and
certainly had a positive effect on the adsorption and removal of DCF. Acidic functional groups can
enhance DCF adsorption (Lonappan et al., 2017) and after citric acid functionalization, more than
10% increase in total acidic functional groups were observed with all biochars (Table 4). This 10%
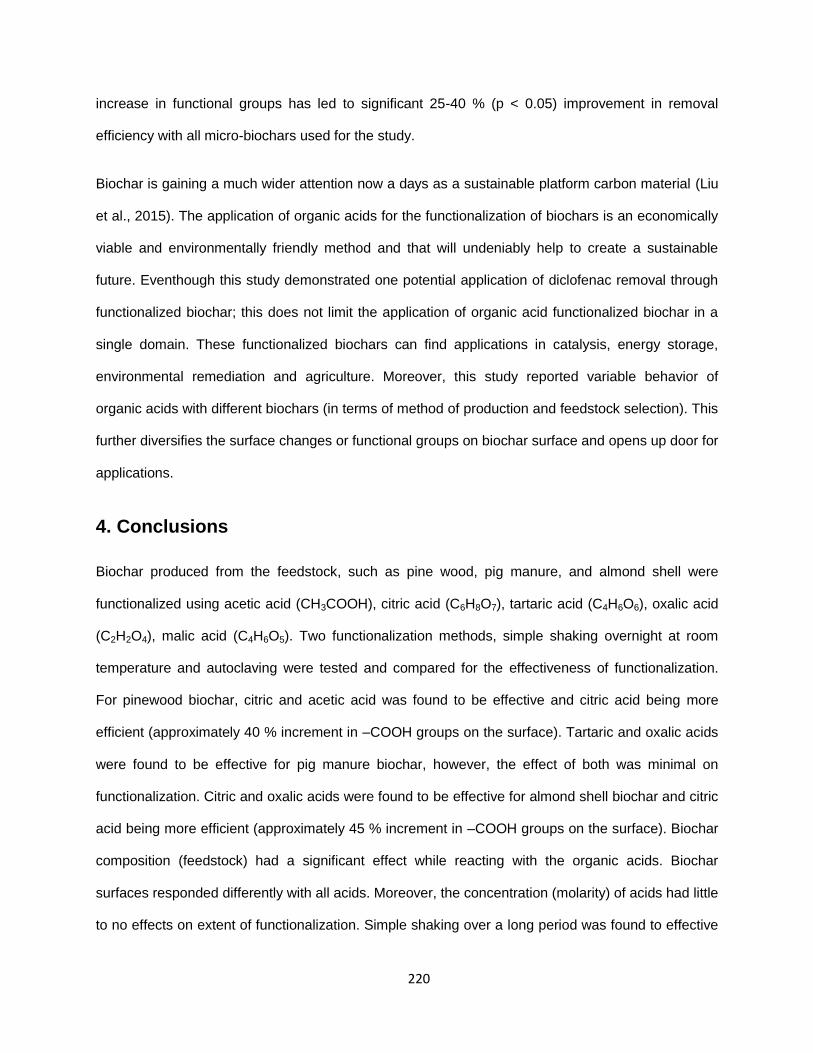
220
increase in functional groups has led to significant 25-40 % (p < 0.05) improvement in removal
efficiency with all micro-biochars used for the study.
Biochar is gaining a much wider attention now a days as a sustainable platform carbon material (Liu
et al., 2015). The application of organic acids for the functionalization of biochars is an economically
viable and environmentally friendly method and that will undeniably help to create a sustainable
future. Eventhough this study demonstrated one potential application of diclofenac removal through
functionalized biochar; this does not limit the application of organic acid functionalized biochar in a
single domain. These functionalized biochars can find applications in catalysis, energy storage,
environmental remediation and agriculture. Moreover, this study reported variable behavior of
organic acids with different biochars (in terms of method of production and feedstock selection). This
further diversifies the surface changes or functional groups on biochar surface and opens up door for
applications.
4. Conclusions
Biochar produced from the feedstock, such as pine wood, pig manure, and almond shell were
functionalized using acetic acid (CH3COOH), citric acid (C6H8O7), tartaric acid (C4H6O6), oxalic acid
(C2H2O4), malic acid (C4H6O5). Two functionalization methods, simple shaking overnight at room
temperature and autoclaving were tested and compared for the effectiveness of functionalization.
For pinewood biochar, citric and acetic acid was found to be effective and citric acid being more
efficient (approximately 40 % increment in –COOH groups on the surface). Tartaric and oxalic acids
were found to be effective for pig manure biochar, however, the effect of both was minimal on
functionalization. Citric and oxalic acids were found to be effective for almond shell biochar and citric
acid being more efficient (approximately 45 % increment in –COOH groups on the surface). Biochar
composition (feedstock) had a significant effect while reacting with the organic acids. Biochar
surfaces responded differently with all acids. Moreover, the concentration (molarity) of acids had little
to no effects on extent of functionalization. Simple shaking over a long period was found to effective

221
over autoclaving at high temperature for short period. Overall, citric acid was found to be the efficient
organic acid for effective functionalization (COOH) on biochar surface. Citric acid functionalization
increased total acidic functional groups by 23.6 %, 10.2 %, and 26.2 % for pine wood, pig manure
and almond shell, respectively. Citric acid functionalized biochars gave significant removal (p < 0.05)
of DCF at equilibrium.
Acknowledgements
Authors are sincerely thankful to the Natural Sciences and Engineering Research Council of Canada
(Discovery Grant 355254 and NSERC Strategic Grant) and Ministère des Relations internationales
du Québec (coopération Québec-Catalanya 2012-2014-project 07.302). Special thanks to Pyrovac
inc. Quebec and IRDA Quebec for biochar samples.

222
References
A D, Hegde G. Activated carbon nanospheres derived from bio-waste materials for supercapacitor applications - a review. RSC Advances 2015; 5: 88339-88352.
Bruun EW, Hauggaard-Nielsen H, Ibrahim N, Egsgaard H, Ambus P, Jensen PA, et al. Influence of fast pyrolysis temperature on biochar labile fraction and short-term carbon loss in a loamy soil. Biomass and Bioenergy 2011; 35: 1182-1189.
Chen JP, Wu. Acid/Base-Treated Activated Carbons: Characterization of Functional Groups and Metal Adsorptive Properties. Langmuir 2004; 20: 2233-2242.
Domingues RR, Trugilho PF, Silva CA, Melo ICNAd, Melo LCA, Magriotis ZM, et al. Properties of biochar derived from wood and high-nutrient biomasses with the aim of agronomic and environmental benefits. PLOS ONE 2017; 12: e0176884.
Fischer K, Bipp H-P. Generation of organic acids and monosaccharides by hydrolytic and oxidative transformation of food processing residues. Bioresource Technology 2005; 96: 831-842.
Gai X, Wang H, Liu J, Zhai L, Liu S, Ren T, et al. Effects of Feedstock and Pyrolysis Temperature on Biochar Adsorption of Ammonium and Nitrate. PLoS ONE 2014; 9: e113888.
George WO, Green JHS, Pailthorpe D. The OH stretching vibrations of 2-hydroxy carboxylic acids. Journal of Molecular Structure 1971; 10: 297-299.
Guedidi H, Reinert L, Soneda Y, Bellakhal N, Duclaux L. Adsorption of ibuprofen from aqueous solution on chemically surface-modified activated carbon cloths. Arabian Journal of Chemistry 2017; 10: S3584-S3594.
Haberhauer G, Rafferty B, Strebl F, Gerzabek MH. Comparison of the composition of forest soil litter derived from three different sites at various decompositional stages using FTIR spectroscopy. Geoderma 1998; 83: 331-342.
He K, Zhang S, Mi J, Zhang W. The evolution of chemical groups and isotopic fractionation at different maturation stages during lignite pyrolysis. Fuel 2018; 211: 492-506.
Hu H, Bhowmik P, Zhao B, Hamon MA, Itkis ME, Haddon RC. Determination of the acidic sites of purified single-walled carbon nanotubes by acid–base titration. Chemical Physics Letters 2001; 345: 25-28.
Jindo K, Mizumoto H, Sawada Y, Sanchez-Monedero MA, Sonoki T. Physical and chemical characterization of biochars derived from different agricultural residues. Biogeosciences 2014; 11: 6613-6621.
Jung C, Boateng LK, Flora JRV, Oh J, Braswell MC, Son A, et al. Competitive adsorption of selected non-steroidal anti-inflammatory drugs on activated biochars: Experimental and molecular modeling study. Chemical Engineering Journal 2015; 264: 1-9.
Khan SH, Iqbal J. Recent advances in the role of organic acids in poultry nutrition. Journal of Applied Animal Research 2016; 44: 359-369.

223
Li X, Shen Q, Zhang D, Mei X, Ran W, Xu Y, et al. Functional Groups Determine Biochar Properties (pH and EC) as Studied by Two-Dimensional 13C NMR Correlation Spectroscopy. PLOS ONE 2013; 8: e65949.
Liu W-J, Jiang H, Yu H-Q. Development of Biochar-Based Functional Materials: Toward a Sustainable Platform Carbon Material. Chemical Reviews 2015; 115: 12251-12285.
Lonappan L, Brar SK, Das RK, Verma M, Surampalli RY. Diclofenac and its transformation products: Environmental occurrence and toxicity - A review. Environment International 2016a; 96: 127-138.
Lonappan L, Rouissi T, Das RK, Brar SK, Ramirez AA, Verma M, et al. Adsorption of methylene blue on biochar microparticles derived from different waste materials. Waste Management 2016b; 49: 537-544.
Lonappan L, Rouissi T, Kaur Brar S, Verma M, Surampalli RY. An insight into the adsorption of diclofenac on different biochars: mechanisms, surface chemistry, and thermodynamics. Bioresource Technology 2017.
Max J-J, Chapados C. Infrared Spectroscopy of Aqueous Carboxylic Acids: Comparison between Different Acids and Their Salts. The Journal of Physical Chemistry A 2004; 108: 3324-3337.
Méndez A, Fidalgo JM, Guerrero F, Gascó G. Characterization and pyrolysis behaviour of different paper mill waste materials. Journal of Analytical and Applied Pyrolysis 2009; 86: 66-73.
Mohamad Nor N, Lau LC, Lee KT, Mohamed AR. Synthesis of activated carbon from lignocellulosic biomass and its applications in air pollution control—a review. Journal of Environmental Chemical Engineering 2013; 1: 658-666.
Mohan D, Sarswat A, Ok YS, Pittman CU, Jr. Organic and inorganic contaminants removal from water with biochar, a renewable, low cost and sustainable adsorbent--a critical review. Bioresour Technol 2014; 160: 191-202.
Naghdi M, Taheran M, Brar SK, Kermanshahi-pour A, Verma M, Surampalli RY. Immobilized laccase on oxygen functionalized nanobiochars through mineral acids treatment for removal of carbamazepine. Science of The Total Environment 2017; 584-585: 393-401.
Nam S-W, Jung C, Li H, Yu M, Flora JRV, Boateng LK, et al. Adsorption characteristics of diclofenac and sulfamethoxazole to graphene oxide in aqueous solution. Chemosphere 2015; 136: 20-26.
Ojamäe L, Aulin C, Pedersen H, Käll P-O. IR and quantum-chemical studies of carboxylic acid and glycine adsorption on rutile TiO2 nanoparticles. Journal of Colloid and Interface Science 2006; 296: 71-78.
Pradhan BK, Sandle NK. Effect of different oxidizing agent treatments on the surface properties of activated carbons. Carbon 1999; 37: 1323-1332.
Qian Q, Machida M, Tatsumoto H. Preparation of activated carbons from cattle-manure compost by zinc chloride activation. Bioresource Technology 2007; 98: 353-360.

224
Rouissi T, Tyagi RD, Brar SK, Prevost D, John RP, Surampalli RY. Efficient and simple method for determination of suspendibility of bio-inoculant suspensions. Bioresource Technology 2011; 102: 10754-10758.
Sauer M, Porro D, Mattanovich D, Branduardi P. Microbial production of organic acids: expanding the markets. Trends in Biotechnology 2008; 26: 100-108.
Shamsuddin MS, Yusoff NRN, Sulaiman MA. Synthesis and Characterization of Activated Carbon Produced from Kenaf Core Fiber Using H3PO4 Activation. Procedia Chemistry 2016; 19: 558-565.
Sharma RK, Wooten JB, Baliga VL, Lin X, Geoffrey Chan W, Hajaligol MR. Characterization of chars from pyrolysis of lignin. Fuel 2004; 83: 1469-1482.
Tan IA, Ahmad AL, Hameed BH. Adsorption isotherms, kinetics, thermodynamics and desorption studies of 2,4,6-trichlorophenol on oil palm empty fruit bunch-based activated carbon. J Hazard Mater 2009; 164: 473-82.
Tan X, Liu Y, Zeng G, Wang X, Hu X, Gu Y, et al. Application of biochar for the removal of pollutants from aqueous solutions. Chemosphere 2015; 125: 70-85.
Tsai W-T, Liu S-C, Chen H-R, Chang Y-M, Tsai Y-L. Textural and chemical properties of swine-manure-derived biochar pertinent to its potential use as a soil amendment. Chemosphere 2012; 89: 198-203.
Uchimiya M, Bannon DI, Wartelle LH. Retention of Heavy Metals by Carboxyl Functional Groups of Biochars in Small Arms Range Soil. Journal of Agricultural and Food Chemistry 2012; 60: 1798-1809.
Vert M, Doi Y, Hellwich K-H, Hess M, Hodge P, Kubisa P, et al. Terminology for biorelated polymers and applications (IUPAC Recommendations 2012). Pure and Applied Chemistry 2012; 84.
Woolf D, Amonette JE, Street-Perrott FA, Lehmann J, Joseph S. Sustainable biochar to mitigate global climate change. 2010; 1: 56.
Yan Q, Wan C, Liu J, Gao J, Yu F, Zhang J, et al. Iron nanoparticles in situ encapsulated in biochar-based carbon as an effective catalyst for the conversion of biomass-derived syngas to liquid hydrocarbons. Green Chemistry 2013; 15: 1631-1640.
Zhang P, Sun H, Yu L, Sun T. Adsorption and catalytic hydrolysis of carbaryl and atrazine on pig manure-derived biochars: Impact of structural properties of biochars. Journal of Hazardous Materials 2013; 244-245: 217-224.

225
Table 1: Molarities of various acids used for functionalization of biochars
Acetic acid
Citric acid
Tartaric acid
Oxalic acid
Malic acid
2 M 1M
0.5M
2 M 1M 0.5
1M
0.5M 0.1M
0.1M 0.5M 1M
2 M 1M
0.5M
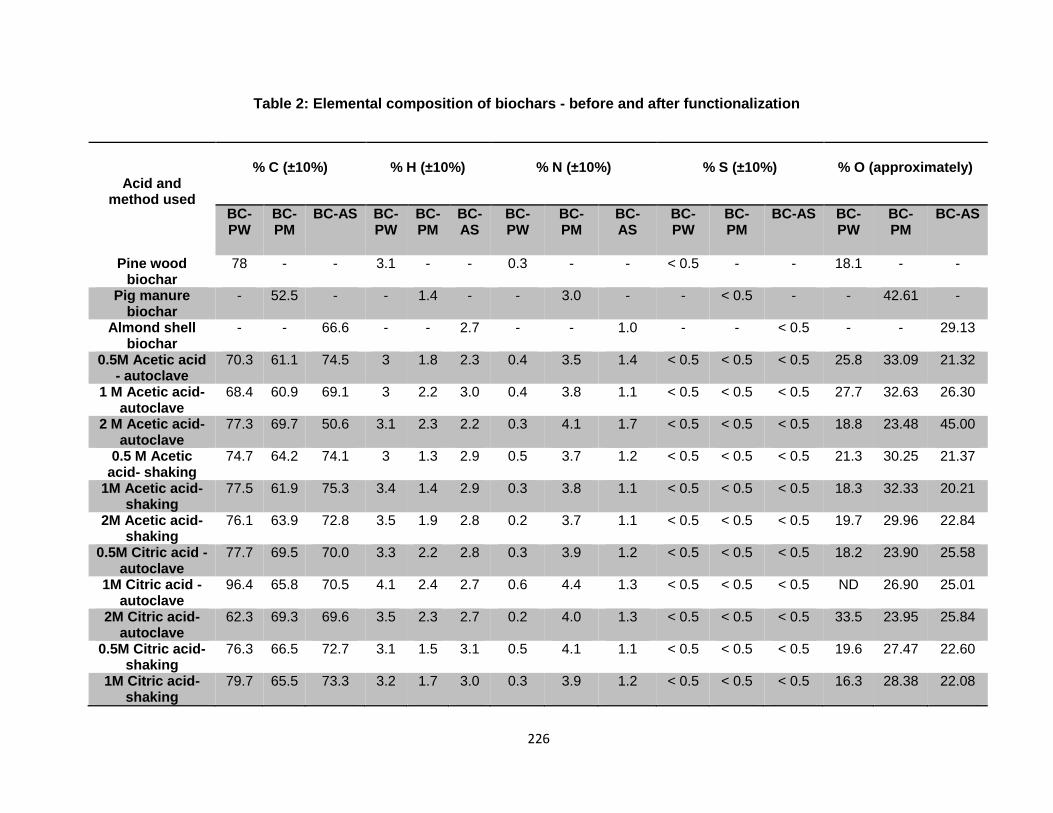
226
Table 2: Elemental composition of biochars - before and after functionalization
Acid and method used
% C (±10%)
% H (±10%)
% N (±10%)
% S (±10%)
% O (approximately)
BC-PW
BC-PM
BC-AS BC-PW
BC-PM
BC-AS
BC-PW
BC-PM
BC-AS
BC-PW
BC-PM
BC-AS BC-PW
BC-PM
BC-AS
Pine wood biochar
78 - - 3.1 - - 0.3 - - < 0.5 - - 18.1 - -
Pig manure biochar
- 52.5 - - 1.4 - - 3.0 - - < 0.5 - - 42.61 -
Almond shell biochar
- - 66.6 - - 2.7 - - 1.0 - - < 0.5 - - 29.13
0.5M Acetic acid - autoclave
70.3 61.1 74.5 3 1.8 2.3 0.4 3.5 1.4 < 0.5 < 0.5 < 0.5 25.8 33.09 21.32
1 M Acetic acid- autoclave
68.4 60.9 69.1 3 2.2 3.0 0.4 3.8 1.1 < 0.5 < 0.5 < 0.5 27.7 32.63 26.30
2 M Acetic acid- autoclave
77.3 69.7 50.6 3.1 2.3 2.2 0.3 4.1 1.7 < 0.5 < 0.5 < 0.5 18.8 23.48 45.00
0.5 M Acetic acid- shaking
74.7 64.2 74.1 3 1.3 2.9 0.5 3.7 1.2 < 0.5 < 0.5 < 0.5 21.3 30.25 21.37
1M Acetic acid- shaking
77.5 61.9 75.3 3.4 1.4 2.9 0.3 3.8 1.1 < 0.5 < 0.5 < 0.5 18.3 32.33 20.21
2M Acetic acid- shaking
76.1 63.9 72.8 3.5 1.9 2.8 0.2 3.7 1.1 < 0.5 < 0.5 < 0.5 19.7 29.96 22.84
0.5M Citric acid - autoclave
77.7 69.5 70.0 3.3 2.2 2.8 0.3 3.9 1.2 < 0.5 < 0.5 < 0.5 18.2 23.90 25.58
1M Citric acid - autoclave
96.4 65.8 70.5 4.1 2.4 2.7 0.6 4.4 1.3 < 0.5 < 0.5 < 0.5 ND 26.90 25.01
2M Citric acid- autoclave
62.3 69.3 69.6 3.5 2.3 2.7 0.2 4.0 1.3 < 0.5 < 0.5 < 0.5 33.5 23.95 25.84
0.5M Citric acid- shaking
76.3 66.5 72.7 3.1 1.5 3.1 0.5 4.1 1.1 < 0.5 < 0.5 < 0.5 19.6 27.47 22.60
1M Citric acid- shaking
79.7 65.5 73.3 3.2 1.7 3.0 0.3 3.9 1.2 < 0.5 < 0.5 < 0.5 16.3 28.38 22.08

227
2M Citric acid- shaking
70.9 64.6 70.1 3.3 1.8 3.0 0.3 3.8 1.1 < 0.5 < 0.5 < 0.5 25 29.26 25.29
0.1M Tartaric acid- autoclave
78.6 53.5 72.4 3.2 2.7 3.1 0.3 2.9 1.1 < 0.5 < 0.5 < 0.5 17.4 40.44 22.98
0.5M Tartaric acid- autoclave
80 53.8 74.7 3.1 2.5 3.2 0.3 2.9 1.2 < 0.5 < 0.5 < 0.5 16.1 40.20 20.45
1M Tartaric acid- autoclave
75.5 56.3 72.8 2.8 2.6 2.9 0.5 2.9 1.1 < 0.5 < 0.5 < 0.5 20.7 37.64 22.77
0.1M Tartaric acid- shaking
78 54.8 72.0 3.4 2.4 2.8 0.3 3.1 1.3 < 0.5 < 0.5 < 0.5 17.8 39.22 23.37
0.5M Tartaric acid- shaking
50.2 78.9 68.8 2.9 3.3 2.9 2.7 0.4 1.0 < 0.5 < 0.5 < 0.5 43.7 16.86 26.76
1M Tartaric acid- shaking
80.1 56.5 70.1 3.4 2.4 2.7 0.3 3.2 1.2 < 0.5 < 0.5 < 0.5 15.7 37.39 25.46
0.5M Malic acid- autoclave
75.2 63.6 73.9 3.1 1.9 2.8 0.5 4.1 1.2 < 0.5 < 0.5 < 0.5 20.7 29.91 21.61
1M Malic acid- autoclave
76 67.6 75.2 3.3 2.1 2.8 0.5 3.9 1.3 < 0.5 < 0.5 < 0.5 19.7 25.90 20.21
2M Malic acid- autoclave
77.3 63.5 69.3 3.4 2.2 3.1 0.5 3.7 1.2 < 0.5 < 0.5 < 0.5 18.3 30.02 25.92
0.5M Malic acid- shaking
78.9 66.8 66.3 3.1 2.1 2.9 1 3.8 1.6 < 0.5 < 0.5 < 0.5 16.5 26.80 28.71
1M Malic acid- shaking
79.4 62.2 73.7 3 1.8 3.2 0.3 4.0 1.1 < 0.5 < 0.5 < 0.5 16.8 31.53 21.54
2M Malic acid- shaking
76.7 62.6 73.9 3 2.1 2.8 0.3 3.8 1.2 < 0.5 < 0.5 < 0.5 19.5 31.03 21.68
0.1M Oxalic acid- autoclave
73.3 53.6 73.6 3 1.8 2.6 0.4 3.1 1.1 < 0.5 < 0.5 < 0.5 22.8 40.98 22.16
0.5M Oxalic acid- autoclave
58.5 56.8 72.9 2 1.9 2.7 3.2 3.2 1.3 < 0.5 < 0.5 < 0.5 35.8 37.63 22.60
1M Oxalic acid- autoclave
83.3 57.6 70.0 3.3 1.7 2.9 0.2 3.1 1.0 < 0.5 < 0.5 < 0.5 12.7 37.06 25.64
0.1M Oxalic acid- shaking
76.9 54.7 71.3 3.2 1.9 2.4 0.2 3.0 1.1 < 0.5 < 0.5 < 0.5 19.2 39.89 24.67
0.5M Oxalic acid- shaking
77.7 57.2 72.6 3.2 1.6 2.2 0.4 3.2 1.2 < 0.5 < 0.5 < 0.5 18.2 37.49 23.44
1M Oxalic acid- shaking
79.3 75.1 76.1 3.3 3.0 2.7 0.3 0.6 1.1 < 0.5 < 0.5 < 0.5 16.6 20.85 19.56

228
Table 3: Total acidic functional groups, zeta potential and shift in FTIR peaks in
functionalized and non-functionalized biochars
Biochar
Acidic functional groups
( mmolg-1
)
Transmittance from FTIR (%)
Zeta potential
(mV)
Raw
micro
biochar
After citric acid
functionalization
Raw
micro
biochar
After citric acid
functionalization
Raw
micro
biochar
After citric acid
functionalization
Pine wood
2.9
3.8
75.6
36.1
-55.3
-0.6
Pig
manure
3.5
3.9
71.3
61.1
-39.8
3.1
Almond
shell
3.1
4.2
67.6
28.3
-48.7
1.2

229
Figure. 1: Particle size of biochars used

230
Figure 2: Representative scanning electron micrographs of non-functionalized and citric
acid functionalized biochar. A- raw pine wood biochar; B-functionalized pine wood
biochar; A- raw pine wood biochar; B-functionalized pine wood biochar; C- raw pig
manure biochar; D-functionalized pig manure biochar; E- raw almond shell biochar; F-
functionalized almond shell biochar

231
Figure 3: FTIR spectrum – functionalization of pinewood biochar using organic acids

232
Figure 4: FTIR spectrum – functionalization of pig manure biochar using organic acids

233
Figure 5: FTIR spectrum – functionalization of almond shell biochar using organic acids.

234
Figure 6: Functionalized biochars and removal of diclofenac
0
20
40
60
80
100
BC-PW-FN BC-PW BC-PM-FN BC-PM BC-AS-FN BC-AS
Re
mo
val e
ffic
ien
cy (
%)
Adsorbent
10 ppmequilibrium
500 ppbequilibrium
235
CHAPTER 4
LACCASE ENZYMES: PRODUCTION; IMMOBILIZATION OF
ENZYMES ON MICRO-BIOCHARS AND DEGRADATION OF
DICLOFENAC

236

237
PART 1
AGRO-INDUSTRIAL PRODUCED LACCASE FOR DEGRADATION OF
DICLOFENAC AND IDENTIFICATION OF TRANSFORMATION
PRODUCTS
Linson Lonappan a, Tarek Rouissi a, Mohamed Amine Laadila a, Satinder Kaur
Brar a*, Hernandez Galan Leticia b, Mausam Verma c, R.Y. Surampalli d
a INRS-ETE, Université du Québec, 490, Rue de la Couronne, Québec, Canada G1K 9A9
b Escuela Nacional de Ingeniería y Ciencias, Tecnológico de Monterrey. Epigmenio González
500, Fracc. San Pablo. CP 76130, Santiago de Queretaro, Qro. Mexico
c CO2 Solutions Inc., 2300, rue Jean-Perrin, Québec, Canada G2C 1T9
d Department of Civil Engineering, University of Nebraska-Lincoln, N104 SEC P.O. Box 886105,
Lincoln, NE 68588-6105, United States
ACS SUSTAINABLE CHEMISTRY & ENGINEERING 5(7) (2017), 5772–5781

238
RÉSUMÉ
Le diclofenac, un anti-inflammatoire répandu, est récalcitrant dans divers milieux aquatiques et
représente une menace pour plusieurs espèces aquatiques et terrestres. La dégradation
enzymatique des contaminants émergents, souvent les micropolluants, a gagné de l’intérêt au
cours des dernières années. Cependant, les coûts de production d’enzymes demeurent élevés.
Dans cette étude, la laccase, une enzyme ligninolytique, a été produite par des champignons de
pourriture blanche Tremetes versicolor (ATCC 20869) en utilisant les résidus agro-industriels
suivants : le marc de pomme (AP), les résidus solides de pâte et papier (PPSW) et les fibres alfa
comme substrat. Plusieurs inducteurs de production de laccase tels que le tween 80 (0.1%
(w/w)), l’alcool veratryle (3 mM Kg-1
), CuSO4 (3 mM Kg-1
) et le Rouge de Phénol (3 mM Kg-1
),
ont été utilisés pour améliorer la production de laccase. Des activités de laccase maximum de
49.16 ± 4.5 U/gds (units/gram dry substrate), 52.4 ± 2.2 U/gds and 14.26 ± 0.8 U/gds ont été
obtenues dans des conditions expérimentales optimales à partir de AP, PPSW et de fibre alfa,
respectivement. Ensuite, la cinétique de dégradation du DCF par la laccase a été étudiée. À des
concentrations représentatives de celles retrouvées dans l’environnement, un pH de 4.5 et une
température de 50°C se sont avérés être les conditions optimales pour la dégradation du DCF
par la laccase. Le 3′-hydroxydiclofenac, le 4′-hydroxydiclofenac and le 5-hydroxydiclofenac ont
été identifiés comme étant les principaux produits de transformation pendant les premières 5
heures de dégradation. Cependant, après 24 heures de dégradation, ni le DCF, ni aucuns autres
produits de transformation ont été identifiés. Ainsi, le mécanisme de dégradation proposé
implique une hydroxylation suivi par une ouverture des cycles et une minéralisation finale en
CO2, NH3, H2O et HCl.
Mots clés : Diclofenac; Laccase; Dégradation; Produit de transformation; Marc de pomme;
Cinétique, fibre alfa; résidus solides de pâte et papier

239
ABSTRACT
A widely used anti-inflammatory drug, diclofenac (DCF) is recalcitrant in many environmental
compartments and poses threat to several aquatic and terrestrial organisms. Enzymatic degradation
of emerging contaminants which are often micropollutants, has gained interest for the past few
years. However, production of enzymes often incurs high costs. In this study, ligninolytic enzyme
laccase was produced by white rot fungi Tremetes versicolor (ATCC 20869) using agro-industrial
residues, apple pomace (AP), Pulp and paper solid waste (PPSW) and alfa fibers as substrates.
Various known inducers for laccase production, such as tween 80 (0.1% (w / w)), veratryl alcohol (3
mM Kg-1
), CuSO4 (3 mM Kg-1
) and phenol red (3 mM Kg-1
) were used to enhance laccase
production. A maximum laccase activity of 49.16± 4.5 U/gds (units/gram dry substrate),52.4±2.2
U/gds and 14.26±0.8 U/gds was obtained from apple pomace, PPSW and alfa plant fibers,
respectively at optimal experimental conditions. Further, the kinetics of the laccase mediated
degradation of DCF was studied. At environmentally relevant concentration of DCF (500 µg L-1
),
laccase catalyzed degradation followed first order kinetics. At environmentally relevant
concentrations pH of 4.5 and temperature of 50 °C was found to be optimal for the effective
degradation of DCF with laccase. 3′-hydroxydiclofenac, 4′-hydroxydiclofenac and 5-
hydroxydiclofenac were identified as the major transformation products during the initial five hours of
degradation. However, after 24 hours of degradation, neither DCF nor any transformation products
were identified so that the proposed degradation mechanism involved hydroxylation followed by ring
opening and final mineralization to CO2, NH3, and H2O and HCl.
Keywords: Diclofenac; Laccase; Degradation; Transformation products; Apple pomace; Kinetics;
Alfa fibers; Pulp and paper solid waste

240
1. Introduction
The use of pharmaceuticals is vital for the prevention, treatment, and maintenance of productivity in
human as well as other organisms 1. Besides its inevitable applications, these pharmaceuticals
spawn concerns over environmental pollution due to their frequent occurrences in wastewater as
well as drinking water 2. After consumption, excess, partially metabolized and conjugate forms
usually end up in wastewater treatment plant. These emerging contaminants (ECs) are often
persistent and induce unwanted biological effects in many aquatic as well as terrestrial organisms
even at very low or micro concentrations. Diclofenac (DCF) is a non-steroidal anti-inflammatory drug
(NSAID) and its global human consumption is estimated to be more than 1443 ± 58 tons 3. Owing to
its huge consumption and poor degradation in wastewater treatment plants 4, residues of DCF and
its metabolites are frequently detected in wastewater 5, surface water
6 and even in drinking water
5.The adverse effects and toxicity of DCF is well established for several aquatic organisms and
microbial communities 2, 4-5
in fragile river ecosystems. Furthermore, the mixed toxic concerns over
the untreated DCF along with its own metabolites, other ECs, organic and inorganic contaminants is
still undeciphered 2. Thus, DCF need to be treated at its primary sink and the transformation
products must be properly identified and tested for any unwanted potential toxic effects. Most of the
currently existing methods are energy and cost-intensive and the quest for new, alternative
sustainable and eco-friendly treatment methods must be initiated.
Ligninolytic enzymes are known for detoxification/degradation of recalcitrant pollutants 7-8
. Amongst
ligninolytic enzymes, laccases (1.10.3.2, p-diphenol: dioxygen oxidoreductases) have been widely
recognized for biotechnological and waste treatment applications due to simple requirements for
laccase catalysis (presence of substrate and O2), as well as its extra stability and minor inhibition
possibilities in comparison with other enzymes of the same class9. A wide variety of microorganisms
has been used for the production of laccases, of which different fungal species are well known due
to their salient capabilities for enhanced production. For fungal cultures, various fermentation
techniques, such as submerged fermentation, solid-state fermentation and semi-solid-state

241
fermentation were utilized and a wide variety of substrates has been used as the fermentation media
8. Moreover, the application of various inducers enhances the laccase production
10. High production
costs are often associated with enzyme production, particularly in large-scale production, and which
is usually associated with the expensive medium for the microbial growth. Thus, investigation on the
utilization of wastes from agriculture and food processing industries as substrates is getting much
wider attention 8, 11
. However, selecting a suitable lignocellulosic material (substrate) having an
appropriate Carbon/Nitrogen (C/N) ratio, micro-macro nutrients composition with the absence of
potential inhibitors is important for the cost-effective production of laccase. In this study, juice
industry residue, apple pomace (AP) has been used as one of the solid substrate for the production
of laccase due to its vast availability in Canada. AP has been already proved as an excellent
medium for the production of various enzymes and platform chemicals 12
. Moreover, life cycle
analysis studies proved that the fermentation method to produce ligninolytic enzymes is
environmentally sustainable for the disposal of the juice industry residuals 13
. Pulp and paper solid
waste (PPSW) has been sleceted as another substrate due to its vast availability in Canada and rich
lignocellulosic contents14
. Moreover, proper disposal and management of PPSW is a major concern
thorgh out the world15-16
. Likewise, the feasibility for laccase production has been tested for the alfa
plant fibers (otherwise known as needles grass - Stipa tenacissima) for the first time to the best of
our knowledge. Needles grass is well known for its polyphenolic and lignin contents 17-18
and thus
can be a suitable candidate for use as a substrate for laccase production. Hence, three agro-
industrial residues, apple pomace dried alfa fibers and pulp and paper solid waste (PPSW) were
used for the production of the ligninolytic enzyme, laccase. A well-known producer of laccase,
Trametes versicolor- ATCC 20869 was selected as the suitable microorganism. Effect of various
inducers, such as veratryl alcohol (3, 4-dimethoxybenzyl alcohol), Tween-80 (C32H60O10), phenol
red( C19H14O5S) and copper sulfate (CuSO4) were studied for the production of laccase.
Fermentation conditions were optimized in terms of substrate and inducer concentration. The
supernatant suspension obtained from fermentation medium was concentrated using ultrafiltration.
The crude enzyme suspension was used for the degradation of DCF at varying pH, temperatures,

242
enzyme activities and DCF concentrations and the optimum conditions for the degradation of DCF
was determined. Moreover, kinetics of the laccase-mediated degradation of DCF was studied and
transformation products were identified by tandem mass spectroscopy.
2. Materials and methods
2.1 Chemicals and reagents
The inducers, Tween 80, phenol red and copper sulfate pentahydrate were purchased from Fisher
Scientific (Ottawa, ON, Canada). The 3,4-dimethoxybenzyl alcohol (veratryl alcohol) was purchased
from Sigma- Aldrich, Canada. Reagents for buffer solutions (monosodium phosphate, disodium
phosphate, and citric acid) and 2,2′-azinobis(3-ethylbenzothiazoline-6-sulfonic acid (ABTS) were
purchased from Fisher Scientific (Ottawa, ON, Canada).
Diclofenac sodium salt (98%; CAS 15307-79-6), HPLC-grade methanol (MeOH, purity >99.8%),
HPLC grade acetonitrile (ACN, assay 99.9%), glacial acetic acid (assay: ≥99.7% w/w) and
ammonium hydroxide (NH4OH, 28–30% w/w) were purchased from Fisher Scientific (Ottawa, ON,
Canada). The internal standard (IS), diclofenac-d4 was obtained from C/D/N isotopes Inc. (Montreal,
QC, Canada). Disodium ethylenediamine tetraacetic acid (Na2H2EDTA, 99%) was purchased from
E-bay (Tokyo, Japan). Chromatography grade water was prepared in the laboratory using Milli-
Q/Milli-RO Millipore system (Milford, MA, USA).
2.2 Production of laccase
2.2.1 Substrates
Juice industry residue, apple pomace was gifted by Vergers Paul Jodoin Inc, Quebec and used after
drying overnight at 60 ±1 °C in a hot air oven to remove moisture. Pulp and paper solid waste
(PPSW) was obtained from Kruger Wayagamack Inc. (Trois-Rivieres, Quebec, Canada) PPSW is a
mixture of primary sludge (60%) and secondary sludge (40%). Alfa fibers were dried in a hot air oven
and ground in Retsch RS 200’ vibratory disc mill at 750 rpm for 10 minutes to obtain particles ranged

243
from 75-300 μm (ASTM 200 and 50 numbered sieves) which were used for the fermentation.
Before fermentation substrates were adjusted to 75 ±1 % (w/w) moisture with sterile milli-Q water.
2.2.2 Microorganism
White-rot fungus, Trametes versicolor (ATCC 20869) was selected as a suitable organism for
enzyme production due to its excellent potential. The culture was grown on potato-dextrose-agar
(PDA) plates and incubated at 30 ± 1 °C for 8–10 days. The mycelial layer from the PDA plates was
harvested under sterile conditions and used as the inoculum for fermentation. The culture plates
were stored at 4 ± 1 °C and sub-cultured every 3 weeks.
2.2.3 Solid state fermentation
Experiments were carried out at 30 ± 1°C for 14 days in 500 mL Erlenmeyer flasks containing 20 g
of the solid substrates (apple pomace, PPSW and alfa fibers). The solid medium containing 75 %
(w/w) moisture was autoclaved at 121 ◦C for 20 minutes. The medium was inoculated with mycelium
from 8-10 days old Trametes versicolor plate (diameter of petri dish = 90 mm) which was previously
optimized to one plate for optimum growth and incubated at 30 ± 1°C for 14 days. In addition,
inducers, such as tween 80 (0.1% (w / w; equivalent to 1g of tween 80 per Kg of dry substrate),
veratryl alcohol (3 mM Kg-1
of dry substrate ; equivalent to 0.5 g of 3,4-dimethoxybenzyl alcohol
(veratryl alcohol) per Kg of dry substrate ), CuSO4 (3 mM Kg
-1 of dry substrate; equivalent to 0.75 g
of copper sulfate pentahydrate per Kg of dry substrate), phenol red (3 mM Kg
-1 of dry substrate;
equivalent to 1.06 g of phenol red per Kg of dry substrate) and a mixture of all these inducers were
used to enhance the production of laccase. The concentrations of the inducers were selected
following previous studies 19
. Enzyme extraction and moisture adjustment (by adding sterile water, if
needed) were carried out on alternative days starting from the 5th day of fermentation, until 14
th day.
Aeration was maintained by aerating the fermenting substrate under sterile conditions and by gentle
mixing in alternative days.

244
2.2.4 Enzyme extraction
One gram of fermented sample was mixed with 9 ml of 50 mM sodium phosphate buffer of pH 6.5
(10/1:v/w). Vigorous agitation was carried out using a sterile metallic rod followed by vortexing for 10
minutes. The mixture was later centrifuged at 9000 x g for 30 min at 4° C. The supernatant collected
was analyzed for enzyme activity.
2.2.5 Enzyme assay
Laccase activity was determined by measuring the rate of color generation due to the enzymatic
oxidation of 2,2′-azinobis(3-ethylbenzothiazoline-6-sulfonic acid) (ABTS) to ABTS radical ion
(ABTS+) at 420 nm and pH 4.5. The extinction coefficient (ɛ) used was 36,000 M
−1 cm
−1
20. The
assay solution contained 100 mM citrate phosphate as the buffer (pH 4.5), 0.5 mM ABTS and
enzyme. Enzyme-ABTS mixture was incubated for four minutes and the average per minute
increase in absorbance was taken. One unit of laccase activity (U L-1
) is defined as the production of
1 μM ABTS+ per minute under assay conditions
21-22
2.2.6 Enzyme concentration
Crude laccase obtained from apple pomace was concentrated by ultrafiltration using Sartorius
stedim- SartoJet ultrafiltration system (Göttingen, Germany). Sartocon Slice Hydrosart Cassette- 10
kDa and 100 kDa were used as the filtration membranes. Harvested enzyme was filtered using 100
kDa membrane to remove the particles having size more than 100 kDa. Later, the filtrate was
passed through 10 kDa and the retentate having particles of molecular weight less than 10 kDa have
been discarded.
2.3 DCF degradation experiments - methodology
Degradation experiments were carried out under various experimental conditions, such as varying
pH (from 2.5 to 12.5) and temperature (from 10°C to 60°C) to study the performance of laccase.

245
Specific details related to each experiment are given in each corresponding section. All the
experiments were carried out in milli-Q water in 250 mL conical flasks with 100 ml of sample in an
INFORS HT - multitron standard shaking incubator (INFORS, Canada) at 150 rpm at a pH of 6.5
(real wastewater conditions - in wastewater treatment plants); unless specified for a particular
experiment) and at 25±1°C (room temperature; unless specified for a particular experiment). At the
end of each experiment, the enzyme activity was stopped using methanol (purity >99.8%, Fisher
Scientific Ottawa, ON, Canada) and samples were stored at 4°C for DCF analysis.
2.3.1 Kinetics of laccase-mediated DCF degradation
Degradation kinetics (substrate based) was carried out for 50 µg L-1
, 500 µg L-1
and 5 mg L-1
of DCF
with an enzyme activity of 50 U L-1
for 5 days. Sampling was carried out each hour for the first 12
hours, for the first day and each 24 hours for next 4 days. Moreover, varying DCF concentration (50
µg L-1
, 100 µg L-1
, 500 µg L-1
, 1 mg L-1
, 5 mg L-1
and 10 mg L-1
) was tested against 50 U L-1
of
laccase to study the Michaelis–Menten kinetics.
The Michaelis-Menten kinetic parameters of the DCF degradation by laccase was determined by
measuring the initial degradation rate of DCF at different concentrations (equation (1)) 23
.
𝑉 =𝑉𝑚[𝑆]
𝐾𝑀+[𝑆] --------------------------------------------------------------------- (1)
Where, V (µg L-1/hour) is the catalytic reaction rate, Vm (µg L-1
h-1
) is the maximum rate of the
reaction, [S] is the concentration of substrate, and KM is the Michaelis–Menten constant.
However, Km and Vmax values were obtained by fitting the data to the Lineweaver-Burke plot,
resulting from the Michaelis–Menten plot conversion. First and second order rate equations were
used to compare the reaction kinetics at higher as well as environmentally relevant concentrations.

246
2.3.2 Effect of pH and enzyme activity on DCF degradation
The effect of pH on degradation was studied at pH varying from 2 to 12.5. The initial DCF
concentration was 500 µg L-1
and the enzyme activity was 50 U L-1
. Experiments were carried out for
5 hours. Standard solutions of 500 µg L-1
DCF were prepared in pH adjusted milliQ water prior to the
experiment.
Varying enzyme activities of 50, 100, 500, 1000, 1250, 1500 and 1750 U L-1
were also tested against
1000 µg L-1
of DCF to find out the optimal amount of laccase required to degrade DCF. For this
particular experiment, the sampling was carried out at 0th
, 5th, 18
th 24
th and 48
th h. Various kinetic
models were also studied under varying enzyme concentration levels to determine the effect of
enzyme concentrations on the degradation of DCF.
2.3.3 Effect of temperature on DCF degradation
The effect of temperature on DCF degradation was carried out at varying temperatures from 10°C to
60°C with an initial DCF concentration of 500 µg L-1
for 5 hours and with an enzyme activity of 50 U
L-1
. The experiments were carried out in milli-Q water in 250 mL conical flasks with 100 ml of sample
in an INFORS HT–multitron standard shaking incubator (INFORS, Canada) at 150 rpm at a pH of
6.5.
2.4 DCF analysis and identification of transformation products
A newly developed and rapid Laser diode thermal desorption tandem mass spectroscopy (LDTD-
MS/MS) was used for the analysis of DCF samples 6. The instrument comprised LDTD-APCI (Laser
diode thermal desorption - atmospheric pressure chemical ionization) source (LDTD T-960,
Phytronix Technologies, Quebec, Canada) mounted on a TSQ Quantum access triple quadruple
mass spectrometer (Thermo Scientific, Mississauga, Ontario, Canada). Potential transformation
products were identified using LC-MS/MS. A detailed description for the quantification of DCF by this
method is already given in a previous publication6. Transformation products (major) of DCF were

247
identified by scanning a mass range of m/z = 10-500. The obtained m/z values were compared with
the previous studies reported the transformation products of DCF 24
.
2.5 Statistical analysis
All the experiments for the production of laccase and degradation of DCF were carried out in
triplicates. Data presented are the mean values with standard deviation (±SD). To investigate the
statistical significance of the measured values of the standard curve, one way ANOVA test has been
carried out with 95% confidence level using Statistica, version 11.0 (StatSoft, USA) and the results
which have p < 0.05 were considered as significant. Moreover, to study the effect of various
inducers, Tukey HSD test has been carried out.
3. Results and Discussion
3.1 Laccase production
3.1.1 Apple pomace, alfa fibers and pulp and paper solid waste as fermentation
substrates
Figure 1 presents the laccase production profile over time using apple pomace, PPSW and alfa plant
fibers. In comparison with alfa fibers, apple pomace and PPSW were effective substrates for the
production of laccase. Without the use of any inducers, maximum production of laccase obtained by
apple pomace was 36.4±4.7 U/gds (units per gram of dry substrate) on the 7th day; whereas for alfa,
it was 9.15±1 U/gds on the 9th day (Fig 1). Without the use of inducers PPSW showed a maximum
production of 34±3.6 U/gds on the 11th day. Apple pomace has been already well established for the
production of various enzymes and platform chemicals 12, 25-26
. Previous studies reported that AP
contains about 128 g Kg-1
of total carbon, 6.8 g Kg-1
of total nitrogen and 23.5 g Kg-1
of lignin27
.
Moreover, AP is a rich source of many micro and macro nutrients, such as Ca, Cu, Fe, K Zn etc.28
and which makes AP as one of the best available agro-industrial residue for ligninolytic enzyme
production27-28
. PPSW is already proven to be a substrate for the production of several organic

248
acids through fermentation, such as fumaric acid.PPSW contains about 410 g Kg-1
of total carbon
and 31.9 g Kg-1
of total nitrogen . In addition, previous studies reported rich presence of micro and
macro nutrients, such as Mg, Ca, Fe, K, Zn, Mn, P etc. in PPSW14
. Its been already proved that
metal ions including Mg2+
, Zn2+
and Fe2+
act as cofactors for many cellular enzymes. Thus, PPSW
can be a suitable substrate for enzyme production . Alfa fibers contain about 21.8% total lignin,
about 45 % carbon and 1.3% nitrogen18
. Thus, alfa fibers have promising potential for ligninolytic
enzyme production which needs to be studied. The richness of nutrients and lignocellulosic content
in apple pomace 27
in comparison with alfa plant fibers and the presence of phenolic compounds in
apple pomace 29
which are essential for laccase production resulted in higher production of laccase.
Optimal C/N ratio and the presence of several micro and macro nutrients including metal ions
resulted in better laccase production from PPSW. The absence/ low concentration of these
elements; micronutrients, such as Cu in particular made alfa plant fibers not suitable for higher
laccase production30
. Furthermore, none of the previous studies reported the use of alfa plant fibers
as a potential substrate for enzyme production. To the best of our knowledge, this is the first study
to report the same although the production was rather limited, which could be amended by
supplementary nutrients.
3.2 Effect of various inducers
Various inducers were used to enhance the production of laccase and their effects have been given
in table 1. The effect of inducers was minimal on overall laccase production. Of all the inducers used
with apple pomace, copper sulfate (improved production by 35.2%) and veratryl alcohol (an increase
in activity by about 28%) exhibited enhanced efficiency for production of laccase. Moreover, all
inducers combined did not result in an enhanced laccase production. Previous studies also reported
the applicability of veratryl alcohol and tween 80 as inducers for the production of various ligninolytic
enzymes including laccase 19, 27
. Copper sulfate was reported to be an effective inducer for laccase
production by T.versicolor 31
which was in accord with the current study. In addition, with apple
pomace, maximum laccase production was observed on the 7th day of fermentation where as for

249
PPSW maximum production was observed on 11th day of fermentation. Both veratryl alcohol and
copper sulphate exhibited enhanced production capacity with PPSW. With alfa plant fibers, all
inducers, tween 80 (29 %), copper sulfate (56 %) and veratryl alcohol (48 %) demonstrated
competence for enhanced laccase production. Maximum laccase production was observed on the
9th day of fermentation as compared with apple pomace (7
th day). Similar to apple pomace, all
inducers in the combined form did not result in an enhanced laccase production with alfa plant fibers.
Analysis of variance was carried out at day 9 for alfa , day 7 for pomace and day 11 for pulp and
paper solid waste which corresponded to respective maximum laccases production. Results
indicated that use of inducers significantly affected the laccase production (p<0.001).Tukey posthoc
analysis was used to compare between all inducers used (tables 1,2,3,4,5 and 6 in supplementary
data ). For alfa fibers, a significant increase in laccase production with copper sulfate was observed
followed by phenol red, while no significant increase was observed when veratryl alcohol and tween
80 were used. For pomace, best inducers that can be used for significant improvement in laccase
production was copper sulfate followed by veratryl alcohol. For both tween-80 and phenol red, no
difference was observed when compared to the control (p>0.05). For pulp and paper solid waste ,
best inducers that can be used for significant improvement in laccase production was copper sulfate
followed by veratryl alcohol.
From experiments and statistical analysis, copper sulfate was found to be the best inducer among
the 4 inducers for alfa, apple pomace and pulp and paper solid waste . Laccases are blue copper
oxidases and contain four copper atoms per molecule. Thus, copper is an essential element and
addition of copper might lead to activating the metal and hence gene expression encoding laccase
production 27, 32
. Tween-80 being a surfactant,33
enhanced extracellular enzyme production by
promoting both the uptake and release of compounds from the cells through the modification of
plasma membrane permeability 27, 33
. Veratryl alcohol is a secondary metabolite known to have a
significant role in the degradation of lignin as cation radical mediating redox reactions34
. It is reported
that laccase production can be stimulated by a wide variety of inducing substrates composed of

250
aromatic or phenolic origin those are related to lignin or lignin derivatives such as ferulic acid, 2,5-
xylidine, and veratryl alcohol 27, 34
. There an increasing trend in production until the 7th day for apple
pomace and 9th day for alfa during fermentation and afterward the laccase activity tapered off.
Multiple reasons can be attributed towards this decrese in laccse activity. Lignocellulosic materials
are already present in the substrate. The produced enzyme could be used for the degradation of this
lignin and could be deactivated. Moreover, availability of nutrients decreased with fermentation time
which affected the laccase production as laccase production is growth dependent. Another potential
reason was the changes in pH during fermentation35-36
as the experiments were conducted in batch
scale in flasks without pH control. Due to metabolic acivities of T.versicolor and hence the
degradation of substrate, changes in pH were observed in the medium. These changes in pH can
further affect the laccase production.
This study presents few substrates that can be potentially cost-effective for laccase production. In
the present study, the residuals are used as sole substrates and they make up for the 40-60% cost
in the total production scale as also proved in our earlier studies of our research group37
. The best
results were observed with PPSW and apple pomace. From the information gatherned from the
respective industries, apple pomace costs about $100/tonne and PPSW cost about $20/tonne.
Potato dextrose agar (PDA) supplemented with phenolic compounds can be considered as the
standard media for laccase production and which costs about $1000/tonne for bulk purchase
(Alibaba.com). Moreover, basal medium was also reported as an effective medium for laccase
production38
, however, it is cost intensive. Thus, PDA was considered as the standard medium for
these approximate cost estimations. All the expenses related to fermentation (sterilization,
incubation, extraction etc..) for the standard media and the residual materials used for e this study
are the same. Hence, they were not considered and thus approximate cost was calculated based on
media cost. Therefore, as an approximation, while using apple pomace, a 90% reduction and while
using PPSW, a 98% reduction in expenses was observed. Moreover, under optimal conditions, one
251
tonne of PPSW can produce 51 x 106 IU (international units) of laccase whereas, apple pomace can
produce 49 x 106 IU of laccase.
3.3 Degradation of DCF
3.3.1 Degradation kinetics
The kinetics of DCF degradation over time was studied at different concentrations such as 50 µg L-
1, 500 µg L
-1 and 5 mg L
-1. The removal efficiency of laccase for DCF over time is presented in
Figure 2.
DCF degradation followed first-order kinetics at very low concentration of 50 µg L-1
(R2= 0.95) and
had some agreement with zero order (R2
= 0.94) and first order (R2
= 0.83) at intermediate
concentration of 500 µg L-1
. Pursuing the same trend, the rate of degradation exclusively followed
zero order (R2
= 0.92) at a higher concentration of DCF i.e. 5 mg L-1
. Further, DCF degradation
followed Michaelis-Menten kinetics having a parabolic curve from 50 µg L-1
to 5 mg L-1
. This further
confirmed the order of reaction of DCF degradation since in Michaelis-Menten kinetic model, the
degradation rate is zero order at higher substrate concentrations (for diclofenac- in comparison with
real environmental conditions) and first order at lower substrate concentrations (for diclofenac- in
comparison with real environmental conditions). Moreover, this also confirms the inhibition at higher
DCF concentrations due to the shift from first order to zero order. In addition, Lineweaver-Burke
model was also plotted and this also showed excellent agreement with the kinetic data. The plot was
fitted with an R2 of 0.98. The equation obtained from Lineweaver-Burke plot
39 was used to calculate
Km and Vmax of the degradation process. Vmax was found to be 80.6 µg L-1
hour-1
and Km was
calculated to be 2675 µg (data not shown). It has been reported that the degradation of
micropollutants followed first order with peroxidases 40
degradation due to low concentrations, such
as few millimolar levels. Moreover, laccase-mediated degradation of textile dyes and few endocrine
disrupting compounds respected first order degradation following Michaelis-Menten principles23, 41-
42. However, to the best of our knowledge, kinetics and rate of degradation of DCF with fungal

252
laccases have never been reported earlier. Thus, considering the µg L-1
levels of DCF 2, 6
in
wastewater, DCF will follow first order kinetics with a maximum velocity of 80.6 µg L-1
hour-1
. As a
result, degradation using fungal laccases can be an excellent biological removal method for DCF.
Throughout this study, the concentration of DCF was chosen resembling environmentally relevant
concentrations. In addition, other experimental conditions, such as pH have been carefully selected
to match with real wastewater conditions. Thus, the obtained velocity of degradation (80.6 µg L-1
hour-1
) can provide substantial insight while using laccase for the degradation of DCF in real
environmental conditions.
3.3.2 Temperature and pH
Temperature and pH were two crucial factors for laccase-mediated DCF degradation. The
degradation trend of DCF along with pH and temperature is given in Figure 3.
From fig.3, it is clear that the maximum degradation of DCF occurred at pH 4 and hence it was the
optimum pH for degradation. Again, an increase in degradation was observed at pH 10 and which
further decreased along with an increase in pH. Thus, the maximum degradation was observed at
pH ranging from 4-5. It is reported that for ABTS, which is the standard substrate used for the
determination of laccase activity, maximum substrate conversion was observed at pH 4.5 20
. The
pKa of DCF (4.15) can be directly correlated with the efficient degradation of DCF at pH 4.5.
Previous studies also reported pH 3-5 as effective for the DCF degradation43
Moreover, it was
reported that laccases from fungal origin work efficiently at acidic pH44
. Enzyme activity of laccases
may decrease at higher pH because of the formation of hydroxide anion. Hydroxide anion will bind to
the T2/T3 coppers of laccase and which in return disturb/block the internal electron transfer from T1
to T2/T345
.
For laccases, degradation of DCF was increased along with temperature. It has been reported that
optimal temperature for pollutant degradation largely depends upon the pollutant characteristics,
such as molecular structure, pKa and solubility43
. Laccase-mediated reactions are largely

253
temperature dependent in which rate of reaction is often controlled by temperature due to Arrhenius
effects46
. It has been reported that laccase is active at a higher temperature and the standard assay
for laccase is being carried out at 45°C. Moreover, for DCF, the solubility can be increased at
elevated temperatures and as a result which will increase the availability of DCF for laccase-
mediated catalysis. Thus, as shown in fig.3 (B), increasing temperature had a positive effect on DCF
degradation. Previous studies reported that laccase-catalyzed de-colouration various synthetic azo
dyes such as acid blue 92 followed the same pattern of degradation along with temperature47
.
3.3.3 Reaction rates - varying enzyme activities
The obtained enzymes from SSF through apple pomace were further concentrated using
ultrafiltration so that the impurities derived from the substrate AP was removed. The effect of
enzyme activity on DCF degradation is given as Figure 4. The experiments were carried out using 1
mg L-1
of DCF. More than 90% degradation for DCF was obtained with an enzyme activity of 500 U
L-1
in 5 hours. At the 24th hour, it reached nearly 100 %. Further, this trend has been observed with
increasing laccase concentrations. With enzyme activities of 1000, 1250, 1500 and 1700 U L-1
,
respective DCF removal of 96.6 %, 97.5%, 98% and 98.3 % was observed. In all these cases, at
18th and 24
th hour, a removal of ca.100 % was observed. A similar degradation was observed for
DCF using T. versicolor pellets 24
. The influence of the enzyme activity on the transformation rate
was not directly proportional. Thus, an enzyme activity of 500 U L-1
can be considered effective for
DCF degradation. Further increasing the laccase activity did not result in the enhanced removal.
3.3.4 Transformation products and reaction pathways
To find the degradation pathway of DCF treated with 1500 U L-1
of laccase, the reaction mixture was
analyzed at 5th, 18
th and 24
th hour of degradation. Samples were analyzed using both LDTD-MS/MS
and LC-MS/MS instruments with non-targeted scanning to find out the clearly visible peaks and
corresponding m/z values. Previously optimized methods were used for the analysis of DCF6. It was
observed that non-targeted scanning with LDTD-MS/MS did not result in the accurate identification
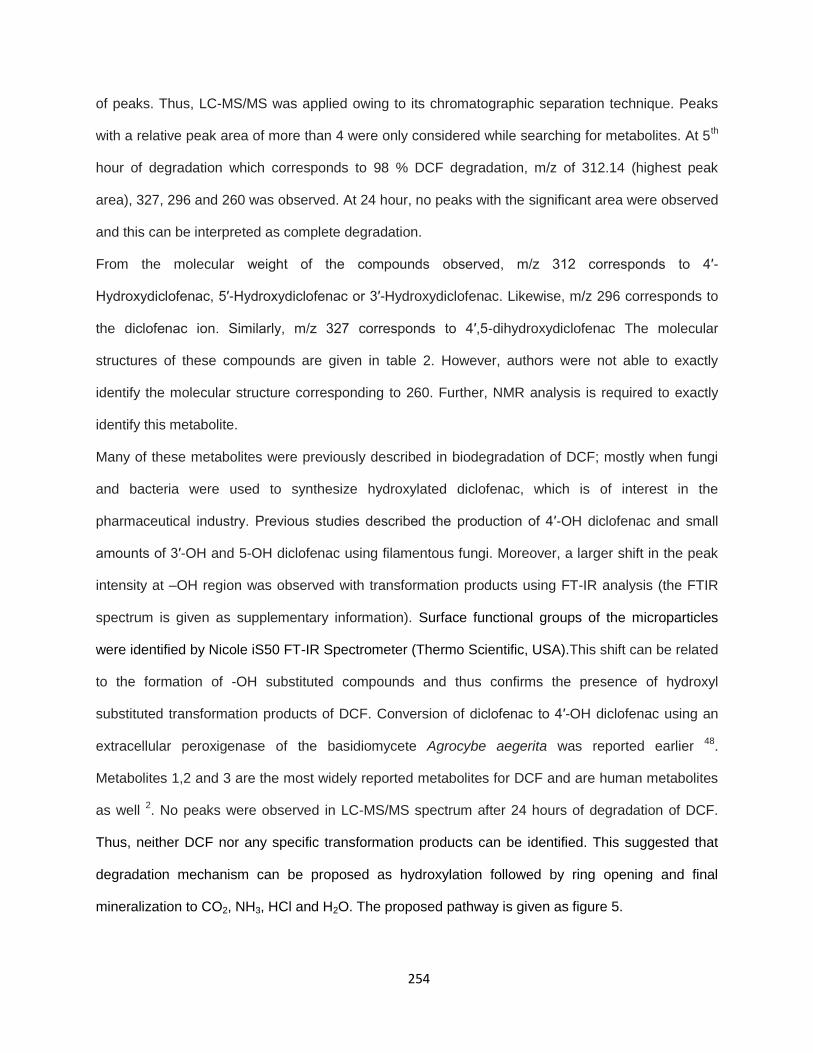
254
of peaks. Thus, LC-MS/MS was applied owing to its chromatographic separation technique. Peaks
with a relative peak area of more than 4 were only considered while searching for metabolites. At 5th
hour of degradation which corresponds to 98 % DCF degradation, m/z of 312.14 (highest peak
area), 327, 296 and 260 was observed. At 24 hour, no peaks with the significant area were observed
and this can be interpreted as complete degradation.
From the molecular weight of the compounds observed, m/z 312 corresponds to 4′-
Hydroxydiclofenac, 5′-Hydroxydiclofenac or 3′-Hydroxydiclofenac. Likewise, m/z 296 corresponds to
the diclofenac ion. Similarly, m/z 327 corresponds to 4′,5-dihydroxydiclofenac The molecular
structures of these compounds are given in table 2. However, authors were not able to exactly
identify the molecular structure corresponding to 260. Further, NMR analysis is required to exactly
identify this metabolite.
Many of these metabolites were previously described in biodegradation of DCF; mostly when fungi
and bacteria were used to synthesize hydroxylated diclofenac, which is of interest in the
pharmaceutical industry. Previous studies described the production of 4′-OH diclofenac and small
amounts of 3′-OH and 5-OH diclofenac using filamentous fungi. Moreover, a larger shift in the peak
intensity at –OH region was observed with transformation products using FT-IR analysis (the FTIR
spectrum is given as supplementary information). Surface functional groups of the microparticles
were identified by Nicole iS50 FT-IR Spectrometer (Thermo Scientific, USA).This shift can be related
to the formation of -OH substituted compounds and thus confirms the presence of hydroxyl
substituted transformation products of DCF. Conversion of diclofenac to 4′-OH diclofenac using an
extracellular peroxigenase of the basidiomycete Agrocybe aegerita was reported earlier 48
.
Metabolites 1,2 and 3 are the most widely reported metabolites for DCF and are human metabolites
as well 2. No peaks were observed in LC-MS/MS spectrum after 24 hours of degradation of DCF.
Thus, neither DCF nor any specific transformation products can be identified. This suggested that
degradation mechanism can be proposed as hydroxylation followed by ring opening and final
mineralization to CO2, NH3, HCl and H2O. The proposed pathway is given as figure 5.

255
This study provides novel insight on waste valorization and treatment of emerging contaminats.
Cost-effective production of of laccase was achieved through the utilization of residual materials as
substrates. Ecological advantages include waste management, green process, waste valorization
and sequestration of waste carbon leading to reduced carbon footprint and hence mitigation of
greenhouse gases. Moreover, produced laccase was utilized for the degradation of emerging
contaminant, diclofenac and optimal degradation conditions were identified.
4. Conclusions
Apple juice industry residue, apple pomace (49.16±2.5 U/gds) ) and pulp and paper solid waste
(52.4±2.2 U/gds) were found to be the efficient substrates for laccase production over dried alfa
fibers (14.26±0.8 U/gds). Copper sulfate was found to be an efficient inducer for laccase production
over tween 80, veratryl alcohol and phenol red. However, the inducing effect of the studied inducers
were rather limited with all substrates. At environmentally relevant concentrations (500 µg L-1
of
DCF), pH of 4.5 and temperature of 50 °C was found to be optimal for the effective degradation of
DCF with laccase. For laccase-mediated degradation, the rate of reaction was found to be zero
order at higher substrate concentrations and first order at lower substrate concentrations
(environmentally relevant). Under favorable conditions, up to 99 % degradation was observed for
DCF within 5 hours. The initial transformation products were identified by LC-MS/MS and identified
as 3′-hydroxydiclofenac, 4′-hydroxydiclofenac, and 5-hydroxydiclofenac. Laccase-catalyzed DCF
degradation mechanism has been proposed as hydroxylation ring opening and final mineralization to
CO2, NH3, and H2O and chlorine.
Acknowledgement(s):
The authors are sincerely thankful to the Natural Sciences and Engineering Research Council of
Canada (Discovery Grant 355254and NSERC Strategic Grant) and Ministère des Relations
internationales du Québec (coopération Québec-Catalanya 2012-2014- project 07.302). Sincere
thanks to Kruger Wayagamack Inc. (Trois-Rivieres, Quebec, Canada) for providing pulp and paper

256
solid waste for the studies. We are also thankful to Vergers Paul Jodoin. Inc., Quebec for providing
apple pomace for the study and Mr. Stephane Moise for technical support during analysis.
References
1. Secondes, M. F. N.; Naddeo, V.; Belgiorno, V.; Ballesteros Jr, F., Removal of emerging contaminants by simultaneous application of membrane ultrafiltration, activated carbon adsorption, and ultrasound irradiation. Journal of Hazardous Materials 2014, 264, 342-349.
2. Lonappan, L.; Brar, S. K.; Das, R. K.; Verma, M.; Surampalli, R. Y., Diclofenac and its transformation products: Environmental occurrence and toxicity - A review. Environment International 2016, 96, 127-138.
3. Acuña, V.; Ginebreda, A.; Mor, J. R.; Petrovic, M.; Sabater, S.; Sumpter, J.; Barceló, D., Balancing the health benefits and environmental risks of pharmaceuticals: Diclofenac as an example. Environment International 2015, 85, 327-333.
4. Vieno, N.; Sillanpää, M., Fate of diclofenac in municipal wastewater treatment plant — A review. Environment International 2014, 69, 28-39.
5. Zhang, Y.; Geißen, S.-U.; Gal, C., Carbamazepine and diclofenac: Removal in wastewater treatment plants and occurrence in water bodies. Chemosphere 2008, 73 (8), 1151-1161.
6. Lonappan, L.; Pulicharla, R.; Rouissi, T.; Brar, S. K.; Verma, M.; Surampalli, R. Y.; Valero, J. R., Diclofenac in municipal wastewater treatment plant: quantification using laser diode thermal desorption—atmospheric pressure chemical ionization—tandem mass spectrometry approach in comparison with an established liquid chromatography-electrospray ionization–tandem mass spectrometry method. Journal of Chromatography A 2016, 1433, 106-113.
7. Tien, M.; Kirk, T. K., Lignin-Degrading Enzyme from the Hymenomycete Phanerochaete chrysosporium Burds. Science 1983, 221 (4611), 661-663.
8. Majeau, J.-A.; Brar, S. K.; Tyagi, R. D., Laccases for removal of recalcitrant and emerging pollutants. Bioresource Technology 2010, 101 (7), 2331-2350.
9. Monteiro, M. C.; De Carvalho, M. E. A., Pulp bleaching using laccase from trametes versicolor under high temperature and alkaline conditions. Applied Biochemistry and Biotechnology 1998, 70 (1), 983.
10. Ikehata, K.; Buchanan, I. D.; Smith, D. W., Recent developments in the production of extracellular fungal peroxidases and laccases for waste treatment. Journal of Environmental Engineering and Science 2004, 3 (1), 1-19.
11. Vikineswary, S.; Abdullah, N.; Renuvathani, M.; Sekaran, M.; Pandey, A.; Jones, E. B. G., Productivity of laccase in solid substrate fermentation of selected agro-residues by Pycnoporus sanguineus. Bioresource Technology 2006, 97 (1), 171-177.
12. Shalini, R.; Gupta, D. K., Utilization of pomace from apple processing industries: a review. Journal of food science and technology 2010, 47 (4), 365-371.

257
13. Gassara, F.; Brar, S. K.; Pelletier, F.; Verma, M.; Godbout, S.; Tyagi, R. D., Pomace waste management scenarios in Québec—Impact on greenhouse gas emissions. Journal of Hazardous Materials 2011, 192 (3), 1178-1185.
14. Das, R. K.; Brar, S. K.; Verma, M., Potential use of pulp and paper solid waste for the bio-production of fumaric acid through submerged and solid state fermentation. Journal of Cleaner Production 2016, 112, Part 5, 4435-4444.
15. Oral, J.; Sikula, J.; Puchyr, R.; Hajny, Z.; Stehlik, P.; Bebar, L., Processing of waste from pulp and paper plant. Journal of Cleaner Production 2005, 13 (5), 509-515.
16. Abou-Elela, S. I.; Nasr, F. A.; Ibrahim, H. S.; Badr, N. M.; Askalany, A. R. M., Pollution prevention pays off in a board paper mill. Journal of Cleaner Production 2008, 16 (3), 330-334.
17. Abdelkafi, F.; Ammar, H.; Rousseau, B.; Tessier, M.; El Gharbi, R.; Fradet, A., Structural Analysis of Alfa Grass (Stipa tenacissima L.) Lignin Obtained by Acetic Acid/Formic Acid Delignification. Biomacromolecules 2011, 12 (11), 3895-3902.
18. Nadji, H.; Diouf, P. N.; Benaboura, A.; Bedard, Y.; Riedl, B.; Stevanovic, T., Comparative study of lignins isolated from Alfa grass (Stipa tenacissima L.). Bioresource Technology 2009, 100 (14), 3585-3592.
19. Gassara, F.; Brar, S. K.; Tyagi, R. D.; John, R. P.; Verma, M.; Valero, J. R., Parameter optimization for production of ligninolytic enzymes using agro-industrial wastes by response surface method. Biotechnology and Bioprocess Engineering 2011, 16 (2), 343-351.
20. Wolfenden, B. S.; Willson, R. L., Radical-cations as reference chromogens in kinetic studies of ono-electron transfer reactions: pulse radiolysis studies of 2,2[prime or minute]-azinobis-(3-ethylbenzthiazoline-6-sulphonate). Journal of the Chemical Society, Perkin Transactions 2 1982, (7), 805-812.
21. Collins, P. J.; Dobson, A., Regulation of Laccase Gene Transcription in Trametes versicolor. Applied and Environmental Microbiology 1997, 63 (9), 3444-3450.
22. Bourbonnais, R.; Paice, M. G., Demethylation and delignification of kraft pulp by Trametes versicolor laccase in the presence of 2,2′-azinobis-(3-ethylbenzthiazoline-6-sulphonate). Applied Microbiology and Biotechnology 1992, 36 (6), 823-827.
23. Johnson, K. A.; Goody, R. S., The Original Michaelis Constant: Translation of the 1913 Michaelis–Menten Paper. Biochemistry 2011, 50 (39), 8264-8269.
24. Marco-Urrea, E.; Pérez-Trujillo, M.; Cruz-Morató, C.; Caminal, G.; Vicent, T., Degradation of the drug sodium diclofenac by Trametes versicolor pellets and identification of some intermediates by NMR. Journal of Hazardous Materials 2010, 176 (1–3), 836-842.
25. Das, R. K.; Lonappan, L.; Brar, S. K.; Verma, M., Bio-conversion of apple pomace into fumaric acid in a rotating drum type solid-state bench scale fermenter and study of the different underlying mechanisms. RSC Advances 2015, 5 (126), 104472-104479.
26. Dhillon, G. S.; Kaur, S.; Brar, S. K., Perspective of apple processing wastes as low-cost substrates for bioproduction of high value products: A review. Renewable and Sustainable Energy Reviews 2013, 27, 789-805.

258
27. Gassara, F.; Brar, S. K.; Tyagi, R. D.; Verma, M.; Surampalli, R. Y., Screening of agro-industrial wastes to produce ligninolytic enzymes by Phanerochaete chrysosporium. Biochemical Engineering Journal 2010, 49 (3), 388-394.
28. Gassara, F.; Ajila, C. M.; Brar, S. K.; Verma, M.; Tyagi, R. D.; Valero, J. R., Liquid state fermentation of apple pomace sludge for the production of ligninolytic enzymes and liberation of polyphenolic compounds. Process Biochemistry 2012, 47 (6), 999-1004.
29. Ajila, C. M.; Gassara, F.; Brar, S. K.; Verma, M.; Tyagi, R. D.; Valéro, J. R., Polyphenolic Antioxidant Mobilization in Apple Pomace by Different Methods of Solid-State Fermentation and Evaluation of Its Antioxidant Activity. Food and Bioprocess Technology 2012, 5 (7), 2697-2707.
30. Ferreira, J.; Cornacchione, M.; Liu, X.; Suarez, D., Nutrient Composition, Forage Parameters, and Antioxidant Capacity of Alfalfa (Medicago sativa, L.) in Response to Saline Irrigation Water. Agriculture 2015, 5 (3), 577.
31. Kapoor, R. K.; Rajan, K.; Carrier, D. J., Applications of Trametes versicolor crude culture filtrates in detoxification of biomass pretreatment hydrolyzates. Bioresource Technology 2015, 189, 99-106.
32. Álvarez, J. M.; Canessa, P.; Mancilla, R. A.; Polanco, R.; Santibáñez, P. A.; Vicuña, R., Expression of genes encoding laccase and manganese-dependent peroxidase in the fungus Ceriporiopsis subvermispora is mediated by an ACE1-like copper-fist transcription factor. Fungal Genetics and Biology 2009, 46 (1), 104-111.
33. Ding, J.; Cong, J.; Zhou, J.; Gao, S., Polycyclic aromatic hydrocarbon biodegradation and extracellular enzyme secretion in agitated and stationary cultures of Phanerochaete chrysosporium. J Environ Sci (China) 2008, 20 (1), 88-93.
34. Barbosa, A. M.; Dekker, R. F. H.; Hardy, G. E. S., Veratryl alcohol as an inducer of laccase by an ascomycete, Botryosphaeria sp., when screened on the polymeric dye Poly R-478. Letters in Applied Microbiology 1996, 23 (2), 93-96.
35. Coote, N.; Kirsop, B. H., FACTORS RESPONSIBLE FOR THE DECREASE IN pH DURING BEER FERMENTATIONS. Journal of the Institute of Brewing 1976, 82 (3), 149-153.
36. Cuadra, T.; Fernández, F. J.; Tomasini, A.; Barrios-González, J., Influence of pH regulation and nutrient content on cephalosporin C production in solid-state fermentation by Acremonium chrysogenum C10. Letters in Applied Microbiology 2008, 46 (2), 216-220.
37. Brar, S. K.; Verma, M.; Tyagi, R. D.; Valero, J. R.; Surampalli, R. Y., Techno-economic analysis of bacillus thuringiensis biopesticides production from wastewater and wastewater sludge. In Moving forward wastewater biosolids sustainability: technical, managerial, and public synergy, LeBlanc, R. J.; Laughton, P. J.; Tyagi, R. D., Eds. GMSC: New Brunswick, 2007; pp 731-738.
38. Rezende, M. I.; Barbosa, A. M.; Vasconcelos, A.-F. D.; Haddad, R.; Dekker, R. F. H., Growth and production of laccases by the ligninolytic fungi, Pleurotus ostreatus and Botryosphaeria rhodina , cultured on basal medium containing the herbicide, Scepter® (imazaquin). Journal of Basic Microbiology 2005, 45 (6), 460-469.
39. Lineweaver, H.; Burk, D., The Determination of Enzyme Dissociation Constants. Journal of the American Chemical Society 1934, 56 (3), 658-666.

259
40. Eibes, G.; Debernardi, G.; Feijoo, G.; Moreira, M. T.; Lema, J. M., Oxidation of pharmaceutically active compounds by a ligninolytic fungal peroxidase. Biodegradation 2011, 22 (3), 539-550.
41. Cabana, H.; Jones, J. P.; Agathos, S. N., Preparation and characterization of cross-linked laccase aggregates and their application to the elimination of endocrine disrupting chemicals. Journal of Biotechnology 2007, 132 (1), 23-31.
42. Michniewicz, A.; Ledakowicz, S.; Ullrich, R.; Hofrichter, M., Kinetics of the enzymatic decolorization of textile dyes by laccase from Cerrena unicolor. Dyes and Pigments 2008, 77 (2), 295-302.
43. Margot, J.; Maillard, J.; Rossi, L.; Barry, D. A.; Holliger, C., Influence of treatment conditions on the oxidation of micropollutants by Trametes versicolor laccase. New Biotechnology 2013, 30 (6), 803-813.
44. Madzak, C.; Mimmi, M. C.; Caminade, E.; Brault, A.; Baumberger, S.; Briozzo, P.; Mougin, C.; Jolivalt, C., Shifting the optimal pH of activity for a laccase from the fungus Trametes versicolor by structure-based mutagenesis. Protein Engineering, Design and Selection 2005, 19 (2), 77-84.
45. Strong, P. J.; Claus, H., Laccase: a review of its past and its future in bioremediation. Crit Rev Environ Sci Technol 2011, 41.
46. Kurniawati, S.; Nicell, J. A., Variable Stoichiometry during the Laccase-Catalyzed Oxidation of Aqueous Phenol. Biotechnology Progress 2007, 23 (2), 389-397.
47. Wong, Y.; Yu, J., Laccase-catalyzed decolorization of synthetic dyes. Water Research 1999, 33 (16), 3512-3520.
48. Kinne, M.; Poraj-Kobielska, M.; Aranda, E.; Ullrich, R.; Hammel, K. E.; Scheibner, K.; Hofrichter, M., Regioselective preparation of 5-hydroxypropranolol and 4′-hydroxydiclofenac with a fungal peroxygenase. Bioorganic & Medicinal Chemistry Letters 2009, 19 (11), 3085-3087.
49. Boettcher, I. W.; Pfeilschifter, J.; Schweizer, A.; Sallmann, A.; Wenk, P., Pharmacological properties of five diclofenac metabolites identified in human plasma. Agents and Actions 1991, 34, 135-137.
50. Stulten, D.; Lamshoft, M.; Zuhlke, S.; Spiteller, M., Isolation and characterization of a new human urinary metabolite of diclofenac applying LC–NMR–MS and high-resolution mass analyses. Journal of Pharmaceutical and Biomedical Analysis 2008, 47, 371–376.
51. Stierlin, H.; Faigle, J. W.; Sallmann, A.; Kung, W.; Richter, W. J.; Kriemler, H. P.; Alt, K. O.; Winkler, T., Biotransformation of diclofenac sodium (Voltaren®) in animals and in man. Xenobiotica 1979, 9 (10), 601-610.

260
Table 1: Effect of various inducers on laccase production
Inducer
Time (day)
Laccase production (U /g of dry substrate )
Apple pomace
Alfa plant fibers
Pulp and paper
solid waste
Without
inducers
5
7
9
11
14
32.8±3
36.4±4.7
22.9±1.5
0.61±0.1
0.4±0.1
5.65±0.1
6.4±0.3
9.15±0.9
4.3±0.2
1.2±0.1
17.2±2.8
19.7±2.2
33.1±2.6
34±3.6
7.6±0.5
Tween 80
5
7
9
11
14
20.4±1.6
38.3±5.1
27.4±2.4
3.63±0.2
1.54±0.2
5.4±0.25
6.33±0.6
11.8±0.6
5.6±0.4
0.9±0.1
12.5±0.9
24±0.5
34.1±3.5
37.6±3.3
12.6±3.6
Veratryl
alcohol
5
7
9
11
14
28.6±2.5
46.6±2.5
29.8±1.6
5.78±0.9
2.65±0.02
9.7±0.7
9.49±0.4
8.26±0.7
7.2±0.6
1.1±0.2
20.2±0.1
27.8±7.6
32.8±6.5
51.2±1.6
16.6±1.6

261
Copper
sulfate
5
7
9
11
14
32.49±2.8
49.16±4.5
14.16±2.3
4.32±1.1
1.66±.0.8
7.7±0.7
9.49±0.4
14.26±0.8
7.2±0.4
3.1±0.2
14.4±0.8
40.8±.1
51.2±0.5
52.4±2.2
9.2±1.6
Phenol red
5
7
9
11
14
19.6±2.8
27.8±0.5
42±8.4
21.2±1.6
10.3±.0.9
4.1±0.4
8.8±0.5
15.3±1.8
15.8±1.1
3.4±0.8
32.2±0.8
42.9±.0.7
26.6±0.1
25.8±1.3
3.1±1.5
All inducers combined
5
7
9
11
14
19.04±1.4
32±3.2
24.4±3.2
1.63±0.6
1.57±0.1
4.3±0.6
5.2±0.4
8.26±0.9
3.4±0.2
0.8±0.1
11.2±0.5
15.04±1.4
20.4±3.7
27±1.2
9.6±0.5

262
Table 2: Diclofenac major transformation products- initial hours
Transformation product
Molecular structure
First reports on
transformation products
4'-hydroxydiclofenac
49-51
5'-hydroxydiclofenac
49-51
3'-hydroxydiclofenac
49, 51
4',5-dihydroxydiclofenac
49, 51

263
Time (days)
0 2 4 6 8 10 12 14
La
cc
as
e a
cti
vit
y (
U/g
dry
su
bs
tra
te )
0
10
20
30
40
50alfa fibers
apple pomace
pulp and paper solid waste
Figure 1: Production of laccase using alfa plant fibers, apple pomace and pulp and paper
solid waste as substrates

264
Time (hours)
0 20 40 60 80 100 120 140
Dic
lofe
nac
deg
rdat
ion
(%
)
0
20
40
60
50 µg L-1
of diclofenac
500 µg L-1
of diclofenac
5 mg L-1
of diclofenac
Figure 2: Diclofenac degradation over time, laccase activity = 50 U L-1; pH = 6.5

265
Figure 3: Laccase mediated diclofenac degradation, (A) with pH (at a constant
temperature, 25 °C); (B) with temperature (at a constant pH , 6.5) ; diclofenac
concentration = 500 μg L-1, enzyme activity = 50 U L-1,

266
Figure 4: Laccase mediated diclofenac degradation at various laccase activities;
temperature =25 °C; pH = 6.5; diclofenac concentration = 1 mg L-1
267
Figure 5: Proposed laccase mediated diclofenac degradation pathway

268
269
PART 2
ADSORPTIVE IMMOBILIZATION OF AGRO-INDUSTRIALLY
PRODUCED CRUDE LACCASE ON VARIOUS MICRO-BIOCHARS AND
DEGRADATION OF DICLOFENAC
Linson Lonappan a, Yuxue Liu a,b ,Tarek Rouissi a, Satinder Kaur Brar a*, Mausam
Verma c, Rao Y. Surampalli d
a INRS-ETE, Université du Québec, 490, Rue de la Couronne, Québec, Canada G1K 9A9
b Institute of Environment Resources, Soil and Fertilizer, Zhejiang Academy Of Agricultural
Sciences, 198 Shiqiao Road, Hangzhou 310021, P.R China
c CO2 Solutions Inc., 2300, rue Jean-Perrin, Québec, Canada G2C 1T9
d Department of Civil Engineering, University of Nebraska-Lincoln, N104 SEC P.O. Box 886105,
Lincoln, NE 68588-6105, United States
SCIENCE OF THE TOTAL ENVIRONMENT (UNDER REVIEW)

270
RÉSUMÉ
Dans cette étude, de la laccase brute produite agro-industriellement a été concentré par
ultrafiltration et immobilisé sur des microparticules de biochars de bois de pin (BC-PW), de fumier de
porc (BC-PM) et de coquille d’amandes (BC-AS). L’immobilisation de la laccase a été étudiée à
différentes activités sur les microbiochars et la cinétique de libération (désorption) de l’enzyme a été
mesurée. Le BC-PM s’est avéré être le plus efficace (31.4 ± 3.1 U g-1
) à 10 U mL-1
d’activité
enzymatique, suivi du BC-AS (24.3±4.8 U g-1
) et du BC-PW (14.58±3.3 U g-1
). De plus, les
microbiochars fonctionnalisé à l’acide citrique ont été étudié pour l’immobilisation de la laccase
brute. Les études d’isotherme ont établi que l’adsorption en monocouche homogène est le
mécanisme majeur. La désorption de la laccase a suivi une cinétique de pseudo-second ordre. La
laccase immobilisé a démontrer une capacité à être entreposer (durée de conservation) trois fois
plus élevée que la laccase libre. Finalement, la laccase immobilisée a été utilisée pour la
dégradation du DCF, un important micropolluant, et près de 100% d’enlèvement a été obtenu après
5 heures avec des concentrations représentatives de celles retrouvées dans l’environnement.
Mots clés : Laccase, biochar; diclofenac; biotransformation; immobilisation adsorptive; isotherme,
désorption

271
ABSTRACT
In this study, agro-industrially produced crude laccase was concentrated using ultrafiltration and
immobilized on pine wood (BC-PW), pig manure (BC-PM) and almond shell (BC-AS) biochar
microparticles. Immobilization of laccase was investigated at various laccase activities on micro-
biochars and the release kinetics (desorption) of the enzyme has been studied. BC-PM was found to
be the most effective (31.4±3.1 U g-1
) at 10 U mL-1
of enzyme activity followed by BC-AS (24.3±4.8
U g-1
) and BC-PW (14.58±3.3 U g-1
). In addition, citric acid functionalized micro-biochars were
studied for crude laccase immobilization. Isotherm studies established homogeneous monolayer
adsorption as major mechanism. The desorption kinetics of laccase followed pseudo-second-order.
Immobilized laccase exhibited superior storage ability/ shelf-life which were three times higher than
free laccase. Finally, the immobilized laccase was used for the degradation of micropollutant, DCF
and near 100% removal was obtained within 5 hours at an environmentally relevant concentration
(500 μg L-1
).
Keywords: Laccase; Biochar; Diclofenac; Biotransformation; Adsorptive immobilization; Isotherms;
Desorption

272
1. Introduction
Gifted with unique unprecedented catalytic activity and selectivity over a wide range of pollutants,
enzymes offer tremendous potential for environmental remediation. In particular, ligninolytic
enzymes are well known for degradation of recalcitrant pollutants (Tien & Kirk, 1983), (Majeau et al.,
2010; Strong & Claus, 2011). Along with manganese peroxidase and lignin peroxidase, laccases are
known to be the prominent enzymes in this category due to its wide substrate range, simple
requirements for catalysis, apparent stability and lack of inhibition in comparison with other enzymes
(Majeau et al., 2010). However, low thermal and pH stability ( narrow pH range in activity), loss of
catalytic activity after one cycle and huge consumption loss while being used in water environment
have remained as major obstacles in large-scale environmental applications (Jesionowski et al.,
2014). Thus, past studies investigated the improvement of enzyme stability and their properties for
environmental applications, and immobilization of enzymes on solid supports was suggested as an
effective method (Cowan & Fernandez-Lafuente, 2011; Mateo et al., 2007).
Immobilization of enzymes on solid supports is primarily based on two approaches: physical binding
and covalent binding between the enzyme and the supports. Physical binding (includes van der
Waals forces, ionic interactions, and hydrogen bonding) through adsorption is often considered as
the most economically viable method (Jesionowski et al., 2014). Enzyme-support affinity is the most
important factor in adsorptive immobilization along with a larger surface area. The presence of
specific active functional groups on the surface of the carrier along with a large surface area of the
carrier can enhance the adsorptive immobilization of enzymes on solid supports. Recently,
carbonaceous material, such as biochar is getting wide attention due to its great potential in various
domains including agricultural applications and environmental remediation (Glaser et al., 2009). The
possibility of production from waste materials, moderate surface area and abundant presence of
surface functional groups make biochar an excellent adsorbent for various contaminants (Fang et
al., 2014; Lonappan et al., 2017a). Also, due to these dependable properties, biochars can be used
as immobilization support for laccases.

273
Diclofenac (DCF), being an emerging micropollutant poses toxic concerns towards several aquatic
as well as terrestrial organisms (Lonappan et al., 2016a; Vieno & Sillanpää, 2014). Therefore, DCF
must be removed from the environmental compartments, for a sustainable and healthy environment
and ecosystem. Previous studies have demonstrated the efficiency of laccase for the degradation of
DCF (Lonappan et al., 2017b; Marco-Urrea et al., 2010). Nevertheless, these studies were mostly
focused on the production and application of free laccase for the degradation of DCF and thus,
incurred disadvantages of application of free enzyme limiting their applicability at large scale and in
long-term. Therefore, the possibility of immobilizing crude non-purified laccase produced from agro-
industrial materials (most economically convenient production method as well as through valorization
of waste materials) on micro-biochar (efficient, least expensive and valorization of waste materials)
derived from different feedstocks was investigated in this study. This approach has the dual
advantage of continuous adsorption as well as degradation of the contaminants (DCF in this study).
Moreover, this study employed the simple adsorption technique for immobilization which can be
considered as green as it avoids usage of any chemicals. Immobilization of laccase at various
concentrations on various biochars and the release of the enzyme have been studied. In addition,
the biochars were functionalized with organic acids for possible surface modifications, and their
effect on adsorption of enzymes has been investigated. Finally, the laccase-immobilized biochars
were applied for the degradation of DCF in batch mode under various experimental conditions and
the results are presented. In brief, the immobilization of non-purified laccase on organically
functionalized biochars (and non-functionalized) along with its potential application for the
degradation of model micropollutant presents the novelty elements of this study.
2. Materials and Methods
2.1 Materials
Pinewood and almond shell biochar samples were obtained from Pyrovac Inc. (Quebec, Canada).
Pinewood biochar (BC-PW) was derived from pine white wood (80% v/v) spruce and fir (20% v/v)
274
and was produced at 525±1 °C under atmospheric pressure by increasing the temperature of
biomass at the rate of 25 °C min-1
in the presence of nitrogen. Almond shell biochar (BC-AS) was
produced from almond shells slightly under atmospheric pressure at 520±1 °C for 4 h. Pig manure
biochar (BC-PM) was a gift sample from Research and Development Institute for Agri-Environment
(IRDA), Quebec, Canada. BC-PM was derived from the solid fraction of pig slurry and prepared at
400±1 °C for 2 h.
Juice industry residue, apple pomace was used as the substrate for the microorganism for enzyme
production which was gifted by Vergers Paul Jodoin Inc., Quebec. White-rot fungus, Trametes
versicolor (ATCC 20869) was used as the microorganism for the production of laccase.
Diclofenac sodium salt (98%; CAS 15307-79-6) was purchased from Fisher Scientific (Ottawa, ON,
Canada) and internal standard (IS), diclofenac-d4 was obtained from C/D/N Isotopes Inc. (Montreal,
QC, Canada). All other chemicals used in this study (including organic acids used for the
functionalization of biochars) were of analytical grade and they were obtained from Fisher Scientific
and Sigma-Aldrich (Ontario, Canada).
2.2 Methods
2.2.1 Pre-treatment of biochar
All the biochars were ground and sieved to obtain biochar microparticles less than 75 μm. This pre-
treatment produced compact, almost uniformly sized (distributed) biochar with an increased surface
area. Functionalization procedure of biochar microparticles is given in previous publication
(submitted)(Lonappan et al., 2018). In short, the micro-biochars were shaken with 2M citric acid for
24 hours. Then, the samples were centrifuged at 3000 x g and washed twice using deionized water.
Further, micro-biochar samples were dried at 60°C and used for the immobilization of laccase.

275
2.2.2 Preparation of laccase
Detailed procedure for the production of laccase has been presented elsewhere (Lonappan et al.,
2017b). In short, the fermentation substrates were adjusted to 75 ±1 % (w/w) moisture with sterile
milli-Q water. Fermentation was carried out at 30 ± 1 °C for 9 d in 500 mL Erlenmeyer flasks
containing 20 g of apple pomace. Extraction of laccase was carried out using 50 mM sodium
phosphate buffer at pH 6.5 (10/1: v/w).
Crude laccase obtained by fermentation from apple pomace was concentrated by ultrafiltration using
Sartorius stedim- SartoJet ultrafiltration system (Göttingen, Germany). Sartocon Slice Hydrosart
Cassette- 10 kDa and 100 kDa were used as the filtration membranes. Harvested enzyme was
filtered using 100 kDa membrane to remove the particles having size more than 100 kDa. Later, the
filtrate was passed through 10 kDa and the retentate having particles of molecular weight less than
10 kDa have been discarded. This resulted in semi-purification of laccases.
2.2.3 Enzyme assay
Laccase activity was determined by measuring the rate of color generation due to the enzymatic
oxidation of 2,2′-azinobis (3-ethylbenzothiazoline-6-sulfonic acid) (ABTS) to ABTS radical (ABTS+)
at 420 nm and pH 4.5. The extinction coefficient (ɛ) used was 36,000 M−1
cm−1
(Wolfenden &
Willson, 1982). The assay solution contained 100 mM citrate-phosphate as the buffer (pH 4.5), 0.5
mM ABTS and enzyme. Enzyme-ABTS mixture was incubated for 4 min and the average increase in
absorbance per min was taken. One unit of laccase activity (U L-1
) is defined as the production of 1
μM ABTS+ per min under assay conditions (Bourbonnais & Paice, 1992; Collins & Dobson, 1997).
2.2.4 Immobilization of laccase on biochars
Throughout the experiment, a constant solid: liquid ratio of 1: 5 (w/v) was maintained between
biochars and enzyme extract. Various enzyme concentrations were tested for immobilization as the

276
highest enzyme activity obtained after concentration of enzyme was 10 U mL-1
. Biochars were mixed
with crude enzyme using a vortex blender (Fisher Scientific 02215370 Vortex mixer-deluxe 120V) at
1200 rpm. Initially, the mixing was carried out for 5 h and in later experiments; the mixing was done
for 12 h (overnight) to have maximum possible adsorption of enzymes on biochars. Thus, the effect
of contact time and adsorptive immobilization was studied. Various enzyme concentrations of 0.5,
2.5, 5, 7.5, and 10 U mL-1
were studied by keeping the biochar amount constant. Similar
experiments were repeated with the functionalized biochar obtained from pine wood, pig manure and
almond shell. Citric acid was used for the functionalization of micro-biochars. After immobilization
experiments, enzyme- biochar mixture was centrifuged at 6000 x g and the liquid portion was
removed. The solid fraction was gently washed using deionized water, later centrifuged and the
liquid part was removed. Then, the remaining enzyme in the liquid was analyzed for enzyme (activity)
and hence effective enzyme immobilized on biochar was calculated in U g-1
. Enzyme- immobilized
biochar was dried at room temperature/ or by using compressed air carefully without increasing the
temperature above 28±1 °C. Moreover, 0.1 g of enzyme immobilized biochar (dried) was shaken for
15 min with 10 mL of sodium phosphate buffer at pH 6.5 and the enzyme activity in the supernatant
was measured after centrifugation. This procedure was carried out to make sure the immobilization
of enzyme on biochar surface; however, the values were not used for calculation due to the
variations in release kinetics from different biochars.
Studies on release of enzymes (desorption) from biochars were carried out under shaking conditions
over time for two days (at pH 6.5). The stability of enzyme- immobilized biochar (shelf life) was
tested after 3 months. In short, free and immobilized laccase were stored at 4± 1 °C for up to 60
days and their activities were determined in 20 days interval.
2.2.5 Characterization of laccase immobilized biochar
Particle size distribution was measured using a “Horiba particle size analyzer “(LA-950). Mean
values were taken after analyzing the samples twice. Surface morphology of micro-biochar and

277
enzyme immobilized micro-biochar was investigated using an “EVO®
50 smart scanning electron
microscope” (SEM) (Zeiss, Germany). The specific surface area of micro-biochars before and after
laccase immobilization was obtained from Brunauer, Emmett and Teller (BET) N2 adsorption
isotherms at 77 K (Autosorb-1, Quantachrome, USA). Analysis on changes in surface functional
groups of micro-biochars before and after laccase immobilization was carried out using Fourier
transform infrared (FT-IR) spectrometer (Nicolet iS50, Thermo Scientific, USA).
2.2.6 Diclofenac degradation experiments
Laccase-immobilized biochars (most suitable sample from each micro-biochar) was tested for the
degradation of DCF. The degradation experiments were carried out at room temperature and at pH
6.5. About 10 mL of 500 µg L-1
DCF was used as the initial concentration. About 0.5 g of laccase
immobilized biochar was used for the experiments. Experiments were carried out for 12 h with
continuous sampling. Supernatant from the samples was collected and mixed with equal amount of
methanol (purity >99.8%, Fisher Scientific Ottawa, ON, Canada) to stop enzyme activity. The
samples were stored at 4 °C and later analyzed for DCF using LDTD-MS/MS (Lonappan et al.,
2016a).
3. Results and discussion
3.1 Laccase: concentration by ultrafiltration and enzyme activity
The major focus of this study was on adsorptive immobilization of crude laccase on micro-biochars
from various sources. Laccase was produced using agro-industrial residue, apple pomace as the
substrate for microorganism (Lonappan et al., 2017b). Possible presence of several other
biomolecules can be expected in these crude extracts since extraction of the enzyme was carried
out from fermented apple pomace. These biomolecules/unwanted substances can include phenolic
substances, various organic acids, sugars and minor fractions of minerals lipids and proteins
(Gassara et al., 2011; Persic et al., 2017; Sato et al., 2010). Various concentrations of laccase
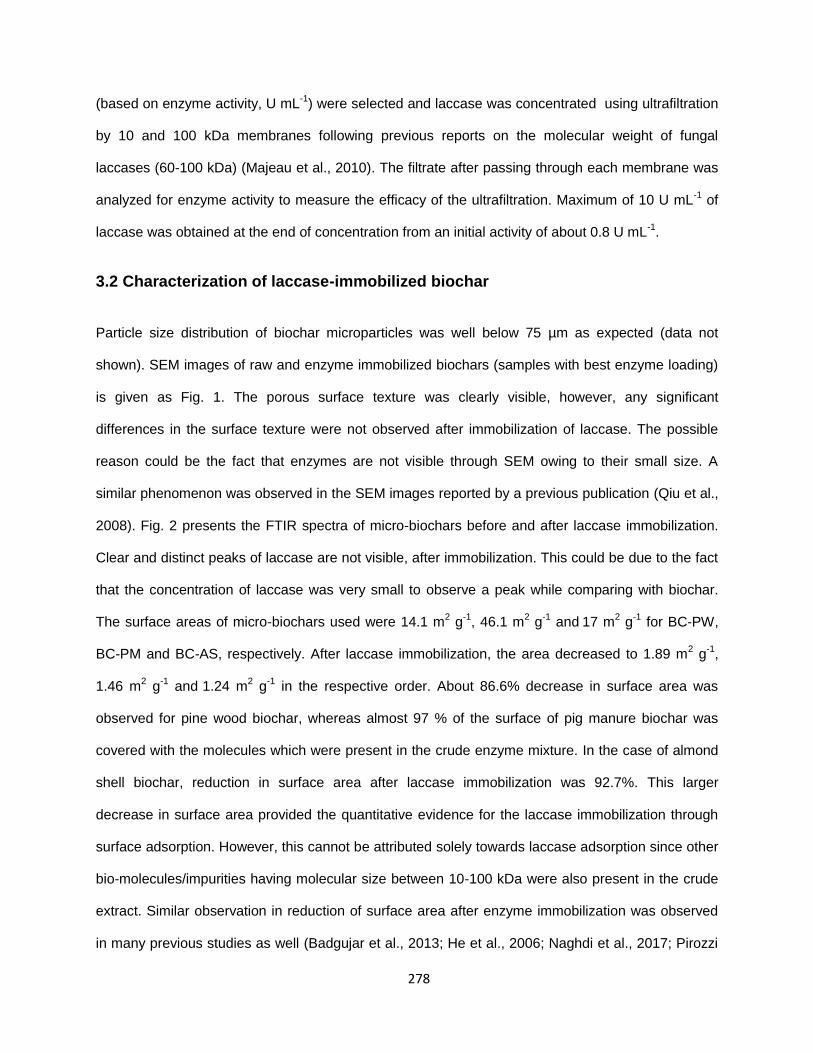
278
(based on enzyme activity, U mL-1
) were selected and laccase was concentrated using ultrafiltration
by 10 and 100 kDa membranes following previous reports on the molecular weight of fungal
laccases (60-100 kDa) (Majeau et al., 2010). The filtrate after passing through each membrane was
analyzed for enzyme activity to measure the efficacy of the ultrafiltration. Maximum of 10 U mL-1
of
laccase was obtained at the end of concentration from an initial activity of about 0.8 U mL-1
.
3.2 Characterization of laccase-immobilized biochar
Particle size distribution of biochar microparticles was well below 75 µm as expected (data not
shown). SEM images of raw and enzyme immobilized biochars (samples with best enzyme loading)
is given as Fig. 1. The porous surface texture was clearly visible, however, any significant
differences in the surface texture were not observed after immobilization of laccase. The possible
reason could be the fact that enzymes are not visible through SEM owing to their small size. A
similar phenomenon was observed in the SEM images reported by a previous publication (Qiu et al.,
2008). Fig. 2 presents the FTIR spectra of micro-biochars before and after laccase immobilization.
Clear and distinct peaks of laccase are not visible, after immobilization. This could be due to the fact
that the concentration of laccase was very small to observe a peak while comparing with biochar.
The surface areas of micro-biochars used were 14.1 m2 g
-1, 46.1 m
2 g
-1 and
17 m
2 g
-1 for BC-PW,
BC-PM and BC-AS, respectively. After laccase immobilization, the area decreased to 1.89 m2 g
-1,
1.46 m2 g
-1 and
1.24 m
2 g
-1 in the respective order. About 86.6% decrease in surface area was
observed for pine wood biochar, whereas almost 97 % of the surface of pig manure biochar was
covered with the molecules which were present in the crude enzyme mixture. In the case of almond
shell biochar, reduction in surface area after laccase immobilization was 92.7%. This larger
decrease in surface area provided the quantitative evidence for the laccase immobilization through
surface adsorption. However, this cannot be attributed solely towards laccase adsorption since other
bio-molecules/impurities having molecular size between 10-100 kDa were also present in the crude
extract. Similar observation in reduction of surface area after enzyme immobilization was observed
in many previous studies as well (Badgujar et al., 2013; He et al., 2006; Naghdi et al., 2017; Pirozzi

279
et al., 2009).For example, up to 89.1% decrease in surface area was observed in an immobilization
study of lipase on mesoporous silica(He et al., 2006).
3.3 Adsorptive immobilization of laccase onto micro-biochars
Biochar properties including surface characteristics vary according to the feedstock as well as the
pyrolysis type(Fang et al., 2014; Liu et al., 2015). In this study, three different types of biochars,
namely, BC-PW, BC-PM, and BC-AS were selected to understand the effect of surface features and
chemical composition of biochars on immobilization of laccase and identify the best feedstock.
Moreover, it is already established that reduction in particle size can increase effective surface area
(Lonappan et al., 2016b) and thus the micro-biochar was prepared and used. It has also been
reported that the presence of carboxylic acids on the support can enhance immobilization of
enzymes (Cho & Bailey, 1979). Thus, carboxylic acids functionalized biochar (through citric acid)
was tested for the improved immobilization of laccase.
Fig. 3 presents laccase binding on non-functionalized biochars. Various laccase concentrations,
(enzyme activities),such as 0.5, 2.5, 5, 7.5, and 10 U mL-1
were used for the immobilization of
laccase on micro-biochars. It was observed that binding increased as the initial laccase activity
increased. This observation was unanimous in all the three micro-biochars. This phenomenon can
be explained based on adsorption. As the initial activity of laccase increased, more laccase
molecules were available in the solution. This increased the effective interactions between micro-
biochar and laccase molecules and hence better adsorption leading to higher immobilization. The
previous study on the immobilization of 𝛼-amylase onto bentonite/chitosan composite has reported
increased adsorption of enzyme with increased initial concentration (Baysal et al., 2014). In addition,
another study on immobilization of bovine catalase onto magnetic nanoparticle reported the same
trend in loading the enzyme onto the nanoparticles. However, both studies reported that, increasing
the enzyme activity beyond a particular level will not enhance the adsorption capacity. This is
because once the saturation level (equilibrium of adsorption) has been reached, it is impossible to

280
increase the loading on the support. In this study, with increased initial laccase activity, loading was
also enhanced. Thus, it has to be hypothesized that the saturation was never reached for any of the
three biochars used for the study. As a result, it can be assumed that increasing the activity of
laccase in the crude extract will further enhance the adsorption of laccase and thus will increase the
immobilization. The aim of this study was to test the loading efficiency/immobilization efficiency of
crude laccase on biochars. Nevertheless, increasing the enzyme activity beyond 10 U mL-1
through
concentration (by ultrafiltration) for the enzymes produced by agro-industrial route was not easily
achievable. This was due to the comparatively lower yield of laccase by this method since a
maximum of 1 U mL-1
of laccase was produced(Lonappan et al., 2017b).
Since, non-purified laccase has been used for the immobilization, competitive adsorption can be
expected. Presence of other substances, such as polyphenols, proteins and carboxylic acids (Persic
et al., 2017; Sato et al., 2010) in the crude extract can reduce the adsorption of laccase, because the
available sites on the biochar can be occupied by these impurities. These factors depend upon the
selectivity of the molecules which have to be attached on to the surface of the biochar. This will vary
according to the surface features of each biochar. Of the three biochars used in this study, BC-PM
had the largest surface area (46.1 m2 g
-1 ) followed by BC-AS (17.0 m
2 g
-1) and BC-PW (14.1 m
2 g
-
1,). This difference in surface area has been reflected in enzyme loading and thus immobilization of
enzymes on the biochar surface. BC-PM was found to be most effective (31.4±3.1 U g-1
) under
optimal conditions followed by BC-AS (24.3±4.8 U g-1
) and BC-PW (14.58±3.3 U g-1
). The
effectiveness of BC-PM can also be directly correlated with their surface features which show the
presence of diverse functional groups that can be potential adsorption sites (Lonappan et al., 2017a;
Xu et al., 2014).
Previous studies have reported that COOH groups on immobilization supports can enhance the
binding of enzymes and laccase in particular on the supports (Cho & Bailey, 1979). The citric acid
treated biochars were used for the immobilization laccase and the results are presented as Fig. 4.
The selective grafting of COOH groups on biochar surface by citric acid treatment has been reported

281
in a previous study(Lonappan et al., 2018). However, unexpectedly lowered laccase binding was
observed with all the three functionalized biochars.
3.4 Loading efficiency and isotherms
Table 1 presents binding efficiency (%) of the micro-biochars at various laccase concentrations.
Laccase concentrations have been presented in international units (IU) and presented for total
volume used (10 mL) and 1 g of micro-biochar was used (Cabana et al., 2009). Due to the larger
surface area and advanced surface characteristics in comparison with other biochars, BC-PM
showed higher binding efficiency that topped at 31.4%. Maximum binding efficiency obtained from
BC-AS was 24.3% and with BC-PW, a maximum binding efficiency of 14.58% was achieved. An
increasing trend in binding efficiency was observed for all the biochars. For BC-PW, the binding
efficiency decreased initially at 25 U and a further increase was observed. However, inconsistencies
in results were observed with BC-PW which led to 12% binding efficiency at 5 U and which
decreased to 6.4% at 25 U and later an increment to 8.6%, 12.4% and reached a maximum at
14.58% corresponding to 50 U, 75 U and 100 U of laccase activity , respectively. Thus, the
immobilization efficiency was barely increased by 2.58% even with 20-fold increase in effective
enzyme concentration. This observation can be explained by selective and competitive adsorption
and hydrophobic and electrostatic interaction between the laccase and micro-biochar (Lassen &
Malmsten, 1996; Nakanishi et al., 2001). Initially, to obtain 5 U enzyme activity, crude extracts were
diluted using milliQ water and several fold dilutions (20 folds for 5 U) were made. Thus, this
procedure could possibly eliminate the potentially competing adsorbates from the crude laccase and
thus effective binding was obtained for laccase. Later, as the enzyme concentration increased, the
concentration of other impurities also increased as the dilution reduced. Along with surface area and
enzyme concentration, the selectivity of BC-PW for adsorbates is important. In this case, it has to be
assumed that BC-PW had a superior affinity towards other adsorbates than the laccase molecule.

282
For BC-PM and BC-AS, a significant increase in binding efficiency was observed with increasing
laccase concentration. This was particularly evident for BC-PM. A consistent increase in binding
from 14% to 31.4% was observed from an enzyme concentration (in terms of enzyme activity) of 5 U
to 100 U. This phenomenon can be explained based on increased adsorbate (laccase) adsorbent
(BC-PM) interactions and thus resulted in higher adsorption (Baysal et al., 2014). Moreover, it must
be assumed that in comparison with BC-PW and BC-AS along with an increased surface area, BC-
PM exhibited superior affinity towards laccase molecules. However, an increase in binding efficiency
from 6% to 24.3% was observed for BC-AS, albeit this phenomenon was not consistent since
irregularities in results were observed at 25 U.
Since immobilization process was carried out using adsorption, the adsorption isotherms were
plotted to better understand the mechanisms behind protein (laccase binding) to micro-biochars.
Langmuir and Freundlich isotherms were employed to study the adsorption process of laccase onto
biochars and equation (1) presents Langmuir isotherm model whereas equation (2) presents
Freundlich isotherm model.
𝐶𝑒𝑞𝑒
⁄ = 1𝑄0𝐾𝐿
⁄ +𝐶𝑒
𝑄0⁄ ---------------------------------------------------- (1)
log 𝑞𝑒 = log 𝐾𝐹 + 1 𝑛 log 𝐶𝑒⁄ ---------------------------------------------- (2)
Where Ce (U L-1
) is the equilibrium concentration of the adsorbate, qe (U g-1
) is the amount of
adsorbate adsorbed per unit mass of adsorbent, Qo and KL are Langmuir constants for adsorption
capacity and rate of adsorption, respectively. KF is the adsorption capacity of the adsorbent and n is
the favorability factor of the adsorption.
Table 2 shows Langmuir and Freundlich adsorption isotherm constants for micro-biochar for laccase
adsorption. Langmuir isotherm model was constructed based on the assumption of homogeneous
monolayer adsorption onto the surface with no re-adsorption of adsorbate on the surface. Therefore,

283
for BC-PW laccase adsorption was expected to be homogeneous monolayer adsorption and most
likely by physical forces (physisorption) such as electrostatic interactions, H-bonding and Van der
Waals forces (dipole-dipole, dipole-induced dipole and London (instantaneous induced dipole-
induced dipole) force). However, an R2 value of 0.92 for Freundlich adsorption isotherm contradicted
with this assumption. Even though a 1/n value of 1.052 (isotherm plot not shown) suggested a
homogeneous adsorption since adsorption becomes heterogeneous when the slope 1/n equals zero
(Baysal et al., 2014). Since this value is greater than 1 even from Freundlich adsorption isotherm
constants, homogeneous monolayer adsorption can be expected. Thus, Langmuir isotherm model
was suitable for BC-PW. However, for BC-PM and BC-AS, Freundlich adsorption isotherm model
was suitable owing to near unity R2 values (0.96 and 0.98, respectively). Thus, in these two
biochars, stronger binding sites on the surface were occupied first and the binding strength
decreased with the increasing degree of site occupancy and which reduced the adsorption with time.
At the same time, for both these biochars, favorability factor values (1/n) were well above zero and
hence instead of heterogeneous adsorption, homogenous adsorption occurred through both
physisorption and chemisorption. Of the three biochars, high rate of adsorption (KL) was shown by
BC-AS followed by BC-PM and BC-PW. Thus, theoretically and as per isotherm models, adsorption
loading of laccase was faster in BC-AS in comparison with other two micro-biochars.
3.5 Release kinetics (de-immobilization) of immobilized laccase
Results related to desorption been given as Fig. 5. It is evident that a complete desorption can never
be expected even under vigorous shaking conditions. However, this particular experiment tried to
understand the stability and binding strength of immobilized laccase as well as the nature of release
(release kinetics) of various immobilization supports (micro-biochars). Almost all previous studies
presented static release (leaching) of enzymes from the support. However, this study presents the
desorption/ release of enzymes under mild shaking conditions. It is clear that a very fast release can
be expected in this manner due to continuous shaking in comparison with static conditions.
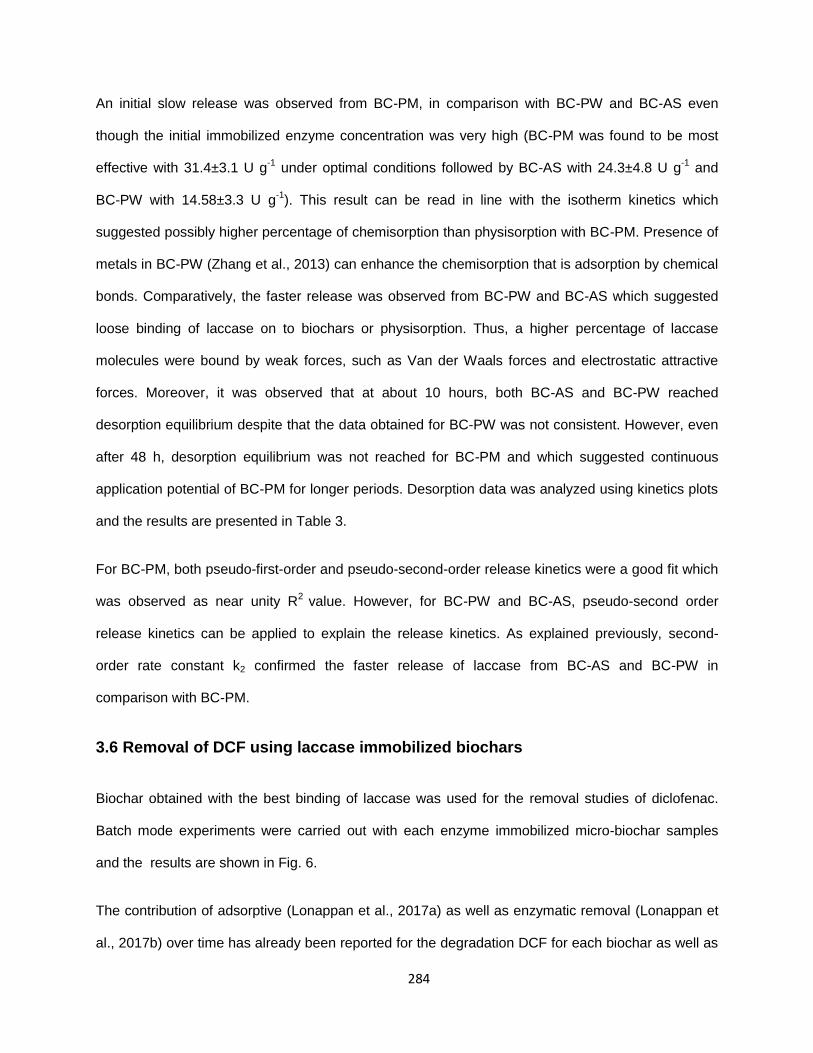
284
An initial slow release was observed from BC-PM, in comparison with BC-PW and BC-AS even
though the initial immobilized enzyme concentration was very high (BC-PM was found to be most
effective with 31.4±3.1 U g-1
under optimal conditions followed by BC-AS with 24.3±4.8 U g-1
and
BC-PW with 14.58±3.3 U g-1
). This result can be read in line with the isotherm kinetics which
suggested possibly higher percentage of chemisorption than physisorption with BC-PM. Presence of
metals in BC-PW (Zhang et al., 2013) can enhance the chemisorption that is adsorption by chemical
bonds. Comparatively, the faster release was observed from BC-PW and BC-AS which suggested
loose binding of laccase on to biochars or physisorption. Thus, a higher percentage of laccase
molecules were bound by weak forces, such as Van der Waals forces and electrostatic attractive
forces. Moreover, it was observed that at about 10 hours, both BC-AS and BC-PW reached
desorption equilibrium despite that the data obtained for BC-PW was not consistent. However, even
after 48 h, desorption equilibrium was not reached for BC-PM and which suggested continuous
application potential of BC-PM for longer periods. Desorption data was analyzed using kinetics plots
and the results are presented in Table 3.
For BC-PM, both pseudo-first-order and pseudo-second-order release kinetics were a good fit which
was observed as near unity R2
value. However, for BC-PW and BC-AS, pseudo-second order
release kinetics can be applied to explain the release kinetics. As explained previously, second-
order rate constant k2 confirmed the faster release of laccase from BC-AS and BC-PW in
comparison with BC-PM.
3.6 Removal of DCF using laccase immobilized biochars
Biochar obtained with the best binding of laccase was used for the removal studies of diclofenac.
Batch mode experiments were carried out with each enzyme immobilized micro-biochar samples
and the results are shown in Fig. 6.
The contribution of adsorptive (Lonappan et al., 2017a) as well as enzymatic removal (Lonappan et
al., 2017b) over time has already been reported for the degradation DCF for each biochar as well as

285
for laccase. In these studies, similar experimental conditions were used. With all samples, near
100% removal was observed over time. As enzymes are immobilized onto biochars, continuous
adsorption and biotransformation of DCF can be expected. It can be hypothesized that, a series of
continuous adsorption of DCF onto the vacant sites (sites available after immobilization of laccase)
of micro biochar and simultaneous degradation of DCF through laccase can be expected. DCF is
often considered as a compound resistant to laccase degradation (Nguyen et al., 2014; Yang et al.,
2013). Poor oxidative efficiency of laccase and steric hindrance between laccase and the target
molecule are the major reasons for inadequate degradation of certain micro-pollutants (d'Acunzo &
Galli, 2003). Simultaneous and complete removal of DCF is possibly due to the enhancement of
electron transfer between laccase and DCF after adsorption on the GAC surface. Furthermore, in
line with previous release kinetics experiments (section 3.6), the immobilized laccase can be used
for several cycles without loss in enzyme activity.
3.7 Storage and stability and shelf-life of immobilized laccase
Low thermal and pH stability (narrow pH range in activity) and loss of catalytic activity of enzymes
after one cycle and consumption loss while using in water environment have remained as major
obstacles in large-scale environmental remediation applications (Jesionowski et al., 2014). Thus,
past studies investigated the improvement of enzymes stability through immobilization on solid
supports (Cowan & Fernandez-Lafuente, 2011; Jesionowski et al., 2014; Mateo et al., 2007; Sheldon
& van Pelt, 2013). About 80% reduction in laccase activity (residual) was observed for free-form
laccase while being stored at 4 °C over 60 days. The loss in residual activity was about 38% after 20
days and 65% after 40 days. However, higher enzyme activity stability was observed with all
immobilized biochar samples at 4± 1 °C over 60 days. The loss in residual activity was less than
35% for all laccase immobilized biochar samples over 60 days. After 60 days, laccase immobilized
BC-PM lost 21% activity, laccase immobilized BC-PW lost 24% residual activity and laccase
immobilized BC-AS lost 32% residual activity. A similar but lower storage stability was observed for
laccase immobilized on chitosan/poly (vinyl alcohol) composite nanofibrous membranes (Xu et al.,
286
2013), however, this study employed covalent binding. Another study reported up to 98% retention in
residual activity of immobilized laccase while immobilized on Eupergit supports (Lloret et al., 2012).
To the best of our knowledge, for the first time, this study presented concise and first hand
information on adsorptive immobilization of crude enzyme (laccase) on various biochars by using the
principles of physical chemistry (adsorption). Moreover, this study demonstrated one potential
application of laccase immobilized micro-biochar for the removal of an emerging contaminant DCF.
Thus, the laccase immobilized micro-biochar can be used for several other applications including but
not limited to soil remediation, wastewater treatment etc. and which further signifies the importance
of this study.
4. Conclusions
Adsorptive immobilization of crude laccase on pine wood (BC-PW), pig manure (BC-PM) and
almond shell (BC-AS) micro-biochars were investigated using the principles of physical chemistry
and through isotherms. With all biochars, as the initial activity of laccase increases in the crude
solution, the binding capacity also increased and thus the immobilization efficiency. BC-PM was
found to be most effective (31.4±3.1 U/g) at 10 U mL -1
of enzyme activity followed by BC-AS
(24.3±4.8 U/g) and BC-PW (14.58±3.3 U/g). Homogeneous monolayer adsorption was key
mechanism behind enzyme binding on biochar. Immobilized laccase exhibited superior storage
ability/ shelf life over free laccase and which was quantified to be more than 3 times. Immobilized
laccase degraded diclofenac with near 100% and obtained within 5 hours at an environmentally
relevant concentration (500 ug L-1
).
Acknowledgement(s)
Authors are sincerely thankful to the Natural Sciences and Engineering Research Council of Canada
(Discovery Grant 355254 and NSERC Strategic Grant) and Ministère des Relations internationales
du Québec (coopération Québec-Catalanya 2012-2014-project 07.302).

287
References
Badgujar, K.C., Dhake, K.P., Bhanage, B.M. 2013. Immobilization of Candida cylindracea lipase on poly lactic acid, polyvinyl alcohol and chitosan based ternary blend film: Characterization, activity, stability and its application for N-acylation reactions. Process Biochemistry 48(9), 1335-1347.
Baysal, Z., Bulut, Y., Yavuz, M., Aytekin, Ç. 2014. Immobilization of α-amylase via adsorption onto bentonite/chitosan composite: Determination of equilibrium, kinetics, and thermodynamic parameters. Starch - Stärke 66(5-6), 484-490.
Bourbonnais, R., Paice, M.G. 1992. Demethylation and delignification of kraft pulp by Trametes versicolor laccase in the presence of 2,2′-azinobis-(3-ethylbenzthiazoline-6-sulphonate). Applied Microbiology and Biotechnology 36(6), 823-827.
Cabana, H., Alexandre, C., Agathos, S.N., Jones, J.P. 2009. Immobilization of laccase from the white rot fungus Coriolopsis polyzona and use of the immobilized biocatalyst for the continuous elimination of endocrine disrupting chemicals. Bioresource Technology 100(14), 3447-3458.
Cho, Y.K., Bailey, J.E. 1979. Immobilization of enzymes on activated carbon: Selection and preparation of the carbon support. Biotechnology and Bioengineering 21(3), 461-476.
Collins, P.J., Dobson, A. 1997. Regulation of Laccase Gene Transcription in Trametes versicolor. Applied and Environmental Microbiology 63(9), 3444-3450.
Cowan, D.A., Fernandez-Lafuente, R. 2011. Enhancing the functional properties of thermophilic enzymes by chemical modification and immobilization. Enzyme and Microbial Technology 49(4), 326-346.
d'Acunzo, F., Galli, C. 2003. First evidence of catalytic mediation by phenolic compounds in the laccase-induced oxidation of lignin models. European Journal of Biochemistry 270(17), 3634-3640.
Fang, Q., Chen, B., Lin, Y., Guan, Y. 2014. Aromatic and hydrophobic surfaces of wood-derived biochar enhance perchlorate adsorption via hydrogen bonding to oxygen-containing organic groups. Environmental Science & Technology 48(1), 279-288.
Gassara, F., Brar, S.K., Pelletier, F., Verma, M., Godbout, S., Tyagi, R.D. 2011. Pomace waste management scenarios in Québec—Impact on greenhouse gas emissions. Journal of Hazardous Materials 192(3), 1178-1185.
Glaser, B., Parr, M., Braun, C., Kopolo, G. 2009. Biochar is carbon negative. Nature Geosci 2(1), 2-2.
He, J., Song, Z., Ma, H., Yang, L., Guo, C. 2006. Formation of a mesoporous bioreactor based on SBA-15 and porcine pancreatic lipase by chemical modification following the uptake of enzymes. Journal of Materials Chemistry 16(44), 4307-4315.
Jesionowski, T., Zdarta, J., Krajewska, B. 2014. Enzyme immobilization by adsorption: a review. Adsorption 20(5), 801-821.

288
Lassen, B., Malmsten, M. 1996. Competitive Protein Adsorption Studied with TIRF and Ellipsometry. J. Colloid Interface Sci. 179(2), 470-477.
Liu, W.-J., Jiang, H., Yu, H.-Q. 2015. Development of Biochar-Based Functional Materials: Toward a Sustainable Platform Carbon Material. Chemical Reviews 115(22), 12251-12285.
Lloret, L., Hollmann, F., Eibes, G., Feijoo, G., Moreira, M.T., Lema, J.M. 2012. Immobilisation of laccase on Eupergit supports and its application for the removal of endocrine disrupting chemicals in a packed-bed reactor. Biodegradation 23(3), 373-386.
Lonappan, L., Pulicharla, R., Rouissi, T., Brar, S.K., Verma, M., Surampalli, R.Y., Valero, J.R. 2016a. Diclofenac in municipal wastewater treatment plant: quantification using laser diode thermal desorption—atmospheric pressure chemical ionization—tandem mass spectrometry approach in comparison with an established liquid chromatography-electrospray ionization–tandem mass spectrometry method. Journal of Chromatography A 1433, 106-113.
Lonappan, L., Rouissi, T., Das, R.K., Brar, S.K., Ramirez, A.A., Verma, M., Surampalli, R.Y., Valero, J.R. 2016b. Adsorption of methylene blue on biochar microparticles derived from different waste materials. Waste Management 49, 537-544.
Lonappan, L., Rouissi, T., Kaur Brar, S., Verma, M., Surampalli, R.Y. 2017a. An insight into the adsorption of diclofenac on different biochars: mechanisms, surface chemistry, and thermodynamics. Bioresource Technology.
Lonappan, L., Rouissi, T., Laadila, M.A., Brar, S.K., Hernandez Galan, L., Verma, M., Surampalli, R.Y. 2017b. Agro-industrial-Produced Laccase for Degradation of Diclofenac and Identification of Transformation Products. ACS Sustainable Chemistry & Engineering 5(7), 5772-5781.
Lonappan, L., Yuxue, L., Rouissi, T., Brar, S.K., Verma, M., Surampalli, R.Y. 2018. Development of biochar based green functional materials using organic acids for the removal of diclofenac. Science of the Total Environment (submitted)
Majeau, J.-A., Brar, S.K., Tyagi, R.D. 2010. Laccases for removal of recalcitrant and emerging pollutants. Bioresource Technology 101(7), 2331-2350.
Marco-Urrea, E., Pérez-Trujillo, M., Cruz-Morató, C., Caminal, G., Vicent, T. 2010. Degradation of the drug sodium diclofenac by Trametes versicolor pellets and identification of some intermediates by NMR. Journal of Hazardous Materials 176(1–3), 836-842.
Mateo, C., Palomo, J.M., Fernandez-Lorente, G., Guisan, J.M., Fernandez-Lafuente, R. 2007. Improvement of enzyme activity, stability and selectivity via immobilization techniques. Enzyme and Microbial Technology 40(6), 1451-1463.
Naghdi, M., Taheran, M., Brar, S.K., Kermanshahi-pour, A., Verma, M., Surampalli, R.Y. 2017. Immobilized laccase on oxygen functionalized nanobiochars through mineral acids treatment for removal of carbamazepine. Science of The Total Environment 584-585, 393-401.
Nakanishi, K., Sakiyama, T., Imamura, K. 2001. On the adsorption of proteins on solid surfaces, a common but very complicated phenomenon. Journal of Bioscience and Bioengineering 91(3), 233-244.
289
Nguyen, L.N., Hai, F.I., Price, W.E., Leusch, F.D.L., Roddick, F., McAdam, E.J., Magram, S.F., Nghiem, L.D. 2014. Continuous biotransformation of bisphenol A and diclofenac by laccase in an enzymatic membrane reactor. International Biodeterioration & Biodegradation 95(Part A), 25-32.
Persic, M., Mikulic-Petkovsek, M., Slatnar, A., Veberic, R. 2017. Chemical composition of apple fruit, juice and pomace and the correlation between phenolic content, enzymatic activity and browning. LWT - Food Science and Technology 82(Supplement C), 23-31.
Pirozzi, D., Fanelli, E., Aronne, A., Pernice, P., Mingione, A. 2009. Lipase entrapment in a zirconia matrix: Sol–gel synthesis and catalytic properties. Journal of Molecular Catalysis B: Enzymatic 59(1), 116-120.
Qiu, H., Xu, C., Huang, X., Ding, Y., Qu, Y., Gao, P. 2008. Adsorption of Laccase on the Surface of Nanoporous Gold and the Direct Electron Transfer between Them. The Journal of Physical Chemistry C 112(38), 14781-14785.
Sato, M.F., Vieira, R.G., Zardo, D.M., Falcão, L.D., Nogueira, A., Wosiacki, G. 2010. Apple pomace from eleven cultivars: an approach to identify sources of bioactive compounds. Acta Scientiarum. Agronomy 32, 29-35.
Sheldon, R.A., van Pelt, S. 2013. Enzyme immobilisation in biocatalysis: why, what and how. Chemical Society Reviews 42(15), 6223-6235.
Strong, P.J., Claus, H. 2011. Laccase: A Review of Its Past and Its Future in Bioremediation. Critical Reviews in Environmental Science and Technology 41(4), 373-434.
Tien, M., Kirk, T.K. 1983. Lignin-Degrading Enzyme from the Hymenomycete Phanerochaete chrysosporium Burds. Science 221(4611), 661-663.
Vieno, N., Sillanpää, M. 2014. Fate of diclofenac in municipal wastewater treatment plant — A review. Environment International 69, 28-39.
Wolfenden, B.S., Willson, R.L. 1982. Radical-cations as reference chromogens in kinetic studies of ono-electron transfer reactions: pulse radiolysis studies of 2,2[prime or minute]-azinobis-(3-ethylbenzthiazoline-6-sulphonate). Journal of the Chemical Society, Perkin Transactions 2 (7), 805-812.
Xu, R., Zhou, Q., Li, F., Zhang, B. 2013. Laccase immobilization on chitosan/poly(vinyl alcohol) composite nanofibrous membranes for 2,4-dichlorophenol removal. Chemical Engineering Journal 222(Supplement C), 321-329.
Xu, X., Cao, X., Zhao, L., Sun, T. 2014. Comparison of sewage sludge- and pig manure-derived biochars for hydrogen sulfide removal. Chemosphere 111(Supplement C), 296-303.
Yang, S., Hai, F.I., Nghiem, L.D., Price, W.E., Roddick, F., Moreira, M.T., Magram, S.F. 2013. Understanding the factors controlling the removal of trace organic contaminants by white-rot fungi and their lignin modifying enzymes: A critical review. Bioresource Technology 141(Supplement C), 97-108.
Zhang, P., Sun, H., Yu, L., Sun, T. 2013. Adsorption and catalytic hydrolysis of carbaryl and atrazine on pig manure-derived biochars: impact of structural properties of biochars. Journal of hazardous materials 244-245, 217-24.

290
Table 1: Immobilization efficiency of laccase at various activities on micro-biochars
BC-PW: pine wood biochar, BC-PM: pig manure biochar, BC-AS: almond shell biochar
Micro-biochar
Theoretical binding efficiency of laccase (%) at
5 U 25 U 50 U 75 U 100 U
BC-PW
12
6.4
8.6
12.4
14.58
BC-PM
14
16.4
16.6
18.53
31.4
BC-AS
6
2
9
22.4
24.3

291
Table 2: Langmuir and Freundlich adsorption isotherm constants for micro-biochar for
laccase adsorption
BC-PW: pine wood biochar, BC-PM: pig manure biochar, BC-AS: almond shell biochar
Micro-biochar
Langmuir isotherm model
Freundlich isotherm model
Q0
(U g-1
)
KL
(LU−1
)
R2 KF
(U g-1
)
n R2
BC-PW
6.87
8.28×10⁻⁵
0.96
1288.2
0.95
0.92
BC-PM
21.4
7.26×10⁻⁵
0.74
2917.4
0.80
0.96
BC-AS
2.54
1.20×10⁻⁴
0.33
28543
0.648
0.98

292
Table 3: Desorption kinetics of laccase from biochars
BC-PW: pine wood biochar, BC-PM: pig manure biochar, BC-AS: almond shell biochar
𝑞𝑒 and 𝑞𝑡 are desorbed (U g-1
) laccase from biochar at equilibrium and at time t (hour) respectively
and 𝑘1 is the rate constant of desorption (h−1
). 𝑘2 (g U-1
h-1
) is the desorption rate constant of
pseudo-second-order desorption.
Micro-biochar
Pseudo-first order model Pseudo-second order model
qe, cal.
(U g-1
)
k1
(h−1
)
R2 qe, cal.
(U g-1
)
K2
(g U-1
h-1
)
R2
BC-PW
----
-----
0.1663
16.0
1.95 x 10⁻⁴
0.99
BC-PM
-891.2
0.00092
0.99
2500
5.42 x 10⁻⁸
0.99
BC-AS
------
------
0.369
30.3
8.12 x 10⁻²
0.99

293
Figure 1: SEM of micro-biochars before and after laccase immobilization (A, D: pine wood biochar before and after laccase
immobilization; B, E: pig manure biochar before and after laccase immobilization; C, F: almond shell biochar before and
after laccase immobilization)

294
Figure 2: FTIR spectra of micro-biochars before and after laccase immobilization

295
Figure 3: Laccase loading on non-functionalized biochars at different laccase activities

296
Figure 4: Laccase loading on functionalized biochars at 10 U mL-1 laccase activity

297
Figure 5: Release (de-immobilization) of immobilized laccase on micro-biochars

298
Figure 6: Removal of DCF using enzyme immobilized micro-biochar over time

299
PART 3
COVALENT IMMOBILIZATION OF LACCASE ON CITRIC ACID
FUNCTIONALIZED MICRO-BIOCHARS DERIVED FROM DIFFERENT
FEEDSTOCKS AND REMOVAL OF DICLOFENAC
Linson Lonappan a, Yuxue Liu a,b, Florent Pourcel a , Tarek Rouissi a, Satinder
Kaur Brar a*, Rao Y. Surampalli c
a INRS-ETE, Université du Québec, 490, Rue de la Couronne, Québec, Canada G1K 9A9
b Institute of Environment Resources, Soil and Fertilizer, Zhejiang Academy of Agricultural
Sciences, 198 Shiqiao Road, Hangzhou 310021, P.R China
c Department of Civil Engineering, University of Nebraska-Lincoln, N104 SEC P.O. Box 886105,
Lincoln, NE 68588-6105, United States
WATER RESEARCH (UNDER REVIEW)

300
RÉSUMÉ
La remédiation enzymatique des micropolluants peut être une méthode efficace et durable,
cependant, les préoccupations de stabilité des enzymes représentent un inconvénient pour cette
approche. L'immobilisation des enzymes sur un support solide peut améliorer la stabilité ainsi que les
propriétés catalytiques des enzymes. Dans cette étude, le biochar dérivé de diverse matière
première a été utilisé comme support d'immobilisation tout en prenant en compte les propriétés
carbones négatives et durables du biochar. La laccase brute partiellement purifiée (concentrée) a été
immobilisée par covalence sur des microbiochars de pin (BC-PW), de fumier de porc (BC-PM) et de
coquille d'amande (BC-AS) en utilisant une glutaraldéhyde optimisée à 5% p/v après une série
d'optimisations. De plus, le prétraitement à l'acide citrique a amélioré la capacité de liaison à la
laccase de tous les microbiochars et la liaison à la laccase la plus élevée de 40,2 ± 1,8 U g-1
a été
observée avec BC-PM (34,1 ± 1,1 U g-1
). La liaison accrue de la laccase sur les BC-PM par rapport
aux biochars dérivés du bois a été attribuée à la plus grande surface (46,1 m2 g
-1) de BC-PM. BC-
PW a montré une meilleure stabilité au pH, à la chaleur, au stockage et au fonctionnement,
comparativement aux BC-AS et BC-PM. Lors de l'application du microbiochar lié à la laccase, une
élimination complète a été observée en 2 heures en mode discontinu avec 0,5 g de BC-PM lié à la
laccase à une concentration environnementale de 500 μg L-1
dans l'effluent d'eaux usées. Environ
40% de l'activité de la laccase a été retenue avec tous les microbiochars liés à la laccase après 5
cycles de traitement au diclofénac.
Mots-clés: Immobilisation covalente; Biochar; Laccase; Acide citrique, stabilité des enzymes;
Diclofénac

301
ABSTRACT
Enzymatic remediation of micropollutants can be an efficient and sustainable method, however,
stability concerns regarding enzymes is a drawback for this approach. Immobilization of enzymes on
the solid support can improve the stability as well as catalytic properties of enzymes. In this study,
biochar derived from various feedstocks were used as immobilization support while considering
biochars carbon negative as well sustainable properties. Partially purified (concentrated) crude
laccase was covalently immobilized onto pine wood (BC-PW), pig manure (BC-PM) and almond shell
(BC-AS) micro-biochars using optimized 5 % w/v glutaraldehyde after series of optimizations.
Moreover, citric acid pretreatment improved the laccase binding capacity of all the micro-biochars
and the highest laccase binding of 40.2±1.8 U g-1 was observed with BC-PM while compared with
raw BC-PM (34.1±1.1 U g-1) The enhanced binding of laccase on BC-PM over wood derived
biochars was attributed towards the higher surface area (46.1 m2 g-1 ) of BC-PM. BC-PW showed
better pH, thermal, storage and operational stability, compared with BC-AS and BC-PM. . On
applying the laccase bound micro-biochar, complete removal was observed in 2 hours under batch
mode with 0.5 g of laccase bound BC-PM at an environmentally relevant concentration of 500 µg L-1
in wastewater effluent. About 40 % of the laccase activity was retained with all the laccase-bound
micro-biochars after 5 cycles of diclofenac treatment.
Keywords: Covalent immobilization; Biochar; Laccase; Citric acid, Enzymes stability; Diclofenac

302
1. Introduction
Enzymatic remediation/bio catalysis is gaining attention in the recent past particularly, for the
bioremediation of recalcitrant compounds. Ligninolytic enzymes are being used for the past several
decades and can be a potential solution for environmental remediation, such as for the
bioremediation of micro-pollutants (Durán and Esposito 2000). Laccases are the most prominent
enzymes in this class along with lignin peroxidase and manganese peroxidase (Shraddha et al.,
2011). Laccases are used in industrial wastewater treatment, food industry (juice and wine
clarification), decolourization of dyes and for the delignification of woody fiber (Fernandez-Fernandez
et al., 2013, Homaei et al., 2013, Vernekar 2009), and most importantly for degradation of recalcitrant
pollutants (Majeau et al., 2010b). Cost-effective and eco-friendly production of laccase is a
prerequisite for industrial process viability and previous studies demonstrated waste/residue-based
production of laccase (Lonappan et al., 2017a, Postemsky et al., 2017, Sharma et al., 2017).
Even if enzymes can be produced by economically convenient methods, application of free enzymes
for the bioremediation of recalcitrant pollutants is not industrially feasible. Immobilizing the enzymes
on a solid support is a prerequisite as it can increase its activity, stability and most importantly, its
reusability (Brena et al., 2013, Zucca and Sanjust 2014). The characteristics of an ideal support for
enzyme immobilization include inexpensive nature; able to load a significant amount of enzyme per
unit weight; low hydrophobicity; inertness after immobilization; microbial resistance; pH, thermal and
mechanical resistance (Zucca and Sanjust 2014). Several immobilization supports have been
previously studied (Brena et al., 2013). However, application of biochar as an immobilization support
is not thoroughly studied nor well established. Often biochar is produced from waste/residual
materials and thus it has the potential for both cost-effectiveness as well as waste valorization.
Moreover, biochar shows strong physicochemical resistance on top of its high sorption ability and
capacity to exchange electrons (Naghdi et al., 2017, Prevoteau et al., 2016). Laccase immobilization
on pine wood nano-biochar and its mineral acid functionalized derivatives was previously studied
(Naghdi et al., 2017) and ascertained significant improvement in storage and stability. However,

303
biochars produced from different feedstock and under varied conditions exhibit completely different
properties (Lonappan et al., 2018a, Sun et al., 2014, Zhao et al., 2013). Thus, further studies are
required to establish the potential applicability of biochar as an enzyme immobilization support. In
general, two types of immobilization approaches are used and they are (i) adsorption (adsorptive
immobilization) and; (ii) chemical bonds formed between the support and enzymes (covalent
immobilization). Covalent immobilization of enzymes results in slow release of enzymes and better
storage ability/shelf-life. Thus, covalent immobilization of enzymes is preferred for long-lasting, real-
scale and continuous applications. Further, in this study, micro-biochars produced from various
feedstocks under different conditions were used for the immobilization of crude laccase which fills
lacunae existing in this research. To the best of our knowledge, biochar feedstock effects and
surface chemistry were not previously studied for covalent laccase immobilization through covalent
binding on various micro-biochars. This study investigates the possibility of covalent immobilization of
laccase onto micro-biochars prepared from the feedstock, such as pine wood (BC-PW), pig manure
(BC-PM) and almond shell (BC-AS). Surface modified derivatives of biochars using citric acid were
also tested for immobilization of laccase because of possible grafting of -COOH groups.
Diclofenac (DCF) is a largely sold and extensively used drug with an estimated global consumption
of 1443 ± 58 tons per year (Acuña et al., 2015). The toxicity and environmental effects of DCF have
been studied previously and studies revealed that DCF residues in the environment can toxic
towards both terrestrial and aquatic animals (Lonappan et al., 2016a, Petrie et al., 2015, Vieno and
Sillanpää 2014). For instance, Mehinto et al reported that even concentrations such as 1 µg L-1
can
have significant effects on liver, gills, and kidney of rainbow trout (Oncorhynchus mykiss) (Mehinto et
al., 2010). Due to these significant toxic concerns and comparatively high consumption as well
detection rate in wastewater, DCF was selected as the model contaminant to test the efficiency of
laccase immobilized micro biochar system which was developed in this study.

304
2. Materials and Methods
2.1 Materials
Pinewood and almond shell biochar samples were gifted by Pyrovac Inc. (Quebec, Canada). Pine
white wood (80% v/v) spruce and fir (20% v/v) was pyrolyzed at 525±1°C under atmospheric
pressure to produce pine wood biochar. Almond shell biochar was produced from the almond shell at
520±1°C for 4 h. Pig manure biochar was procured from Research and Development Institute for
Agri-Environment (IRDA), Quebec, Canada and produced from a solid fraction of pig slurry by
pyrolysis at 400±1 °C for 2 h. All biochars were ground using ‘Retsch RS 200’ vibratory disc mill at
1000 rpm for 10 min and obtained particles were sieved through ASTM 200 numbered sieve to obtain
a uniform particle size of less than 75 μm. Moreover, surface treatment of micro-biochars was carried
out using 2 M citric acid by shaking biochar with citric acid for 24 hours. A detailed description of
surface modification was given in a previous publication ( submitted-under review) (Lonappan et al.,
2018b).
Apple pomace was used as the substrate for laccase production and was procured from Vergers
Paul Jodoin Inc, Quebec. Trametes versicolor (ATCC 20869) was selected as fungi for the
production of laccase. Detailed production procedure of laccase has been presented elsewhere
(Lonappan et al., 2017a). In short, about 25 g of apple pomace was used as the substrate and
mycelial layer from one Petri-plate was used as the inoculum. Fermentation was carried out for 9
days at 30±1°C with 75±1% moisture. On the 9th day, laccase from fermented broth was extracted
using sodium phosphate buffer (pH 6.5, (10/1 v/w). The supernatant obtained after centrifugation was
filtered using a rough filter paper and later filtered through ultrafiltration in a Sartorius stedim −
SartoJet ultrafiltration system (Göttingen, Germany). Sartocon slice hydrosart Cassettes (10 kDa and
100 kDa) were used as the filtration membranes. Filtrates collected between 10-100 kDa were
harvested and subjected to enzyme assay. After concentration, laccase activity of 10 U mL-1
(10,000
U L-1
) was obtained and was used for the immobilization.
305
Glutaraldehyde and diclofenac sodium salt (98%; CAS 15307-79-6) was purchased from Fisher
Scientific (Ottawa, ON, Canada) and internal standard (IS), diclofenac-d4 was obtained from C/D/N
isotopes Inc. (Montreal, QC, Canada). The molecular weight of diclofenac is 296.1 g mol-1
, log Kow is
4.51 and pKa is 4.15. All other chemicals used in this study were of analytical grade and was
obtained from Fisher Scientific or Sigma-Aldrich (Canada).
2.2 Enzyme assay
Laccase activity was spectrophotometrically measured at 420 nm using 2,2′-azinobis (3-
ethylbenzothiazoline-6-sulfonic acid) (ABTS). Laccase oxidizes ABTS into ABTS radical (ABTS+) and
is blue in color. The assay solution was prepared using 100 mM citrate-phosphate as the buffer (pH
4.5), 0.5 mM ABTS and enzyme at an extinction coefficient (ɛ) of 36,000 M−1
cm−1
were used for the
calculations. Crude laccase - ABTS mixture was incubated for about five minutes and the average
per minute increase in absorbance was calculated from the slope of the straight line which was
obtained while plotting absorbance versus time. One unit of laccase activity (U mL-1
) is defined as the
production of 1 μM ABTS cation per minute under assay conditions (Bourbonnais and Paice 1992,
Collins and Dobson 1997a).
2.3 Covalent immobilization of concentrated crude laccase on micro-biochars
2.3.1 Surface modified micro-biochars
Initially, micro-biochars BC-PW, BC-PM, and BC-AS were tested as the solid support for
immobilization. Later, organic acid functionalized derivatives of the biochars were used for the
immobilization to study for any enhancement in immobilization/loading of laccase through
functionalization. Citric acid was used for the functionalization of micro-biochars following a previous
study which demonstrated that these functionalization methods are effective for introducing –COOH
functional groups on micro-biochars (Lonappan et al., 2018b). The optimal concentration of
glutaraldehyde was added to surface functionalized micro-biochars and incubated under shaking for

306
5 h and later crude laccase was added to this mixture and incubated for another 3 hours. After 3 h of
incubation, the biochar was removed, and the enzyme activity was measured.
2.3.2 Covalent immobilization of laccase onto micro-biochars
A constant solid: liquid ratio of 1:10 of biochar was used throughout the study (about 100 U of
laccase per gram). Crude concentrated laccase, glutaraldehyde , and biochar were mixed using a
vortex blender (Fisher Scientific 02215370 Vortex mixer-deluxe 120V) at 1200 rpm and at room
temperature; 25 °C and pH 6.5 .
Three strategies were tested for the effective immobilization of laccase onto biochars. In the first
method, 10 mL of crude laccase (10,000 U L-1
activity) was mixed with 1g of biochar for 5 h followed
by the addition of glutaraldehyde and mixing for 12 h (at room temperature, 25 °C) with intermediate
sampling every 3 h. This was to ensure the initial adsorption of laccase on to micro-biochars and
later reinforcement by cross-linking. Glutaraldehyde concentrations of 1 %, 2.5 %, 5% and 10 % (v/v
in the final volume) were tested along with this approach to optimize its concentration. In the second
approach, glutaraldehyde (optimized concentration) was mixed with micro-biochar for 5 h to activate
the immobilization sites; either amine groups or carboxylic acid groups which followed by the addition
of crude laccase and shaking for another 3 h (at room temperature, 25 °C). In the third approach,
crude laccase, cross-linking agent and micro-biochar was mixed together overnight (for about 12 h).
After immobilization, enzyme- biochar mixture was centrifuged, and the liquid portion was decanted
which was further analyzed for the remaining laccase activity. The solid fraction was washed twice
using deionized water, centrifuged and the liquid used for washing was discarded. Enzyme-loaded
biochar was dried under compressed air by maintaining a temperature lower than 25±1°C. Later,
laccase immobilized biochar was completely dried at room temperature and stored at 4°C.
To ensure the immobilizationand further release of laccase onto biochars, 0.1 g of laccase-
immobilized biochar was shaken with 1 mL of sodium phosphate buffer at pH 6.5 for 15 minutes. This

307
mixture was centrifuged in a tabletop centrifuge and enzyme activity in the supernatant was
analyzed.
2.4 Stability, release and reusability of laccase immobilized on micro-biochars
The pH, temperature and storage stability of crude and immobilized laccase on biochars were
studied. Crude enzyme mixture containing laccase was used as the control/blank for all these
experiments. The pH stability was tested for pHs of 2.5, 4.5, 6.5, 8.5 and 10.5. About 0.1 g of
immobilized laccase samples was added to 5 mL buffer solutions having the above-mentioned pH.
The release of laccase was studied at 25 °C while shaking in vortex blender (Fisher Scientific
02215370 Vortex mixer-deluxe 120V) at 750 rpm for 24 hours. Laccase activity in the supernatants
was measured after centrifugation at the 24th hour. Similarly, to study the thermal stability, the
samples were incubated at temperatures ranging from 10°C to 70°C for 12 h at pH 6.5. Enzyme
activity measurement was carried out at the respective temperatures. The storage stability/shelf-life
of the crude and immobilized laccase samples was measured by enzyme activity of the immobilized
laccase over a period of 5 weeks by measuring the residual activity once in a week. Laccase
immobilized samples were left at room temperature while studying the storage stability.
2.5 Characterization of micro-biochars with covalently bound laccase
Representative samples were selected based on laccase loading and used for the characterization.
The surface morphology of the laccase immobilized biochars was investigated using EVO®
50 smart
scanning electron microscope (SEM) (Zeiss, Germany). Before analysis, the samples were coated
with gold using a SPI-module sputter coater to minimize charging effect. Specific surface areas of
micro-biochars before and after immobilization were measured using Brunauer, Emmett, and Teller
(BET) technique (Autosorb-1, Quantachrome, USA). Moreover, Fourier transform infrared spectra of
micro-biochars and laccase immobilized micro-biochars were recorded using a Nicole IS50 FT-IR
Spectrometer (Thermo Scientific, USA). Transmittance was measured at 4 cm-1
resolution with 16
scans per sample.

308
2.6 Diclofenac degradation experiments
Laccase immobilized biochars with maximum laccase loading were selected from each biochar class
(BC-PW, BC-PM, and BC-AS) and was tested for the degradation of DCF. Degradation experiments
were carried out at room temperature and in wastewater (effluent collected from Quebec Urban
Community wastewater treatment plant) having a pH of 6.35. DCF was spiked to the wastewater and
the initial concentration of DCF in wastewater was maintained at 500 µg L-1
and which was
considered as environmentally relevant (Lonappan et al., 2016c). The general composition of
wastewater from Quebec Urban Community wastewater treatment plant has been presented
elsewhere (Naghdi et al., 2017, Puicharla et al., 2014). About 0.5 g of laccase immobilized micro-
biochar was incubated with 25 mL DCF solution at 25 °C for 6 hours with continuous sampling in
every 30 minutes. Supernatant from samples (by collecting about 1mL each and centrifuging in a
tabletop centrifuge) was collected and mixed with equal amount of methanol (purity >99.8%, Fisher
Scientific Ottawa, ON, Canada) to determine enzyme activity. Samples were stored at 4°C, until
analysis. Quantification of DCF was carried out using LDTD-APCI-MS/MS method and detailed
procedure is described elsewhere (Lonappan et al., 2016b).
Reusability of laccase immobilized micro-biochars was studied by measuring the residual activity of
laccase in laccase-immobilized biochars over 5 cycles of diclofenac degradation. Diclofenac
degradation experiments were carried out in batches as described before. In this experiment, in the
first batch, about 1.2 g of biochar and 120 mL of DCF solution was used. After each cycle (6 hours),
the samples were washed using milli-Q water, centrifuged, and the recovered biochar was dried
using compressed air and reused. However, 100% recovery of biochar was not obtained after
washing. The amount of biochar added after each cycle was reduced in each batch by maintaining
the same solid: liquid ratio as the first batch.

309
2.7 Quality control
All experiments were carried out in duplicates. Means and standard deviations are calculated and
data is presented with ±SD. Except for immobilization experiments, one-way ANOVA was carried out
with 95% confidence level using Sigmaplot software (version 11.0, Systat Software Inc.) and the
results which had p < 0.05 were considered as significant.
3. Results and discussion
3.1 Characterization of micro-biochars covalently bound with laccase
Scanning electron micrographs of micro-biochar as well as enzyme loaded biochar (selected laccase
immobilized samples from BC-PW, BC-PM and BC-AS (untreated) are given as Figure 1 A, B, C, D,
E and F. Figures A and B represent BC-PW before and after laccase immobilization, respectively.
Similarly, C and D represent BC-PM and E and F represent BC-AS. A clear and visible change in the
surface texture was not observed after immobilization of laccase. However, clumping was observed
after laccase immobilization with all the micro-biochars and this observation was more prominent with
BC-AS as shown in Fig. 1(F). This phenomenon can be attributed to the changes in surface charges
by the addition of immobilizing agents as well as the addition of crude laccase. The electron
micrographs showed the representative surface and porous texture of micro-biochars. Moreover, the
molecular weight of laccases is between 60–90 kDa (Shraddha et al., 2011) and which approximately
corresponds to a particle size of less than 5 nm (Erickson 2009). The micrographs showed a
minimum magnification up to 1µm and further magnification was not possible due to instrument
limitations. Thus, the electron micrographs serve the sole purpose of presenting the surface texture
of micro-biochar. However, another study presented encapsulated laccases on polyvinyl
alcohol/chitosan and showed diameters between 1-3 µm for the enzyme capsules (Xu et al., 2015).
Fourier-transform infrared spectra of micro-biochars and laccase immobilized biochars (raw biochar
not treated with citric acid) are presented in figure 2. Broad peaks which were observed around 3300

310
cm-1
were attributed towards the presence of primary, secondary amine and amides and which can
be correlated to the presence of laccases as the molecular formula of laccase show the presence of
several NH groups. However, as regards to the laccase in pure or impure form, only limited
information is available for FT-IR interpretation (Nitta et al., 2002, Ragusa et al., 2002).
Micro-biochars were having surface areas of 14.1 m2 g
-1 (BC-PW), 46.1 m
2 g
-1 (BC-PM) and
17 m
2 g
-
1 (BC-AS) respectively. After covalent immobilization surface area has been decreased to 4.85 m
2 g
-1
(BC-PW), 38.8 m2 g
-1 (BC-PM) and 12.6 m
2 g
-1 (BC-AS). The reduction in surface area was because
the crude enzyme (proteins) and glutaraldehyde was occupied on the surface along with the possible
agglomeration of micro-biochar since cross-linking agent was used.
3.2 Covalent immobilization of laccase on untreated micro-biochars
3.2.1 Optimization of glutaraldehyde concentration and incubation time
The bifunctional versatile nature of glutaraldehyde permits its application to almost any surface for
the immobilization of proteins. Glutaraldehyde is capable of reacting with the amine groups at the
surface of both enzyme and supports through the formation of Schiff’s bases and Michael’s adducts
(Isabelle Migneault 2004). In this study, as an initial optimization, 1 %, 2.5%, 5% and 10 % (v/v, in
the final volume) glutaraldehyde was used for the immobilization of laccase on BC-PW, BC-PW, and
BC-AS. Results revealed that application of 5% glutaraldehyde resulted in the optimal
loading/binding of laccase onto biochars (data not shown) in comparison with the other
glutaraldehyde concentrations. Moreover, enzyme activity/loading decreased with 10%
glutaraldehyde concentration on prolonged contact with glutaraldehyde, such as for 12 hours
(overnight) and this observation was unanimous with all the three biochars ( BC-PW : 9.8 %; BC-PM:
11.1%; BC-AS : 12.4%). This observation can be ascribed to the further interaction of laccase with a
high concentration of glutaraldehyde, which can cause inactivation of laccase (Pezzella et al., 2014).
A blank experiment without the addition of biochar was conducted by mixing only glutaraldehyde and
crude laccase and which further confirmed the inactivation of laccase by a higher concentration of

311
glutaraldehyde on prolonged contact. On the other hand, lower glutaraldehyde concentrations, such
as 1% resulted in a better immobilization on prolonged contact with glutaraldehyde for 12 h.
However, this increase was not comparable with the laccase loading observed at 5% glutaraldehyde
for 3 hours of incubation. Moreover, very high concentrations of glutaraldehyde can induce
glutaraldehyde-glutaraldehyde interactions rather than laccase-glutaraldehyde interactions, since
glutaraldehyde is a bifunctional reagent. Thus, 5% glutaraldehyde and 3 hours of contact after the
initial adsorption step was ascertained to be optimal and further studies were conducted in these
conditions. In a similar study about laccase immobilization on silica, Tavares et al. (2013) also
observed that 5 % glutaraldehyde was optimal for the covalent immobilization of laccase (Tavares et
al., 2013). Optimal glutaraldehyde concentration of 5% was used also for laccase immobilization on
the nano-copper incorporated electro spun fibrous membrane (Xu et al., 2017). Another study on
laccase immobilization on perlite revealed that 1-5 % glutaraldehyde and incubation for 4 hours
optimal for effective immobilization of laccase (Pezzella et al., 2014).
3.2.2 Effect of various methods and micro-biochars
Three approaches were used for the immobilization of laccase onto micro-biochars as described in
section 2.3.2. In the first approach, micro-biochars were mixed with crude laccase for about 5 hours.
This facilitated the adsorption of laccase on the micro-biochars and after 5 hours 1% (v/v)
glutaraldehyde was added, the reaction was allowed to continue overnight (12 h, with intermittent
sampling). This procedure allowed glutaraldehyde to cross-link both the laccase and the support
which is micro-biochar (Betancor et al., 2006).The above-mentioned optimization (section 3.2.1) was
carried out using this method (addition of glutaraldehyde in the second step: method 1). Excellent
binding of laccase onto biochars was observed as illustrated in Fig. 2 A maximum of 16.18±0.3 U g-1
laccase was covalently bound to BC-PW whereas 34.1±1.1 U g-1
and 25.3±2.8 U g-1
laccase binding
were observed with BC-PM and BC-AS, respectively. In the second approach, micro-biochars were
initially shaken with 5 % (v/v in the final mixture) glutaraldehyde for 5 hours and crude laccase was
added to this mixture and continued incubating for another 4 hours (addition of glutaraldehyde in the

312
first step: method 2). In this approach, immobilization is expected to occur through ionic exchange
between the biochar (which was pre-activated by glutaraldehyde) and laccase (Betancor et al.,
2006). Results obtained are shown in Fig.3. In method 2, almost identical results with ±5 %
difference in enzyme binding were observed in comparison with method 1. Highest laccase binding
was observed with BC-PM (33.4±2.2 U g-1
) followed by BC-AS (26.7±1.7 U g-1
) and BC-PW
(15.9±0.9 U g-1
). In the third approach, crude laccase, cross-linking agent and micro-biochar was
mixed together overnight (for about 12 hours- method 3). However, in comparison with method 1 and
method 2, significant reduction in laccase binding was observed as shown in Fig.3. Laccase binding
with all biochars as was reduced up to 31%. For instance, with BC-PM, only 23.4±3.2 U g-1
laccase
binding was observed instead of 34.1±1.1 U g-1
laccase binding with method 1. Two possible reasons
can be ascertained towards reduction in enzyme activity/binding onto micro-biochars. Firstly, the
possible denaturation of laccase by glutaraldehyde on prolonged incubation (Pezzella et al., 2014)
for about 12 hours instead of 4 hours with the other two methods. The second possible reason can
be overcrowding of surface with enzymes and multipoint attachment of enzymes onto the biochar
carriers (Bayramoğlu et al., 2008). Methods 1 and 2 were found to be effective and didn’t showed
any significant (p < 0.05) difference loading capacities. As a result method-1 was selected as the
optimized method for further studies (supplementary data - univariate tests for significance of loading
capacity).
As shown in Figures 1 and 2, biochars completely exhibited different surface texture, morphology,
surface chemistry and functional groups. This was attributed to the feedstock selection and
pyrolytic conditions (Sun et al., 2014, Zhao et al., 2013). Biochars generally ( with few exceptions)
exhibit a basic pH (Li et al., 2013) and all the three biochars used in this study showed pH values
ranging from 8 to 10.5. However, on the contrary, most of the biochars exhibits considerably high
cation exchange capacity (CEC) (Singh et al., 2010) and thus showed cationic nature. Low-ionic
strength and the cationic nature of the surface allowed a rapid immobilization of protein with the
help of glutaraldehyde (Betancor et al., 2006). Of the three biochars studied, BC-PM was found to
be the best support for laccase immobilization in comparison with BC-PW and BC-AS. Manure
313
derived biochars, such as BC-PM showed much higher CEC cation exchange capacity in
comparison with wood-based biochar similar to BC-PW and BC-AS (Singh et al., 2010). Thus, high
CEC can enhance the cationic nature of biochar which can further increase the enzyme binding
through covalent binding with glutaraldehyde. Moreover, the abundant presence of various surface
functional groups including aldehyde, amine carboxylic acids and hydroxyl groups on the biochar
surface ( (Lonappan et al., 2018a) as presented in Fig.2 are capable of forming bonds with
glutaraldehyde and which can enhance the loading. Moreover, higher binding of laccase on BC-PM
can be attributed toward the high surface area of BC-PM in comparison with BC-PW and BC-AS.
3.3 Citric acid functionalized micro-biochars and glutaraldehyde
To improve laccase binding on micro-biochars, micro-biochars were initially treated with citric acid.
Citric acid being an organic acid eliminates the toxic concerns regarding the application of mineral
acids which is very popular for surface modification of biochars and preparation of activated carbon
(Azargohar and Dalai 2006). After citric acid functionalization, the carboxylic acid functional groups
grafted on biochar surface can be observed as shown in Fig.4 (strong and broad peak around 3000
cm-1
). Improved laccase binding on biochars was observed in comparison with raw untreated micro-
biochar and the results are presented as Fig.5. Similar order in laccase binding was observed as in
section 3.2.2; BC-PM (40.2±1.8 U g-1
) having the highest laccase binding followed by BC-AS
(31.8±1.3 U g-1
) and BC-PW (20.10±3.6 U g-1
) and which corresponded to a theoretical loading
efficiency of 40.2 %, 31.8 % and 20.1 %, respectively. In comparison with non-functionalized micro-
biochar and under similar conditions (method 1), about 17 % improvement in laccase binding was
observed with BC-PM, 16 % increase was observed with BC-AS and 20% improvement was
observed with BC-PW. Similar improvement in laccase binding was observed with mineral acid
treated activated carbon and biochar and the authors attributed the increase towards the enhanced
available surface area and removal of debris on the surface of the support (Naghdi et al., 2017,
Nguyen et al., 2016). In addition, unlike mineral acids, the action of organic acids could be more
delicate which will improve the functional groups on the surface of biochar than making a big change

314
in the surface area as represented in Fig. 4. Thus, along with improved surface area, involvement of
other factors, such as chemical reactions involved in covalent binding of laccase cannot be
overruled. Initial, rapid adsorption of laccase onto biochar surface was hypothesized due to the
expected improved surface area and the presence of –COOH functional groups that can enhance the
adsorption of laccase (Nguyen et al., 2016). Later, the remaining laccase undergoes cross-linking
through the addition of glutaraldehyde (Betancor et al., 2006) and this cross-linked laccase was
further linked to the biochar surface with glutaraldehyde. In a related study, citric acid was used for
the cross-linking of hydroxyl propyl methyl cellulose (HPMC) with the help of NaH2PO4catalyst and
which improved the water vapor barrier by about 34% (Coma et al., 2003).
3.4 Stability of immobilized laccase
3.4.1 Effect of pH and temperature on immobilized laccase
Due to the changes in the ionization state of amino acids with pH (Haki and Rakshit 2003, Nitta et al.,
2002), changes in pH can affect any enzyme including laccase. However, enzymes are highly stable
in immobilized form and are susceptible to pH and temperature changes in the immobilized form
(Brena et al., 2013, Fernandez-Fernandez et al., 2013). The pH effect of free and immobilized
laccase was studied from pH of 2 to 10 and the results are presented as Fig.5 (A). In the immobilized
form, highest laccase activity was observed at pH 4.5 and which was higher than the activity
observed at pH 2.5 for all biochars. However, this difference was not very high (less than 10%
difference). It has to be noted that laccase activity is measured at pH 4.5 since which was found to
be the optimal pH for highest laccase activity under standard test conditions (Bourbonnais and Paice
1992, Collins and Dobson 1997b). There was a rapid reduction in activity was observed unanimously
for all biochars along with pH 8.5 and 10.5. However, at pH 2.5 and 6.5 laccase activities were found
to be almost similar and just below the activity which was observed at 4.5. Similar observations were
previously reported that is optimal pH of 4 for immobilized laccase on nano-pine wood biochar; in
porous glass beads (Leonowicz et al., 1988) and pH 5 for immobilized laccase on polyacrylonitrile

315
(PAN) beads (Catapane et al., 2013). In the present study, for all the biochars, the optimal pH was
found to be 4.5. Laccase in free form is not stable under high acidic and basic conditions and
significant changes in laccase activity can be observed (Lonappan et al., 2017a, Naghdi et al., 2017).
From Fig. 6(A), it is evident that immobilization has significantly improved stability of laccase and
provided resistance to inactivation with pH changes. This enhanced spectrum of pH ranges extended
the laccase applicability to large number of pollutants having high acidic and basic pH’s. At a pH of
6.5 (approximates pH of wastewater), BC-PM immobilized laccase has maintained 77% of its activity
while comparing with pH 4.5 which has shown highest activity. Under the same conditions, BC-PW
maintained 86% activity and BC-AS maintained 83% activity. The lowest laccase activity was
observed at pH 10.5 for all the biochars. However, even at pH 10.5 while comparing with pH 4.5,
BC-AS maintained 61% residual activity followed by BC-PW (60%) and BC-PM (50%). Thus,
maximum loss of 50 % was observed even with a highly basic pH and the immobilization significantly
improved the pH stability of the laccase. Moreover, it is interesting to note that the immobilized
laccase on wood derived biochar (BC-PW, BC-AS) exhibited higher stability than laccase
immobilized on manure-derived biochar (BC-PM) as shown in fig 7.
Figure 6 (B) illustrates the changes in laccase activity along with temperature. Highest laccase
activity was observed at 40 °C unanimously for all biochars. At 10°C and 25°C, similar laccase
activity was observed. However, after 40°C, a steady decrease in laccase activity bound biochars
was observed. A similar observation of highest activities between 40-50 °C was observed for the
degradation of octylphenol through immobilized laccase on PAN beads (Catapane et al., 2013) and
immobilized laccase on porous glass beads (Leonowicz et al., 1988). Another study reported that
activity of the immobilized laccase was better conserved at 40 °C than the free form (Cabana et al.,
2007). In this study, all the other results were compared with the highest activity observed at 40°C.
About 61 % activity was maintained at 70°C for BC-PW, while 59.7% was maintained for BC-PM and
72.6% for BC-AS. Thus, overall less than 40% loss in residual activity was observed even at 70°C.
Moreover, almost similar (±5% change) residual activity was observed at 55°C and 70°C. The
enhanced stability and resistance to denaturation is an important property of immobilized enzymes

316
on solid supports as observed in several previous studies (Bayramoğlu et al., 2008, Brena et al.,
2013, Cabana et al., 2007, Fernandez-Fernandez et al., 2013, Haki and Rakshit 2003, Leonowicz et
al., 1988, Nguyen et al., 2016). Enhanced thermal stability can be due to increased substrate
diffusion at higher temperatures (Xu et al., 2013). Moreover, while studying the effect of biochar
feedstock, it was observed that similar to pH resistance, the immobilized laccase on wood derived
biochar (BC-PW, BC-AS) exhibited higher thermal stability than laccase immobilized on manure-
derived biochar (BC-PM).
As a result, it can be concluded that immobilization on micro-biochars confers to the enzyme higher
resistance to pH and thermal inactivation, and feedstock selection of biochar was an important
influencing factor for pH and thermal stability of immobilized enzymes.
3.4.2 Storage stability
Laccases in free form are not stable under normal storage conditions, such as at room temperature
or under refrigeration and they lose enzyme activity gradually over time (Haki and Rakshit 2003,
Majeau et al., 2010a). This is due to the denaturation of proteins (structural and conformational
changes) over time and immobilization of enzymes on the solid support can reduce this effect
(Leonowicz et al., 1988). Figure 6 (C) presents the changes in residual laccase activity immobilized
on various micro-biochars at 25±1 °C (room temperature) over a period of five weeks. It was
observed that after 5 weeks, BC- PW has maintained 80% of its residual activity followed by 74 % for
BC-AS. However, BC-PM has maintained only 65.6% of its initial activity after 5 weeks. These results
are similar to the results which were observed with pH and temperature effect on stability. Thus, it
can be ascertained that wood derived biochars exhibit much more protection while preventing
denaturation of laccase activity in comparison with manure-derived biochars. The improved stability
of laccase can be attributed to the improved resistance capacity of enzymes towards the
conformational changes and lower flexibility of the laccase in immobilized form (Leonowicz et al.,
1988). In previous similar studies, a similar improvement in stability was observed and the percent of
improvement varied between studies (30-70%) (Pezzella et al., 2014, Tavares et al., 2013) and the

317
nature of immobilization support and the extent and mechanism of binding. Moreover, laccase
immobilized on PAN membranes has reported up to 90% retention of laccase activity in 3 weeks (Xu
et al., 2013).
3.5 Application of laccase immobilized micro-biochars for removal of DCF
3.5.1 Removal of DCF
Figure 7 (A) illustrates the removal of DCF by various laccase immobilized micro-biochars. With all
the three micro-biochars, near 100 % removal was observed within few hours. With BC-PM, near 100
% removal was observed in 2 h (98.9%) and which can be attributed to the high laccase binding with
BC-PM Moreover, BC-PM had a better surface area in comparison with the other two micro-biochars
used in this study and it is already established that BC-PM showed excellent adsorption capacity
towards DCF (Lonappan et al., 2018a). With BC-PW treated wastewater, DCF was not detected from
3rd hour onwards. Near 100 % removal was observed with BC-AS after 4 hours of treatment (98.9%)
and in the following hours, DCF was not detected in the wastewater. Similarly, almost 100 % removal
of DCF was observed with BC-PW after 5 hours of treatment. The removal efficiency of DCF followed
exactly the same order as enzyme bound to the micro-biochars and thus the release and availability
of more laccase and better availability of surface area for adsorption can be correlated with these
observations in changes with time of degradation or rate of degradation. It can be hypothesized that
some portion of diclofenac was adsorbed to the biochar surface and may not have undergone
degradation even though 100 % removal was observed. However, laccase bound to biochar
retained its activity even after several cycles of DCF degradation experiments (explained in section
3.6.2). Thus, the adsorbed diclofenac will eventually be degraded due to the presence of laccase on
biochar surface in the simultaneous process. In the previous study, where laccase was immobilized
to granular activated carbon (GAC) applied for the degradation of DCF in column mode, 100%
removal of DCF was observed in 24 hours (Nguyen et al., 2016). However, this experiment was in
column mode and which limits the contact time that was observed at the extended time for
318
degradation. Moreover, a very high concentration of DCF was used in this study and which was 2.5
mg L-1
. In another study where 12.5 mg L-1
of DCF was used as the initial concentration, complete
removal of DCF was observed within 6 hours using laccase immobilized onto multi-walled carbon
nanotubes (Xu et al., 2015). Previously under almost identical conditions, DCF adsorption onto
micro-biochars (Lonappan et al., 2018a) and DCF degradation using free laccase (Lonappan et al.,
2017b) were studied and both of these studies reported more than/ near about 5 hours for the
complete removal of DCF. However, with laccase immobilized BC-PM, this has been reduced to
almost 2 hours in this study. Steric hindrance and/ or blockades in the transfer of electrons between
laccase and DCF can be the potential reason for the lower removal rate of DCF or prolonged time for
the removal of DCF as reported in the previous study on laccase degradation. However,
immobilization of laccase on solid support could have enhanced the electron transfer between
laccase and DCF after immobilization since adsorption of DCF on micro-biochar can enhance
effective contact between laccase and micro-biochars (Nguyen et al., 2016).
3.5.2 Reusability/ operational stability of covalently immobilized laccase
The operational stability/ reusability of micro biochar bound laccase was investigated for 5 cycles of
batch DCF degradation experiments and the results are presented as Fig. 7 (B). BC-PW bound
laccase retained 46 % activity after 5 cycles as BC-AS bound laccase retained 43 % activity after 5
cycles. BC-PM was found to be the best support for laccase immobilization out of the three biochars.
In this study, BC-PM retained 40 % of laccase activity after 5 cycles. A similarretention of laccase
activity (35%) was reported for granular activated carbon bound laccase in a previous study (Nguyen
et al., 2016). Previously laccase immobilized on multiwalled carbon nanotubes retained about 73 %
activity after 7 cycles of ABTS oxidation (Xu et al., 2015). However, in the same study, under similar
conditions, only 48% retention in laccase activity was observed with polyvinyl alcohol (PVA)/chitosan
(CS) bound laccase. In this study also, as illustrated in Figure 7 (B) variations in retention of laccase
activity was observed with different immobilization support. As a result, it can be ascribed that,
operation stability depended upon the immobilization support physicochemical properties, binding

319
strength between laccase and the support and leaching kinetics of laccase from the support and
which can vary significantly.
This study presented a method for the covalent immobilization of crude on various micro-biochars. In
addition, this study demonstrated one potential application of covalently bound laccase on micro-
biochar for the removal of an emerging contaminant DCF. Covalently bound laccase demonstrated
superior storage and operation stability and thus can be used for several environmental applications
including but not limited to soil remediation, wastewater treatment etc.
4. Conclusions
Partially purified (concentrated) crude laccase was covalently immobilized onto BC-PW, BC-PM, and
BC-AS using 5 % glutaraldehyde. BC-PM (34.1±1.1 U g-1
) showed the highest laccase binding
capacity followed by BC-AS (25.3±2.8 U g-1
) and BC-PW (16.18±0.3 U g-1
). Citric acid pretreatment
improved the laccase binding capacity of all the micro-biochars and showed up to 20 % improvement
in laccase binding with BC-AS. The enhanced surface area and CEC of manure-based biochars over
wood derived biochar was attributed to the better binding of laccase on BC-PM. However, wood-
derived biochars (BC-PW and BC-AS) showed better pH, thermal, storage and operational stability
over manure-derived biochars (BC-PM). Laccase immobilized micro-biochars were used for the
removal of micro-pollutant, diclofenac and complete removal of diclofenac was observed in 2 hours
under batch mode with 0.5 g of laccase bound BC-PM at an environmentally relevant concentration
of 500 µg L-1
in the wastewater effluent. Moreover, more than 40 % of the laccase activity was
retained with all the laccase-bound biochar after 5 cycles of diclofenac treatment in which each cycle
lasted for 6 hours.
320
Acknowledgements
Authors are sincerely thankful to the Natural Sciences and Engineering Research Council of Canada
(Discovery Grant 355254 and NSERC Strategic Grant) and Ministère des Relations internationales
du Québec (coopération Québec-Catalanya 2012-2014-project 07.302).
References
Acuña, V., Ginebreda, A., Mor, J.R., Petrovic, M., Sabater, S., Sumpter, J. and Barceló, D. (2015) Balancing the health benefits and environmental risks of pharmaceuticals: Diclofenac as an example. Environment International 85, 327-333.
Azargohar, R. and Dalai, A.K. (2006) Twenty-Seventh Symposium on Biotechnology for Fuels and Chemicals. McMillan, J.D., Adney, W.S., Mielenz, J.R. and Klasson, K.T. (eds), pp. 762-773, Humana Press, Totowa, NJ.
Bayramoğlu, G., Kiralp, S., Yilmaz, M., Toppare, L. and Arıca, M.Y. (2008) Covalent immobilization of chloroperoxidase onto magnetic beads: Catalytic properties and stability. Biochemical Engineering Journal 38(2), 180-188.
Betancor, L., López-Gallego, F., Alonso-Morales, N., Dellamora, G., Mateo, C., Fernandez-Lafuente, R. and Guisan, J.M. (2006) Immobilization of Enzymes and Cells. Guisan, J.M. (ed), pp. 57-64, Humana Press, Totowa, NJ.
Bourbonnais, R. and Paice, M.G. (1992) Demethylation and delignification of kraft pulp by Trametes versicolor laccase in the presence of 2,2′-azinobis-(3-ethylbenzthiazoline-6-sulphonate). Applied Microbiology and Biotechnology 36(6), 823-827.
Brena, B., Gonzalez-Pombo, P. and Batista-Viera, F. (2013) Immobilization of enzymes: a literature survey. Methods Mol Biol 1051, 15-31.
Cabana, H., Jones, J.P. and Agathos, S.N. (2007) Preparation and characterization of cross-linked laccase aggregates and their application to the elimination of endocrine disrupting chemicals. Journal of Biotechnology 132(1), 23-31.
Catapane, M., Nicolucci, C., Menale, C., Mita, L., Rossi, S., Mita, D.G. and Diano, N. (2013) Enzymatic removal of estrogenic activity of nonylphenol and octylphenol aqueous solutions by immobilized laccase from Trametes versicolor. Journal of Hazardous Materials 248-249(Supplement C), 337-346.
Collins, P.J. and Dobson, A. (1997a) Regulation of Laccase Gene Transcription in Trametes versicolor. Applied and Environmental Microbiology 63(9), 3444-3450.
Collins, P.J. and Dobson, A. (1997b) Regulation of Laccase Gene Transcription in Trametes versicolor. Appl Environ Microbiol 63(9), 3444-3450.

321
Coma, V., Sebti, I., Pardon, P., Pichavant, F.H. and Deschamps, A. (2003) Film properties from crosslinking of cellulosic derivatives with a polyfunctional carboxylic acid. Carbohydrate Polymers 51(3), 265-271.
Durán, N. and Esposito, E. (2000) Potential applications of oxidative enzymes and phenoloxidase-like compounds in wastewater and soil treatment: a review. Applied Catalysis B: Environmental 28(2), 83-99.
Erickson, H.P. (2009) Size and Shape of Protein Molecules at the Nanometer Level Determined by Sedimentation, Gel Filtration, and Electron Microscopy. Biological Procedures Online 11, 32-51.
Fernandez-Fernandez, M., Sanroman, M.A. and Moldes, D. (2013) Recent developments and applications of immobilized laccase. Biotechnology advances 31(8), 1808-1825.
Haki, G.D. and Rakshit, S.K. (2003) Developments in industrially important thermostable enzymes: a review. Bioresource Technology 89(1), 17-34.
Homaei, A.A., Sariri, R., Vianello, F. and Stevanato, R. (2013) Enzyme immobilization: an update. Journal of chemical biology 6(4), 185-205.
Isabelle Migneault, C. (2004) Glutaraldehyde: behavior in aqueous solution, reaction with proteins, and application to enzyme crosslinking. BioTechniques 37.
Leonowicz, A., Sarkar, J.M. and Bollag, J.-M. (1988) Improvement in stability of an immobilized fungal laccase. Applied Microbiology and Biotechnology 29(2), 129-135.
Li, X., Shen, Q., Zhang, D., Mei, X., Ran, W., Xu, Y. and Yu, G. (2013) Functional Groups Determine Biochar Properties (pH and EC) as Studied by Two-Dimensional 13C NMR Correlation Spectroscopy. PLOS ONE 8(6), e65949.
Lonappan, L., Brar, S.K., Das, R.K., Verma, M. and Surampalli, R.Y. (2016a) Diclofenac and its transformation products: Environmental occurrence and toxicity - A review. Environment International 96(Supplement C), 127-138.
Lonappan, L., Pulicharla, R., Rouissi, T., Brar, S.K., Verma, M., Surampalli, R.Y. and Valero, J.R. (2016b) Diclofenac in municipal wastewater treatment plant: quantification using laser diode thermal desorption—atmospheric pressure chemical ionization—tandem mass spectrometry approach in comparison with an established liquid chromatography-electrospray ionization–tandem mass spectrometry method. Journal of Chromatography A 1433(Supplement C), 106-113.
Lonappan, L., Pulicharla, R., Rouissi, T., Brar, S.K., Verma, M., Surampalli, R.Y. and Valero, J.R. (2016c) Diclofenac in municipal wastewater treatment plant: quantification using laser diode thermal desorption—atmospheric pressure chemical ionization—tandem mass spectrometry approach in comparison with an established liquid chromatography-electrospray ionization–tandem mass spectrometry method. Journal of Chromatography A 1433, 106-113.
Lonappan, L., Rouissi, T., Kaur Brar, S., Verma, M. and Surampalli, R.Y. (2018a) An insight into the adsorption of diclofenac on different biochars: Mechanisms, surface chemistry, and thermodynamics. Bioresource Technology 249(Supplement C), 386-394.
Lonappan, L., Rouissi, T., Laadila, M.A., Brar, S.K., Galan, L.H., Verma, M. and Surampalli, R.Y. (2017a) Agro-industrial-Produced Laccase for Degradation of Diclofenac and Identification of Transformation Products. ACS Sustainable Chemistry & Engineering 5, 5772-5781.

322
Lonappan, L., Rouissi, T., Laadila, M.A., Brar, S.K., Hernandez Galan, L., Verma, M. and Surampalli, R.Y. (2017b) Agro-industrial-Produced Laccase for Degradation of Diclofenac and Identification of Transformation Products. ACS Sustainable Chemistry & Engineering 5(7), 5772-5781.
Lonappan, L., Yuxue, L., Rouissi, T., Brar, S.K., Verma, M. and Surampalli, R.Y. (2018b) Development of biochar based green functional materials using organic acids for the removal of diclofenac. Science of the Total Environment (submitted)
Majeau, J.-A., Brar, S.K. and Tyagi, R.D. (2010a) Laccases for removal of recalcitrant and emerging pollutants. Bioresource Technology 101(7), 2331-2350.
Majeau, J.A., Brar, S.K. and Tyagi, R.D. (2010b) Laccases for removal of recalcitrant and emerging pollutants. Bioresour Technol 101(7), 2331-2350.
Mehinto, A.C., Hill, E.M. and Tyler, C.R. (2010) Uptake and Biological Effects of Environmentally Relevant Concentrations of the Nonsteroidal Anti-inflammatory Pharmaceutical Diclofenac in Rainbow Trout (Oncorhynchus mykiss). Environmental Science & Technology 44(6), 2176-2182.
Naghdi, M., Taheran, M., Brar, S.K., Kermanshahi-Pour, A., Verma, M. and Surampalli, R.Y. (2017) Immobilized laccase on oxygen functionalized nanobiochars through mineral acids treatment for removal of carbamazepine. Sci Total Environ 584-585, 393-401.
Nguyen, L.N., Hai, F.I., Dosseto, A., Richardson, C., Price, W.E. and Nghiem, L.D. (2016) Continuous adsorption and biotransformation of micropollutants by granular activated carbon-bound laccase in a packed-bed enzyme reactor. Bioresource Technology 210(Supplement C), 108-116.
Nitta, K., Kataoka, K. and Sakurai, T. (2002) Primary structure of a Japanese lacquer tree laccase as a prototype enzyme of multicopper oxidases. Journal of Inorganic Biochemistry 91(1), 125-131.
Petrie, B., Barden, R. and Kasprzyk-Hordern, B. (2015) A review on emerging contaminants in wastewaters and the environment: current knowledge, understudied areas and recommendations for future monitoring. Water Res 72, 3-27.
Pezzella, C., Russo, M.E., Marzocchella, A., Salatino, P. and Sannia, G. (2014) Immobilization of a Pleurotus ostreatus Laccase Mixture on Perlite and Its Application to Dye Decolourisation. BioMed Research International 2014, 11.
Postemsky, P.D., Bidegain, M.A., Gonzalez-Matute, R., Figlas, N.D. and Cubitto, M.A. (2017) Pilot-scale bioconversion of rice and sunflower agro-residues into medicinal mushrooms and laccase enzymes through solid-state fermentation with Ganoderma lucidum. Bioresour Technol 231, 85-93.
Prevoteau, A., Ronsse, F., Cid, I., Boeckx, P. and Rabaey, K. (2016) The electron donating capacity of biochar is dramatically underestimated. Sci Rep 6, 32870.
Puicharla, R., Mohapatra, D.P., Brar, S.K., Drogui, P., Auger, S. and Surampalli, R.Y. (2014) A persistent antibiotic partitioning and co-relation with metals in wastewater treatment plant—Chlortetracycline. Journal of Environmental Chemical Engineering 2(3), 1596-1603.
Ragusa, S., Cambria, M.T., Pierfederici, F., Scirè, A., Bertoli, E., Tanfani, F. and Cambria, A. (2002) Structure–activity relationship on fungal laccase from Rigidoporus lignosus: a Fourier-transform infrared spectroscopic study. Biochimica et Biophysica Acta (BBA) - Proteins and Proteomics 1601(2), 155-162.

323
Sharma, A., Gupta, V., Khan, M., Balda, S., Gupta, N., Capalash, N. and Sharma, P. (2017) Flavonoid-rich agro-industrial residues for enhanced bacterial laccase production by submerged and solid-state fermentation. 3 Biotech 7(3), 200.
Shraddha, Shekher, R., Sehgal, S., Kamthania, M. and Kumar, A. (2011) Laccase: Microbial Sources, Production, Purification, and Potential Biotechnological Applications. Enzyme Research 2011, 217861.
Singh, B., Singh, B.P. and Cowie, A.L. (2010) Characterisation and evaluation of biochars for their application as a soil amendment. Soil Research 48(7), 516-525.
Sun, Y., Gao, B., Yao, Y., Fang, J., Zhang, M., Zhou, Y., Chen, H. and Yang, L. (2014) Effects of feedstock type, production method, and pyrolysis temperature on biochar and hydrochar properties. Chemical Engineering Journal 240(Supplement C), 574-578.
Tavares, A.P.M., Rodríguez, O., Fernández-Fernández, M., Domínguez, A., Moldes, D., Sanromán, M.A. and Macedo, E.A. (2013) Immobilization of laccase on modified silica: Stabilization, thermal inactivation and kinetic behaviour in 1-ethyl-3-methylimidazolium ethylsulfate ionic liquid. Bioresource Technology 131(Supplement C), 405-412.
Vernekar, M., S. S. Lele (2009) Laccase: Properties and applications. Bio Resources 4((4)), 1694-1717.
Vieno, N. and Sillanpää, M. (2014) Fate of diclofenac in municipal wastewater treatment plant — A review. Environment International 69(Supplement C), 28-39.
Xu, R., Chi, C., Li, F. and Zhang, B. (2013) Laccase–Polyacrylonitrile Nanofibrous Membrane: Highly Immobilized, Stable, Reusable, and Efficacious for 2,4,6-Trichlorophenol Removal. ACS Applied Materials & Interfaces 5(23), 12554-12560.
Xu, R., Cui, J., Tang, R., Li, F. and Zhang, B. (2017) Removal of 2,4,6-trichlorophenol by laccase immobilized on nano-copper incorporated electrospun fibrous membrane-high efficiency, stability and reusability. Chemical Engineering Journal 326(Supplement C), 647-655.
Xu, R., Tang, R., Zhou, Q., Li, F. and Zhang, B. (2015) Enhancement of catalytic activity of immobilized laccase for diclofenac biodegradation by carbon nanotubes. Chemical Engineering Journal 262(Supplement C), 88-95.
Zhao, L., Cao, X., Mašek, O. and Zimmerman, A. (2013) Heterogeneity of biochar properties as a function of feedstock sources and production temperatures. Journal of Hazardous Materials 256-257(Supplement C), 1-9.
Zucca, P. and Sanjust, E. (2014) Inorganic materials as supports for covalent enzyme immobilization: methods and mechanisms. Molecules 19(9), 14139-14194.
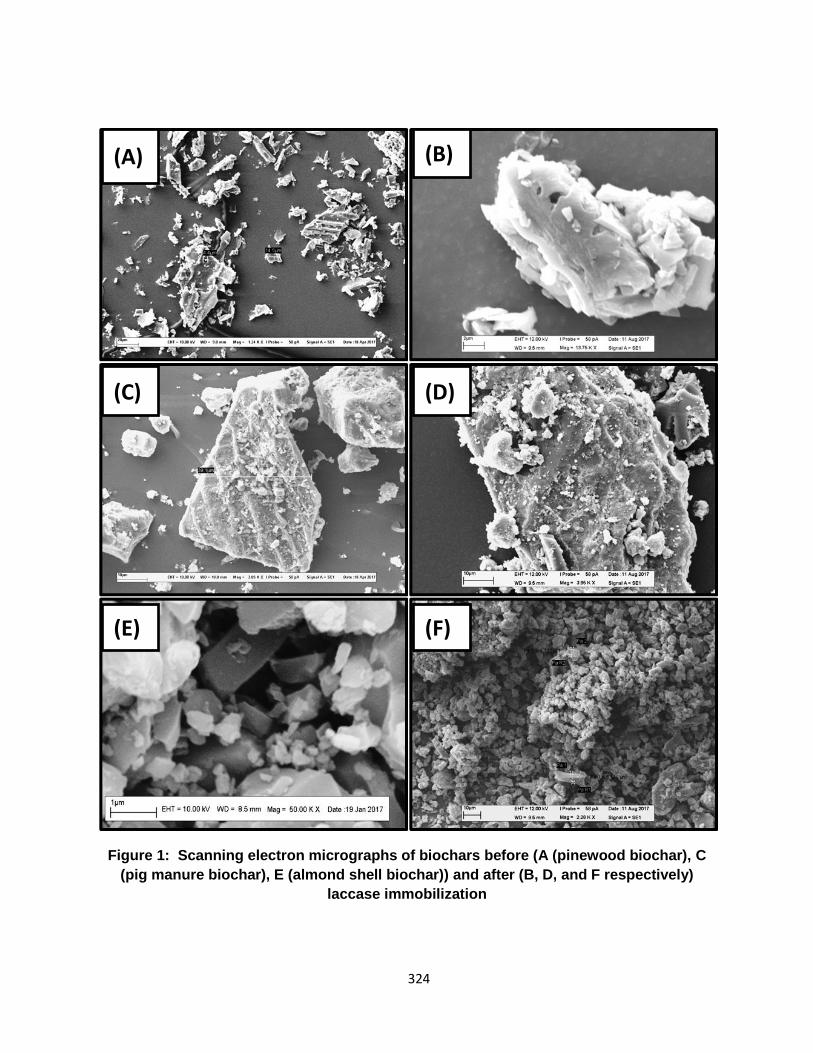
324
Figure 1: Scanning electron micrographs of biochars before (A (pinewood biochar), C
(pig manure biochar), E (almond shell biochar)) and after (B, D, and F respectively)
laccase immobilization
(F) (E)
(D) (C)
(A) (B)

325
Figure 2: FTIR spectra of micro-biochars before and after laccase immobilization

326
Figure 3: Covalent-immobilization of laccase onto micro-biochars by different methods

327
Figure 4: FTIR spectra of citric acid functionalized micro-biochars

328
BC-PW: pine wood biochar, BC-PM: pig manure biochar, BC-AS: almond shell biochar
Figure 5: Covalent-immobilization of laccase onto citric acid functionalized micro-
biochars (method-1)

329
BC-PW: pine wood biochar, BC-PM: pig manure biochar, BC-AS: almond shell biochar
Figure 6: Effect of A) pH; B) temperature and; C) 5 weeks storage on activity of covalently
immobilized laccase on citric acid functionalized micro-biochars

330
BC-PW: pine wood biochar, BC-PM: pig manure biochar, BC-AS: almond shell biochar
Figure 7: (A) Diclofenac removal by laccase immobilized micro-biochars and; (B) operational stability of laccase
immobilized micro-biochars
331
CHAPTER 5
THE BIOCHAR- ENZYME IMPREGNATED MICROSYSTEM (BEMS)

332

333
REMOVAL OF DICLOFENAC USING MICROBIOCHAR FIXED-BED
COLUMN BIOREACTOR
Linson Lonappan a, Tarek Rouissi a, Yuxue Liu a,b, Satinder Kaur Brar a*, Mausam
Verma C, Rao Y. Surampalli d
a INRS-ETE, Université du Québec, 490, Rue de la Couronne, Québec, Canada G1K 9A9
b Institute of Environment Resources, Soil and Fertilizer, Zhejiang Academy of Agricultural
Sciences, 198 Shiqiao Road, Hangzhou 310021, P.R China
c CO2 Solutions Inc., 2300, rue Jean-Perrin, Québec, Canada G2C 1T9
d Department of Civil Engineering, University of Nebraska-Lincoln, N104 SEC P.O. Box 886105,
Lincoln, NE 68588-6105, United States
JOURNAL OF ENVIRONMENTAL CHEMICAL ENGINEERING (SUBMITTED)

334
RÉSUMÉ
Le microbiochar préparé à partir de bois de pin (BC-PW), de fumier de porc (BC-AS) et de coquille
d'amande (BC-PW) a été évalué pour l'élimination du DCF à des concentrations environnementales
pertinentes dans des conditions de fonctionnement continu. Les biochars ont été caractérisés pour
la taille des particules, les métaux totaux, la composition élémentaire, la surface spécifique, la
porosité, la texture de surface et les groupes fonctionnels. De plus, l'enzyme ligninolytique laccase a
été immobilisée sur des microbiochars et testée pour l'élimination / biodégradation du DCF dans des
conditions optimales obtenues à partir d'expériences sur colonne d'adsorption. On a trouvé que le
BC-PM était un adsorbant efficace par rapport au BC-PW et BC-AS. Cette efficacité était attribuée à
une plus grande surface spécifique, à la porosité et à la présence de divers groupes fonctionnels
contenant des métaux. À une concentration pertinente pour l'environnement (500 μg L-1
), BC-PM a
montré une capacité d'adsorption de 4,10 mg g-1
avec une masse de lit de 2 g, un débit de 2 mL
min-1
et un pH de 6,5. Pour tous les biochars, l'absorption de DCF à travers une colonne à lit fixe
dépendait de la masse de l'adsorbant (hauteur du lit) et de la concentration de DCF. La capacité
d'adsorption diminue avec l'augmentation de la hauteur du lit, alors qu'elle augmente avec la
concentration croissante de DCF. Les modèles de Thomas et Yoon-Nelson ont été appliqués avec
succès pour prédire les courbes de percée, indiquant que ces modèles étaient utiles pour la
conception et la mise à l'échelle des colonnes de biochar à lit fixe. Le biochar lié à la laccase
présentait une efficacité d'élimination supérieure à celle du biochar brut et une amélioration
significative dans le temps percé a été observée, qui a été attribué à la biodégradation du DCF dans
la colonne.
Mots-clés: biochar; diclofénac; contaminant émergent; adsorption; colonne à lit fixe; biodégradation;
laccase

335
ABSTRACT
Laccase bound biochar as a fixed-bed column for the removal of emerging contaminant,
diclofenac(DCF) provides novel insights into valorization of waste materials, application of
environmentally benign sorbents and removal of DCF with possibilities of scaling up for larger
applications. Micro-biochar prepared from pine wood (BC-PW) pig manure (BC-PM) and almond
shell (BC-AS) were evaluated for the removal of DCF at environmentally relevant concentrations
under continuous fixed–fed column operating conditions. Biochars were characterized for particle
size, total metals, elemental composition, surface area, porosity, surface texture and functional
groups. igninolytic enzyme laccase was immobilized on micro-biochars and tested for
removal/biodegradation of DCF under optimized conditions obtained from adsorption column
experiments. BC-PM was found to be an effective adsorbent for BC-PW and BC-AS and which was
attributed to the higher surface area, porosity, and presence of various functional groups containing
metals. At an environmentally relevant concentration (500 g L-1
), BC-PM exhibited an adsorption
capacity of 4.10 mg g-1
with bed mass: 2g, flow rate: 2 mL min-1
and at pH: 6.5. For all biochars,
uptake of DCF through a fixed-bed column was dependent on the mass of adsorbent (bed height)
and DCF concentration. Adsorption capacity decreased with increasing bed height whereas
increased with increasing DCF concentration. The Thomas and Yoon–Nelson models were
successfully applied to predict the breakthrough curves, indicating that these models were used for
designing and scaling – up fixed-bed biochar columns. Laccase bound biochar exhibited higher
removal efficiency over the raw biochar and significant improvement in breakthrough time was
observed which was attributed to the biodegradation of DCF in the column.
Keywords: biochar; diclofenac; emerging contaminant; adsorption; fixed-bed column; interfaces

336
1. Introduction
In the past decade pharmaceuticals and personal care products (PPCPs) were widely detected in
environmental compartments, particularly in surface, waste and groundwater 1.. Non-steroidal anti-
inflammatory drug (NSAID) diclofenac (DCF) is one of the widely detected pharmaceuticals in
wastewater 2 with an estimated annual consumption of about 1443 ± 58 tons/ year
3, DCF stands
among one of the top 20 generic molecules used worldwide. Diclofenac is detected in low ng L-1
to
high μg L-1
concentrations in waste and surface water 4 and the ability of conventional wastewater
treatment plants (WWTPs) to remove diclofenac from wastewater is rather limited 2, 4
. Diclofenac has
been detected in liver, kidney, and gill of fishes and has been correlated to physiological alteration in
aquatic animals even at concentrations of 1 μg L-1
. It is also among one of the very few drugs that
can cause toxic effects to bacteria, invertebrates and algae 4, 5
. Frequent detection of DCF and its
metabolites in the environment and feeble degradation/removal in WWTPs demands efficient
treatment methods for DCF. Advanced treatment methods, such as membrane filtration, ozonation,
and oxidation and electro-dialysis have been tested by several researchers in the past 6, 7
. However,
the majority of these processes are often laden with challenges, such as high capital/ running costs
and produces undesired by-/transformation products which are often toxic.
For the past several decades, adsorption has been used as one of the reliable processes for the
removal of various organic and inorganic contaminants. Even with the availability of various
advanced treatment methods, adsorption still remains as one of the best and efficient methods for
the removal of organic contaminants owing to its inexpensive and universal nature, flexibility and
ease of operation and after all its high efficiency and effectiveness 8. Activated carbon produced from
various materials was one of the most studied adsorbents for the removal of DCF 9-11
; however, the
majority of these studies were carried out in batch mode. Batch mode studies cannot be considered
as a standalone removal/treatment method while considering the feasibility and scaling up
possibilities for higher loads of contaminated water. Handful studies so far have explored fixed bed
adsorption column as a treatment method for the removal of DCF. Until date, granular activated
337
carbon and clay based hybrid materials fixed bed columns were reported to be effective for the
removal of DCF 12, 13
. Enzymatic degradation of micropollutants has emerged as an effective tool for
the degradation of several contaminants including DCF14, 15
. Ligninolytic enzyme laccase has shown
superior ability for the degradation of DCF14
. Even though enzymes are highly effective and
versatile biological catalysts their application in free form incurs challenges such as low operational
stability, difficulties in recovery and reuse along with high costs. Immobilization of enzymes of solid
supports has been suggested as a remedial measure to overcome these challenges16
.
Biochar is a carbon-enriched material produced from a variety of biomass by pyrolysis under
oxygen-limited conditions at a relatively low temperature. Biochar typically exhibits high biochemical
stability, well-developed pore structures, large surface area, and exceptional adsorption properties17
.
Moreover, due to the copious presence of various surface functional groups, biochar is known to
adsorb various organic and inorganic contaminants with anionic and cationic properties 18
. Biochar
as a cost-effective and value-added material for various applications is rapidly emerging as a new
research domain. On this outset, studies on biochar as a fixed bed column for the removal of DCF
shows the possibility of valorization of wastes and removal of DCF with possibilities of scaling up for
larger volumes. Production of biochar from waste/residual materials could render fixed bed column
zero-waste, cost-effective and environmentally benign. Moreover, laccase can be immobilized on
biochar and thus complete removal can be expected through simultaneous adsorption of the
contaminant on biochar and degradation through the immobilized laccase.
This study investigates the removal of DCF through adsorption onto micro-biochar fixed bed column.
Biochar from various origins has been used as the fixed bed column. Moreover, laccase immobilized
biochar has been used as the column bioreactor under optimized conditions for the effective removal
of DCF. To the best of our knowledge, no similar prior study has been carried out using unmodified
biochar as fixed bed column and hence entails the novelty elements of the present study. Moreover,
to the best of our knowledge, no other previous study investigated on “micro-biochar fixed-bed
column bioreactor” for the removal of any micropollutants.

338
2. Material and methods
2.1 Materials
Pinewood biochar sample was obtained from Pyrovac Inc. (Quebec, Canada) and pig manure
biochar was procured from Research and Development Institute for Agri-Environment” (IRDA),
Quebec, Canada. Pinewood biochar (BC-PW) was derived from pine white wood (80% v/v) spruce
and fir (20% v/v) and was produced at 525±1°C under atmospheric pressure by increasing the
temperature of biomass at the rate of 25 °C/min in the presence of nitrogen for 20 minutes. Pig
manure biochar (BC-PM) was derived from the solid fraction of pig slurry and prepared at 400±1 °C
for 2 h. Biochar obtained from reactor outlet was non-uniform and bigger in size (about 2- 3 mm).
The biochar was thus ground and sieved to get a uniform size distribution. Particles were ground
and sieved through ASTM no: 200 sieves (corresponds to 75 μm mesh size) to obtain a uniform size
distribution of micron level. Through grinding, particle size reduced and therefore surface area was
also increased 19
which in turn resulted in increased active sites for adsorption. Moreover, according
to the International Union of Pure and Applied Chemistry (IUPAC) guideline- “Terminology for related
polymers and applications (IUPAC Recommendations 2012, 19
microparticles are considered to be
particles with diameters between 1-100 μm. Further, application of nanoparticles can enhance the
efficiency of the system in fixed bed column mode however often difficult to operate due to
difficulties, such as leaching of particles during operation and heavy resistance and pressure drop
inside the column. Moreover, “toxic concerns” regarding nanoparticles still remains as an unattended
problem 20
. Thus, micro-sized particles were selected as the suitable material for molding fixed bed
columns for this study. For preparing microparticles, samples were ground by ‘Retsch RS 200’
vibratory disc mill at 750 rpm for 2 minutes and sieved through ASTM 200 numbered sieve
(corresponds to less than 75μm particle size) for 10 minutes.
Apple industry residue, apple pomace was used as the substrate for laccase production and
Trametes versicolor (ATCC 20869) was used as fungi for the production of laccase. Details

339
regarding laccase production have been published before. 21
After extraction, laccase has been
concentrated using Sartorius stedim − SartoJet ultrafiltration system (Göttingen, Germany). About
1.1 U mL-1
of laccase activity was obtained after concentration.
Prefabricated Bio-Rad chromatography columns (1.0 × 20 cm; Econo-column) were used as column
beds for filling biochar. Diclofenac sodium salt (98%; CAS 15307-79-6) was purchased from Fisher
Scientific (Ottawa, ON, Canada) and internal standard (IS), diclofenac-d4 was obtained from C/D/N
Isotopes Inc. (Montreal, QC, Canada). Adsorption experiments were carried out in Milli-Q water and
prepared using Milli-Q/Milli-RO Millipore system (Milford, MA, USA). Wastewater collected from
tertiary treatment stage of Quebec Urban Community wastewater treatment plant (spiked with 500
µg L-1
of DCF) was used for testing the biodegradation column.
2.2 Methods
2.2.1 Characterization of biochar, enzyme assay, and analysis of diclofenac
Particle size distribution of raw and biochar microparticles were measured using Horiba particle size
analyzer (LA-950 Laser Particle Size Analyzer, Horiba, Japan. Scanning electron micrographs were
captured using EVO®
50 smart scanning electron microscope (SEM) (Zeiss, Germany). Specific
surface area and porosity of the microparticles were obtained from Brunauer, Emmett and Teller
(BET) N2 adsorption isotherms at 77 K (Autosorb-1, Quantachrome, USA). Surface functional groups
on the microparticles were identified by Nicole iS50 FT-IR Spectrometer (Thermo Scientific, USA).
Elemental analysis of micro-biochar was carried out using TruSpec® Micro- CHN analyzer
(Michigan, USA). Metals in biochar were quantified by ICP-AES (Varian, California; USA). Other
characterization details regarding the biochars used were given in previous publications 19, 22
.
Laccase activity was measured at 420 nm using 2,2′-azinobis (3-ethylbenzothiazoline-6-sulfonic
acid) (ABTS). Detailed procedure has been given in the previous publication14
. Analysis of DCF was
performed by LDTD-MS/MS technique as described by Lonappan et. al 2.
340
2.2.2 Fixed bed column adsorption studies
Column experiments were conducted using a glass column (1 cm inner diameter, 20 cm long)
packed with biochar (2 g and 5 g) and sealed with glass wool below and above and then the column
was packed with glass beads ( 3mm diameter; Fisher Scientific, Ottawa, ON, Canada ). This
measurement confirmed compactness of adsorbent and removed the possible pressure drop and
dead volumes inside the column. Diclofenac sodium solution (prepared and stored in an amber
reservoir of 4 L capacity) was pumped from the top of the column using a peristaltic pump. Various
DCF concentrations were tested (from 500 ug L-1
to 5 mg L-1
) and the concentration chosen (500 ug
L-1
) was close to the concentration of DCF which was observed in some wastewaters. A constant
flow rate of 2mL min -1
was used throughout the study. pH (6.5) and temperature (25± 1 °C) was
kept constant throughout the experiment by preparing solutions in milli-Q water and by conducting
experiments at room temperature. Effluents were collected at various time intervals and centrifuged
(if necessary) at 11600 x g for 10 minutes in a MiniSpin® plus centrifuge for removing any traces of
biochar. Samples were analyzed for remaining DCF in the liquid.
Performance indicators of the fixed-bed column can be calculated from the following equations 23, 24
.
The loading behavior of biochar onto the fixed-bed column was expressed in terms of the normalized
concentration C0/Ct (where C0 and Ct are the inlet and outlet (at time t) DCF concentrations,
respectively) for a given mass of biochar (bed height) and corresponds to breakthrough curve.
Effluent volume can be calculated using the Equation 1.
𝑉𝑒𝑓𝑓 = 𝑄𝑡𝑡𝑜𝑡𝑎𝑙 (1)
Where, t total and Q are the time of exhaustion (hour) and volumetric flow rate (mL min-1
),
respectively. For a fixed DCF concentration and constant flow rate, the total area above the
breakthrough curve can be calculated by integrating the total adsorbed concentration, Cad (mg L-1
)
Vs t (hours) plot and can be used to find total adsorbed DCF capacity, qtotal (mg)as given in Equation
2:

341
𝑞𝑡𝑜𝑡𝑎𝑙 =𝑄
1000∫ 𝐶𝑎𝑑
𝑡=𝑡𝑡𝑜𝑡𝑎𝑙
𝑡=0𝑑𝑡 (2)
The equilibrium uptake qeq ( μg g-1
) of the column was calculated from Equation 3:
𝑞𝑒𝑞 =𝑞𝑡𝑜𝑡𝑎𝑙
𝑥 (3)
Where x (g) is the total dry weight of biochar in the fixed-bed column. The total amount of DCF
adsorbed into the column, Wtotal (mg) was calculated from Equation 4:
𝑊𝑡𝑜𝑡𝑎𝑙 =𝐶𝑡 𝑄𝑡𝑡𝑜𝑡𝑎𝑙
1000 (4)
The removal percent of DCF at saturation can be obtained from Equation 5:
𝑅(%) =𝑞𝑡𝑜𝑡𝑎𝑙
𝑊𝑡𝑜𝑡𝑎𝑙 ∗ 100 (5)
Finally, breakthrough adsorption capacity can be calculated from the following Equation 6:
𝑞𝑏 = {𝐶𝑖−𝐶𝑏
𝑥} 𝑏𝑣 (6)
Where, Ci and Cb are the initial and breakthrough concentrations (mg L-1
); bv is the breakthrough
volume of DCF solution in liters and x is the mass of the adsorbent used (g).
2.2.3 Microbiochar fixed-bed column bioreactor
For immobilization of laccase on microbiochars, about 100 mL of crude laccase (1.1 U mL-1
activity)
was mixed with 10 g of microbiochar for 5 h followed by the addition of glutaraldehyde ( 5% v/v).
This mixture was further shaken for another 7 hours h (at room temperature, 25 °C). Later, the
laccase-biochar mixture was centrifuged and biochar was removed. The supernatant was analyzed
for enzyme activity and theoretical binding of laccase on biochar was calculated. Laccase
immobilized biochar was dried at room temperature and used for column packing. About 5 g biochar
was used for the column packing. Wastewater (effluent from wastewater treatment plant) spiked

342
with 500 µg L-1
of DCF was used for testing the biodegradation column. Experiments were carried
out under optimized conditions which were obtained from the adsorption studies. Further
experiments were carried out as described in section 2.2.2.
3. Results and discussion
3.1 Characterization of biochars and immobilization of laccase on microbiochars
Particle size distribution of biochars as obtained and micro-biochars are given as Fig. 1. For raw BC-
PW, mean particle size was recorded to be 942.5 ± 438.8 µm, whereas, for raw BC-PM, mean
particle size was ≈482.1µm. Through grinding and sieving, the particle size was reduced to ≈36.3 µm
and ≈30.6 µm, respectively for BC-PW and BC-PM. Thus, biochar used to fill adsorption columns
was “micro-biochar” according to IUPAC guidelines.
Obtained specific surface area of micro biochars was 13.3 m2 g
-1 and 43.5 m
2 g
-1, respectively for
BC-PW and BC-PM. The total pore volume of micro BC-PW was obtained as 0.0208 mL g-1
for
pores smaller than 5650.9 Å (diameter), (at P/Po = 0.99660) and pore width (mode value) was
obtained as 27.69 Å. Previous studies also reported similar results for biochar prepared from pine
wood through fast pyrolysis 25
. Moreover, BET experiments resulted in a type-1 isotherm which
corresponds to microporous solids 25
. Unfortunately, porosity analysis failed for micro BC-PM
samples and a further increase in degassing temperature was not useful since samples started
thermal decomposition. Both CO2 and N2 were not able to replace already occupied sorption sites
and thus pointed towards the possibility of irreversible chemisorption. This was further confirmed by
the TGA profile which is given in figure 2. It was clear that thermostability of BC-PM was lower in
comparison with BC-PW. However, further analysis by scanning electron microscope revealed the
porous nature of biochars and thus confirmed that micro BC-PM too has a porous nature. Scanning
electron micrographs of BC-PW and BC-PM are given as Fig. 3. SEM photographs of biochar
samples showed rough and uneven surfaces with the presence of several pores and can effectively
sorb DCF.

343
The FTIR spectra of biochars are given in Fig. 4. For pinewood biochar (BC-PW), after pyrolysis,
some hydroxyl moiety remains in sample 26
and the sharp peak near 3400 cm-1
suggested the
presence a free hydroxyl group. Due to the plant source origin of BC-PW presence of
lignin/cellulose-derived transformation products was observed 17
(multiple peaks starting around
1600 cm-1
to 700 cm-1
). Another peak at 1584 cm-1
indicated aromatic ring modes which are
characteristic of lignocellulose materials, such as Pinewood (softwood) 27
. A strong peak at 1197 cm-
1 was attributed to phenolic C-O bond. The peak at 750 cm
-1 was due to aromatic C-H bend. The
FTIR spectra of pig manure biochar (BC-PM) suggested complex functional groups consisting of a
mixture of minerals and organic matter. For pig manure biochar, a narrow peak at 3400 cm-1
indicated the presence of secondary amines. The peak at 2533 cm-1
attributed towards the presence
of mercaptans (S-H stretch). A broad and strong peak of around 1422 cm-1
indicated the presence of
aromatics (C–C stretch). Peak around 1114 cm-1
was attributed to C-O stretch and signifies the
presence of carboxylic acids. Peaks around 874 cm-1
and 563 cm-1
can be assigned to PO43−
group.
The peak around 712 cm-1
could be due to the presence of calcium and peak around 617 cm-1
could
be due to the presence of disulfides (S-S) stretching. In addition, peak around 563 cm-1
was
attributed towards the presence of alkyl halides.
Further, an attempt to quantitatively analyze results obtained from FTIR was made through analysis
of samples for elemental composition and metals. Functional groups and presence of certain metals
as well as oxygen can affect adsorption 28
. The chemical composition of biochar microparticles is
given as Table 1. In comparison with BC-PW, total carbon was very low in BC-PM and was about 58
%. In BC-PW, total carbon constituted about 84 % and the presence of inorganic materials in very
small quantities made BC-PW as an organically rich adsorbent. Total hydrogen and nitrogen
constituted about 4.5 % in composition. In addition, about 1-2 g/kg of Ca, Fe and K was also present
in BC-PW. In comparison with BC-PW, biochar derived from pig manure (BC-PM) showed the
abundant presence of metals through ICP analysis and which was also confirmed by FTIR analysis.
Usually, biochar from pig manure feedstock contains metals in high concentrations due to its swine

344
manure origin 29-31
.Very high concentrations of Ca( about 45.5 g/kg) was observed in BC-PM
followed by P (about 22.6 g/kg) , K (about 21 g/ kg) , Fe (about 10g/kg), Mg (about 10.1 g/kg),
S(about 8.4 g/kg) and Na (8 g/kg). Thus, pig manure biochar was rich with inorganic compounds as
already reported by previous studies 30, 31
BC-PW resulted with 0.7 U g-1
of laccase whereas, for BC-PM it was 0.9 U g-1
. Laccase was
covalently immobilized onto the microbiochars with the help of crosslinking agent glutaraldehyde.
Further, laccase immobilized microbiochars were used for the packing of the column.
3.2 Adsorption of diclofenac onto biochars
BC-PM exhibited enhanced adsorption potential over BC-PW. For a DCF concentration ≤500 ug L-1
,
the flow rate of 2 mL min -1
and biochar mass of 2 g BC-PM about 89 % DCF was removed in the
first 30 minutes, whereas for BC-PW, the removal was about 60%. Previous studies have also
reported the enhanced capacity of pig manure biochar for the removal of various contaminants 19, 29
.
Under fixed-bed continuous flow conditions, initially, biochar at the top of the column gets saturated
and maximum removal takes place during the beginning which was reflected in these results. The
adsorption zone moves downward with time and reaches the exit of the bed and at this time, the
concentration of DCF in the effluent becomes equal to the influent. A plot of effluent and influent
concentration ratios (Ct/C0) versus elapse time (t) will result in ‘breakthrough curve’. The enhanced
adsorption capacity of BC-PM over BC-PW can be correlated with the higher surface area of BC-
PM. Moreover, apart from higher surface area, the presence of metals, such as Ca and Mg can
enhance DCF adsorption29
by forming precipitates. In this study, elemental analysis and metal
analysis (table 1) showed that Mg (g/kg) ( PM- 10.1, PW- 0.14) and Ca (PM- 45.4 and PW- 1.7)
concentrations are much higher in PM than PW and thus formed precipitates which in turn resulted
in enhanced adsorption. Another possible reason can be the porous structure of biochars. With the
micro-sized pores, sieving effects can be observed for DCF due to its relatively larger structure 32
.

345
Thus, with increased ratios of larger sized pores, DCF can get better contact with biochar surface in
comparison with other carbonaceous adsorbents 33
, resulting in enhanced adsorption.
3.3 Fixed bed adsorption columns under various experimental conditions
3.3.1 Effect of initial DCF concentration
Keeping flow rate and mass of biochar constant at 2 mL min -1
and 2 g, respectively, the effect of two
initial DCF concentrations (0.5 mg L-1
and 5 mg L-1
) were studied and breakthrough curves are
presented as fig.5. The breakthrough time decreased with increasing influent DCF concentration. At
lower and environmentally relevant initial DCF concentration (0.5 mg L-1
)5 the breakthrough curves
were spread in a wide range and the ‘breakthrough rate’ was slower. With increased initial DCF
concentration, the slopes become steep in breakthrough curves owing to the faster mass transfer
flux from the bulk solution to the particle surface as a result of the increased diffusion coefficient.
This phenomenon is much more visible for BC-PM than BC-PW. However, for both biochars,
breakthrough curves were not very steep which indicated that the exhaustion of the bed was
relatively slow. For BC-PW, a breakthrough was obtained at the 18th hour for 0.5 mg L
-1 DCF and at
the 5th hour for 5 mg L
-1 DCF. For BC-PM, a breakthrough was obtained at the 24
th hour for 0.5 mg
L-1
DCF and at the 8th hour for 5 mg L
-1 DCF. Thus, for both the biochars, a change in concentration
gradient affected the saturation rate and the time taken to achieve a breakthrough. Generally, high
initial concentrations of the adsorbates can enhance column performance by increasing the driving
force and hence decreasing the length of the adsorption zone 24, 34
and a similar phenomenon was
observed in this study as well.
3.3.2 Effect of mass of biochar (bed height)
The effect of the mass of biochar (2 g or 5 g) on the breakthrough curve at a constant initial DCF
concentration (0.5 mg L-1
) and flow rate (2 mL min-1
) is shown in Fig. 6. For BC-PM, 2g biochar
corresponds to 3.5cm column height while 5 g corresponds to 8 cm. Whereas, for BC-PW 2g biochar

346
resulted in a column height of 5cm; while 5g resulted in 12.5 cm. The increase in the total amount of
adsorbents resulted in an increase in total available adsorption sites24
. Thus, for biochars,
breakthrough, and saturation times were increased. For BC-PW, a breakthrough was obtained at the
18th hour for 2 g of biochar and at 30
th hour for 5 g of biochar. For BC-PM, breakthrough obtained at
the 24th hour for 2 g of biochar and at the 36
th hour for 5 g of biochar. An increase in adsorption
capacity and saturation time was observed for both biochars with an increase in bed height (mass of
biochar). This can be attributed to the longer residence time of DCF inside the column and hence
better interactions (further diffusion) between biochar and DCF 24, 34
.
3.4 Dynamic modeling of breakthrough curves
For further scaling up, and design and continued successful operation of the fixed-bed column, the
exact determination of breakthrough curve is necessary. Thus, breakthrough curves for the
adsorption of DCF onto biochars were analyzed using the Thomas, Yoon–Nelson and Adams–
Bohart, models to determine the dynamic behaviors in the column. The sorption performance of DCF
through the column was analyzed by Thomas, Yoon-Nelson, and Adams –Bohart models at starting
ratio of Ct/C0 >0.1 ( 10% breakthrough ) until Ct/C0 >0.90( 90% breakthrough ) 35
.
3.4.1 Thomas model
Thomas model is useful in determining the maximum solid phase concentration of the solute on the
adsorbent and calculating the adsorption rate constant for the adsorption column and the Thomas
model can be written as Equation 736
𝐶𝑡
𝐶0=
1
1+𝑒𝑥𝑝{(𝑘𝑡ℎ (𝑞0𝑚−𝐶0𝑉𝑒𝑓𝑓)/𝑄} (7)
Where kth is the Thomas rate constant (mL/min.g), q0 is the equilibrium adsorbate uptake (mg/g), Q
is the volumetric flow rate(mL/min), Veff is the volume of effluent (mL), and m is the mass of
adsorbent in the column (g).
347
The Thomas rate constant and adsorption capacity of biochars were plotted and calculated
according to Eq. (7), and the results are presented in Table 2. It was observed that Thomas model’s
correlation coefficients were high for both BC-PW and BC-PM (R2 > 0.95; except for 5 g adsorbent
mass for BC-PM) and which indicates that the model is able to describe the dynamic behaviors in
the fixed-bed column. With an increase of initial DCF concentration, the value of KTh decreased for
both biochars and this is because of variable concentration conditions, and that the driving force for
the adsorption is the concentration difference between DCF and biochar 35, 37
.Moreover, for both BC-
PM and BC-PW, a significant (p < 0.05 ) increase in q0 (adsorption potential or bed capacity) was
observed with an increase in DCF concentration due to the concentration difference between DCF
and biochar. From q0 values, it is clear that BC-PM is better adsorbent than BC-PW. With an
increased mass of biochar (bed height), the value of KTh increased for both biochars, whereas bed
capacity q0 decreased for both biochars. The perfect fitness of the experimental data with Thomas
model showed that diffusion ( both external and internal) cannot be the rate-limiting parameters35
.
3.4.2 Yoon-Nelson model
The Yoon–Nelson model requires no detailed data about the characteristics of the adsorbent
physical properties in the fixed-bed column 38
. Yoon–Nelson model is expressed as Equation 8:
𝐶𝑡
𝐶0=
1
1+𝑒𝑥𝑝{(𝑘𝑌𝑁 (𝜏−𝑡)} (8)
Where, KYN is the Yoon–Nelson rate constant (h-1
), and τ is the time required for the column to reach
50% adsorbate breakthrough based on the Yoon–Nelson model. kYN is an important parameter in
fixed –bed column dynamics and it depends on the diffusion characteristics of the mass transfer
zone.
The Yoon–Nelson rate constant and time required for 50% adsorbate breakthrough for biochars is
calculated according to Eq. (8), and the results are presented in Table 2. The Yoon–Nelson’s model
correlation coefficients were higher for both BC-PW and BC-PM (R2 > 0.95; except for 5 g adsorbent

348
mass for BC-PM) and which indicates that the model can explain 95% of the variability observed
regarding the diffusion in the fixed bed column. The time required to reach 50% adsorbate
breakthroughs ( τ ) were higher for BC-PM than BC-PW and hence BC-PM was better adsorbent
under fixed-bed column conditions for removing DCF. Moreover, an increase in kYN values with
increase in DCF concentration and bed height proved that the column was saturated with DCF at a
higher rate under these conditions. Moreover, for both biochars, the column saturation reached
much faster with increased DCF concentration. This could be due to the increased availability and as
a result, elevated interactions of DCF with biochar. Previous studies also observed the increased
interaction of adsorbate resulting in a better adsorption 9, 34
. For BC-PW, an increased column height
increased the τ, whereas, for BC-PM, the τ value was reduced by about 5 %.
3.4.3 Adams- Bohart model
Adams- Bohart developed this model based on surface reaction theory and presumed that
equilibrium is not instantaneous. This model describes the initial part of the breakthrough curve.
According to this model, the rate of adsorption is the proportional to residual capacity of the
adsorbate bed and concentration of the sorbate. Linearized form of Adams- Bohart model can be
written as Equation 9:
𝑙𝑛 (𝐶𝑡
𝐶0) = 𝐾𝐴𝐵 𝐶0𝑡 − 𝐾𝐴𝐵 𝑁0 (
𝑧
𝑈0) (9)
Where C0 and 𝐶𝑡 are the inlet and outlet adsorbate concentrations respectively, 𝑧 (cm, g) is the bed
height (mass) , 𝑈0 (cm min-1
) is the superficial velocity. 𝑁0 (mg L-1
) is the saturation concentration
and 𝐾AB (L mg -1
min-1
) is the mass transfer coefficient.
The saturation concentration and mass transfer coefficient for biochars were calculated from Eq. (9),
and the results are presented in Table 2. In comparison with the Thomas and Yoon-Nelson models,
R2 was lower which suggested that this model cannot be applied for explaining adsorption dynamics
of DCF onto BC-PW and BC-PM.

349
It is clear that both Thomas and Yoon-Nelson model explained the adsorption behavior of both
biochars for DCF. Thomas model is based on Langmuir kinetics of adsorption-desorption and no
axial dispersion is derived with the assumption that the rate driving force obeys second-order
reversible reaction kinetics 36
. Thus, while designing scaling up a column for removing DCF using
pine wood and pig manure biochars second order reversible kinetics can be observed. The column
design parameters as obtained in table 1 could be used for the design of adsorption column for a
practical purpose which can further used for larger volumes.
3.5 Microbiochar fixed-bed column bioreactor
Along with adsorption continuous biodegradation was observed with microbiochar fixed-bed column
bioreactor. An initial concentration of 0.5 mg L-1
of DCF was used and a constant 2 mL min-1
flowrate
and 2 g of laccase immobilized microbiochar was used was used. For BC-PM, 2 g laccase
immobilized microbiochar corresponded to corresponds to 4.1 cm and for BC-PW 2 g laccase
immobilized biochar corresponded to 6 cm.
Similar to microbiochar fixed bed adsorption column removal efficiency gradually decreased over
time. Figure 7, presents the results regarding the microbiochar fixed-bed column bioreactor. Near
70% removal was observed with BC-PW column bioreactor whereas it was near 60 % with the
adsorption column. Similarly, 88% removal was observed with laccase bound BC-PM column even
though a similar removal was observed with the adsorption column as well. Laccase-mediated
degradation is a slow process and it reported that Vmax of DCF degradation though laccase mediated
process is reported to 80.6 μg L−1
h-1
under batch mode conditions 14
. Thus being a slow process,
degradation of DCF can occur eventually after adsorption. As a result, huge improvement in removal
efficiency was not observed however, immobilized enzymes can degrade DCF in an eventual
process. Thus, with biodegradation column, complete elimination DCF can be expected instead of
mass transfer which is occurring in the adsorption column. Similar results (near 100% DCF removal)
was observed with laccase bound activated carbon column bioreactor in a previous study39
.
350
4. Conclusions
Biochar prepared from pig manure can be used as an effective adsorbent over biochar prepared
from pinewood for the effective removal of DCF. For both biochars, uptake of DCF through a fixed-
bed column was dependent on the mass of adsorbent (bed height) and DCF concentration. At an
environmentally relevant concentration (500 g L-1
), BC-PM exhibited an adsorption capacity of 4.10
mg g-1
with bed mass: 2g, flow rate: 2 mL min-1
and at pH: 6.5. For both biochars, the adsorption
capacity was decreased with increasing bed height whereas it increased with increasing DCF
concentration. For pig manure biochar, the breakthrough was obtained at the 24th hour for 2 g of
biochar and at the 36th hour for 5 g of biochar; whereas, for pinewood biochar, the breakthrough was
obtained at the 18th hour for 2 g of biochar and at 30
th hour for 5 g of biochar. Thus, column
sorption performed better at higher influent DCF concentration and lower bed height. The surface
area, porosity, and presence of various functional groups containing metals enhanced the adsorption
capacity for BC-PM over BC-PW. For both biochars, second-order reversible reaction was observed
for the adsorption of DCF. The modeling parameters can be successfully used for further scaling the
process. Application of biochar has tremendous potential for the removal of DCF from wastewater in
comparison with other commonly used adsorbents. Laccase bound biochar exhibited slightly
improved removal efficiency over the raw biochar and improvement in breakthrough time was also
observed which was attributed to the biodegradation of DCF in the column
Acknowledgement(s)
The authors are sincerely thankful to the Natural Sciences and Engineering Research Council of
Canada (Discovery Grant 355254 and NSERC Strategic Grant) and Ministère des Relations
internationales du Québec (coopération Québec-Catalanya 2012-2014; project 07.302).

351
References
1. B. Halling-Sørensen, S. Nors Nielsen, P. F. Lanzky, F. Ingerslev, H. C. Holten Lützhøft and S. E. Jørgensen, Chemosphere., 1998, 36, 357-393.
2. L. Lonappan, R. Pulicharla, T. Rouissi, S. K. Brar, M. Verma, R. Y. Surampalli and J. R. Valero, J. Chromatogr. A, 2016, 1433, 106-113.
3. V. Acuña, A. Ginebreda, J. R. Mor, M. Petrovic, S. Sabater, J. Sumpter and D. Barceló, Environ. Int., 2015, 85, 327-333.
4. Y. Zhang, S.-U. Geißen and C. Gal, Chemosphere., 2008, 73, 1151-1161.
5. L. Lonappan, S. K. Brar, R. K. Das, M. Verma and R. Y. Surampalli, Environ. Int., 2016, 96, 127-138.
6. S. O. Ganiyu, E. D. van Hullebusch, M. Cretin, G. Esposito and M. A. Oturan, Sep. Purif. Technol., 2015, 156, Part 3, 891-914.
7. I. Michael, Z. Frontistis and D. Fatta-Kassinos, in Comprehensive Analytical Chemistry, eds. D. B. Mira Petrovic and P. Sandra, Elsevier, 2013, vol. Volume 62, pp. 345-407.
8. Y. Zhou, L. Zhang and Z. Cheng, J. Mol. Liq., 2015, 212, 739-762.
9. J. L. Sotelo, G. Ovejero, A. Rodríguez, S. Álvarez, J. Galán and J. García, Chem. Eng. J., 2014, 240, 443-453.
10. B. N. Bhadra, P. W. Seo and S. H. Jhung, Chem. Eng. J., 2016, 301, 27-34.
11. S. Jodeh, F. Abdelwahab, N. Jaradat, I. Warad and W. Jodeh, Journal of the Association of Arab Universities for Basic and Applied Sciences, 2016, 20, 32-38.
12. J. L. Sotelo, A. Rodríguez, S. Álvarez and J. García, Chem. Eng. Res. Des., 2012, 90, 967-974.
13. D. Tiwari, C. Lalhriatpuia and S.-M. Lee, J.Indust.Eng.Chem., 2015, 30, 167-173.
14. L. Lonappan, T. Rouissi, M. A. Laadila, S. K. Brar, L. Hernandez Galan, M. Verma and R. Y. Surampalli, ACS Sustainable Chemistry & Engineering, 2017, 5, 5772-5781.
15. J. Margot, C. Bennati-Granier, J. Maillard, P. Blánquez, D. A. Barry and C. Holliger, AMB Express, 2013, 3, 63-63.
16. M. Hartmann and X. Kostrov, Chem. Soc. Rev., 2013, 42, 6277-6289.
17. M. Keiluweit, P. S. Nico, M. G. Johnson and M. Kleber, Environ. Sci. Technol., 2010, 44, 1247-1253.
18. J. Lehmann, Front. Ecol. Environ., 2007, 5, 381-387.
19. L. Lonappan, T. Rouissi, R. K. Das, S. K. Brar, A. A. Ramirez, M. Verma, R. Y. Surampalli and J. R. Valero, Waste Manage. (Oxford), 2016, 49, 537-544.

352
20. S. K. Brar, M. Verma, R. D. Tyagi and R. Y. Surampalli, Waste Manage. (Oxford), 2010, 30, 504-520.
21. L. Lonappan, T. Rouissi, M. A. Laadila, S. K. Brar, L. H. Galan, M. Verma and R. Y. Surampalli, ACS Sustainable Chemistry & Engineering, 2017, 5, 5772-5781.
22. L. Lonappan, T. Rouissi, S. Kaur Brar, M. Verma and R. Y. Surampalli, Bioresour. Technol., 2017, DOI: https://doi.org/10.1016/j.biortech.2017.10.039.
23. J. R. Rao and T. Viraraghavan, Bioresour. Technol., 2002, 85, 165-171.
24. J. Jang and D. S. Lee, Bioresour. Technol., 2016, 218, 294-300.
25. C. E. Brewer, V. J. Chuang, C. A. Masiello, H. Gonnermann, X. Gao, B. Dugan, L. E. Driver, P. Panzacchi, K. Zygourakis and C. A. Davies, Biomass Bioenergy, 2014, 66, 176-185.
26. C. H. Chia, B. Gong, S. D. Joseph, C. E. Marjo, P. Munroe and A. M. Rich, Vib. Spectrosc, 2012, 62, 248-257.
27. R. K. Sharma, J. B. Wooten, V. L. Baliga, X. Lin, W. Geoffrey Chan and M. R. Hajaligol, Fuel, 2004, 83, 1469-1482.
28. M. B. Ahmed, J. L. Zhou, H. H. Ngo, W. Guo and M. Chen, Bioresour. Technol., 2016, 214, 836-851.
29. P. Zhang, H. Sun, L. Yu and T. Sun, J. Hazard. Mater., 2013, 244–245, 217-224.
30. K. B. Cantrell, P. G. Hunt, M. Uchimiya, J. M. Novak and K. S. Ro, Bioresour. Technol., 2012, 107, 419-428.
31. W.-T. Tsai, S.-C. Liu, H.-R. Chen, Y.-M. Chang and Y.-L. Tsai, Chemosphere., 2012, 89, 198-203.
32. C. Jung, L. K. Boateng, J. R. V. Flora, J. Oh, M. C. Braswell, A. Son and Y. Yoon, Chem. Eng. J., 2015, 264, 1-9.
33. C. Jung, J. Park, K. H. Lim, S. Park, J. Heo, N. Her, J. Oh, S. Yun and Y. Yoon, J. Hazard. Mater., 2013, 263, Part 2, 702-710.
34. M. Tamez Uddin, M. Rukanuzzaman, M. Maksudur Rahman Khan and M. Akhtarul Islam, J. Environ. Manage., 2009, 90, 3443-3450.
35. G. Naja and B. Volesky, Environ. Sci. Technol., 2006, 40, 3996-4003.
36. H. C. Thomas, J. Am. Chem. Soc., 1944, 66, 1664-1666.
37. S. Chen, Q. Yue, B. Gao, Q. Li, X. Xu and K. Fu, Bioresour. Technol., 2012, 113, 114-120.
38. Y. H. Yoon and J. H. Nelson, Am. Ind. Hyg. Assoc. J., 1984, 45, 509-516.
39. L. N. Nguyen, F. I. Hai, A. Dosseto, C. Richardson, W. E. Price and L. D. Nghiem, Bioresour. Technol., 2016, 210, 108-116.

353
Table 1: Chemical composition of pinewood (BC-PW) and pig manure (BC-PM) biochars
Element BC-PW BC-PM
% C 83.6±2 57.8±1
% H 3.5±0.7 1.5±0.1
% N < 1 3.0±0.2
Metals
BC- PW (mg/kg)
BC- PM (mg/kg)
Al 77.9±3.2 385.2±13.2
As 0.5±0.05 0.9±0.1
B 15.1±1.2 121.9±2.2
Ba 32.5±1.2 37.6±3.2
Ca 1753.3±14.5 45481.8±26.8
Cd 0.3±0.15 0.9±0.2
Co 9.3±1.2 5.6±0.5
Cr 170.6±1.6 8.1±1.6
Cu 5.2±0.7 434.8±15.7

354
Fe 1488.9±12.8 10638.2±16.7
K 1709.6±78.4 21115.2±165.2
Mg 143.4±10.2 10111.5±78.6
Mn 124.6±1.9 563.1±23.8
Mo 0.60±0.1 2.79±0.3
Na 100.2±12.8 8005.5±12.7
Ni 54.6±0.5 5.1±0.4
P 121.9±1.7 22695.1±3.5
Pb 4.7±1.5 14.10±1.4
S 109.9±6.7 8412.0±88.3
Sb 4.3±0.2 3.2±0.3
Se 0.4±0.1 5.4±1.2
Sn 216.6±6.5 92.9±4.5
Zn 24.4±0.2 736.3±6.5

355
Table 2: Model parameters of fixed-bed column adsorption of DCF onto biochars; (BC-PW) and pig manure (BC-PM) biochars
Biochar
C0
(mg L-1
)
Mass
(g)
Thomas Model
Yoon-Nelson model
Adams - Bohart model
kTH (L/mg/h)
q0
(mg/g)
R2
kYN (h
−1)
τ (h)
R
2
kAB (L/mg/h)
N0 (mg/L)
R
2
BC-PW
0.5
5
0.5
2 2 5
0.568
0.126
0.756
1.106
5.174
0.657
0.979
0.988
0.983
0.291
0.634
0.268
2.340
1.028
6.507
0.979
0.988
0.983
0.078
0.023
0.140
8.858
32.130
1.80
0.727
0.803
0.625
BC-PM
0.5
5
0.5
2 2 5
0.480
0.150
0.640
4.108
16.147
0.815
0.980
0.974
0.820
0.240
0.757
0.325
8.216
3.199
8.027
0.980
0.974
0.820
0.172
0.604
0.258
9.831
3.254
1.720
0.867
0.789
0.534

356
Diameter (µm)
0.01 0.1 1 10 100 1000 10000
q (
%)
0
2
4
6
8
10
12
14
16
Un
de
rsiz
e (
%)
0
10
20
30
40
50
60
70
80
90
100BC-PW micro
BC-PM micro
BC-PM
BC-PW
Figure 1: Particle size distribution of biochar

357
Figure 2: Thermogravimetric profiles of biochar: Pinewood biochar (BC-PW), Pig Manure biochar (BC-PM)

358
Figure 3: Scanning electron micrographs of biochar: (A) Pinewood biochar (BC-PW), (B) Pig Manure biochar (BC-PM)

359
Figure 4: Fourier transform infra-red spectra for biochar- pine wood biochar (BC-PW) and
pig manure biochar (BC-PM)

360
Figure 5: Breakthrough curves with different initial diclofenac concentrations: (A) pinewood biochar (BC-PW) and (B) pig
manure biochar (BC-PM)

361
Figure 6: Breakthrough curves with different bed heights: (A) pine wood biochar (BC-PW) and (B) pig manure biochar (BC-PM)

362
Figure 7: Degradation of diclofenac in microbiochar fixed bed column bioreactor

363
CHAPTER 6
CONCLUSIONS ET RECOMMANDATIONS

364

365
CONCLUSIONS
Les conclusions suivantes ont été tirées des travaux de recherche:
1. Procédé de matrice à tendance rapide pour la quantification du DCF : la nouvelle méthode
développée LDTD-APCI-MS / MS a réduit le temps d'analyse par des échantillons à 12 secondes au
lieu de 12 minutes pour LC-ESI-MS / MS. Les limites de détection de la méthode LDTD-APCI-MS /
MS ont été entre 270 ng L-1
(LOD) et 1000 ng L-1
. La méthode d'extraction accélérée par solvant
(EAS) s'est révélée plus efficace que l'extraction assistée par ultrasons (EAU) pour l'extraction du
DCF des boues d'épuration avec une récupération de 95,6 ± 7 %. En effet, l'extraction du DCF à
partir de boues des eaux usées avec 95,6 ± 7% de récupération. La station d’épuration des eaux
usées de la ville de Québec contenait 64,89 ± 6.7μg L-1
de DCF et l'effluent contenait 15,95 ± 3.7μg
L-1
. L'accumulation de DCF dans les boues primaires (1,10 ± 0,15 µg g-1
), ainsi que des boues
secondaires (0,90 ± 0,15 µg g-1
) a été observée dans les stations d’épuration. Les effluents destinés
pour être rejeter dans le fleuve Saint-Laurent (dans ce cas, des stations d'épuration des eaux usées
du Québec) contenait des concentrations élevées de DCF, ce qui exige le développement de
méthodes de traitement efficace pour l'élimination complète du DCF.
2. Les microparticules de biochar ont montré une capacité importante d'adsorption. La sélection de
matières premières agricoles et la méthode de production ont eu des effets significatifs sur les
propriétés du biochar, ainsi que sur sa capacité optimale d'adsorption. À des faibles concentrations
de bleu de méthylène, le microbiochar a montré une capacité d'adsorption comparable à celle du
charbon actif. Cela peut encore être extrapolé pour l'élimination des contaminants émergents, car ils
sont généralement des micropolluants.
3. Le biochar du fumier de porc a montré une capacité d'adsorption pour la DCF supérieure à celle
du biochar du bois de pin. Nous avons observé une efficacité d'élimination d'environ 99,6 % pour le
microbiochar du lisier de porc à une concentration de 500 µg L-1
(DCF) en mode batch. La diffusion
366
intraparticule s'est avérée être le principal mécanisme expliquant l’adsorption pour les deux types de
biochar.
4. La fonctionnalisation de microbiochar a amélioré l'efficacité d'élimination de DCF :La
fonctionnalisation avec de l'acide citrique permis d’augmenter au total le nombre de groupes
fonctionnels acides par rapport aux contrôles de 23,6%, 10,2% et 26,2% pour le bois de pin, fumier
de porc et coquille d'amande microbiochars, respectivement. La fonctionnalisation avec de l'acide
citrique améliore la capacité d'adsorption du microbiochar. Pour le biochar de pin, l'élimination du
DCF en équilibre est passée de 65 à 80 %. Pour le biochar à base de coquilles d'amandes, dans
des conditions similaires, l'efficacité d'élimination de DCF est passée de 58 à 84 %.
5. Les résidus de l'industrie du jus de pomme, le marc de pommes (49,1±2,5 U/gds) et les déchets
solides de pâtes et papiers (52,4±2,2 U/gds) se sont avérés être des substrats efficaces pour la
production de laccases comparés aux fibres d'alfa séchées (14,2±0,8 U/gds). Le sulfate de cuivre
est un inducteur efficace pour la production de laccases en comparaison avec le twen-80, le
vératryle alcool de et le rouge de phénol. La dégradation de DCF (500 µg L-1
) a été étudiée en
utilisant la laccase brute dans les conditions expérimentales suivantes : pH de 4,5 et température de
50 °C. Dans ces conditions, nous avons observé jusqu' à 99 % de dégradation du DCF dans les 5
heures. Les produits de transformation initiaux 3-hydroxydiclofénac, le 4-hydroxydiclofénac et le 5-
hydroxydiclofénac ont été identifiés par LC-MS/MS. Le mécanisme de dégradation de DCF catalysé
par laccase a été proposé pour l'ouverture du cycle d'hydroxylation et la minéralisation finale en
CO2, NH3, H2O et chlore.
6. En testant tous les biochars, l'activité initiale de la laccase a augmenté dans la solution brute,
l'efficacité de l'immobilisation par adsorption a également augmenté. Le microbiochar du lisier de
porc a été efficace (31,4 ± 3,1 U g-1
) à 10 U mL-1
d’activité enzymatique (laccase) suivie coquille
d'amande microbiocharbon (24,3 ± 4,8 U g-1
) et de bois de pin microbiocharbon (14,58 ± 3,3 U g-1
).
L’adsorption monocouche homogène est un mécanisme clé avant l’utilisation de laccase
367
immobilisée sur la liaison de biocharbon qui dégrade totalement (100%) le DCF dans les premières
5 heures à une concentration d’environs (500 ug L-1
).
7. La laccase immobilisée sur le biochar par la méthode covalente présentant une stabilité
améliorée. Avec l’utilisation du glutaraldéhyde (5 % v/v), le microbiochar du lisier de porc a avait la
plus grande capacité d’immobilisation des laccases la plus élevée (34,1±1,1 U g-1
), suivie du
microbiochar des coquilles d'amande (25,3±2,8 U g-1
) et du microbiochar du bois de pin (16,18±0,3
U g-1
). Le prétraitement à l'acide citrique a permis d’améliorer la capacité d’immobilisation des
laccases pour tous les types de microbiochars, particulièrement pour le microbiochar de coquilles
d’amande. Plus de 40 % de l'activité de laccase a été conservée pour tous les systèmes
microbiochars-laccases après 5 cycles de traitement de DCF (chaque cycle a duré 6 heures).
8. Le biochar lié à la laccase a montré une efficacité d'élimination plus élevée que le biochar brut,
une amélioration significative du temps de résidence a été observée qui a été attribuée à la
biodégradation du DCF dans la colonne. Le microsystème imprégné de biochar et d'enzymes
(BEMS) est rentable et en même temps permet la valorisation des déchets.
En conclusion et dans cette recherche, « une nouvelle technique hybride et efficace de
microsystème immobilisé biocharbon-laccase a été mise en œuvre ». Cette thèse de doctorat a
permis d’intégrer les concepts de durabilité (application d'acide organique pour une
fonctionnalisation, l'adsorption de contaminants et d'immobilisation par adsorption) et la gestion des
déchets et de valorisation ainsi que la rentabilité (biochar à partir de déchets / résiduels en tant que
substrats pour la production de la laccase).

368
RECOMMANDATIONS
Les recommandations suivantes sont tirées pour suite aux différents travaux réalisés dans cette
thèse:
1. Un mélange des enzymes immobilisées ligninolytiques (telles que la peroxydase de la lignine et
du manganèse) peut être pris en considération pour la dégradation non-sélective et efficace des
micropolluants au lieu d'un seul système d'enzyme.
2. La production de biochar doit être optimisée à des fins d'immobilisation spécifique des enzymes,
la présence de groupes fonctionnels tels que des amines peuvent améliorer l'immobilisation des
enzymes.
3. Le système proposé « microsystème immobilisé biocharbon-enzyme » à l'échelle du laboratoire
doit être développée davantage à l'échelle pilote et industrielle (stade tertiaire dans le processus de
traitement des eaux usées) après mise à l'échelle et donc avec les adaptations nécessaires.
4. Le système proposé peut être efficace pour le traitement d'autres contaminants émergents, tenant
compte des propriétés oxydantes de laccase et sa nature non sélective. En outre, le système
proposé peut être utilisé pour le traitement de mélange de contaminants émergents et donc son
application peut être très avantageuse en conditions réelles dans une station d’épuration des eaux
usées.
5. La laccase immobilisée sur microbiochar peut être utilisé pour la dégradation des nouveaux
contaminants dans le sol. Cela servira le double objectif d'assainissement des contaminants dans le
sol ainsi que l'amélioration de la fertilité des sols. En outre, la laccase immobilisée sur le
microbiochar peut être utilisé pour le traitement de boues d'épuration. La libération progressive de
laccase permet la dégradation simultanée des nouveaux contaminants présents dans les boues
d’épuration des eaux usées. Ses boues d’épuration peuvent être ainsi utilisées en toute sécurité
pour la fertilisation des terres agricoles.

369
6. Après son application dans les eaux usées, le BEMS peut être soit réutilisé ou appliqué au sol /
terres agricoles. Le reste de l'enzyme immobilisée dans la microbiochar sera libéré lentement dans
le sol et facilitera la dégradation des contaminants, le biochar permettra d'améliorer la fertilité du sol
en mobilisant les éléments nutritifs.

370
371
ANNEXES

372
Chapter 1: part 2
Table A1: transition details in LDTD-APCI-MS/MS
Compound Diclofenac Diclofenac-d4
Parent (m/z)
296
300
Products (m/z)
215
250
219
Collision energy (v)
20
20
20
Table A2: Diclofenac LDTD- APCI-MS/MS method validation parameters
R2
Intra-day precision
(% Relative Standard
Deviation (RSD))
Inter-day precision
(% Relative Standard
Deviation (RSD))
Method Detection Limit (MDL)
( ng L-1
)
Limit of Detection
(LOD)
Limit of Quantification
(LOQ)
0.9995
7.1
9.2
270
1000

373
Chapter 2: part 1
Figure A 1: Scanning electron microscopy images of biochar microparticles: (1.A) Pine wood biochar (BC-PW) - S1; (1.B) BC-PW-
S2; (1.C) BC-PW-S3; (2.A) Pig manure biochar (BC-PM)-S1; (2.B) BC-PM-S2; (2.C) BC-PM-S3; (3.A) Paper derived biochar (BC-PD)-
S1; (3.B) (BC-PD)-S2; (3.C) (BC-PD)-S3

374
Chapter 2: part 2
Figure A 2: Pseudo first and second order models for adsorption of diclofenac onto biochars

375
Figure A 3: Elovich and intraparticle diffusion models for adsorption of diclofenac onto
biochars

376
Figure A 4: Langmuir and Freundlich models for adsorption of diclofenac onto biochars

377
Figure A 5: Temkin and D-R models for adsorption of diclofenac onto biochars

378
Chapter 4: part 1
Table A 3: Tukey HSD test results: inducers and alfa fibers
Values denoted with * differ significantly at P < 0.05 by Tukey’s post-hoc analyses. Each value is
mean of three independent replicates.
Approximate probabilities for post hoc Tukey tests
Inducers and
substrate
Alfa fibers
only
Veratryl
alcohol and alfa fibers
Copper sulphate and alfa fibers
Tween 80 and alfa
fibers
Phenol red
and alfa fibers
Alfa fibers only
---
0.972691
0.012092*
0.284872
0.122968
Veratryl alcohol and alfa fibers
0.972691
---
0.005449*
0.125999
0.056849
Copper sulphate
and alfa fibers
0.012092*
0.005449*
---
0.253774
0.776647
Tween 80 and alfa
fibers
0.284872
0.125999
0.253774
---
0.912704
Phenol red and
alfa fibers
0.122968
0.056849
0.776647
0.912704
---

379
Table A 4: Tukey HSD test results: inducers and apple pomace
Approximate probabilities for post hoc Tukey tests
Inducers and
substrate
Apple
pomace only
Veratryl alcohol
and apple pomace
Copper sulphate
and apple pomace
Tween 80 and apple pomace
Phenol red and apple pomace
Apple pomace
only
---
0.961901
0.198677
0.040788*
0.045701*
Veratryl
alcohol and apple pomace
0.961901
---
0.078306
0.016000*
0.106946
Copper
sulphate and apple pomace
0.198677
0.078306
---
0.803017
0.002501*
Tween 80 and apple pomace
0.040788*
0.016000*
0.803017
---
0.000862*
Phenol red and apple pomace
0.045701*
0.106946
0.002501*
0.000862*
---
Values denoted with * differ significantly at P < 0.05 by Tukey’s post-hoc analyses. Each value is
mean of three independent replicates.
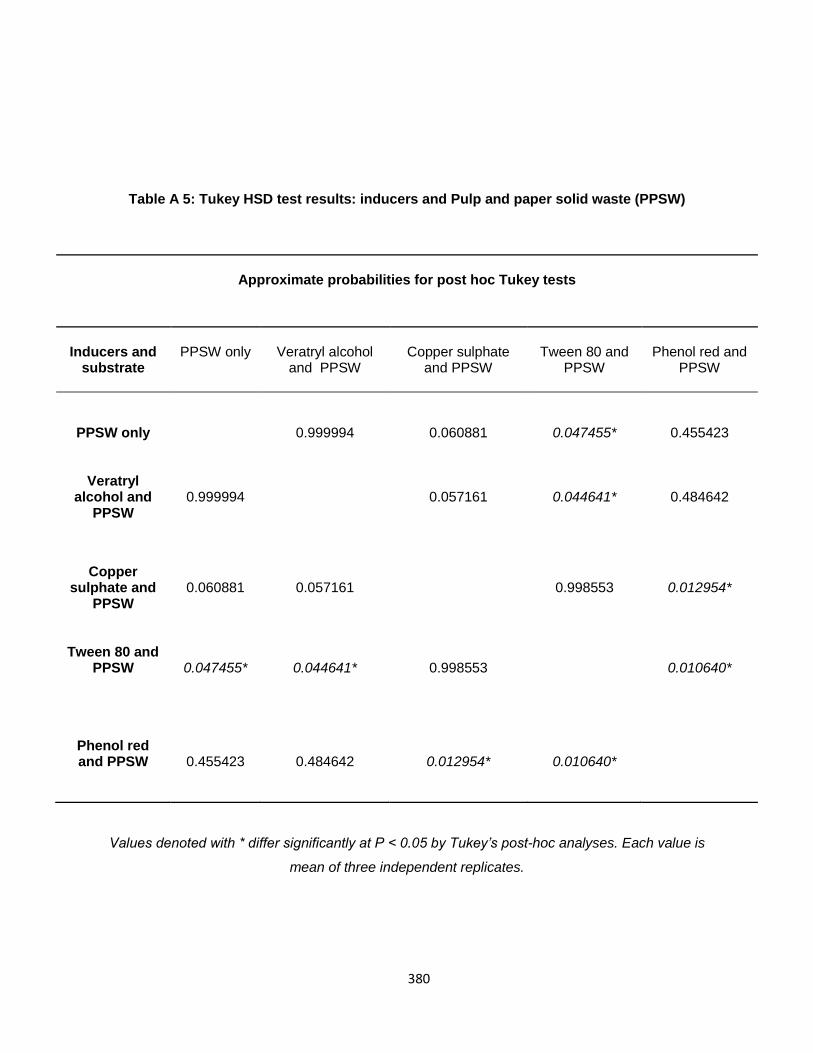
380
Table A 5: Tukey HSD test results: inducers and Pulp and paper solid waste (PPSW)
Approximate probabilities for post hoc Tukey tests
Inducers and
substrate
PPSW only
Veratryl alcohol
and PPSW
Copper sulphate
and PPSW
Tween 80 and
PPSW
Phenol red and
PPSW
PPSW only
0.999994
0.060881
0.047455*
0.455423
Veratryl
alcohol and PPSW
0.999994
0.057161
0.044641*
0.484642
Copper
sulphate and PPSW
0.060881
0.057161
0.998553
0.012954*
Tween 80 and
PPSW
0.047455*
0.044641*
0.998553
0.010640*
Phenol red and PPSW
0.455423
0.484642
0.012954*
0.010640*
Values denoted with * differ significantly at P < 0.05 by Tukey’s post-hoc analyses. Each value is
mean of three independent replicates.

381
Table A 6: Univariate tests of significance for laccase activity for alfa fibers and inducers
Variable
Sum of Squares
(SS)
Degree of Freedom
Mean Square
(MS)
F
p
Intercept
1840.186
1
1840.186
704.5021
0.000000
Inducers for alfa fibers
86.984
4
21.746
8.3253
0.004293
Error
23.508
9
2.612
Table A 7: Univariate tests of significance for laccase activity for apple pomace and inducers
Variable
Sum of Squares (SS)
Degree of Freedom
Mean Square (MS)
F
p
Intercept
23319.52
1
23319.52
2042.387
0.000000
Inducers for apple pomace
609.63
4
152.41
13.348
0.000798
Error
102.76
9
11.42

382
Table A 8: Univariate tests of significance for laccase activity for pulp and paper solid waste
and inducers
Variable
Sum of Squares (SS)
Degree of Freedom
Mean Square (MS)
F
p
Intercept
15539.36
1
15539.36
760.3917
0.000001
Inducers for pulp and
paper solid waste
1109.70
4
277.42
13.5753
0.006790
Error
102.18
5
20.44
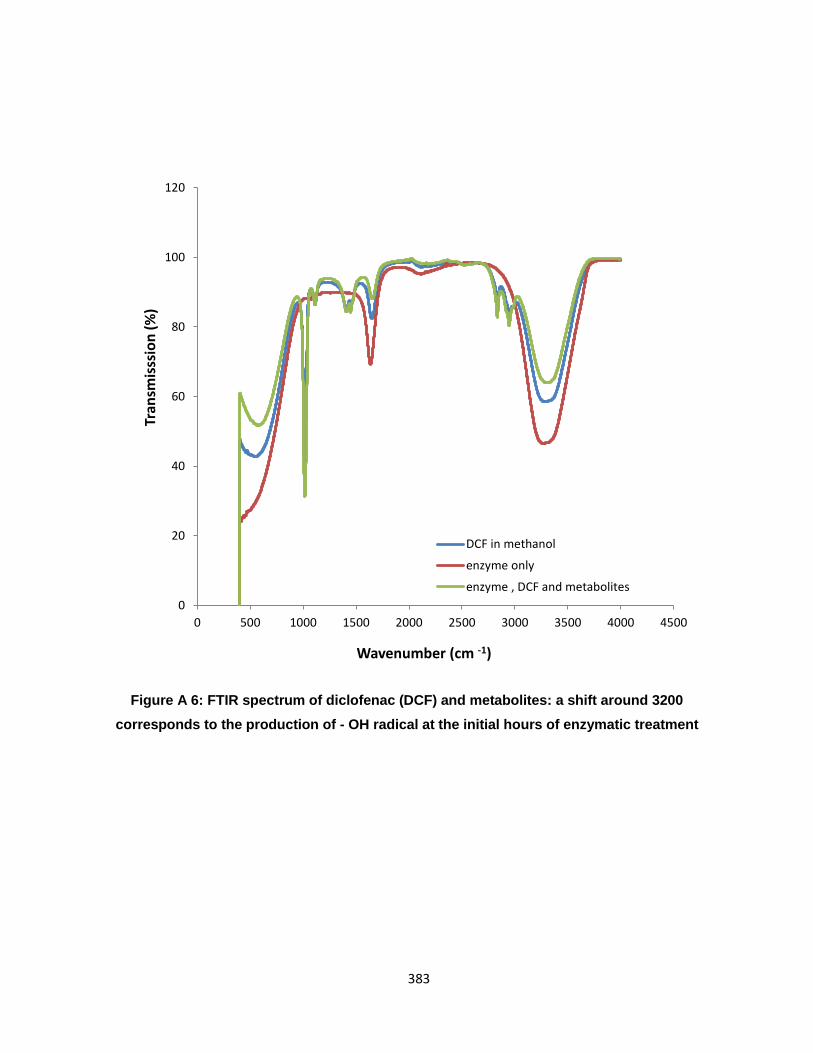
383
Figure A 6: FTIR spectrum of diclofenac (DCF) and metabolites: a shift around 3200
corresponds to the production of - OH radical at the initial hours of enzymatic treatment
0
20
40
60
80
100
120
0 500 1000 1500 2000 2500 3000 3500 4000 4500
Tran
smis
ssio
n (
%)
Wavenumber (cm -1)
DCF in methanol
enzyme only
enzyme , DCF and metabolites

384
Chapter 4: part 3
Table A 9: Univariate Tests of Significance for loading capacity (the three methods M1. M2
and M3) for each type of biochar
Table A 10: Tukey HSD test; variable loading capacity- Pine wood biochar
Pine wood biochar Method 1 Method 2 Method 3
1 Pine wood method 1 0.955201 0.023049*
2 Pine wood method 2 0.955201 0.026675*
3 Pine wood method 3 0.023049* 0.026675*
Biochar p
Pig Manure biochar 0.021762
Pine wood biochar 0.018694
Almond shell biochar 0.023044

385
Table A 11: Tukey HSD test; variable Loading capacity- Pig Manure
Pig Manure biochar Method 1 Method 2 Method 3
1 Pig manure biochar method 1 0.967827 0.030812*
2 Pig manure biochar method 2 0.967827 0.038258*
3 Pig manure biochar method 3 0.030812* 0.038258*
Table A 12: Tukey HSD test; variable loading capacity-Almond Shell biochar
Almond Shell biochar Method 1 Method 2 Method 3
1 Almond Shell biochar method 1 0.861390 0.039313*
2 Almond Shell biochar method 2 0.861390 0.033336*
3 Almond Shell biochar method 3 0.039313* 0.033336*

386