Coating of Carbon Fiber with Polyhedral Oligomeric Silsesquioxane (POSS) to Enhance Mechanical...
13
Materials 2011, 4, 1619-1631; doi:10.3390/ma4091619 materials ISSN 1996-1944 www.mdpi.com/journal/materials Article Coating of Carbon Fiber with Polyhedral Oligomeric Silsesquioxane (POSS) to Enhance Mechanical Properties and Durability of Carbon/Vinyl Ester Composites Hassan Mahfuz 1, *, Felicia Powell 1 , Richard Granata 1 , Mahesh Hosur 2 and Mujib Khan 3 1 Ocean and Mechanical Engineering Department, Florida Atlantic University, Boca Raton, FL 33431, USA; E-Mails: [email protected] (F.P.); [email protected] (R.G.) 2 Materials Science and Engineering Department, Tuskegee University, Tuskegee, AL 36088, USA; E-Mail: [email protected] 3 Department of Mechanical Engineering, University of Texas at El Paso, TX 79968, USA; E-Mail: [email protected] * Author to whom correspondence should be addressed; E-Mail: [email protected]; Tel.: +1-561 297-3483; Fax: +1-561 297-3885. Received: 27 July 2011; in revised form: 24 August 2011 / Accepted: 6 September 2011 / Published: 21 September 2011 Abstract: Our continuing quest to improve the performance of polymer composites under moist and saltwater environments has gained momentum in recent years with the reinforcement of inorganic nanoparticles into the polymer. The key to mitigate degradation of composites under such environments is to maintain the integrity of the fiber/matrix (F/M) interface. In this study, the F/M interface of carbon/vinyl ester composites has been modified by coating the carbon fiber with polyhedral oligomeric silsesquioxane (POSS). POSS is a nanostructured inorganic-organic hybrid particle with a cubic structure having silicon atoms at the core and linked to oxygen atoms. The advantage of using POSS is that the silicon atoms can be linked to a substituent that can be almost any chemical group known in organic chemistry. Cubic silica cores are ‘hard particles’ and are about 0.53 nm in diameter. The peripheral organic unit is a sphere of about 1–3 nm in diameter. Further, cubic structure of POSS remains intact during the polymerization process and therefore with appropriate functional groups, if installed on the fiber surface, would provide a stable and strong F/M interface. Two POSS systems with two different functional groups; namely, octaisobutyl and trisilanolphenyl have been investigated. A set of chemical and mechanical procedures has been developed to coat carbon fibers with POSS, and to fabricate layered composites with vinyl ester resin. Interlaminar shear and low velocity OPEN ACCESS
-
Upload
independent -
Category
Documents
-
view
1 -
download
0
Transcript of Coating of Carbon Fiber with Polyhedral Oligomeric Silsesquioxane (POSS) to Enhance Mechanical...

Materials 2011, 4, 1619-1631; doi:10.3390/ma4091619
materials ISSN 1996-1944
www.mdpi.com/journal/materials Article
Coating of Carbon Fiber with Polyhedral Oligomeric Silsesquioxane (POSS) to Enhance Mechanical Properties and Durability of Carbon/Vinyl Ester Composites
Hassan Mahfuz 1,*, Felicia Powell 1, Richard Granata 1, Mahesh Hosur 2 and Mujib Khan 3
1 Ocean and Mechanical Engineering Department, Florida Atlantic University, Boca Raton,
FL 33431, USA; E-Mails: [email protected] (F.P.); [email protected] (R.G.) 2 Materials Science and Engineering Department, Tuskegee University, Tuskegee, AL 36088, USA;
E-Mail: [email protected] 3 Department of Mechanical Engineering, University of Texas at El Paso, TX 79968, USA;
E-Mail: [email protected]
* Author to whom correspondence should be addressed; E-Mail: [email protected];
Tel.: +1-561 297-3483; Fax: +1-561 297-3885.
Received: 27 July 2011; in revised form: 24 August 2011 / Accepted: 6 September 2011 /
Published: 21 September 2011
Abstract: Our continuing quest to improve the performance of polymer composites under
moist and saltwater environments has gained momentum in recent years with the
reinforcement of inorganic nanoparticles into the polymer. The key to mitigate degradation
of composites under such environments is to maintain the integrity of the fiber/matrix
(F/M) interface. In this study, the F/M interface of carbon/vinyl ester composites has been
modified by coating the carbon fiber with polyhedral oligomeric silsesquioxane (POSS).
POSS is a nanostructured inorganic-organic hybrid particle with a cubic structure having
silicon atoms at the core and linked to oxygen atoms. The advantage of using POSS is that
the silicon atoms can be linked to a substituent that can be almost any chemical group
known in organic chemistry. Cubic silica cores are ‘hard particles’ and are about 0.53 nm
in diameter. The peripheral organic unit is a sphere of about 1–3 nm in diameter. Further,
cubic structure of POSS remains intact during the polymerization process and therefore
with appropriate functional groups, if installed on the fiber surface, would provide a stable
and strong F/M interface. Two POSS systems with two different functional groups;
namely, octaisobutyl and trisilanolphenyl have been investigated. A set of chemical and
mechanical procedures has been developed to coat carbon fibers with POSS, and to
fabricate layered composites with vinyl ester resin. Interlaminar shear and low velocity
OPEN ACCESS

Materials 2011, 4
1620
impact tests have indicated around 17–38% improvement in mechanical properties with
respect to control samples made without the POSS coating. Saltwater and hygrothermal
tests at various environmental conditions have revealed that coating with POSS reduces
water absorption by 20–30% and retains the composite properties.
Keywords: nanocomposite; POSS; carbon fiber; vinyl ester; F/M interface
1. Introduction
Although carbon fiber reinforced polymer composites are widely used in various industries, their
usage in marine applications is somewhat limited [1–3]. To date, the Navy has used traditional
materials to construct their fleets; however, maintenance costs, fuel consumption, and warfare
vulnerabilities has renewed the development of composite fabrication [4]. The durability of composites
in moist environments has been a limiting factor in capitalizing on the structural advantages of
composite vessels. Since epoxies are not as stable as vinyl ester in salt water environment, recent thrust
has been to develop carbon/vinyl ester composites for marine structures. Several studies have been
conducted investigating the effects of water on the mechanical properties of carbon/vinyl ester
composites [5–9]. The mechanical and thermal analysis of all these studies indicated that the primary
area of failure was the fiber/matrix (F/M) interface due to water degradation. As the F/M interface is
primarily responsible for load transfer from the matrix to the fiber, its degradation signals initial failure
of the composite. The objective of this investigation is to improve this F/M interface by coating the
carbon fiber surface with polyhedral oligomeric silsesquioxane (POSS).
Modification of the fiber surface has been considered as a method of improving the fiber/matrix
bonding [10–12]. Studies by Langston [13] and Verghese et al. [14] have shown that fiber surface
modification improves the interface properties of carbon/vinyl ester composites. However, an
improvement across the range of mechanical, thermal and hygrothermal behavior of composites was
not observed.
To address this issue, we are investigating nanoscale inclusion at the carbon fiber surface.
Nanoparticles, such as POSS, should be ideal for such coating of the fiber since the physical dimension
of POSS is in nanometer range and is expected to enhance bonding at the interface. POSS is an
inorganic-organic hybrid nano silica engineered to strengthen composites, as well as, promote
hydrophobicity, which is ideal for marine applications. The advantage of using POSS is that silicon
atoms can be linked to a substituent that can be almost any chemical group known in organic
chemistry. POSS chemically bonded with thermoset polymers either enhances or reinforces the
mechanical and thermal properties of the neat material system [15]. Recent studies by Zhang [16] have
demonstrated 25–27% improvement of the interlaminar shear strength with various POSS products. It
is therefore expected that if POSS particles, with appropriate functional groups, can be installed on the
carbon fiber surface, they would provide a stable and strong F/M interface [17,18].
Materials 2011, 4
1621
2. Experimentation
Two types of carbon/vinyl ester nanocomposites were manufactured; one with 1.0 wt % loading of
octaisobutyl-POSS (Octa), and the other with 0.2 wt % of trisilanolphenyl-POSS (TriS). POSS
particles were procured from Hybrid Plastics (55 W.L. Runnels Industrial Drive, Hattiesburg, MS
39401). As-received carbon fiber cloth (Vectorply, 3500 Lakewood Dr. Phenix City, AL, 36867) was
cut into panels of 12 in × 12 in and placed in stacks of 6 plies into a Ziplock® bag. Each Ziplock® bag
was filled with 240 mL of acetone, then the air bubbles were removed prior to sealing the Ziplock®
bag. The plies were soaked in acetone for 16 hours in order to remove the sizing from the fiber surface.
Acetone was evaporated in a cooling oven preheated to 100 °C.
A liquid media was produced to de-agglomerate POSS particles and provide a medium for attaching
the particles to the carbon fiber. The manufacturer specified two solvents; hexane for Octa and ethanol
for TriS. The POSS product and respective solvent were mixed by a VDI-24 homogenizer at
2400 rev/min for 5 minutes. The amount of solvent in each batch was of sufficient quantity such that
the fiber plies could be fully soaked. Weight percent of POSS was calculated based on the weight of
the carbon fiber to be coated. Since the homogenizer was not able to completely de-agglomerate the
particles, the admixture was then subjected to ultrasound cavitation to achieve appropriate dispersion
of POSS particles. The solution was submerged in a 5.5 °C cooling bath and was sonicated for an hour
and 30 minutes at 45% amplitude using the VCX 500 Vibra Cell Liquid Processor.
To coat carbon fibers with POSS, fiber plies were individually inserted in a Ziploc® bag with 40 mL
of the solution for each 6 in × 6 in ply. In case of each 12 in × 12 in ply, 140 mL of the solution was
used. To ensure complete soaking, air bubbles were removed prior to sealing the bags. Each Ziploc®
bag was then secured to a standard massage pad set on high vibration mode for a duration of three
hours. Residual solvent was then evaporated by keeping it in an cooling oven (preheated to 100 °C) for
30 minutes. Coated carbon fibers were next used to fabricate composite panels.
Traditional hand lay–up method followed by compression molding was used to fabricate the various
categories of panels. Three categories of composite panels were fabricated using Derakane 8084 vinyl
ester resin (J.I. Plastics 19233 Plank Road Zachery. LA 70791). The three types of panels were:
(i) - fiber coated with 1.0 wt % octaisobutly; (ii) - fiber coated with 0.2 wt % Trisilanolphenyl; and
(iii) - control panels with acetone treated carbon fiber. The resin was formulated as specified by the
manufacture, namely, Ashland Inc. The process began with pouring of resin on the mold face. A single
ply was stacked on top followed by the addition of resin spread over the entire ply. This sequence was
repeated until all the required plies had been applied. The top mold plate was stacked at the end
completing the hand lay-up operation. The mold was then clamped and allowed to cure. After curing
for 24 hours the mold was debulked, and the panel was machined to extract samples for mechanical
and hygrothermal analyses.
Short beam shear tests were carried out on a Z050 Zwick/Roell machine at a crosshead speed
of 1.3 mm/min at ambient temperature. ASTM D2344 standard was followed to conduct the
short beam shear tests. Span-to-thickness ratio was maintained at 4. Sample dimensions were
30 mm (length) × 10 mm (width) × 5 mm (thickness). Five specimens were tested in each category.
Low velocity impact tests were conducted using a Dynatup 8210 machine with a 12.5 mm diameter
hemispherical tup. Impact energy was 30 J. The weight of the crosshead was 6.39 kg [19]. Specimen

Materials 2011, 4
1622
size was 2.8 mm × 101.6 mm × 101.6 mm. Each specimen was clamped into the sample holder at the
bottom of the testing machine with a circular support spanning 75 mm. A GRC 930-I data acquisition
system was used to compute the load, energy, velocity, and displacement during each impact. Three
specimens were tested for each category.
For durability tests, composite samples were exposed to saltwater at room temperature, saltwater at
40 °C, and 85% humidity at 50 °C for six weeks. Thirty-six short beam shear specimens were used in
this investigation. Specimens from each category of panels were weighed prior to immersion. Samples
were weighed periodically to measure the rate of water absorption. Initially, the samples were weighed
every 3–4 days followed by wider intervals up to a week. Water absorption was higher initially, and
then leveled off as the samples became saturated. Percentage of weight change was determined as:
100%0
M
MMM ot (1)
where Mt is the weight at time t and M0 is the initial dry weight [7,20]. After environmental exposure,
five specimens from each composite system were tested in short beam shear under two conditions; one
is immediately after taking them from the testing environment (wet condition) and the other after
drying them for several days in ambient conditions. Shear strength values were then compared with
those obtained prior to environmental exposure.
3. Results and Discussion
3.1. Fiber Surface Analysis
In an attempt to assess the success of coating, SEM micrographs of fiber surfaces were examined as
shown in Figure 1. Figure 1a shows the surface of as-received carbon fiber. The figure indicates a very
clear surface. EDS studies at multiple sites have shown presence of elemental C and O. The oxygen
may have come from oxidation of the fiber surface by the manufacturer to promote bonding. Weight
percentage of these elements varied slightly at three locations examined on the fiber surface. No trace
of silicon (Si) was observed. Fiber surface treated with POSS is shown in Figure 1b. Attachment of
POSS coating on the fiber surface is quite evident. As seen in the SEM micrograph, the coating is
more or less uniform on the surface. EDS studies have detected Si indicating the success of our coating
methodology. Although we did not determine what chemical bonds were created between fiber and the
POSS, the coating is smooth and adhering to the fiber. The reason for such adherence is coming from
the silanol functional group that has been installed in the trisilanolphenyl-POSS. Silanol has Si atom at
the core with OH functional groups at the outside which can interact with carbon fiber substrate and
form Si–O–C chemical bonds. On the other hand, hydroxyl groups (OH) of silanol can also react with
unsaturated C (reactive sites) present in vinyl ester molecules forming similar chemical bonds resulting
in an intimate fiber/matrix interface.

Materials 2011, 4
1623
Figure 1. SEM images and EDS anaylsis of carbon fibers: (a) “as-received” and
(b) POSS Treated.
Spectrum 1
Spectrum 2
Spectrum 1Spectrum 1
Spectrum 2Spectrum 2
Spectrum 1
Spectrum 2
Spectrum 1Spectrum 1
Spectrum 2Spectrum 2
100.00100.00Totals
49.1056.2452.7859.82O K
50.9043.7647.2240.18C K
Atomic%Weight%Atomic%Weight%Element
Spectrum 2Spectrum 1
100.00100.00Totals
2.444.790.681.37Si K
47.7153.3644.6351.37O K
49.8541.8554.6947.26C K
Atomic%Weight%Atomic%Weight%Element
Spectrum 2Spectrum 1
(a) “as received” carbon fiber
(b) trisilanolphenyl-POSS fiber surface treatment
Spectrum 1
Spectrum 2
Spectrum 1Spectrum 1
Spectrum 2Spectrum 2
Spectrum 1
Spectrum 2
Spectrum 1Spectrum 1
Spectrum 2Spectrum 2
100.00100.00Totals
49.1056.2452.7859.82O K
50.9043.7647.2240.18C K
Atomic%Weight%Atomic%Weight%Element
Spectrum 2Spectrum 1
100.00100.00Totals
2.444.790.681.37Si K
47.7153.3644.6351.37O K
49.8541.8554.6947.26C K
Atomic%Weight%Atomic%Weight%Element
Spectrum 2Spectrum 1
100.00100.00Totals
2.444.790.681.37Si K
47.7153.3644.6351.37O K
49.8541.8554.6947.26C K
Atomic%Weight%Atomic%Weight%Element
Spectrum 2Spectrum 1
(a) “as received” carbon fiber
(b) trisilanolphenyl-POSS fiber surface treatment
3.2. Interlaminar Shear and Low Velocity Impact Tests
Two types of mechanical tests were performed to see if there was any improvement in properties
due to POSS coating of the fiber. Short beam shear and low velocity impact tests were conducted.
Short beam shear tests were meant to measure the interlaminar shear strength of the composite. Since
the span/depth ratio was low the tests allowed specimens to fail under in-plane shear. Short beam shear
tests were done according to ASTM standard. Representative load-displacement curves for three
categories of samples are shown in Figure 2. The curve for the neat specimen portrays an uncontrolled
displacement after it reaches the maximum load. A distinct failure is not obvious until the specimen
reaches the maximum displacement limit. On the other hand, clear failure of the composite is quite
evident in the curves of Octa and TriS. The failure is almost brittle in nature. In both cases, the load
reaches to a maximum and then failure occurs immediately after. Deflection to failure is much smaller
compared to that of neat. The initial slope of both the curves is also much steeper than that of the neat.
If tangent modulii were to be calculated, they would be much higher with the POSS-coated specimens.
Calculated values of average strength with corresponding standard deviation are shown in Table 1. It is
seen in Table 1 that interlaminar shear strength of the composite has increased by 17% and 25%,
respectively with the coating of Octa and TriS. We attribute such increase in strength solely to POSS.
Data in the table also suggests that TriS provides a better coating than Octa. Stiffening of the
composite also corresponds to previous studies conducted with other nanoparticles corroborating the
fact that any inorganic inclusion in the composite will tend to increase modulus and reduce fracture

Materials 2011, 4
1624
strain [21,22]. However if we look at the three curves up to the yield point, an important feature is
revealed. Although it is not a standard procedure to measure modulus of resilience (toughness) from
flexure tests, one can still have a good estimate of energy absorption up to yield from Figure 2. For
example, a vertical line at 0.35 mm displacement up to the tip of each curve would clearly indicate that
the area under the curve which, in essence is energy absorption, has increased significantly with POSS
coated samples. Increase in strength and energy absorption thus demonstrates the effectiveness of
our approach.
Figure 2. Short beam shear testing results.
0
200
400
600
800
1000
1200
1400
1600
1800
0 0.2 0.4 0.6 0.8 1 1.2 1.4
Deformation (mm)
Lo
ad
(N
)
Neat
Octa
TriS
Neat
TriS
Octa
0
200
400
600
800
1000
1200
1400
1600
1800
0 0.2 0.4 0.6 0.8 1 1.2 1.4
Deformation (mm)
Lo
ad
(N
)
Neat
Octa
TriS
Neat
TriS
Octa
Table 1. Comparison of interlaminar shear strength.
Panel Type Carbon Fiber wt % Shear Strength (MPa) Gain/Loss (%)
Neat --- 18.38 ± 0.72 --- Octa 1.0% 21.51 ± 0.73 17.03
TriS 0.2% 23.06 ± 1.82 25.48
In the next step, samples were tested under low velocity impact. As the tup tends to penetrate during
impact, energy is absorbed and dissipated from the point of impact. Absorption of energy will depend
on delamination, matrix cracking, and interface separation. On the other hand, tensile wave speed
through the composite will dictate the rate of dissipation of energy. Tensile wave speed through the
composite in turn will depend on the modulii of the matrix and fiber, F/M matrix interface, and density
of the composite. In other words performance under low velocity impact, in addition to energy
absorption characteristics of the composite, will also reflect the integrity of the F/M interface modified
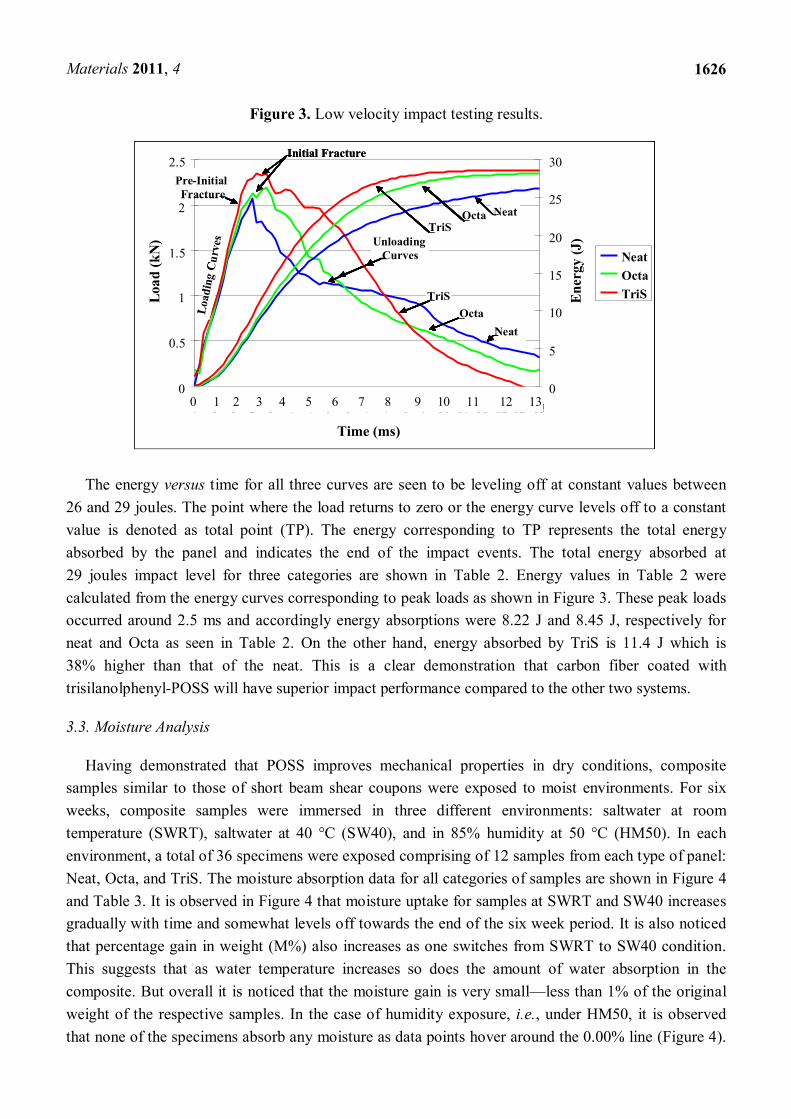
by POSS. Load and energy versus time curves from the impact tests are shown in Figure 3. Load
curves are to the left rising to a peak and then unloading to almost zero load level. Energy curves are
seen to be rising steadily and leveling off at around 29 joules. Load and energy curves in Figure 3 are
shown for three categories of samples; neat, Octa, and TriS. Load curve for the neat indicates a linear

Materials 2011, 4
1625
ramping up to the maximum load point without any load drops. Since load drops during the ascending
stage of the load curve are indicative of the existence of incipient damage point (IDP). The IDP can be
detected by a change of slope in the loading portion of the load vs. time curve [23]. The curve for the
neat suggests that there is no IDP. However in case of TriS and Octa there are slight load drops just
before reaching the peak meaning that IDP is present. Before IDP, the load drop indicates initial matrix
damage in the early stage of the impact event, and after IDP the load drop indicates delamination and
F/M interface failure. Since load drops are very small in these two cases, presence of IDP suggests that
there is modest delamination and interface failure with the POSS modified samples. The maximum
load point (MLP) provides the peak value that a panel can tolerate under a particular impact event
before undergoing major damage. Usually at the MLP a major fiber breakage occurs through the
thickness [24] and this breakage normally starts from the back face (tension side) followed by a
penetration on the front face (compression side). Peak values for neat, Octa and TriS are 2.14, 2.26 and
2.51 KN, respectively. It is clear that at this energy level (29J) TriS specimens can withstand higher
impact load as compared to neat and Octa (Table 2). The load curve after MLP is denoted as unloading
curve. It is seen in Figure 3 that unloading curves for all three categories gradually descend with more
or less smooth load drops until contact ceases. However, there are some differences between the three
unloading curves. In case of neat, unloading from MLP is very sudden up to about 4 ms and then it
gradually drops to 0.4 KN load. Such sudden drop indicates more fiber breakage at the tensile side of
the coupon. In case of Octa and TriS the rate of unloading is relatively smoother without any sudden
change in slope suggesting a gradual progression of failure. It is also noticed in Figure 3 that loading
curves for the three systems are not symmetric about MLP, that is they have shorter time (~2.5 ms) for
fracture initiation (i.e., time required to reach the peak load) but longer propagation time. However
with Octa and TriS samples, it is observed that there is also a initial fracture region before the load
reaches the peak. This initial fracture region is followed by pre-initial fracture as indicated in Figure 3.
This two step fracture process with POSS modified samples during the loading apparently sets the
stage for gradual damage progression, especially in the case of TriS samples.
Table 2. Comparison of low velocity impact parameters.
Impact Parameters at Peak Load
Fiber Sizing Agent
Neat Octa G/L* TriS G/L*
Load (kN) 2.14 2.26 5.61 2.51 17.3 Energy (J) 8.22 8.45 2.80 11.4 38.3
Deflection (mm) 6.79 6.71 −1.18 7.85 15.6 Time to Peak (ms) 2.37 2.35 −0.84 2.81 18.6
Front Damage (m2) 6.02 4.70 21.80 4.27 29.03 Back Damage (m2) 4.32 2.49 42.40 2.05 52.63
Materials 2011, 4
1626
Figure 3. Low velocity impact testing results.
0
0.5
1
1.5
2
2.5
0 1 1 2 3 4 4 5 6 7 7 8 9 10 10 11 12 12 13
Time (ms)
Loa
d (
kN
)
0
5
10
15
20
25
30
En
ergy
(J)
Neat
Octa
TriS
Neat
OctaLoa
din
g C
urv
es Unloading Curves
Initial Fracture
Pre-Initial Fracture
TriS
NeatOctaTriS
Neat
OctaLoa
din
g C
urv
es Unloading Curves
Initial Fracture
Pre-Initial Fracture
TriS
NeatOctaTriS
0 1 2 3 4 5 6 7 8 9 1 0 11 12 130
0.5
1
1.5
2
2.5
0 1 1 2 3 4 4 5 6 7 7 8 9 10 10 11 12 12 13
Time (ms)
Loa
d (
kN
)
0
5
10
15
20
25
30
En
ergy
(J)
Neat
Octa
TriS
Neat
OctaLoa
din
g C
urv
es Unloading Curves
Initial Fracture
Pre-Initial Fracture
TriS
NeatOctaTriS
Neat
OctaLoa
din
g C
urv
es Unloading Curves
Initial Fracture
Pre-Initial Fracture
TriS
NeatOctaTriS
0 1 2 3 4 5 6 7 8 9 10 11 12 130
0.5
1
1.5
2
2.5
0 1 1 2 3 4 4 5 6 7 7 8 9 10 10 11 12 12 13
Time (ms)
Loa
d (
kN
)
0
5
10
15
20
25
30
En
ergy
(J)
Neat
Octa
TriS
Neat
OctaLoa
din
g C
urv
es Unloading Curves
Initial Fracture
Pre-Initial Fracture
TriS
NeatOctaTriS
Neat
OctaLoa
din
g C
urv
es Unloading Curves
Initial Fracture
Pre-Initial Fracture
TriS
NeatOctaTriS
0 1 2 3 4 5 6 7 8 9 1 0 11 12 130
0.5
1
1.5
2
2.5
0 1 1 2 3 4 4 5 6 7 7 8 9 10 10 11 12 12 13
Time (ms)
Loa
d (
kN
)
0
5
10
15
20
25
30
En
ergy
(J)
Neat
Octa
TriS
Neat
OctaLoa
din
g C
urv
es Unloading Curves
Initial Fracture
Pre-Initial Fracture
TriS
NeatOctaTriS
Neat
OctaLoa
din
g C
urv
es Unloading Curves
Initial Fracture
Pre-Initial Fracture
TriS
NeatOctaTriS
0 1 2 3 4 5 6 7 8 9 10 11 12 130
0.5
1
1.5
2
2.5
0 1 1 2 3 4 4 5 6 7 7 8 9 10 10 11 12 12 13
Time (ms)
Loa
d (
kN
)
0
5
10
15
20
25
30
En
ergy
(J)
Neat
Octa
TriS
0
0.5
1
1.5
2
2.5
0 1 1 2 3 4 4 5 6 7 7 8 9 10 10 11 12 12 13
Time (ms)
Loa
d (
kN
)
0
5
10
15
20
25
30
En
ergy
(J)
Neat
Octa
TriS
Neat
OctaLoa
din
g C
urv
es Unloading Curves
Initial Fracture
Pre-Initial Fracture
TriS
NeatOctaTriS
Neat
OctaLoa
din
g C
urv
es Unloading Curves
Initial Fracture
Pre-Initial Fracture
TriS
NeatOctaTriS
0 1 2 3 4 5 6 7 8 9 1 0 11 12 130
0.5
1
1.5
2
2.5
0 1 1 2 3 4 4 5 6 7 7 8 9 10 10 11 12 12 13
Time (ms)
Loa
d (
kN
)
0
5
10
15
20
25
30
En
ergy
(J)
Neat
Octa
TriS
0
0.5
1
1.5
2
2.5
0 1 1 2 3 4 4 5 6 7 7 8 9 10 10 11 12 12 13
Time (ms)
Loa
d (
kN
)
0
5
10
15
20
25
30
En
ergy
(J)
Neat
Octa
TriS
Neat
OctaLoa
din
g C
urv
es Unloading Curves
Initial Fracture
Pre-Initial Fracture
TriS
NeatOctaTriS
Neat
OctaLoa
din
g C
urv
es Unloading Curves
Initial Fracture
Pre-Initial Fracture
TriS
NeatOctaTriS
0 1 2 3 4 5 6 7 8 9 10 11 12 13
The energy versus time for all three curves are seen to be leveling off at constant values between
26 and 29 joules. The point where the load returns to zero or the energy curve levels off to a constant
value is denoted as total point (TP). The energy corresponding to TP represents the total energy
absorbed by the panel and indicates the end of the impact events. The total energy absorbed at
29 joules impact level for three categories are shown in Table 2. Energy values in Table 2 were
calculated from the energy curves corresponding to peak loads as shown in Figure 3. These peak loads
occurred around 2.5 ms and accordingly energy absorptions were 8.22 J and 8.45 J, respectively for
neat and Octa as seen in Table 2. On the other hand, energy absorbed by TriS is 11.4 J which is
38% higher than that of the neat. This is a clear demonstration that carbon fiber coated with
trisilanolphenyl-POSS will have superior impact performance compared to the other two systems.
3.3. Moisture Analysis
Having demonstrated that POSS improves mechanical properties in dry conditions, composite
samples similar to those of short beam shear coupons were exposed to moist environments. For six
weeks, composite samples were immersed in three different environments: saltwater at room
temperature (SWRT), saltwater at 40 °C (SW40), and in 85% humidity at 50 °C (HM50). In each
environment, a total of 36 specimens were exposed comprising of 12 samples from each type of panel:
Neat, Octa, and TriS. The moisture absorption data for all categories of samples are shown in Figure 4
and Table 3. It is observed in Figure 4 that moisture uptake for samples at SWRT and SW40 increases
gradually with time and somewhat levels off towards the end of the six week period. It is also noticed
that percentage gain in weight (M%) also increases as one switches from SWRT to SW40 condition.
This suggests that as water temperature increases so does the amount of water absorption in the
composite. But overall it is noticed that the moisture gain is very small—less than 1% of the original
weight of the respective samples. In the case of humidity exposure, i.e., under HM50, it is observed
that none of the specimens absorb any moisture as data points hover around the 0.00% line (Figure 4).

Materials 2011, 4
1627
A comparison among the three systems is shown in Table 3. The table lists percentage gain for each
category of samples under SWRT and SW40 conditions. Since there is no weight change under HM50,
it is omitted in Table 3. Last two columns of Table 3 compare weight change of Octa and TriS with
that of neat. It is observed under SWRT that Octa gains 0.64% weight as compared to that of neat
(0.75%). This means that Octa absorbs 15% less water when compared with neat. This value is
depicted in Gain/Loss column for Octa in Table 3. On the other hand, weight change for TriS is 0.51%
meaning that it absorbs 32% less water with respect to neat specimens. As condition changed to SW40
i.e., at higher temperature, Octa absorbed more water (0.94%) than the neat (0.85%). But that was not
the case with TriS, it still absorbed less water (0.68%) than the neat. Amount of water absorption was
20% less compared to neat as indicated in the table. This again shows clearly that TriS coating is very
effective in enhancing the durability of carbon/vinyl ester composites under salt water environment.
Figure 4. Percentage of weight change in saltwater 40 °C.
-0.20
0.00
0.20
0.40
0.60
0.80
1.00
1.20
0 5 10 15 20 25 30 35 40
Time (sqrt[hr])
M (
%)
Neat SWRT
Neat SW40
Neat HM50
TriS SWRT
TriS SW40
TriS HM50
Octa SWRT
Octa SW40
Octa HM50
Table 3. Comparison of weight change in moist and saltwater environments.
Condition Percentage of Weight Change (%) Gain/Loss w.r.t Neat (%)
Neat Octa TriS Octa TriS
SWRT 0.75 0.64 0.51 15 32
SW40 0.85 0.94 0.68 −11 20 HM50 - - -

Materials 2011, 4
1628
In an attempt to assess the degradation of strength after environmental exposure, samples were
tested in short beam shear at two stages; one category was tested immediately after the end of six week
period while specimens were still wet (SW40_Wet), and the other was dried for two weeks at ambient
temperature (SW40_Dry) and then tested. Although short beam shear tests were performed after all
three environmental exposures, test data for SW40 are shown in this paper. Since the performance of
TriS samples were most significant, short beam shear data for TriS only are shown in Figure 5. Two
sets of curve–one for neat and the other for TriS are shown. Each set of neat and TriS has three curves
for Original_Dry, SW40_Wet, and SW40_Dry. Strength data from these tests are shown in Table 4.
It is evident from Table 4 that shear strength of the composite has increased rather than decreasing
after SW40 exposure. Similar was the case with other conditions. This was true also with Octa. It is
observed that in case of neat there is substantial gain in strength from 18 MPa to about 29 MPa after
exposure. Gain in strength with TriS was however, moderate from 23 MPa to about 28–30 MPa. There
is no significant change whether specimens are tested immediately after or after two weeks of drying.
In any case, it was surprising to note that instead of loosing strength, composites were in fact gaining
strength after the exposure. This trend was more prominent as the exposure temperatures increased
from RT to 40 °C and then to 50 °C. Probable explanation for such behavior is that during
environmental exposure, the resin was in fact still curing. Based on this observation, Original_Dry
samples were post cured for at 90 °C for 2 hours as specified by the manufacturer. The resulting shear
strength was 33 MPa, indicating that the composites were curing in the moist environments.
Figure 5. Seawater 40 °C short beam shear testing results.
0
500
1000
1500
2000
2500
0.00 0.50 1.00 1.50
Displacement (mm)
Loa
d (
N)
Neat Original_Dry
TriS Original_Dry
Neat SW40_Wet
TriS SW40_Wet
Neat SW40_Dry
TriS SW40_DryTriS Original_Dry
Neat Original_Dry
TriS SW40_Dry
TriS SW40_Wet
Neat SW40_Wet
Neat SW40_Dry
0
500
1000
1500
2000
2500
0.00 0.50 1.00 1.50
Displacement (mm)
Loa
d (
N)
Neat Original_Dry
TriS Original_Dry
Neat SW40_Wet
TriS SW40_Wet
Neat SW40_Dry
TriS SW40_DryTriS Original_Dry
Neat Original_Dry
TriS SW40_Dry
TriS SW40_Wet
Neat SW40_Wet
Neat SW40_Dry
Table 4. Comparison of interlaminar shear strength after environmental exposure.
Shear Strength (MPa)
Specimens Original_Dry SW40_Wet SW40_Dry
Neat 18.38 ± 0.72 29.29 ± 1.35 29.58 ± 1.07 TriS 21.51 ± 0.73 28.64 ± 1.56 30.30 2.16

Materials 2011, 4
1629
4. Summary
A chemical procedure has been developed to install POSS on the carbon fiber surface. The
procedure is simple and involves a few low cost steps. SEM and EDS studies have demonstrated that
the treatment of the fiber surface is indeed successful. Two types of POSS, namely, octaisobutyl and
trisilanolphenyl have been investigated. Mechanical tests have indicated that both interlaminar shear
strength and low velocity impact strength have improved by the reinforcement of POSS. However, the
improvement was more significant with TriS in each case since TriS had compatible functional groups
attached to its core silica molecule.
Environmental exposure experiments have revealed that water uptake during a six week period of
time was minimal. Although water absorption was insignificant, it has been shown that composites
with TriS performed the best under each of the exposure conditions. Mechanical tests, such as short
beam shear test, of samples after exposure to environmental conditions have shown that there is no
degradation in shear strength. In some cases, it has rather shown some improvement. This was true
with neat, as well as with POSS reinforced composites. However, improvement with POSS was
consistent as it was observed under dry conditions. It also suggests that while under environmental
exposure, the resin was in fact curing rather than deteriorating within the six week time period, especially
at elevated temperature. This explains the minimum amount of water absorption and slight increase in
shear strength. Follow up experiments with post cured specimens have confirmed the assertion.
Acknowledgement
The authors wish to thank the Offices of Naval Research for financial support through grant
N00014-09-1-0317.
References
1. Mouritz, A.P.; Gellert, E.; Burchill, P.; Challis, K. Review of Advanced Composite Structures for
Naval Ship and Submarines. Compos. Struct. 2001, 53, 21-41.
2. Makinen, K.; Hellbratt, S.E.; Olsson, K.A. Mechanics of Sandwich Structures; Vautrin, A., Ed.;
Kluwer Academic Publishers: Dordrecht, The Netherlands, 1988; Volume 13.
3. Goublat, P.; Mayes, S. Comparitive Analysis of Metal and Composite Materials for the Primary
Structure of Patrol Boat. J. Nav. Eng. 1996, 108, 387-397.
4. Shivakumar, K.N.; Swaminathan, G.; Sharpe, M. Carbon/Vinyl Ester Composites for Enhanced
Performance in Marine Applications. J. Reinf. Plast. Compos. 2006, 25, 1101-1116.
5. Kootsookos, A.; Mouritz, A.P. Seawater Durability of Glass- and Carbon- Polymer Composites.
Compos. Sci. Technol. 2004, 64, 1503-1511.
6. Rivera, J.; Karbhari, V.M. Cold-Temperature and Simultaneous Aqueous Environment Related
Degradation of Carbon/Vinyl Ester Composites. Compos. Part B Eng. 2002, 33, 17-24.
7. Acha, B.A.; Carlsson, L.A.; Granata, R.D. Moisture Effects on Carbon/Vinyl Ester by Dynamic
Mechanical Analysis. In Proceedings of the ECCOMAS Thematic Conference on Mechanical
Response of Composites, Porto, Portugal, 12–14 September 2007.

Materials 2011, 4
1630
8. Ramirez, F.A. Evaluation of water degradation of vinyl ester and epoxy matrix composites by
single fiber and composite tests. M.S. Thesis, Florida Atlantic University, Boca Raton, FL, USA
2008.
9. Wood, C.A.; Bradley, W.L. Determination of the Effect of Seawater on the Interfacial Strength of
an Interlayer E-glass/Graphite/Epoxy Composite by In situ Observation of Transverse Cracking in
an Environmental SEM. Compos. Sci. Technol. 1997, 57, 1033-1043.
10. Zhu, J.; Imam, A.; Crane, R.; Lozano, K.; Khabashesku, V.; Barrera, E. Processing a glass fiber
reinforced vinyl ester composite with nanotube enhancement of interlaminar shear strength.
Compos. Sci. Technol. 2007, 67, 1509-1517.
11. Allerd, R.E.; Haight, A.E.H.; Gosau, J.M.; Wesson, S.P. Aqueous-Based Emulsion Reactive
Finishes for Improving Carbon/Vinyl Ester Interfacial Bonding. In Proceedings of the 50th
International SAMPE Symposium and Exhibition, Long Beach, CA, USA, 1–5 May 2005.
12. Park, R.; Jang, J. Performance improvement of carbon fiber/polyethylene fiber hybrid composites.
J. Mater. Sci. 1999, 34, 2903-2910.
13. Langston, T.A. The Effects of Nitric Acid and Silane Surface Treatments on Carbon Fibers and
Carbon/Vinyl Ester Composites Before and After Seawater Exposure. Ph.D. Dissertation, Florida
Atlantic University, Boca Raton, FL, USA, 2008.
14. Verghese, K.N.E.; Broyles, N.S.; Lesko, J.J.; Davis, R.M.; Riffle, J.S. Pultruded Carbon
Fiber/Vinyl Ester Composites Processed with Different Fiber Sizing Agents. Part II: Enviro-
Mechanical Durability. J. Mater. Civ. Eng. 2005, 17, 335-342.
15. User’s Guide. Hybrid Plastics, a Company. 2009. Available online: http://www.hybridplastics.com/
pdf/user-v2.06.pdf (accessed on 4 September 2008).
16. Zhang, X.; Huang, Y.; Wang, T.; Liu, L. Effects of polyhedral oligomeric silsesquioxane coatings
on the interface and impact properties of carbon fiber/polyarylacetylene composites. J. Appl.
Polym. Sci. 2006, 102, 5202-5211.
17. Mahfuz, H.; Powell, F.; Granata, R.; Hosur, M. The Effects of POSS on the Interlaminar Shear
Strength of Marine Composites under Various Environmental Conditions. In Proceedings of the
2010 Nanotech Conference, Anaheim, CA, USA, 21–23 June 2010; Volume 115.
18. Mahfuz, H.; Powell, F.; Granata, R.; Hosur, M. Treatment of Carbon Fiber with POSS and
Enhancement in Mechanical Properties of Composites. In Proceedings of the Society for the
Advancement of Material and Process Engineering, Seattle, WA, USA, 17–20 May 2010.
19. Hosur, M.V.; Jain, K.; Chowdhury, F.; Jeelani, S.; Bhat, M.R.; Murthy, C.R.L. Low-velocity
impact response of carbon/epoxy laminates subjected to cold-dry and cold-moist conditioning.
Compos. Struct. 2007, 79, 300–311.
20. Shen, C.; Spring, G.S. Moisture Absorption and desorption of composite materials. J. Compos.
Mater. 1976, 10, 2–20.
21. Rodgers, R.; Mahfuz, H.; Rangari, V.; Chisholm, N.; Jeelani, S. Infusion of nanoparticle into
SC-15 epoxy; an investigation of thermal and mechanical response. Macromol. Mater. Eng. 2005,
290, 423–429.
22. Chisholm, N.; Mahfuz, H.; Rangari, V.; Ashfaq, A.; Jeelani, S. Fabrication and mechanical
characterization of carbon/epoxy nanocomposites. Compos. Struct. 2005, 67, 115–124.

Materials 2011, 4
1631
23. Cantwell, W.J.; Morton, J. Comparison of low and high velocity impact response of CFRP.
Composites 1989, 20, 545–551.
24. Nejhad, M.N.G.; Parvizi-Majidi, A. Impact behavior and damage tolerance of woven carbon
reinforced thermoplastic composites. Composites 1990, 21, 155–168.
© 2011 by the authors; licensee MDPI, Basel, Switzerland. This article is an open access article
distributed under the terms and conditions of the Creative Commons Attribution license
(http://creativecommons.org/licenses/by/3.0/).