Nanoarchitecture and Global warming New Revolution for Nanomaterials

Motion with Moving Man SIM HomeworkAnswer Key
Representations of Motion For this homework assignment, you will need to use the Moving Man Exploration available from the course website at http://www.colorado.edu/physics/phys1010. As you work through these problems focus on making sense of the motion graphs and discuss your reasoning with your peers! What is the graph really telling you about the motion? Graphs are used in science and many other areas (!) to record and convey a whole lot of information, just like a photo of the foothills conveys a whole lot of information about the area we live in. They provide a compact way to tell the whole history of an object's motion.
1) (0.5 pts) First, orient yourself to the Moving Man tool by selecting the “accelerate” motion from the choose motion list. With the moving man starting at a position of -8 m, set him to “accelerate” at 1 m/s2 from an initial velocity of 0. Observe the motion. Also notice that the tool comes equipped with a playback feature and a double-bar cursor that you may move with the mouse to probe position, velocity, and acceleration along the graph. What is his velocity when he crosses the origin (the position of 0 meters)? Answer: 4.0 m/s (3.9 to 4.1)Discussion: The moving man starts at a position of -8 metersand is accelerating at 1 m/s2. He starts with a velocity of 0 m/s. After 1 second, he will be going 1 m/s (remember acceleration is 1 m/s per s so velocity will change by +1 m/s with each second that elapses). So after 2 seconds, he will be going 2 m/s, etc. If you carry this motion out with moving man, you see it will take him 4 seconds to get to theorigin (a position of 0 meters), or equivalently to move +8 meters from where he started. At 4 seconds, he will have a velocity of 4 m/s.
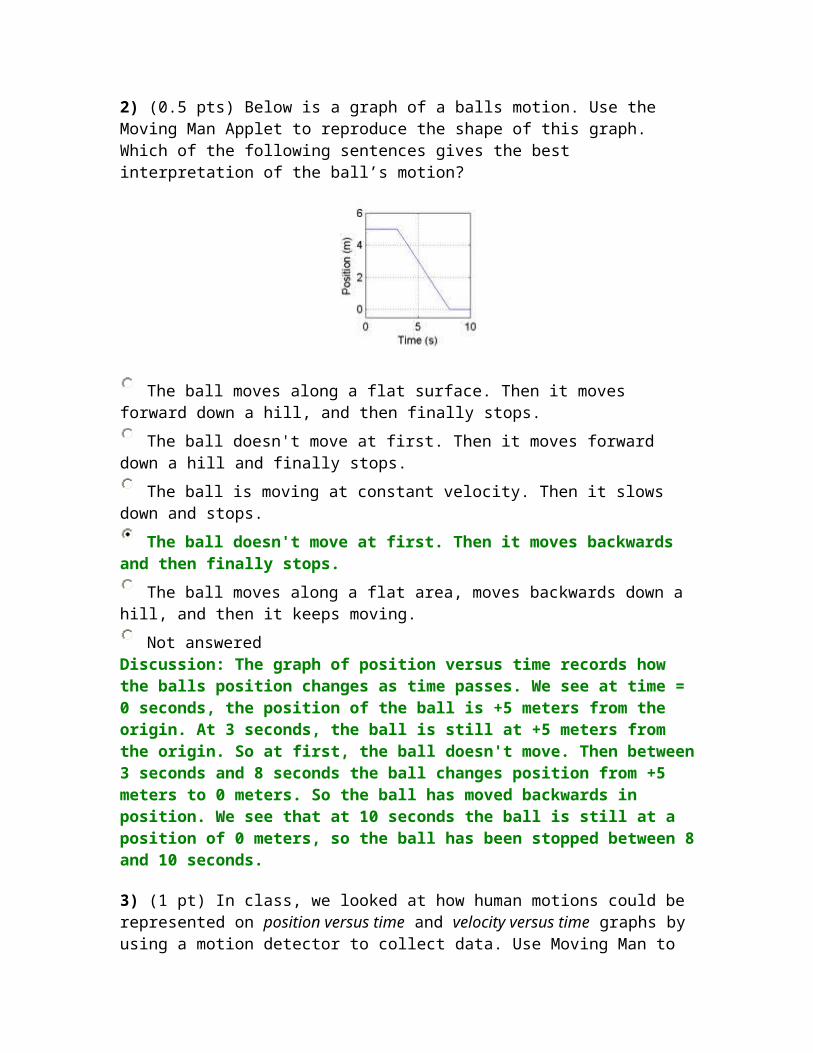
2) (0.5 pts) Below is a graph of a balls motion. Use the Moving Man Applet to reproduce the shape of this graph. Which of the following sentences gives the best interpretation of the ball’s motion?
The ball moves along a flat surface. Then it moves forward down a hill, and then finally stops.
The ball doesn't move at first. Then it moves forward down a hill and finally stops.
The ball is moving at constant velocity. Then it slows down and stops.
The ball doesn't move at first. Then it moves backwards and then finally stops.
The ball moves along a flat area, moves backwards down a hill, and then it keeps moving.
Not answered Discussion: The graph of position versus time records how the balls position changes as time passes. We see at time = 0 seconds, the position of the ball is +5 meters from the origin. At 3 seconds, the ball is still at +5 meters from the origin. So at first, the ball doesn't move. Then between3 seconds and 8 seconds the ball changes position from +5 meters to 0 meters. So the ball has moved backwards in position. We see that at 10 seconds the ball is still at a position of 0 meters, so the ball has been stopped between 8and 10 seconds.
3) (1 pt) In class, we looked at how human motions could be represented on position versus time and velocity versus time graphs byusing a motion detector to collect data. Use Moving Man to

simulate the following scenario: A man starts at the origin,walks towards the tree slowly and steadily for 6 seconds, then stands still for 6 seconds, and then turns around and walks towards the house steadily about twice as fast for 6 seconds.
a) Which of the following velocity versus time graphs conveys this type of motion:
A B
C D E Answer: F G H ......... Not answered
Discussion: The graph of velocity versus time records howthe man's velocity changes as time passes. Graph F shows a constant negative velocity for the first 6 seconds. This represents the man walking towards the tree (in the negative direction). Between 6 seconds and 12 seconds, Graph F shows the velocity as ZERO, meaning the man is standing still. Between 12 seconds and 18 seconds, Graph F show a constant positive velocity. This represents the man walking towards the house (in the positive direction). The magnitude (or absolute value) of the velocity indicates the speed and the sign (or plus/minus)of the velocity indicates direction of motion. Between 12seconds and 18 seconds, the speed is twice as fast as it was for the first 6 seconds.

b) Which of the following position versus time graphs also conveys this motion?
A Answer: B C D E F G H .......... Not answered
Discussion: The graph of position versus time records howthe man's position changes as time passes. Graph B shows that at time = 0 seconds, the man is at a position of 0 meters (the origin). Between 0 and 6 seconds, the man walks towards the tree, so his position changes steadily (constant slope) as he moves in the negative direction. This is represented in Graph B. Between 6 and 12 seconds,the man stands still so his position does not change. Between 12 and 18 seconds, the man walks twice as fast towards the house. The position vs time graph shows his position changing steadily but more rapidly than in the first 6 seconds. With every second that passes, the man moves twice as far as he did in the first 6 seconds. Graph B shows that at this faster pace, he walks past theorigin (position = 0) and continues on in the positive direction.
4) (4.5 pts total) A car is traveling along a road. Its velocity is recorded as a function of time and is shown in the graph below.

Use the Moving Man Simulation to reproduce the shape of thisgraph. You’ll find that there are a variety of approaches for recreating this type of motion within the applet, these include among others: • reproducing the motion using the walk motion and the velocity slider control, • reproducing the motion using the accelerate motion and acceleration slider control, or • reproducing the motion using direct mouse control over thewalking man. Note: This method is hard!
a) (1 pt) Describe in your own words the motion of the car and give a everyday life scenario in which the car’s velocity would resemble the plot shown above. Explain your reasoning by relating your description to what you see in the graph of the velocity vs time.
A velocity vs time graph records how the velocity changesas time passes. The magnitude of the velocity tells us the speed of the car, and the sign of the velocity tells us in what direction the car is traveling. In this graph,the velocity is a constant positive velocity of 15 m/s for the first 3 seconds, so during this time the car is traveling down the road at a steady speed in the positivedirection (call that in the forward direction). Over the next 5 seconds, the velocity decreases at a steady rate from 15 m/s to 0 m/s. During this time, the car continues

in the forward direction (positive velocity) but slows from 15 m/s to 0 m/s at which time it has stopped. The velocity remains 0 m/s for the next 5 seconds. At time = 13 seconds, the car's velocity increases at a steady ratefrom 0 m/s to 20 m/s. So the car starts moving in the forward direction again, and speeds up from 0 m/s to 20 m/s. After reaching 20 m/s, it travels forward at a steady speed.
A good scenario for this would be a car approaching a stop sign. Slowing to a stop. Waiting a few seconds. And then accelerating back up to a steady, but slightly higher, speed.
b) (0.5 pts) From this graph, what do you know about the position of the car at time equals 0 seconds? A velocity vs time graph records how the velocity changesas time passes. Velocity is (change in position)/(time elapsed). So if we know the velocity we know how the position is changing as time passes, but we have been given no information about about the position of the car. We do not know where the origin of position is nor do we know where the car is relative to the origin at time =0 s. At time = 0 seconds, the car is traveling at 15 m/s inthe positive direction, but the car could be at any position at time = 0 seconds. The velocity versus time curve is the same whether the car is at a position of 100meters, 0 meter, or -100 meters at time = 0 seconds.
c) (0.5 pts) How far does the car travel between 0 and 3 seconds? Answer: 45 m (42 to 48).Discussion: Between 0 and 3 seconds, the car travels at asteady velocity of 15 m/s. So every second, the car's position changes by +15 m. Over 3 seconds, the car's position has changed 45 m. In general, if the velocity is constant, than the (distance traveled = velocity x time).
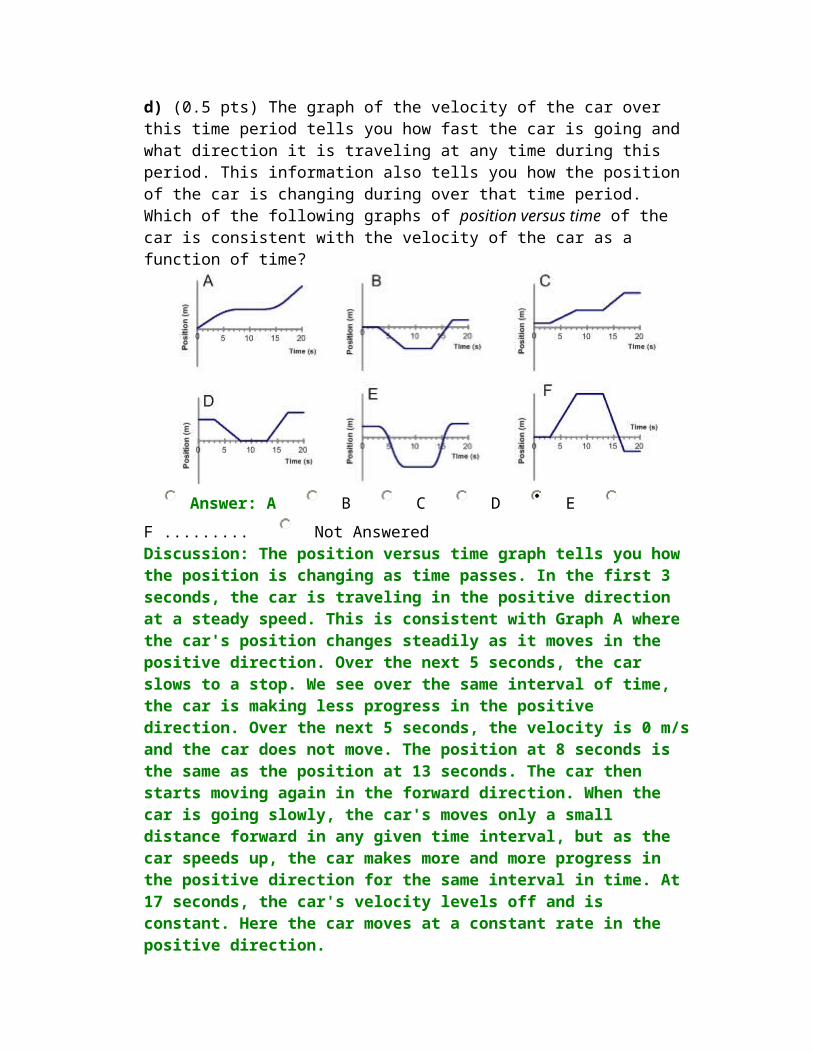
d) (0.5 pts) The graph of the velocity of the car over this time period tells you how fast the car is going and what direction it is traveling at any time during this period. This information also tells you how the position of the car is changing during over that time period. Which of the following graphs of position versus time of the car is consistent with the velocity of the car as a function of time?
Answer: A B C D E F ......... Not Answered Discussion: The position versus time graph tells you how the position is changing as time passes. In the first 3 seconds, the car is traveling in the positive direction at a steady speed. This is consistent with Graph A where the car's position changes steadily as it moves in the positive direction. Over the next 5 seconds, the car slows to a stop. We see over the same interval of time, the car is making less progress in the positive direction. Over the next 5 seconds, the velocity is 0 m/sand the car does not move. The position at 8 seconds is the same as the position at 13 seconds. The car then starts moving again in the forward direction. When the car is going slowly, the car's moves only a small distance forward in any given time interval, but as the car speeds up, the car makes more and more progress in the positive direction for the same interval in time. At 17 seconds, the car's velocity levels off and is constant. Here the car moves at a constant rate in the positive direction.

e) (1 pt) During which of the following times is the car accelerating? (Check all that apply)
between 0 and 3 seconds for only a brief instant at 3 seconds Answer: between 3 and 8 seconds between 8 and 13 seconds for only a brief instant at 13 seconds Answer: between 13 and 17 seconds for only a brief instant at 17 seconds between 17 and 20 seconds
Discussion: If the velocity is changing (either in magnitude (speed) or direction), then the car is accelerating. If the velocity is constant (both speed anddirection), than the acceleration is 0. The car's velocity (in this case speed), is changing between 3 and 8 seconds as the car slows down and again between 13 and 17 seconds as the car speeds up. f) (1 pt) What is the..
i) average acceleration between 0 and 3 seconds: Answer: 0 m/s^2
Discussion: If the velocity is constant (both speed anddirection), than the acceleration is 0. During the first 3 seconds, the velocity is constant (15 m/s in the positive direction).
ii) average acceleration between 3 and 8 seconds: Answer: -3.0 m/s^2 (-3.2 to -2.8)
Discussion: If the velocity is changing (either in magnitude (speed) or direction), then the car is accelerating. Between 3 and 8 seconds, the velocity changes from 15 m/s to 0 m/s.

Acceleration = (change in velocity)/(time elapsed) = (Vfinal - Vinitial) / (Tfinal - Tinitial) = (-15 m/s) /(5 s) = -3 m/s2.
5) (2 pts) The moving man applet allows you to set him into “Walk” mode and control the velocity at which the man walks.Play around with this control until you gain an intuition asto how the motion of the moving man relates to the velocity setting.
Answer: True False Not answered If the velocity is negative, the man is walking towards the tree under all conditions. Discussion: Velocity tells us both the speed (magnitude) anddirection (sign) of the man's motion. The origin (position =0 meters) is half-way between the tree and the house, and the tree is in the negative direction. If the velocity is negative (say - 1 m/s), then the position changes -1m each second. (If the man is at 5 meters, he will be at 4 meters after 1 second. If the man is at -5 meters, he will be at -6meters after 1 second.)
True Answer: False Not answered If the velocity is positive, the man’s position is always greater than zero. Discussion: Velocity tells us both the speed (magnitude) anddirection (sign) of the man's motion. A positive velocity indicates the man is moving in the positive direction at some rate. He can be at a position of -5 meters and moving towards the house with a velocity of +1m/s.
True Answer: False Not answered If the velocity is negative, the acceleration is negative. Discussion: A negative acceleration only indicates that the velocity is changing by say -1 m/s2, or (-1 meter per second, per second). The man could be traveling in the positive direction with a velocity of 5m/s. After 1 second, he would have slowed from 5 m/s to 4 m/s (a change of - 1m/s). OR the man could be traveling in the negative direction with a velocity of - 5 m/s. After 1 second, he

would have sped up from -5m/s to -6m/s (again, a change of -1m/s).
True Answer: False Not answered A negative velocity means the man is slowing down. Discussion: Velocity tells us speed and direction. A negative velocity means the man is moving in the negative direction. Depending on his acceleration, he could be speeding up, slowing down, or going at a constant speed in the negative direction.
True Answer: False Not answered If the velocity is zero, the moving man is at the origin. Discussion: A velocity of 0 m/s means the man is not moving.He is standing still, but he could be standing still at the house (+10 meters), at the tree (-10 meters), or at any other position.
6) (3.5 pts total) Two cars (A and B) are moving along the same stretch of road. The figure below shows a position versus time graph for the motions of the cars.
a) (0.5 pts) Which of the following pictures best represents a snapshot of the road way at t=0 sec.

A B C Answer: D E .... Not answered
Discussion: The position versus time graph tells us the position of each car as time passes. At time = 0 seconds,Car A is at the origin (a position of 0 meters), and car B is at a position of +20 meters from the origin.
b) At the instant time=2sec,
i) (0.25 pts) Car A is … Car B ahead of Answer: behind along side ..... Not answered
Discussion: The position versus time graph tells us theposition of each car as time passes. At time = 2 seconds, Car B is at a position of +23.3 meters from the origin and Car A is at a position of +10 meters from the origin. Car B is ahead of Car A.
ii) (0.25 pts) The speed of Car A is … Car B Answer: faster than slower than equalto ...... Not answered
Discussion: The position versus time graph tells us theposition of each car as time passes. Car A's position changes more with each second that passes than Car B's position. So Car A must be going faster. (Or
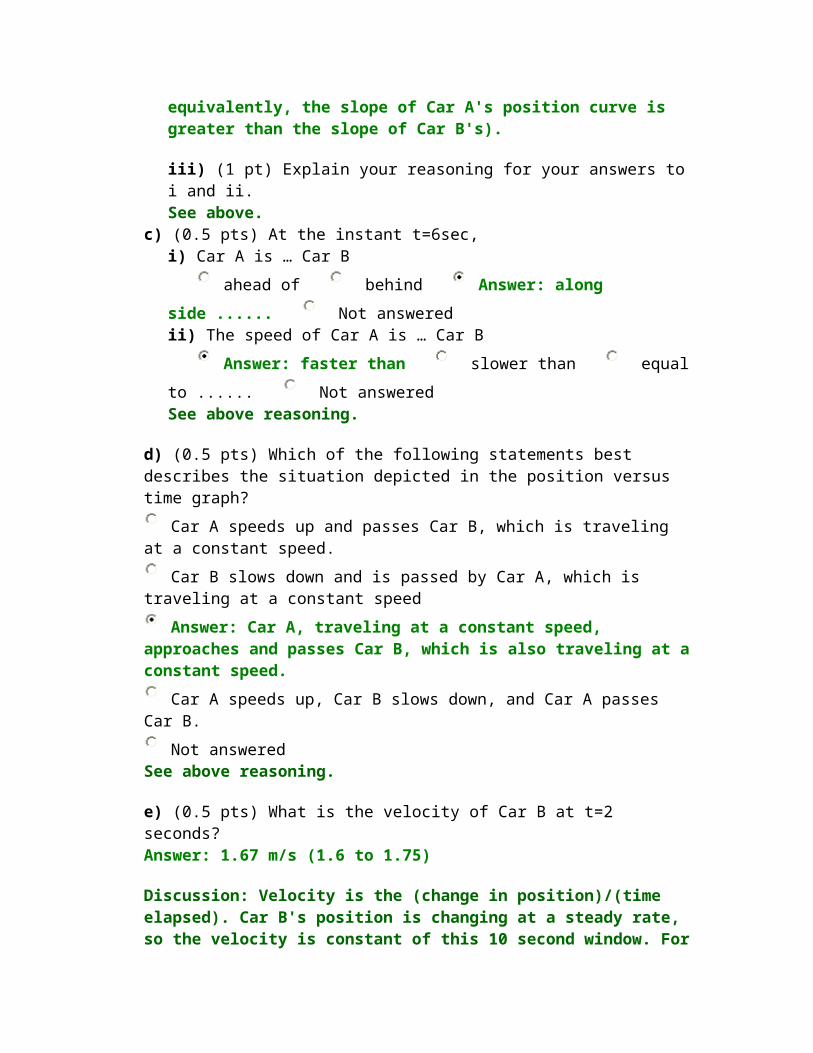
equivalently, the slope of Car A's position curve is greater than the slope of Car B's).
iii) (1 pt) Explain your reasoning for your answers to i and ii. See above.
c) (0.5 pts) At the instant t=6sec, i) Car A is … Car B ahead of behind Answer: along side ...... Not answered ii) The speed of Car A is … Car B Answer: faster than slower than equalto ...... Not answered See above reasoning.
d) (0.5 pts) Which of the following statements best describes the situation depicted in the position versus time graph?
Car A speeds up and passes Car B, which is traveling at a constant speed.
Car B slows down and is passed by Car A, which is traveling at a constant speed
Answer: Car A, traveling at a constant speed, approaches and passes Car B, which is also traveling at aconstant speed.
Car A speeds up, Car B slows down, and Car A passes Car B.
Not answered See above reasoning.
e) (0.5 pts) What is the velocity of Car B at t=2 seconds? Answer: 1.67 m/s (1.6 to 1.75)
Discussion: Velocity is the (change in position)/(time elapsed). Car B's position is changing at a steady rate, so the velocity is constant of this 10 second window. For

easy calculation and graph reading, pick a time interval over which it is easy to measure the change in position. Between 0 and 6 seconds, Car B's position changed from 20meters to 30 meters for a change of +10 meters in 6 seconds.
Velocity = (change in position)/(time elapsed) = +10 meters / 6 seconds = 1.67 m/s.
7) (3.4 pts total) The motion of a walking man is recorded on the position vs time graph below. Use the Moving Man Applet in the “Walk” mode to reproduce this position vs time graph by adjusting the velocity slider as the man is walking.
a) (2.4 pts) At which of the lettered points on the graph: (Choose all that apply)
i) is the man’s motion slowest? a Answer: b c d Answer: e f
ii) is the man speeding up? a b c d e Answer: f
iii) is the man slowing down Answer: a b Answer: c (either slowing down or not changing is
accepted) Answer: d e f
iv) is the man turning around? a Answer: bc d e f

Discussion: The position versus time graph records how the position changes as time passes. At both b and e, the man stops momentarily and so there his motion is the slowest (0 m/s velocity). At f, the man is speedingup, moving faster and faster in the negative direction.At a and d, the man is slowing down. His position is changing more rapidly in the time just before a and d, than in the time just after a and d. Before b, the man was moving away from the origin in the positive direction. Just after b, the man starts moving towards the origin in the negative direction.
b) (1 pt) Your friend is not taking physics, but wants toknow how you can tell from just looking at this graph of position vs time when the man is slowing down and when he is speeding up. How would you explain it to him so that he could make sense of it (without using technical terms like slope)?
The position versus time graph records how the position changes as time passes. If the position changes by a large amount in a specific amount of time, then the man is moving quickly. (i.e. he covers a lot of distance.) Ifthe position changes by just a small amount in that same amount of time, then the man is moving slowly. If the manis speeding up, then the amount his position changes (thedistance traveled) in a given time interval will be increasing. If the man is slowing down, then the amount his position changes (the distance traveled) in a given time interval will be decreasing.
Copyright © 2022 FDOKUMEN