Coarse-grained molecular dynamics simulations of membrane proteins and peptides
7
Coarse-grained molecular dynamics simulation of nanofilled crosslinked rubber Hiromasa Yagyu * , Takayuki Utsumi Mitsuboshi Belting Ltd., 4-1-21, Hamazoe-dori, Nagata-ku, Kobe 653-0024, Japan article info Article history: Received 5 December 2008 Received in revised form 23 February 2009 Accepted 27 February 2009 Available online 5 April 2009 PACS: 02.70.Ns 07.05.Tp 61.25.H 61.25.hp 61.41.+e 62.23.Pq Keywords: Polymer Filler Reinforcement Interaction Nanocomposite Elongation abstract A bead-spring model was applied to a crosslinked polymer with nanofillers for coarse-grained molecular dynamics simulation. Two nanofillers consisting 561 tightly connected beads and a crosslinked polymer with about 3000 beads were used as a simulation model. The strength of interactions between nanofiller and polymer based on the Lennard-Jones potential were varied. In order to investigate the effects of crosslinking and nanofiller on reinforcement, uniaxial elongation behavior was studied by coarse-grained molecular dynamics simulation with deformation function. From the uniaxial elongation simulation results and the analysis of polymer dynamics around nanofiller, it was confirmed that the degree of rein- forcement depends on the strength of filler–polymer interaction, and one of the factors which influenced the stress was attributed to the existence of a low mobility phase around the nanofiller. Ó 2009 Elsevier B.V. All rights reserved. 1. Introduction Industrial rubber is nanocomposite material in which polymer is filled with nanosized carbon and silica. These nanocomposite materials show reinforcement such as high tensile strength, tear and abrasion resistance. The degree of reinforcement provided by filler is still a largely unsettled question [1–4]. For example, carbon filled rubber shows high tensile strength in the elongation process. On the other hand, graphite filled rubber shows lower strength in comparison with carbon filled rubber, but higher value than that of unfilled rubber [5,6]. The degree of reinforcement provided by filler depends on a number of variables. It was assumed that the rein- forcement of rubber depends on the kind and concentration of fil- ler, and this phenomenon is generally induced by volume effect, surface effect and space effect. The surface effect, which greatly influences reinforcement, is attributed to chemical and physical interactions between polymer and filler surface. For the uncross- linked rubber, the strength of filler–polymer interaction was eval- uated by measuring the amount of the remaining polymer without extraction by organic solvent, which is the adsorbed polymer around the filler, or so-called ‘‘bound rubber” [7]. For the cross- linked rubber, the strength of filler–polymer interaction was esti- mated by measurement of temperature dispersion in the dynamic viscoelasticity [8,9] and nuclear magnetic resonance (NMR) [10]. The reinforcement strength of rubber was evaluated as physical properties such as tensile strength, tear, and abrasion. Generally, the strength of filler–polymer interaction can be varied by different end group of molecule chain surrounding the filler and properties of the filler surface [11,12]. In addition, dispersibility of the filler is an important factor in the strength of reinforcement. Recently, a Young’s modulus distribution image of polymer around filler [13] and strain during elongation [14] were evaluated with atomic force microscopy (AFM) in order to investigate the relation between the filler–polymer interaction and the strength of rein- forcement. Although the relation between the mechanical proper- ties of filled rubber and the filler–polymer interaction measured with the above methods gives experimental information about the degree of reinforcement through the surface effect of the filler, dependence on the filler–polymer interaction alone cannot be clar- ified because these results include other effects such as filler struc- ture, shape and mass. The molecular dynamics method is expected to be useful simulating these behaviors. However, industrial rub- ber materials are a mixture of polymers with molecular weights 0927-0256/$ - see front matter Ó 2009 Elsevier B.V. All rights reserved. doi:10.1016/j.commatsci.2009.02.035 * Corresponding author. Tel.: +81 78 682 3952; fax: +81 78 681 1006. E-mail address: [email protected] (H. Yagyu). Computational Materials Science 46 (2009) 286–292 Contents lists available at ScienceDirect Computational Materials Science journal homepage: www.elsevier.com/locate/commatsci
Transcript of Coarse-grained molecular dynamics simulations of membrane proteins and peptides

Computational Materials Science 46 (2009) 286–292
Contents lists available at ScienceDirect
Computational Materials Science
journal homepage: www.elsevier .com/locate /commatsci
Coarse-grained molecular dynamics simulation of nanofilled crosslinked rubber
Hiromasa Yagyu *, Takayuki UtsumiMitsuboshi Belting Ltd., 4-1-21, Hamazoe-dori, Nagata-ku, Kobe 653-0024, Japan
a r t i c l e i n f o
Article history:Received 5 December 2008Received in revised form 23 February 2009Accepted 27 February 2009Available online 5 April 2009
PACS:02.70.Ns07.05.Tp61.25.H�61.25.hp61.41.+e62.23.Pq
Keywords:PolymerFillerReinforcementInteractionNanocompositeElongation
0927-0256/$ - see front matter � 2009 Elsevier B.V. Adoi:10.1016/j.commatsci.2009.02.035
* Corresponding author. Tel.: +81 78 682 3952; faxE-mail address: [email protected] (H. Yag
a b s t r a c t
A bead-spring model was applied to a crosslinked polymer with nanofillers for coarse-grained moleculardynamics simulation. Two nanofillers consisting 561 tightly connected beads and a crosslinked polymerwith about 3000 beads were used as a simulation model. The strength of interactions between nanofillerand polymer based on the Lennard-Jones potential were varied. In order to investigate the effects ofcrosslinking and nanofiller on reinforcement, uniaxial elongation behavior was studied by coarse-grainedmolecular dynamics simulation with deformation function. From the uniaxial elongation simulationresults and the analysis of polymer dynamics around nanofiller, it was confirmed that the degree of rein-forcement depends on the strength of filler–polymer interaction, and one of the factors which influencedthe stress was attributed to the existence of a low mobility phase around the nanofiller.
� 2009 Elsevier B.V. All rights reserved.
1. Introduction
Industrial rubber is nanocomposite material in which polymeris filled with nanosized carbon and silica. These nanocompositematerials show reinforcement such as high tensile strength, tearand abrasion resistance. The degree of reinforcement provided byfiller is still a largely unsettled question [1–4]. For example, carbonfilled rubber shows high tensile strength in the elongation process.On the other hand, graphite filled rubber shows lower strength incomparison with carbon filled rubber, but higher value than that ofunfilled rubber [5,6]. The degree of reinforcement provided by fillerdepends on a number of variables. It was assumed that the rein-forcement of rubber depends on the kind and concentration of fil-ler, and this phenomenon is generally induced by volume effect,surface effect and space effect. The surface effect, which greatlyinfluences reinforcement, is attributed to chemical and physicalinteractions between polymer and filler surface. For the uncross-linked rubber, the strength of filler–polymer interaction was eval-uated by measuring the amount of the remaining polymer withoutextraction by organic solvent, which is the adsorbed polymer
ll rights reserved.
: +81 78 681 1006.yu).
around the filler, or so-called ‘‘bound rubber” [7]. For the cross-linked rubber, the strength of filler–polymer interaction was esti-mated by measurement of temperature dispersion in thedynamic viscoelasticity [8,9] and nuclear magnetic resonance(NMR) [10]. The reinforcement strength of rubber was evaluatedas physical properties such as tensile strength, tear, and abrasion.Generally, the strength of filler–polymer interaction can be variedby different end group of molecule chain surrounding the filler andproperties of the filler surface [11,12]. In addition, dispersibility ofthe filler is an important factor in the strength of reinforcement.Recently, a Young’s modulus distribution image of polymer aroundfiller [13] and strain during elongation [14] were evaluated withatomic force microscopy (AFM) in order to investigate the relationbetween the filler–polymer interaction and the strength of rein-forcement. Although the relation between the mechanical proper-ties of filled rubber and the filler–polymer interaction measuredwith the above methods gives experimental information aboutthe degree of reinforcement through the surface effect of the filler,dependence on the filler–polymer interaction alone cannot be clar-ified because these results include other effects such as filler struc-ture, shape and mass. The molecular dynamics method is expectedto be useful simulating these behaviors. However, industrial rub-ber materials are a mixture of polymers with molecular weights
H. Yagyu, T. Utsumi / Computational Materials Science 46 (2009) 286–292 287
of several hundred thousands and fillers with diameter of tens ofnanometers. Full-atomistic molecular dynamics simulations can-not calculate the mechanical properties of these materials with fil-ler–polymer interaction because the size of filler is a large value incomparison with the polymer-chain length. In order to addressthese issues, coarse-grained molecule dynamics simulation usingthe Kremer–Grest chain (bead-spring model) was studied. Incoarse-grained molecule dynamics simulation, a bead of chainwas treated as several monomer units used for a molecular model.Although coarse-grained molecule dynamics simulation cannottake into account the chemical effects of chain linkage in the mod-el, the dynamics of chains at the micro-scale level can be simulatedusing appropriate potential energy between the beads such asbond and non-bond potentials [15]. The bead-spring model hasbeen studied in non-equilibrium situations such as shear [16]and elongation flow [17] from the above viewpoint [18].
In this study, we used two nanofillers consisting of tightly con-nected beads and a crosslinked polymer, in which the beads werelinearly connected by harmonic potential, as a simulation model.The cutoff parameter in the Lennard-Jones potential between thenanofiller and the polymer beads, which modifies the ratio ofrepulsive and attractive parts, was applied to control the strengthof filler–polymer interaction. In order to investigate the effects ofthe crosslinking density and the strength of filler–polymer interac-tion on the reinforcement, uniaxial elongation behavior was stud-ied by coarse-grained molecule dynamics simulation.
Fig. 1. Icosahedron nanofiller model with 561 beads (a), and linear polymer-chainmodel consisting of the type A bead with one residual bond for reaction, the type Bbead with a saturated bond, and the type C bead with two residual bonds forreaction (b).
2. Simulation model
2.1. Bead-spring model
Coarse-grained molecular dynamics simulation employs thebead-spring polymer-chain model proposed by Kremer and Grest[15]. The model uses polymer-chain which consists of i beads con-nected by the following potential energy U(r)
UðrÞ ¼ UbðrÞ þ UnbðrÞ ð1Þ
where r is the distance between the beads. The bond potential en-ergy Ub(r) and non-bond potential energy Unb(r) are given by
UbðrÞ ¼12
kðr � r0Þ2 ð2Þ
UnbðrÞ ¼4eij
rij
rij
� �12� rij
rij
� �6� �
� rij
c
� �12 � rij
c
� �6n o�
; ðr 6 cÞ
0; ðr > cÞ
8<:
ð3Þ
where k is the spring constant and r0 is the bond length at equilib-rium state. rij and eij are the Lennard-Jones parameters between thebeads of types i and j, and c is the cutoff distance. The bond poten-tial Ub(r) is the harmonic potential between the beads bonded witha spring as a function of the distance r. More often, the FENE poten-tial, which is reduced to the harmonic potential in the case of weakextension, was used for bond potential [15]. Non-Newtonian flowbehavior was enhanced using the FENE potential. However, in thelarge deformation simulation and the construction of the cross-linked structure model, the harmonic potential is suitable becausegeneration of high stress in the system due to stretch of the bondis avoided. The harmonic potential was used for the crosslinkedrubber model, and the model based on the Gauss chain could effec-tively simulate the characteristics of vulcanized rubber materials onmechanical deformation [19]. In this paper, since a crosslinkingstructure was generated by reaction between a linear polymerand crosslinking agents by molecular dynamics simulation, it isthought that a large stress was generated in the bond and the sim-
ulation was stopped during the reaction step in the case of using theFENE potential. The non-bond potential Unb(r) attributed to the non-bond interaction between the beads separated with the distance r,is given by the Lennard-Jones potential. The time evolution of thebeads at the position ri is calculated by the following Langevinequation:
md2ri
dt2 ¼ �@UðrÞ@ri
� Cdri
dtþWiðtÞ ð4Þ
m is the mass of a bead, U (r) is the total potential energy of system,C is the friction constant, and Wi(t) is a Gaussian white noise whichis generated according to the following equation:
< WiðtÞWjðt0Þ >¼ 2kBT mCdijIdðt � t0Þ ð5Þ
where d is a delta function, T is the temperature of the system, kB isthe Boltzmann’s constant, and I is an identity matrix. The calcula-tion is carried out using a reduced unit, in which r, e, and m are ta-ken as the unit of length, energy and mass, respectively. The unit oftime is s (=r (m/e)1/2), and the unit of temperature is e/kB. In thisstudy, the friction constant C was set to 0.5s�1. The equation of mo-tion is solved using the velocity Verlet algorithm with time stepDt = 0.01s. The simulation was performed using a periodic bound-ary condition for all walls of the cell. The density of the systemwas set to 0.85m/r3 under the condition of constant-temperatureand density (NVT ensemble). In the case of glass transition temper-ature evaluations of the model in Section 3.2, the simulation wasperformed using the constant-pressure condition of Andersen’smethod (NPT ensemble). All the calculations were done using thecoarse-grained molecular dynamics program OCTA/COGNAC [20].
2.2. Nanofiller and polymer model
Fig. 1a shows a nanofiller model. The nanofiller model has a so-lid icosahedron structure, and consists of 561 tightly connectednanofiller beads (referred to as type P beads). The model can takeinto account the effects of rotational mobility and surface structureof the nanofiller due to use of the solid structure with the type Pbeads. The equilibrium bond length r0 between the type P beads
288 H. Yagyu, T. Utsumi / Computational Materials Science 46 (2009) 286–292
was set to 1.0r. In order to maintain the structure of nanofillersduring the simulation, the spring constant kp�p in bond potentialbetween the type P beads was defined as 2000e/r2, which is a largevalue in comparison with that of polymer, and the number of max-imum bonds in the type P beads was set to 12. There is a tradeoffbetween the maximum spring constant (=kp�p) and time step Dt,and a large kp�p value will reduce the time step. In this model,the spring constant kp�p was set to the value at which the nanofill-er model maintained its initial formation during simulation underthe condition of time step Dt = 0.01s.
Fig. 1b shows a polymer-chain model. A chain consisted of 613beads linearly connected by a spring with a spring constant kr�r of200e/r2. The equilibrium bond length r0 between the polymerbeads was set to 1.0r. In order to produce the crosslinked structureof the polymer, three types of polymer beads (type A, B, and Cbeads) were defined. Type A and C beads are crosslink sites andcan be connected to the crosslinker beads (type S bead). The typeA and C beads are terminal and internal beads of the chain, andthe maximum number of bonds was set to 2 and 3, respectively.The type B bead cannot be used as a crosslink site. The type S beadwas defined as a crosslinker. The maximum number of bonds in thetype S beads was set to 2, and bond and non-bond potential ener-gies were set to the same value as those of polymer beads.
2.3. Composite model
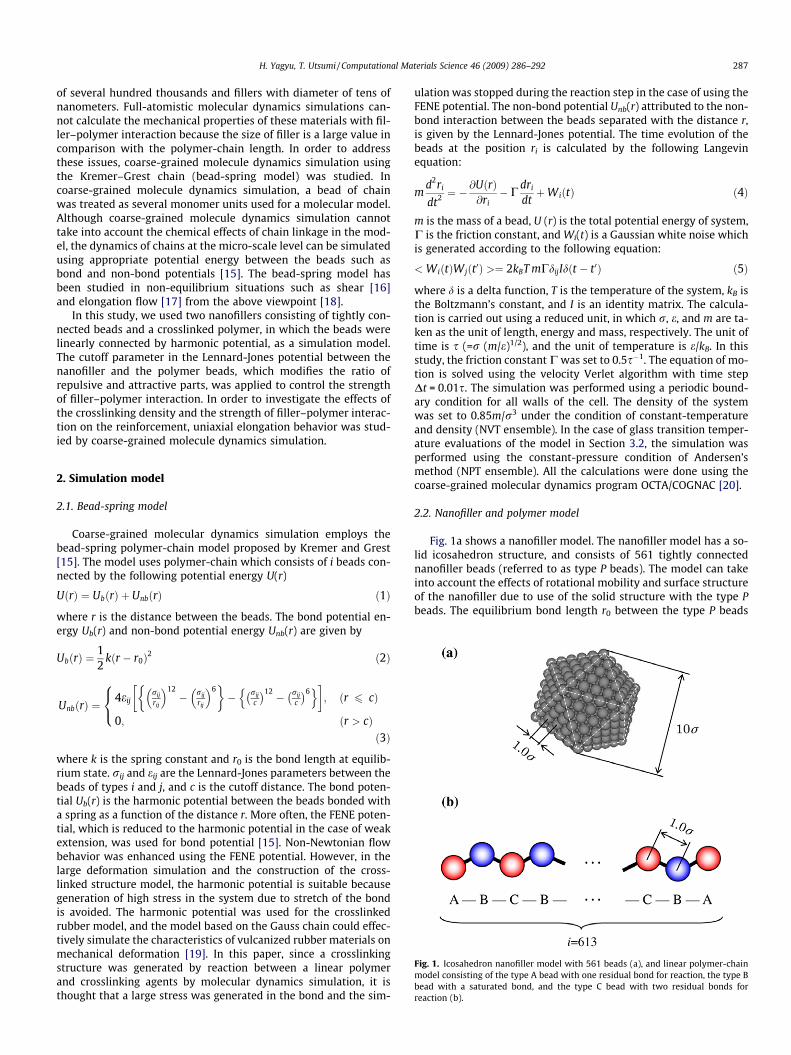
Two nanofillers (P516) and five polymer-chains(A1[B1C1]305B1A1) were set into a cell as follows. Fig. 2 showsthe modeling flow of the filled crosslinked polymer. Initial cell sizewas defined as 17.015r � 17.015r � 17.015r because the densityof the system, mass of a bead and number of the beads were0.85m/r3, 1.0m and 4097, respectively. At first, the type P beadswere set at the coordinates forming an icosahedron structure,and bonded under a condition in which the positions of the typeP beads were constrained (Fig. 2a). Five polymer-chains were setat coordinates other than interior positions of the nanofiller by ran-
Fig. 2. Modeling flow for the filled
dom work of the type A, B, and C beads. The cutoff distance c be-tween the polymer beads in the Lennard Jones potential was setto 2.0r. Subsequently, relaxation of the system was carried outfor 500,000 time steps (5000s) under constant-temperature anddensity conditions (NVT ensemble). After release of the type P beadfrom the constraint position, the second relaxation process wascarried out for 500,000 time steps using same conditions as firstrelaxation process (Fig. 2b). Moreover, a crosslinked polymer struc-ture was produced as follows. The type S beads for crosslinkerswere set into a random coordination excluding interior positionsof the nanofiller of the above relaxation model (Fig. 2c). The cross-links, for example A–S–A, C–S–A, were created using the reactionfunction in the simulation [20]. The crosslink between polymerbeads is produced by a reaction function of OCTA/COGNAC. Thatis, the crosslink is generated, when the beads (type A, C, and Sbeads) approach a distance within 1.1r in the molecular dynamicssimulation. Finally, the third relaxation process was carried out for500,000 time steps using the cell size in which the density reached0.85m/r3 (Fig. 2d) and under the same conditions as the first relax-ation process. The relaxation structure in the simulation was de-fined as the state in which the stress in the cell is constant. Inthis model, the constant stress was obtained by the calculationfor 15,000 time steps.
In this paper, in order to investigate the effect of the strength offiller–polymer interaction on reinforcement, we studied four typesof cutoff distance parameter c in the Lennard-Jones potential fornon-bond interaction between the nanofiller and the polymerbead: c = 21/6r, 1.5r, 2.0r and 2.5r. The parameter of c = 21/6rshows purely repulsive interaction (no interaction between nano-filler and polymer beads), and a larger value of parameter c showsmore increasingly attractive interaction (stronger interaction be-tween nanofiller and polymer beads). The parameters in the Len-nard-Jones potential between beads were rij = 1.0r and eij = 4.0rfor the nanofiller beads, and rij = 1.0r and eij = 1.0r for the polymerbeads, respectively. Since actual nanofiller was expected to easilyaggregate, the parameters of the nanofiller were set to value at
crosslinked polymer structure.
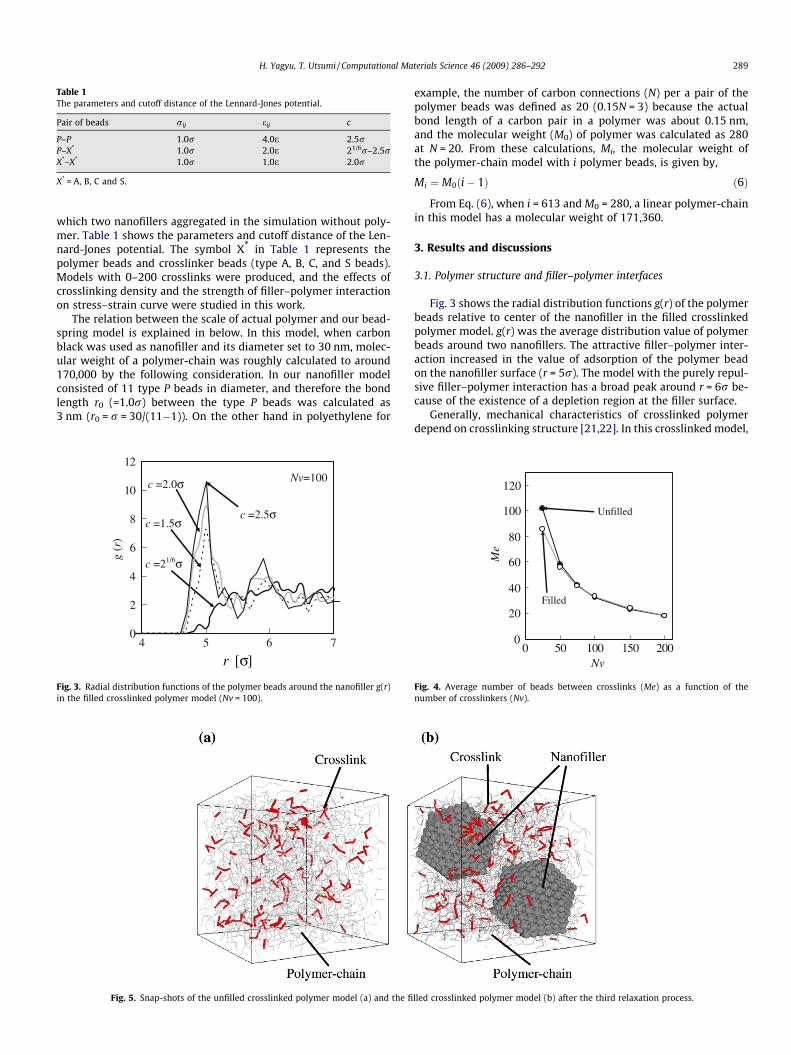
Table 1The parameters and cutoff distance of the Lennard-Jones potential.
Pair of beads rij eij c
P–P 1.0r 4.0e 2.5rP–X* 1.0r 2.0e 21/6r–2.5rX*–X* 1.0r 1.0e 2.0r
X* = A, B, C and S.
H. Yagyu, T. Utsumi / Computational Materials Science 46 (2009) 286–292 289
which two nanofillers aggregated in the simulation without poly-mer. Table 1 shows the parameters and cutoff distance of the Len-nard-Jones potential. The symbol X* in Table 1 represents thepolymer beads and crosslinker beads (type A, B, C, and S beads).Models with 0–200 crosslinks were produced, and the effects ofcrosslinking density and the strength of filler–polymer interactionon stress–strain curve were studied in this work.
The relation between the scale of actual polymer and our bead-spring model is explained in below. In this model, when carbonblack was used as nanofiller and its diameter set to 30 nm, molec-ular weight of a polymer-chain was roughly calculated to around170,000 by the following consideration. In our nanofiller modelconsisted of 11 type P beads in diameter, and therefore the bondlength r0 (=1.0r) between the type P beads was calculated as3 nm (r0 = r = 30/(11�1)). On the other hand in polyethylene for
Nv=100
c =21/6σ
c =1.5σ
c =2.0σ
c =2.5σ
0
2
4
6
8
10
12
4 5 6 7
r [σ]
g (r
)
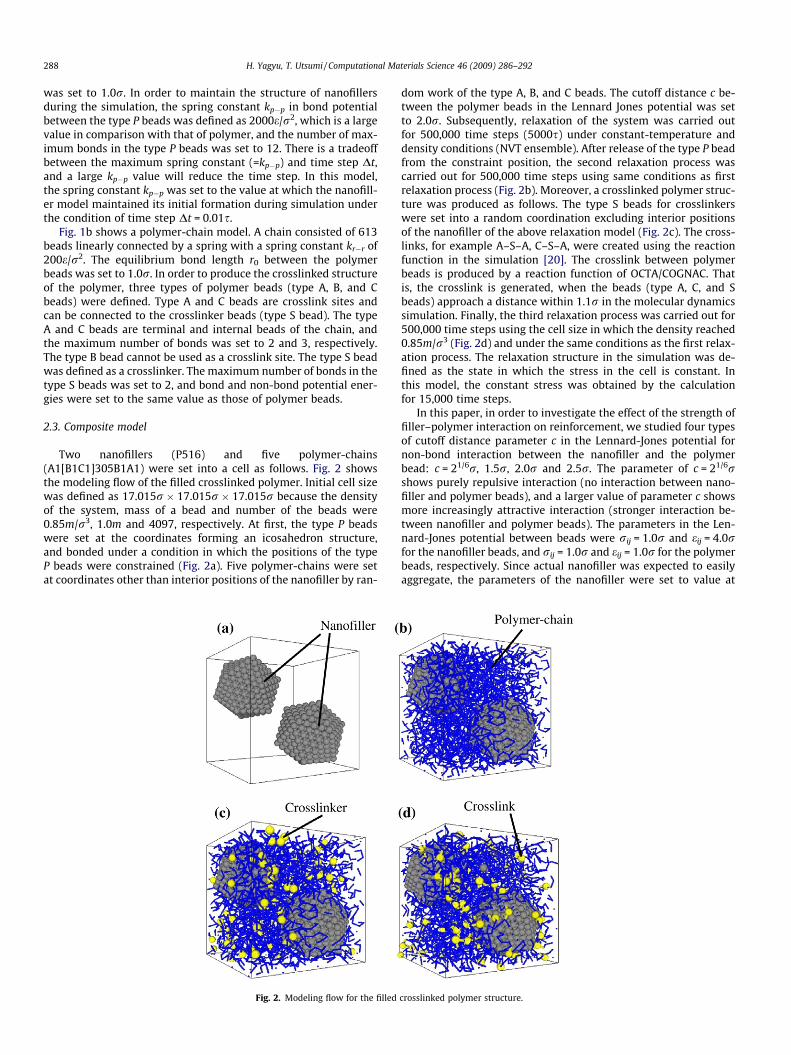
Fig. 3. Radial distribution functions of the polymer beads around the nanofiller g(r)in the filled crosslinked polymer model (Nv = 100).
Fig. 5. Snap-shots of the unfilled crosslinked polymer model (a) and the fi
example, the number of carbon connections (N) per a pair of thepolymer beads was defined as 20 (0.15N = 3) because the actualbond length of a carbon pair in a polymer was about 0.15 nm,and the molecular weight (M0) of polymer was calculated as 280at N = 20. From these calculations, Mi, the molecular weight ofthe polymer-chain model with i polymer beads, is given by,
Mi ¼ M0ði� 1Þ ð6Þ
From Eq. (6), when i = 613 and M0 = 280, a linear polymer-chainin this model has a molecular weight of 171,360.
3. Results and discussions
3.1. Polymer structure and filler–polymer interfaces
Fig. 3 shows the radial distribution functions g(r) of the polymerbeads relative to center of the nanofiller in the filled crosslinkedpolymer model. g(r) was the average distribution value of polymerbeads around two nanofillers. The attractive filler–polymer inter-action increased in the value of adsorption of the polymer beadon the nanofiller surface (r = 5r). The model with the purely repul-sive filler–polymer interaction has a broad peak around r = 6r be-cause of the existence of a depletion region at the filler surface.
Generally, mechanical characteristics of crosslinked polymerdepend on crosslinking structure [21,22]. In this crosslinked model,
0
20
40
60
80
100
120
0 50 100 150 200Nv
Me
Unfilled
Filled
Fig. 4. Average number of beads between crosslinks (Me) as a function of thenumber of crosslinkers (Nv).
lled crosslinked polymer model (b) after the third relaxation process.
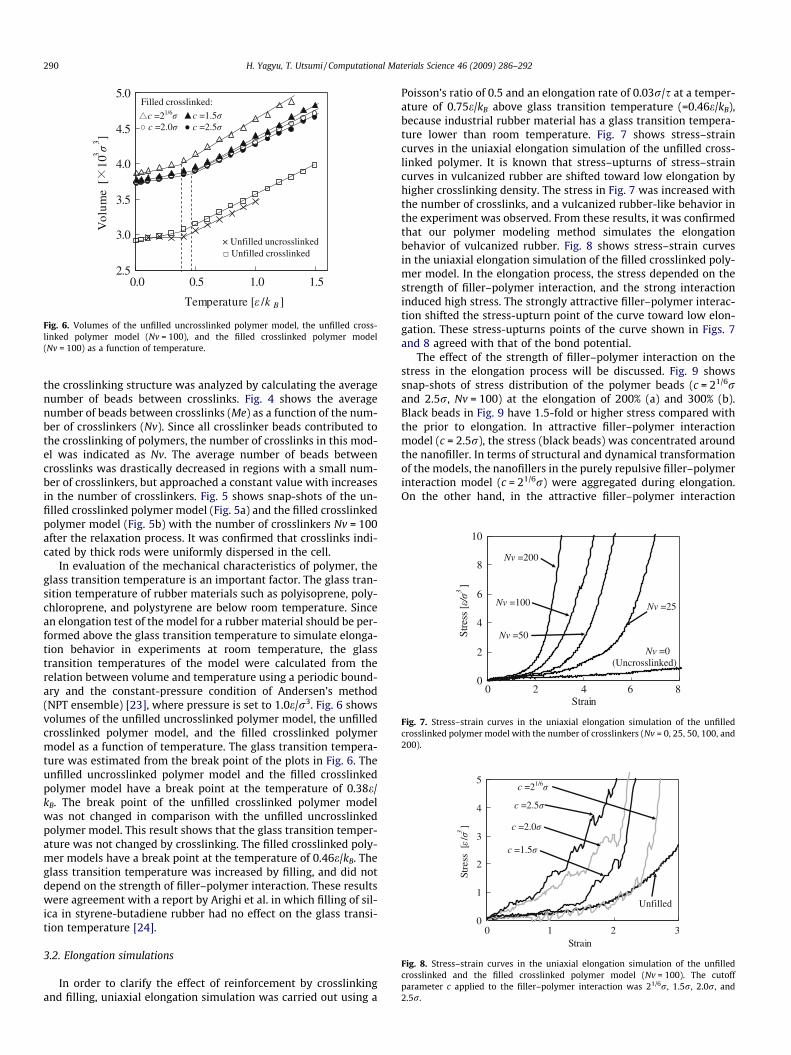
Fig. 6. Volumes of the unfilled uncrosslinked polymer model, the unfilled cross-linked polymer model (Nv = 100), and the filled crosslinked polymer model(Nv = 100) as a function of temperature.
Fig. 7. Stress–strain curves in the uniaxial elongation simulation of the unfilledcrosslinked polymer model with the number of crosslinkers (Nv = 0, 25, 50, 100, and200).
Fig. 8. Stress–strain curves in the uniaxial elongation simulation of the unfilledcrosslinked and the filled crosslinked polymer model (Nv = 100). The cutoffparameter c applied to the filler–polymer interaction was 21/6r, 1.5r, 2.0r, and2.5r.
290 H. Yagyu, T. Utsumi / Computational Materials Science 46 (2009) 286–292
the crosslinking structure was analyzed by calculating the averagenumber of beads between crosslinks. Fig. 4 shows the averagenumber of beads between crosslinks (Me) as a function of the num-ber of crosslinkers (Nv). Since all crosslinker beads contributed tothe crosslinking of polymers, the number of crosslinks in this mod-el was indicated as Nv. The average number of beads betweencrosslinks was drastically decreased in regions with a small num-ber of crosslinkers, but approached a constant value with increasesin the number of crosslinkers. Fig. 5 shows snap-shots of the un-filled crosslinked polymer model (Fig. 5a) and the filled crosslinkedpolymer model (Fig. 5b) with the number of crosslinkers Nv = 100after the relaxation process. It was confirmed that crosslinks indi-cated by thick rods were uniformly dispersed in the cell.
In evaluation of the mechanical characteristics of polymer, theglass transition temperature is an important factor. The glass tran-sition temperature of rubber materials such as polyisoprene, poly-chloroprene, and polystyrene are below room temperature. Sincean elongation test of the model for a rubber material should be per-formed above the glass transition temperature to simulate elonga-tion behavior in experiments at room temperature, the glasstransition temperatures of the model were calculated from therelation between volume and temperature using a periodic bound-ary and the constant-pressure condition of Andersen’s method(NPT ensemble) [23], where pressure is set to 1.0e/r3. Fig. 6 showsvolumes of the unfilled uncrosslinked polymer model, the unfilledcrosslinked polymer model, and the filled crosslinked polymermodel as a function of temperature. The glass transition tempera-ture was estimated from the break point of the plots in Fig. 6. Theunfilled uncrosslinked polymer model and the filled crosslinkedpolymer model have a break point at the temperature of 0.38e/kB. The break point of the unfilled crosslinked polymer modelwas not changed in comparison with the unfilled uncrosslinkedpolymer model. This result shows that the glass transition temper-ature was not changed by crosslinking. The filled crosslinked poly-mer models have a break point at the temperature of 0.46e/kB. Theglass transition temperature was increased by filling, and did notdepend on the strength of filler–polymer interaction. These resultswere agreement with a report by Arighi et al. in which filling of sil-ica in styrene-butadiene rubber had no effect on the glass transi-tion temperature [24].
3.2. Elongation simulations
In order to clarify the effect of reinforcement by crosslinkingand filling, uniaxial elongation simulation was carried out using a
Poisson’s ratio of 0.5 and an elongation rate of 0.03r/s at a temper-ature of 0.75e/kB above glass transition temperature (=0.46e/kB),because industrial rubber material has a glass transition tempera-ture lower than room temperature. Fig. 7 shows stress–straincurves in the uniaxial elongation simulation of the unfilled cross-linked polymer. It is known that stress–upturns of stress–straincurves in vulcanized rubber are shifted toward low elongation byhigher crosslinking density. The stress in Fig. 7 was increased withthe number of crosslinks, and a vulcanized rubber-like behavior inthe experiment was observed. From these results, it was confirmedthat our polymer modeling method simulates the elongationbehavior of vulcanized rubber. Fig. 8 shows stress–strain curvesin the uniaxial elongation simulation of the filled crosslinked poly-mer model. In the elongation process, the stress depended on thestrength of filler–polymer interaction, and the strong interactioninduced high stress. The strongly attractive filler–polymer interac-tion shifted the stress-upturn point of the curve toward low elon-gation. These stress-upturns points of the curve shown in Figs. 7and 8 agreed with that of the bond potential.
The effect of the strength of filler–polymer interaction on thestress in the elongation process will be discussed. Fig. 9 showssnap-shots of stress distribution of the polymer beads (c = 21/6rand 2.5r, Nv = 100) at the elongation of 200% (a) and 300% (b).Black beads in Fig. 9 have 1.5-fold or higher stress compared withthe prior to elongation. In attractive filler–polymer interactionmodel (c = 2.5r), the stress (black beads) was concentrated aroundthe nanofiller. In terms of structural and dynamical transformationof the models, the nanofillers in the purely repulsive filler–polymerinteraction model (c = 21/6r) were aggregated during elongation.On the other hand, in the attractive filler–polymer interaction
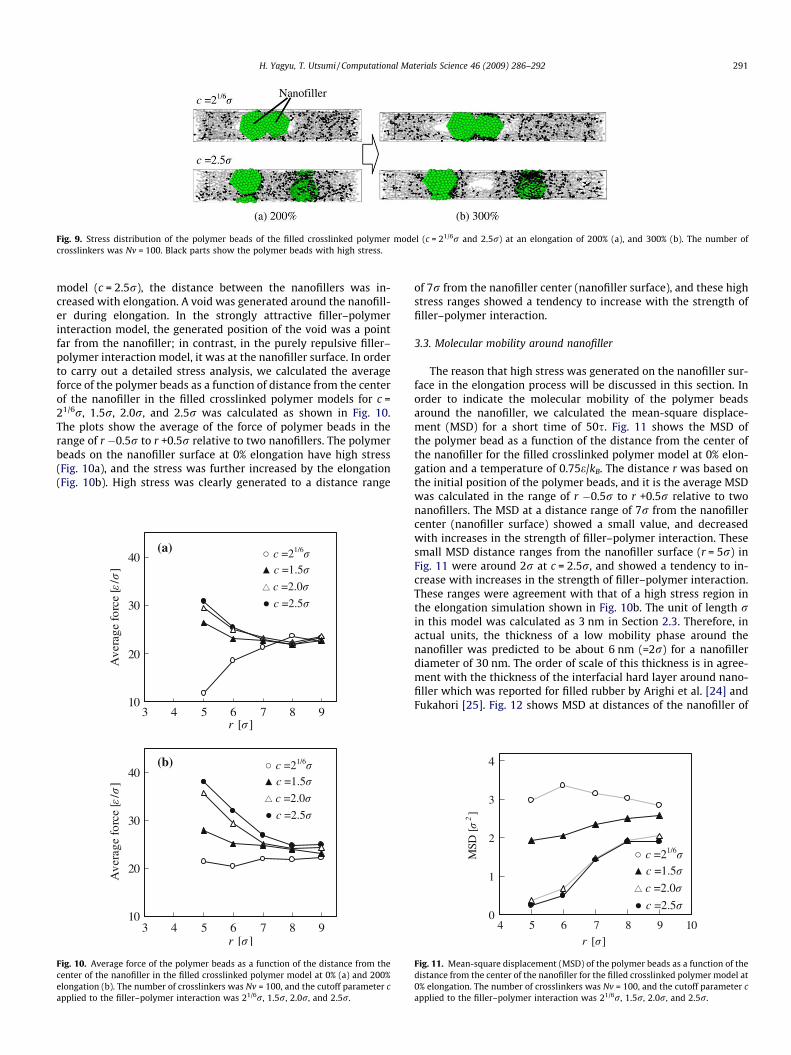
Fig. 9. Stress distribution of the polymer beads of the filled crosslinked polymer model (c = 21/6r and 2.5r) at an elongation of 200% (a), and 300% (b). The number ofcrosslinkers was Nv = 100. Black parts show the polymer beads with high stress.
H. Yagyu, T. Utsumi / Computational Materials Science 46 (2009) 286–292 291
model (c = 2.5r), the distance between the nanofillers was in-creased with elongation. A void was generated around the nanofill-er during elongation. In the strongly attractive filler–polymerinteraction model, the generated position of the void was a pointfar from the nanofiller; in contrast, in the purely repulsive filler–polymer interaction model, it was at the nanofiller surface. In orderto carry out a detailed stress analysis, we calculated the averageforce of the polymer beads as a function of distance from the centerof the nanofiller in the filled crosslinked polymer models for c =21/6r, 1.5r, 2.0r, and 2.5r was calculated as shown in Fig. 10.The plots show the average of the force of polymer beads in therange of r �0.5r to r +0.5r relative to two nanofillers. The polymerbeads on the nanofiller surface at 0% elongation have high stress(Fig. 10a), and the stress was further increased by the elongation(Fig. 10b). High stress was clearly generated to a distance range
Fig. 10. Average force of the polymer beads as a function of the distance from thecenter of the nanofiller in the filled crosslinked polymer model at 0% (a) and 200%elongation (b). The number of crosslinkers was Nv = 100, and the cutoff parameter capplied to the filler–polymer interaction was 21/6r, 1.5r, 2.0r, and 2.5r.
of 7r from the nanofiller center (nanofiller surface), and these highstress ranges showed a tendency to increase with the strength offiller–polymer interaction.
3.3. Molecular mobility around nanofiller
The reason that high stress was generated on the nanofiller sur-face in the elongation process will be discussed in this section. Inorder to indicate the molecular mobility of the polymer beadsaround the nanofiller, we calculated the mean-square displace-ment (MSD) for a short time of 50s. Fig. 11 shows the MSD ofthe polymer bead as a function of the distance from the center ofthe nanofiller for the filled crosslinked polymer model at 0% elon-gation and a temperature of 0.75e/kB. The distance r was based onthe initial position of the polymer beads, and it is the average MSDwas calculated in the range of r �0.5r to r +0.5r relative to twonanofillers. The MSD at a distance range of 7r from the nanofillercenter (nanofiller surface) showed a small value, and decreasedwith increases in the strength of filler–polymer interaction. Thesesmall MSD distance ranges from the nanofiller surface (r = 5r) inFig. 11 were around 2r at c = 2.5r, and showed a tendency to in-crease with increases in the strength of filler–polymer interaction.These ranges were agreement with that of a high stress region inthe elongation simulation shown in Fig. 10b. The unit of length rin this model was calculated as 3 nm in Section 2.3. Therefore, inactual units, the thickness of a low mobility phase around thenanofiller was predicted to be about 6 nm (=2r) for a nanofillerdiameter of 30 nm. The order of scale of this thickness is in agree-ment with the thickness of the interfacial hard layer around nano-filler which was reported for filled rubber by Arighi et al. [24] andFukahori [25]. Fig. 12 shows MSD at distances of the nanofiller of
Fig. 11. Mean-square displacement (MSD) of the polymer beads as a function of thedistance from the center of the nanofiller for the filled crosslinked polymer model at0% elongation. The number of crosslinkers was Nv = 100, and the cutoff parameter capplied to the filler–polymer interaction was 21/6r, 1.5r, 2.0r, and 2.5r.
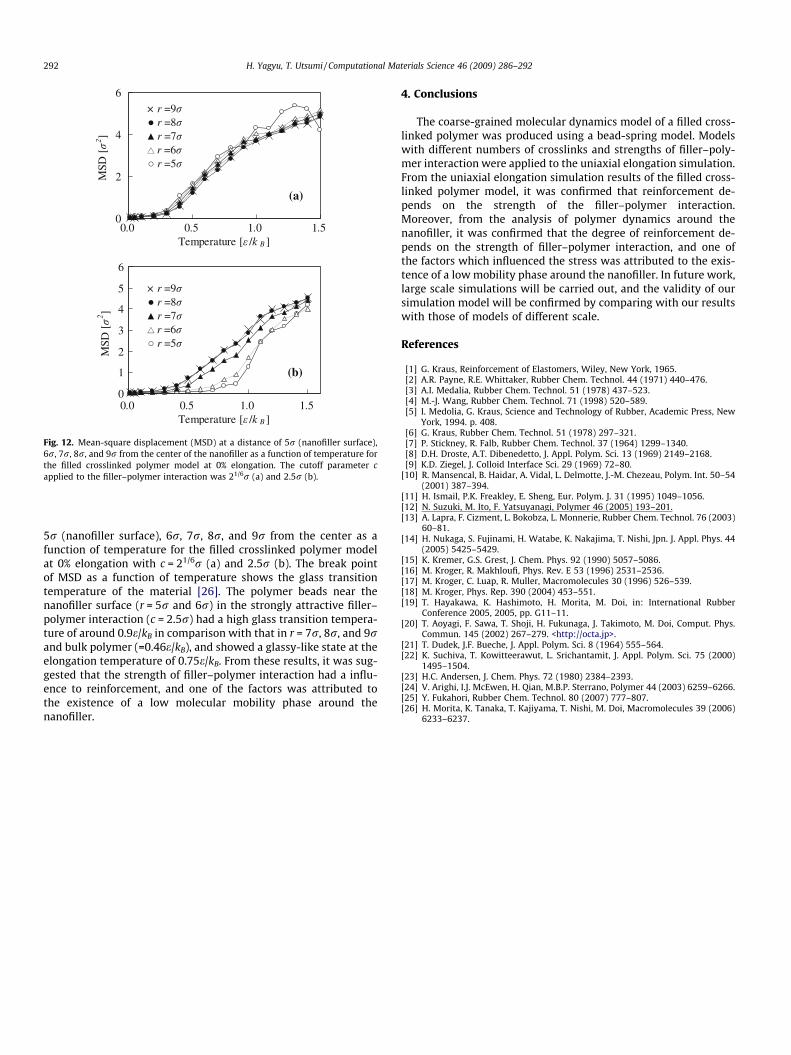
Fig. 12. Mean-square displacement (MSD) at a distance of 5r (nanofiller surface),6r, 7r, 8r, and 9r from the center of the nanofiller as a function of temperature forthe filled crosslinked polymer model at 0% elongation. The cutoff parameter capplied to the filler–polymer interaction was 21/6r (a) and 2.5r (b).
292 H. Yagyu, T. Utsumi / Computational Materials Science 46 (2009) 286–292
5r (nanofiller surface), 6r, 7r, 8r, and 9r from the center as afunction of temperature for the filled crosslinked polymer modelat 0% elongation with c = 21/6r (a) and 2.5r (b). The break pointof MSD as a function of temperature shows the glass transitiontemperature of the material [26]. The polymer beads near thenanofiller surface (r = 5r and 6r) in the strongly attractive filler–polymer interaction (c = 2.5r) had a high glass transition tempera-ture of around 0.9e/kB in comparison with that in r = 7r, 8r, and 9rand bulk polymer (=0.46e/kB), and showed a glassy-like state at theelongation temperature of 0.75e/kB. From these results, it was sug-gested that the strength of filler–polymer interaction had a influ-ence to reinforcement, and one of the factors was attributed tothe existence of a low molecular mobility phase around thenanofiller.
4. Conclusions
The coarse-grained molecular dynamics model of a filled cross-linked polymer was produced using a bead-spring model. Modelswith different numbers of crosslinks and strengths of filler–poly-mer interaction were applied to the uniaxial elongation simulation.From the uniaxial elongation simulation results of the filled cross-linked polymer model, it was confirmed that reinforcement de-pends on the strength of the filler–polymer interaction.Moreover, from the analysis of polymer dynamics around thenanofiller, it was confirmed that the degree of reinforcement de-pends on the strength of filler–polymer interaction, and one ofthe factors which influenced the stress was attributed to the exis-tence of a low mobility phase around the nanofiller. In future work,large scale simulations will be carried out, and the validity of oursimulation model will be confirmed by comparing with our resultswith those of models of different scale.
References
[1] G. Kraus, Reinforcement of Elastomers, Wiley, New York, 1965.[2] A.R. Payne, R.E. Whittaker, Rubber Chem. Technol. 44 (1971) 440–476.[3] A.I. Medalia, Rubber Chem. Technol. 51 (1978) 437–523.[4] M.-J. Wang, Rubber Chem. Technol. 71 (1998) 520–589.[5] I. Medolia, G. Kraus, Science and Technology of Rubber, Academic Press, New
York, 1994. p. 408.[6] G. Kraus, Rubber Chem. Technol. 51 (1978) 297–321.[7] P. Stickney, R. Falb, Rubber Chem. Technol. 37 (1964) 1299–1340.[8] D.H. Droste, A.T. Dibenedetto, J. Appl. Polym. Sci. 13 (1969) 2149–2168.[9] K.D. Ziegel, J. Colloid Interface Sci. 29 (1969) 72–80.
[10] R. Mansencal, B. Haidar, A. Vidal, L. Delmotte, J.-M. Chezeau, Polym. Int. 50–54(2001) 387–394.
[11] H. Ismail, P.K. Freakley, E. Sheng, Eur. Polym. J. 31 (1995) 1049–1056.[12] N. Suzuki, M. Ito, F. Yatsuyanagi, Polymer 46 (2005) 193–201.[13] A. Lapra, F. Cizment, L. Bokobza, L. Monnerie, Rubber Chem. Technol. 76 (2003)
60–81.[14] H. Nukaga, S. Fujinami, H. Watabe, K. Nakajima, T. Nishi, Jpn. J. Appl. Phys. 44
(2005) 5425–5429.[15] K. Kremer, G.S. Grest, J. Chem. Phys. 92 (1990) 5057–5086.[16] M. Kroger, R. Makhloufi, Phys. Rev. E 53 (1996) 2531–2536.[17] M. Kroger, C. Luap, R. Muller, Macromolecules 30 (1996) 526–539.[18] M. Kroger, Phys. Rep. 390 (2004) 453–551.[19] T. Hayakawa, K. Hashimoto, H. Morita, M. Doi, in: International Rubber
Conference 2005, 2005, pp. G11–11.[20] T. Aoyagi, F. Sawa, T. Shoji, H. Fukunaga, J. Takimoto, M. Doi, Comput. Phys.
Commun. 145 (2002) 267–279. <http://octa.jp>.[21] T. Dudek, J.F. Bueche, J. Appl. Polym. Sci. 8 (1964) 555–564.[22] K. Suchiva, T. Kowitteerawut, L. Srichantamit, J. Appl. Polym. Sci. 75 (2000)
1495–1504.[23] H.C. Andersen, J. Chem. Phys. 72 (1980) 2384–2393.[24] V. Arighi, I.J. McEwen, H. Qian, M.B.P. Sterrano, Polymer 44 (2003) 6259–6266.[25] Y. Fukahori, Rubber Chem. Technol. 80 (2007) 777–807.[26] H. Morita, K. Tanaka, T. Kajiyama, T. Nishi, M. Doi, Macromolecules 39 (2006)
6233–6237.