Bisphosphonate–polyaspartamide conjugates as bone targeted drug delivery systems

ORIGINAL PAPER
Coarse-grained modeling study of nonpeptide RGD liganddensity and PEG molecular weight on the conformationof poly(γ-glutamyl-glutamate) paclitaxel conjugates
Lili X. Peng & Sanjib K. Das & Lei Yu &
Stephen B. Howell & David A. Gough
Received: 11 October 2010 /Accepted: 24 January 2011 /Published online: 1 March 2011# The Author(s) 2011. This article is published with open access at Springerlink.com
Abstract Molecular shape, flexibility, and surface hydro-philicity are thought to influence the ability of nanoparticlesto cross biological barriers during drug delivery. In thisstudy, coarse-grained (CG) molecular dynamics (MD)simulations were used to study these properties of apolymer-drug construct in potential clinical development:poly(γ-glutamyl-glutamate)-paclitaxel-poly(ethylene gly-col) nonpeptide RGD (PGG-PTX-PEG-npRGD), a linearglutamyl-glutamate polymer with paclitaxel and poly(eth-ylene glycol)-nonpeptide RGD side groups. It was hypoth-esized that the PEG molecular weight (MW) (500 Da;1,000 Da; and 2,000 Da) and nonpeptide RGD liganddensity (4, 8, 12, and 16 per molecule), respectively, mayhave advantageous effects on the shape, flexibility, andsurface hydrophilicity of PGG-PTX-PEG-npRGD. Circulardichroism spectroscopy was used to suggest initial struc-tures for the all-atom (AA) models of PGG-PTX-PEG-npRGD, which were further converted to CG models using
a commercially available mapping algorithm. Due to itssemi-flexibility, PGG-PTX-PEG-npRGD is not limited toone specific conformation. Thus, CG MD simulations wererun until statistical equilibrium, at which PGG-PTX-PEG-npRGD is represented as an ensemble of statistically similarconformations. The size of a PGG-PTX-PEG-npRGDmolecule is not affected by the PEG MW or the nonpeptideRGD density, but higher PEG MW results in increasedsurface density of a PGG-PTX-PEG-npRGD molecule.Most PGG-PTX-PEG-npRGD shapes are globular, al-though filamentous shapes were also observed in thePEG500 and PEG1000 molecules. PEG500 and PEG1000molecules are more flexible than PEG2000 systems. Ahigher presence of npRGD ligands results in decreasesurface hydrophilicity of PGG-PTX-PEG-npRGD. Theseresults indicate that the PGG-PTX-PEG1000-npRGD4 andPGG-PTX-PEG1000-npRGD8 molecules are the mostefficacious candidates and are further recommended forexperimental preclinical studies.
Keywords Polymer . Paclitaxel . Poly(ethylene glycol) .
Nonpeptide RGD . Active targeting . Coarse-grainedmodeling
Introduction
A continuing challenge in the development of anticancertherapeutics is ensuring that adequate amounts of the drugare delivered to tumors while simultaneously minimizingtoxic and adverse effects to healthy tissue [1, 2]. Asangiogenesis is crucial for tumor growth, the microvascularendothelial cell and its receptors have become key targetmodulators in cancer therapy [3]. The αVβ3 integrin and itsligands, vitronectin and fibronectin, are known to promote
Electronic supplementary material The online version of this article(doi:10.1007/s00894-011-0989-4) contains supplementary material,which is available to authorized users.
L. X. Peng :D. A. Gough (*)Department of Bioengineering, University of California,San Diego,La Jolla, CA, USAe-mail: [email protected]
L. X. Penge-mail: [email protected]
S. K. Das : L. YuNitto Denko Technical Corporation,Oceanside, CA, USA
S. B. HowellMoores Cancer Center, University of California, San Diego,La Jolla, CA, USA
J Mol Model (2011) 17:2973–2987DOI 10.1007/s00894-011-0989-4

angiogenesis [4, 5], and tumor cells with non-activated αVβ3
integrins have been shown to exhibit decreased angiogenicbehavior [6]. As a result, antagonists of αVβ3 integrins haveemerged as a new class of anticancer therapeutics, primarilythe Arg-Gly-Asp (RGD) tripeptide and RGD peptidomimet-ics, which bind to αVβ3 integrins with high affinity to preventbinding of αVβ3 integrins to their natural receptors [7–9].
This study focuses on the preclinical development of anonpeptide RGD (npRGD)-based drug delivery system:poly(γ-glutamyl-glutamate) paclitaxel tethered to npRGDvia poly(ethylene glycol) (PGG-PTX-PEG-npRGD) [10].Paclitaxel (Taxol®, C47H51NO14) (PTX) is a hydrophobicdrug used to treat breast, ovarian, and lung cancers, andpoly(γ-glutamyl-glutamate) (PGG) is a hydrophilic polymerconjugated to PTX to improve solubility [11, 12]. Tomaximize access of npRGD to αVβ3 integrins, PEG is
positioned between glutamyl-glutamate and npRGD residuesto avoid steric interactions between PGG-PTX and npRGD(see Fig. 1). Conjugation of PEG to therapeutic agents hasalso been shown to result in improved in vivo stability,protection from proteolytic digestion, increased biologicalhalf-life, improved solubility, and decreased toxicity [13].
Preclinical development of anticancer therapeutics usu-ally involves trial-and-error testing of candidate compoundson in vitro and in vivo models. While these methods yielduseful results, they are time-consuming, inefficient, andresource-intensive. Given to urgent clinical need forsuccessful therapies there is clear motivation to shortenthe course of preclinical development of therapeutic agents.In this study, we performed molecular dynamics (MD)simulations of PGG-PTX to predict their physicochemicalproperties, such as shape, flexibility, and surface hydro-
Fig. 1 Chemical structures ofpoly(γ-glutamyl-glutamate)(GG), GG-paclitaxel (PTX), andGG-poly(ethylene glycol)(PEG)-npRGD [non-peptideresidues RGD (Arg-Gly-Asp)peptidomimic]. GGNH3+ andGG-PTX each has a charge of−1; GG and GG-PEG-npRGDeach a charge of −2; andGGCOO– a charge of −3. TheGG residue differs slightlybased on its position on thepolymer, e.g., its position at theamino or carboxyl termini. Forthe GG-PTX residue, paclitaxelis conjugated to a carboxylategroup of glutamyl-glutamate viaan ester linkage. For the GG-npRGD residue, the nonpeptideRGD is attached to a linear PEGspacer, which is conjugated tothe GG residue. The length n ofthe PEG spacer depends on themolecular weight of the linearPEG molecule: 500 Da; 1,000Da; and 2,000 Da correspond toapproximately 11, 23, and 45ethylene glycol monomers
2974 J Mol Model (2011) 17:2973–2987

philicity—factors that may influence how nanoparticlesovercome biological barriers [14–18]. It was hypothesizedthat the density of nonpeptide RGD (4, 8, 12, and 16ligands) and molecular weight (MW) of PEG spacer (500Da; 1,000 Da; and 2,000 Da) concomitantly affects theshape, flexibility, and surface hydrophilicity of a PGG-PTX-PEG-npRGD molecule. (Figure 2 shows the pattern-ing schemes for the PGG-PTX-PEG-npRGD molecules.)
Theoretical insight from the modeling results may beuseful to suggest better molecular designs of PGG-PTX-PEG-npRGD, ultimately expediting its preclinicaldevelopment.
Prior to running MD simulations, a key challenge was todetermine the initial configuration of PGG-PTX-PEG-npRGD [19]. The combination of flexible polymericcomponents (PGG and PEG) and rigid components (PTX
Fig. 2 Abstract representations of the spatial positioning patterns ofpaclitaxel (PTX) and (PEG)n-nonpeptide RGD molecules on the PGGbackbone. Patterning schemes apply to all PEG 500, PEG 1000, andPEG 2000 systems. Each PGG-PTX molecule is composed of 130poly-γ-glutamyl-glutamate monomers, 26 paclitaxel molecules, and 4,8, 12, or 16 (PEG)n-nonpeptide RGD molecules. Paclitaxel and
(PEG)n-nonpeptide RGD molecules are attached covalently to thePGG backbone in a random fashion. Numbers between residuesdenote the number of repeating GG residues that are not amino- orcarboxyl-termini GG residues. The amino- and carboxyl-termini GGresidues are represented by black dots at the ends of each line
J Mol Model (2011) 17:2973–2987 2975

and npRGD) make PGG-PTX-PEG-npRGD a semiflexiblemolecule. Currently, there is no crystallized conformationrepresenting its experimental form available from theProtein Data Bank. Therefore, circular dichroism (CD)spectroscopy was used to determine the presence of chiralforms of PGG-PTX-PEG-npRGD in aqueous form andobtain a general idea of its initial structure, which was thenused to construct all-atom (AA) models.
In previous work on protein simulations, once the initialconfiguration has been determined, MD simulations were runto equilibrium, at which point a specific structure is attained[20, 21]. At this point, the potential energy level of a systembecame constant with respect to time. The approach must bedifferent in the present case. Given the semiflexible nature ofthe PGG-PTX-PEG-npRGD, the molecule most likely existsas a population of related structures, rather than one specificstructure. Therefore, the goal is not to attain a static PGG-PTX-PEG-npRGD conformation through MD simulations.Rather, MD simulations are run until minimal structuralfluctuations at the molecular level, or a statistical equilibrium[22], is reached, at which point a PGG-PTX-PEG-npRGDmolecule is characterized as an ensemble of statisticallysimilar structures.
Given the relatively large sizes of each PGG-PTX-PEG-npRGD molecule (∼90–130 kDa), running MD simulationson AA models in explicit solvent was judged to require anextraordinary amount of CPU time and expense. Therefore, tominimize computational costs and allow access longer timescales, AA models were converted to coarse-grained (CG)models using the mapping scheme in the MARrink’s ToolkitINItiative (MARTINI) force field [23]. CG parameterizationof the models was done by using the Boltzmann inversion todetermine the equilibrium bonded distances and angles from100 ns AA MD simulations in implicit solvent.
Experimental and computational methods
Experimental
Sample preparation
A lyophilized sample of PGG-PTX-PEG220-npRGD16 wasprovided by Nitto Denko Technical Corporation (Ocean-side, CA, USA). The sample was weighed and then dilutedto 1mg/ml in 1X HyClone modified DPBS buffer (Cat. No.SH30028.03, ThermoScientific, Fremont, CA). The samplewas then sonicated in a 37°C water bath for 15 min andallowed to settle at room temperature (25°C) for 10 min.Finally, the sample was filtered using a 0.2 μm filter paper(Part No. 431215, Corning Life Sciences, San Francisco,CA, USA) and a 20G 1½ Precision Glide needle (BectonDickinson, Franklin Lakes, NJ, USA).
Circular dichroism spectroscopy
CD spectroscopy measurements of the PGG-PTX-PEG220-npRGD16 sample were carried out using an AVIVModel 202 spectrophotometer (AVIV Biomedical, Lake-wood, NJ, USA). CD spectra of pure 1X DPBS buffer andFD protein in 50% TFE/50% double distilled H2O/0.1%TFA were also taken as the negative and positive controls,respectively. All measurements were taken at 37°C. Thefar-UV CD spectra were recorded from 190 to 260 nmusing a 1-cm rectangular quartz cuvette, and the CD spectrawere collected at every 0.5 nm with 5 sec at each point. Foreach sample except pure 1X DPBS, the concentration wasadjusted and diluted so that the dynode voltagecorresponding to the ellipticity signal remained below500 V throughout the entire spectra collection period. (Ithas been suggested in Greenfield et al. [24] that the signal-to-noise ratio diminishes greatly once the dynode voltageexceeds 500 V.) The optimum concentrations of eachsample leading to the optimal elliptical signal and lowestsignal-to-noise ratio were determined to be: 1 mg/ml ofPGG-PTX-PEG220-npRGD16 in 1X DPBS and 0.25 mg/mlof FD protein in 50% TFE/50% ddH2O/0.1% TFA.
Computational methods
All-atom modeling
Model construction The initial structures and input files forthe following residues were constructed in the xleapmodule of AMBER 9.0: GG, GGCOO–, GGNH3+, GG-PTX, GG-PEG500-npRGD, GG-PEG1000-npRGD, andGG-PEG2000-npRGD. The initial structure for paclitaxel(PDB ID: 1JFF) was provided by the Protein Data Bank[25]. The Gaussian (g03) program’s geometry optimizationand restrained electrostatic potential fitting (RESP) wereused to generate the atom-centered point charges for allresidues [26, 27]. For the protonated molecules, hydrogenatoms were added to the carboxyl groups to achievetheir ionized states. To obtain the electrostatic potentialfor these residues, the AM1 geometry scheme and theHF/6-31G* and HF/6-31G** pop=mk iop(6/33=2) abinitio level calculations were performed using theGaussian program. Finally, to derive the equivalentpartial atomic charges, RESP fitting was applied onthe electrostatic potentials.Energy minimization and MD simulation These steps werecarried out using the AMBER 9.0 sander module. Eachmolecule was solvated and minimized in implicit solventusing the modified Generalized-Born model of IGB=2 andthe linear combinations of pairwise overlaps (LPCO) model[28, 29]; 250 steps of steepest descent followed by 1,750steps of conjugate gradient were carried out. The ionic
2976 J Mol Model (2011) 17:2973–2987

strength of the implicit solvent was set to 140 mM to mimicthe salt concentration of blood plasma. No periodicboundary conditions were applied. A non-bonded electro-static cutoff of 16.0 Å was used. Trajectory snapshots weresaved every 100 steps for further reprocessing.
MD simulations were also carried out using the sandermodule applying the modified version (ff99SB) of theCornell et al. parm99 and GAFF force fields in the NVTensemble (in which the number of atoms N, volume V, andtemperature T were fixed) at 310K in implicit solventwithout periodic boundary conditions [30–32]. Constanttemperature scaling was also applied with a time constantof 0.5 ps. Langevin dynamics was used with a collisionfrequency of 2.0 ps−1. Newton’s equations of motions wereintegrated with a time step of 2 fs. All bonds involvinghydrogen atoms were constrained using the SHAKEalgorithm [33]. The rotational and translational degrees offreedom about the center of mass were eliminated.Trajectory snapshots were saved every 100 steps for laterreprocessing. Each cycle of the MD simulation was run for0.1 ns; this step was repeated until a statistical equilibriumwas reached at 100 ns.
Coarse-grained modeling
CG mapping The MARTINI force field was selected for theCG parameterization for its successful application to proteinsby experimental validation of their structural andthermodynamic properties as well as the amino acid-basednature of the glutamyl-glutamate backbone [23, 34]. TheMARTINI force field dictates that a group of roughly four–five atoms are represented as an interaction center, or bead.The only exception applies to aromatic groups, in which amapping scheme of two heavy atoms-to-one-bead wasapplied in order to maintain geometric symmetry, namely,the benzene entities in paclitaxel and nonpeptide RGD. Thesebeads interact through a set of short-range Lennard-Jonespotentials to reproduce characteristic properties resulting fromAA simulations. Charged groups interact via a Coulombicenergy function, and bonded potentials are used to describethe chemical connectivity of the beads. CG mapping of theGG, GGCOO–, GGNH3+, and GG-PTX residues was previous-ly done in Peng et al. [22]. CG mapping of the GG-PEG500-npRGD residue is shown in Fig. 3, and CG mapping of theGG-PEG1000-npRGD and GG-PEG2000-npRGD residuesare provided in Fig. S2. Also, each Na+ion is represented asa single Q type bead, and four AA water molecules aremapped to a single P4 type bead (W).
Theory
The dynamics of the beads are described by Newton’sequations of motion. The effective bonded and nonbonded
interactions are described by a potential of the form,adapted from Marrink et al. [34]:
V ¼X
m
Vmbond þ Vm
angle þ Vmdihedral
h iþ Vm
nonbonded ð2Þ
where the index m represents a bead from a PGG-PTX-PEG-npRGD molecule, a sodium (Na+) ion, or a water (W) bead.Vbond represents the forces between two successively bondedbeads, Vbond accounts for the forces used to sustain anglesbetween three successively bonded beads, and Vdihedral corre-sponds to the dihedral angle potential for four successivelybonded beads. The Vnonbonded term accounts for the nonbondedinteractions among all of the beads in a system. The bondedinteractions are used to describe the chemical connectivity ofthe beads and are characterized as one of the following(the indices i and j represent two consecutive beads):
Vmbond ¼
X
ij
12k
mij rmij � rm0;ij
� �2ð3Þ
where rmij is the distance between two consecutive beads i and j,rm0;ij is the equilibrium bond length, and kmij is the distance forceconstant. The potential for bond angles is:
Vmangle ¼
X
ijk
12k
mijk cos qmijk
� �� cos qm0;ijk
� �h i2ð4Þ
where qmijk is the angle between beads i, j, and k, qm0;ijk is theequilibrium angle, and kmijk is the angle force constant.
The dihedral potential, Vdihedral, applies only to backboneprotein residues. Since the general structure of PGG-PTX-PEG-npRGD adapts a random coil, Vdihedral was set to 0 forall combinations of four successively connected beads:
Vmdihedral ¼
X
ijkl
kmijkl 1þ cos n#mijkl � dmijkl
� �h ið5Þ
where n is an integer that represents multiplicity, dmijkl is thephase shift, #mijkl is the angle between the plane formed by thefirst three beads i, j, and k and the plane formed by the lastthree beads j, k, and l, and kmijklis the dihedral force constant.
Nonbonded interactions between two beads are describedby a van der Waals (vdW) potential, characterized by aLennard-Jones 12-6 potential energy function and a Coulom-bic potential for charged beads. The following summation isperformed over all pairs of nonbonded beads m and nseparated by a distance of rmn:
Vnonbonded ¼X
m;n
4"mnsmn
rmn
� �12
� smn
rmn
� �6" #
þX
m;n
qmqn4p"0"rmn
ð6Þ
where constants σmn and εmn are the vdW parameters for thebead interaction, σmn refers to the closest distance of
J Mol Model (2011) 17:2973–2987 2977

approach between two beads m and n, and εmn denotes thestrength of the interactions between beads m and n. Thecharges qm and qn of the mth and nth beads, respectively, andthe vacuum dielectric permittivity ε0 are included. A relativedielectric constant of ε=15 is assumed for all electrostaticinteractions.
CG parameterization
The bonded distances and angles for the PGG-PTX-PEG-npRGD molecules were determined as follows: (1) MDsimulations of the 12 AA PGG-PTX-PEG-npRGD modelswere run to 100 ns; (2) the bonded distances and values forthe assigned beads were extracted from the AA MDsimulations using the AMBER 9.0 ptraj module; and (3)the Boltzmann inversion was used to extract the equilibri-um bonded distances and angles [35]. These values wereaveraged for each set of four PGG-PTX-PEG-npRGDmolecules with the same PEG MW. (For example, thebonded distances and angles for the four PEG1000molecules were averaged together; the resulting valueswere used for the parameterizing the PGG-PTX-PEG1000-npRGD4, PGG-PTX-PEG1000-npRGD8, PGG-PTX-PEG1000-npRGD12, and PGG-PTX-PEG1000-npRGD16
molecules.) CG topologies for the GG, GGCOO–, GGNH3+,and GG-PTX residues were taken from Peng et al. andshown in Table S1 [22]; CG topologies for the GG-PEG500-npRGD residue are provided in Table S2; andCG topologies of the GG-PEG1000-npRGD and GG-PEG2000-npRGD residues are provided in Table S3.
MD simulation
CG models of the 12 PGG-PTX-PEG-npRGD moleculeswere constructed using the atom2cg and itp-generatingscripts provided by the MARTINI tutorials. Each PGG-PTX-PEG-npRGD molecule was solvated in explicit solventcomprising of W beads. Due to the negative chargesimparted by the glutamyl-glutamate residues, 234 Na+ionswere added in place of water molecules to neutralize thesystem. The simulations were carried out under NPT (thenumber of particles N, pressure P, and temperature T arefixed) conditions at a constant temperature of 310 K with acoupling constant of τT=0.1 ps and a constant pressure of 1bar with a relaxation time of τP=0.5 ps. The cutoff lengthused for the nonbonded interactions was rcut=1.2 nm.Lennard-Jones and Coulombic forces were considered forrcut<0.9 nm and rcut<1.2 nm, respectively. Coulombic
Fig. 3 Coarse-grained representation of a GG-PEG500-npRGD residue. A GG-PEG500-npRGD molecule was reduced from 75 heavy atoms to21 CG beads. (CG representations for the GG-PEG1000-npRGD and GG-PEG2000-npRGD residues are shown in Figs. S1 and S2, respectively)
2978 J Mol Model (2011) 17:2973–2987
forces were computed every time step for 1.0 nm and onceevery 10 time steps for 0.9 nm<rcut<1.2 nm. The time stepin the leap-frog integration scheme was 5 fs. The energies,coordinates and velocities were written every 0.5 ps. MDsimulations were run for 1 μs. The timescale was scaled upby a factor of four because CG dynamics are faster than all-atom dynamics, due to the smoothness of the CG inter-actions. This factor of four is based on the speedup in thediffusional dynamics of CG water as compared to AAwater.Therefore, the 1 μs simulation timescale was scaled up by afactor of four, resulting in an effective time of 4 μs[23, 34, 36].
Root-mean-square deviation clustering
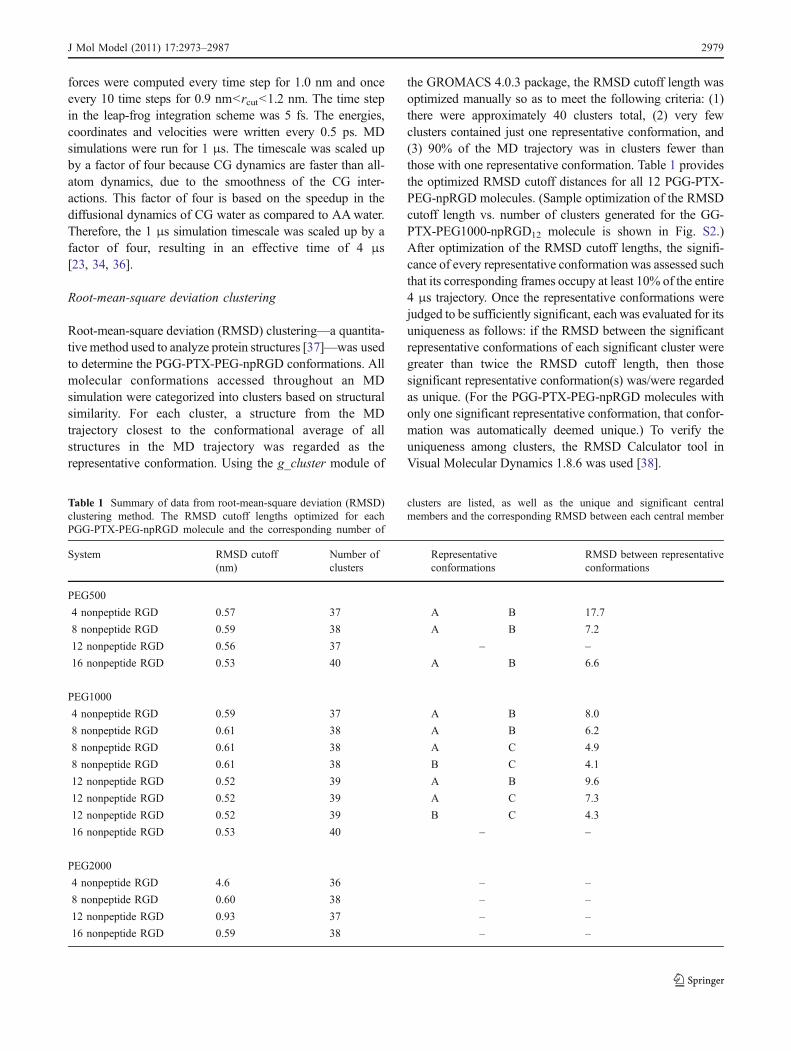
Root-mean-square deviation (RMSD) clustering—a quantita-tive method used to analyze protein structures [37]—was usedto determine the PGG-PTX-PEG-npRGD conformations. Allmolecular conformations accessed throughout an MDsimulation were categorized into clusters based on structuralsimilarity. For each cluster, a structure from the MDtrajectory closest to the conformational average of allstructures in the MD trajectory was regarded as therepresentative conformation. Using the g_cluster module of
the GROMACS 4.0.3 package, the RMSD cutoff length wasoptimized manually so as to meet the following criteria: (1)there were approximately 40 clusters total, (2) very fewclusters contained just one representative conformation, and(3) 90% of the MD trajectory was in clusters fewer thanthose with one representative conformation. Table 1 providesthe optimized RMSD cutoff distances for all 12 PGG-PTX-PEG-npRGD molecules. (Sample optimization of the RMSDcutoff length vs. number of clusters generated for the GG-PTX-PEG1000-npRGD12 molecule is shown in Fig. S2.)After optimization of the RMSD cutoff lengths, the signifi-cance of every representative conformation was assessed suchthat its corresponding frames occupy at least 10% of the entire4 μs trajectory. Once the representative conformations werejudged to be sufficiently significant, each was evaluated for itsuniqueness as follows: if the RMSD between the significantrepresentative conformations of each significant cluster weregreater than twice the RMSD cutoff length, then thosesignificant representative conformation(s) was/were regardedas unique. (For the PGG-PTX-PEG-npRGD molecules withonly one significant representative conformation, that confor-mation was automatically deemed unique.) To verify theuniqueness among clusters, the RMSD Calculator tool inVisual Molecular Dynamics 1.8.6 was used [38].
Table 1 Summary of data from root-mean-square deviation (RMSD)clustering method. The RMSD cutoff lengths optimized for eachPGG-PTX-PEG-npRGD molecule and the corresponding number of
clusters are listed, as well as the unique and significant centralmembers and the corresponding RMSD between each central member
System RMSD cutoff(nm)
Number ofclusters
Representativeconformations
RMSD between representativeconformations
PEG500
4 nonpeptide RGD 0.57 37 A B 17.7
8 nonpeptide RGD 0.59 38 A B 7.2
12 nonpeptide RGD 0.56 37 – –
16 nonpeptide RGD 0.53 40 A B 6.6
PEG1000
4 nonpeptide RGD 0.59 37 A B 8.0
8 nonpeptide RGD 0.61 38 A B 6.2
8 nonpeptide RGD 0.61 38 A C 4.9
8 nonpeptide RGD 0.61 38 B C 4.1
12 nonpeptide RGD 0.52 39 A B 9.6
12 nonpeptide RGD 0.52 39 A C 7.3
12 nonpeptide RGD 0.52 39 B C 4.3
16 nonpeptide RGD 0.53 40 – –
PEG2000
4 nonpeptide RGD 4.6 36 – –
8 nonpeptide RGD 0.60 38 – –
12 nonpeptide RGD 0.93 37 – –
16 nonpeptide RGD 0.59 38 – –
J Mol Model (2011) 17:2973–2987 2979

Density analysis
Typically in MD simulations, the radial distributionfunction, g(r), is used to characterize the structure of thebiomolecules. The gAB(r) between species A and B isdefined as follows [39]:
gABðrÞ ¼ rABðrÞrB;local
ð7Þ
where ρAB(r) is the density of species B at a distance r fromspecies A and ρB,local is the local density of species B atmaximum distance rmax from species A. For this study,species B refers to a PGG-PTX-PEG-npRGD molecule andspecies A its center-of-mass (COM). It is important toemphasize that the COMdoes not necessarily correspond to thegeometric center, particularly for irregularly shaped molecules,and the COM is always towards the more massive end.
Since the local densities of the PGG-PTX-PEG-npRGDmolecules are different, their gAB(r) values would notproperly describe how the structure of PGG-PTX-PEG-npRGD is affected by PEG MW and npRGD density.Therefore, the density of PGG-PTX-PEG-npRGD from itsCOM, ρAB(r), was used to describe structure. The localdensity of each PGG-PTX-PEG-npRGD molecule, ρB,local,was determined from its molecular mass and simulation boxsize (see Table 2). The g_rdf module of GROMACS 4.0.3was then used to extract the gAB(r) values of each PGG-PTX-PEG-npRGD molecule throughout the 4 μs trajectory.Using the definition of gAB(r), the density of PGG-PTX-PEG-npRGD from its spatial center was determined bymultiplying gAB(r) and ρB,local: ρAB(r)=gAB(r)×ρB,local.
Solvent-accessible surface area analysis
The solvent-accessible surface area (SASA) indicates thearea of a particular species that is exposed to the solvent.
The SASA of the PGG-PTX-PEG-npRGD molecules wasanalyzed in VMD 1.8.6 using a solvent probe radius of2.4 nm. For each PGG-PTX-PEG-npRGD molecule, theSASA of the entire molecule was calculated, along with theSASA of PGG, PEG, PTX, and npRGD entities of eachPGG-PTX-PEG-npRGD molecule. The contribution of eachentity was then determined by taking the fraction of theSASA for a particular entity with respect to the SASA of thewhole PGG-PTX-PEG-npRGD molecule, or the percentage(%) SASA. Table 3 shows the % SASA for the PGG, PEG,PTX, and npRGD entities for all PGG-PTX-PEG-npRGDmolecules. The hydrophilic SASA (% SASAphil) wasdetermined from the sum of the % SASAPGG and %SASAPEG residues.
Results and discussion
Circular dichroism spectroscopy
Circular dichroism spectroscopy was used to determine thesecondary structure of a PGG-PTX-PEG220-npRGD16
molecule. This method of determining the initial structurewas originally applied to PGG-PTX in Peng et al. [22].Although PGG-PTX-PEG220-npRGD16 was not one of thePGG-PTX-PEG-npRGD molecules pursued in this study,its chemical structure is similar enough to provide anaccurate representation of the PGG-PTX-PEG-npRGDmolecules being studied.
Figure 4 shows the CD spectra of 1mg/ml PGG-PTX-PEG220-npRGD16 dissolved in 1X DPBS. The curve ismost representative of a random coil at physiologicaltemperature (37°C). The negative control of 1X DPBS at37°C indicates that there is no signal interference that mayhave influenced the conditions while the CD spectrum ofPGG-PTX-PEG220-npRGD16 was being taken. For the
System Mass(kDa)
Mass(× 10−19 g)
Simulation boxvolume (× 103 nm3)
Local density, ρB,local(× 10−3 g/ml)
PGG-PTX-PEG500-npRGD4 58.6 0.97 5.60 17.4
PGG-PTX-PEG500-npRGD8 61.9 1.03 5.07 20.3
PGG-PTX-PEG500-npRGD12 65.1 1.08 5.72 18.9
PGG-PTX-PEG500-npRGD16 68.5 1.14 5.54 20.5
PGG-PTX-PEG1000-npRGD4 60.6 1.01 6.33 15.9
PGG-PTX-PEG1000-npRGD8 65.8 1.09 6.79 16.1
PGG-PTX-PEG1000-npRGD12 71.0 1.18 9.35 12.6
PGG-PTX-PEG1000-npRGD16 76.2 1.27 9.26 13.7
PGG-PTX-PEG2000-npRGD4 64.8 1.08 13.4 8.03
PGG-PTX-PEG2000-npRGD8 74.2 1.23 16.3 7.58
PGG-PTX-PEG2000-npRGD12 83.7 1.39 24.1 5.77
PGG-PTX-PEG2000-npRGD16 93.1 1.55 24.4 6.34
Table 2 Determination of localdensities of PGG-PTX-PEG-npRGD molecules. The localdensity, ρB,local, of each PGG-PTX-PEG-npRGD moleculewas determined by dividing themass of each molecule by thesimulation box volume using thefollowing unit conversions:6.022 × 10²³ Da = 1 gram and 1nm3 = 1.0 × 10⁻²¹ ml
2980 J Mol Model (2011) 17:2973–2987

positive control, the shape of the alpha-helical FD protein, abZIP transcription factor in a floral pathway [40], in 50%TFE/50% ddH2O/0.1% TFA buffer does indeed correspondto an alpha-helix, as compared with the CD spectrum of the
alpha-helical poly(γ-tyrosine) [41]. The lowest part of thecurve is ∼215 nm and the highest point of the curve is∼200 nm, collectively indicating that the FD protein isalpha-helical. Since PGG-PTX-PEG220-npRGD16 exists asa random coil, this data suggest that the PGG-PTX-PEG-npRGD molecules being modeled most likely exist asrandom coils. Therefore, their existence as random coilsimposes no stipulations on the construction of AA modelsof PGG-PTX-PEG-npRGD. Also, the CD spectroscopyresults further support the theory that the conformation ofPGG-PTX-PEG-npRGD is not limited to a specific struc-ture, and structural analysis must account for multipleconformations of PGG-PTX-PEG-npRGD.
RMSD values
Figure 5 shows the RMSD time evolutions for allPGG-PTX-PEG-npRGD molecules. Most time evolutionsincreased up to ∼6-7 nm and reached a statisticalequilibrium by 4 μs. Given the relatively large sizes of
Fig. 4 Circular dichroism spectra of samples. The spectra for 16nonpeptide RGD-targeted PGG-PTX (red), PGG-PTX (blue), FDprotein (green), and pure 1X DPBS (black) are shown
System % SASAPGG % SASAPEG % SASAphil* % SASAPTX % SASAnpRGD
PEG 500
4 nonpeptide RGD
A 78.5 1.1 79.6* 18.2 2.2
B 69.5 1.9 71.4* 25.7 2.9
8 nonpeptide RGD
A 73.1 1.6 74.7* 21.5 3.9
B 73.3 1.5 74.8* 20.4 4.9
12 nonpeptide RGD 68.2 2.8 70.0* 19.0 8.2
16 nonpeptide RGD
A 66.9 3.7 70.6* 18.7 10.6
B 58.1 6.2 64.3* 23.8 11.8
PEG1000
4 nonpeptide RGD
A 74.2 0.3 74.5* 24.2 1.2
B 74.9 1.1 76.0* 22.3 1.8
8 nonpeptide RGD
A 78.3 2.0 80.3* 16.4 3.4
B 64.7 5.8 70.5* 25.2 4.3
C 71.7 2.4 74.1* 22.8 3.1
12 nonpeptide RGD
A 78.7 0.5 79.2* 15.0 5.8
B 73.2 0.4 73.6* 18.7 7.7
C 73.9 0.4 74.3* 18.8 6.9
16 nonpeptide RGD 74.1 0.6 74.7* 16.0 9.2
PEG2000
4 nonpeptide RGD 78.9 1.8 80.7* 17.8 1.5
8 nonpeptide RGD 72.6 6.5 79.1* 17.0 3.8
12 nonpeptide RGD 68.3 8.4 76.7* 16.9 6.4
16 nonpeptide RGD 66.0 12.5 78.5* 12.3 9.2
Table 3 Percentage solvent-accessible surface area (SASA) ofPGG-PTX-PEG-npRGDmolecules. Lists the percentageSASA values for the PGG, PEG,PTX, and npRGD entities withrespect to the entire SASA of eachPGG-PTX-PEG-npRGDmolecule
*The % SASAphil is the sum ofthe%SASAPGG and % SASAPEG
J Mol Model (2011) 17:2973–2987 2981

these systems, these values are reasonable. The RMSDvalues for the PEG2000 molecules are slightly higher thanthose of the PEG500 and PEG1000 molecules (by ∼1 nm),whereas the RMSD values for the PEG500 and PEG1000molecules are comparable. This 1 nm difference is inaccordance with the size of the molecular systems, as thePEG2000 molecules are the largest. In addition, the time ittakes for PGG-PTX-PEG-npRGD molecules to attainstatistical equilibrium depends on the PEG MW. ThePEG1000molecules take the longest time to reach equilibrium,as some molecules do not reached a plateau until 3 μs.Conversely, the PEG2000 molecules take the least time toreach equilibrium; by 1 μs, all molecules have attained astatistical equilibrium. The time it takes for the PEG500molecules to level off is∼2μs, which is intermediate comparedto the time it takes for the PEG1000 and PEG2000 moleculesto reach equilibrium. This behavior suggests that the PEG1000molecules fluctuate the most, accessing a wide range ofmolecular conformations throughout the 4 μs MD trajectory.
Size of a PGG-PTX-PEG-npRGD molecule
Figure 6 shows the radius of gyration (Rgyr) trajectories forall PGG-PTX-PEG-npRGD molecules over the 4 μs timescale. For all molecules, the Rgyr values begin at ∼7–8 nmand decrease to ∼3 nm, nearly half their original size. ThePEG2000 and PEG1000 systems take the shortest and
longest to reach their final Rgyr values, respectively. Thesevalues correspond to the RMSD values: the PEG2000 andPEG1000 systems also take the shortest and longest toreach their final RMSD values, respectively. Furthermore,as shown in Fig. 7, the Rgyr of each PGG-PTX-PEG-npRGD representative conformation is approximately 2-4 nm. Figure 8 further supports the notion that neither thePEG MW nor the npRGD density significantly influencesthe size of a PGG-PTX-PEG-npRGD molecule.
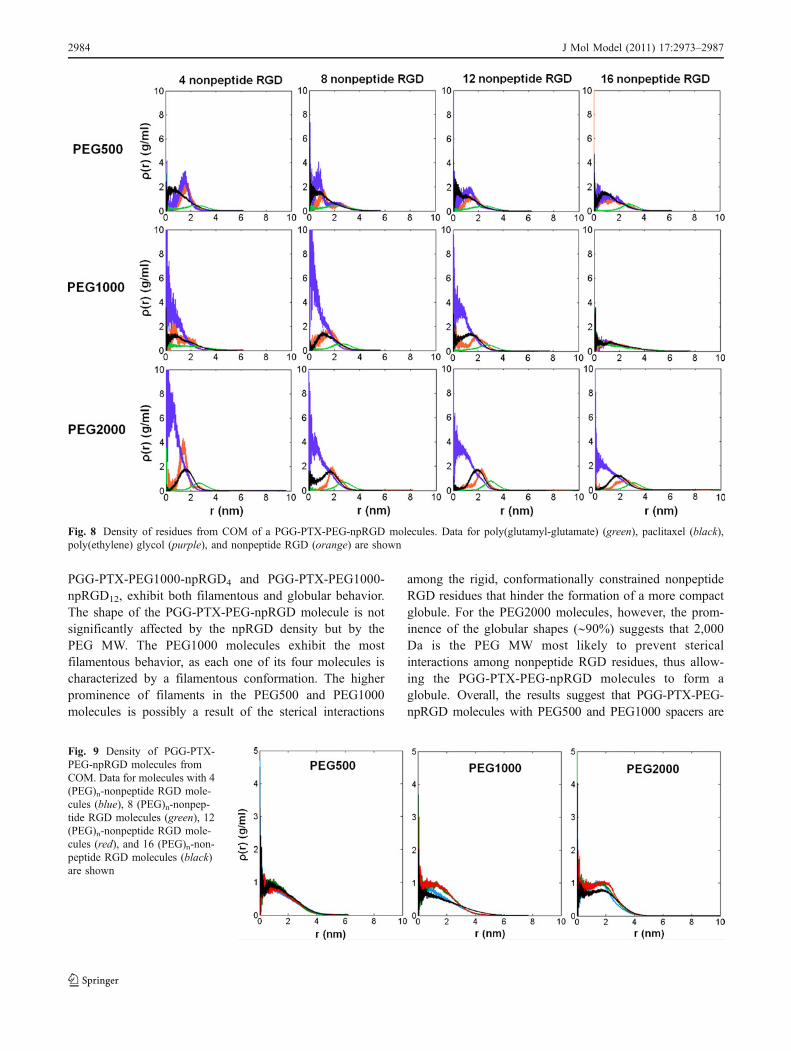
Structure of a PGG-PTX-PEG-npRGD molecule
Figure 9 shows that each PGG-PTX-PEG-npRGD moleculeis most densely packed at its COM. Most PGG-PTX-PEG-npRGD molecules exhibit a peak density of ∼1 g/ml justoutside its center-of-mass at r∼1 nm, 1.5 nm, and 2 nm forthe PEG500, PEG1000, and PEG2000 molecules. Thisincrease in distance of peak density is correlated withincreasing PEG MW. Figure 8 shows how the density ofeach residue type (PGG, PTX, PEG, and npRGD) variesfrom the COM of a PGG-PTX-PEG-npRGD molecule. ThePEG MW impacts how the density of each residue changeswith distance from COM. For instance, PTX and npRGDresidues exhibit peak densities at greater distances as PEGMW increases, suggesting that higher PEG MW causesPTX and npRGD residues to approach closer to the surfaceof the PGG-PTX-PEG-npRGD. The peak densities of PTX
Fig. 5 RMSD time evolutions of PGG-PTX-PEG-npRGD molecules.Data for molecules with 4 (PEG)n-nonpeptide RGD molecules (blue),8 (PEG)n-nonpeptide RGD molecules (green), 12 (PEG)n-nonpeptide
RGD molecules (red), and 16 (PEG)n-nonpeptide RGD molecules(black) are shown
Fig. 6 Radius of gyration trajectories of PGG-PTX-PEG-npRGDPTX molecules. Data for molecules with 4 (PEG)n-nonpeptide RGDmolecules (blue), 8 (PEG)n-nonpeptide RGD molecules (green), 12
(PEG)n-nonpeptide RGD molecules (red), and 16 (PEG)n-nonpeptideRGD (black) molecules are shown
2982 J Mol Model (2011) 17:2973–2987

and npRGD in Fig. 8 agree with the peak densities of PGG-PTX-PEG-npRGD in Fig. 9, suggesting that the presence ofPTX and npRGD residues is mostly responsible for thisspatial shift in the peak density of the overall PGG-PTX-PEG-npRGD molecule. On the contrary, for PEG, thedistance of peak density tends to decrease as the PEG MWincreases, which suggests that increasing the PEG spacerlength causes PEG to shift away from the external surfaceand move internally towards the COM of a PGG-PTX-PEG-npRGD molecule. In general, the difference in peakdensities of PEG and peak densities of PTX and npRGDbecomes more pronounced as the PEG MW increases,which signifies that the PGG-PTX-PEG-npRGD moleculetends to become more spatially divided (by residue type) athigher PEG MW. Finally, taking the Rgyr values into account,these results suggest that while the PEG MW does not affectthe size of a PGG-PTX-PEG-npRGD molecule, the PEGMW does impact structure. Figure 8 also suggests that thenpRGD density also does not significantly affect thestructure of the PGG-PTX-PEG-npRGD molecule.
Implications of shape of a PGG-PTX-PEG-npRGD molecule
Discher and colleagues have demonstrated that filamentousparticles retains a longer circulation half-life in thebloodstream, thus decreasing levels of clearance via thereticoendothelial system (RES) and improving the chancesof the nanoparticle to reach the target tumor [16]. Also,nonspherical nanoparticles have been shown to adheremore firmly to walls of tumor endothelia [17]. Figure 7shows the representative conformations of all PGG-PTX-PEG-npRGD molecules. The geometry of each molecule ischaracterized as a filament (wormlike and threadlike) orglobule (round). In general, most molecules are globules,which is most likely attributed to the hydrophobic drivingforce among PTX molecules that are uniformly distributedalong the PGG backbone. The uniform distribution of PTXcauses the entire PGG-PTX-PEG-npRGD to self-assembleinto a globule in which PTX molecules are located in thecore, where it is the furthest from the solvent andsurrounded by hydrophilic PGG. Other molecules, such as
Fig. 7 Representative conformations of PGG-PTX-PEG-npRGDmolecules. Each structure shows GG (grey), PTX (yellow), PEG(blue), and npRGD (red) residues. Explicit W beads and Na+ions arenot shown. Representing an actual frame in the trajectory, the centralmember embodies the configuration that is the most similar to the
average of all configurations in that cluster. The percentage indicatesthe population of frames, or % trajectory occupancy, corresponding tothat particular cluster for the full 4 μs MD trajectory. Radius ofgyration values for each PGG-PTX-PEG-npRGD molecule is alsoshown below the % trajectory occupancy
J Mol Model (2011) 17:2973–2987 2983
PGG-PTX-PEG1000-npRGD4 and PGG-PTX-PEG1000-npRGD12, exhibit both filamentous and globular behavior.The shape of the PGG-PTX-PEG-npRGD molecule is notsignificantly affected by the npRGD density but by thePEG MW. The PEG1000 molecules exhibit the mostfilamentous behavior, as each one of its four molecules ischaracterized by a filamentous conformation. The higherprominence of filaments in the PEG500 and PEG1000molecules is possibly a result of the sterical interactions
among the rigid, conformationally constrained nonpeptideRGD residues that hinder the formation of a more compactglobule. For the PEG2000 molecules, however, the prom-inence of the globular shapes (∼90%) suggests that 2,000Da is the PEG MW most likely to prevent stericalinteractions among nonpeptide RGD residues, thus allow-ing the PGG-PTX-PEG-npRGD molecules to form aglobule. Overall, the results suggest that PGG-PTX-PEG-npRGD molecules with PEG500 and PEG1000 spacers are
Fig. 8 Density of residues from COM of a PGG-PTX-PEG-npRGD molecules. Data for poly(glutamyl-glutamate) (green), paclitaxel (black),poly(ethylene) glycol (purple), and nonpeptide RGD (orange) are shown
Fig. 9 Density of PGG-PTX-PEG-npRGD molecules fromCOM. Data for molecules with 4(PEG)n-nonpeptide RGD mole-cules (blue), 8 (PEG)n-nonpep-tide RGD molecules (green), 12(PEG)n-nonpeptide RGD mole-cules (red), and 16 (PEG)n-non-peptide RGD molecules (black)are shown
2984 J Mol Model (2011) 17:2973–2987

more efficacious than the PGG-PTX-PEG-npRGD moleculeswith PEG2000 spacers. While the molecular weight of thePEG spacer influences the shape of a PGG-PTX-PEG-npRGDmolecule, the npRGD density has only minimal impact.
Implications of flexibility of a PGG-PTX-PEG-npRGDmolecule
Takeoka has speculated that higher molecular flexibility ofnanoparticles promotes more surface interactions to tumorcells [18]. The flexibility of each PGG-PTX-PEG-npRGDmolecule was assessed by the number of representativeconformations of each molecule and, for those systems withmultiple representative conformations, the similarity amongrepresentative conformations. A higher number of repre-sentative conformations indicates a stronger tendency forthat molecule to fluctuate and change shape. The PEG1000molecules have the most representative conformations; thePGG-PTX-PEG1000-npRGD8 and PGG-PTX-PEG1000-npRGD12 molecules are characterized by three representa-tive conformations, although with low significance (∼10–20%). On the contrary, each PEG2000 molecule has onlyone unique shape with very high significance (∼90%).Moreover, the degree of similarity among the representativeconformations is also an indicator of flexibility: a PGG-PTX-PEG-npRGD molecule with two globular representa-tive conformations is less flexible than a moleculecharacterized by globular and filamentous conformations.For instance, PGG-PTX-PEG500-npRGD4 and PGG-PTX-PEG1000-npRGD4 each has two representative conforma-tions, but a larger structural difference exists between theglobular and filamentous shapes of the PGG-PTX-PEG500-npRGD4 molecule, as compared to the two filamentousconformations of the PGG-PTX-PEG1000-npRGD4 mole-cule. In all, these observations show that the PEG2000molecules are the least flexible, whereas the PEG500 andPEG1000 molecules are more flexible and would thereforebind more effectively to tumor cells. Finally, the npRGDligand density does not have a significant effect on theflexibility of a PGG-PTX-PEG-npRGD molecule.
Implications of surface hydrophilicity of a PGG-PTX-PEG-npRGD molecule
Nanoparticles with higher degrees of surface hydrophilicityhave been shown to possess longer circulation half-lives inthe bloodstream, suggesting a higher preference foraccumulating in leaky vasculature of tumors [14]. Thedegree of surface hydrophilicity of each PGG-PTX-PEG-npRGD molecule was assessed by the % SASA of thehydrophilic entities: PGG and PEG (see Table 3). These %SASA values are related to the density plots in Fig. 9. Ingeneral, the high % SASAPGG values can be attributed to
the high density values at r∼3 nm, at the external surface ofthe PGG-PTX-PEG-npRGD molecule. Likewise, the %SASAPEG values are the lowest, which is a result of thehigh concentration of PEG near the center-of-mass and notthe surface. Figure 8 also shows that the densities of PTXand npRGD residues are relatively high near the surface ofa PGG-PTX-PEG-npRGD molecule, but their low molec-ular weight ratio with respect to the entire molecule resultsin lower % SASAPTX and % SASAnpRGD values than %SASAPGG. As expected, the surface hydrophilicityincreases with PEG MW, and an increase in npRGDdensity results in higher % SASAnpRGD. A higher npRGDdensity also tends to cause a decrease in the % SASAphil.While nonpeptide RGD is used to promote active targetingof PGG-PTX to tumor cells, too many nonpeptide RGDligands may decrease surface hydrophilicity, which mayunfavorably decrease to the circulation half-life. PGG-PTX-PEG-npRGD must remain in the bloodstream longenough to diffuse convectively into leaky tumor vascula-ture. At the same time, adequate amounts of nonpeptideRGD ligands must be exposed to the solvent to achieveeffective binding to αVβ3 integrins. Therefore, optimiza-tion of npRGD density is necessary to attain optimalefficacy of PGG-PTX-PEG-npRGD. Taking these factorsinto consideration, the PGG-PTX-PEG-npRGD moleculeswith 8 and 12 npRGD and PEG1000 and PEG2000 MWare most likely to confer the longest circulation half-livesand effective targeting to αVβ3 integrins on tumor cells.
Recommendations
This study was founded on the hypothesis that the degree ofPEGylation (500 Da; 1,000 Da; and 2,000 Da) and npRGDdensity (4, 8, 12, and 16 nonpeptide RGD per PGG-PTX-PEG-npRGD molecule) collectively affect the size, structure,shape, flexibility, and surface hydrophilicity of PGG-PTX-PEG-npRGD. While the size of a PGG-PTX-PEG-npRGDmolecule is consistent at all PEG MW and npRGD densities,the molecular density tends to be is higher at the surface athigher PEG MW. The results also show that the PEG500 andPEG1000molecules exhibited more filamentous behavior andhigher flexibility, whereas the PEG2000 molecules areglobular and more rigid. An increase in the nonpeptideRGD ligand density may result in lower surface hydro-philicity, yet an insufficient number of nonpeptide RGDligands may prevent PGG-PTX-PEG-npRGD from achiev-ing effective targeting to tumor cells. All factors consid-ered, the ideal PGG-PTX-PEG-npRGD candidate wouldpossess the following properties: filamentous shape, highflexibility, and high surface hydrophilicity. Based on theresults, the PGG-PTX-PEG1000-npRGD4 and PGG-PTX-PEG1000-npRGD8 molecules most satisfy these criteriaand are the most promising candidates.
J Mol Model (2011) 17:2973–2987 2985

Conclusions
The roles of shape, flexibility, and surface hydrophilicity ininfluencing the delivery of therapeutic nanoparticles totumors have attracted increasing attention. These factorscan serve as a basis for the design of anticancertherapeutics, such as PGG-PTX-PEG-npRGD. While itmay be technically feasible to determine these propertiesusing experimental methods, the effort required to synthe-size all candidate compounds and subsequently performexperimental testing would be very time- and resource-intensive, especially since the testing is usually conductedin a trial-and-error manner. Therefore, MD simulationswere used to explore the size, shape, flexibility, andsurface hydrophilicity of candidate PGG-PTX-PEG-npRGD compounds in a more efficient and controlledmanner. The theoretical results can be used to furtherguide experiments, potentially shortening the preclinicaldevelopment of PGG-PTX-PEG-npRGD. This study alsointroduces a new structural analysis method of character-izing semiflexible molecules without a specific, crystal-lized conformation.
Acknowledgments Financial support for this work was provided by aUniversity of California Discovery Grant and the Nitto Denko TechnicalCorporation (NDT). S.K.D. and L.Y. are full-time employees of NDT,and S.B.H. and D.A.G. serve as consultants for NDT on an arrangementapproved by the UCSD Conflict of Interest Committee. The authorsacknowledge J. Andrew McCammon for providing the supercomputingcluster resources.
Open Access This article is distributed under the terms of theCreative Commons Attribution Noncommercial License which per-mits any noncommercial use, distribution, and reproduction in anymedium, provided the original author(s) and source are credited.
References
1. Ferrari M (2005) Cancer nanotechnology: opportunities andchallenges. Nat Rev Cancer 5:161–171
2. Amiji MM (2007) Nanotechnology for cancer therapy. CRC, BocaRaton
3. Satchi-Fainaro R, Puder M, Davies JW, Tran HT, Sampson DA,Greene AK, Corfas G, Folkman J (2004) Targeting angiogenesiswith a conjugate of HPMA copolymer and TNP-470. Nat Med10:225–261
4. Kok RJ, Schraa AJ, Bos EJ, Moorlag HE, Asgeirsdottir SA,Everts M, Meijer DKF, Molema G (2002) Preparation andfunctional evaluation of RGD-modified proteins as αVβ3 integrindirected therapeutics. Bioconjug Chem 13:128–135
5. Chen X, Plasencia C, Hou Y, Neamati N (2005) Synthesis andbiological evaluation of dimeric RGD peptide-paclitaxel conjugateas a model for integrin-targeted drug delivery. J Med Chem48:1098–1106
6. Lorger M, Kreuger JS, O'Neal M, Staflin K, Felding-HabermannB (2009) Activation of tumor cell integrin αVβ3 controls
angiogenesis and metastatic growth in the brain. Proc Natl AcadSci USA 106:10666–10671
7. Temming K, Schiffelers RM, Molem G, Kok RJ (2005) RGD-based strategies for selective delivery of therapeutics and imagingagents to the tumour vasculature. Drug Resist Updat 8:381–402
8. Danhier F, Vroman B, Lecouturier N, Crokart N, Pourcelle V,Freichels H, Jérôme C, Marchand-Brynaert J, Feron O, Préat V(2009) Targeting of tumor endothelium by RGD-grafted PLGA-nanoparticles loaded with paclitaxel. J Control Release 2:166–173
9. Bourguet E, Banères JL, Parello J, Lusinchi X, Girard JP, Vidal JP(2003) Nonpeptide RGD antagonists: a novel class of mimetics,the 5, 8-disubstituted 1-azabicyclo[5.2.0]nonan-2-one Lactam.Bioorg Med Chem Lett 13:1561–1564
10. Wang X, Gang Z, Van S, Yu L (2009) Polymer paclitaxelconjugates and methods for treating cancer. USA PatentUS20090226393
11. Pujol JL (2005) Phase II study of carboplatin and weekly paclitaxelas first line treatment of elderly patients with non-small cell lungcancer. Clinical Study Report for Study CA139-368
12. Yoshida T (2009) Rollover study of weekly paclitaxel (BMS-181339) in patients with advanced breast cancer. Clinical StudyReport for Study CA139-387
13. Duncan R (2003) The dawning era of polymer therapeutics. NatRev Drug Discov 2:347–360
14. McNeeley KM, Karathanasis E, Annapragada AV, BellamkondaRV (2009) Masking and triggered unmasking of targeting ligandson nanocarriers to improve drug delivery to brain tumors.Biomaterials 30:3986–3995
15. Farokhzad OC, Langer R (2009) Impact of nanotechnology ondrug delivery. ACS Nano 3:16–20
16. Geng Y, Dalhaimer P, Cai S, Tsai R, Tewari M, Minko T, DischerDE (2007) Shape effects of filaments versus spherical particles inflow and drug delivery. Nat Nanotechnol 2:249–255
17. Decuzzi P, Pasqualini R, Arap W, Ferrari M (2009) Intravasculardelivery of particulate systems: does geometry really matter?Pharma Res 26:235–243
18. Takeoka S (2002) Rolling properties of rGPIbα-conjugatedphospholipid vesicles with different membrane flexibilities onvWf surface under flow conditions. Biochem Biophys ResCommun 296:765–770
19. van Gunsteren WF (1993) Molecular dynamics studies ofproteins. Curr Opin Struct Biol 3:277–281
20. Mark AE, Berendsen HJC, van Gunsteren WF (1991) Conforma-tional flexibility of aqueuous monomeric and dimeric insulin: amolecular dynamics study. Biochemistry 30:10866–10872
21. Daggett V, Levitt M (1992) A model of the molten globule statefrom molecular dynamics simulations. Proc Natl Acad Sci USA89:5142–5146
22. Peng LX, Ivetac A, Van S, Zhao G, Chaudhari AS, Yu L, HowellSB, McCammon JA, Gough DA (2010) Characterization of aclinical polymer-drug conjugate using multiscale modeling.Biopolymers 93:936–951
23. Monticelli L, Kandasamy SK, Periole X, Larson RG, TielemanDP, Marrink SJ (2008) The MARTINI coarse-grained force field:extension to proteins. J Chem Theory Comput 4:819–834
24. Greenfield NJ (2007) Using circular dichroism spectroscopyspectra to estimate protein secondary structure. Nat Protoc1:2876–2890
25. Bernstein FC, Koetzle TF, Williams GJ, Meyer EE Jr, Brice MD,Rodgers JR, Kennard O, Shimanouchi T, Tasumi M (1977) J MolBiol 112:535
26. Frisch MJT et al (1995) Gaussian 94. Gaussian Inc, Pittsburgh27. Cornell WD, Cieplak C, Bayly CI, Kollman PA (1993) Applica-
tion of RESP charges to calculate conformational energies,
2986 J Mol Model (2011) 17:2973–2987

hydrogen bond energies, and free energies of solvation. J AmChem Soc 115:9620–9631
28. Onufriev A, Bashford D, Case DA (2004) Exploring proteinnative states and large-scale conformational changes with amodified Generalized-Born model. Proteins 55:383–394
29. Weiser J, Shenkin PS, Still WC (1999) Approximate atomicsurfaces from linear combinations of pairwise overlaps (LPCO). JComput Chem 20:217–230
30. Hornak V, Abel R, Okur A, Strockbine R, Roitberg A, Simmerl-ing C (2006) Comparison of multiple Amber force fields anddevelopment of improved protein backbone parameters. Proteins65:712–725
31. Cornell WD, Cieplak P, Bayly CI, Gould IR, Merz KM Jr,Ferguson DM, Spellmeyer DC, Fox T, Caldwell JW, Kollman PA(1995) A second generation force field for the simulation ofproteins, nucleic acids, and organic molecules. J Am Chem Soc117:5179–5197
32. Wang J, Rolf RM, Caldwell JW, Kollman PA, Case DA (2004)Development and testing of a general amber force field. J ComputChem 25:1157–1174
33. Ryckaert J, Ciccotti G, Berendsen H (1977) Numericalintegration of the Cartesian equations of motion of a systemwith constraints; molecular dynamics of n-alkenes. J CompPhysiol 23:327–341
34. Marrink SJ, Rissalada JH, Yefimov S, Tieleman DP, de Vries AH(2007) The MARTINI force field: coarse-grained model forbiomolecular simulations. J Phys Chem B 111:7812–7824
35. Trylska J, Tozzini V, McCammon JA (2005) Exploring globalmotions and correlations in the ribosome. Biophys J 89:1455–1463
36. Marrink SJ, de Vries AH, Mark AE (2004) J Phys Chem B108:750–760
37. Cheng LS, Amaro RE, Xu D, Li WW, Arzberger PW, McCammonJA (2008) Ensemble-based virtual screening reveals potential novelantiviral compounds for avian influenza neuraminidase. J Med Chem51:3878–3894
38. Humphrey W, Dalke A, Schulten K (1996) VMD - VisualMolecular Dynamics. J Mol Graph 14:33–38
39. Lindahl E, Hess B, van der Spoel D (2001) GROMACS 3.0: apackage for molecular simulation and trajectory analysis. J MolModel 7:306–317
40. Abe M, Kobayashi Y, Yamamoto S, Daimon Y, Yamaguchi A,Ikeda Y, Ichinoki H, Notaguchi M, Goto K, Araki T (2005) FD, abZIP protein mediating signals from the floral pathway integratorFT at the shoot apex. Science 309:1052–1056
41. Yasui SC, Keiderling TA (1986) Vibrational circular dichroism ofpolypeptides. VI. Polytyrosine alpha-helical and random-coilresults. Biopolymers 25:5–15
J Mol Model (2011) 17:2973–2987 2987
Copyright © 2022 FDOKUMEN