Lanthanide(III) Complexes of Rhodamine–DO3A Conjugates as Agents for Dual-Modal Imaging
10
Lanthanide(III) Complexes of Rhodamine−DO3A Conjugates as Agents for Dual-Modal Imaging Charlotte Rivas, † Graeme J. Stasiuk, † Juan Gallo, † Florencia Minuzzi, ‡ Guy A. Rutter, ‡ and Nicholas J. Long* ,† † Department of Chemistry, Imperial College London, South Kensington, London SW7 2AZ, U.K. ‡ Section of Cell Biology, Division of Diabetes, Endocrinology and Metabolism, Department of Medicine, Imperial College London, South Kensington, London SW7 2AZ, U.K. * S Supporting Information ABSTRACT: Two novel dual-modal MRI/optical probes based on a rhodamine−DO3A conjugate have been prepared. The bis(aqua)gadolinium(III) complex Gd.L1 and mono(aqua)gadolinium(III) complex Gd.L2 behave as dual-modal imaging probes (r 1 = 8.5 and 3.8 mM −1 s −1 for Gd.L1 and Gd.L2, respectively; λ ex = 560 nm and λ em = 580 nm for both complexes). The rhodamine fragment is pH-sensitive, and upon lowering of the pH, an increase in fluorescence intensity is observed as the spirolactam ring opens to give the highly fluorescent form of the molecule. The ligands are bimodal when coordinated to Tb(III) ions, inducing fluorescence from both the lanthanide center and the rhodamine fluorophore, on two independent time frames. Confocal imaging experiments were carried out to establish the localization of Gd.L2 in HEK293 cells and primary mouse islet cells (∼70% insulin-containing β cells). Colocalization with MitoTracker Green demonstrated Gd.L2’s ability to distinguish between tumor and healthy cells, with compartmentalization believed to be in the mitochondria. Gd.L2 was also evaluated as an MRI probe for imaging of tumors in BALB/c nude mice bearing M21 xenografts. A 36.5% decrease in T 1 within the tumor was observed 30 min post injection, showing that Gd.L2 is preferentially up taken in the tumor. Gd.L2 is the first small-molecule MR/fluorescent dual-modal imaging agent to display an off−on pH switch upon its preferential uptake within the more acidic microenvironment of tumor cells. ■ INTRODUCTION Molecular imaging is a rapidly growing area of chemistry that aims to visualize cellular function and structure in a noninvasive manner with the in vivo use of specially designed imaging agents. The combination of magnetic resonance imaging (MRI) and optical imaging offers synergistic advantages over either modality alone. MRI has high spatial resolution and good soft- tissue contrast 1,2 while optical imaging displays high sensitivity and can give information on the local chemical environment. 3 Lanthanide-based optical probes have superior fluorescence properties in comparison to organic fluorophores, with luminescence lifetimes stretching to the millisecond region, and time-gated techniques can be employed in order to eliminate interfering background autofluorescence. 4−6 With the constant advances in cancer treatment, it is becoming increasingly important to detect the early signs of the disease and to establish the efficacy of the concurrent treatment in a noninvasive manner. This can be achieved by the in vivo use of a dual-modal MRI/fluorescent probe that responds to a characteristic trait of tumor cells. 7−9 It is known that the mitochondrial potential in cancer cells is greater than that of healthy cells, 10 and the design of a probe that can accumulate in these energized mitochondria will lead to a tumor-targeting agent. The combination of MRI and fluorescence will allow for improved diagnostic accuracy by tumor localization via MRI imaging and guided surgery via fluorescence imaging. MRI is a noninvasive diagnostic technique that relies on the enhancement of local water proton relaxation. 11,12 Different tissues have different relaxation times, resulting in endogenous Received: September 2, 2013 Published: December 4, 2013 Article pubs.acs.org/IC © 2013 American Chemical Society 14284 dx.doi.org/10.1021/ic402233g | Inorg. Chem. 2013, 52, 14284−14293 Terms of Use CC-BY
-
Upload
independent -
Category
Documents
-
view
2 -
download
0
Transcript of Lanthanide(III) Complexes of Rhodamine–DO3A Conjugates as Agents for Dual-Modal Imaging

Lanthanide(III) Complexes of Rhodamine−DO3A Conjugates asAgents for Dual-Modal ImagingCharlotte Rivas,† Graeme J. Stasiuk,† Juan Gallo,† Florencia Minuzzi,‡ Guy A. Rutter,‡
and Nicholas J. Long*,†
†Department of Chemistry, Imperial College London, South Kensington, London SW7 2AZ, U.K.‡Section of Cell Biology, Division of Diabetes, Endocrinology and Metabolism, Department of Medicine, Imperial College London,South Kensington, London SW7 2AZ, U.K.
*S Supporting Information
ABSTRACT: Two novel dual-modal MRI/optical probes based on a rhodamine−DO3A conjugate have been prepared. Thebis(aqua)gadolinium(III) complex Gd.L1 and mono(aqua)gadolinium(III) complex Gd.L2 behave as dual-modal imagingprobes (r1 = 8.5 and 3.8 mM−1 s−1 for Gd.L1 and Gd.L2, respectively; λex = 560 nm and λem = 580 nm for both complexes). Therhodamine fragment is pH-sensitive, and upon lowering of the pH, an increase in fluorescence intensity is observed as thespirolactam ring opens to give the highly fluorescent form of the molecule. The ligands are bimodal when coordinated to Tb(III)ions, inducing fluorescence from both the lanthanide center and the rhodamine fluorophore, on two independent time frames.Confocal imaging experiments were carried out to establish the localization of Gd.L2 in HEK293 cells and primary mouse isletcells (∼70% insulin-containing β cells). Colocalization with MitoTracker Green demonstrated Gd.L2’s ability to distinguishbetween tumor and healthy cells, with compartmentalization believed to be in the mitochondria. Gd.L2 was also evaluated as anMRI probe for imaging of tumors in BALB/c nude mice bearing M21 xenografts. A 36.5% decrease in T1 within the tumor wasobserved 30 min post injection, showing that Gd.L2 is preferentially up taken in the tumor. Gd.L2 is the first small-moleculeMR/fluorescent dual-modal imaging agent to display an off−on pH switch upon its preferential uptake within the more acidicmicroenvironment of tumor cells.
■ INTRODUCTION
Molecular imaging is a rapidly growing area of chemistry thataims to visualize cellular function and structure in a noninvasivemanner with the in vivo use of specially designed imagingagents. The combination of magnetic resonance imaging (MRI)and optical imaging offers synergistic advantages over eithermodality alone. MRI has high spatial resolution and good soft-tissue contrast1,2 while optical imaging displays high sensitivityand can give information on the local chemical environment.3
Lanthanide-based optical probes have superior fluorescenceproperties in comparison to organic fluorophores, withluminescence lifetimes stretching to the millisecond region,and time-gated techniques can be employed in order toeliminate interfering background autofluorescence.4−6
With the constant advances in cancer treatment, it isbecoming increasingly important to detect the early signs of the
disease and to establish the efficacy of the concurrent treatmentin a noninvasive manner. This can be achieved by the in vivouse of a dual-modal MRI/fluorescent probe that responds to acharacteristic trait of tumor cells.7−9 It is known that themitochondrial potential in cancer cells is greater than that ofhealthy cells,10 and the design of a probe that can accumulate inthese energized mitochondria will lead to a tumor-targetingagent. The combination of MRI and fluorescence will allow forimproved diagnostic accuracy by tumor localization via MRIimaging and guided surgery via fluorescence imaging.MRI is a noninvasive diagnostic technique that relies on the
enhancement of local water proton relaxation.11,12 Differenttissues have different relaxation times, resulting in endogenous
Received: September 2, 2013Published: December 4, 2013
Article
pubs.acs.org/IC
© 2013 American Chemical Society 14284 dx.doi.org/10.1021/ic402233g | Inorg. Chem. 2013, 52, 14284−14293
Terms of Use CC-BY
magnetic resonance contrast. Exogenous agents can be used toenhance this contrast by selectively shortening the T1(longitudinal) or T2 (transverse) relaxation time; these agentsinclude Gd(III) chelates, manganese complexes, and super-paramagnetic nanoparticles.13,14 The most successful andcommonly used of these exogenous agents are complexescontaining the Gd(III) ion because of its high magneticmoment (7.9μB) given by its seven unpaired electrons and itstotally symmetric electronic ground state (8S7/2).
15 Accordingto Solomon−Bloembergen−Morgan theory, the relaxivity ofGd(III) complexes is governed by a number of factors,including the number of bound water molecules (q), therotational tumbling time (rotational correlation time) of thecomplex (τR), and the mean residence lifetime of Gd(III)-bound water molecules (τM).
2 An effective way to increase therelaxivity of a Gd(III) complex is to increase the number ofbound water molecules. Herein we report two novel probespossessing different hydration states. We envisioned that therelaxivity could be improved by decreasing the number ofcoordination sites on the Gd(III) chelate from eight to seven,allowing for a change from one bound water molecule to two. Itis reported however that heptadentate ligands, when bound toGd(III), have unfavorable properties for use as MRI probes interms of thermodynamic and kinetic stability because of thecoordinatively unsaturated nature of the complex.16
Eu(III) and Tb(III) chelates based on a DO3A core havereceived a lot of interest as luminescent lanthanidesystems.17−20 These lanthanides are characterized by theirlong-lived luminescent excited states (ms time scale) andlinelike emission spectra, and their complexes have been shownto be useful in biomedicine as luminescent probes.21
Lanthanide metals or ions however, have low absorptioncoefficients due to Laporte-forbidden f−f transitions.22 This canbe overcome by attaching an aromatic chromophore to themacrocyclic core to act as an “antenna” by transferringabsorbed excitation energy from its triplet excited state to theexcited state of the coordinated lanthanide ion.23 Rhodaminederivatives have received significant attention as fluorescentlabeling agents because of their long absorption and emission
wavelengths, large absorption coefficients, and high quantumyields.24 They have been used in a wide range of applications,having great success as chemosensors (both in vitro and invivo),25,26 protein labels,27 and dual-modal imaging agents.28,29
Rhodamine derivatives have had particular success asmitochondria targets,30−32 as their delocalized organic cationicforms tend to accumulate in the mitochondria of tumor cells asa result of the increased negative mitochondrial potential.33−35
The spiro ring-opening mechanism of rhodamine has also ledto its extensive use as a chemosensor for metal detection as wellas a pH-sensitive probe.36−38 Under acidic conditions, therhodamine moiety exists in its highly fluorescent pink-coloredopen form. Upon addition of OH−, the structure exists in itsspirocyclic form, which is colorless and nonfluorescent.In recent years there have been an increasing number of
reports of multimodal imaging probes wherein two or moreimaging modalities are combined.39,40 The combination ofmodalities leads to probes that give enhanced visualization andimproved reliability of data by synergistically combiningimaging techniques to overcome their inherent disadvantages.MRI gives high anatomical resolution and deep tissuepenetration but lacks sensitivity. Optical imaging, however,boasts high sensitivity but has limited tissue penetration. Asdiscussed earlier, the combination of the two techniques yieldsa probe that is able to provide a more complete picture of thebiological area of interest. There are few reports of dual-modalMRI/optical imaging agents in the literature that are not ofnanoparticle nature. These include Gou et al.’s description ofthe binding of a cyanine−DTPA conjugate to BSA to affordrelaxivity rate constants of 15 mM−1 s−1.41 The aliphatic natureof the chelate is unfavorable, however, as release of Gd(III) ionsinto the body from these types of complexes has been related tonephrogenic systemic fibrosis (NSF).42 In 1998, it was reportedthat a rhodamine−Gd(III) complex conjugate showed no MRIcontrast enhancement when introduced to Xenopus laevisembryos.43 The same complex conjugate, Gd(Rhoda-DOTA),was studied alongside a series of hydrophobic fluorescent dye−Gd(III) complex conjugates in 2011 by Yamane et al.,44 whofound that incorporation of the hydrophobic fluorescent moiety
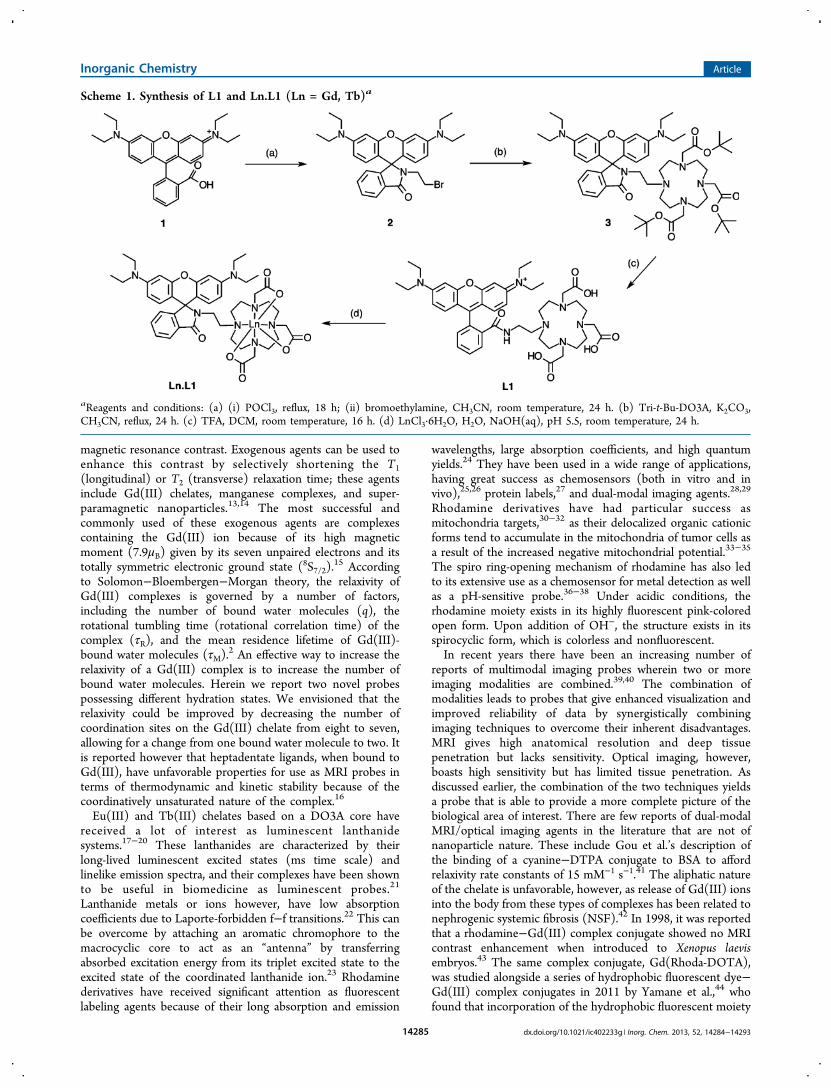
Scheme 1. Synthesis of L1 and Ln.L1 (Ln = Gd, Tb)a
aReagents and conditions: (a) (i) POCl3, reflux, 18 h; (ii) bromoethylamine, CH3CN, room temperature, 24 h. (b) Tri-t-Bu-DO3A, K2CO3,CH3CN, reflux, 24 h. (c) TFA, DCM, room temperature, 16 h. (d) LnCl3·6H2O, H2O, NaOH(aq), pH 5.5, room temperature, 24 h.
Inorganic Chemistry Article
dx.doi.org/10.1021/ic402233g | Inorg. Chem. 2013, 52, 14284−1429314285
improves cell permeability compared to Gd(DOTA). Theyreported that Gd(Rhoda-DOTA) showed a large increase in r1relaxivity when bound to albumin and efficient cell permeationwhen incubated with HeLa cells. Again, however, no significantchange in the MR signal of HeLa cells was observed in thepresence of the complex, even though its fluorescence wasobserved by microscopy. Similarly, a rhodamine moiety haspreviously been conjugated to DO3A and consequently labeledwith 64Cu to arrive at a dual-modal PET/optical probe.29 It wasfound that 64Cu(DOTA-LRB) had a surprisingly high tumoruptake compared with other 64Cu-labeled organic cations. Theprobe was able to selectively localize to the tumor mitochondriawith long tumor retention times.45 The probe and itsderivatives have been the subjects of extensive in vitro and invivo studies showing that there is promise for a Gd(III) MRI/optical analogue to be as successful in vivo.In this paper, we report two novel methods for conjugating
fluorescent rhodamine derivatives to DO3A. We evaluated thetwo rhodamine−DO3A Gd(III) derivatives as multimodalMRI/optical imaging agents by measuring their relaxivity andfluorescence properties as well as their in vitro tumor cellularlocalization. The Tb(III) analogues were synthesized to assesstheir dual-luminescence properties, and it was found that theorganic and metal-based luminescence can be separated ondifferent time scales.
■ RESULTS AND DISCUSSION
Synthesis. Two new synthetic routes were developed toobtain L1 and L2 (outlined in Schemes 1 and 2, respectively),
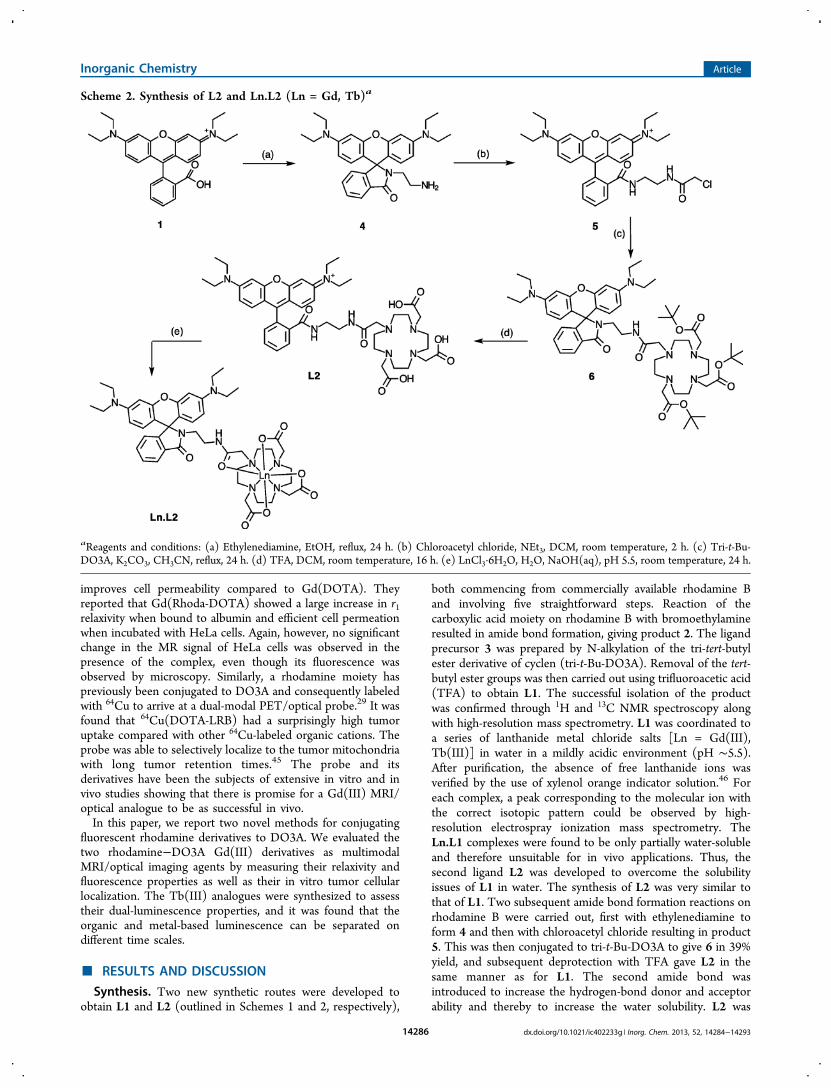
both commencing from commercially available rhodamine Band involving five straightforward steps. Reaction of thecarboxylic acid moiety on rhodamine B with bromoethylamineresulted in amide bond formation, giving product 2. The ligandprecursor 3 was prepared by N-alkylation of the tri-tert-butylester derivative of cyclen (tri-t-Bu-DO3A). Removal of the tert-butyl ester groups was then carried out using trifluoroacetic acid(TFA) to obtain L1. The successful isolation of the productwas confirmed through 1H and 13C NMR spectroscopy alongwith high-resolution mass spectrometry. L1 was coordinated toa series of lanthanide metal chloride salts [Ln = Gd(III),Tb(III)] in water in a mildly acidic environment (pH ∼5.5).After purification, the absence of free lanthanide ions wasverified by the use of xylenol orange indicator solution.46 Foreach complex, a peak corresponding to the molecular ion withthe correct isotopic pattern could be observed by high-resolution electrospray ionization mass spectrometry. TheLn.L1 complexes were found to be only partially water-solubleand therefore unsuitable for in vivo applications. Thus, thesecond ligand L2 was developed to overcome the solubilityissues of L1 in water. The synthesis of L2 was very similar tothat of L1. Two subsequent amide bond formation reactions onrhodamine B were carried out, first with ethylenediamine toform 4 and then with chloroacetyl chloride resulting in product5. This was then conjugated to tri-t-Bu-DO3A to give 6 in 39%yield, and subsequent deprotection with TFA gave L2 in thesame manner as for L1. The second amide bond wasintroduced to increase the hydrogen-bond donor and acceptorability and thereby to increase the water solubility. L2 was
Scheme 2. Synthesis of L2 and Ln.L2 (Ln = Gd, Tb)a
aReagents and conditions: (a) Ethylenediamine, EtOH, reflux, 24 h. (b) Chloroacetyl chloride, NEt3, DCM, room temperature, 2 h. (c) Tri-t-Bu-DO3A, K2CO3, CH3CN, reflux, 24 h. (d) TFA, DCM, room temperature, 16 h. (e) LnCl3·6H2O, H2O, NaOH(aq), pH 5.5, room temperature, 24 h.
Inorganic Chemistry Article
dx.doi.org/10.1021/ic402233g | Inorg. Chem. 2013, 52, 14284−1429314286
complexed with Gd(III) and Tb(III) as above, and thecomplexes Ln.L2 were found to be water-soluble.Photophysical Properties. Complexes Ln.L1 and Ln.L2
(Figure 1) behave as dual-modal MRI/optical imaging probeswith Gd(III) and dual-luminescent probes with Tb(III). In thissection, we discuss the photophysical properties of bothsystems. The photophysics of the two ligands with Gd(III)
were found to be very similar, as they exhibited fluorescenceemission at 580 nm upon excitation at 560 nm. This shortStokes shift and orange fluorescence was expected, as thefluorescence properties of rhodamine and its derivatives havebeen extensively studied.47 Modification of the carboxylic acidmoiety of rhodamine B does not lead to significant changes inthe photophysical properties of the chromophore, as no
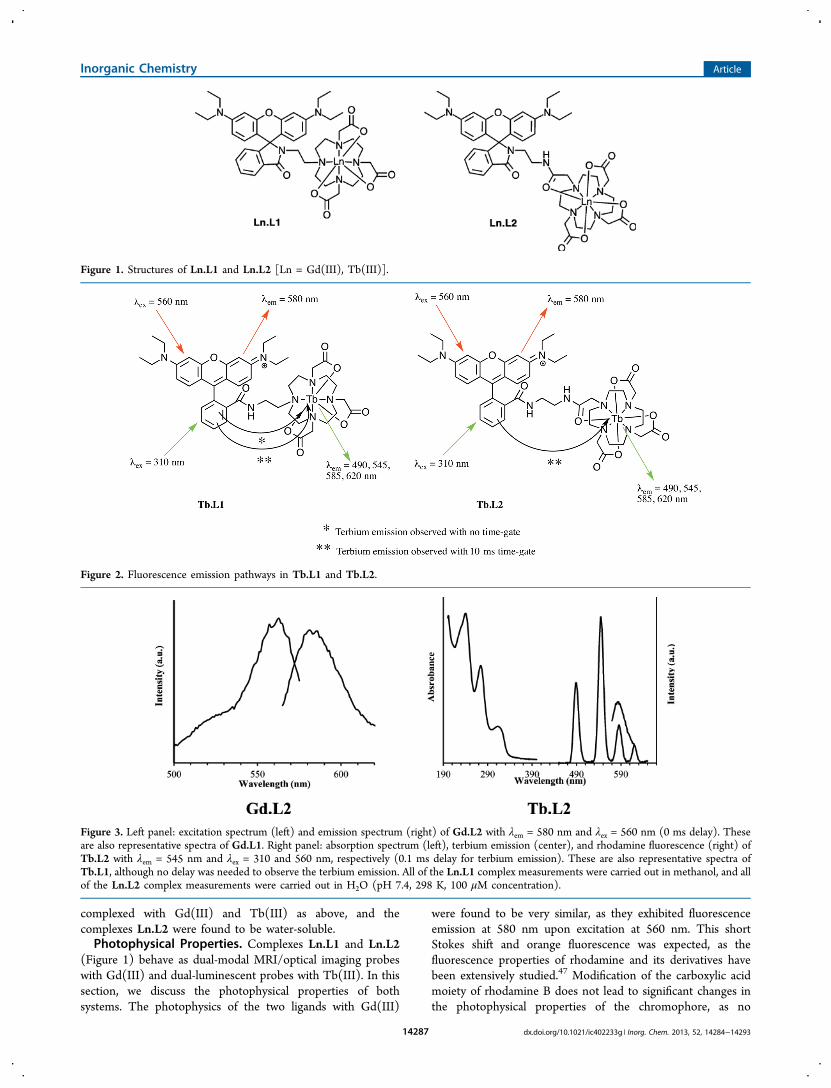
Figure 1. Structures of Ln.L1 and Ln.L2 [Ln = Gd(III), Tb(III)].
Figure 2. Fluorescence emission pathways in Tb.L1 and Tb.L2.
Figure 3. Left panel: excitation spectrum (left) and emission spectrum (right) of Gd.L2 with λem = 580 nm and λex = 560 nm (0 ms delay). Theseare also representative spectra of Gd.L1. Right panel: absorption spectrum (left), terbium emission (center), and rhodamine fluorescence (right) ofTb.L2 with λem = 545 nm and λex = 310 and 560 nm, respectively (0.1 ms delay for terbium emission). These are also representative spectra ofTb.L1, although no delay was needed to observe the terbium emission. All of the Ln.L1 complex measurements were carried out in methanol, and allof the Ln.L2 complex measurements were carried out in H2O (pH 7.4, 298 K, 100 μM concentration).
Inorganic Chemistry Article
dx.doi.org/10.1021/ic402233g | Inorg. Chem. 2013, 52, 14284−1429314287
electronic or structural changes occur on the xanthene core, soa very small bathochromic shift is observed (rhodamine B: λex =553 nm, λem = 572 nm in ethanol).The photophysical properties of the Tb(III) analogues were
investigated (Figure 2). Under excitation at λex = 310 nm,complex Tb.L1 displays exclusively green emission arising from5D4−7FJ transitions of terbium. The rhodamine-centeredemission is of a very low intensity in comparison with theTb(III) emission, indicating efficient ligand-to-lanthanideenergy transfer. At λex = 560 nm, emission is seen at 580 nm,featuring fluorescence from the xanthene core. Therefore, twofluorescence pathways are available to Tb.L1: emission via thelanthanide with energy transfer from rhodamine and directexcitation of the xanthene core. Conversely, under excitation atλex = 310 nm, the emission spectrum of complex Tb.L2 isdominated by rhodamine emission at 580 nm. Applying a 0.1ms delay to the fluorescence measurement allowed for isolationof the short-lived organic fluorescence of the rhodamine moietyfrom the long-lived lanthanide luminescence in both complexes.The extra amide bond in L2 renders the complex water-solublebut also introduces a quenching pathway. The additional N−Hbond is close to the lanthanide center, and fluorescencedeactivation may occur via the N−H vibrational energy leveloscillator.48
Therefore, when complexed with a luminescent lanthanideion, both ligands behave as dual-luminescent probes. In bothTb.L1 and Tb.L2, excitation at 560 nm leads to emission fromthe organic chromophore at 580 nm, with the fluorescenceoriginating from the xanthene core. Using time-gatingtechniques, Tb(III) emission is induced in both complexesupon excitation of the isolated phenyl ring of the rhodaminemoiety at 310 nm by energy transfer to the Tb(III) metalcenter (Figures 2 and 3). In Tb.L1 only, Tb(III) emission canbe seen upon excititation at 310 nm without the use of a timedelay. The quantum yields of both terbium complexes weredetermined, and the results were in agreement with theobserved spectra, confirming the efficient energy transfer to theterbium metal center in Tb.L1 (Φ = 18.6%) and the inefficientenergy transfer in Tb.L2 (Φ = 0.8%).The luminescence decays of the Tb(III) complexes in both
H2O and D2O were also measured (see the SupportingInformation). The luminescence lifetimes in D2O wereincreased in comparison to H2O because less nonradiativedeactivation was induced by O−D vibrations than by O−Hvibrations.49 From these differences in the rates of energytransfer to H2O and D2O oscillators, the hydration state can becalculated using eq 1, in which the term 0.06 reflects the
quenching effect of unbound water molecules and n is thenumber of coordinated secondary amide groups, reflecting thequenching effect of the proximate NH oscillators.50 Theemission decays were fitted to monoexponential decays, andthe corresponding lifetime measurements of both terbiumcomplexes confirmed the expected coordination numbers ofseven for Tb.L1 and eight for Tb.L2 (Table 1).Relaxometric Studies. T1 measurements of the Gd(III)
complexes were performed at 400 MHz (9.4 T, 25 °C), andtheir r1 values were determined. The r1 values of 8.5 and 3.8mM−1 s−1 obtained for complexes Gd.L1 and Gd.L2,respectively, were within the range for Gd(III) chelates with
hydration states of two and one respectively. These hydrationstates were confirmed by the lifetime measurements of theterbium analogues.It is well-known that the presence of hydrophobic moieties
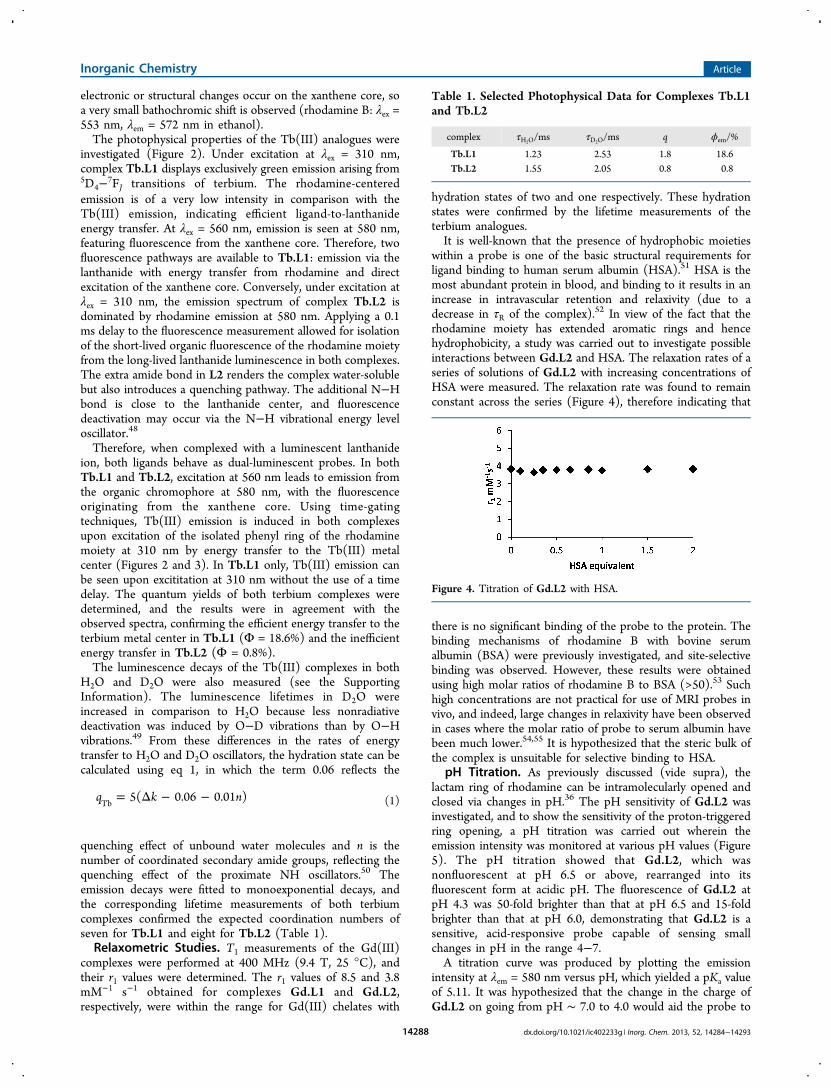
within a probe is one of the basic structural requirements forligand binding to human serum albumin (HSA).51 HSA is themost abundant protein in blood, and binding to it results in anincrease in intravascular retention and relaxivity (due to adecrease in τR of the complex).52 In view of the fact that therhodamine moiety has extended aromatic rings and hencehydrophobicity, a study was carried out to investigate possibleinteractions between Gd.L2 and HSA. The relaxation rates of aseries of solutions of Gd.L2 with increasing concentrations ofHSA were measured. The relaxation rate was found to remainconstant across the series (Figure 4), therefore indicating that
there is no significant binding of the probe to the protein. Thebinding mechanisms of rhodamine B with bovine serumalbumin (BSA) were previously investigated, and site-selectivebinding was observed. However, these results were obtainedusing high molar ratios of rhodamine B to BSA (>50).53 Suchhigh concentrations are not practical for use of MRI probes invivo, and indeed, large changes in relaxivity have been observedin cases where the molar ratio of probe to serum albumin havebeen much lower.54,55 It is hypothesized that the steric bulk ofthe complex is unsuitable for selective binding to HSA.
pH Titration. As previously discussed (vide supra), thelactam ring of rhodamine can be intramolecularly opened andclosed via changes in pH.36 The pH sensitivity of Gd.L2 wasinvestigated, and to show the sensitivity of the proton-triggeredring opening, a pH titration was carried out wherein theemission intensity was monitored at various pH values (Figure5). The pH titration showed that Gd.L2, which wasnonfluorescent at pH 6.5 or above, rearranged into itsfluorescent form at acidic pH. The fluorescence of Gd.L2 atpH 4.3 was 50-fold brighter than that at pH 6.5 and 15-foldbrighter than that at pH 6.0, demonstrating that Gd.L2 is asensitive, acid-responsive probe capable of sensing smallchanges in pH in the range 4−7.A titration curve was produced by plotting the emission
intensity at λem = 580 nm versus pH, which yielded a pKa valueof 5.11. It was hypothesized that the change in the charge ofGd.L2 on going from pH ∼ 7.0 to 4.0 would aid the probe to
= Δ − −q k n5( 0.06 0.01 )Tb (1)
Table 1. Selected Photophysical Data for Complexes Tb.L1and Tb.L2
complex τH2O/ms τD2O/ms q ϕem/%
Tb.L1 1.23 2.53 1.8 18.6Tb.L2 1.55 2.05 0.8 0.8
Figure 4. Titration of Gd.L2 with HSA.
Inorganic Chemistry Article
dx.doi.org/10.1021/ic402233g | Inorg. Chem. 2013, 52, 14284−1429314288

localize in the more acidic microenvironment of tumor cells.56
It has been shown that the microenvironment of tumor cells ismore acidic than that of healthy tissues (Warburg effect). Uponentering an acidic environment, the probe can undergorearrangement to its ring-opened form, which is fluorescent.This cationic acid form of the probe would then be expected toaccumulate in the mitochondria.57
In Vitro/in Vivo Studies. To test the viability of Gd.L2 as adual-modal agent for cancer imaging, in vivo and in vitrostudies were carried out. Because of a lack of water solubility,no in vivo studies could be carried out on L1 complexes. Theaddition of an extra amide functionality within L2 introducedwater solubility, and this allowed for the investigation of itsbiological properties via in vitro and in vivo studies. Cellpenetration is crucial for the use of imaging probes in themonitoring of biological mechanisms. To this end, preliminaryin vitro cell studies were carried out using Gd.L2. Rhodaminehas been widely used to determine the mitochondrial potentialin tumor cells.9 The negative mitochondrial potential isreported to be greater in tumor cells than in normal cells,and organic cations such as rhodamine have been shown toaccumulate in the energized mitochondria.57,58 With this inmind, colocalization experiments were undertaken wherein aknown mitochondrial stain (MitoTracker Green FM) wastested against Gd.L2. Confocal microscopy images of humanembryonic kidney (HEK293) cells and primary mouse isletcells (∼70% insulin-containing β cells) were recorded after a 30min incubation with Gd.L2 and MitoTracker Green (Figure 6).
Images B, C and E, F in Figure 6 show clear accumulation ofGd.L2 within each cell type. However, a clear colocalization ofGd.L2 and MitoTracker was not evident (Figure 6C, box).Moreover, we noted that in cells where significant uptake ofGd.L2 was apparent (as indicated in the primary cells in D−F),MitoTracker accumulation was lower and more diffuse than inneighboring cells, and little, if any, colocalization of red andgreen staining was evident (Figure 6F). These findings areprobably best explained by the fact that the Gd.L2 fluorescence,which is strongly suppressed at pH >6.5 (Figure 5B), is onlyreadily detectable in cells in which mitochondria are relativelydepolarized, such that the mitochondrial matrix pH falls tolevels permissive of Gd.L2 fluorescence. Such mitochondria,however, are expected to be poorly able to retain MitoTracker,whose accumulation depends on the inner mitochondrialmembrane potential and the pH gradient (i.e., high intra-mitochondrial pH >7). These results are thus consistent withthe known properties of both MitoTracker and Gd.L2 but areunable to definitively establish a mitochondrial localization ofthe latter.BALB/c nude mice with neck M21 (human melanoma cell)
xenograft implantations were injected intravenously with 0.1mmol kg−1 Gd.L2. The mice were imaged in a 4.7 T MRIinstrument at different times (preinjection, 30 min postinjection, and 60 min post injection) to evaluate the effect ofthe contrast agent. Thirty minutes after the injection of Gd.L2,a 36.5% decrease in tumor average T1 was observed comparedwith the baseline of the preinjection image (Figure 7a,b). Thisdecrease in longitudinal relaxation time was retained at least up
Figure 5. Upper panel: pH-mediated ring opening of the intramolecular sprirolactam of Gd.L2, yielding a highly fluorescent species. Lower panels:(a) pH-dependent emission spectra of Gd.L2 (λex = 560 nm, λem = 580 nm); (b) pH titration curve used to determine pKa.
Inorganic Chemistry Article
dx.doi.org/10.1021/ic402233g | Inorg. Chem. 2013, 52, 14284−1429314289

to 60 min (31.3% decrease; Figure 7c). These preliminaryimages demonstrate that Gd.L2 functions successfully in vivoby shortening the T1 of protons in the tumor sufficiently so asto give a more detailed image. The observed accumulation ofGd.L2 in the tumor area is consistent with the predicted effectof a lower pH environment on the probe; the rearrangement ofthe lactam ring at acidic pH introduces a positive charge in themolecule that can promote the intracellular uptake of themolecule responsible of the average T1 decrease observed in thetumor.
■ CONCLUSIONSWe have reported the preparation and full characterization oftwo rhodamine−DO3A conjugate derivatives. The DO3A unitshave been coordinated to paramagnetic Gd(III) andluminescent Tb(III) centers. Complexation with Tb(III) givesdual-luminescent probes with two different time scales, andphotophysical data collected also show the impact of distance
of the sensitizer and linker design from the lanthanide metalcenter on the efficiency of energy transfer. When complexedwith Gd(III), they form dual-modal MRI/fluorescent probes.Ln.L2 is water-soluble and suitable for in vitro/in vivo studies,and Gd.L2 has r1 = 3.84 mM−1 s−1 (9.4 T, 25 °C) and has beenshown to be viable both in vitro and in vivo. The pH sensitivityof the probe means that it functions as an “off−on” luminescentprobe that is sensitive to the small pH changes within cells. Bycoexpression with a known mitochondrial stain, the probe hasbeen hypothesized to localize in the mitochondria of HEK cells.These studies demonstrate that the probe is cell-penetrating,has a pH sensitivity to acidic microenvironments, and is atumor specific, dual-modal MRI/fluorescent contrast agent.
■ EXPERIMENTAL SECTIONMaterials and Conditions. No special precautions were taken to
exclude air or moisture during reactions or workups, unless otherwisestated. Products 259 and 460 were prepared via literature methods from
Figure 6. (A−C) Confocal microscopy images of HEK cells. Cells were incubated with 215 mM Gd.L2 and 100 nM MitoTracker Green for 30 min,washed twice with KREBS buffer, and visualized under a fluorescence microscope. (A) MitoTracker Green signal. (B) Gd.L2 signal. (C) Mergedsignals. Scale bar: 50 μm. (D−F) Confocal microscopy images of dissociated primary mouse islet cells. Cells were incubated with 215 mM Gd.L2and 100 nM MitoTracker Green for 30 min, washed twice with KREBS buffer, and visualized under a fluorescence microscope. (D) MitoTrackerGreen signal. (E) Gd.L2 signal. (F) Merged signals. Scale bar: 50 μm.
Figure 7. Parametric T1 maps of a BALB/c nude mouse tumor: (a) preinjection; (b) 30 min post injection with Gd.L2; (c) 60 min post injectionwith Gd.L2. Scale bars in ms.
Inorganic Chemistry Article
dx.doi.org/10.1021/ic402233g | Inorg. Chem. 2013, 52, 14284−1429314290

commercially available starting materials. All other materials werepurchased from commercial suppliers and used without furtherpurification.Instrumentation. 1H and 13C{1H} NMR spectra were recorded at
ambient temperature on a Bruker 400 MHz spectrometer andinternally referenced to the residual solvent peaks of CDCl3 at 7.26ppm (1H) and 77.16 ppm (13C{1H}) or MeOD at 3.31 ppm (1H) and49.15 ppm (13C{1H}). 13C{1H} spectra were fully assigned wherepossible using 2D correlation spectroscopy. Mass spectrometryanalyses were conducted by the Mass Spectrometry Service, ImperialCollege London. Microanalyses were carried out by Stephen Boyer ofthe Science Centre, London Metropolitan University. ICP-MS analysiswas carried out by Stanislav Strekopytov of the Natural HistoryMuseum.Fluorescence Measurements. Absorption and fluorescence
spectra of all complexes in either aqueous or methanolic solutionsdepending on solubility were obtained at room temperature on aPerkinElmer Lambda 25 spectrometer and a Cary Varian luminescencespectrometer (using SCAN for Windows), respectively. Samples wereheld in 10 mm × 4 mm quartz Hellma cuvettes. Lifetimes weremeasured by direct excitation of the sample at 325 nm with a 40 mspulse of light (50 pulses per point) followed by monitoring of theintegrated intensity of light emitted at 545 nm during a fixed gate timeof 0.1 ms at a delay time later. Delay times were set at 0.1 ms, coveringfour or more lifetimes. Excitation and emission slits were set to 10:10nm bandpass respectively. The obtained decay curves were fitted to asimple monoexponential first-order decay curve using Microsoft Excel.Fluoresence quantum yields of terbium complexes were determinedfrom the integrated fluorescence intensities of the complexes followinga previously reported method61 using the reference compound62
Na3[Tb(dpa)3] in water or methanol at 279 nm (quantum yield =26.5% or 18.2%, respectively).pH Titration. A 1.49 mM solution of Gd.L2 in 0.1 M NaCl (1 mL)
was prepared, from which 15 × 67 μL aliquots (microlitre pipet,Eppendorf) were taken. Each aliquot was adjusted to the required pHusing a digital pH meter (Jenway 3510) equipped with a glasselectrode (Jenway 924005). The pH was monitored and adjusted toacidic or basic conditions using small aliquots of a 1 M HCl or 1 MNaOH solution, respectively. The pH was allowed to stabilize. Thesolution was then added to a quartz cuvette for fluorescence analysis.The fluorimeter was operated using an excitation slit width of 10 nmand an emission slit width of 2.5 nm.Relaxivity Measurements. Gd.L1 was dissolved in a methanol/
water (50:50) solvent mixture to give a solution of concentration 5mM. Gd.L2 was dissolved in water to give a solution concentration of5 mM. The resulting solutions were placed in 1.7 mm diametercapillaries, which were sealed. The 1/T1 measurements wereperformed on a Bruker Avance 400 spectrometer (400 MHz). Theseexperiments were carried out a minimum of three times, and therelaxivity results given are averages of all experiments. Theconcentration of Gd(III) was checked by the chemical shiftmeasurement of HOD induced by magnetic susceptibility.63
HSA Relaxivity Titration. A 1.49 mM solution of Gd.L2 in 0.1 MNaCl (pH 7.4) was prepared, from which 10 × 67 μL aliquots weretaken. To each aliquot was added an aliquot of a 2 mM solution ofHSA (0.1 M NaCl, pH 7.4) to give 10 different sample concentrations(0, 0.1, 0.25, 0.35, 0.5, 0.65, 0.85, 1, 1.5, and 2 equiv of HSA). Thesolutions were made up to a volume of 100 μL by addition of waterwhere required. The resulting solutions were placed in 1.7 mmdiameter capillaries, which were sealed. The 1/T1 measurements wereperformed on a Bruker Avance 400 spectrometer (400 MHz).In Vivo Tumor Models. All of the animal experiments were
performed by licensed investigators in accordance with the UnitedKingdom Home Office Guidance on the Operation of the Animal(Scientific Procedures) Act 1986 and in keeping with the newlypublished guidelines for the welfare and use of animals in cancerresearch.64 Female BALB/c nude mice (aged 6−8 weeks; Harlan)were used. M21 cells were injected subcutaneously on the back of mice(5 × 10⁶ cells in 100 μL of sterile PBS). Animals were used when thexenografts reached ∼100 mm3. Tumor dimensions were measured
continuously using calipers, and tumor volumes (V) were calculatedusing the equation V = πabc/6, where a, b, and c represent the lengthsof the three orthogonal axes of the tumor.
In Vivo MRI. In vivo MRI was performed in a 4.7 T horizontal-boreDirectDrive MRI system (Varian, Palo Alto, CA, USA) equipped with40 G/cm actively shielded gradients (VnmrJ 3.1). For imaging of thetumors and generation of the T1 parametric maps, a 45 mm diametersaddle coil was used in transmit mode and a separate 20 mm diameterstripline resonator was used as a surface coil to accommodate thetumors.65 Imaging was performed with an inversion recovery (IR)sequence and the following parameters: axial images; FOV = 35 × 35mm; No slices = 14; slice thickness = 1 mm (zero slice gap); imagebandwidth = 156 kHz; TR = 4500 ms; TI = 6, 14.6, 35.4, 86.1, 209,508, 1230, or 3000 ms; NA = 2; image matrix = 192 × 192; TA = 12min. During imaging, animals were anesthetized with 2% isofluoraneand respiration and body temperature were monitored via SAphysiological monitoring systems (SA Instruments, Stony Brook,NY, USA). Body temperature was monitored by a rectal probe andmaintained at 35 ± 1 °C. T1 maps were generated in ImageJ66 byfitting the acquired data to the equation S = S0[1 − 2 exp(−TI/T1)],where TI is the inversion time and T1 is the longitudinal relaxationtime. In order to assign the signal with the appropriate sign for thefitting process, the χ2 value of the fit was evaluated during the fitting.ROIs were then drawn on the T1 maps to delineate the whole tumorwith consideration to avoid the edges of the tumor and thuscontamination from neighboring tissues and partial volume effects.
In Vitro Cell Culture and Imaging. HEK293 cells were culturedin DMEM (Lonza) supplemented with 10% fetal bovine serum (FBS)(Lonza), 1% glutamine (Lonza), and 1% penicillin/streptomycin(Gibco). On the day of visualization, cells were washed twice withKREBS buffer (140 mM NaCl, 3.6 mM KCl, 0.5 mM NaH2PO4, 0.2mM MgSO4, 1.5 mM CaCl2, 10 mM HEPES, pH 7.4, 2 mMNaHCO3) pre-equilibrated with 95:5 O2/CO2 and containing 25 mMglucose. Cells were then incubated with KREBS buffer containing 215mM Gd.L2 and 100 nM MitoTracker Green for 30 min and washedtwice with KREBS buffer before visualization. Images were capturedusing a Zeiss Axiovert confocal microscope coupled to a Nipkowspinning-disk head (Yokogawa CSU-10) using a 63× oil objective. Asolid-state laser (CrystaLaser) controlled by a laser-merge module(Spectral Applied Physics) provided wavelengths of 491 nm to exciteMitoTracker Green (emission filtered at 525 nm) and 561 nm toexcite Gd.L2 (emission filtered at 620 nm). Images were captured by ahighly sensitive 16-bit, 512 × 512 pixel back-illuminated EM-CCDcamera (ImageEM 9100-13, Hamamatsu). Volocity software (Perki-nElmer) provided the user interface.
In Vivo Tissue Isolation and Imaging. Islet isolation was carriedout as shown in ref 67. In short, a female CD1 mouse (8−12 weeksold) was sacrificed by cervical dislocation. The pancreas was injectedwith 1 mg/mL collagenase solution through the bile duct and excised.The pancreas was digested by heating with collagenase solution, andislets were isolated through the use of ficoll gradient centrifugation.Islets were hand-picked and kept at 37 °C in Islet medium (RPMIsupplemented with 10% FBS and 1% penicillin/streptomycin). Isletswere dispersed into clusters and single cells according to the procedurein ref 67. Briefly, islets were incubated with Hank’s based enzyme-freedissociation buffer (Invitrogen, Paisley, UK) and centrifuged. All but 1mL of the supernatant was removed, and the pellet was resuspendedvigorously via pipetting. The cells were washed and resuspended withRPMI 1640 and then loaded onto a poly-L-lysine-treated coverslip. Onthe day of visualization, cells were washed twice with KREBS buffer(140 mM NaCl, 3.6 mM KCl, 0.5 mM NaH2PO4, 0.2 mM MgSO4, 1.5mM CaCl2, 10 mM HEPES, pH 7.4, 2 mM NaHCO3) pre-equilibratedwith 95:5 O2/CO2 and containing 25 mM glucose. Cells were thenincubated with KREBS buffer containing 215 mM Gd.L2 and 100 nMMitoTracker Green for 30 min and washed twice with KREBS bufferbefore visualization. Images were captured using a Zeiss Axiovertconfocal microscope coupled to a Nipkow spinning-disk head(Yokogawa CSU-10) using a 63× oil objective. A solid-state laser(CrystaLaser) controlled by a laser-merge module (Spectral AppliedPhysics) provided wavelengths of 491 nm to excite MitoTracker Green
Inorganic Chemistry Article
dx.doi.org/10.1021/ic402233g | Inorg. Chem. 2013, 52, 14284−1429314291
(emission filtered at 525 nm) and 561 nm to excite Gd.L2 (emissionfiltered at 620 nm). Images were captured by a highly sensitive 16-bit,512 × 512 pixel back-illuminated EM-CCD camera (ImageEM 9100-13, Hamamatsu). Volocity software (PerkinElmer) provided the userinterface.Synthesis of 3. DO3A-t-Bu-ester (0.16 g, 0.28 mmol) and K2CO3
(0.05 g, 0.34 mmol) were dissolved in MeCN (5 mL), and the mixturewas stirred for 5 min. 2 (0.15 g, 0.28 mmol) in MeCN (15 mL) wasadded dropwise. The reaction mixture was heated to refluxtemperatures for 24 h. The resulting solution was filtered, and thefiltrate was concentrated under reduced pressure. The crude productwas purified by silica gel chromatography with 1−20% MeOH/DCM,1% NH3 solution (28%), affording 3 as a beige solid (0.21 g, 37%). 1HNMR (400 MHz, CDCl3): δ 1.18 (t, 12H, 3JHH = 7.1 Hz), 1.43 (s, 27H), 2.09−2.15 (m, 2H), 2.29−3.06 (m, 16H), 3.13−3.19 (m, 2H),3.36 (q, 8H, 3JHH = 7.4 Hz), 3.50 (s, 6H), 6.23−6.43 (m, 6H), 7.04−7.08 (m, 1H), 7.41−7.47 (m, 2H), 7.81−7.84 (m, 1H). 13C NMR(100 MHz, CDCl3): δ 12.6, 28.0, 30.9, 36.0, 44.3, 46.2, 49.6, 51.0,53.5, 55.8, 56.4, 65.2, 82.0, 82.4, 97.9, 105.1, 107.8, 122.6, 123.8, 128.0,128.7, 131.0, 132.4, 148.8, 153.4, 153.5, 168.4, 172.5. ESI-HRMS:calcd for C56H83N7O8 982.6381, found m/z 982.6398.Synthesis of L1. 3 (0.20 g, 1 mmol) was dissolved in CH2Cl2 (2
mL), and trifluoroacetic acid (2 mL) was added dropwise. Thesolution was stirred at room temperature, open to air, for 24 h. Thesolvents were removed in vacuo, and the residue was redissolved inCH2Cl2. This was repeated with diethyl ether and again with CH2Cl2until L1 was obtained as a bright-pink solid (0.16 g, 96%). 1H NMR(400 MHz, CDCl3): δ 1.17 (t, 12H, 3JHH = 7.2 Hz), 3.06−3.71 (m,24H), 4.20 (m, 2H), 6.54−6.75 (m, 6H), 7.14 (d, 1H), 7.60−7.64 (m,2H), 7.80 (d, 1H). 13C NMR (100 MHz, CDCl3): δ 11.06, 34.14,45.42, 45.63, 48.18, 49.33, 51.97, 52.26, 54.41, 110.36, 122.90, 124.22,126.14, 128.62, 128.82, 129.83, 133.57, 153.00, 153.35, 160.78, 169.12.ESI-HRMS: calcd for C44H60N7O8 814.4503, found m/z 814.4503.Synthesis of Gd.L1. L1 (0.04 g, 0.05 mmol) and GdCl3·6H2O
(0.01 g, 0.03 mmol) were dissolved in water (2 mL), and the pH wasadjusted to 5.5 using 1 M NaOH solution. The mixture was stirred atroom temperature for 24 h. The reaction precipitate was filtered andthen dissolved in DCM. The organic layer was washed with water andthen dried over MgSO4. Addition of ether to this solution precipitatedGd.L1 as a pale-beige powder (0.022 g, 84%). ESI-HRMS: calcd forC44H57N7O8Gd 969.3510, found m/z 969.3569.Synthesis of Tb.L1. The complex was prepared by an method
analogous to that for Gd.L1 using L1 (0.26 g, 0.32 mmol) and TbCl3·6H2O (0.06 g, 0.16 mmol) to yield Tb.L1 as a pale-beige solid (0.12 g,80%). ESI-HRMS: calcd for C44H57N7O8Tb 970.3522, found m/z970.3555.Synthesis of 5. 4 (0.50 g, 1.03 mmol) was dissolved in DCM (10
mL), and NEt3 (0.1 mL, 1.24 mmol) was added. The reaction mixturewas cooled to 0 °C using an ice bath, and chloroacetyl chloride (0.1mL, 1.24 mmol) in DCM (5 mL) was then added dropwise. Thereaction mixture was allowed to come to room temperature. Thesolution was stirred at room temperature for 5 h, and then the solventwas removed under reduced pressure. The resultant solid wasdissolved in DCM (20 mL) and washed with water (10 mL × 2)and brine. The organic extract was dried over MgSO4 and evaporatedto give 5 as a purple solid (0.36 g, 62%). 1H NMR (400 MHz,CDCl3): δ 1.18 (t, 12H, 3JHH = 7.0 Hz), 3.10 (t, 2H, 3JHH = 7.1 Hz),3.34 (q, 10H, 3JHH = 7.2 Hz), 3.95 (s, 2H), 6.31−6.47 (m, 6H), 7.08−7.11 (m, 1H), 7.46−7.48 (m, 2H), 7.93−7.96 (m, 1H). 13C NMR(100 MHz, CDCl3): δ 12.42, 39.50, 40.39, 41.43, 42.42, 45.01, 65.65,98.87, 108.96, 123.08, 123.88, 128.41, 128.53, 130.22, 133.03, 148.26,153.17, 153.55, 166.80, 169.46, 169.85. ESI-HRMS: calcd forC32H38ClN4O3 561.2632, found m/z 561.2646.Synthesis of 6. Tri-tert-butyl-DO3A (0.32 g, 0.59 mmol) and
K2CO3 (0.08 g, 0.59 mmol) were dissolved in MeCN (20 mL) and leftto stir for 5 min. 5 in MeCN (20 mL) was then added dropwise. Thereaction mixture was heated to reflux for 24 h. The resulting solutionwas filtered, and the filtrate was concentrated under reduced pressure.The crude product was purified by silica gel chromatography using 1−20% MeOH/DCM, 1% NH3 solution (33%), affording 6 as a beige
solid (0.12 g, 21%). 1H NMR (400 MHz, CDCl3): δ 1.18 (t, 12H,3JHH
= 7.0 Hz), 1.40 (s, 27H), 1.98−2.92 (m, 28H), 3.28 (q, 8H, 3JHH = 7.1Hz), 6.24−6.41 (m, 6H), 7.01−7.04 (m, 1H), 7.35−7.45 (m, 2H),7.76−7.83 (m, 1H). 13C NMR (100 MHz, CDCl3): δ 12.53, 27.86,30.94, 40.00, 40.55, 44.31, 49.01, 50.27, 51.13, 55.66, 56.22, 65.43,81.52, 97.68, 104.84, 108.17, 122.73, 123.84, 128.38, 130.05, 132.84,148.8, 153.18, 169.63, 170.58, 171.01, 172.31. ESI-HRMS: calcd forC58H87N8O9 1039.6596, found m/z 1039.6676.
Synthesis of L2. 6 (0.30 g, 0.3 mmol) was stirred in CH2Cl2 (1mL), and trifluoroacetic acid (1 mL, excess) was added dropwise. Thesolution was stirred at room temperature, open to air, for 24 h. Thesolvents were then removed in vacuo, and the residue was redissolvedin CH2Cl2. This was again removed, and diethyl ether was added. Afterremoval of diethyl ether, this process was repeated, affording L2 as apink solid (0.23 g, 92%). 1H NMR (400 MHz, MeOD): δ 1.15 (t,12H, 3JHH = 6.0 Hz), 2.84 (t, 2H, 3JHH = 7.0 Hz), 2.97−3.95 (m, 26H),3.54 (q, 8H, 3JHH = 6.0 Hz), 6.60−6.66 (m, 6H), 7.11 (d, 1H), 7.59(m, 2H), 7.90 (d, 1H). 13C NMR (100 MHz, CDCl3): δ 10.88, 38.29,39.01, 45.44, 46.52, 50.41, 53.10, 110.98, 115.25, 122.42, 123.66,128.55, 128.91, 133.06, 153.05, 161.17, 161.51, 169.20. ESI-HRMS:calcd for C46H63N8O9 871.4702, found m/z 871.4718.
Synthesis of Gd.L2. L2 (0.19 g, 0.22 mmol) and GdCl3·6H2O(0.04 g, 0.11 mmol) were dissolved in water (2 mL), and the pH wasadjusted to 5.5 using 1 M NaOH(aq). The reaction was left stirring atroom temperature overnight. The solution was removed in vacuo untila small volume was left. This crude solution was purified usingSephadex G10 chromotography, affording Gd.L2 as a pale-beige solid(0.03 g, 27%). ESI-HRMS: calcd for C46H60GdN8O9 1026.3724, foundm/z 1026.3834.
Synthesis of Tb.L2. The complex was prepared by an methodanalogous to that for Gd.L2 using L2 (0.19 g, 0.21 mmol) and TbCl3·6H2O (0.04 g, 0.11 mmol) to yield Tb.L2 as a pale-beige solid (0.03 g,27%). ESI-HRMS (MeOH): calcd for C46H60N8O9Tb 1027.3737,found m/z 1027.3805.
■ ASSOCIATED CONTENT
*S Supporting InformationLuminescence decay data for Tb.L1 and Tb.L2. This material isavailable free of charge via the Internet at http://pubs.acs.org.
■ AUTHOR INFORMATION
Corresponding Author*E-mail: [email protected].
NotesThe authors declare no competing financial interest.
■ ACKNOWLEDGMENTS
N.J.L. and G.A.R. were supported by a grant from theWellcome Trust Institutional Strategic Support Fund. G.A.R.was supported by Wellcome Trust Senior Investigator(WT098424AIA), MRC Programme (MR/J0003042/1), andDiabetes UK Project (11/0004210) grants and is the recipientof a Royal Society Wolfson Research Merit Award. The workleading to this publication received support from the InnovativeMedicines Initiative Joint Undertaking under Grant Agreement155005 (IMIDIA), resources of which are composed offinancial contributions from the European Union’s SeventhFramework Programme (FP7/2007-2013) and EFPIA compa-nies’ in-kind contribution (G.A.R.). We also thank ImperialCollege London for funding, Dr. Pauline Chabosseau (CellBiology) for kind assistance with single cell imaging, Dr. IsratAlam (Surgery and Cancer) for assistance with mice work, andDr. Ioannis Lavdas (Surgery and Cancer) for MRI coil setupand expertise.
Inorganic Chemistry Article
dx.doi.org/10.1021/ic402233g | Inorg. Chem. 2013, 52, 14284−1429314292

■ REFERENCES(1) Aime, S.; Crich, S. G.; Gianolino, E.; Giovenzana, G. B.; Tei, L.;Terreno, E. Coord. Chem. Rev. 2006, 250, 1562−1579.(2) Toth, E.; Helm, L.; Merbach, A. E. Top. Curr. Chem. 2002, 221,61−101.(3) Frullano, L.; Meade, T. J. J. Biol. Inorg. Chem. 2007, 12, 939−949.(4) Bunzli, J.-C. G.; Piguet, C. Chem. Soc. Rev. 2005, 34, 1048−1077.(5) Montgomery, C. P.; Murray, B. S.; New, E. J.; Pal, R.; Parker, D.Acc. Chem. Res. 2009, 42, 925−937.(6) Faulkner, S.; Burton-Pye, B. P.; Pope, S. J. A. Appl. Spectrosc. Rev.2005, 40, 1−39.(7) Manella, C. Biochim. Biophys. Acta 2006, 1762, 140−147.(8) David, S.; Weiss, M. J.; Wong, J. R.; Lampidis, T. J.; Chen, L. B. J.Biol. Chem. 1985, 260, 13844−13850.(9) Dairkee, S. H.; Hackett, A. J. Breast Cancer Res. Treat. 1991, 18,57−61.(10) Duchen, M. R. Mol. Aspects Med. 2004, 25, 365−451.(11) Caravan, P.; Ellison, J. J.; McMurry, T. J.; Lauffer, R. B. Chem.Rev. 1999, 99, 2293−2352.(12) Caravan, P. Chem. Soc. Rev. 2006, 35, 512−523.(13) Weissleder, R.; Ross, B.; Rehemtulla, A.; Gambhir, S. MolecularImaging: Principles and Practice; PMPH-USA: Shelton, CT, 2010.(14) Comblin, V.; Gilsoul, D.; Hermann, M.; Humblet, V.; Jacques,V.; Mesbahi, M.; Sauvage, C.; Desreux, J. Coord. Chem. Rev. 1999, 185,451−470.(15) Esqueda, A. C.; Lopez, J. A.; Andreu-de-Riquer, G.; Alvarado-Monzon, J. C.; Ratnaker, J.; Lubag, A. J. M.; Sherry, A. D.; De Leon-Rodríguez, L. M. J. Am. Chem. Soc. 2009, 131, 11387−11391.(16) Polasek, M.; Caravan, P. Inorg. Chem. 2013, 52, 4084−4096.(17) Reguerio-Figueroa, M.; Bensenane, B.; Ruscsak, E.; Esteban-Gomez, D.; Charbonniere, L. J.; Tircso, G.; Toth, I.; de Blas, A.;Rodríguez-Blas, T.; Platas-Iglesias, C. Inorg. Chem. 2011, 50, 4125−4141.(18) Placidi, M. P.; Engelmann, J.; Natarajan, L. S.; Logothetis, N. K.;Angelovski, G. Chem. Commun. 2011, 47, 11534−11536.(19) Faulkner, S.; Pope, S. J. A.; Burton-Pye, B. P. Appl. Spectrosc. Rev.2005, 40, 1−39.(20) Parker, D.; Dickins, R. S.; Puschmann, H.; Crossland, C.;Howard, J. A. K. Chem. Rev. 2002, 102, 1977−2010.(21) Murray, B. S.; New, E. J.; Pal, R.; Parker, D. Org. Biomol. Chem.2008, 6, 2085−2094.(22) Atkins, P.; de Paula, J. Physical Chemistry, 8th ed.; OxfordUniversity Press: Oxford, U.K., 2006.(23) Bunzli, J.-C. G. Acc. Chem. Res. 2006, 39, 53−61.(24) Goncalves, M. S. T. Chem. Rev. 2009, 109, 190−212.(25) Yuan, L.; Lin, W.; Zheng, K.; He, L.; Huang, W. Chem. Soc. Rev.2013, 42, 622−661.(26) Suksai, C.; Tuntulani, T. Chem. Soc. Rev. 2003, 32, 192−202.(27) Bandichlov, R.; Petrescu, A. D.; Vespa, A.; Kier, A. B.;Schroeder, F.; Burgess, K. Bioconjugate Chem. 2006, 17, 1219−1225.(28) Zhou, Y.; Kim, Y.-S.; Yan, X.; Jacobson, O.; Chen, X.; Liu, S.Mol. Pharmaceutics 2011, 8, 1198−1209.(29) You, Y.; Tomat, E.; Hwang, K.; Atanasijevic, T.; Nam, W.;Jasanoff, A. P.; Lippard, S. J. Chem. Commun. 2010, 46, 4139−4141.(30) Scadutro, R. C., Jr.; Grotyohann, L. W. Biophys. J. 1999, 76,469−477.(31) Longmuir, M. R.; Ogawa, M.; Hana, Y.; Kosaka, N.; Regino, C.A. S.; Choyke, P. L.; Kobayashi, H. Bioconjugate Chem. 2008, 19,1735−1742.(32) Lavis, L. D.; Chao, T.-Y.; Raines, R. T. ACS Chem. Biol. 2006, 1,252−260.(33) Hockings, P. D.; Rogers, P. J. Biochim. Biophys. Acta 1996, 1282,101−106.(34) Huang, S. G. J. Biomol. Screening 2002, 7, 383−389.(35) Lefevre, C.; Kang, H. C.; Haugland, R. P.; Malakzadeh, N.;Arttamangkul, S.; Haugland, R. P. Bioconjugate Chem. 1996, 7, 482−489.(36) Chen, X.; Pradhan, T.; Wang, F.; Kim, J. S.; Yoon, J. Chem. Rev.2012, 112, 1910−1956.
(37) Best, Q. A.; Xu, R.; McCarroll, M. E.; Wang, L.; Dyer, D. J. Org.Lett. 2010, 12, 3219−3221.(38) Lee, M. H.; Han, J. H.; Lee, J. H.; Park, N.; Kumar, R.; Kang, C.;Kim, J. S. Angew. Chem., Int. Ed. 2013, 52, 6206−6209.(39) Jennings, L. E.; Long, N. J. Chem. Commun. 2009, 3511−3524.(40) Stasiuk, G. J.; Long, N. J. Chem. Commun. 2013, 49, 2732−2746.(41) Guo, K.; Berezin, M. Y.; Zheng, J.; Akers, W.; Lin, F.; Teng, B.;Vasalatiy, O.; Gandjbakhche, A.; Griffiths, G. L.; Achilefu, S. Chem.Commun. 2010, 46, 3705−3707.(42) Hao, D.; Ai, T.; Goerner, F.; Hu, X.; Runge, V. M.; Tweedle, M.J. Magn. Reson. Imaging 2012, 36, 1060−1071.(43) Huber, M. M.; Staubli, A. B.; Kustedjo, K.; Gray, M. H. B.; Shih,J.; Fraser, S. E.; Jacobs, R. E.; Meade, T. J. Bioconjugate Chem. 1998, 9,242−249.(44) Yamane, T.; Hanaoka, K.; Muramatsu, Y.; Tamura, K.; Adachi,Y.; Miyashita, Y.; Hirata, Y.; Nagano, T. Bioconjugate Chem. 2011, 22,2227−2236.(45) Yan, X.; Zhou, Y.; Liu, S. Theranostics 2012, 2, 988−998.(46) Barge, A.; Cravotto, G.; Gianolio, E.; Fedeli, F. Contrast Med.Mol. Imaging 2006, 1, 184−188.(47) Beija, M.; Afonso, C. A. M.; Martinho, J. M. G. Chem. Soc. Rev.2009, 38, 2410−2433.(48) Beeby, A.; Clarkson, I. M.; Dickins, R. S.; Faulkner, S.; Parker,D.; Royle, L.; de Sousa, A. S.; Williams, J. A. G.; Woods, M. J. Chem.Soc., Perkin Trans. 2 1999, 493−503.(49) Bruce, J. A.; Lowe, M. P.; Parker, D. Photophysiscal Aspects ofLanthanide(III) Complexes: The Chemistry of Contrast Agents in MedicalMagnetic Resonance Imaging; Wiley; West Sussex, U.K., 2001.(50) Horrocks, W. D.; Sudnick, D. R. J. Am. Chem. Soc. 1979, 101,334−340.(51) Fasano, M.; Curry, S.; Terreno, E.; Galliano, M.; Fanali, G.;Narciso, P.; Notari, S.; Ascenzi, P. IUBMB Life 2005, 57, 787−796.(52) Boros, E.; Caravan, P. J. Med. Chem. 2013, 56, 1782−1786.(53) Cai, H.-H.; Zhong, X.; Yang, P.-H.; Wei, W.; Chen, J.; Cai, J.Colloids Surf., A 2010, 372, 35−40.(54) Caravan, P. Acc. Chem. Res. 2009, 42, 851−862.(55) Caravan, P.; Zhang, Z. Eur. J. Inorg. Chem. 2012, 1916−1923.(56) Estrella, V.; Chen, T.; Lloyd, M.; Wotjkowiak, J.; Cornnell, H.H.; Ibrahim-Hashim, A.; Bailey, K.; Balagurunathan, Y.; Rothberg, J.M.; Sloane, B. F.; Johnson, J.; Gatenby, R. A.; Gillies, R. J. Cancer Res.2013, 73, 1524−1535.(57) Zhao, Z.; Chan, P.-S.; Li, H.; Wong, K.-L.; Wong, R. N. S.; Mak,N.-K.; Zhang, J.; Tam, H.-L.; Wong, W.-Y.; Kwong, D. W. J.; Wong,W.-K. Inorg. Chem. 2012, 51, 812−821.(58) Reungpatthanaphong, P.; Dechsupa, S.; Meesungnoen, J.;Loetchutinat, C.; Mankhetkorn, S. J. Biochem. Biophys. Methods2003, 57, 1−16.(59) Shiraishi, Y.; Sumiya, S.; Kohno, Y.; Hirai, T. J. Org. Chem. 2008,73, 8571−8574.(60) Zhang, X.; Shiraishi, Y.; Hirai, T. Org. Lett. 2007, 9, 5039−5042.(61) Zheng, Y.; Yang, Z.; Ying, J. Y. Adv. Mater. 2007, 19, 1475−1479.(62) Chauvin, A.-S.; Gumy, F.; Imbert, D.; Bunzli, J.-C. G. Spectrosc.Lett. 2004, 37, 517−532.(63) Corsi, D. M.; Platas-Iglesias, C.; van Bekum, H.; Peters, J. A.Magn. Reson. Chem. 2001, 39, 723−726.(64) Workman, P.; Aboagye, E. O.; Balkwill, F.; Balmain, A.; Bruder,G.; Chaplin, D. J.; Double, J. A.; Everitt, J.; Farningham, D. A. H.;Glennie, M. J.; Kelland, L. R.; Robinson, V.; Stratford, I. J.; Tozer, G.M.; Watson, S.; Wedge, S. R.; Eccles, S. A. Br. J. Cancer 2010, 102,1555−1577.(65) Lavdas, I.; Seton, H. C.; Harrington, C. R.; Wischik, C. M.Magn. Reson. Mater. Phys. 2011, 24, 331−337.(66) Rasband, W. S. ImageJ; U.S. National Institutes of Health:Bethesda, MD, 1997−2012; http://rsb.info.nih.gov/ij/.(67) Ravier, M. A.; Rutter, G. A. Methods Mol. Biol. 2010, 633, 171−184.
Inorganic Chemistry Article
dx.doi.org/10.1021/ic402233g | Inorg. Chem. 2013, 52, 14284−1429314293