Binding of DNA with Rhodamine B: Spectroscopic and molecular modeling studies
11
Binding of DNA with Rhodamine B: Spectroscopic and molecular modeling studies Md. Maidul Islam a, * , Maharudra Chakraborty b , Prateek Pandya c, 1 , Abdulla Al Masum a , Neelima Gupta c , Subrata Mukhopadhyay b a Department of Chemistry, Aliah University, Sector-V, Salt Lake City, Kolkata 700 091, India b Department of Chemistry, Jadavpur University, Kolkata 700 032, India c Department of Chemistry, University of Rajasthan, Jaipur 302 004, India article info Article history: Received 29 March 2013 Received in revised form 2 May 2013 Accepted 23 May 2013 Available online 7 June 2013 Keywords: Rhodamine BeCT DNA interaction Cooperative binding Denaturation Circular dichroism Thermodynamic study Molecular docking abstract Binding of Rhodamine B to Calf thymus DNA (CT DNA) was studied using various biophysical techniques and molecular docking method. Circular dichroic studies revealed that conformation of CT DNA changed moderately and unwind on binding with Rhodamine B. The binding was cooperative in nature. The overall binding constant, evaluated from Benesi Hidebrand plot was seen to be in the range of 10 3 M 1 . Salt dependence binding data showed that the binding free energy depends on salt concentration. From the thermodynamics studies, it was concluded that binding process is favored by both negative enthalpy change and positive entropy change. Molecular docking calculations and Quenching experiment confirmed that the dye binds in the minor groove of CT DNA. These results further advance our knowledge on the molecular aspects on the interaction of these types of dyes to nucleic acids. Ó 2013 Elsevier Ltd. All rights reserved. 1. Introduction The interaction of nucleic acids with small molecules such as drugs, organic dyes and metal complexes has been studied inten- sively as it provides knowledge on the screening and design of novel and more efficient drugs targeting DNA, and can potentially speed up the drug discovery and development processes [1e4]. The study of anti-carcinogenic medicines and their interactions with DNA are also significantly important to develop new cancer therapy treatments [5,6]. Several types of molecules are known that interact with DNA, viz. isoquinoline alkaloids [7,8], indole alkaloids [9,10], pyrrol- imidazol polyamides [11,12], synthetic indole derivatives [13], etc. Rhodamine B (RB) (Fig. 1), a xanthene dye is widely used to detect metal ions in luminescent analysis [14e16] and in biotechnology to study fluorescence microscopy, flow cytometry, fluorescence cor- relation spectroscopy and ELISA [17e19]. Rhodamine B possesses biochemical and pharmacological effects and shows antibacterial activity upon conjugation with peptides [20]. The studies of mutagenicity indicate that the commercial Rhodamine B dye is mutagenic after activation in in vitro systems although much of this effect may be due to (unidentified) impurities. Elliot and coworkers investigated the mutagenic potential of urinary metabolites of Rhodamine B and found no mutagenic activity of rabbit urine against TA98 or TA100 with and without activation [21]. Moreover, a urine sample of human subject was also found negative. Two commercial samples of Rhodamine B were both weakly mutagenic in the same system [21]. Brown and group tested two samples of Rhodamine B by Ames test, both with and without activation and both were found positive after activation, but one was significantly weaker than the other and this difference appeared to be associated with an undefined impurity [22]. Nestman and hisngroup also conducted the Ames in which the Rhodamine B was found positive after activation in TA1538 and TA98 [23]. They also found that DNA damages in CHO cells were significantly diminished by purification of the dye [23]. Lewis et al. exposed fibroblast cell samples (from Muntiacus Muntjac) to a concentrations of Rhodamine B between 2 and 20 mg/ml for 24 and 48 h respectively and they found that all doses and times indicate the frequency of chromosome aberrations * Corresponding author. E-mail address: [email protected] (Md.M. Islam). 1 Dr. D S Kothari PDF No. F.4-2/2006(BSR)/13-557/2011. Contents lists available at SciVerse ScienceDirect Dyes and Pigments journal homepage: www.elsevier.com/locate/dyepig 0143-7208/$ e see front matter Ó 2013 Elsevier Ltd. All rights reserved. http://dx.doi.org/10.1016/j.dyepig.2013.05.028 Dyes and Pigments 99 (2013) 412e422
-
Upload
independent -
Category
Documents
-
view
1 -
download
0
Transcript of Binding of DNA with Rhodamine B: Spectroscopic and molecular modeling studies
at SciVerse ScienceDirect
Dyes and Pigments 99 (2013) 412e422
Contents lists available
Dyes and Pigments
journal homepage: www.elsevier .com/locate/dyepig
Binding of DNA with Rhodamine B: Spectroscopic and molecularmodeling studies
Md. Maidul Islam a,*, Maharudra Chakraborty b, Prateek Pandya c,1, Abdulla Al Masuma,Neelima Gupta c, Subrata Mukhopadhyay b
aDepartment of Chemistry, Aliah University, Sector-V, Salt Lake City, Kolkata 700 091, IndiabDepartment of Chemistry, Jadavpur University, Kolkata 700 032, IndiacDepartment of Chemistry, University of Rajasthan, Jaipur 302 004, India
a r t i c l e i n f o
Article history:Received 29 March 2013Received in revised form2 May 2013Accepted 23 May 2013Available online 7 June 2013
Keywords:Rhodamine BeCT DNA interactionCooperative bindingDenaturationCircular dichroismThermodynamic studyMolecular docking
* Corresponding author.E-mail address: [email protected] (Md.M. Is
1 Dr. D S Kothari PDF No. F.4-2/2006(BSR)/13-557/2
0143-7208/$ e see front matter � 2013 Elsevier Ltd.http://dx.doi.org/10.1016/j.dyepig.2013.05.028
a b s t r a c t
Binding of Rhodamine B to Calf thymus DNA (CT DNA) was studied using various biophysical techniquesand molecular docking method. Circular dichroic studies revealed that conformation of CT DNA changedmoderately and unwind on binding with Rhodamine B. The binding was cooperative in nature. Theoverall binding constant, evaluated from Benesi Hidebrand plot was seen to be in the range of 103 M�1.Salt dependence binding data showed that the binding free energy depends on salt concentration. Fromthe thermodynamics studies, it was concluded that binding process is favored by both negative enthalpychange and positive entropy change. Molecular docking calculations and Quenching experimentconfirmed that the dye binds in the minor groove of CT DNA. These results further advance ourknowledge on the molecular aspects on the interaction of these types of dyes to nucleic acids.
� 2013 Elsevier Ltd. All rights reserved.
1. Introduction
The interaction of nucleic acids with small molecules such asdrugs, organic dyes and metal complexes has been studied inten-sively as it provides knowledge on the screening and design ofnovel and more efficient drugs targeting DNA, and can potentiallyspeed up the drug discovery and development processes [1e4]. Thestudy of anti-carcinogenic medicines and their interactions withDNA are also significantly important to develop new cancer therapytreatments [5,6].
Several types of molecules are known that interact with DNA,viz. isoquinoline alkaloids [7,8], indole alkaloids [9,10], pyrrol-imidazol polyamides [11,12], synthetic indole derivatives [13], etc.Rhodamine B (RB) (Fig. 1), a xanthene dye is widely used to detectmetal ions in luminescent analysis [14e16] and in biotechnology tostudy fluorescence microscopy, flow cytometry, fluorescence cor-relation spectroscopy and ELISA [17e19]. Rhodamine B possesses
lam).011.
All rights reserved.
biochemical and pharmacological effects and shows antibacterialactivity upon conjugation with peptides [20]. The studies ofmutagenicity indicate that the commercial Rhodamine B dye ismutagenic after activation in in vitro systems although much of thiseffect may be due to (unidentified) impurities. Elliot and coworkersinvestigated the mutagenic potential of urinary metabolites ofRhodamine B and found no mutagenic activity of rabbit urineagainst TA98 or TA100 with and without activation [21]. Moreover,a urine sample of human subject was also found negative. Twocommercial samples of Rhodamine B were both weakly mutagenicin the same system [21]. Brown and group tested two samples ofRhodamine B by Ames test, both with and without activation andboth were found positive after activation, but one was significantlyweaker than the other and this difference appeared to be associatedwith an undefined impurity [22]. Nestman and hisngroup alsoconducted the Ames in which the Rhodamine B was found positiveafter activation in TA1538 and TA98 [23]. They also found that DNAdamages in CHO cells were significantly diminished by purificationof the dye [23]. Lewis et al. exposed fibroblast cell samples (fromMuntiacus Muntjac) to a concentrations of Rhodamine B between 2and 20 mg/ml for 24 and 48 h respectively and they found that alldoses and times indicate the frequency of chromosome aberrations

Fig. 1. Structure of Rhodamine B.
Md.M. Islam et al. / Dyes and Pigments 99 (2013) 412e422 413
was increased in comparison with controls. At the higher doses,there was also an increase of induced aberrations of chromosome[24]. Parodi et al. carried out Ames test to the strains TA98 andTA100 and test for DNA fragmentation in rat liver in vivo withRhodamine B [25]. Both results were negative. Wuebbles & Feltontested a range of dyes including Rhodamine B by Ames test instrains TA1538, TA98 and TA100 and the results were negative forRhodamine B both with and without activation [26]. Investigationsin Drosophila showed that Rhodamine is genotoxic in both somaticand germ line cells [27]. From the currently available data, it isappropriate to consider that Rhodamine B is potentially genotoxic.From the experiments of Wang et al. and Kui Jiao et al., it wassuggested that Rhodamine B is able to bind with DNA sequences[28e30]. The earlier studies of DNA binding ability of Rhodamine Bdid not provide the details at the molecular level. An understandingat the molecular level is important to characterize the mechanismof ligandereceptor interactions. In this paper, we have investigatedthe interactions of Rhodamine B with DNA at the molecular levelusing Spectrophotometric, Fluorimetric, Circular dichroic, Calori-metric and computer docking procedure. These studies provide anunderstanding of the binding affinity and structural details ofRhodamine B: DNA complex.
2. Experimental
2.1. Materials and methods
CT DNA was purchased from SigmaeAldrich Corporation (St.Louis, MO, USA). Its concentration was determined spectrophoto-metrically using known molar extinction coefficient ( 3)(6600 M�1 cm�1 at 260 nm) expressed in terms of nucleotidephosphates [7]. The ratio of the absorbances at 260e280 nm indi-cated that the sample was free from protein contamination.Rhodamine B were obtained from SigmaeAldrich and were usedthroughout without further purification as no detectable impuritieswere found by thin layer chromatography and 1H NMR spectros-copy. Rhodamine B solutions were freshly prepared each day andwere always kept protected in dark to prevent any light inducedphotochemical changes. Molar extinction coefficients ( 3) ofRhodamine B were determined in our laboratory and the value is91,675M�1 cm�1 (at 554 nm). This value was used to determine theconcentration of Rhodamine B by absorbance measurements. Nodeviation from Beer’s law was observed in the concentration rangeat 0e100 mM for Rhodamine B used in our study.
All the experiments were conducted in Citrate-Phosphate (CP)buffer medium (10 mM [Naþ]) at pH 7.0 containing 5.0 mMNa2HPO4. pH of the medium was adjusted using citric acid [31].Glass-distilled deionized water and analytical grade reagents wereused throughout. The pH values of the solutions were measuredwith a calibrated Orion-Ross combined electrode system (Model81-02). All buffer solutions were filtered through Millipore filters(Millipore, India Pvt. Ltd, Bangalore, India) of 0.45 mm before use.
2.2. Absorbance spectral studies
Absorbance spectra were measured on a Shimadzu PharmaspecUV-1700 spectrophotometer (Shimadzu Corporation, Tokyo, Japan)equipped with a thermoelectrically controlled cell holder (modelTCC 240A) under stirring at 25 � 0.1 �C in quartz cells of 1.00 cmpath length.
2.3. Fluorescence spectral studies
All Fluorescence spectral studies were measured on a Hitachispectrofluorimeter (Hitachi Corporation, Tokyo, Japan) equippedwith a thermoelectrically controlled cell holder in matched quartzcells of 1.00 cm path length under stirring at 25 � 0.5 �C.
2.4. Determination of affinity constants
All calculations regarding the binding of RB with CT DNA wereevaluated by Benesi Hildebrand plot [32,33], Scatchard analysis andHill plot using the following equations (equations (1)e(3))
2.4.1. Benesi Hildebrand plot
1=DA ¼ 1=ðKa$DA0Þ½DNA� þ 1=ðDA0Þ (1)
where DA is absorbance/Florescence intensity change, Ka is thebinding constant, and DA0 is maximum absorbance/Florescenceintensity change. The binding constant can be obtained by plotting1/DA vs 1/[DNA] and then dividing intercept by slope.
2.4.2. Scatchard analysisThe amount of free and bound dye was determined as follows.
During theUV/Vis experiment, known amount of the dyewas addedto DNA solution (70 mM). This quantity was used to calculate theexpected absorbance at wavelength maximum, Aexp¼ lCt 3max. Fromthe difference between Aexp and the observed absorbance (Aobsd),the amount of bound drug can be calculated as Cb ¼ DA/D 3¼ (Aexp � Aobsd)/l( 3f � 3b). The amount of free drug was deter-minedby thedifference,Cf¼Ct� Cb. The extinction coefficient of thecompletely bound drug was determined from the slope of BenesieHildebrand plot. In the fluorescence study, Cb was calculated fromthe relationCb¼Ct(I� Io)/(Vo�1)Io,whereCt is the known total drugconcentration, I is the observed fluorescence, Io is the fluorescenceintensity of identical concentration of drug in absence of DNA andVois the experimentally determined ratio of the fluorescence intensityof totally bound drug to that of free alkaloid. Free drug concentra-tions (Cf) were obtained from the relationship Ct ¼ Cb þ Cf. Thebinding ratio r is defined as r ¼ Cb/[DNA]total.
Binding data obtained from spectrophotometric and spectro-fluorimetric titrations were converted into Scatchard plot of r/Cfversus r. All the Scatchard plots revealed positive slopes at low rvalues as observed in cooperative binding isotherms and hencewere analyzed using the following McGheeevon Hippel equation[34,35]:
rCf
¼ Kið1� nrÞ ��ð2uþ 1Þð1� nrÞ þ ðr � RÞ
2ðu� 1Þð1� nrÞ�ðn�1Þ
�1� ðnþ 1Þr þ R
2ð1� nrÞ�2
(2)
where, R ¼ {[1 � (n þ 1)r]2 þ 4ur(1 � nr)}1/2, Ki is the intrinsicbinding constant to an isolated binding site, n is the number of basepairs excluded by the binding of a single ligand molecule and u is

Table 1Four DNA decamer sequences used for docking.
S.No. DNA Sequence
1 S1 50-d(GATGGCCATC)22 S2 50-d(GATCCGGATC)23 S3 50-d(GGCAATTGCC)24 S4 50-d(GGCTTAAGCC)2
Md.M. Islam et al. / Dyes and Pigments 99 (2013) 412e422414
the cooperativity factor. The binding data were analyzed using theOrigin 7.0 software (Microcal, Inc., Northampton, MA, USA) thatdetermines the best-fit parameters to equation (2).
2.4.3. Hill plotThe cooperative nature of binding was also analyzed by Hill
equation, plotting the value of log(r/(1 � r)) vs Cf according to thefollowing equation the following equation:
log½r=ð1� rÞ� ¼ u$log Cf � log Kd (3)
where u and Kd are the cooperativity factor and dissociation con-stant respectively. The value of r and Cf were obtained from spec-trophotometric titration [36].
2.5. Continuous variation analysis (Job’s plot)
The binding stoichiometry was determined by Job’s continuousvariation using fluorescence technique [37]. The fluorescenceemission intensity of RB was monitored at 578 nm after exiting at510 nm at constant temperature. The fluorescence intensities wererecorded for solutions where the concentrations of both DNA andRhodamine B were varied but the sum of their concentrations waskept constant at 50 mM. The differences in fluorescence intensity(DF) of the dye in the absence and presence of DNA were plottedagainstmole fraction of thedye [37]. Breakpoint in the resultingplotcorresponds to the mole fraction of the bound dye in the complex.The stoichiometry was obtained in terms of DNA/dye ¼ [(1 � cdye)/cdye] where cdye denotes the mole fraction of Rhodamine B. Theresults reported are average of at least three experiments.
2.6. Fluorescence quenching studies
Fluorescence quenching experiments were performed with ananionic quencher, K4[Fe(CN)6] as reported earlier [31e34]. The F0/Fvalues were plotted against [Fe(CN)6]4� concentration according tothe SterneVolmer equation:
F0=F ¼ 1þ Ksv½Q � (4)
Here, F0 and F represent the fluorescence intensities of thecomplex in absence and presence of the quencher respectively and[Q] is the concentration of the quencher. Ksv is the SterneVolmerquenching constant, which is the measure of efficiency ofquenching by the quencher.
2.7. Circular dichroism
A JASCO: J-815 spectropolarimeter (Japan Spectroscopic Ltd.,Japan) controlled by a PC was used for all circular dichroic mea-surements. A rectangular quartz cell having 1 cm path length wasused for all CD measurements performing at 25 � 0.5 �C [31e34].Each spectrumwas averaged from five successive accumulations ata scan rate of 100 nm/min keeping a bandwidth of 1.0 nm at asensitivity of 100 milli degree and was base line corrected andsmoothed within permissible limits using the inbuilt software ofthe unit. Themolar ellipticity values [q] presented in terms of eitherper nucleotide (210e400 nm) are expressed as deg cm2 dmol�1. Thespectropolarimeter was routinely calibrated using an aqueous so-lution of d-10 ammonium camphor sulphonate.
2.8. Isothermal titration calorimetric studies
All isothermal titration calorimetric experimentswere performedusing a Microcal ITC 200. Aliquots of degassed DNA solution were
injected from a rotating syringe (1500 rpm) into the isothermalsample chamber containing the RB solution. Corresponding controlexperiments to determine the heat of dilution of DNA were per-formed by injecting identical volumes of DNA into the buffer. Theduration of each injectionwas 10 s and the delay time between eachinjection was 120 s. The initial delay before the first injection was120 s. Each injection generated a heat burst curve (micro calories persecond versus time). The area under each heat burst curve wasdetermined by integration using the Origin 7.0 software (MicroCal)to give the measure of the heat associated with that injection. Theheat associated with each DNA-buffer mixing was subtracted fromthe corresponding heat associated with the DNA injection to the RBto give the heat of RB binding to DNA. The heat of dilution ofinjecting the buffer into the RB solution was observed to be negli-gible. The resulting corrected injection heats were plotted as afunction of the D/P [dye]/[nucleotide phosphatemolar ratio], fit witha model for one set of binding sites, and analyzed using Origin 7.0software to estimate the binding affinity (Ka), the binding stoichi-ometry (N) and the enthalpy of binding (DH). The free energies (DG)were calculated using the standard equation:
DG ¼ DH � TDS (5)
The binding free energy coupled with the binding enthalpyderived from the ITC data allowed the calculation of the entropiccontribution (TDS) to the binding, where DS is the calculatedbinding entropy using the standard relationship (equation (5)).
2.9. Molecular docking studies
Four DNA decamer sequences viz. DNA-1 to DNA-4, wereselected for docking experiments in order to find out any basesequence specific binding of Rhodamine-B (RB). The selected B-DNA duplex sequences consisted of 10 base pairs each with acentral core consisting of four specific bases from the 50-end in eachDNA duplex [Table 1]. The structural coordinates of sequences DNA-1 to DNA-4 were generated in PDB format according to Arnott et al.using scfbio server at IIT Delhi [38].
Molecular docking calculations were accomplished usingAutoDock-vina program (version 1.1.2) from The Scripps ResearchInstitute [39]. Autodock-vina performs faster and more accuratedocking calculations thanautodock software [40e42]. Beforedocking,the receptor and drug coordinate files were converted into PDBQTformat using MGLTools (version 1.5.4). For docking calculations, a 3-dimensional grid box of 24 � 26 � 30 was prepared with a gridspacing of 1.0 �A. The grid was centered on coordinates x ¼ �3.002,y¼ 0.008, z¼ 15.212. For each docking calculation, 20 different poseswere requested within the energy range of 2 kcal/mol. All other pa-rameters were kept at their default values. The grid boxwas preparedto cover the full length of DNA so as to allow the drug molecule toexplore all the possible binding sites in each DNA sequence.
3. Results and discussion
3.1. Spectroscopic results
The absorption spectra of the RB (5.5 mM) in presence ofincreasing CT DNA concentrations is presented in Fig. 2.
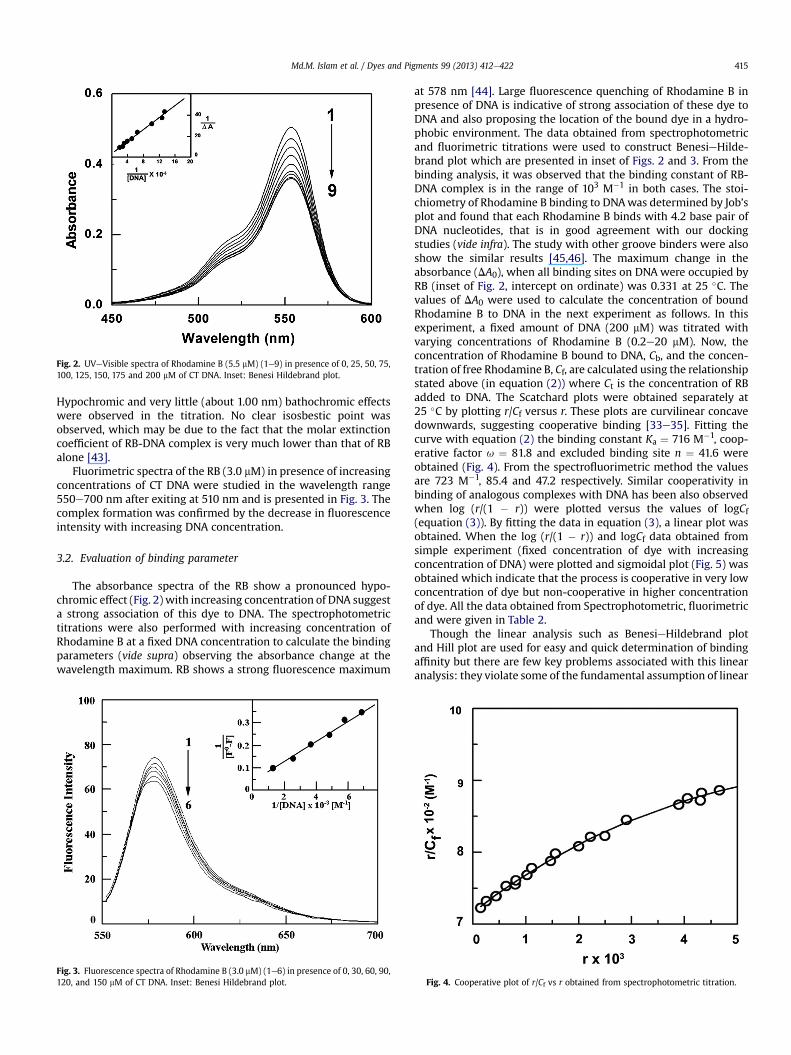
Fig. 2. UVeVisible spectra of Rhodamine B (5.5 mM) (1e9) in presence of 0, 25, 50, 75,100, 125, 150, 175 and 200 mM of CT DNA. Inset: Benesi Hildebrand plot.
Md.M. Islam et al. / Dyes and Pigments 99 (2013) 412e422 415
Hypochromic and very little (about 1.00 nm) bathochromic effectswere observed in the titration. No clear isosbestic point wasobserved, which may be due to the fact that the molar extinctioncoefficient of RB-DNA complex is very much lower than that of RBalone [43].
Fluorimetric spectra of the RB (3.0 mM) in presence of increasingconcentrations of CT DNA were studied in the wavelength range550e700 nm after exiting at 510 nm and is presented in Fig. 3. Thecomplex formation was confirmed by the decrease in fluorescenceintensity with increasing DNA concentration.
3.2. Evaluation of binding parameter
The absorbance spectra of the RB show a pronounced hypo-chromic effect (Fig. 2) with increasing concentration of DNA suggesta strong association of this dye to DNA. The spectrophotometrictitrations were also performed with increasing concentration ofRhodamine B at a fixed DNA concentration to calculate the bindingparameters (vide supra) observing the absorbance change at thewavelength maximum. RB shows a strong fluorescence maximum
Fig. 3. Fluorescence spectra of Rhodamine B (3.0 mM) (1e6) in presence of 0, 30, 60, 90,120, and 150 mM of CT DNA. Inset: Benesi Hildebrand plot.
at 578 nm [44]. Large fluorescence quenching of Rhodamine B inpresence of DNA is indicative of strong association of these dye toDNA and also proposing the location of the bound dye in a hydro-phobic environment. The data obtained from spectrophotometricand fluorimetric titrations were used to construct BenesieHilde-brand plot which are presented in inset of Figs. 2 and 3. From thebinding analysis, it was observed that the binding constant of RB-DNA complex is in the range of 103 M�1 in both cases. The stoi-chiometry of Rhodamine B binding to DNAwas determined by Job’splot and found that each Rhodamine B binds with 4.2 base pair ofDNA nucleotides, that is in good agreement with our dockingstudies (vide infra). The study with other groove binders were alsoshow the similar results [45,46]. The maximum change in theabsorbance (DA0), when all binding sites on DNA were occupied byRB (inset of Fig. 2, intercept on ordinate) was 0.331 at 25 �C. Thevalues of DA0 were used to calculate the concentration of boundRhodamine B to DNA in the next experiment as follows. In thisexperiment, a fixed amount of DNA (200 mM) was titrated withvarying concentrations of Rhodamine B (0.2e20 mM). Now, theconcentration of Rhodamine B bound to DNA, Cb, and the concen-tration of free Rhodamine B, Cf, are calculated using the relationshipstated above (in equation (2)) where Ct is the concentration of RBadded to DNA. The Scatchard plots were obtained separately at25 �C by plotting r/Cf versus r. These plots are curvilinear concavedownwards, suggesting cooperative binding [33e35]. Fitting thecurve with equation (2) the binding constant Ka ¼ 716 M�1, coop-erative factor u ¼ 81.8 and excluded binding site n ¼ 41.6 wereobtained (Fig. 4). From the spectrofluorimetric method the valuesare 723 M�1, 85.4 and 47.2 respectively. Similar cooperativity inbinding of analogous complexes with DNA has been also observedwhen log (r/(1 � r)) were plotted versus the values of logCf(equation (3)). By fitting the data in equation (3), a linear plot wasobtained. When the log (r/(1 � r)) and logCf data obtained fromsimple experiment (fixed concentration of dye with increasingconcentration of DNA) were plotted and sigmoidal plot (Fig. 5) wasobtained which indicate that the process is cooperative in very lowconcentration of dye but non-cooperative in higher concentrationof dye. All the data obtained from Spectrophotometric, fluorimetricand were given in Table 2.
Though the linear analysis such as BenesieHildebrand plotand Hill plot are used for easy and quick determination of bindingaffinity but there are few key problems associated with this linearanalysis: they violate some of the fundamental assumption of linear
Fig. 4. Cooperative plot of r/Cf vs r obtained from spectrophotometric titration.

Fig. 5. Plot of log[r/(1 � r)] vs logCf plot. The values were obtained from titration offixed concentration of Rhodamine B with increasing concentration of CT DNA.
Md.M. Islam et al. / Dyes and Pigments 99 (2013) 412e422416
regression by distorting the experimental error. They frequentlyinvolve assumptions and shortcuts; such as assuming that[DNA] >> [RB] and that the complex is fully formed at the end oftitration. It is also assumed that the binding stoichiometry is 1:1.These assumptions are often not valid and distort the results. Thenon-linear regression approachwithexact solutionsof thequadraticequation yields the most accurate results. In our previous work [7],we showed that the non-linear plot give more accurate results andthe Ka�u obtained fromCooperative Scatchared analysis ismore orless same as obtained by other analysis such as non-cooperativeanalysis, Isothermal titration calorimetric (ITC) analysis, Ethidiumdisplacement assay and melting analysis. In this work also this data(Ka � u) is in good agreement with ITC data (vide infra).
3.3. Thermodynamics of the interaction
To determine the thermodynamics parameters of binding ofRhodamine B to DNA, the binding was further analyzed by BenesieHildebrand plot at three different temperatures, viz.15 �C, 20 �C and25 �C. The analyzed data yielded association constant (Ka) of 1192,1125 and 1067 M�1, at 15.0 �C, 20.0 �C and 25.0 �C respectively. Thecorresponding DG values at those temperatures are �4087, �4117and �4156 cal/mol respectively.
From the linear plot of DG against temperature (T) (usingequation (5)) we obtained an enthalpy change (DH) of �1.92 kcal/mol and an entropy change (DS) of 7.56 cal/mol/K from the inter-cept and slope respectively. The thermodynamic data showed that
Table 2Binding study obtained by spectrophotometrica and fluorimetric studya.
Experimentalmethod
Analyzed by BindingconstantKa (M�1)
n u Ka � u (M�1)
Spectrophotometric BenesieHildebrand 1067 e e
CooperativeScatchared plot
716 41.6 81.8 5.86 � 104
Hill plot 1071 e 1.16 1243Spectrofluorimetric BenesieHildebrand 1025 e e e
CooperativeScatchared plot
723 47.2 85.4 6.2 � 104
Hill plot 1067 e 1.18 1259
a Average of four determinations. Binding constants (Ka) and the number ofoccluded sites (n) refer to solution conditions of CP buffer containing 5 mMNa2HPO4, pH 7.0 at 25 �C. u is the cooperativity factor.
the binding of Rhodamine B to CT DNA was favored by bothnegative enthalpy and positive entropy changes. The data correlatewith the interaction of different alkaloids with DNA and RNA [33e35]. The negative enthalpy change is due to the binding of RB to thegroove of DNA and the positive entropy change is due to release ofthe bound water from the DNA that is replaced by the binding of RBto DNA.
3.4. Ionic strength dependence of the binding and parsing of thefree energy of binding
The single positive charge on the exocyclic nitrogen of Rhoda-mine B is thought to be the driving force for this interaction withnucleic acids due to the electrostatic interaction. Furthermore, thecations are condensed around the DNA helix and the charged li-gands compete to expel the cations for phosphate neutralization;these are thermodynamically linked processes. In order to provideinsights into such molecular details, binding studies were per-formed at three different salt concentrations [Naþ] at 10 mM,20 mM and 50 mM and the association constants were evaluatedfrom the BenesieHildebrand plot. These association constantvalues for the binding of Rhodamine B to the DNA are presented inthe Table 3.
The molecules easily bind if their association to double strandedDNA is facilitated by positive charges. DNA condenses counter ionsto its surfaces to screen the polyionic charge on the phosphodiesterbackbone and RB may compete with sodium ions for binding toDNA phosphates, which further stabilize the RB-DNA complex. Itwas observed that in high salt concentration the binding of RB toDNA phosphate backbone decreases and the overall binding con-stant decreases moderately. Analysis of the salt effects in DNAbinders has been used in many cases to assess the role of electro-static contribution in binding process. The following relationshipbetween Ka and sodium ion concentration (equation (6)) has beenderived previously [33,34].
dlog Ka=dloghNaþ
i¼ �Z4 (6)
Z is the apparent charge on the bound ligand and 4 is thefraction of the [Naþ] bound per DNA phosphate. It has been seenthat the value of the association constant decreases as the salt in-creases. Plot of logKa versus log[Naþ] yielded a straight lines(Fig. 6a). From the slope (Z4) 0.621 indicating the number of ionsreleased is in good agreement with that reported for mono cationicmolecules binding to double stranded DNAs and RNAs [7,33]. Theobserved free energy of the interaction is in the range of 3.5e4.2 kcal/mol (Table 3). From the dependence of Ka on [Naþ], theobserved free energy can be partitioned between two contribu-tions, namely, the non-polyelectrolytic contribution (DGt) and thepolyelectrolytic contribution (DGpe) as were done for severalintercalators [47,48] using following equation:
DG0 ¼ �RTln Ka ¼ �DGt�þ ðDGpeÞ (7)
Table 3Binding constants at different salt concentration determined by spectrophotometricprocess and analyzed by Benesi Hildabrand plota.
Salt concentration Bindingconstant
DGt
(cal/mol)DGpe
(cal/mol)DG0 (cal/mol)
10 mM 1067 �2452 �1704 �415620 mM 818 �2549 �1448 �399750 mM 397 �2457 �1109 �3566
a Average of four determinations. Binding constants (K) were determined in CPbuffer containing 5, 10 and 25 mM Na2HPO4, pH 7.0 at 25.0 �C.

Fig. 6. (a) logKa vs log[Naþ] plot. (b) The solid parts and hatched parts indicaterespectively the non-polyelectrolytic (DGt) and the polyelectrolytic (DGpe) contributionto the binding free energy. In all cases the values of Ka obtained from BenesieHilde-brand analysis.
Md.M. Islam et al. / Dyes and Pigments 99 (2013) 412e422 417
The polyelectrolytic contribution at any given [Naþ] may becalculated from the experimentally determined quantity ((dlogKa/dlog[Naþ]) ¼ �Z4). Record and coworkers [49,50] have shown thatDGpe ¼ �(Z4)RTln[MX], where MX is the monovalent salt concen-tration. The magnitude of DGpe is the free energy contributionarising from coupled polyelectrolytic forces particularly that fromthe release of condensed counter ions from the DNA helix uponbinding of charged ligands. The free energy of binding of RB to theDNA and the polyelectrolytic and the non-polyelectrolytic contri-bution to the same were calculated at and presented in Table 3. Agraphical representation of the same is presented in Fig. 6b. At10 mM where the electrostatic contribution is also predominantthe values of DGt and DGpe for the binding of Rhodamine B to DNAare respectively, �2.45 and �1.70 kcal/mol. It is pertinent toobserve that the DGt remained invariant at all ionic strengths. Asthe salt concentration increased the DGpe contribution decreased,while the DGt contribution to the total free energy remainedinvariant. It can be seen from the figure and table that in both casesthere is remarkably large contribution from the non-electrostaticforces to the binding free energy clearly suggesting the role of hy-drophobic forces in the DNA intercalation process of these twomolecules. Further, the polyelectrolytic contribution to the freeenergy appears to be more or less similar in all the cases at all ionicstrengths further supporting the presumption of the weak partic-ipation of the charges on the Rhodamine B in the interaction. It is
pertinent to observe here that the low electrostatic contributionobserved here is in stark contrast to that observed with the bindingof isoquinoline alkaloids to DNA and RNA-interaction [7,34].
3.5. CT-DNA denaturation data and evaluation of thermodynamicparameters of denaturation
Denaturation of CT-DNA in presence of increasing concentrationof the Rhodamine B was conducted according to the method ofTorshizi et al. [36]. These experiments were carried out separately attwo temperatures, 15 �C, and 25 �C in citrate phosphate buffer me-dium at pH 7.0 and [Naþ] concentration at 10 mM. The absorbance at258 nm was monitored for either CT-DNA (70 mM in each case) ormixtures of DNA with Rhodamine B (4.0e70 mM at each tempera-ture). The profiles of denaturation of CT-DNA by Rhodamine B areshown in Fig. 7a. As Fig. 7a shows, the concentration of Rhodamine Bin the midpoint of transition, at 15 �C is 23.2 mM and at 25 �C is28.1 mM. Thus, the complex can denature CT-DNA at extremely lowconcentration and if it will be used as anticancer agent, quite lowdoses will be needed, which may cause fewer side effects. From theDNAdenaturationplots (Fig. 7a) and Pacemethod [51], the value of K,(i.e. unfolding equilibrium constant) and DGo(H2O), (i.e. unfoldingfree energy of DNA at two temperatures of 15 �C and at 25 �C in thepresence of Rhodamine B) have been calculated. A straight line isobtained when the values of DGo(H2O) are plotted against the con-centrations of RB in the transition region at 15 �C and 25 �C. Theseplots are presented in Fig. 7b. The slopes of these plots (a measure ofthe Rhodamine B ability to denature DNA) and the intercepts onordinate, i.e. DGo(H2O), (conformational stability of DNA in theabsence of Rhodamine B) are summarized in Table 4.
As we know, the higher the values of DGo(H2O) increase theconformational stability of DNA. However, the values of DGo(H2O)(Table 4) are decreased by raising the temperature. This is expectedbecause, in general, the decrease in DGo(H2O) value is the mainreason for the decrease in DNA stability [52]. Another two importantthermodynamic parameters are molar enthalpy of DNA denaturationin absence of Rhodamine B, DHo(H2O) and molar entropy of DNA inabsence of Rhodamine B, DSo(H2O). To determine these, we calcu-lated the molar enthalpy of DNA denaturation (DHo conformation orDHo denaturation) in the presence of the Rhodamine B in the range oftwo temperatures using GibbseHelmholtz equation [53]. A Plot be-tween enthalpies versus concentration of Rhodamine B gives astraight line as shown in Fig. 7c. Interpolation of this line (intercepton ordinate, i.e. absence of Rhodamine B) resulted the values ofDHo(H2O), (Table 4). This plot shows that in the range of 15e25 �C,the changes in the enthalpies in presence of Rhodamine B aredescending. These observations indicate that on increasing the con-centration of Rhodamine B, the stability of DNA is decreased. More-over, the entropy of DNA unfolded by Rhodamine B (DSo(H2O)) havebeen calculated using the equation DG ¼ DH � TDS and the data aregiven in Table 4. These data show that the RBeDNA complex is moredisordered than native DNA (Fig. 7d), as we found that the entropychanges are positive for Rhodamine B complex in the denaturationprocesses of CT-DNA (Table 4).
3.6. Conformational aspects of binding
Conformational aspectof thebindingof theRhodamineBwithDNAwas investigated by intrinsic circular dichroic studies. The intrinsic CDspectra of the DNA display more or less gross B-form conformationcharacterized by a large positive band in the 260e268 nm and a largenegative band at 235 nm. These bands are caused due to the stackinginteractions between the bases and the helical structure of the poly-mers thatprovideasymmetric environment for thebases.On theotherhand, under investigation, Rhodamine B does not have any intrinsic

Fig. 7. (a) Relative absorbance change, (b) free energy change, (c) enthalpy change and (d) entropy change of Rhodamine B, with increasing concentration of CT DNA.
Md.M. Islam et al. / Dyes and Pigments 99 (2013) 412e422418
optical activity. To record the dye-induced changes in the DNAconformation, the CD spectra in the 200e400 nm regions wererecorded in presence of varying D/P (Rhodamine B/DNA base pairmolar ratio) values. In presence of Rhodamine B the ellipticity of thelong wavelength positive band of DNA increased as the interactionprogressed with a slight hypsochromic shift and increase in molarellipticity q (Fig. 8). Two weak iso-elliptic points at 256 nm and at287 nm were also observed (small arrow in Fig. 8). Similar type ofresults were also observed during the interaction of bridging ligandsandminor-Groove binders to DNA [54,55]. These results depicted thatRhodamineBbindstotheminorgrooveofDNA,whichwasalsoprovedby Docking studies and other experiments (vide infra).
3.7. Fluorescence quenching studies
The binding of the RB to DNA was further probed using fluo-rescence quenching experiments in presence of [Fe(CN)6]4�. Theanionic quencher would not be able to penetrate the negativelycharged helix and if these small molecules are buried within theDNA helix by intercalation, little change in fluorescence is expected.Results indicate that free molecules are quenched efficiently, RB-DNA complex also quenched to a considerable extent. Thequenching constants calculated for free and bound RB were 24.72and 23.83 M�1 respectively. From the result it is clear that RB is notburied deeply into the DNA (intercalation) but it remains open to[Fe(CN)6]4� after binding (groove binding mode).
Table 4Thermodynamic parameters of DNA denaturation by Rhodamine Ba.
Temperature(�C)
m � (107)((cal/mol)(mol/L)-1)
DG0
(cal/mol)DH0
(cal/mol)DS0
(cal/mol/K)
15 23.2 1889.44 5630.56 12.9925 28.1 1759.54
a Average of four determinations. Values were determined in CP buffer containing5 mM Na2HPO4, pH 7.0. m is the slope of DG vs concentration of Rhodamine B. DG0,DH0 and DS0 are the Gibbs free energy, Enthalpy and entropy of DNA denaturation inabsence of Rhodamine B.
3.8. Isothermal titration calorimetric studies
To further characterize the energetic of the binding of RB toDNA, isothermal titration calorimetric (ITC) experiments wereperformed. In Fig. 9 (upper panel) the representative raw ITC pro-files resulting from the titration of DNA to RB solution is presented.Each of the heat burst curves in the figure corresponds to a singleinjection. The areas under these heat burst curves were determinedby integration to yield the associated injection heats. These injec-tion heats were corrected by subtracting the corresponding dilu-tion heats derived from the injection of identical amounts of DNAinto the buffer alone (curves in the upper panel offset for clarity). Inthe lower panel of the figure, the resulting corrected injection heatsare plotted against the respective molar ratios. In this panel thedata points reflect the experimental injection heat while the solidlines reflect calculated fits of data. The corrected isotherms
Fig. 8. Induced circular dichroic spectra of CT DNA (50 mM) in the presence of 0, 5, 10,15, 20 and 25 mM Rhodamine B (curves 1e6).

Fig. 9. Representative ITC profile for the titration of CT DNA with a solution ofRhodamine B in 10 mM CP buffer, pH 7.0 at 25 �C. In the top panel the heat burst curvesare the result of successive injection of aliquots of the DNA into the Rhodamine B. Thebottom panel represents the corresponding normalized heat signals versus molar ratio.The control heat bursts of titration of the dye into buffer are presented in the top panel(curves offset of clarity).
Table 5Distribution of binding poses of RB in the minor and major grooves of DNA.
DNA binding site S1 S2 S3 S4Minor groove 12 9 20 17Major groove 5 3 0 1Total poses 17 12 20 18
Md.M. Islam et al. / Dyes and Pigments 99 (2013) 412e422 419
obtained at different temperature showed single site binding eventfitting to a single site protocol in ITC. The experimental datarevealed that the binding constant Ka is 1.34 � 104 M�1, enthalpychange DH is �1.53 kcal/mol, entropy change is 13.8 cal/mol/K andthe binding stoichiometry is near about 7 base pair per dye. Thebinding constants obtained in this process in the same order ofKa � u in cooperative analysis by scatchard plot, but slightly higherthan that of obtained from other analysis. This may be due to thefact that binding constant highly depend on the method of analysis[56,57].
Fig. 10. Rhodamine-B in the minor groove of S1. (a) Showing S1 as hydrophobic sur-face, (b) depicting inter-molecular H-bonds indicated by arrows.
3.9. Study of binding by computational docking method
Molecular docking of Rhodamine-B resulted in binding poses inboth minor and major grooves of DNA. Although, the maximumnumber of poses within the energy range of 2 kcal/mol were set to20, the actual number of poses obtained were 17 in case of S1, 12 incase of S2, 20 in case of S3 and 18 in case of S4 [Table 5].
The docking results clearly indicate that the drug prefers to sit inthe minor groove of DNA as the majority of binding poses obtainedin each case were inside the minor groove. This is largely due to thefact that during the binding process, the narrower and deepershape of DNAminor groove offers several points of close contact viavan-der Waals forces with the surface of drug molecule, allowingthe banana shaped conformation of RB to orient easily along theminor groove (Fig. 10a).
The orientation of RB molecule in the minor groove is such thatits carboxy-phenyl ring is orthogonal to the rest of the moleculeand is exposed to the outside of the minor groove in contact withsolvent environment. This enables the drug to anchor itself viaintermolecular H-bonds between its carboxyl group terminus andDNA backbone as shown in Fig. 10b. These results provided usefulinformation about various binding poses of RB along with thebinding free energy of each pose. The binding free energy profile ofRhodamine-B for four DNA sequences (S1eS4) along with thenumber of H-bonds observed in each case is shown in Fig. 11.
Binding free energy values of minor groove poses of RB werehigher, in the range of �8.2 to �6.9 kcal/mol as compared to �6.5to �6.0 kcal/mol for the major groove binding poses (Fig. 12). Thevalues are in good agreement with experimental values obtainedfrom isothermal titration calorimetric experiments (DG¼�5.57 kcal/mol) and cooperative Scatchard analysis (DG ¼ �6.5 kcal/mol).
The difference in the free energy values obtained from experi-mental and computational results arises due to several factors. Inthe case of ITC, binding free energy includes the flexibility of DNAmolecule along with several other energy terms such as trans-lational energy, entropy, hydration free energy, conformational freeenergy, etc. On the other hand, the docking calculations explicitlyconsidered DNA as a rigid molecule and drug as a flexible molecule.In addition, the binding free energy obtained from ITC also includesthe effects from counter-ion environment of buffer solutionwhereas docking calculations do not consider the counter ions inthe complexation process.
The strength and specificity of weak interactions are highlydependent on the medium in which they take place, and mostbiological interactions take place in water. Water is an excellentsolvent for polar molecules and greatly weakens electrostatic forcesand hydrogen bonding between polar molecules by competing fortheir attractions. The dielectric constant of water is 80, so waterdiminishes the strength of electrostatic attractions by a factor of 80compared with the strength of those same interactions in a vac-uum. From this explanation it is clear that hydrophilic contributionof free energy is present during the binding process. The differences

Fig. 11. All the docked poses of RB with four DNA decamer sequences (S1eS4) areshown as inverted blue bars. The number of H-bonds corresponding to each pose isshown as red bars. (For interpretation of the references to color in this figure legend,the reader is referred to the web version of this article.)
Md.M. Islam et al. / Dyes and Pigments 99 (2013) 412e422420
in free energy obtained theoretically and observed value is due tothe fact.
Barcelo and coworkers [58] showed observed binding free en-ergy is the combination of hydrophobic free energy, conformationalchange free energy, rotational free energy etc. Among them hy-drophobic free energy is more negative than that of observed freeenergywhether conformational free energy is positive compared tothe observed free energy. From this it may be revealed that the freeenergy observed in docking process mainly the hydrophobic freeenergy which may be due to the deep penetration of RB in theminor groove of DNA. The positive entropy change and negativeenthalpy change observed from ITC experiment also support thisdata. From the observed free energy (from ITC data) and calculatedfree energy (docking data) the following relation may be obtained.
DGobserved ¼ DGHydrophobic þ DGconfromational (8)
where DGobserved, DGHydrophobic and DGconfromational are the observedfree energy, hydrophobic free energy obtained from docking andconformational free energy. Free energy contribution due to otherfacts like transitional, rotational etc neglected due to lower values.
From equation (8) the roughly calculated DGconfromational is 2.63e1.33 kcal/mol which is more or less similar to that of conforma-tional stability of DNA helix (1.76 kcal/mol) obtained from dena-turation study.
It is interesting to note that the number of inter-molecular H-bonds observed in the minor groove poses were significantly lesserthan major groove binding poses (Fig. 11). The H-bonds in the
Fig. 12. Total distribution of binding poses in all four DNA strands. Red colored Crossesindicate major groove binding poses. Dots indicate minor groove poses.
minor groove poses show higher binding free energy in each DNAsequence suggesting clearly that the binding of RB is largely facil-itated by favorable van der Waals interactions. It was also observedthat although the number of H-bonds in the major groove poseswas higher than their minor groove counterparts, the overallbinding interactions in the major groove are much weaker ascompared to the minor groove poses. This further establishes thegreater contribution of hydrophobic interactions in the overallbinding free energy of RB with DNA.
Rhodamine B molecule is positively charged in the solution andit is likely to interact with the negatively charged phosphate groupsof DNA backbone. However, in our docking experiments, RB is notfound to interact with any of the phosphate backbone atoms. Thisfurther supports that the binding of RB with DNA is largely drivenby the hydrophobic forces and hydrogen bonding.
The occurrence of large number of poses in the minor groove ofDNA suggests that Rhodamine B prefers the minor groove ascompared to the major groove. The possibility of interaction of RBwith major groove of DNA also exists. However, since the overallstructure of Rhodamine B is small and the volume of major grooveis too big. This causes RB to slip-off from the major groove of DNA.In general, major groove of DNA is a preferred site for proteinsbinding. Therefore it is highly unlikely that any number of RBmolecules bind in the major groove of DNA at the fluorescence orITC time scale. It appears that the shape of the minor grooveperfectly suits the geometry of RB and therefore accommodates theRB molecules with the help of van der Waals and other forces.
We have also investigated the binding site size and sequencespecific binding ability of RB in docked complexes. All the minorgroove binding poses were found to occupy three base pairs of DNAwhile the major groove poses occupied 3-4 base pairs. The clueabout the sequence-specific binding preference of RB could not beobtained from the dataset of 59 binding poses in the minor grooveof four DNA duplex sequences (S1eS4). All the minor groove posesof RB were found to be dispersed over the entire length of DNAsequences with almost all possible base pair sets showing no sta-tistically significant binding site preference.
4. Conclusions
In conclusion, our study revealed that Rhodamine B binds to theDNA by groove binding mode. The dye binding to DNA exhibitspositive cooperativity and slightly unwind DNA helix. The freeenergy of the binding includes significant electrostatic and non-electrostatic contribution. The binding is also characterized bymoderate change in the conformation of the DNA polymers withthe bound dye acquiring induced optical activity to varying extents.Thermodynamics of the interaction revealed that the binding wasfavored by both negative enthalpy and positive entropy changes.
Molecular docking study supports minor groove binding modelfor the RB-DNA complex. It may be highlighted that the bindingaffinity result (binding constant) obtained from some experimentaltechniques are different from the affinity data obtained fromdocking calculations. This is due to the fact that binding constantvalues are extremely method dependent, i.e. the values may bedifferent for different methods of analysis (double reciprocal plot,Scatchard plot, ITC, etc). In addition, docking produces binding freeenergy values that are converted into binding constants using van’tHoff’s equation in order tomatchwith the experimental data. Thesesteps can sometimes show variation in the exact numerical valuesof binding affinity of drugereceptor complexes. Molecular dockingnevertheless shows similar trend in binding affinity and bindingmode as shown by the experimental results.
The present study reveals the details of binding affinity, mode ofinteraction and structural aspects of RB-DNA complexes. This study
Md.M. Islam et al. / Dyes and Pigments 99 (2013) 412e422 421
will encourage further investigations of other natural and syntheticdyes as DNA binding agents and their potential for use as thera-peutic molecules.
Acknowledgments
Md. Maidul Islam thanks Prof. Sayed Samsul Alam, Vice Chan-cellor, Aliah University and Dr. Anowar Hossain, Registrar, AliahUniversity, for their valuable help. Prateek Pandya is thankful to theUGC for the award of Dr D S Kothari PDF (No. F.4-2/2006(BSR)/13-557/2011). We are thankful to Dr. Gopal Chakraborty and Mr. ArijitPal, Ballygunge Science College, Calcutta University. The award of aSenior Research Fellowship to Maharudra Chakraborty by theCouncil of Scientific and Industrial Research (New Delhi) is grate-fully acknowledged.
References
[1] Li YQ, Guo YJ, Li XF, Pan JH. Electrochemical studies of the interaction of basicbrown G with DNA and determination of DNA. Talanta 2007;71:123e8.
[2] Hossain M, Suresh Kumar G. DNA intercalation of methylene blue and quin-acrine: new insights into base and sequence specificity from structural andthermodynamic studies with polynucleotides. Mol Biosyst 2009;5:1311e22.
[3] Saha I, Suresh Kumar G. Phenazinium dyes methylene violet 3rax and indoineblue binds to DNA by intercalation: evidences from structural and thermo-dynamics studies. Dyes Pigment 2013;96:81e91.
[4] Kabir A, Hossain M, Suresh Kumar G. Thermodynamics of the DNA binding ofbiogenic polyamines: calorimetric and spectroscopic investigations. J ChemThermodyn 2013;57:445e53.
[5] Hajian R, Tavakol M. Interaction of anticancer drug methotrexate with DS-DNA analyzed by spectroscopic and electrochemical methods. E-JournalChem 2012;9:471e80.
[6] Palchaudhuri R, Hergenrother PJ. DNA as a target for anticancer compounds:methods to determine the mode of binding and the mechanism of action. CurrOpin Biotechnol 2007;18:497e503.
[7] Islam MM, Basu A, Hossain M, Kumar GS, Hotha S, Suresh Kumar G. EnhancedDNA binding of 9-u-amino alkyl ether analogs of plant alkaloid berberine.DNA Cell Biol 2011;30:123e33.
[8] Bhadra K, Suresh Kumar G. Therapeutic potential of nucleic acid bindingisoquinoline alkaloids: binding aspects and implications for drug design. MedRes Rev 2011;31:821e62.
[9] Gupta SP, Pandav K, Pandya P, Suresh Kumar G, Barthwal R, Kumar S. Meth-ylene linker assisted DNA binding of vinblastine and simpler analogs: purine-pyrimidine specificity of indole derivatives. Chem Biol Interface 2011;1:297e309.
[10] Pandya P, Gupta SP, Barthwal R, Jayaram B, Kumar S. DNA binding studies ofvinca alkaloids: experimental and computational evidence. Nat Prod Commun2012;7:1e5.
[11] Peter B. Dervan molecular recognition of DNA by small molecules. Bioorg MedChem 2001;9:2215e35.
[12] White S, Baird EE, Dervan PB. Effects of the A.T/T.A degeneracy of pyrroleeimidazole polyamide recognition in the minor groove of DNA. Biochemistry1996;35:12532e7.
[13] Pandya P, Islam MM, Kumar GS, Jayaram B, Kumar S. DNA minor groovebinding of small molecules: experimental and computational evidence.J Chem Sci 2010;122:247e57.
[14] Karstens T, Kobs K. Rhodamine B and Rhodamine 101 as reference substancesfor fluorescence quantum yield measurements. J Phys Chem 1980;84:1871e2.
[15] Yang F. Preparation of uniform Rhodamine B-doped SiO2/TiO2 compositemicrospheres. J Solid State Chem 2006;179:457e63.
[16] Chen H, Zhou M, Jin X, Song Y, Zhang Z, Ma Y. Chemiluminescence determi-nation of ultramicro DNA with a flow-injection method. Anal Chim Acta2003;478:31e6.
[17] Hasegawa T, Kondo Y, Koizumib Y, Sugiyamab T, Takeda A, Ito S, et al. A highlysensitive probe detecting low pH area of HeLa cells based on Rhodamine Bmodified b-cyclodextrins. Bioorg Med Chem 2009;17:6015e9.
[18] Burden DL, Walhout PK, Elliott JT, Chandler EL, Scharf RG, Culbertson MJ, et al.Measuring diffusion in nanoscale environments with single-moleculeconfocal fluorescence microscopy. Spectrosc Lett 2004;37:129e49.
[19] Endre K, Peter N, Andrea B, Janos S, Janos M. Cytometry of raft and caveolamembrane microdomains: from flow and imaging techniques to highthroughput screening assays. Cytometry 2008;73A:599e614.
[20] Bucki R, Pastore JJ, Randhawa P, Vegners R, Weiner DJ, Janmey PA. Antibac-terial activities of Rhodamine B-conjugated gelsolin-derived peptidescompared to those of the antimicrobial peptides cathelicidin LL37, magaininII, and melittin. Antimicrobial Agents Chemother 2004;48:1526e33.
[21] Elliot GS, Mason RW, Edwards IR. Studies on the pharmacokinetics andmutagenic potential of Rhodamine B. J Toxicol Clin Toxicol 1990;28:45e59.
[22] Brown JP, Dietrich PS, Bakner CM. Mutagenicity testing of some drug andcosmetic dye lakes with the Salmonella/mammalian microsome assay. MutatRes 1979;66:181e5.
[23] Nestmann ER, Douglas GR, Matula TI, Grant CE, Kowbel DJ. Mutagenic activityof Rhodamine dyes and their impurities as detected by mutation induction inSalmonella and DNA damage in Chinese hamster ovary cells. Cancer Res1979;39:4412e7.
[24] Lewis IL, Patterson RM, McBay HC. The effects of Rhodamine B on the chro-mosomes of Muntiacus muntjac. Mutat Res 1981;88:211e6.
[25] Parodi S, Taningher M, Russo P, Pala M, Tamaro M, Monti-Bragadin C. DNA-damaging activity in vivo and bacterial mutagenicity of sixteen aromaticamines and azo-derivatives as related quantitatively to their carcinogenicity.Carcinogenesis 1982;2:1317e26.
[26] Wuebbles BJ, Felton JS. Evaluation of laser dye mutagenicity using the Ames/Salmonella microsome test. Environ Mutagen 1985;7:511e22.
[27] Tripathy NK, Nabi MJ, Sahu GP, Kumar AA. Genotoxicity testing of two reddyes in the somatic and germ line cells of Drosophila. Food Chem Toxicol1995;33:923e7.
[28] Wang XM, Jiang XL, Lu ZH, Chen HY. Evidence of DNA-ligand bindingwith different modes studied by spectroscopy. Chin Chem Lett 2000;11:147e8.
[29] Kui J, Li QJ, Sun W, Wang ZY. Electrochemical studies of the recognitioninteraction of Rhodamine B with DNA. Chin Chem Lett 2005;16:382e4.
[30] Kui J, Li QJ, Sun W, Zhen-yong W. Studies on the recognition interaction ofRhodamine B and DNA by voltammetry. Chem Res Chinese U 2005;21:145e8.
[31] Islam MM, Pandya P, Kumar S, Roy Chowdhury S, Suresh Kumar G. Binding ofDNA binding alkaloids to tRNA and comparison to ethidium through spec-troscopic and molecular modeling studies. J Mol Struct 2008;891:498e507.
[32] Islam MM, Suresh Kumar G. RNA targeting by small molecule alkaloids:studies on the binding of palmatine and berberine to polyribonucleotides andcomparison to ethidium. J Mol Struct 2008;875:382e91.
[33] Islam MM, Suresh Kumar G. Small molecule RNA interactions: spectroscopicand calorimetric studies on the binding by the cytotoxic protoberberinealkaloid coralyne to single stranded polyribonucleotides. Biochim BiophysActa 2009;1790:829e39.
[34] Islam MM, Roy Chowdhury S, Suresh Kumar G. Spectroscopic and calorimetricstudies on the binding of alkaloids berberine, palmatine and coralyne todouble-stranded RNA polynucleotides. J Phys Chem B 2009;113:1210e24.
[35] Islam MM, Basu A, Suresh Kumar G. Binding of 9-u-amino alkyl ether analogsof plant alkaloid berberine to poly(A): insights into self-structure induction.Med Chem Commun 2011;2:631e7.
[36] Torshizi HM, Saeidifar M, Khosravi F, Divsalar A, Saboury AA, Hassani F. DNAbinding and antitumor activity of a-diimineplatinum(II) and palladium(II)dithiocarbamate complexes. Bioinorg Chem Appl 2011;2011:1e11.
[37] Islam MM, Sinha R, Suresh Kumar G. RNA binding small molecules: studies ont-RNA binding by cytotoxic plant alkaloids berberine, palmatine and com-parison to ethidium. Biophys Chem 2007;125:508e20.
[38] Arnott S, Campbell-Smith PJ, Chandrasekaran R. Fasman GP, editor. Handbookof biochemistry and molecular biology. Nucleic acids. 3rd ed., vol. II. Cleve-land: CRC Press; 1976. p. 411e22.
[39] Trott O, Olson A. AutoDock vina: improving the speed and accuracy of dockingwith a new scoring function, efficient optimization, and multithreading.J Comput Chem 2010;31:455e61.
[40] Seeliger D, de Groot BL. Ligand docking and binding site analysis with PyMOLand Autodock/vina. J Comput Aided Mol Des 2010;24:417e22.
[41] Chang MW, Ayeni C, Breuer S, Torbett BE. Virtual screening for HIV proteaseinhibitors: a comparison of AutoDock 4 and vina. PLoS One 2010;5:e11955. 1e9.
[42] Takatsuka Y, Chen C, Nikaido H. Mechanism of recognition of compounds ofdiverse structures by the multidrug efflux pump AcrB of Escherichia coli. ProcNatl Acad Sci U S A 2010;107:6559e65.
[43] Antony T, Atreyi M, Rao MVR. Interaction of methylene blue with transfer RNAe a spectroscopic study. Chem Biol Interact 1995;97:199e214.
[44] López AF, Ojeda PR, López AI. Fluorescence self-quenching of themolecular formsof Rhodamine B in aqueous and ethanolic solutions. J Lumin 1989;44:105e12.
[45] Lin LP, Huang LS, Lin CW, Lee CK, Chen JL, Hsu SM, et al. Determination ofbinding constant of DNA-binding drug to target DNA by surface plasmonresonance biosensor technology. Curr Drug Targets Immune Endocr MetabolDisord 2005;5:61e72.
[46] Gopala Krishna A, Vijay Kumar D, Khan BM, Rawal SK, Ganesh KN. TaxoleDNAinteractions: fluorescence and CD studies of DNA groove binding properties oftaxol. Biochim Biophys Acta 1998;1381:104e12.
[47] Chaires JB, Satyanarayana S, Suh D, Fokt I, Przewloka T, Priebe W. Parsing thefree energy of anthracycline antibiotic binding to DNA. Biochemistry 1996;35:2047e53.
[48] Chaires JB. Dissecting the free energy of drug binding to DNA. Anticancer DrugDes 1996;11:569e80.
[49] Record Jr MT, Anderson CF, Lohman TM. Thermodynamic analysis of ion ef-fects on the binding and conformational equilibria of proteins and nucleicacids: the roles of ion association or release, screening, and ion effects onwater activity. Q Rev Biophys 1978;11:103e78.
[50] Record Jr MT, Ha JH, Fisher MA. Analysis of equilibrium and kinetic mea-surements to determine thermodynamic origins of stability and specificityand mechanism of formation of site-specific complexes between protein andhelical DNA. Meth Enzymol 1991;208:291e343.

Md.M. Islam et al. / Dyes and Pigments 99 (2013) 412e422422
[51] Greene Jr RF, Pace CN. Urea and guanidine hydrochloride denaturation ofribonuclease, lysozyme, alpha-chymotrypsin, and beta-lactoglobulin. J BiolChem 1974;249:5388e93.
[52] Bathaie SZ, Bolhasani A, Hoshyar R, Ranjbar B, Sabouni F, Moosavi-Movahedi AA.Interaction of saffron carotenoids as anticancer compounds with ctDNA, oligo(dG.dC)15, and oligo (dA.dT)15. DNA Cell Biol 2007;26:533e40.
[53] Barrow GM. Physical chemistry. 5th ed. New York: MC. Graw-Hill; 1988.[Chapter 7].
[54] Nazif MA, Rubbiani R, Alborzinia H, Kitanovic IWölfl S, Ott I, Sheldrick WS.Cytotoxicity and cellular impact of dinuclear organoiridium DNA intercalatorsand nucleases with long rigid bridging ligands. Dalton Trans 2012;41:5587e98.
[55] Nguyen B, Hamelberg D, Bailly C, Colson P, Stanek J, Brun R, et al. Char-acterization of a novel DNA minor-groove complex. Biophys J 2004;86:1028e41.
[56] Islam MM, Pandya P, Kumar S, Suresh Kumar G. RNA targeting throughbinding of small molecules: studies on t-RNA binding by the cytotoxic pro-toberberine alkaloid coralyne. Mol Biosyst 2009;5:244e54.
[57] Vijan LE. The interaction of vancomycin with DNA. Rev Roum Chim 2009;54:807e13.
[58] Barcelo F, Capo D, Portugal J. Thermodynamic characterization of themultivalent binding of chartreusin to DNA. Nucleic Acids Res 2002;30:4567e73.