![On the time and cell dependence of the coarse-grained entropy. II [1976]](https://static.fdokumen.com/doc/165x107/63176605e88f2a90c80123e9/on-the-time-and-cell-dependence-of-the-coarse-grained-entropy-ii-1976.jpg)
On the time and cell dependence of the coarse-grained entropy. II [1976]
Self-Assembly of a Simple Membrane Protein: Coarse-Grained MolecularDynamics Simulations of the Influenza M2 Channel
Timothy Carpenter, Peter J. Bond, Syma Khalid, and Mark S. P. SansomDepartment of Biochemistry, University of Oxford, Oxford, United Kingdom
ABSTRACT The transmembrane (TM) domain of the M2 channel protein from influenza A is a homotetrameric bundle ofa-helices and provides a model system for computational approaches to self-assembly of membrane proteins. Coarse-grainedmolecular dynamics (CG-MD) simulations have been used to explore partitioning into a membrane of M2 TM helices duringbilayer self-assembly from lipids. CG-MD is also used to explore tetramerization of preinserted M2 TM helices. The M2 helixmonomer adopts a membrane spanning orientation in a lipid (DPPC) bilayer. Multiple extended CG-MD simulations (5 3 5 ms)were used to study the tetramerization of inserted M2 helices. The resultant tetramers were evaluated in terms of the mostpopulated conformations and the dynamics of their interconversion. This analysis reveals that the M2 tetramer has 2 3
rotationally symmetrical packing of the helices. The helices form a left-handed bundle, with a helix tilt angle of ;16�. The M2helix bundle generated by CG-MD was converted to an atomistic model. Simulations of this model reveal that the bundle’sstability depends on the assumed protonation state of the H37 side chains. These simulations alongside comparison with recentx-ray (3BKD) and NMR (2RLF) structures of the M2 bundle suggest that the model yielded by CG-MD may correspond to aclosed state of the channel.
INTRODUCTION
Membrane proteins comprise ;25% of most genomes, and in
humans are a major target for drugs (1,2). Yet of the ;47,000
structures deposited in the Protein Data Bank (3), only ;300
are for membrane proteins, corresponding to ,150 unique
structures (http://blanco.biomol.uci.edu/Membrane_Proteins_
xtal.html). Thus, despite the progress made in determining
membrane protein structures (4), it is of some importance to
develop methods that enable prediction of membrane protein
structures either ab initio or as an adjunct to methods for de-
termining low-resolution structures (5).
Models of membrane protein folding suggest that it may
occur via two major stages (6–9). First, upon insertion into
the bilayer, the polypeptide forms independently stable
transmembrane (TM) a-helices. Second, these TM helices
subsequently pack together to form the tertiary structure of
the protein. Subsequent to and/or in parallel with the initial
insertion phase, TM helices can start to seek out their most
stable native conformations. This search for the native pro-
tein conformation may include the reorientation of the helices
from their original insertion positions to alignments that will
lead to the most stable packing arrangement of the helices.
This search may itself proceed via several steps. For example,
bacteriorhodopsin has several folding intermediates (10), and
indeed there may exist multiple folding pathways leading to
the native structure (11), consistent with the more general
concept of protein folding on a funnel-shaped energy land-
scape (12).
Recent studies with small water-soluble proteins suggest
that molecular dynamics (MD) and Monte Carlo simulations
can be used to explore aspects of protein folding (13). For
example, simulation folding studies on small soluble pep-
tides, e.g., Trpcage (14,15), yielded predicted structures with
an accuracy close to that of NMR. However, Trpcage folds in
;10 ns, whereas the folding and assembly of small mem-
brane peptides occurs on the microsecond timescale (16), i.e.,
beyond the range of most atomistic MD simulations of
membrane systems (17–19). However, coarse-grained (CG)
approaches, in which small groups of atoms are treated as
single particles, allow one to expand the length of MD sim-
ulations of membranes to tens of microseconds (20–30).
Recent works have adapted CG lipid models for use with
proteins (27,28,31–33), and demonstrated that CG-MD may
be used to simulate, e.g., the self-assembly of TM helix di-
mers of the simple model membrane protein glycophorin A
(31) and the folding of a TM a-helical hairpin (28).
The M2 channel protein from influenza A virus (Fig. 1)
provides a good test case for modeling studies of simple mem-
brane proteins (34,35). It is a 97-residue protein containing a
single TM a-helix. The protein exists as a tetramer, with the
ion channel formed by a parallel bundle of four TM helices.
M2 has been the subject of extensive experimental (36–58)
and computational (59–65) studies in the past few years. In
particular, it has been used in simulations based on an implicit
membrane and solvation model to study folding/self-assembly
of the TM helix tetramer (64,65). It therefore provides a well-
doi: 10.1529/biophysj.108.131078
Submitted February 6, 2008, and accepted for publication July 1, 2008.
Address reprint requests to Mark S. P. Sansom, Dept. of Biochemistry,
University of Oxford, South Parks Road, Oxford OX1 3QU, UK. Tel.:
44-1865-275371; Fax: 44-1865-275273; E-mail: [email protected].
ac.uk.
Peter J. Bond’s present address is Max Planck Institute of Biophysics,
Frankfurt/Main, Germany.
Syma Khalid’s present address is School of Chemistry, University of
Southampton, Highfield, Southampton, UK.
Editor: Gregory A. Voth.
� 2008 by the Biophysical Society
0006-3495/08/10/3790/12 $2.00
3790 Biophysical Journal Volume 95 October 2008 3790–3801
documented test case for analysis of TM helix bundle self-
assembly and dynamics using CG-MD. Furthermore, two re-
cent structures of the M2 TM helix tetramer, as revealed by
x-ray crystallography in the presence of detergent (octyl glu-
coside) (66) and by NMR in detergent (DHPC) micelles (67),
enable the model structures to be compared with those deter-
mined experimentally, albeit in different environments.
In this study, CG-MD simulations are used to study the
partitioning of isolated TM helices into a lipid bilayer during
self-assembly of a bilayer. CG-MD is also used to explore the
self-assembly of a tetrameric bundle of M2 TM helices in a
bilayer, and the conformational dynamics of the resultant
helix bundle. The resultant M2 bundle model is converted
from CG to atomistic (AT) form and shown to be stable in
;15 ns duration simulations in an atomistic lipid bilayer.
METHODS
M2 TM helix and bilayer models
A 27-mer peptide (residues D21SSDPLVVAASIIGILHLILWILDRLF47)
was used to model the TM region of M2 plus several residues on either side
(68). This region was chosen on the basis of experimental evidence (69,70) in
combination with results of a TM helix prediction server (71). Modeller v7.7
(72–74) was used create a structure with an a-helical region for the proposed
TM domain (residues 22–46) with an additional residue at either end in a
random coil conformation. This atomistic model was converted to CG using
the protocol described previously (31). The result was a monomer 27 amino
acids in length, with the central 25 amino acids held together in a compar-
atively rigid a-helical structure. Since the CG backbone particles cannot
form hydrogen bonds, harmonic restraints were used to maintain the
a-helical conformation.
To simulate bilayer formation and partitioning of a single TM helix into
the membrane, a simulation box (of dimensions 100 3 100 3 100 A3)
containing the CG a-helical peptide was filled with 256 randomly placed and
orientated CG dipalmitoylphosphatidylcholine (DPPC) lipids, ;3000 CG
water particles, and four CG Na1 ions. This primary simulation resulted in a
stable membrane-spanning M2 TM helix (see Fig. 2). This monomeric helix
was replicated to produce four monomers of similar orientation, which were
inserted into a preformed and equilibrated CG DPPC bilayer, ;45 A apart
from one another. This system was the basis of five subsequent tetramer
simulations, each of 5 ms duration.
CG simulation parameters and protocols
All simulations were performed using GROMACS (www.gromacs.org)
(75,76). CG simulations were performed as described by Bond and Sansom
(31). The CG parameters for lipids (DPPC), ions, and water molecules were
as described by Marrink et al. (21). The CG parameters for amino acids were
a modified version of that described by Bond and Sansom (31), and the same
as that described by Bond et al. (28) and Bond and Sansom (32). Briefly, a
CG peptide model was generated from the atomistic model, yielding a chain
of backbone particles with attached side-chain particles. Interparticle bond
potentials used a force constant of 50 kJ mol�1A�2. The equilibrium bond
length was 3.6 A for the backbone particles. Different amino acids had dif-
ferent equilibrium bond length(s) for their side-chain particle(s). Harmonic
restraints were applied between backbone particles to mimic secondary
structure H-bonds in the atomistic structure. The target distance was 6 A,
with a force constant of 10 kJ mol�1 A�2.
For all CG simulations, Lennard-Jones interactions were smoothly shifted
to zero between 9 A and 12 A, and electrostatics were smoothly shifted to
zero between 0 A and 12 A, with a relative dielectric constant of 20 used for
explicit screening. The nonbonded neighbor list was updated every 10 steps.
All simulations were performed at constant temperature, pressure, and
number of particles. The temperatures of the protein, DPPC, and solvent
were each coupled separately using the Berendsen algorithm (77) at 323 K,
with a coupling constant tT¼ 1 ps. The system pressure was anisotropically
coupled using the Berendsen algorithm at 1 bar with a coupling constant tP¼1 ps and a compressibility of 5 3 10�6 bar�1. The time step for integration
was 40 fs, and coordinates were saved every 400 ps for subsequent analysis.
Analyses were performed using GROMACS tools and locally written code.
Visualization used VMD (78).
Atomistic simulations
Atomistic simulations used an extended united atom version of the GROMOS96
force field (79,80). All energy minimizations used ,1000 steps of steepest
descents to relax any steric conflicts generated during setup. Long-range
electrostatic interactions were treated using the particle mesh Ewald method
(81) with a 10 A cutoff for the real space calculation. A 10 A cutoff was used
for the van der Waals interactions. All simulations were performed in the
constant number of particles, pressure, and temperature (NPT) ensemble.
The temperatures of the protein, lipids, water, and ions were coupled sep-
arately using the Berendsen thermostat (77) at 323 K with a coupling constant
tT ¼ 0.1 ps. The pressure was coupled semiisotropically using the Berendsen
barostat at 1 bar with coupling constant tP¼ 1 ps. The time step for integration
was 2 fs. The LINCS algorithm (82) was used to restrain bond lengths.
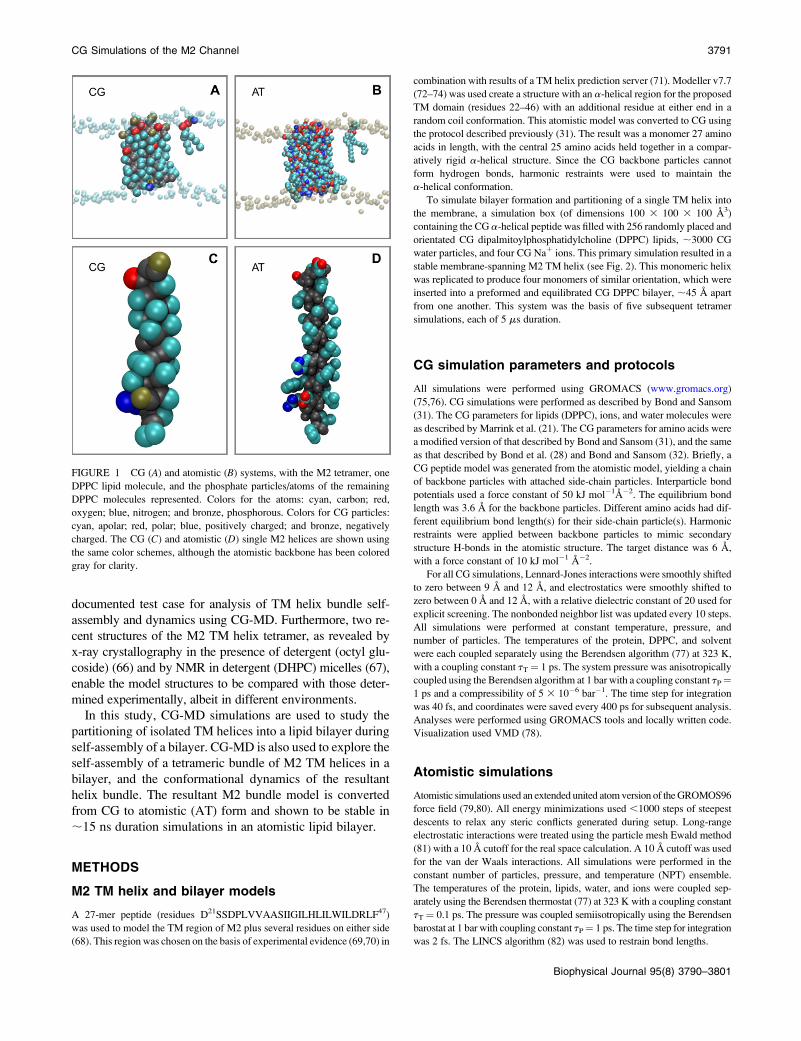
FIGURE 1 CG (A) and atomistic (B) systems, with the M2 tetramer, one
DPPC lipid molecule, and the phosphate particles/atoms of the remaining
DPPC molecules represented. Colors for the atoms: cyan, carbon; red,
oxygen; blue, nitrogen; and bronze, phosphorous. Colors for CG particles:
cyan, apolar; red, polar; blue, positively charged; and bronze, negatively
charged. The CG (C) and atomistic (D) single M2 helices are shown using
the same color schemes, although the atomistic backbone has been colored
gray for clarity.
CG Simulations of the M2 Channel 3791
Biophysical Journal 95(8) 3790–3801
General analysis
Simulation results were analyzed using GROMACS tools and locally written
code. The clustering of tetramer structures was carried out using NMRclust
(83). Secondary structure analyses used DSSP (84). Pores within the helical
bundle were analyzed and visualized using HOLE (85). Visualization used
VMD (78).
RESULTS
M2 helix partitioning into a lipid bilayer
The initial set of simulations (CG-M1 to CG-M10) consisted
of self-assembly simulations starting from a box of randomly
positioned lipids plus a single 27-mer M2-TM peptide in an
a-helical conformation (Table 1). The aim of the simulation
was to test the assumption of a preferred TM orientation of
the M2 peptides. For 90% of the simulation time, as the lipids
self-assemble into a bilayer, the peptide helix partitions into
the bilayer and remains spanning it (Fig. 2). This occurs after
an average of ;25 ns, after which time both the bilayer and
membrane-spanning helix remain stable throughout the re-
mainder of the simulation. It should be noted that the dy-
namics of CG simulations may be faster than that of a
corresponding AT simulation, with a 3–6-fold speed-up
factor depending on the molecules in question (21). Thus
from 75 to 150 ns of ‘‘atomistic time’’ was needed for bilayer/
helix self-assembly. This is comparable to the estimate of 50–
100 ns obtained from earlier atomistic simulations, albeit on a
smaller system (86).
The tilt angle of the helix in the TM orientation simulations
relative to the bilayer normal (i.e., the z axis) has an average
of 16� (67�). The N-terminal of the M2 TM helix contains
several charged and polar residues (D21, S22, S23, and D24),
whereas the C-terminal contains both charged and aromatic
residues (R45 and F47). These residues interact with the lipid
headgroups and appear to act as anchors of the helix in the
membrane.
Thus, this relatively simple CG-MD simulation is consis-
tent with both experimental studies (36,87) and implicit bi-
layer simulations (64,88) indicating that the M2-TM helix
adopts a membrane-spanning orientation.
M2 TM helix tetramerization
Five independent self-assembly simulations of the influenza
M2 tetramer (CG-T1 to CG-T5; see Table 1), each of duration
5 ms, were performed, starting from four isolated M2-TM
helices inserted in a parallel fashion and similar orientation
(at an interhelix separation of ;45 A) in a preformed DPPC
bilayer. Thus, this simulation mimics the second stage of
membrane protein folding, i.e., oligomerization and packing
together of the helices. The formation of helix bundles was
assessed by monitoring the distances between the centers of
mass of the Ca particles of the various pairwise combinations
of helices as a function of time (Fig. 3).
In each of the five simulations a tetrameric bundle was
formed. It can be seen that this occurs by initial formation of
TABLE 1
Simulation Setup Duration (ns)
CG-M1 to CG-M10 27-mer M2-TM peptide, 256 DPPCs, ;3000 water particles,
4 Na1 ion particles
10 3 1000
CG-T1 to CG-T5 4 3 27-mer M2-TM peptides, preequilibrated bilayer (195 DPPCs),
;3000 water particles, 16 Na1 ion particles
5 3 5000
CG-T6 4 3 27-mer M2-TM peptides (randomly orientated) in a preequilibrated
bilayer (196 DPPCs), ;3000 water particles, 16 Na1 particles
5000
CG-T1 3 3 27-mer M2-TM peptide with neutral H37, 1 3 27-mer M2-TM peptide
with positive H37, preequilibrated bilayer (195 DPPCs), ;3000 water
particles, 14 Na1 particles
5000
CG-T21 2 3 27-mer M2-TM peptide with neutral H37, 2 3 27-mer M2-TM peptide
with positive H37, preequilibrated bilayer (195 DPPCs), ;3000 water
particles, 12 Na1 particles
5000
CG-T31 1 3 27-mer M2-TM peptide with neutral H37, 3 3 27-mer M2-TM peptide
with positive H37, preequilibrated bilayer (195 DPPCs), ;3000 water
particles, 10 Na1 particles
5000
CG-T41 4 3 27-mer M2-TM peptide with positive H37, preequilibrated bilayer
(195 DPPCs), ;3000 water particles, 8 Na1 particles
5000
AT-T0 4 3 27-mer M2-TM peptides, preequilibrated bilayer (195 DPPCs),
;8000 water molecules, 8 Na1 ions
15
AT-T41 4 3 27-mer M2-TM peptides, preequilibrated bilayer (195 DPPCs),
;8000 water molecules, 4 Na1 ions
15
CG-x-ray 4 3 25-mer (x-ray-to-CG*), preequilibrated bilayer (203 DPPCs),
;3000 water molecules, 8 Na1 ions
500
CG-D4 4 3 25-mer (AT model-to-CGy), preequilibrated bilayer (203 DPPCs),
;3000 water molecules, 8 Na1 ions
2000
*For this simulation, the crystal structure was converted into a CG model.yFor this simulation, the D4 model adapted from the crystal structure was converted into a CG model.
3792 Carpenter et al.
Biophysical Journal 95(8) 3790–3801

dimer, which subsequently grows by addition of helices until
the tetramer is formed. Averaging across the five simulations,
the mean time taken for formation of a tetramer was 550 ns
(6 120 ns). It is worth noting that in each simulation a loose
tetrameric assembly formed within a shorter period of time;
the mean time quoted is for formation of a plausible homo-
tetrameric left-handed helix bundle. However, to allow
equilibration of each bundle before analysis, only data from
1 ms onward were considered, giving 4 ms per simulation and
20 ms of tetramer simulation time in total.
Conformation of the four-helix bundle
The five simulations were each clustered (using NMRclust
(83) on their Ca RMSDs) to yield representative frames from
the three top clusters per simulation. A comparison of the 15
structures, via calculation of a Ca RMSD matrix, yielded
four major conformations, combinations of which were
present in all of the simulations. Furthermore, a more detailed
examination of these four major conformations revealed that
they corresponded to the same structure, but with different
numbering (i.e., permutation) of the helices. Manual re-
numbering of the helices resulted in a single cluster of
structures (see Fig. 4) with an overall Ca RMSD of 3 A
between one another. Note that this is comparable to, e.g., the
RMSD of an NMR ensemble structure for the TM domain of
the F1F0 ATPase c-subunit (89).
Previous modeling studies of M2 have assumed fourfold
rotational symmetry (44,61,65) for the tetramer, such that the
two diagonal distances across the bundle (distances H1-H2
and H3-H4 in Fig. 5) are by definition equal to one another.
However, in the final ensemble of 11 structures (four struc-
tures having been excluded during the clustering as outliers/
minor conformations) of the tetramer, the two average di-
agonal distances are 11.5 6 0.3 A and 16.8 6 0.2 A. Thus,
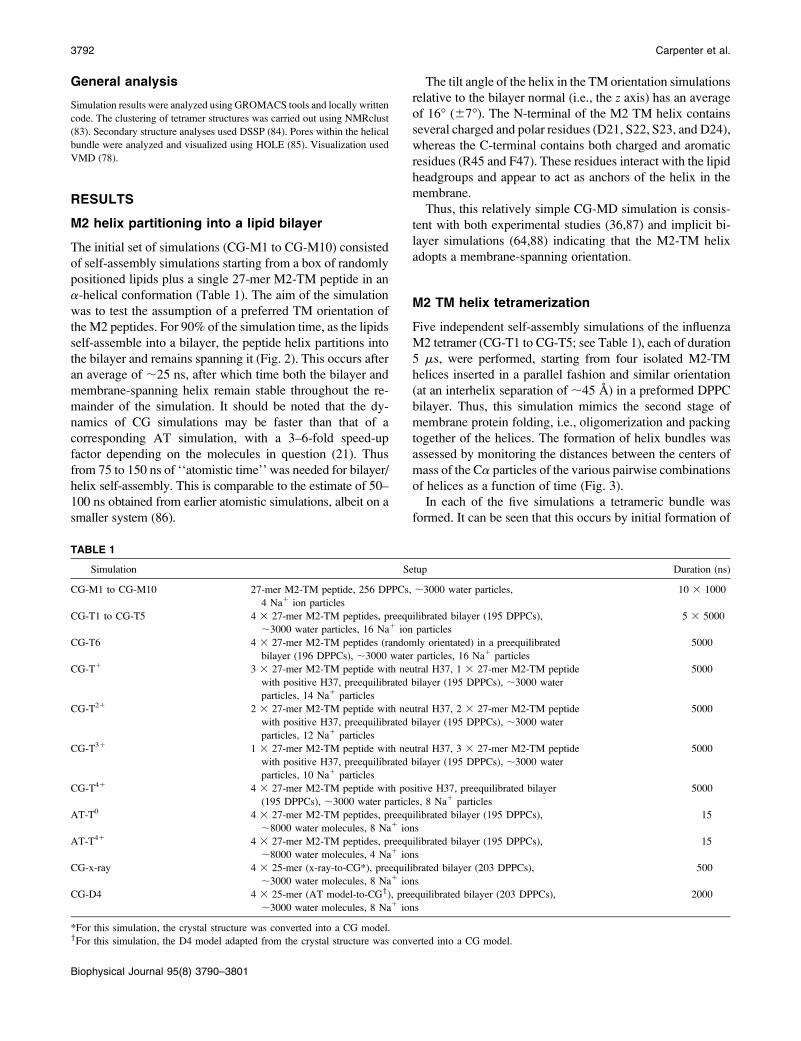
FIGURE 3 Distances between the centers of mass of the helices as they
aggregate together into a tetramer (A), and snapshots of the positions of the
helices (B) as tetramerization takes place. Helix 1, blue; helix 2, red; helix 3,
gray; and helix 4, orange. This indicates that helices 1 and 4 form a dimer
after ;120 ns, which becomes a trimer (with helix 2) ;100 ns later. A four-
helix aggregate is formed after ;530 ns, which then rearranges into a left-
handed helical bundle.
FIGURE 4 Ensemble represents conformations 1–4 rotated by 90�, 180�,
or 270� so that they can all be superimposed upon one another.
FIGURE 2 Snapshots of the system during the bilayer-
forming simulation, showing the helix partitioning into the
bilayer as it forms (water particles omitted for clarity). The
helix partitions into the arranging lipids that form a stable
bilayer after ;23 ns. This bilayer remains intact (and the
helix continues to span the bilayer) for the remainder of the
simulation.
CG Simulations of the M2 Channel 3793
Biophysical Journal 95(8) 3790–3801
the ensemble structure shown in Fig. 4 has 23 rotational
symmetry. Interestingly, such symmetry has been seen in
some atomistic simulations of M2 models (90).
From visual inspection, the helix bundle is clearly left-
handed, in agreement with previously published data (36).
During the simulation, the average tilt angle of the helices is
16� 6 7�. This result is comparable to some experimental
estimates of the tilt angle (14� 6 5� (91)), but somewhat less
that other findings (33� 6 3� (36), 37� 6 3� (40), 32� 6 6�(87)). Although there appears to be a discrepancy between
the calculated tilt angle for the CG system and some other
experimental data, it is worth noting that these experiments
were carried out in DMPC (36,40,87), whereas the CG-MD
simulations presented here utilized DPPC, which would be
expected to result in a ;4 A thicker hydrophobic core than in
a DMPC bilayer (92). However, it should be mentioned that
due to the granularity of the CG lipid model, the CG-DPPC
molecule in our simulations represents lipid tails of 14–18
carbons in length (21,33). Despite this, however, our simu-
lations reveal a bilayer thickness (defined by the phosphate–
phosphate distance) of ;39 A, which more closely resembles
the corresponding distance in DPPC (37 A) (93). It might
be anticipated that in a wider lipid bilayer the tilt angle will
be lower. Indeed, previous work stated that the conforma-
tion of M2 depends on the lipid bilayer environment (55),
with a thicker hydrophobic distance resulting in a shallower
tilt angle. It is also worth noting that the experimentally
derived model that most closely matches the CG simula-
tion (14� 6 5� (91)) was based on data obtained from M2
channels expressed in Xenopus laevis oocytes. Furthermore,
the tilt angle in the recent NMR structure in DHPC micelles
(67) is ;15�.
The average crossing angle between sequential helices was
calculated at 21� 6 7� This compares well with the experi-
mentally derived model value of 19� (91). The orientation of
the helices relative to each other was such that the proposed
pore-lining residues (V27, A30, S31, G34, H37, F38, and
W41) (91,94,95) are indeed facing the center of the helix
bundle. The side-chain particles for the important pore-gating
residues, H37 and W41 (see Fig. 6), were also observed to
form two rings of constriction within the center of the helix
bundle that occluded the pore (see below). In agreement with
recent atomistic simulations (96), the V27 region was also
seen to form a narrow passage in the pore.
The interhelix distances discussed so far were calculated
using the center of mass of all of the backbone particles.
Further analysis of the interhelix distance was carried out by
dividing the helices into N- and C-terminal segments (where
the N-terminus was defined as the center of mass of the
backbone particles for the first five residues of the helix, and
the C-terminus for the last five residues). The average adja-
cent (i.e., not diagonal) helix–helix distance for the N-ter-
minus was 9.6 6 0.1 A (9.5 A, 9.4 A, 9.6 A, and 9.7 A for
helices 1-3, 3-2, 2-4, and 4-1, respectively), whereas for the
C-terminus the corresponding distance was 14.0 6 0.2 A
(14.1 A, 14.2 A, 13.7 A, and 14.1 A for helices 1-3, 3-2, 2-4,
and 4-1, respectively). Thus the N-terminal segments of the
helices are packed more closely together than the C-terminal
segments. Again, this seems to agree with available structural
data. A further simulation (simulation CG-T6, Table 1) was
also run in which the helices were orientated randomly (by
random rotations about their bilayer normal axes) in the bi-
layer. This resulted in the same converged conformation,
with representatives being within 2 A of the central structure
of the main ensemble produced from simulations CG-T1 to
CG-T5 (Fig. 4).
Thus, overall, the ensemble of bundle structures agrees
well with previous structural data, other than in the departure
from exact 43 rotational symmetry. Indeed, recent x-ray
studies of the M2 TM tetramer (66) suggest that local devi-
ations from exact 43 symmetry may occur.
Dynamics of the helical bundle
The CG simulations of the tetrameric helix bundle were
further analyzed in terms of possible switching between al-
ternative conformations. From analysis of the interhelical
distances (Fig. 5), it is evident that switching occurs on a
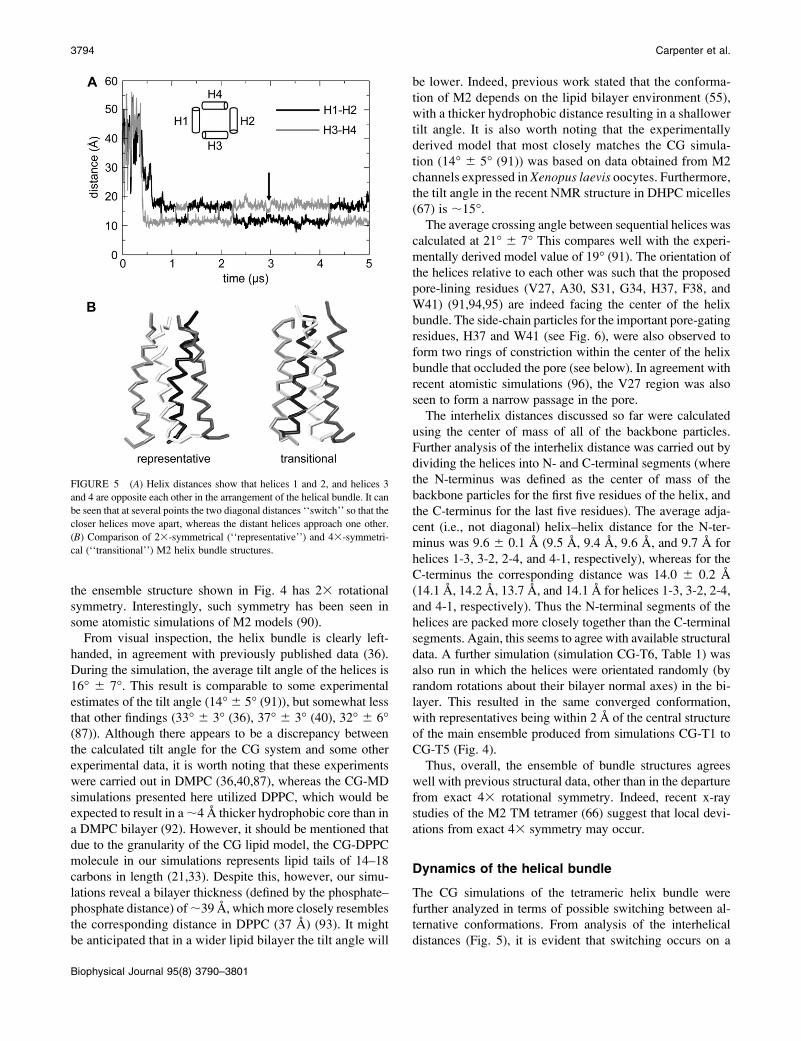
FIGURE 5 (A) Helix distances show that helices 1 and 2, and helices 3
and 4 are opposite each other in the arrangement of the helical bundle. It can
be seen that at several points the two diagonal distances ‘‘switch’’ so that the
closer helices move apart, whereas the distant helices approach one other.
(B) Comparison of 23-symmetrical (‘‘representative’’) and 43-symmetri-
cal (‘‘transitional’’) M2 helix bundle structures.
3794 Carpenter et al.
Biophysical Journal 95(8) 3790–3801
;1 ms timescale between two alternative twofold symmet-
rical structures. In one of these two conformations, helices
H1 and H2 are farthest from each other, whereas in the other
the most distant helices are H3 and H4. The distances be-
tween these helices versus time (Fig. 5) suggest that these
two conformations switch back and forth in a concerted
motion, with helices H1 and H2 moving toward each other
as helices H3 and H4 move apart. In addition, occasionally
a ‘‘transitional conformation’’ between the two is observed
(e.g., as indicated by the vertical arrow in Fig. 5). A more
detailed examination of this structure suggests that dur-
ing the transition the average tilt angle of the helices (;10�)
is less than that during the simulation as a whole (;16�).
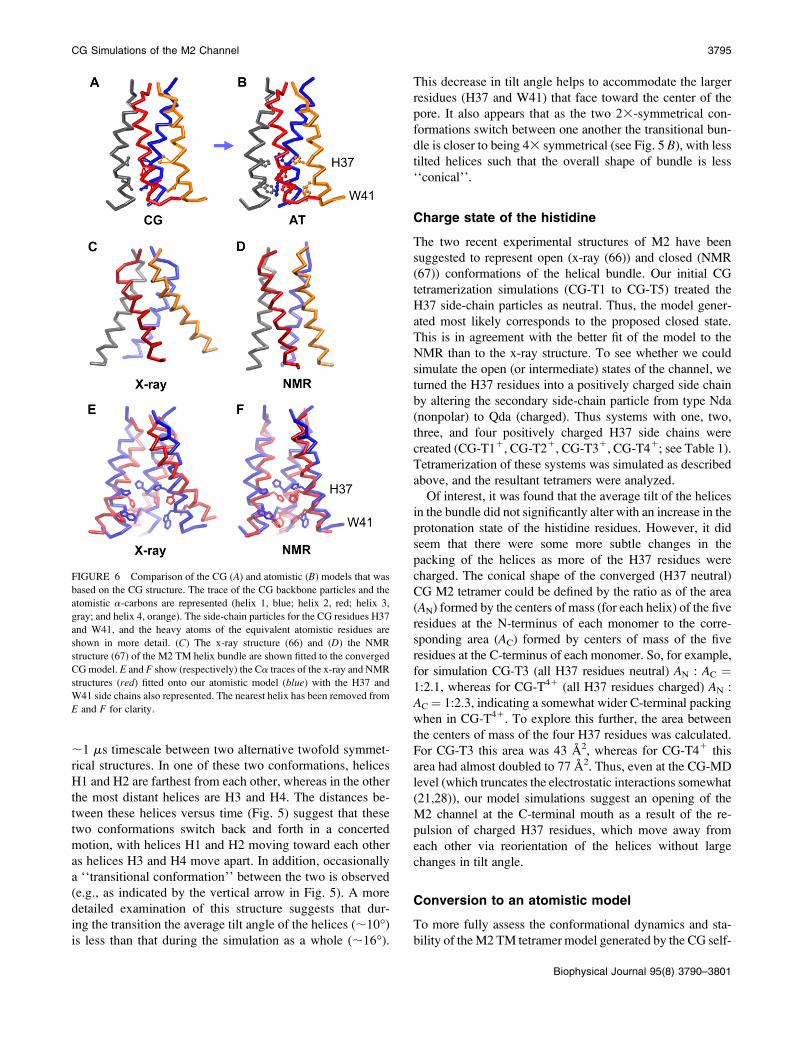
This decrease in tilt angle helps to accommodate the larger
residues (H37 and W41) that face toward the center of the
pore. It also appears that as the two 23-symmetrical con-
formations switch between one another the transitional bun-
dle is closer to being 43 symmetrical (see Fig. 5 B), with less
tilted helices such that the overall shape of bundle is less
‘‘conical’’.
Charge state of the histidine
The two recent experimental structures of M2 have been
suggested to represent open (x-ray (66)) and closed (NMR
(67)) conformations of the helical bundle. Our initial CG
tetramerization simulations (CG-T1 to CG-T5) treated the
H37 side-chain particles as neutral. Thus, the model gener-
ated most likely corresponds to the proposed closed state.
This is in agreement with the better fit of the model to the
NMR than to the x-ray structure. To see whether we could
simulate the open (or intermediate) states of the channel, we
turned the H37 residues into a positively charged side chain
by altering the secondary side-chain particle from type Nda
(nonpolar) to Qda (charged). Thus systems with one, two,
three, and four positively charged H37 side chains were
created (CG-T11, CG-T21, CG-T31, CG-T41; see Table 1).
Tetramerization of these systems was simulated as described
above, and the resultant tetramers were analyzed.
Of interest, it was found that the average tilt of the helices
in the bundle did not significantly alter with an increase in the
protonation state of the histidine residues. However, it did
seem that there were some more subtle changes in the
packing of the helices as more of the H37 residues were
charged. The conical shape of the converged (H37 neutral)
CG M2 tetramer could be defined by the ratio as of the area
(AN) formed by the centers of mass (for each helix) of the five
residues at the N-terminus of each monomer to the corre-
sponding area (AC) formed by centers of mass of the five
residues at the C-terminus of each monomer. So, for example,
for simulation CG-T3 (all H37 residues neutral) AN : AC ¼1:2.1, whereas for CG-T41 (all H37 residues charged) AN :
AC¼ 1:2.3, indicating a somewhat wider C-terminal packing
when in CG-T41. To explore this further, the area between
the centers of mass of the four H37 residues was calculated.
For CG-T3 this area was 43 A2, whereas for CG-T41 this
area had almost doubled to 77 A2. Thus, even at the CG-MD
level (which truncates the electrostatic interactions somewhat
(21,28)), our model simulations suggest an opening of the
M2 channel at the C-terminal mouth as a result of the re-
pulsion of charged H37 residues, which move away from
each other via reorientation of the helices without large
changes in tilt angle.
Conversion to an atomistic model
To more fully assess the conformational dynamics and sta-
bility of the M2 TM tetramer model generated by the CG self-
FIGURE 6 Comparison of the CG (A) and atomistic (B) models that was
based on the CG structure. The trace of the CG backbone particles and the
atomistic a-carbons are represented (helix 1, blue; helix 2, red; helix 3,
gray; and helix 4, orange). The side-chain particles for the CG residues H37
and W41, and the heavy atoms of the equivalent atomistic residues are
shown in more detail. (C) The x-ray structure (66) and (D) the NMR
structure (67) of the M2 TM helix bundle are shown fitted to the converged
CG model. E and F show (respectively) the Ca traces of the x-ray and NMR
structures (red) fitted onto our atomistic model (blue) with the H37 and
W41 side chains also represented. The nearest helix has been removed from
E and F for clarity.
CG Simulations of the M2 Channel 3795
Biophysical Journal 95(8) 3790–3801

assembly simulations, the CG structure was converted to an
atomistic model, which was then the starting point for con-
ventional atomistic simulations. To convert the CG protein
model, Modeller v7.7 (http://www.salilab.org/modeller/)
was used, with the backbone particles of the CG model as a
template for the Ca atoms. An ensemble of 1000 models was
produced, which was subsequently filtered in terms of RMSD
(for the backbone positions and also for key side-chain po-
sitions) to yield the atomistic model that best fitted the input
CG model. To convert the CG lipid bilayer to an atomistic
equivalent, we used a library of 1500 different conformations
of DPPC molecules derived from an atomistic simulation of a
pure DPPC bilayer. For each CG lipid, the entire library was
searched to determine which atomistic conformation pro-
vided the best matches (defined via the RMSD of the 12 CG
particles against their atomistic equivalents). These AT lipid
molecules were then superimposed onto their CG counter-
parts, and concatenated together with the AT protein model.
The resultant AT system was then energy-minimized before
solvation and addition of counterions.
The outcome of this conversion procedure is illustrated in
Fig. 6, A and B. The RMSD between the CG protein con-
formation and the modeled atomistic structure is 1.9 A (cal-
culated using the CG backbone particles versus the Ca atoms
plus the side-chain particles against the corresponding side-
chain atoms), with a backbone-Ca RMSD of 0.7 A. In par-
ticular, it can be seen that the AT model has an overall conical
shape, with the side chains of H37 and W41 directed toward
the interior of the pore.
The conformational dynamics and stability of the resultant
AT model were assessed in a pair of related MD simulations
(Table 1 and Fig. 7). In simulation AT-T0 the four H37 res-
idues were in their neutral (i.e., unprotonated) state, whereas
in simulation AT-T41 all four histidines were protonated.
Comparing the Ca RMSDs for the two simulations (Fig. 7 A),
it can be seen that the conformational drift is, as anticipated,
substantially less for the AT-T0 simulation than for the AT-
T41 simulation. For the AT-T0 simulation the Ca RMSD
after ;15 ns is ;3.5 A relative to the starting structure. This
is comparable to that seen in, e.g., simulations of low-reso-
lution x-ray or EM structures (97). The profile of Ca root
mean-square fluctuation versus residue (Fig. 7 B) suggests
that fluctuations in the vicinity of the H37 are low for AT-T0,
and somewhat higher for AT-T41. Significantly, over the 15
ns of the simulations (for both AT-T0 and AT-T41), the di-
agonal helix–helix distances (i.e., between H1 and H2, and
between H3 and H4) change by ,1 A. Thus, these simula-
tions confirm that switching between the two 23-symmet-
rical structures (seen in the CG simulations on a ;1 ms
timescale) is not seen on the much shorter timescale of the
atomistic simulations.
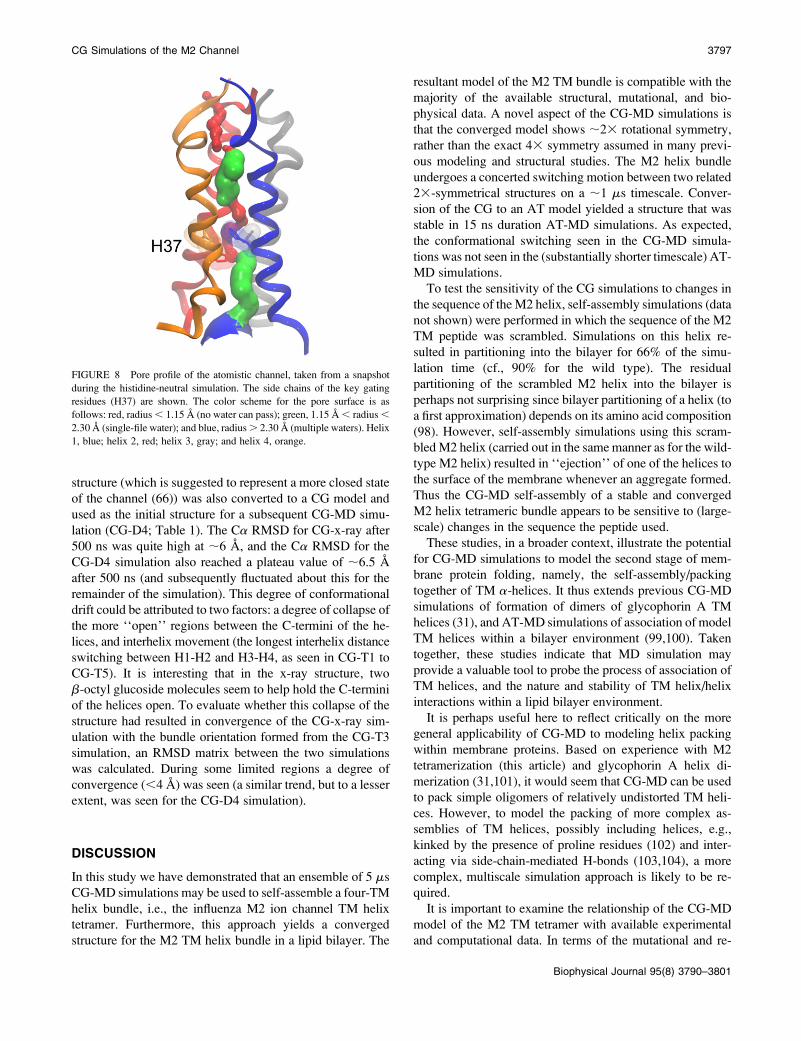
The atomistic model pore (at t¼ 0.25 ns from AT-T0; Fig.
8) was analyzed in terms of the central pore using HOLE
(85). Two constrictions to the central pore were observed:
one at the N-terminus and one in the vicinity of the H37 side
chains, the latter suggesting that this model may correspond
to a closed conformation of the channel. A comparable
N-terminal constriction is observed in the recently determined
x-ray structure (66) and in some recent simulations based on
models (e.g., (62,90). This N-terminal constriction is also in
the vicinity of V27, which has been suggested to form an
amantadine-sensitive ‘‘second gate’’ (96). A constriction is
also seen in the recent NMR structure (67) around the H37
region. The pore radius profile of the atomistic model (see
Supplementary Material, Data S1) shows that whereas the
N-terminal region more closely resembles the N-terminal of the
x-ray structure, the C-terminal region more closely resembles
that of the NMR structure, with a smaller cavity in the center.
This model was also compared with the crystal structure of
the M2 TM helix bundle (Fig. 6 C) (66). The initial RMSD
for the Ca atoms of the AT-T0 starting conformation against
the x-ray structures is relatively high (5 A) and the corre-
sponding plateau value during the AT-T0 simulation was 5.6 A.
The x-ray structure was also compared with the initial CG
simulations that were used to form the tetramer (CG-T3 in
particular) to see whether the crystal conformation was
sampled at any point throughout the CG bundle dynamics.
The minimum RMSD observed was 3.9 A. In a further
comparison, the x-ray structure (Fig. 6 C) was converted into
a CG model and used to initiate a further simulation (CG-
x-ray; see Table 1). The D4 model constructed from the x-ray
FIGURE 7 RMSD (top) and RMSF (bottom) for the two atomistic sim-
ulations containing the histidine-neutral (solid) system and the histidine-41
(shaded) system.
3796 Carpenter et al.
Biophysical Journal 95(8) 3790–3801
structure (which is suggested to represent a more closed state
of the channel (66)) was also converted to a CG model and
used as the initial structure for a subsequent CG-MD simu-
lation (CG-D4; Table 1). The Ca RMSD for CG-x-ray after
500 ns was quite high at ;6 A, and the Ca RMSD for the
CG-D4 simulation also reached a plateau value of ;6.5 A
after 500 ns (and subsequently fluctuated about this for the
remainder of the simulation). This degree of conformational
drift could be attributed to two factors: a degree of collapse of
the more ‘‘open’’ regions between the C-termini of the he-
lices, and interhelix movement (the longest interhelix distance
switching between H1-H2 and H3-H4, as seen in CG-T1 to
CG-T5). It is interesting that in the x-ray structure, two
b-octyl glucoside molecules seem to help hold the C-termini
of the helices open. To evaluate whether this collapse of the
structure had resulted in convergence of the CG-x-ray sim-
ulation with the bundle orientation formed from the CG-T3
simulation, an RMSD matrix between the two simulations
was calculated. During some limited regions a degree of
convergence (,4 A) was seen (a similar trend, but to a lesser
extent, was seen for the CG-D4 simulation).
DISCUSSION
In this study we have demonstrated that an ensemble of 5 ms
CG-MD simulations may be used to self-assemble a four-TM
helix bundle, i.e., the influenza M2 ion channel TM helix
tetramer. Furthermore, this approach yields a converged
structure for the M2 TM helix bundle in a lipid bilayer. The
resultant model of the M2 TM bundle is compatible with the
majority of the available structural, mutational, and bio-
physical data. A novel aspect of the CG-MD simulations is
that the converged model shows ;23 rotational symmetry,
rather than the exact 43 symmetry assumed in many previ-
ous modeling and structural studies. The M2 helix bundle
undergoes a concerted switching motion between two related
23-symmetrical structures on a ;1 ms timescale. Conver-
sion of the CG to an AT model yielded a structure that was
stable in 15 ns duration AT-MD simulations. As expected,
the conformational switching seen in the CG-MD simula-
tions was not seen in the (substantially shorter timescale) AT-
MD simulations.
To test the sensitivity of the CG simulations to changes in
the sequence of the M2 helix, self-assembly simulations (data
not shown) were performed in which the sequence of the M2
TM peptide was scrambled. Simulations on this helix re-
sulted in partitioning into the bilayer for 66% of the simu-
lation time (cf., 90% for the wild type). The residual
partitioning of the scrambled M2 helix into the bilayer is
perhaps not surprising since bilayer partitioning of a helix (to
a first approximation) depends on its amino acid composition
(98). However, self-assembly simulations using this scram-
bled M2 helix (carried out in the same manner as for the wild-
type M2 helix) resulted in ‘‘ejection’’ of one of the helices to
the surface of the membrane whenever an aggregate formed.
Thus the CG-MD self-assembly of a stable and converged
M2 helix tetrameric bundle appears to be sensitive to (large-
scale) changes in the sequence the peptide used.
These studies, in a broader context, illustrate the potential
for CG-MD simulations to model the second stage of mem-
brane protein folding, namely, the self-assembly/packing
together of TM a-helices. It thus extends previous CG-MD
simulations of formation of dimers of glycophorin A TM
helices (31), and AT-MD simulations of association of model
TM helices within a bilayer environment (99,100). Taken
together, these studies indicate that MD simulation may
provide a valuable tool to probe the process of association of
TM helices, and the nature and stability of TM helix/helix
interactions within a lipid bilayer environment.
It is perhaps useful here to reflect critically on the more
general applicability of CG-MD to modeling helix packing
within membrane proteins. Based on experience with M2
tetramerization (this article) and glycophorin A helix di-
merization (31,101), it would seem that CG-MD can be used
to pack simple oligomers of relatively undistorted TM heli-
ces. However, to model the packing of more complex as-
semblies of TM helices, possibly including helices, e.g.,
kinked by the presence of proline residues (102) and inter-
acting via side-chain-mediated H-bonds (103,104), a more
complex, multiscale simulation approach is likely to be re-
quired.
It is important to examine the relationship of the CG-MD
model of the M2 TM tetramer with available experimental
and computational data. In terms of the mutational and re-
FIGURE 8 Pore profile of the atomistic channel, taken from a snapshot
during the histidine-neutral simulation. The side chains of the key gating
residues (H37) are shown. The color scheme for the pore surface is as
follows: red, radius , 1.15 A (no water can pass); green, 1.15 A , radius ,
2.30 A (single-file water); and blue, radius . 2.30 A (multiple waters). Helix
1, blue; helix 2, red; helix 3, gray; and helix 4, orange.
CG Simulations of the M2 Channel 3797
Biophysical Journal 95(8) 3790–3801
lated functional data, the CG-MD model is consistent in that
it suggests that the key side chains (e.g., H37 and W41) are
directed toward the center of the four-helix bundle.
A number of previous studies of self-assembly of the M2
tetramer (64,65) and of the stability of the related HIV Vpu
channel TM helix pentamer (105) have employed MD sim-
ulations combining an atomistic protein model with a con-
tinuum model for the lipid bilayer and solvent. These
simulations assumed N-fold rotational symmetry of the helix
bundle. Here we relax this assumption, and the resultant
simulations suggest the existence of a 23-symmetrical
(closed) state. There is also some evidence for departure from
exact 43 rotational symmetry of the M2 channel in the recent
x-ray crystallographic structure (66). Indeed, this structure
seems to more closely match our model than the subsequent
(exactly 43 rotationally symmetric) model, D4, that was
generated from the crystal structure. It is possible that such
loss of symmetry would be more difficult to detect in NMR
experiments. For example, the recent NMR structure (Fig.
6 D) determined in DHPC micelles was generated using C4
rotational symmetry (67). However, the helix tilt angle in the
NMR model (;15�) is close to that of the CG-MD generated
model (;16�).
It is also productive to reflect on some of the limitations of
the computational methodology used in this study. The CG
force field employed is relatively simple, although it has been
tested for membrane peptides and protein against a range of
experimental data (28,30). Furthermore, this and related CG
models have been used successfully to characterize the in-
teractions of integral proteins (106) with lipid bilayers, to
probe lipid bilayer deformation by integral membrane pro-
teins (32,33), and to explore bilayer/protein coupling in
gating of mechanosensitive channels (107). Refinement of
the force field for lipids was recently reported (29), and this
refinement has been extended to peptides and proteins (108).
It will therefore be important to explore the sensitivity/ro-
bustness of our conclusions to such improvements in the CG
force field.
We used our converged CG model of the M2 helix bundle
as the starting point for a (brief) AT-MD simulation. Another
possible means of capturing atomistic detail is to combine CG
and AT components within the same simulation (25,26,109–
111). Such an approach may provide a more accurate, yet still
computationally feasible, route to modeling self-assembly of
TM helix bundles. We also would like to explore a more
sophisticated (and possibly automated (112)) approach to
initiation and implementation of CG / AT switching.
For example, one might consider that an appropriate switch
time would be shortly after a transition between the two
23-symmatrical bundle conformations. This can be deter-
mined by monitoring, e.g., the pattern of interhelix distances
as the CG-MD simulation proceeds and thus automatically
initiating the switch to AT-MD. Thus a single long (multi-
microseconds) CG-MD simulation could spawn an ensemble
of shorter (multi-nanoseconds) AT-MD simulations.
In terms of future directions of these studies, it will be of
interest to extend the approach to self-assembly of TM helix
bundles (e.g., phospholamban (J. Vorel and M. S. P. Sansom,
unpublished results)), to TM helix hairpins fragments from
more complex membrane proteins (28), and ultimately to
multipass membrane protein helix bundles. In this way it may
be possible to develop CG-MD as a component of a multi-
scale approach for predicting membrane protein structure via
simulation.
SUPPLEMENTARY MATERIAL
To view all of the supplemental files associated with this
article, visit www.biophysj.org.
We thank the Biotechnology and Biological Sciences Research Council
(BBSRC) and the Wellcome Trust for funding. T.C. was supported by a
BBSRC research studentship. We also thank our colleagues (especially
Philip Biggin and Chee Chew) for helpful discussions concerning this
article, and Bill DeGrado for valuable discussions and for providing us with
access to the M2 x-ray structure for comparison with the CG models.
REFERENCES
1. Hopkins, A. L., and C. R. Groom. 2002. The druggable genome. Nat.Rev. Drug Discov. 1:727–730.
2. Russ, A. P., and S. Lampel. 2005. The druggable genome: an update.Drug Discov. Today. 10:1607–1610.
3. Berman, H. M., J. Westbrook, Z. Feng, G. Gilliland, T. N. Bhat, H.Weissig, I. N. Shindyalov, and P. E. Bourne. 2000. The Protein DataBank. Nucleic Acids Res. 28:235–242.
4. White, S. H. 2004. The progress of membrane protein structuredetermination. Protein Sci. 13:1948–1949.
5. Fleishman, S. J., V. M. Unger, and N. Ben-Tal. 2006. Transmembraneprotein structures without X-rays. Trends Biochem. Sci. 31:106–113.
6. Popot, J. L., and D. M. Engelman. 1990. Membrane protein foldingand oligomerization: the two-state model. Biochemistry. 29:4031–4037.
7. Engelman, D. M., Y. Chen, C. Chin, R. Curran, A. M. Dixon, A.Dupuy, A. Lee, U. Lehnert, E. Mathews, Y. Reshetnyak, A. Senes,and J. L. Popot. 2003. Membrane protein folding: beyond the twostage model. FEBS Lett. 555:122–125.
8. White, S. H., and G. von Heijne. 2004. The machinery of membraneprotein assembly. Curr. Opin. Struct. Biol. 14:397–404.
9. Bowie, J. U. 2005. Solving the membrane protein folding problem.Nature. 438:581–589.
10. Booth, P. J., S. L. Flitsch, L. J. Stern, D. A. Greenhalgh, P. S. Kim,and H. G. Khorana. 1995. Intermediates in the folding of themembrane-protein bacteriorhodopsin. Nat. Struct. Biol. 2:139–143.
11. Lu, H., and P. J. Booth. 2000. The final stages of folding of themembrane protein bacteriorhodopsin occur by kinetically indistin-guishable parallel folding paths that are mediated by pH. J. Mol. Biol.299:233–243.
12. Dill, K. A., and H. S. Chan. 1997. From Levinthal to pathways tofunnels. Nat. Struct. Biol. 4:10–19.
13. Snow, C. D., E. J. Sorin, Y. M. Rhee, and V. S. Pande. 2004. Howwell can simulation predict protein folding kinetics and thermody-namics? Annu. Rev. Biophys. Biomol. Struct. 34:43–69.
14. Simmerling, C., B. Strockbine, and A. E. Roitberg. 2002. All-atomstructure prediction and folding simulations of a stable protein. J. Am.Chem. Soc. 124:11258–11259.
3798 Carpenter et al.
Biophysical Journal 95(8) 3790–3801
15. Chowdhury, S., M. C. Lee, G. Xiong, and Y. Duan. 2003. Ab initiofolding simulation of the trp-cage mini-protein approaches NMRresolution. J. Mol. Biol. 327:711–717.
16. Kubelka, J., J. Hofrichter, and W. A. Eaton. 2004. The protein folding‘‘speed limit.’’ Curr. Opin. Struct. Biol. 14:76–88.
17. Bond, P. J., and M. S. P. Sansom. 2003. Membrane protein dynamicsvs. environment: simulations of OmpA in a micelle and in a bilayer.J. Mol. Biol. 329:1035–1053.
18. Ash, W. L., M. R. Zlomislic, E. O. Oloo, and D. P. Tieleman. 2004.Computer simulations of membrane proteins. Biochim. Biophys. Acta.1666:158–189.
19. Gumbart, J., Y. Wang, A. Aksimentiev, E. Tajkhorshid, and K.Schulten. 2005. Molecular dynamics simulations of proteins in lipidbilayers. Curr. Opin. Struct. Biol. 15:423–431.
20. Shelley, J. C., M. Y. Shelley, R. C. Reeder, S. Bandyopadhyay, andM. L. Klein. 2001. A coarse grain model for phospholipid simula-tions. J. Phys. Chem. B. 105:4464–4470.
21. Marrink, S. J., A. H. de Vries, and A. E. Mark. 2004. Coarse grainedmodel for semiquantitative lipid simulations. J. Phys. Chem. B. 108:750–760.
22. Murtola, T., E. Falck, M. Patra, M. Karttunen, and I. Vattulainen.2004. Coarse-grained model for phospholipid/cholesterol bilayer.J. Chem. Phys. 121:9156–9165.
23. Nielsen, S. O., C. F. Lopez, G. Srinivas, and M. L. Klein. 2004.Coarse grain models and the computer simulation of soft materials.J. Phys. Condens. Matter. 16:R481–R512.
24. Stevens, M. J. 2004. Coarse-grained simulations of lipid bilayers.J. Chem. Phys. 121:11942–11948.
25. Izvekov, S., and G. A. Voth. 2005. A multiscale coarse-grainingmethod for biomolecular systems. J. Phys. Chem. B. 109:2469–2473.
26. Shi, Q., S. Izvekov, and G. A. Voth. 2006. Mixed atomistic andcoarse-grained molecular dynamics: simulation of a membrane boundion channel. J. Phys. Chem. B. 110:15045–15048.
27. Shih, A. Y., A. Arkhipov, P. L. Freddolino, and K. Schulten. 2006.Coarse grained protein-lipid model with application to lipoproteinparticles. J. Phys. Chem. B. 110:3674–3684.
28. Bond, P. J., J. Holyoake, A. Ivetac, S. Khalid, and M. S. P. Sansom.2007. Coarse-grained molecular dynamics simulations of membraneproteins and peptides. J. Struct. Biol. 157:593–605.
29. Marrink, S. J., J. Risselada, S. Yefimov, D. P. Tieleman, and A. H. deVries. 2007. The MARTINI forcefield: coarse grained model forbiomolecular simulations. J. Phys. Chem. B. 111:7812–7824.
30. Sansom, M. S. P., K. A. Scott, and P. J. Bond. 2008. Coarse grainedsimulation: a high throughput computational approach to membraneproteins. Biochem. Soc. Trans. 36:27–32.
31. Bond, P. J., and M. S. P. Sansom. 2006. Insertion and assembly ofmembrane proteins via simulation. J. Am. Chem. Soc. 128:2697–2704.
32. Bond, P. J., and M. S. P. Sansom. 2007. Bilayer deformation by theKv channel voltage sensor domain revealed by self-assembly simu-lations. Proc. Natl. Acad. Sci. USA. 104:2631–2636.
33. Periole, X., T. Huber, S. J. Marrink, and T. P. Sakmar. 2007. Gprotein-coupled receptors self-assemble in dynamics simulations ofmodel bilayers. J. Am. Chem. Soc. 129:10126–10132.
34. Forrest, L. R., W. F. DeGrado, G. R. Dieckmann, and M. S. P.Sansom. 1998. Two models of the influenza A M2 channel domain:verification by comparison. Fold. Des. 3:443–448.
35. Sansom, M. S. P., L. R. Forrest, and R. Bull. 1998. Viral ion channels:molecular modelling and simulation. Bioessays. 20:992–1000.
36. Kovacs, F. A., and T. A. Cross. 1997. Transmembrane four-helixbundle of influenza A M2 protein channel: structural implicationsfrom helix tilt and orientation. Biophys. J. 73:2511–2517.
37. Song, Z., F. A. Kovacs, J. Wang, J. K. Denny, S. C. Shekar, J. R.Quine, and T. A. Cross. 2000. Transmembrane domain of M2 proteinfrom influenza A virus studied by solid-state 15N polarization inver-sion spin exchange at magic angle NMR. Biophys. J. 79:767–775.
38. Mould, J. A., J. E. Drury, S. M. Frings, U. B. Kaupp, A. Pekosz, R. A.Lamb, and L. H. Pinto. 2000. Permeation and activation of the M2 ionchannel of influenza A virus. J. Biol. Chem. 275:31038–31050.
39. Mould, J. A., H. C. Li, C. S. Dudlak, J. D. Lear, A. Pekosz, R. A.Lamb, and L. H. Pinto. 2000. Mechanism for proton conduction of theM(2) ion channel of influenza A virus. J. Biol. Chem. 275:8592–8599.
40. Kovacs, F. A., J. K. Denny, Z. Song, J. R. Quine, and T. A. Cross.2000. Helix tilt of the M2 transmembrane peptide from influenza Avirus: an intrinsic property. J. Mol. Biol. 295:117–125.
41. Wang, J., S. Kim, F. Kovacs, and T. A. Cross. 2001. Structure of thetransmembrane region of the M2 protein H(1) channel. Protein Sci.10:2241–2250.
42. Okada, A., T. Miura, and H. Takeuchi. 2001. Protonation of histidineand histidine-tryptophan interaction in the activation of the M2 ionchannel from influenza A virus. Biochemistry. 40:6053–6060.
43. Lin, T. I., and C. Schroeder. 2001. Definitive assignment of protonselectivity and attoampere unitary current to the M2 ion channelprotein of influenza A virus. J. Virol. 75:3647–3656.
44. Nishimura, K., S. Kim, L. Zhang, and T. A. Cross. 2002. The closedstate of a H1 channel helical bundle combining precise orientationaland distance restraints from solid state NMR. Biochemistry. 41:13170–13177.
45. Tang, Y., F. Zaitseva, R. A. Lamb, and L. H. Pinto. 2002. The gate ofthe influenza virus M2 proton channel is formed by a single trypto-phan residue. J. Biol. Chem. 277:39880–39886.
46. Howard, K. P., J. D. Lear, and W. F. DeGrado. 2002. Sequencedeterminants of the energetics of folding of a transmembrane four-helix-bundle protein. Proc. Natl. Acad. Sci. USA. 99:8568–8572.
47. Tian, C. L., K. Tobler, R. A. Lamb, L. H. Pinto, and T. A. Cross.2002. Expression and initial structural insights from solid-state NMRof the M2 proton channel from influenza A virus. Biochemistry. 41:11294–11300.
48. Cristian, L., J. D. Lear, and W. F. DeGrado. 2003. Use of thiol-disulfide equilibria to measure the energetics of assembly of trans-membrane helices in phospholipid bilayers. Proc. Natl. Acad. Sci.USA. 100:14772–14777.
49. Chizhmakov, I. V., D. C. Ogden, F. M. Geraghty, A. Hayhurst, A.Skinner, T. Betakova, and A. J. Hay. 2003. Differences in conduc-tance of M2 proton channels of two influenza viruses at low and highpH. J. Physiol. 546:427–438.
50. Tian, C. L., P. F. Gao, L. H. Pinto, R. A. Lamb, and T. A. Cross.2003. Initial structural and dynamic characterization of the M2 proteintransmembrane and amphipathic helices in lipid bilayers. Protein Sci.12:2597–2605.
51. Vijayvergiya, V., R. Wilson, A. Chorak, P. F. Gao, T. A. Cross, andD. D. Busath. 2004. Proton conductance of influenza virus M2 proteinin planar lipid bilayers. Biophys. J. 87:1697–1704.
52. Czabotar, P. E., S. R. Martin, and A. J. Hay. 2004. Studies ofstructural changes in the M2 proton channel of influenza A virus bytryptophan fluorescence. Virus Res. 99:57–61.
53. Venkataraman, P., R. A. Lamb, and L. H. Pinto. 2005. Chemicalrescue of histidine selectivity filter mutants of the M2 ion channel ofinfluenza A virus. J. Biol. Chem. 280:21463–21472.
54. Kass, I., and I. T. Arkin. 2005. How pH opens a H1 channel: thegating mechanism of influenza A M2. Structure. 13:1789–1798.
55. Duong-Ly, K. C., V. Nanda, W. F. Degrad, and K. P. Howard. 2005.The conformation of the pore region of the M2 proton channeldepends on lipid bilayer environment. Protein Sci. 14:856–861.
56. Stouffer, A. L., V. Nanda, J. D. Lear, and W. F. DeGrado. 2005.Sequence determinants of a transmembrane proton channel: An inverserelationship between stability and function. J. Mol. Biol. 347:169–179.
57. Betakova, T., F. Ciampor, and A. J. Hay. 2005. Influence of residue44 on the activity of the M2 proton channel of influenza A virus.J. Gen. Virol. 86:181–184.
58. Hu, J., R. Fu, K. Nishimura, L. Zhang, H. X. Zhou, D. D. Busath, V.Vijayvergiya, and T. A. Cross. 2006. Histidines, heart of the hydrogen
CG Simulations of the M2 Channel 3799
Biophysical Journal 95(8) 3790–3801

ion channel from influenza A virus: toward an understanding ofconductance and proton selectivity. Proc. Natl. Acad. Sci. USA. 103:6865–6870.
59. Zhong, Q., T. Husslein, P. B. Moore, D. M. Newns, P. Pattnaik, andM. L. Klein. 1998. The M2 channel of influenza A virus:- a moleculardynamics study. FEBS Lett. 434:265–271.
60. Zhong, Q., D. M. Newns, P. Pattnaik, J. D. Lear, and M. L. Klein.2000. Two possible conducting states of the influenza A virus M2 ionchannel. FEBS Lett. 473:195–198.
61. Forrest, L. R., A. Kukol, I. T. Arkin, D. P. Tieleman, and M. S. P.Sansom. 2000. Exploring models of the Influenza A M2 channel:-MD Simulations in a lipid bilayer. Biophys. J. 78:55–69.
62. Smondyrev, A. M., and G. A. Voth. 2002. Molecular dynamicssimulation of proton transport through the influenza A virus M2channel. Biophys. J. 83:1987–1996.
63. Wu, Y., and G. A. Voth. 2005. A computational study of the closedand open states of the influenza a M2 proton channel. Biophys. J. 89:2402–2411.
64. Im, W., M. Feig, and C. L. Brooks. 2003. An implicit membranegeneralized Born theory for the study of structure, stability, andinteractions of membrane proteins. Biophys. J. 85:2900–2918.
65. Bu, L., W. Im, and C. L. Brooks. 2007. Membrane assembly ofsimple helix homo-oligomers studied via molecular dynamics simu-lations. Biophys. J. 92:854–863.
66. Stouffer, A. L., R. Acharya, D. Salom, A. S. Levine, L. Di Costanzo,C. S. Soto, V. Tereshko, V. Nanda, S. Stayrook, and W. F. DeGrado.2008. Structural basis for the function and pharmaceutical inhibitionof an influenza virus proton channel. Nature. 451:596–599.
67. Schnell, J. R., and J. J. Chou. 2008. Structure and mechanism of theM2 proton channel of influenza A virus. Nature. 451:591–595.
68. Forrest, L. R., D. P. Tieleman, and M. S. P. Sansom. 1999. Definingthe transmembrane helix of M2 protein from influenza A by molec-ular dynamics simulations in a lipid bilayer. Biophys. J. 76:1886–1896.
69. Lamb, R. A., S. L. Zebedee, and C. D. Richardson. 1985. Influenzavirus M2 protein is an integral membrane protein expressed on theinfected-cell surface. Cell. 40:627–633.
70. Grambas, S., M. S. Bennett, and A. J. Hay. 1992. Influence ofamantadine resistance mutations on the pH regulatory function of theM2 protein of influenza A viruses. Virology. 191:541–549.
71. Cuthbertson, J. M., D. A. Doyle, and M. S. P. Sansom. 2005.Transmembrane helix prediction: a comparative evaluation and anal-ysis. Protein Eng. Des. Sel. 18:295–308.
72. Sali, A., and T. L. Blundell. 1993. Comparative protein modeling bysatisfaction of spatial restraints. J. Mol. Biol. 234:779–815.
73. Marti-Renom, M. A., A. Stuart, A. Fiser, R. Sanchez, F. Melo, and A.Sali. 2000. Comparative protein structure modelling of genes andgenomes. Annu. Rev. Biophys. Biomol. Struct. 29:291–325.
74. Fiser, A., R. Kinh Gian Do, and A. Sali. 2000. Modeling of loops inprotein structures. Protein Sci. 9:1753–1773.
75. Berendsen, H. J. C., D. van der Spoel, and R. van Drunen. 1995.GROMACS: a message-passing parallel molecular dynamics imple-mentation. Comput. Phys. Commun. 95:43–56.
76. Lindahl, E., B. Hess, and D. van der Spoel. 2001. GROMACS 3.0: apackage for molecular simulation and trajectory analysis. J. Mol.Model. 7:306–317.
77. Berendsen, H. J. C., J. P. M. Postma, W. F. van Gunsteren, A.DiNola, and J. R. Haak. 1984. Molecular dynamics with coupling toan external bath. J. Chem. Phys. 81:3684–3690.
78. Humphrey, W., A. Dalke, and K. Schulten. 1996. VMD—visualmolecular dynamics. J. Mol. Graph. 14:33–38.
79. van Gunsteren, W. F., P. Kruger, S. R. Billeter, A. E. Mark, A. A.Eising, W. R. P. Scott, P. H. Huneberger, and I. G. Tironi. 1996.Biomolecular Simulation: The GROMOS96 Manual and User Guide.Zurich, Switzerland/Groningen, The Netherlands, Biomos & Hoch-schulverlag AG an der ETH Zurich.
80. Scott, W. R. P., P. H. Hunenberger, I. G. Tironi, A. E. Mark, S. R.Billeter, J. Fennen, A. E. Torda, T. Huber, P. Kruger, and W. F. vanGunsteren. 1999. The GROMOS biomolecular simulation programpackage. J. Phys. Chem. A. 103:3596–3607.
81. Darden, T., D. York, and L. Pedersen. 1993. Particle mesh Ewald—anN.log(N) method for Ewald sums in large systems. J. Chem. Phys.98:10089–10092.
82. Hess, B., H. Bekker, H. J. C. Berendsen, and J. G. E. M. Fraaije.1997. LINCS: a linear constraint solver for molecular simulations.J. Comput. Chem. 18:1463–1472.
83. Kelley, L. A., S. P. Gardner, and M. J. Sutcliffe. 1996. An automatedapproach for clustering an ensemble of NMR-derived protein struc-tures into conformationally related subfamilies. Protein Eng. 9:1063–1065.
84. Kabsch, W., and C. Sander. 1983. Dictionary of protein secondarystructure: pattern-recognition of hydrogen-bonded and geometricalfeatures. Biopolymers. 22:2577–2637.
85. Smart, O. S., J. G. Neduvelil, X. Wang, B. A. Wallace, and M. S. P.Sansom. 1996. HOLE: a program for the analysis of the pore dimen-sions of ion channel structural models. J. Mol. Graph. 14:354–360.
86. Esteban-Martin, S., and J. Salgado. 2007. Self-assembling of peptide/membrane complexes by atomistic molecular dynamics simulations.Biophys. J. 92:903–912.
87. Kukol, A., P. D. Adams, L. M. Rice, A. T. Brunger, and I. T. Arkin.1999. Experimentally based orientational refinement of membraneprotein models: a structure for the influenza A M2 H1 channel.J. Mol. Biol. 286:951–962.
88. Ulmschneider, M. B., M. S. P. Sansom, and A. Di Nola. 2006.Evaluating tilt angles of membrane-associated helices: comparison ofcomputational and NMR techniques. Biophys. J. 90:1650–1660.
89. Girvin, M. E., V. K. Rastogi, F. Abildgaard, J. L. Markley, and R. H.Fillingame. 1998. Solution structure of the transmembrane H1-trans-porting subunit c of the F1Fo ATP synthase. Biochemistry. 37:8817–8824.
90. Chen, H. N., Y. J. Wu, and G. A. Voth. 2007. Proton transportbehavior through the influenza a M2 channel: insights from molecularsimulation. Biophys. J. 93:3470–3479.
91. Pinto, L. H., G. R. Dieckmann, C. S. Gandhi, C. G. Papworth, J.Braman, M. A. Shaughnessy, J. D. Lear, R. A. Lamb, and W. F.DeGrado. 1997. A functionally defined model for the M2 protonchannel of influenza A virus suggest a mechanism for its ionselectivity. Proc. Natl. Acad. Sci. USA. 94:11301–11306.
92. Kandasamy, S. K., and R. G. Larson. 2006. Molecular dynamicssimulations of model trans-membrane peptides in lipid bilayers: asystematic investigation of hydrophobic mismatch. Biophys. J. 90:2326–2343.
93. Tieleman, D. P., and H. J. C. Berendsen. 1996. Molecular dynamicssimulations of a fully hydrated dipalmitoylphosphatidycholine bilayerwith different macroscopic boundary conditions and parameters.J. Chem. Phys. 105:4871–4880.
94. Hay, A. J., A. J. Wolstenholme, J. J. Skehel, and M. H. Smith. 1985.The molecular basis of the specific anti-influenza action of amanta-dine. EMBO J. 4:3021–3024.
95. Holsinger, L. J., D. Nichani, L. H. Pinto, and R. A. Lamb. 1994.Influenza A virus M2 ion channel protein: a structure-functionanalysis. J. Virol. 68:1551–1563.
96. Yi, M., T. A. Cross, and H. X. Zhou. 2008. A secondary gate as amechanism for inhibition of the M2 proton channel amantadine.J. Phys. Chem. B. 112:7977–7979.
97. Law, R. J., C. Capener, M. Baaden, P. J. Bond, J. Campbell, G.Patargias, Y. Arinaminpathy, and M. S. P. Sansom. 2005. Membraneprotein structure quality in molecular dynamics simulation. J. Mol.Graph. Model. 24:157–165.
98. Hessa, T., H. Kim, K. Bihlmaier, C. Lundin, J. Boekel, H. Andersson,I. Nilsson, S. H. White, and G. von Heijne. 2005. Recognition oftransmembrane helices by the endoplasmic reticulum translocon.Nature. 433:377–381.
3800 Carpenter et al.
Biophysical Journal 95(8) 3790–3801
99. Stockner, T., W. L. Ash, J. L. MacCallum, and D. P. Tieleman. 2004.Direct simulation of transmembrane helix association: role of aspar-agines. Biophys. J. 87:1650–1656.
100. Ash, W. L., T. Stockner, J. L. MacCallum, and D. P. Tieleman. 2004.Computer modeling of polyleucine-based coiled coil dimers in arealistic membrane environment: insight into helix-helix interactionsin membrane proteins. Biochemistry. 43:9050–9060.
101. Psachoulia, E., P. J. Bond, P. W. Fowler, and M. S. P. Sansom. 2008.Helix-helix interactions in membrane proteins: coarse grained simula-tions of glycophorin helix dimerization. Biochemistry. In press.
102. Cordes, F. S., J. N. Bright, and M. S. P. Sansom. 2002. Proline-induceddistortions of transmembrane helices. J. Mol. Biol. 323:951–960.
103. Choma, C., H. Gratkowski, J. D. Lear, and W. F. DeGrado. 2000.Asparagine-mediated self-association of a model transmembrane helix.Nat. Struct. Biol. 7:161–166.
104. Senes, A., D. E. Engel, and W. F. DeGrado. 2004. Folding of helicalmembrane proteins: the role of polar, GxxxG-like and proline motifs.Curr. Opin. Struct. Biol. 14:465–479.
105. Ulmschneider, J. P., and M. B. Ulmschneider. 2007. Folding simu-lations of the transmembrane helix of Virus Protein U in an implicitmembrane model. J. Chem. Theory Comput. 3:2335–2346.
106. Scott, K. A., P. J. Bond, A. Ivetac, A. P. Chetwynd, S. Khalid, andM. S. P. Sansom. 2008. Coarse-grained MD simulations of membraneprotein-bilayer self-assembly. Structure. 16:621–630.
107. Yefimov, S., E. van der Giessen, P. R. Onck, and S. J. Marrink. 2008.Mechanosensitive membrane channels in action. Biophys. J. 94:2994–3002.
108. Monticelli, L., S. K. Kandasamy, X. Periole, R. G. Larson, D. P.Tieleman, and S. J. Marrink. 2008. The MARTINI coarse grained forcefield: extension to proteins. J. Comput. Theor. Chem. 4:819–834.
109. Neri, M., C. Anselmi, M. Cascella, A. Maritan, and P. Carloni. 2005.Coarse-grained model of proteins incorporating atomistic detail of theactive site. Phys. Rev. Lett. 95:218102.
110. Chang, R., G. S. Ayton, and G. A. Voth. 2005. Multiscale coupling ofmesoscopic- and atomistic-level lipid bilayer simulations. J. Chem.Phys. 122:244716.
111. Ayton, G. S., and G. A. Voth. 2007. Multiscale simulation of trans-membrane proteins. J. Struct. Biol. 157:570–578.
112. Sun, Y., S. McKeever, K. Balali-Mood, and M. S. P. Sansom. 2008.Integrating multi-level molecular simulations across heterogeneousresources. In Proceedings of the 8th IEEE/ACM International Confer-ence on Grid Computing (Grid 2007). Austin, Texas, 2007. 161–168.
CG Simulations of the M2 Channel 3801
Biophysical Journal 95(8) 3790–3801
Copyright © 2022 FDOKUMEN