Measuring Syntactic Development in L2 Writing: Fine Grained ...
202
Georgia State University Georgia State University ScholarWorks @ Georgia State University ScholarWorks @ Georgia State University Applied Linguistics and English as a Second Language Dissertations Department of Applied Linguistics and English as a Second Language 5-9-2016 Measuring Syntactic Development in L2 Writing: Fine Grained Measuring Syntactic Development in L2 Writing: Fine Grained Indices of Syntactic Complexity and Usage-Based Indices of Indices of Syntactic Complexity and Usage-Based Indices of Syntactic Sophistication Syntactic Sophistication Kristopher Kyle Follow this and additional works at: https://scholarworks.gsu.edu/alesl_diss Recommended Citation Recommended Citation Kyle, Kristopher, "Measuring Syntactic Development in L2 Writing: Fine Grained Indices of Syntactic Complexity and Usage-Based Indices of Syntactic Sophistication." Dissertation, Georgia State University, 2016. doi: https://doi.org/10.57709/8501051 This Dissertation is brought to you for free and open access by the Department of Applied Linguistics and English as a Second Language at ScholarWorks @ Georgia State University. It has been accepted for inclusion in Applied Linguistics and English as a Second Language Dissertations by an authorized administrator of ScholarWorks @ Georgia State University. For more information, please contact [email protected].
-
Upload
khangminh22 -
Category
Documents
-
view
2 -
download
0
Transcript of Measuring Syntactic Development in L2 Writing: Fine Grained ...

Georgia State University Georgia State University
ScholarWorks @ Georgia State University ScholarWorks @ Georgia State University
Applied Linguistics and English as a Second Language Dissertations
Department of Applied Linguistics and English as a Second Language
5-9-2016
Measuring Syntactic Development in L2 Writing: Fine Grained Measuring Syntactic Development in L2 Writing: Fine Grained
Indices of Syntactic Complexity and Usage-Based Indices of Indices of Syntactic Complexity and Usage-Based Indices of
Syntactic Sophistication Syntactic Sophistication
Kristopher Kyle
Follow this and additional works at: https://scholarworks.gsu.edu/alesl_diss
Recommended Citation Recommended Citation Kyle, Kristopher, "Measuring Syntactic Development in L2 Writing: Fine Grained Indices of Syntactic Complexity and Usage-Based Indices of Syntactic Sophistication." Dissertation, Georgia State University, 2016. doi: https://doi.org/10.57709/8501051
This Dissertation is brought to you for free and open access by the Department of Applied Linguistics and English as a Second Language at ScholarWorks @ Georgia State University. It has been accepted for inclusion in Applied Linguistics and English as a Second Language Dissertations by an authorized administrator of ScholarWorks @ Georgia State University. For more information, please contact [email protected].

MEASURING SYNTACTIC DEVELOPMENT IN L2 WRITING:
FINE GRAINED INDICES OF SYNTACTIC COMPLEXITY AND
USAGE-BASED INDICES OF SYNTACTIC SOPHISTICATION
By
KRISTOPHER KYLE
Under the Direction of Scott Crossley (PhD)
ABSTRACT
Syntactic complexity has been an area of significant interest in L2 writing development
studies over the past 45 years. Despite the regularity in which syntactic complexity measures
have been employed, the construct is still relatively under-developed, and, as a result, the
cumulative results of syntactic complexity studies can appear opaque. At least three reasons exist
for the current state of affairs, namely the lack of consistency and clarity by which indices of
syntactic complexity have been described, the overly broad nature of the indices that have been
regularly employed, and the omission of indices that focus on usage-based perspectives. This
study seeks to address these three gaps through the development and validation of the Tool for
the Automatic Assessment of Syntactic Sophistication and Complexity (TAASSC). TAASSC
measures large and fined grained clausal and phrasal indices of syntactic complexity and usage-
based frequency/contingency indices of syntactic sophistication. Using TAASSC, this study will
address L2 writing development in two main ways: through the examination of syntactic
development longitudinally and through the examination of human judgments of writing

proficiency (e.g., expert ratings of TOEFL essays). This study will have important implications
for second language acquisition, second language writing, and language assessment.
INDEX WORDS: Second language acquisition, Syntactic complexity, Writing development,
Language use, Language assessment, Natural language processing

MEASURING SYNTACTIC DEVELOPMENT IN L2 WRITING:
FINE GRAINED INDICES OF SYNTACTIC COMPLEXITY AND
USAGE-BASED INDICES OF SYNTACTIC SOPHISTICATION
by
KRISTOPHER KYLE
A Dissertation Submitted in Partial Fulfillment of the Requirements for the Degree of
Doctor of Philosophy
in the College of Arts and Sciences
Georgia State University
2016

Copyright by Kristopher Donald Kyle
2016

MEASURING SYNTACTIC DEVELOPMENT IN L2 WRITING:
FINE GRAINED INDICES OF SYNTACTIC COMPLEXITY AND
USAGE-BASED INDICES OF SYNTACTIC SOPHISTICATION
by
KRISTOPHER KYLE
Committee Chair: Scott Crossley
Committee: YouJin Kim
Ute Römer
Ben Miller
Electronic Version Approved:
Office of Graduate Studies
College of Arts and Sciences
Georgia State University
May 2016

iv
DEDICATION
This dissertation is dedicated to my wife, Jessica Kyle. Without her unwavering support,
this project would have never begun, much less been completed.

v
ACKNOWLEDGEMENTS
This project represents the culmination of a great deal of time and effort by a great
number of people.
First, I am deeply indebted to my advisor, dissertation chair, co-author, and friend Scott
Crossley. Scott has offered encouragement and support at all stages of my academic career. He
has given hours upon hours of his time to walk me through statistical analyses, the publication
process, and so much more. He has also patiently and calmly listened to me critically assess his
work, and even more patiently and calmly listened at times when I have reacted strongly to his
critical assessments of my work. Scott has taught me both about being a successful academic and
mentoring others in that process in the manner of the best teachers: By example.
I also want to thank Ute Römer, who has always been available to chat about corpus
linguistics, VACs, and life in general. Without her work and her encouragement, I wouldn’t have
pursued usage-based approaches to language development. I am also indebted to YouJin Kim,
who, among other things, taught the first SLA course that was compelling to me. Without her,
my interest in SLA may have never taken hold. I also want to thank Doug Flahive, my MA thesis
advisor, who first taught me how to critically appraise research articles.
I am also indebted to the faculty of the Department of Applied Linguistics and ESL as a
whole, and particularly to those who taught the PhD courses I took. In particular, I want to thank
Diane Belcher for her insights into qualitative inquiry and genre analysis (and for so graciously
putting up with a serial quantitative researcher). I also want to thank John Murphy for his
insights into second language teacher education, and for masterfully demonstrating how to lead a
graduate seminar.

vi
I want to thank my wife, Jess Kyle, for supporting me in all ways (financially,
emotionally, etc.) over the past few years and for putting up with a crazy doctoral student for
four years. I also want to thank my friends and colleagues in the department, and particularly
Stephen Skalicky and Cindy Berger. Thanks for all of the philosophical discussions, venting
sessions, and good times. May there be much more of that to come.
My research has also been supported in numerous ways by researchers outside of Georgia
State University. In particular, I would like to thank Tom Salsbury and Marolijn Verspoor, who
graciously shared their corpora with me. Without their hard work and generosity, this
dissertation would have been much shorter (and much less interesting). I would also like to thank
Danielle McNamara, who has been extremely supportive of my work by providing numerous
resources and excellent feedback on manuscripts.

vii
TABLE OF CONTENTS
ACKNOWLEDGEMENTS ............................................................................................. v
LIST OF TABLES ........................................................................................................... xi
LIST OF FIGURES ....................................................................................................... xiii
1 INTRODUCTION .................................................................................................... 1
2 SYNTACTIC COMPLEXITY AND SOPHISTICATION ................................... 8
2.1 Syntactic Complexity ....................................................................................................8
2.1.1 Commonly used syntactic complexity indices ............................................................9
2.1.2 Syntactic complexity indices and the Biber Tagger ..................................................16
2.1.3 Syntactic complexity indices and Coh-Metrix ..........................................................20
2.1.4 Other operationalizations of syntactic complexity ....................................................25
2.1.5 Longitudinal and cross-sectional research designs ...................................................26
2.1.6 Summary of syntactic complexity measures .............................................................27
2.2 Syntactic Sophistication ..............................................................................................27
2.2.1 Verb-argument constructions ....................................................................................29
2.2.2 Psychological reality of VACs in L1 and L2 ............................................................29
2.2.3 VAC development ....................................................................................................32
2.3 Overview of L2 Syntactic Development Research ....................................................34
3 TOOL FOR THE AUTOMATIC ANALYSIS OF SYNTACTIC
SOPHISTICATION AND COMPLEXITY (TAASSC) .......................................................... 35
3.1 NLP Processes ..............................................................................................................36
3.1.1 Part of speech tagging ...............................................................................................36
3.1.2 Constituency parsing .................................................................................................39

viii
3.1.3 Dependency parsing ..................................................................................................42
3.2 Extant automatic indices of syntactic complexity ....................................................44
3.2.1 Biber Tagger .............................................................................................................44
3.2.2 Syntactic Complexity Analyzer ................................................................................45
3.2.3 Coh-Metrix ................................................................................................................46
3.3 Evaluating automatic syntactic complexity analysis tools .......................................46
3.3.1 Accuracy ...................................................................................................................46
3.3.2 Range of indices ........................................................................................................48
3.3.3 Availability ...............................................................................................................48
3.3.4 Portability ..................................................................................................................49
3.3.5 Summary of the characteristics of extant syntactic complexity tools .......................49
3.4 Tool for the Automatic Analysis of Syntactic Sophistication and Complexity ......50
3.4.1 Syntactic Complexity Analyzer ................................................................................52
3.4.2 Fine-grained clausal complexity ...............................................................................54
3.4.3 Fine-grained phrasal complexity ...............................................................................56
3.4.4 Syntactic sophistication ............................................................................................58
3.4.5 Principal component analysis ...................................................................................69
3.5 Conclusion ....................................................................................................................77
4 THE RELATIONSHIP BETWEEN SYNTACTIC COMPLEXITY AND
SOPHISTICATION AND L2 WRITING QUALITY ............................................................. 78
4.1 Method ..........................................................................................................................79
4.1.1 Indices .......................................................................................................................79
4.1.2 Writing proficiency corpus .......................................................................................79
4.1.3 Statistical analysis .....................................................................................................81
4.2 Results and Discussion ................................................................................................83

ix
4.2.1 Research Question 1a: Syntactic Complexity Analyzer ...........................................83
4.2.2 Research Question 2a: Fine-grained clausal complexity ..........................................86
4.2.3 Research Question 3a: Phrasal complexity ...............................................................89
4.2.4 Research Question 4a: Syntactic sophistication .......................................................96
4.2.5 Research Question 5a: Combined syntactic complexity and sophistication ...........102
4.3 Summary ....................................................................................................................108
4.4 Limitations and future directions ............................................................................110
4.5 Conclusion ..................................................................................................................111
5 LONGITUDINAL SYNTACTIC DEVELOPMENT ........................................ 112
5.1 Method ........................................................................................................................113
5.1.1 Indices .....................................................................................................................113
5.1.2 Learner corpora .......................................................................................................113
5.1.3 Statistical analyses ..................................................................................................118
5.2 Results and Discussion ..............................................................................................119
5.2.1 Research Question 1b results: Syntactic Complexity Analyzer ..............................119
5.2.2 Research Question 1b discussion: Syntactic Complexity Analyzer .......................122
5.2.3 Research Questions 2b-5b results: Other TAASSC index types ............................129
5.2.4 Research Questions 2b-5b discussion: Other TAASSC index types ......................133
5.3 Summary of findings .................................................................................................149
5.3.1 Research Question 1b: Syntactic Complexity Analyzer indices .............................149
5.3.2 Research Question 2b: Fine-grained clausal complexity ........................................150
5.3.3 Research Question 3b: Fine-grained phrasal complexity .......................................151
5.3.4 Research Question 4b: Syntactic sophistication .....................................................151
5.3.5 Research Question 5b: All TAASSC indices ..........................................................152
5.3.6 Limitations ..............................................................................................................153

x
5.3.7 Future directions .....................................................................................................154
6 Conclusion and Outlook ....................................................................................... 154
6.1 The Tool for the Automatic Analysis of Syntactic Sophistication and Complexity
155
6.2 Summary of Findings ................................................................................................157
6.2.1 Research Question 1: Syntactic complexity analyzer indices .................................157
6.2.2 Research Question 2: Fine-grained clausal complexity indices ..............................158
6.2.3 Research Question 3: Fine-grained phrasal complexity indices .............................159
6.2.4 Research Question 4: Indices of syntactic sophistication .......................................160
6.2.5 Research Question 5: All TAASSC indices ............................................................162
6.2.6 Summary of findings ...............................................................................................163
6.3 Contributions .............................................................................................................164
6.4 Implications ................................................................................................................165
6.4.1 Second language acquisition ...................................................................................165
6.4.2 Writing assessment .................................................................................................166
6.4.3 Second language pedagogy .....................................................................................166
6.5 Limitations .................................................................................................................167
6.6 Outlook .......................................................................................................................168
REFERENCES .............................................................................................................. 170
APPENDICES ............................................................................................................... 186
Appendix A: TOEFL Independent Essay Rubric ...............................................................186

xi
LIST OF TABLES
Table 2.1 Biber-tagger based indices relevant to syntactic complexity proposed in Biber et al. (2011) ............................................................................................................................................ 18Table 2.2 Coh-Metrix indices of syntactic complexity reported by Crossley and McNamara (2014) ............................................................................................................................................ 24Table 2.3 Coh-Metrix indices reported in Guo et al., 2013 .......................................................... 25Table 3.1 Dependency representation of the sentence “The linguist climbs rocks.” .................... 43Table 3.2 Overview of current automatic analysis of syntactic complexity tools ........................ 50Table 3.3 A description of syntactic structures counted by SCA ................................................. 53Table 3.4 A description of SCA Variables ................................................................................... 54Table 3.5 Clausal dependent types analyzed by TAASSC ........................................................... 55Table 3.6 Phrase types and dependent types analyzed by TAASSC ............................................ 57Table 3.7 An overview of the phrasal indices included in TAASSC ........................................... 58Table 3.8 Main verb lemma frequencies in the the written section of COCA .............................. 61Table 3.9 Verb argument construction frequencies in COCA ...................................................... 61Table 3.10 Most common verb argument construction-main verb lemma combinations in COCA....................................................................................................................................................... 62Table 3.11 Contingency table used to calculate various indices of association strength ............. 64Table 3.12 Strongly attracted SVO – Verb combinations in academic COCA ............................ 68Table 3.13 An overview of the syntactic sophistication indices calculated in TAASSC for each subcorpus ...................................................................................................................................... 69Table 3.14 Component 1: Noun phrase elaboration ..................................................................... 72Table 3.15 Component 2: Verb-VAC frequency .......................................................................... 73Table 3.16 Component 3: Nouns as modifiers and modifier variation ......................................... 73Table 3.17 Component 4: Determiners ......................................................................................... 74Table 3.18 Component 5: VAC frequency and direct objects ...................................................... 74Table 3.19 Component 6: Association Strength ........................................................................... 75Table 3.20 Component 7: Diversity and frequency ...................................................................... 76Table 3.21 Component 8: Possessives .......................................................................................... 76Table 3.22 Component 9: Frequency ............................................................................................ 77Table 4.1 Writing prompts for independent essays in TOEFL public use dataset ....................... 80Table 4.2 Overview of writing proficiency corpus ....................................................................... 80Table 4.3 Abbreviated TOEFL rubric for independent writing tasks ........................................... 81Table 4.4 Correlations between holistic essay score and SCA variables entered into regression model ............................................................................................................................................. 84Table 4.5 Summary of SCA multiple regression model ............................................................... 84Table 4.6 Examples from TOEFL Essays: Mean length of clause ............................................... 85Table 4.6 Correlations between holistic essay score and clausal complexity variables entered into regression ...................................................................................................................................... 87Table 4.7 Summary of clausal complexity multiple regression model ......................................... 87Table 4.9 Examples of non-finite clauses in high-scoring essays ................................................ 88Table 4.8 Correlations between holistic essay score and phrasal complexity variables entered into regression ...................................................................................................................................... 90Table 4.9 Summary of phrasal complexity multiple regression model ........................................ 90

xii
Table 4.10 Correlations between holistic essay score and syntactic sophistication variables entered into regression .................................................................................................................. 97Table 4.11 Summary of syntactic sophistication multiple regression model ............................... 98Table 4.14 Examples of weak and strong verb-VAC associations in TOEFL essays .................. 99Table 4.15 Examples of high and low frequency VACs .............................................................. 99Table 4.12 Correlations between holistic essay score and variables entered into regression ..... 104Table 4.13 Summary of multiple regression model .................................................................... 105Table 4.14 An overview of the performance of each model tested ............................................ 106Table 4.15 A comparison of models using Fisher’s r to z transformation .................................. 106Table 4.16 A comparison of the exact accuracy of the models using McNemar’s test .............. 107Table 4.17 A comparison of the exact/adjacent accuracy of the models using McNemar’s test 107Table 5.1 Overview of Salsbury written corpus data .................................................................. 114Table 5.2 Number of words collected per participant in Salsbury subcorpus ............................ 116Table 5.3 Essay topics in the Verspoor longitudinal corpus ....................................................... 117Table 5.4 Overview of Verspoor longitudinal corpus data ......................................................... 117Table 5.5 Salsbury corpus: Mean (standard deviation) for selected SCA indices at each collection point ............................................................................................................................................ 120Table 5.6 Repeated measure analysis of variance results for SCA variables ............................. 121Table 5.7 Verspoor corpus: Mean (standard deviation) for selected SCA indices at each collection point ............................................................................................................................ 121Table 5.8 Repeated measure analysis of variance results for SCA variables ............................. 122Table 5.9 Examples from the Salsbury corpus: Mean length of T-unit ...................................... 123Table 5.10 Examples from the Verspoor corpus: Mean length of T-unit ................................... 124Table 5.11 Examples from the Salsbury corpus: T-units per sentence ....................................... 127Table 5.9 Salsbury corpus: Mean (standard deviation) for component scores at each collection point ............................................................................................................................................ 130Table 5.10 Repeated measure analysis of variance results for TAASSC component indices .... 131Table 5.11 Verspoor corpus: Mean (standard deviation) for component scores at each collection point ............................................................................................................................................ 132Table 5.12 Repeated measure analysis of variance results for TAASSC component indices .... 133Table 5.16 Examples from Marta, T1 (week 3) and T10 (week 50) .......................................... 136Table 5.17 Examples from the Salsbury corpus: Verb-VAC combination frequency ............... 137Table 5.18 Examples from the Salsbury corpus: Possessives component .................................. 145Table 5.19 Examples of main verb use by Fenna in first and last essay ..................................... 148Table 5.20 The ten strongest effect sizes across the two longitudinal studies ............................ 153

xiii
LIST OF FIGURES
Figure 3.1 A visual representation of the parse tree for the sentence The linguist climbs rocks. 40Figure 3.2 Graphic representation of a dependency parse ............................................................ 43Figure 3.3 The TAASSC GUI ...................................................................................................... 51Figure 4.1 Phrasal complexity: Dependents per nominal ............................................................. 92Figure 4.2 Phrasal complexity: Dependents per object of the preposition ................................... 92Figure 4.3 Phrasal complexity: Prepositions per object of the preposition .................................. 92Figure 4.4 Phrasal variation: Dependents per nominal subject ..................................................... 93Figure 4.5 Phrasal complexity and variation: Direct objects ........................................................ 94Figure 5.1 Increase in TOEFL scores over time (Salsbury) ....................................................... 115Figure 5.2 Increase in holistic scores over time in Verspoor longitudinal corpus ...................... 118Figure 5.3 MLTU (Salsbury) ...................................................................................................... 125Figure 5.4 MLTU (Verspoor) ..................................................................................................... 126Figure 5.5 T-units per sentence (Salsbury) ................................................................................. 128Figure 5.6 Trends for indices included in the Verb-VAC frequency component (Salsbury) ..... 134Figure 5.7 Trends for indices included in the Verb-VAC frequency component (Verspoor) .... 135Figure 5.8 Verb-VAC frequency component results (Salsbury) ................................................ 139Figure 5.9 Verb-VAC frequency component results (Verspoor) ................................................ 139Figure 5.10 Indices included in the diversity and frequency component (Verspoor) ................. 141Figure 5.11 Diversity and frequency component results (Verspoor) .......................................... 143Figure 5.12 Trends for indices included in the possessives component (Salsbury) ................... 144Figure 5.13 Possessives component results (Salsbury) ............................................................... 146Figure 5.14 Trends for indices included in the frequency component (Verspoor) ..................... 147Figure 5.15 Frequency component results (Verspoor) ............................................................... 149

1
1 INTRODUCTION
A key measure of academic and professional success is writing proficiency (Kellogg &
Raulerson, 2007). Writing is a multifaceted endeavor (Condon, 2013), and attaining proficiency
is often difficult, both for first language (L1) and second language (L2) writers (McNamara,
Crossley, & McCarthy, 2010; National Commission on Writing, 2003). Various aspects of
writing proficiency have been explored, ranging from humanistic concerns such as writing
processes (Casanave, 1994; Graves, 1975), voice (Hirvela & Belcher, 2001), and rhetorical
effectiveness (Ferris, 1994) to linguistic concerns such as the characteristics of the words (Kyle
& Crossley, 2015; Laufer & Nation, 1995; Linnarud, 1986; McNamara et al., 2010), phrases
(Crossley, Cai, & McNamara, 2012; Kyle & Crossley, 2015), and syntactic units (Guo, Crossley,
& McNamara, 2013; Lu, 2011; Ortega, 2003) that comprise a text. One particularly important
linguistic construct that has been influential in the study of writing has been complexity (Bulté &
Housen, 2012).
Complexity has been an important construct in first language (L1) and second language
(L2) development for the past 45 years. Larsen-Freeman (1978), drawing on previous work in L1
development (Hunt, 1965), cited complexity as one of three important constructs of language
development (in addition to accuracy and fluency). Complexity has been operationalized at both
the lexical and syntactic level (Wolfe-Quintero, Inagaki, & Kim, 1998). At the lexical level,
complexity, which is also referred to as sophistication (e.g., Laufer & Nation, 1995; Linnarud,
1986), is often measured in relation to reference corpus frequency. Highly frequent lexical items
seem to be learned first (Nation, 2001) and are therefore considered less sophisticated, while less
frequent words are learned later (if at all), and are therefore considered more sophisticated.
Complexity is also an important component of syntax. Syntax refers to the systematic ways in

2
which discrete units (e.g., words) can be combined to create meaningful utterances (e.g.,
sentences; (Fromkin, Rodman, & Hyams, 2013). At the syntactic level, complexity has generally
been operationalized with regard to clausal subordination and/or sentence length (as a proxy for
subordination), though there has also been recent interest in phrasal complexity (Biber, Gray, &
Poonpon, 2011). A review of the L2 acquisition literature suggests that as learners develop they
produce longer and more varied syntactic structures (Ortega, 2003). Even though syntactic
complexity indices are often used to investigate development in L2 writing, a fully agreed upon
definition of syntactic complexity has yet to be realized (Bulté & Housen, 2012). There are at
least three major issues that still exist with regard to extant indices of syntactic complexity that
hinder a fuller understanding of syntactic complexity.
First, Wolfe-Quintero et al. (1998), among others, have noted the lack of consistency by
which syntactic complexity measures have been defined. A clear, longstanding example is in the
counting of clauses. Some studies, for example, define a clause as having a subject and a finite
verb (e.g., Polio, 1997) while others include non-finite clauses (e.g., Bardovi-Harlig & Bofman,
1989). Such differences in definitions can make comparisons between studies difficult. To
exemplify this issue, the sentence My goal is to run a marathon would include one clause in the
former definition and two clauses in the latter. Furthermore, some studies do not report how
particular structures are defined, making comparisons between studies even more complicated.
This issue of consistency and clarity is of course not limited to the finite/non-finite distinction.
Because syntax can vary in many ways, even seemingly simple indices such as the number of
modifiers per noun phrase (e.g., Crossley & McNamara, 2014) may end up being opaque unless
they are exhaustively defined. This issue makes it difficult to compile cumulative, concrete
knowledge about the relationship between L2 writing and syntactic complexity.

3
Second, a number of scholars have noted the issue of granularity (i.e., specificity) of
syntactic complexity indices (e.g., Larsen-Freeman, 2009; Norris & Ortega, 2009; Wolfe-
Quintero et al., 1998). Despite the fact that there has been relatively consistent positive
relationship between measures such as mean length of T-unit (MLTU) and writing development,
we know very little about the specific structures that emerge as writing develops because these
indices are not sensitive enough to provide this information. Furthermore, these indices also hide
the degree to which development in syntactic complexity is linear or not (e.g., Biber et al., 2011;
Larsen-Freeman, 2006; Norris & Ortega, 2009; Verspoor, Schmid, & Xu, 2012). For example,
while writers tend to write longer clauses as they develop, the specific structures they use to
increase clause length may change. Some structures (of various lengths) seem to be prevalent at
some stages and less so at others. This issue suggests that using fine-grained indices of syntactic
complexity may provide a clearer understanding of how learners develop with regard to syntax.
In order to understand the relationship between syntactic complexity and writing development,
investigations using more fine-grained indices are likely necessary.
The third issue is that syntactic complexity has largely been interpreted as a formal
characteristic that is distinct from lexical development. Lexical complexity/sophistication and
syntactic complexity indices are often employed in tandem as distinct measures language
development (e.g., Guo et al., 2013), but are rarely measured jointly (that is, as a single,
interrelated construct; c.f., Crossley, Cai, et al., 2012). Recent investigations from a usage-based
perspective, however, suggest that the development of lexis and syntactic forms are likely
intertwined (Ellis & Ferreira-Junior, 2009b; Römer, 2009). Furthermore, usage-based
perspectives suggest that frequency and contingency (i.e., the probability that a verb and a
syntactic construction will co-occur) explain L2 syntactic development in ways that are similar

4
to lexical development: frequent syntactic constructions (and verb-construction combinations)
are learned first and are therefore less sophisticated than less frequent ones. Thus, from a usage-
based perspective, the underlying construct that syntactic complexity is assumed to measure
(language development at the syntactic level) is best measured by frequency of use and
contingency, which may or may not coincide with syntactic measures based on subordination
(i.e., t-units). Thus, in this paper, the term sophistication will be used to refer to syntactic
development from a usage-based perspective and the term complexity to refer to the formal
characteristic of syntax (e.g., subordination). Syntactic forms that are learned earlier can be
considered less sophisticated and/or less complex than forms learned later. Sophistication
roughly equates to relative complexity while complexity falls within absolute complexity (Bulté
& Housen, 2012)
Although usage-based perspectives to language acquisition have gained traction over the
past 20 years, most of the extant body of research explores a small number of lexical/syntactic
combinations (called constructions, e.g., Goldberg, 1995) and has been restricted to relatively
early stages of language development. This indicates potential gaps in our understanding of
linguistic development for all but the most salient constructions (and only at early stages of
development for those construction). Despite concurrent interests in both written language
development at the clausal level (e.g., Ortega, 2003) and usage-based language acquisition (e.g.,
Ellis, 2002a) more research is needed to examine relationships between writing development and
clause level construction use in either the L1 or the L2. For instance, a comprehensive frequency
database of verb-construction combinations in English (or any other language) would prove
beneficial in better understanding syntactic development from a usage-based perspective. This
issue has recently begun to be addressed through the use of advanced natural language

5
processing (NLP) techniques to identify and document the frequency profiles of VACs in the
British National Corpus (BNC) (O’Donnell & Ellis, 2010; Römer, O’Donnell, & Ellis, 2015),
though there is still work to be done.
This study helps address important gaps in our knowledge of syntactic development in L2
writing by explaining the development and testing of the Tool for the Automatic Analysis of
Syntactic Complexity (TAASSC). Using advanced natural language processing technology (e.g.,
Chen & Manning, 2014), TAASSC reports on a number of fine-grained clausal and phrasal
syntactic structures. Additionally, TAASSC reports on the 14 widely used large-grained indices
of syntactic complexity implemented in the Syntactic Complexity Analyzer (SCA) (Lu, 2010,
2011). TAASSC also calculates a number of indices of syntactic sophistication, comprised of
frequency and contingency-based indices for verb argument constructions derived from the
Corpus of Contemporary American English (COCA). By applying the indices measured by
TAASSC to longitudinal and cross-sectional corpora of L2 writing, this study examines issues in
the measurement of syntactic development from both a syntactic complexity and sophistication
perspective. Accordingly, this study is guided by the following research questions:
1. What is the relationship between the Syntactic Complexity Analyzer indices and
a. holistic scores of writing proficiency?
b. longitudinal writing development?
2. What is the relationship between fine-grained indices of clausal complexity and
a. holistic scores of writing proficiency?
b. longitudinal writing development?
3. What is the relationship between fine-grained indices of phrasal complexity and
a. holistic scores of writing proficiency?

6
b. longitudinal writing development?
4. What is the relationship between usage-based indices of syntactic sophistication
a. holistic scores of writing proficiency?
b. longitudinal writing development?
5. What is the relationship between all syntactic development indices included in TAASSC
and
a. holistic scores of writing proficiency?
b. longitudinal writing development?
This dissertation is organized as follows: First, the literature, which highlights the rationale
for the study, is reviewed. Next, the text analysis tool designed for this project is described. The
next two chapters comprise analyses that address the research questions. In the final chapter, the
results are summarized and implications are discussed. A more detailed outline of each chapter is
provided below.
Chapter 2 comprises a discussion of the literature with regard to syntactic development
from two perspectives. The first perspective discussed is that of syntactic complexity, which has
dominated second language writing studies for the past 45 years (Larsen-Freeman, 1978; Ortega,
2003, 2015; Wolfe-Quintero et al., 1998). The second perspective discussed is usage-based
theories of second language development (Behrens, 2009; Ellis, 2002a; Langacker, 1987;
Tomasello, 2003), which posit (among other things) that frequency is the primary component of
language development.
Chapter 3 comprises a discussion of the development of TAASSC and the indices it
includes. The underlying natural language processing (NLP) techniques used for grammatical
and syntactic analysis are first discussed (Brill, 1995; Charniak, 2000; Chen & Manning, 2014;

7
Klein & Manning, 2003), including part of speech (POS) tagging, constituency parsing, and
dependency parsing. A review of extant syntactic development analysis tools then follows,
including a comparison of their relative strengths and weaknesses. The attributes of TAASSC
and the indices of calculated are then described in detail.
Chapter 4 addresses research questions 1a – 5a by examining the ability of multivariate
models comprised of various indices of syntactic development to predict holistic scores of
writing quality in TOEFL essays. Following the research questions, longstanding indices of
syntactic complexity first investigated, followed by fine-grained indices of clausal complexity,
fine-grained indices of phrasal complexity, and VAC-based indices indices of syntactic
sophistication. The final analysis of the chapter includes a model that considers all four types of
syntactic development indices. The results are then discussed and situated within the literature.
Chapter 5 addresses research questions 1b – 5b by examining the relationship between
indices of syntactic development and time spent studying English. Two longitudinal learner
corpora are examined that represent two distinct learning contexts and written registers. The first
is a corpus of free writes written over the course of one year by students enrolled in an intensive
English program (IEP) at a major American university (Salsbury, 2000). The second is a corpus
of argumentative essays written by middle-school students at a bilingual school in the
Netherlands at six points over a two-year period (Verspoor et al., 2012). Following a number of
statistical analyses, the results are then discussed and situated within the literature.
Chapter 6 comprises a summary of the results of the previous chapters. The overall
implications of the findings of this dissertation for the study of second language development,
second language writing, and second language assessment are also reviewed.

8
2 SYNTACTIC COMPLEXITY AND SOPHISTICATION
In this paper a distinction is made between to two operationalizations of syntax, namely
syntactic complexity and syntactic sophistication. Syntactic complexity refers to the formal
characteristics of syntax (e.g., the amount of subordination), which has been described as
absolute complexity (Bulté & Housen, 2012). In contrast, syntactic sophistication refers to the the
relative difficulty of learning particular syntactic structures (i.e., what Bulté and Housen refer to
as relative complexity), which (from a usage-based perspective) is related to input frequency and
contingency. The term sophistication is borrowed from related studies of lexical development
(Laufer & Nation, 1995; Linnarud, 1986), which refer to less frequent words as more
sophisticated because they tend to be produced by more proficient writers.
This chapter is divided into two sections. The first reviews literature regarding the construct
of syntactic complexity and how it has been operationalized in studies of second language
writing. The second section reviews literature regarding usage-based perspectives on syntactic
development, which provide a theoretical backdrop for operationalizations of syntactic
sophistication.
2.1 Syntactic Complexity
Syntactic complexity has been operationalized in L2 writing development studies in a
variety of ways. This variety, while helpful, has made a general description of L2 writing
development in terms of syntactic complexity difficult. In this review, syntactic indices are
grouped into four major categories. First, the syntactic indices described by Wolfe-Quintero et al.
(1998), many of which have been consistently prevalent in L2 research, are considered. Syntactic
complexity indices operationalized by Biber (e.g., Biber, Gray, & Staples, 2014; Biber et al.,
2004; Biber, Gray, & Poonpon, 2011), which have had an impact on recent discussions of clausal

9
and phrasal complexity are then discussed. Next, syntactic complexity indices operationalized
using Coh-Metrix, which have been used in a number of recent L2 writing studies (e.g., Crossley
& McNamara, 2014; Guo et al., 2013) are considered. Finally, a number of indices not
represented in the above categories that have been mentioned in the literature during the past five
years (e.g., Bulté & Housen, 2012) are discussed.
2.1.1 Commonly used syntactic complexity indices
A number of indices of syntactic complexity have been proposed and employed in L2
writing studies (Wolfe-Quintero et al., 1998), though only a few have been consistently
employed across L2 writing studies (Lu, 2011; Ortega, 2003).1 This section provides an
overview of popular indices of syntactic complexity, with a focus on those reviewed and/or
proposed by Wolfe-Quintero et al. (1998).
2.1.1.1 Mean length of clause
The mean length of clause (MLC) index is the average number of words per clause. A
clause is defined as a subject and a finite verb, though some studies (e.g., Bardovi-Harlig &
Bofman, 1989) include clauses with non-finite verbs. MLC can be seen as a global measure of
intra-clausal complexity. MLC values can increase due to a myriad of syntactic factors. These
include increases in phrasal coordination and modification, aspect use (e.g., simple declarative
clauses require no auxiliaries, perfect and progressives require one auxiliary, and
perfect/progressive combinations require two) and/or syntax structure (e.g., SV structures require
two only words, while SVO structures require at least three) among many others. MLC does not
differentiate between clause types (i.e., independent clauses are on an equal footing with
1 Wolfe-Quintero et al. (1998) refer to the first three indices reviewed below as indices of fluency. This notion has been contested (Lu, 2011; Norris & Ortega, 2009; Ortega, 2003).

10
dependent clauses). A number of studies have demonstrated a significant positive relationship
between MLC and proficiency levels (e.g., Cumming et al., 2005; Ortega, 2003; Wolfe-Quintero
et al., 1998) such that clause length tends to increase as proficiency level goes up, though this is
not always the case (Knoch, Rouhshad, & Storch, 2014).
2.1.1.2 Mean length of T-unit
The T-unit was proposed by Hunt (1965) as an index of child L1 development and was
adopted by SLA researchers beginning in the late 70’s (Larsen-Freeman, 1978). A T-unit
consists of an independent clause and any dependent clauses attached to it. The sentence The
linguist wears tweed jackets and he enjoys being stylish includes two independent clauses, and
therefore includes two T-units. The sentence The linguist wears tweed jackets because he enjoys
being stylish includes an independent clause with an attached dependent clause, and therefore
includes only one T-unit. Compared to MLC, mean length of T-unit (MLTU) adds an extra level
of specificity (i.e., dependent clauses are somewhat disambiguated). A number of studies have
demonstrated a positive significant relationship between writing proficiency and MLTU (see
Ortega, 2003; Wolfe-Quintero et al., 1998) such that the length of T-units tend to increase as
proficiency goes up.
2.1.1.3 Mean length of sentence
The mean length of sentence (MLS) index is simply the number of words in a sentence.
The definition of a sentence is relatively straightforward and uncontroversial, and is generally
referred to as a string of words that starts with a capital letter (excepting proper nouns) and
ending with punctuation such as a period, question-mark, and exclamation point. This can be
seen as a strong operationalization advantage compared to clausal or T-unit counts because it is
less ambiguous and therefore can be counted quickly and reliably. MLS has been shown to be

11
strongly correlated with MLTU. Lu (2010), for example reported a correlation between MLS and
MLTU of r = .907. A number of studies have demonstrated positive relationships between MLS
and language proficiency (see Wolfe-Quintero et al., 1998; Ortega, 2003). One clear issue with
MLS as a proxy for MLTU is that there can be multiple T-units per sentence. Furthermore, the
existence of run-on sentences will strongly influence MLS counts (one of the main reasons that
Hunt, [1965] proposed T-units).
2.1.1.4 Complex T-units per T-unit
A complex T-unit is defined as a T-unit that includes both an independent and a
dependent clause (Casanave, 1994; Lu, 2011). The ratio of complex T-units per T-unit
(CTU/TU) measures the number of T-units that have dependent clauses but is insensitive to the
number (above one) or types of extant dependent clauses. Casanave (1994) reported a positive
trend between development and CTU/TU, but did not report any statistical findings. Another
study that has investigated CTU/TU (Lu, 2011) did not find significant relationships between
language development and CTU/TU. Were a positive relationship found between proficiency and
CTU/TU, we would be able to suggest that leaners use more independent/dependent clause
combinations, but would not be able to determine the number or type of dependent clauses.
2.1.1.5 T-units per sentence
The number of T-units per sentence (TU/S) essentially measures the amount of
(independent) clausal coordination in a text. An index score of 1 would indicate that there is no
clausal coordination in an essay, while an index score of 2 would indicate that, on average, every
sentence includes one instance of clausal coordination. Of the studies reviewed by Wolfe-
Quintero et al., only one of the five studies that employed this index (Monroe, 1975, which
investigated French as an L2) reported a significant relationship with language proficiency. This

12
relationship was negative, suggesting that in the Monroe’s study clausal coordination decreased
as proficiency increased.
2.1.1.6 Clauses per sentence
The number of clauses per sentence (C/S) is a global index that concurrently measures
the amount of clausal coordination and subordination in each sentence. The same issues with
regard to other sentence-based indices apply (e.g., insensitivity to run-on sentences). Ishikawa
(1995) found a positive relationship between C/S and language development over a three-month
period, while Lu (2011) found a negative relationship between C/S and school year. This is
clearly an area that deserves more attention.
2.1.1.7 Clauses per T-unit
The number of clauses per T-unit (C/TU) index measures the amount of clausal
subordination in a text, but does not distinguish between types of subordination. Of the eighteen
studies reviewed by Wolfe-Quintero et al. (1998) that employed C/TU, six found significant
positive relationships between language proficiency and C/TU, one found a significant negative
relationship, and 11 did not find a significant relationship. More recently, neither Cumming et al.
(2005) in a study of independent TOEFL essays, Knoch et al. (2014) in a longitudinal study, nor
Lu (2011) found significant differences between C/TU and development.
2.1.1.8 Dependent clauses per clause
The number of dependent clauses per clause (DC/C) index is similar to the (C/TU) index
because it also measures the amount of clausal subordination in a text. Lu (2011) found a
negative relationship between DC/C and school level (between years 2 and 4), suggesting that
writers use fewer dependent clauses as their language proficiency increases.

13
2.1.1.9 Dependent clauses per T-unit
The number of dependent clauses per T-unit (DC/TU) index is very similar to the
previous two indices (in Lu's [2010] data, DC/C and DC/T were correlated at r = .922) that
measures the amount of clausal subordination in a text. (Homburg, 1984) found a significant
positive relationship between DC/TU and proficiency, Lu (2011) found a negative relationship
between the two, and the two studies reported in Vann (1979) failed to find a significant
relationship.
2.1.1.10 Coordinate phrases per clause
The number of coordinate phrases per clause (CP/C) measures the amount of phrasal
coordination in a text. Lu (2011) found a positive relationship between CP/C and proficiency
levels (years 1-3 and 1-4). This positive relationship suggests that phrasal coordination increases
as language learners develop.
2.1.1.11 Coordinate phrases per T-unit
The number of coordinate phrases per T-unit (CP/TU) is very similar to CP/C (in Lu's
[2010] data, CP/TU and CP/C were correlated at r = .945). It measures the amount of phrasal
coordination in a text (but is not sensitive to the types of phrases in which the coordination takes
place). Lu (2011) found a positive relationship between CP/C and language development, but
this relationship was only significant between years 1-4.
2.1.1.12 Complex nominals per clause
Complex nominals include a number of syntactic constructions, including nominal
clauses, infinitives or gerunds in the subject position, and nouns in combinations with adjectives,
adjective clauses, appositives, prepositional phrases, and/or possessives (Cooper, 1976; Lu,

14
2011). Lu (2011) found a positive significant relationship between all levels except for between
years 3-4 in relation to complex nominals per clause (CN/C).
2.1.1.13 Complex nominals per T-unit
The complex nominals per T-unit (CN/TU) index is conceptually similar to CN/C. In
Lu's (2011) data, CN/TU and CN/C were strongly correlated (r = .867). Wolfe-Quintero et al.
(1998) propose that CN/C is a better index than CN/TU because the latter makes a construct-
irrelevant distinction (between coordination and subordination). This proposal seems to be borne
out in Lu's (2011) data: CN/TU discriminated between the first year and years 2-4, but not for
any other adjacent levels while CN/C discriminated between all levels except years 3-4..
2.1.1.14 Verb phrases per T-unit and verb phrases per clause
The verb phrases per T-unit (VP/TU) index was proposed by Wolfe-Quintero et al.
(1998) and measures the total number of verb phrases in a T-unit, including finite and non-finite
verbs. The verb phrases per clause index (VP/C) is the same, but with the clause as the
denominator. The only L2 writing study I am aware of that includes VP/TU is Lu (2011), who
found no relationship between the index and proficiency.
2.1.1.15 Passives per T-unit, clause, and sentence
In Wolfe-Quintero et al.'s (1998) review, only one study (Kameen, 1979) employed
passive indices. Kameen (1979) differentiated between active and stative passives, and only
included active passives in his counts. Passives per T-unit (P/TU), passives per clause (P/C) and
passives per sentence (P/S) all significantly discriminated between “good” and “poor” writers,
with “good” writers using more passive constructions than “poor” writers.

15
2.1.1.16 Other indices proposed by Wolfe-Quintero et al. (1998)
One particularly important issue addressed by Wolfe-Quintero et al. (1998) is the lack of
specificity of the indices described. They therefore proposed a number of more specific indices,
which have not yet been employed in L2 writing studies. These cover a number of specific
phrasal and clausal categories. For each category, they propose an index with the clause as a
denominator and another with the T-unit as the denominator. These categories include the four
finite clause types: independent clauses (IndC/C, IndC/TU), adverbial clauses (AdvC/C,
AdvC/TU), nominal clauses (NomC/C, NomC/TU), adjective clauses (AdjC/C, AdjC/TU), and
the three non-finite verb phrase types: infinitive phrases (InfVP/C, InfVP/TU), gerund phrases
(GerVP/C, GerVP/TU), participial verb phrases (PartVP/C, PartVP/C). They also propose two
further categories based on definite articles (DefArt/C, DefArt/TU) and indefinite articles
(IndefArt/C, IndefArt/TU) on the basis that they are “developmentally important structures” (p.
125).
2.1.1.17 Summary
This review of indices of syntactic complexity described by Wolfe-Quintero et al. (1998)
has demonstrated that large-grained indices, such as MLTU and MLC tend to have a positive
relationship with L2 writing development such that syntactic structures tend to get longer and
more complex as writers develop (though there are exceptions). It has also indicated that many of
these indices are interrelated. Furthermore, many of the large-grained indices do not provide
specific information about the syntactic structures that emerge as learners develop. One can
relatively confidently say that writers will include more information in each clause or T-unit, but
know very little about the types of information/structures included (e.g., adverbials, noun-

16
phrases, noun-phrase modifiers, etc.) and whether learners at a particular proficiency level are
using a consistent set of structures.
2.1.2 Syntactic complexity indices and the Biber Tagger
The Biber Tagger is a text analysis tool that has been predominately used to conduct
multidimensional analyses (MDA) of language variation (e.g, Biber, 1988; Biber et al., 2004).
The Biber Tagger calculates over a hundred lexical and lexico-grammatical indices. Recent
research using the Biber Tagger (Biber et al., 2011) has suggested that traditional clause-based
measures of syntactic complexity may not be indicative of academic writing but rather indicative
of informal speech. For instance, Biber et al. (2011) compared the frequency of a number of
clause and phrase-based features (see Table 2.1 for an overview of these features, and Biber et
al., [2004] for a comprehensive description of each) between a corpus of informal spoken
conversations and a corpus of academic journal articles. With regard to structural type, they
found that the spoken texts contained more finite dependent clauses, while the written academic
texts contained more dependent phrases. With regard to syntactic function, they found that
spoken texts contained more constituents in clauses while written academic texts contained more
constituents in noun phrases. The results of the comparative corpus analysis suggest that
traditional clause-based indices may not be not appropriate for L2 developmental writing studies
because clausal complexity is a feature of informal spoken texts and not of academic written
texts. Biber et al., further propose a number of developmental stages wherein the characteristics
of learner language move from informal spoken language to academic written language.
Yang (2013), however, notes that the L1 reference corpus used in Biber et al. (2011)
cannot clearly answer questions regarding L2 development. To make such claims, one needs to
measure the development of language learners’ speech and writing, either longitudinally or cross-

17
sectionally. An analysis of this type would allow for stronger claims to be made about L2
development. In their rebuttal, Biber, Gray, & Poonpon (2013) argue that if the goal of language
learners is to become members of the English academic community, they will need to develop
language skills that are congruent with that community. Thus, students of English for academic
purposes (EAP) should focus more on complex noun phrases and less on clausal subordination as
evidenced in L1 writing samples.
Yang's (2013) concerns notwithstanding, Biber et al. (2011) propose a number of indices
that are likely important indicators of L2 academic writing development (Biber et al., 2013). The
work of Biber et al. and others (Norris & Ortega, 2009) have prompted a new wave of studies
comparing clausal and phrase-based features. A few of these studies have used indices based on
the Biber Tagger, which are reviewed below, while others (e.g., Crossley & McNamara, 2014)
have used alternative noun phrase complexity indices, which are reviewed in a later section.

18
Table 2.1 Biber-tagger based indices relevant to syntactic complexity proposed in Biber et al. (2011) Category Index Finite adverbial clauses Total finite adverbial clauses Because clause If clause Although clause Finite Complement Clauses verb + that clause verb + WH clause adjective + that clause noun + that clause Finite noun modifier clauses that relative clauses WH relative clauses Nonfinite adverbial clauses to adverbial clause Nonfinite complement clauses verb + -ing clause verb + to clause adjective + -ing clause adjective + to clause noun + of + -ing clause noun + to clause Nonfinite noun modifier clauses nonfinite relative clause Adverbials adverbs as adverbials prepositional phrases as adverbials Noun modifiers attributive adjectives nouns as nominal premodifiers total prepositional phrases as nominal modifiers of as postmodifier in as postmodifier on as postmodifier with as postmodifier for as postmodifier Note. Adapted from Biber et al. (2011)
Taguchi, Crawford, & Wetzel (2013) investigated differences in L2 writing using six
clause-level complexity measures (subordinating conjunctions, verb complements, noun

19
complements, adjective complements, that-relative clauses, and WH-relative clauses) and nine
phrase-level complexity measures (a number of qualifiers, quantifiers, determiners, articles,
conjunctions, adjectives and prepositional phrases). Using these clausal and phrasal complexity
measures, they compared a high group and a low group of L2 writers (based on holistic scores).
It is difficult to objectively interpret the results of this study because inferential statistics were
not used. Nonetheless, (Taguchi et al., 2013) report that the high and low groups demonstrated
similar clausal complexity (though subordinating conjunctions and that- relative clauses used
more often by the low group and that- clause verb complements were used more by the high
group). With regard to the phrasal complexity features, two differences were reported: attributive
adjectives and post-noun-modifying prepositional phrases were used more by the high group. To
reiterate, although differences were reported at both clausal and phrasal level, no inferential
statistic use was reported, limiting the conclusions noted by the authors.
Biber et al. (2014) conducted an analysis similar to the one conducted in Biber et al.
(2011), but instead of analyzing L1 reference corpora, they analyzed responses to the speaking
and writing performance tasks that are part of the Test of English as a Foreign Language
(TOEFL). They divided the texts in to four categories: independent and integrated speaking and
independent and integrated writing. Generally, they found that similar differences existed
between L2 texts as were found in the L1 texts used in Biber et al. (2011). For instance, writing
samples were reported to have more complexity at the phrasal level (particularly with regard to
noun phrases), while spoken texts include more finite clauses and verb + to constructions. With
regard to development, a full factorial analysis indicated that only two indices significantly
interacted with holistic score: high scoring written integrated texts included more attributive
adjectives and verb + that clause constructions. Further analysis indicated that a combined

20
spoken/written features index (derived from a multi-dimensional analysis) indicated small,
positive relationships between the spoken tasks and the integrated written task and holistic
scores. A medium, positive relationship was observed between the combined index and
independent written responses. Overall, this study supports the claims made in Biber et al.
(2011), but does not provide strong evidence that phrasal features are indicators of writing
development.
Parkinson & Musgrave (2014) examined the writing of 21 “upper intermediate”
international English for academic purposes (EAP) students and 16 MA TESOL international
students. Following Biber et al.'s (2011) position that complex noun phrases are the hallmark of
academic writing, they examined the differences in the use of 20 noun modifier types between
the EAP and MA TESOL students that fell along Biber et al.’s proposed cline of writing
development. Based on their analysis, they concluded that the EAP students showed
characteristics of lower levels of development (i.e., reliance on attributive adjectives), while the
MA students demonstrated the characteristics of higher levels of development (e.g., phrasal
modifiers). These results seem to contradict the findings of Biber et al. (2014), who found that
attributive adjectives were indicative of highly scored integrated essays. Some important
limitations of the study are that neither writing prompt nor genre was controlled for nor was
proficiency controlled, making the results difficult to interpret.
2.1.3 Syntactic complexity indices and Coh-Metrix
Another tool that measures syntactic complexity is Coh-Metrix (Graesser, McNamara,
Louwerse, & Cai, 2004; McNamara, Graesser, McCarthy, & Cai, 2014), which is an online text
analysis tool originally designed to measure textual cohesion in reading comprehension studies.
Its usefulness for analyzing L2 writing development, however, has been demonstrated through a

21
number of studies (Crossley & McNamara, 2014; Guo et al., 2013). The measures that can be
freely accessed at www.cohmetrix.com are discussed first, followed by other indices that have
been reported in investigations concerning Coh-Metrix and syntactic complexity.
2.1.3.1 Number words before main verb
The number of words before the main verb (NW->MV) index is a measure of sentence
complexity. The “main verb” is operationalized as the main verb in the first independent clause
in a sentence. A sentence with highly a complex subject (due to phrasal coordination,
embedding, etc.) and/or subordinated adverbial clauses before the main verb would earn high
scores. A sentence with a less complex subject (e.g., lacking embedding) or that lacks an
adverbial clause before the main verb would earn lower scores, as would any sentence with the
same elements applied to a complement (e.g., the direct object) or with adverbial clauses
occurring after the main clause. A number of L1 writing studies (McNamara et al., 2010) have
used NW->MV to successfully discriminate between high and low proficiency writers. The
index was also used in an L2 writing study (Crossley & McNamara, 2014). In this study,
Crossley and McNamara investigated the linguistic features of writing quality and L2 writing
development over the course of a semester. They reported a significant growth in NW->MV
values between the essays written at the beginning and end of a semester (p = .024; η2p = .088)
and a small, positive (though not significant) relationship between NW->MV values and analytic
scores for language use (p = .204, r = .120) and combined analytic scores (p = .065, r = .174). A
summary of the indices reported in Crossley & McNamara (2014) can be found in Table 2.2.
2.1.3.2 Modifiers per noun phrase
The modifiers per noun phrase (M/NP) index is conceptually related to the complex
nominals per T-unit (CN/TU) index. In Coh-Metrix, noun phrases are defined as the final NP in a

22
chain of NPs (or as an NP without any NP children). Any children of that NP are considered
modifiers. This operationalization includes determiners, adjectives, and nouns as modifiers, but
does not included relative clauses or prepositional phrases as modifiers. Guo et al. (2013)
reported a small, positive relationship (r = .264) between M/NP and TOEFL integrated essay
scores and a moderate, positive relationship (r = .377) between M/NP and TOEFL independent
essay scores. Crossley & McNamara (2014) also reported a longitudinal increase in M/NP (p =
.007, η2p = .122), and a positive relationship between M/NP and combined scores (p = .023, r =
.213) but not between M/NP and language use scores.
2.1.3.3 Syntactic structure similarity
Coh-Metrix calculates two syntactic structure indices, one that measures the average
similarity between adjacent sentences, and one that measures the average similarity between all
sentences. These are calculated by counting the proportion of intersecting syntactic nodes
between sentences. Crossley & McNamara (2014), found that an index of syntactic similarity
reported a decrease in values for longitudinal growth (p = .011, η2p = .110) and small, negative
(though statistically insignificant) relationships between the index and language use score (p =
.074, r = -.169) and combined scores (p = .097, r = -.157).
2.1.3.4 Phrase incidence indices
In addition to the indices described above, Coh-Metrix also includes a number of indices
that count the presence of particular syntactic structures in a text. These include the normed
incidence counts (per 1000 words) for noun phrases (NPi), verb phrases (VPi), adverbial phrases
(AdvPi), preposition phrases (PPi), agentless passives (APassi), negations (Ni), gerunds (Geri)
(in Coh-Metrix, gerunds are loosely defined as –ing verbs, which includes participles) and
infinitives (Infi). Guo et al. (2013) found a small, positive relationship (r = .186) between

23
independent writing scores and gerunds. Crossley & McNamara (2014) reported that the learners
increase in their use of verb phrases over a semester of study, but that the incidence of verb
phrases is negatively correlated with holistic essay score. The use of prepositional phrases
increased both as a function of time and writing quality.
2.1.3.5 Other Coh-Metrix indices reported in studies
A number of Coh-Metrix indices related to syntactic complexity that are not available in
the online tool have also been used to investigate syntactic complexity in L1 and L2 writing.
Crossley & McNamara (2014), for example, reported a number of additional Coh-Metrix indices
of syntactic complexity such as the number of subject relative clauses in a text. In addition to the
syntactic indices reported above, Crossley and McNamara found that as students developed, their
writing included more features attributed to clausal complexity, but that essay raters tended to
award higher scores to essays that included more features of phrasal complexity. These, along
with their relationship with longitudinal growth, language use scores, and combined scores are
included in Table 2.2.

24
Table 2.2 Coh-Metrix indices of syntactic complexity reported by Crossley and McNamara (2014) Indices Longitudinal
Direction Strength of
Longitudinal Relationship
(η2 p)
Relationship with Language Use
Score (r)
Relationship with Combined Score
(r)
Incidence of all clauses _ 0.144** -.0295** -0.350**
M/NP + 0.122** 0.211* 0.213* Syntax Similarity - 0.110** -.0169 -0.157 VPi - 0.103** -0.229* -0.237* NW->MV + 0.088* 0.120 0.174 not negation + 0.067* 0.194* 0.263** PPi + 0.057 0.179 0.229* Subject relative clauses + 0.044 0.084 0.099
-that verb complements - 0.005 0.249** 0.199*
S-Bars - 0.003 -0.093 -0.130 Infi + 0.001 0.234* 0.321* Note. ** indicates p < .01; *indicates p < .05
Guo et al. (2013) also reported a number of additional indices of syntactic complexity,
such as the number of past participle verbs (reporting that past participle verbs contributed to
predictor models of independent and integrated writing scores). Guo et al. also found that verbs
in the third person present form and verbs in the base form contributed to a predictor model of
integrated writing. Writers who used more past participle verbs and fewer third person and base
form verbs tended to earn higher marks. A number of other syntactic indices investigated by Guo
et al., along with their reported relationships with independent and integrated writing scores, are
included in Table 2.3.

25
Table 2.3 Coh-Metrix indices reported in Guo et al., 2013
Index Relationship with Independent Essay Scores (r values)
Correlation with Integrated Essay Scores (r values)
Included in online tool?
Grammatical word information indices:
Personal pronouns -.297 -.315 No Past participle verbs .464 .437 No Verbs in base form -.281 -.403 No 3rd person singular present verbs not reported .194 No
verbs not in 3rd person singular present tense -.441 -.344 No
-ing verbs not reported .186 Yes verbs in past tense not reported -.165 Yes Syntactic structure indices:
M/NP .337 .264 Yes Embedded Clauses -.339 not reported No Note. Any indices noted as “not reported” were excluded from the analysis due to multicollinearity or failure to reach statistical significance
2.1.4 Other operationalizations of syntactic complexity
Bulté & Housen (2014) operationalized syntactic complexity at three levels according to
recent discourse on syntactic complexity (e.g., Norris & Ortega, 2009): the sentence, the clause,
and the phrase. Sentence indices were divided into length, sentence composition, and
combining/linking. The length indices were mean length of sentence (MLS) and mean length of
T-unit (MLTU). The sentence composition indices comprised ratios of particular sentence types
to all sentences and included simple sentence (a sentence with a single independent clause and
no dependent clauses) ratio (SSR), compound sentence (a sentence with two or more
independent clauses and no dependent clauses) ratio (CdSR), complex sentence (a sentence with
a single independent clause and at least one dependent clause) ratio (CxSR), and compound
complex sentence (a sentence with at least two independent clauses and one dependent clause)
ratio (CdCxSR). The combining/linking indices included the ratio of coordinated clauses to

26
sentence (CCR) and the ratio of subclauses to sentences (SCR). A single clausal complexity
index was employed, mean length of finite clause (MLFC), and a single phrasal complexity
index, mean length of noun phrase (MLNP) was used. Bulté and Housen compared a text written
by L2 writers at the beginning of the semester and at the end of the semester using these ten
indices. Of the ten, only three (SCR, CdCxSR, and CdSR) failed to demonstrated significant (p <
.05) and meaningful (d > .20) differences between writings from the beginning and end of the
semester. All significant and meaningful relationships increased, with the exception of SSR,
which decreased. That is to say that sentential, clause, and noun phrase length (W/S, W/TU,
W/FC, and W/NP) and amount of clausal coordination (CCR and CdSR) increased, while simple
sentence use decreased. In contrast to the findings of Crossley & McNamara (2014), these
findings aligned closely with analytic ratings of language use and combined ratings: a diverging
relationship only existed for a number of sentence ratio types.
2.1.5 Longitudinal and cross-sectional research designs
Longitudinal research designs involve the collection of data from a relatively
homogenous group of participants over an extended period of time (e.g., Crossley & McNamara,
2014; Knoch et al., 2014). Longitudinal studies allow one to control for individual variation, but
can be difficult to implement due to factors such as attrition (Mackey & Gass, 2005). Cross-
sectional research designs, on the other hand, involve the collection of data at a single point in
time from participants with a wide range of language proficiency (e.g., Guo et al., 2013; Lu,
2011). While individual variability cannot be accounted for, a large amount of data can be
collected in a relatively short period of time, and attrition is not a factor (Mackey & Gass, 2005).
Likely due to practical concerns, much of the body of knowledge regarding syntactic
development is derived from cross-sectional studies (Biber et al., 2014; Guo et al., 2013; Lu,

27
2011). Additionally, the longitudinal studies that have been conducted tend to examine
development over a relatively short period of time (e.g., a semester; c.f., Knoch et al., 2014).
Findings from cross-sectional and longitudinal studies often fail to coincide (e.g., Crossley et al.,
2014), suggesting the need for more (and longer) longitudinal syntactic development studies to
support (or problematize) cross-sectional studies (Ortega, 2003).
2.1.6 Summary of syntactic complexity measures
Due to the overwhelming number and types of indices reviewed, it is difficult to
succinctly summarize the extant body of knowledge regarding syntactic complexity and L2
writing development. However, it appears that L2 writing develops with regard to length of
clauses, sentences, and T-units (Lu, 2011; Ortega, 2003). Furthermore, the use of phrasal
elaboration seems to be linked to academic writing (Biber et al., 2011, 2014), though the ways in
which writers develop over time does not always correlate with the features that are
characteristic of academic writing (Crossley & McNamara, 2014). Additionally, although many
studies (e.g., Bulté & Housen, 2014) report manually annotating texts for syntactic structures, the
use of automatic tools is increasing (Biber et al., 2014; Crossley & McNamara, 2014; Lu, 2011),
which allows for larger datasets to be analyzed, and for the analysis to be standardized.
Additionally, the majority of syntactic development studies have adopted cross-sectional designs
(e.g., Guo et al., 2013; Lu, 2011). Future longitudinal studies may be warranted to support (or
problematize) the findings of cross-sectional studies.
2.2 Syntactic Sophistication
The study of language acquisition from a usage-based perspective has gained traction
over the past 25 years. Generally speaking, a usage-based perspective to language acquisition
posits that language learning is no different from other types of experiential human learning

28
(Bybee, 2006; Langacker, 1987; Tomasello, 2003) in that repeated experiences hearing/using
pieces of language results in language learning. It is through the combination of two human
cognitive abilities, namely intention-reading and pattern-finding that children are able to acquire,
over time, the language system of the adults they interact with (Tomasello, 2003). From a usage-
based perspective, all linguistic forms (e.g., words, phrases, syntactic patterns, etc), which are
called constructions (Goldberg, 1995), are functional form-meaning pairings. Such perspectives
challenge the Chomskian (e.g., Chomsky, 1988) notion that the human propensity for language is
innate via Universal Grammar (UG). UG posits that humans are “hard-wired” for grammatical
knowledge/use via a genetic adaptation of a grammatical system, and that grammatical structures
carry no meaning outside of the items that fill them. From this perspective, language learning
involves mapping linguistic input onto the innate grammatical system. Usage based perspectives,
on the other hand, argue that learners acquire language skills through interacting with the
language.
Starting in the 1990’s, usage-based theories of language acquisition began to be
empirically tested in first language (L1) acquisition (e.g., Goldberg, Casenhiser, & Sethuraman,
2004; Lieven, Pine, & Baldwin, 1997; Tomasello & Brooks, 1999). By the early 2000’s, usage-
based perspectives began to gain traction in the field of second language (L2) acquisition (Ellis,
2002a, 2002b). The unit of investigation in most of this work has been the verb-argument
construction (VAC), which consists of a verb-slot and the arguments it takes. A transitive
construction, for example, includes a subject, a main verb, and a direct object, such as in the
sentence Jacksubject kickedverb a balldirect_object. Research in both L1 and L2 acquisition from a
usage-based perspective has been approached through three general methodologies: analysis of
interactional corpora, psycholinguistic experiments, and analysis of large reference corpora.

29
Interactional corpora have been used to investigate the relationship between linguistic input and
production in both L1 and L2 acquisition (Ellis & Ferreira-Junior, 2009a, 2009b; Ninio, 1999).
Psycholinguistic experiments have been used in conjunction with large reference corpus studies
to explore the psychological reality of constructions in L1 and L2 language users (e.g., Gries &
Wulff, 2005) and determine the relationship between L1 intuitions and reference corpus data
(Ellis, O’Donnell, & Römer, 2014).
2.2.1 Verb-argument constructions
Usage-based theories of language posit that a form/meaning divide does not exist because
grammatical forms carry meaning in the same way that lexical items do (Goldberg, 1995;
Langacker, 1987). In the sentence He wugged her the ball, for example, we can extrapolate the
meaning of the nonsense verb “wugged” because the ditransitive (i.e., subject – verb – indirect
object - direct object) form carries the meaning of transferring something from one entity to
another. This suggests that not only verbs that fill a particular syntactic form have meaning, but
the forms themselves (e.g., the ditransitive) also carry meaning. Goldberg (1995) refers to these
form-meaning pairings as constructions. Constructions occur at multiple levels of abstraction,
ranging from morphology to syntax. Verb-argument constructions (VACs), or constructions that
consist of a verb and all arguments it takes, have been of particular interest in most areas of L1
and L2 development research (Goldberg et al., 2004; Ninio, 1999; Römer, Roberson, O’Donnell,
& Ellis, 2014)
2.2.2 Psychological reality of VACs in L1 and L2
L1 studies suggest that VACs carry as much (or more) meaning as the lexical verbs that
fill them do (Bencini & Goldberg, 2000; Chang, Bock, & Goldberg, 2003; Hare & Goldberg,
1999). Bencini and Goldberg (2000), for example, conducted an experiment to determine the

30
relative importance of verb meaning and construction meaning. They employed a sorting task in
which participants (n = 17) were given 16 cards, each of which included a distinct sentence that
contained one of 4 verbs in one of 4 constructions. Participants were instructed to sort the cards
into four groups based on the overall meanings of the sentence. Seven of the participants sorted
the cards solely by construction type, none of the participants sorted the cards solely by verbs,
and the participants with mixed sorts were closer to construction sortings than verb sortings.
These results suggest that a.) construction form-meaning pairings are a psychological reality and
b) construction meanings are more salient than verb meanings. Other studies conducted by
Goldberg and her colleagues (e.g., Hare & Goldberg, 1999; Chang, Bock, and Goldberg, 2003)
provide additional support for the psychological reality of syntactic-semantic mental
representations in L1 speakers.
Gries & Wulff (2005) demonstrate that VACs are also likely a psychological reality for
L2 learners. In one experiment, advanced L1 German learners of L2 English completed a
sentence completion task that was intended to produce either prepositional dative or ditransitive
constructions based on a particular subject/verb combination. The German learners’ preferences
for prepositional dative/ditransitive given a subject and verb followed similar patterns to native
speakers (based on reference corpus analysis). Furthermore, the L1 German learners of L2
English made prepositional dative/ditransitive choices that diverged from similar constructions in
German, suggesting that advanced L2 learners develop VAC knowledge that is similar to L1
speakers of a target language. In a second experiment, Gries and Wulff replicated the sorting task
in Bencini & Goldberg (2000), which found that when asked to sort sentences based on their
overall meaning, participants were more likely to sort sentences based on constructions than
verbs. In this second experiment, a distinct group of L1 German learners of L2 English

31
completed a sentence-sorting task. Learners were asked to sort 16 sentences, each of which
included a distinct combination: one of 4 verbs and one of 4 constructions into four groups based
on the overall meanings of the sentence. The results indicated that the learners were more likely
to sort the cards based on constructions than verbs. The results of these two experiments suggest
that L2 language learners, like adult L1 speakers, have mental representations of construction
form/meaning pairings and that in advanced L2 learners, these representations are similar to
those of a fully developed L1 user.
Römer et al. (2014) explored the VAC knowledge of German and Spanish L1 learners of
L2 English through corpus studies of the International Corpus of Learner English (ICLE;
Granger, Dagneaux, Meunier, & Paquot, 2009), the Louvain International Database of Spoken
English Interlanguage (LINDSEI; Gilquin, De Cock, & Granger, 2010) and gap-filling exercises.
More specifically, they explored the verbs produced in a number of Subject – Verb –
Prepositional Phrase (SVPP) constructions, with a focus on the verbs produced in these
constructions in relation to the particular preposition present (e.g., which verbs are produced in
SVPPacross, SVPPfor, and SVPPabout constructions). Although the results differed to some degree
across corpora and L1 backgrounds, the study provided additional evidence that L2 learners have
mental representations of constructions by demonstrating that learners have strong verb
preferences for each construction. In a similar study, Römer, O’Donnell, & Ellis (2015)
compared the verbs produced in a variety of SVPP contexts by L1 German learners of L2
English, L1 English speakers (via a gap-filling exercise) and their relative frequencies in the
BNC. Although the results varied by construction type, the verbs produced by the L1 and L2
users of English were generally highly correlated both with each other and with corpus
frequencies.

32
Taken together, these studies suggest that VACs are indeed a psychological reality and
that they carry at least as much meaning as the lexical items that fill them. This appears to be true
both for L1 users and for L2 users.
2.2.3 VAC development
L1 child acquisition studies suggest that VACs (and other constructions) are learned and
thus not likely innate (Goldberg et al., 2004; Lieven et al., 1997; Ninio, 1999). Particular
prototypical “pathbreaking” verbs are used first in constructions for a period of time before the
construction is generalized to other verbs. It is through low-variance, high frequency experiences
with constructions that language learners are able to generalize, and therefore overcome the so-
called poverty of stimulus. Clearly, frequency of input plays an important role in the production
of generalized constructions (Behrens, 2009; Tomasello, 2003), suggesting that high frequency
constructions will be more easily learned (and therefore be considered less sophisticated) than
low frequency constructions.
Fewer studies have explored L2 development from a usage-based perspective. Ellis &
Ferreira-Junior (2009a, 2009b) for example, investigated the production of VL, VOL, and VOO
by seven adult L2 learners of English and their L1 interlocutors over 23-32 months of study. The
verb occupancy frequency profiles for the adult L2 learners closely resembled those of the L1
interlocutors, with very high correlations reported for each construction. Highly frequent verb-
construction combinations in the input tended to be produced by the learners more often than
verb-construction combinations that occurred less frequently, suggesting that input frequency
plays an important role in how verb-construction combinations are learned. Ellis and Ferreira-
Junior also explored whether the strength of association between particular verbs and
constructions could predict which combinations would be produced by the language learners.

33
They used a number of verb-construction contingency features in the L1 input to measure
association strength. These features correlated highly with L2 production, including
collexeme/collostructional strength, which is an index of the joint probability of a
verb/construction combination (Gries, Hampe, & Schönefeld, 2005), suggesting that strength of
association is an important indicator of L2 construction learning. The findings support the notion
that L1 and L2 language development (at least with regard to verb-construction combinations)
are similar (Goldberg et al., 2004) and that both input frequency and strength of association are
important predictors of L2 production. More frequent/strongly associated verb-construction
combinations seem to be learned first (and would therefore be considered less sophisticated) than
les frequent/prototypical verb-construction combinations. In addition, Eskildsen & Cadierno
(2007) investigation of the development of negations in early L2 learning and Eskildsen's (2009)
investigation of the development of the modal can suggest that VAC development in L2 learners
generally proceeds from a single, potentially fixed construction to a more schematic one, in a
manner similar to early L1 learners (Goldberg et al., 2004; Ninio, 1999).
In summary, the reviewed studies have indicated that VACs are a psycholinguistic reality
for both L1 and L2 language users. When learning constructions, L2 adults generally begin by
learning low-variance or fixed constructions, which develop into schematic form-meaning pairs
and that L2 construction learning is affected by input frequency and contingency, which can help
explain the general order in which VACs are learned. What is not currently known is whether
these trends are stable with regard to proficiency (e.g., continue into intermediate stages of
development) and mode (i.e., written versus spoken), and whether these trends are generalizable
to all VACs. In order to begin to address this gap, a number of tasks should be completed. First,
a full account of the constructions used in the English language needs to be created. Second,

34
automated indices need to be created to quantify syntactic development based on frequency and
contingency. Finally, these indices should be applied to a number of longitudinal and cross-
sectional corpora to determine how language use changes over time with regard to syntax.
2.3 Overview of L2 Syntactic Development Research
The extant research regarding L2 syntactic development suggests that as learners become
more proficient writers, they tend to write longer clauses, T-units, and sentences (e.g., Lu, 2011;
Ortega, 2003) although these results are generally based on relatively small sample sizes (Lu,
2011 being an exception). Research also suggests that phrasal elaboration, and particularly noun
phrase elaboration is a feature of academic writing (Biber et al., 2011). Furthermore, learners
tend to produce more noun phrases that include more modifiers as a function of time and writing
proficiency scores (Crossley & McNamara, 2014). Usage-based research suggests that L2
syntactic development is related to frequency in input and use such that frequently encountered
constructions and verb/construction combinations will be learned before less frequent ones (Ellis
& Ferreira-Junior, 2009b). There are, however, gaps in our collective knowledge of syntactic
development. First, because large-grained indices of clausal syntactic complexity are frequently
used, our knowledge about the processes by which clauses, T-units, and sentences become longer
(i.e., the specific features that account for the lengthening of these units) is incomplete. Second,
indices of phrasal elaboration have been explored with much less frequency than indices of
clausal complexity/elaboration, resulting in a relatively limited body of research from which to
make generalizations. Furthermore, the most often employed phrasal indices in developmental
studies, which have been complex nominals per clause/T-unit (Lu, 2010, 2011), modifiers per
noun phrase, and number of words before the main verb (Crossley & McNamara, 2014; Guo et
al., 2013) are relatively large-grained, leaving questions about the types of modifiers learners use

35
as they develop (c.f., Biber et al., 2011, 2014). Finally, usage-based perspectives to syntactic
development have only been explored with regard to a small set of constructions (e.g., SVO,
SVL) and usually only in oral registers with relatively low-proficiency learners (c.f., Römer et
al., 2015).
3 TOOL FOR THE AUTOMATIC ANALYSIS OF SYNTACTIC SOPHISTICATION
AND COMPLEXITY (TAASSC)
Syntactic complexity has been of interest in first language (L1) development since the mid
1960’s (Hunt, 1965) and and second language (L2) development since the mid 1970’s (Larsen-
Freeman, 1978) respectively. A refined and fully developed definition of syntactic complexity
has yet to be agreed upon, but can be defined generally as the existence of a variety of syntactic
structures in a particular language use sample. In L2 writing development, this has traditionally
focused on clausal subordination (Ortega, 2003; Wolfe-Quintero et al., 1998), but complexity at
the phrase level has also recently gained a great deal of interest (e.g., Biber et al., 2011). The
calculation of syntactic complexity measures have traditionally been done manually, perhaps
leading to the prevalence of large-grained syntactic measures such as the mean length of
sentence (MLS) or T-unit (TU). Manual annotation of learner texts is a resource-heavy procedure
and is prone to error (Higgins, Xi, Zechner, & Williamson, 2011; Lu, 2010), leading to calls for
the automation of such procedures (Bulté & Housen, 2012). Relatively recent advances in
computational linguistics and natural language processing (NLP) (e.g., Chen & Manning, 2014;
Klein & Manning, 2003) have made the creation of syntactic analysis tools possible (e.g., Biber
et al., 2004; Lu, 2010; McNamara et al., 2014).
In this chapter, the NLP processes that allow for the automatic extraction of syntactic
complexity measures are outlined, namely part of speech (POS) tagging, constituency parsing,

36
dependency parsing, and parse tree analysis programs. Three tools that currently measure
syntactic complexity automatically are described and their strengths and weaknesses are
reviewed. The rationale for a new tool is then given, followed by a description of the Tool for the
Automatic Analysis of Syntactic Sophistication and Complexity (TAASSC).
3.1 NLP Processes
To analyze syntactic features related to complexity and sophistication one must identify
the parts of speech (POS) of the words in a sentence and the syntactic relationships (i.e.,
constituency and/or dependency relations) between them. A number of computational advances
over the past 50 years, and especially over the past 20 years have made the automatic extraction
of such features possible (Brill, 1995; Charniak, 2000; Chen & Manning, 2014; de Marneffe,
MacCartney, & Manning, 2006; Klein & Manning, 2003). Such advances have made possible
the automatic analysis of syntactic complexity (e.g., dependent clauses per clause and modifiers
per noun phrase) and syntactic sophistication (e.g., the identification of verb argument
constructions). In this section three major NLP processes related to automatic syntactic analysis
will be described, namely POS tagging, constituency parsing, and dependency parsing.
3.1.1 Part of speech tagging
The process of POS tagging involves assigning grammatical part of speech tags (e.g.,
verb, noun, adjective, etc.) to each word in a text. POS tagging is a preliminary step for more
advanced processes needed for syntactic analysis (i.e., constituency and dependency parsing) and
provides some of the information needed for fine-grained syntactic analyses (e.g., number of
nouns as modifiers per noun phrase). The POS tagged version of the sentence The linguist climbs
rocks is The_DT linguist_NN climbs_VBZ rocks_NNS (as processed by the Stanford POS

37
tagger), where DT = determiner, NN = singular common noun, VBZ = third person singular verb,
and NNS = plural common noun. A number of different tagging schemes can be used such as the
61-feature CLAWS5 tagset (Garside, Leech, & McEnery, 1997) or the 45-feature Penn Treebank
tagset (Marcus, Marcinkiewicz, & Santorini, 1993) depending on the preferences of the
developers.
State of the art POS tagging can achieve accuracies of up to 97% (Jurafsky & Manning,
2008; Toutanova, Klein, Manning, & Singer, 2003). Such accuracy is achieved using a number
of methods. Before the methods in which POS taggers such as the Stanford POS tagger
(Toutanova et al., 2003) uses in order to achieve such high accuracy are discussed, it is perhaps
useful to discuss why POS tagging (and natural language processing in general) might be
considered difficult. One important issue is that of linguistic ambiguity. To automatically assign
POS tags to a text we could, for example, create a large dictionary of word-POS tag
correspondences and use these to assign tags to the words in a text. This method will work for
any word in our dictionary that has only one entry (articles such as the, a, and an are good
examples), but is problematic for any words with multiple entries. In our word-POS tag
dictionary, for example, the word form “book” minimally has two tags, one for the verb sense of
book (e.g., I need to book my flight to Denver) and one for the noun sense (e.g., I read a good
book last night). The second major issue is that of unknown words. We can account for a large
proportion of running words in a text using a relatively small number of words (Nation, 2001),
but Zipf’s law (Zipf, 1935) suggests that there will be a disproportionately large number of
words that occur extremely infrequently. Furthermore, new words (and new uses for old words)
are created every day, making the likelihood of a POS tagger encountering a new word quite
likely, even if we had an extremely large dictionary. Additionally, POS tagsets such as the Penn

38
Treebank tagset (Marcus et al., 1993) and the CLAWS5 tagset (Garside et al., 1997) include
relatively detailed tags (e.g., there are seven tags for verbs in the Penn Treebank) making the task
even more difficult (Jurafsky & Manning, 2008).
To solve these problems, two general sets of solutions have been employed:
disambiguation rules and probabilistic disambiguation. A disambiguation rule is a generally
simple rule that can be used to determine which tag should be given to a particular instance of a
word like book, which can be given at least a noun or a verb tag. One such rule might be: If a
word that is ambiguously a noun or a verb comes after a determiner, give it a noun tag. Of
course, for such an approach to gain high accuracy, a large number of rules have to be written.
Brill (1995) came up with a now-famous solution to the issue of rule-writing, which is called
transformation-based learning (TBL). Taking a corpus of training data where each word includes
a POS tag (such as the Penn Treebank), a TBL program will create rules based on contextual
data. As the TBL program iterates through a corpus, it will generate a large number of rules.
Rules that do a better job of explaining the data are kept, while less useful rules are discarded.
TBL-based taggers have achieved very high accuracy (up to 97.2% for known words and 96.2%
combined known/unknown words; Brill, 1995).
The second solution to the problems of disambiguation and unknown words is to assign
the probability of a word/tag combination given corpus derived information. Perhaps the most
prevalent probabilistic method is the Maximum Entropy (MaxEnt) method. MaxEnt is essentially
multiple logistic regression, a statistical method that is used to predict the class membership of a
particular item based on a number of features (Jurafsky & Manning, 2008). In MaxEnt POS
tagging, the class membership being predicted is the tag assigned to a word, and this is done
based on multiple corpus-based probabilistic features (e.g., the probability of the word book

39
being a noun and a verb based on corpus frequency, the probability that book will be a noun or a
verb after a determiner, etc.). Various MaxEnt taggers use different compilations of feature sets
(i.e., probabilistic relationships that can be used as predictor variables). The Stanford POS
Tagger (StanPOS) (Toutanova et al., 2003) is a good example of a MaxEnt tagger that is
currently maintained (i.e., it is updated as new software standards are adopted), widely used, and
highly accurate (e.g., 97.24% for known words and 96.86% combined).
3.1.2 Constituency parsing
Constituency parsing is essential for automatic syntactic analyses because it allows for
the identification of phrasal and clausal boundaries, and also allows for the differentiation
between independent and subordinated clauses. The notion of grammatical constituency, or the
idea that groups of words can together function as a constituent or grammatical unit has been
around for about a hundred years (Wundt, 1900). Constituency explains how strings of words
such as the linguist and the fashionable linguist can occur in similar contexts in a sentence and
serve similar purposes (i.e., they are both noun phrases). Chomsky (1965) used the idea of
constituency as a basis for developing a model for how syntactic systems work. Chomsky
theorized that language systems could be described via a number of phrase-structure rules that
account for constituencies. Although many formalisms have been derived from Chomsky’s
theories, computer scientists tend to use phrase structure rules written in Chomsky Normal Form
(CNF), in which each rule includes a single structure on the left (e.g., NP) and either one or two
structures on the right (Jurafsky & Manning, 2008). Our first example, the linguist, which is a
noun phrase (NP), can be accounted for in CNF via the rule NP -> determiner (DT) noun (N). To
account for our second example, the fashionable linguist, we will need two rules, NP -> DT NP
and NP -> adjective (ADJ) N. It is important to note that these rules do not include lexical items,

40
and therefore theoretically, any ADJ and any N could be used to create a grammatical NP. This
has led to describing such a grammar as a “context-free grammar” (CFG). A CFG presents a
promising starting point for computational syntactic analysis because it can theoretically use a
finite number of rules to describe an infinite number of lexical combinations (sentences). A
syntactic parse, then, is a hierarchical representation of the phrase structure rules that account for
a particular sentence, which is often called a parse tree. The parse tree for the sentence The
linguist climbs rocks, for example is: (S((NP (DT The) (NN linguist)) (VP (VBZ climbs) (NP
(NNS rocks))))), which can be alternatively represented as in Figure 3.1.
Figure 3.1 A visual representation of the parse tree for the sentence The linguist climbs rocks.
Phrase structure rules can of course be handwritten, but they can also be automatically
derived from large repositories of hand-annotated sentences such as the Penn Treebank (Marcus
et al., 1993). Despite the theoretical advantages of CFGs, there is at least one major drawback:
linguistic ambiguity. Syntactic linguistic ambiguity can be demonstrated in many ways and at
many levels. One classic type of example, which is outlined in Fromkin et al. (2013), is
prepositional phrase (PP) attachment. In the sentence The boy saw the man with the telescope,
for example, the attachment of the PP with the telescope is ambiguous. It is not clear whether the

41
PP is directly attached to the VP as a sister of saw (e.g., VP -> V PP) or whether it is directly
attached to the NP as a sister of man (e.g., NP -> N PP): the rules for the grammar allow for both
interpretations. While this example is as ambiguous to humans as it is to a computer program, a
program based solely on phrase structure rules will have much more difficulty than a human
processing the same sentences, especially when we consider that true CFG parsers only use POS
tags (not lexical items) as input. One way structural ambiguity can be solved is probabilistically.
Given hand-tagged corpora, we can calculate the relative probabilities of each sentence parse
based on the POS tags, and assign the most probable parse to a sequence of POS tags (i.e., a POS
representation of a sentence). When probabilities are used to disambiguate possible parsers, they
are referred to as probabilistic context-free grammar parsers (PCFG parsers).
The accuracy of PCFG parsers has improved through the addition of various degrees of
context. Two ways that PCFG parsers have been enhanced is through recognizing grammatical
relations and through the use of lexical information (Jurafsky & Manning, 2008). In the
Switchboard corpus, for example, the probability of an NP consisting of a pronoun (PRP) (NP->
PRP) and the probability of an NP consisting of a determiner and a noun NP -> DT NN is very
similar. If we consider grammatical relations such as subjects and objects of verbs, however, we
see that the probability of NP-> PRP is much higher in the subject position than NP-> DT NN,
while in the object position, the opposite is true (Francis, Gregory, & Michaelas, 1999). PCFGs
can achieve much higher accuracies through the use of such information. Modeling lexical
preferences (e.g., n-gram frequencies) can also increase parser accuracy, but can lead to
extremely large and therefore slow models. Most current parsers such as the Stanford Parser
(Klein & Manning, 2003) tend to use grammatical relations instead of lexical information
(Jurafsky & Manning, 2008).

42
The Charniak parser (Charniak & Johnson, 2005; Charniak, 2000) is another popular
parser (in this chapter the configuration outlined in Charniak & Johnson, 2005 is described), but
unlike the Stanford Parser, it uses lexical information to obtain an accurate parse. The Charniak
parser runs in two stages. First, a text is parsed via a PCFG parser, and the n-best parses (i.e., the
n-most probable parses) are kept (Charniak & Johnson, 2005 reports on a 50-best parse
configuration). Lexical and head information is then added to information available to the
probabilistic model, and MaxEnt is used to choose the best parse. Using this method, the
Charniak parser can achieve up to 91.0% accuracy, which is state of the art.
3.1.3 Dependency parsing
Dependency parsing is useful for automatic syntactic analyses (much like constituency
parsing) because it reveals the syntactic relationships between words and phrases in a text.
Unlike constituency parsing, which results in a hierarchical representation of phrase structure
rules, dependency parsing results in a number of grammatical dependency relations, based on
grammatical function (e.g., the subject(s) of a verb). Dependency parsed representations of texts
make some syntactic analyses (e.g., identifying arguments of a verbs) much more convenient
than constituency parsed representations. Our example sentence, The linguist climbs rocks, can
be represented as a collection of dependency relations as in Table 3.1, or graphically as in Figure
3.2. Each relation includes a governor and a dependent. In simple and complex sentences, the
main verb of the independent clause is represented as the dependent of the ROOT of the sentence
(in graphical representations the ROOT is omitted). Note that single lexical items can be
represented both as governors and dependents in different grammatical relations (e.g., the word
linguist is both a governor of the and a dependent of climbs). Furthermore, a single word can

43
have multiple dependents (e.g., the word climbs has two dependents: the nominal subject linguist
and the direct object rocks).
Table 3.1 Dependency representation of the sentence “The linguist climbs rocks.”
Relation Governor Dependent
determiner linguist the nominal subject climbs linguist root ROOT climbs direct object climbs rocks Note. This parse was obtained via the Stanford Dependency Parser
Figure 3.2 Graphic representation of a dependency parse
Many dependency parsers extract dependency information from constituency parses (i.e.,
Briscoe, 2006; de Marneffe et al., 2006) via rules, though standalone dependency parsers have
existed for some time (e.g., the MALT parser; Nivre, Hall, & Nilsson, 2006). Constituency-based
dependency parsers have historically been more accurate than the former (Cer, Marneffe,
Jurafsky, Manning, & de Marneffe, 2010), though recent advances have led to superior stand-
alone systems (e.g., Chen & Manning, 2014). The Stanford neural network dependency parser
(Chen & Manning, 2014), for example, is capable of state of the art accuracy (around 90%), and
is also able to parse texts ten times faster than most constituency parsers (e.g., Klein & Manning,
2003).
Actual dependency representations differ based on the theoretical and practical
preferences of the developers. De Marneffe et al. (2006) for example, prefer for heads
(governors) to be defined semantically, while others may choose heads (governors) strictly based
on form (e.g., Collins, 2003). Dependency representations have been found to be more useful

44
than constituency representations in a number of NLP processes including information extraction
and question answering (e.g., Moldovan, Clark, Harabagiu, & Maiorano, 2003). Recently,
dependency representations have been used to automatically identify verb argument
constructions (e.g., O’Donnell & Ellis, 2010; Römer et al., 2015). Two particularly popular
dependency parsers are the RASP dependency parser (Briscoe, 2006), which tags 17
grammatical relations, and the Stanford Dependency Parser (Chen & Manning, 2014; de
Marneffe et al., 2006), which includes 50 grammatical relation tags.
This section has provided an overview of the computer processes involved in automatic
syntactic analysis of natural language. Following is a description of three current automated
syntactic analysis tools that can be used to measure syntactic development.
3.2 Extant automatic indices of syntactic complexity
A number of text analysis systems currently exist that measure some indices of syntactic
complexity. These range from tools built from the ground up to analyze specific linguistic
characteristics such as the Biber Tagger, (Biber, 1988; Biber et al., 2004), to tools that utilize
pre-existing NLP technology to analyze classic indices of syntactic complexity such as the
Syntactic Complexity Analyzer (Lu, 2010, 2011) and innovative indices of syntactic complexity
such as Coh-Metrix (Graesser et al., 2004; McNamara et al., 2014).
3.2.1 Biber Tagger
The original Biber Tagger was introduced in Biber (1988). This version tagged texts for
67 different linguistic features. Although not originally designed to measure syntactic
complexity, the depth and breadth of linguistic indices included makes it potentially appropriate
for such, as demonstrated by Biber et al. (2014). The Biber Tagger assigns tags in two stages
(Biber, 1988). The first stage involves dictionary-based tagging with hand-written

45
disambiguation rules. The second stage involves identifying particular structures of varying
complexity (e.g., that- verb complements and that- adjective clauses) based on the tags identified
in the first stage. A more recent version of the tagger includes tags for 131 linguistic features
(Biber et al., 2004), including a number of semantic features. A literature review did not uncover
a precise accuracy figure for the performance of the Biber Tagger, although Biber et al. (1988)
estimates it to be above 90%. The lack of reporting of performance accuracy is perhaps due to
Biber’s practice of hand-checking and correcting problematic tags, as described in a number of
his publications (e.g., Biber, 1988; Biber et al., 2004). See Chapter 2 for an in-depth discussion
of the relationship between syntactic indices measured by the Biber Tagger and L2 writing.
3.2.2 Syntactic Complexity Analyzer
(Lu, 2010, 2011) created the Syntactic Complexity Analyzer (SCA) in order to
automatically calculate 14 indices outlined in Wolfe-Quintero et al.'s (1998) review of syntactic
complexity indices employed in second language (L2) development studies. SCA uses the
Stanford Parser (Klein & Manning, 2003) to generate parse trees from target texts. It then uses a
number of Tregex (Levy & Andrew, 2006) pattern searches to count instances of eight structures
(e.g., clauses, dependent clauses, verb phrases, etc.). These counts, along with text word counts,
are then used to produce the 14 indices of syntactic complexity that SCA calculates (e.g., MLC,
MLTU). Due to the accuracy of the parser, the adequacy of Lu’s pattern matches, and the large-
grained patterns the SCA calculates, Lu (2010, 2011) reports high correlations between human
and SCA counts for all indices (ranging from r = .840 for dependent clauses per clause, to as
high as r = .976 for MLTU). See Chapter 2 for an in-depth discussion of the relationship
between syntactic indices measured by SCA and L2 writing.

46
3.2.3 Coh-Metrix
Coh-Metrix (Graesser et al., 2004; McNamara et al., 2014) is a text analysis tool designed
to measure cohesion. The online version of the tool includes 108 indices related to text difficulty,
cohesion, psycholinguistic word information, and syntactic complexity. Included are ten indices
related to syntactic complexity including the number of words before the main verb, the number
of modifiers per noun phrase, and incidence counts of eight particular syntactic features (e.g.,
noun phrases and gerunds). Syntactic indices in Coh-Metrix are derived from tag information
and parse trees generated by the Charniak parser (Charniak & Johnson, 2005; Charniak, 2000).
Coh-Metrix syntactic indices have been used to model L2 writing quality (e.g., Guo et al., 2013)
and longitudinal L2 growth (e.g., Crossley & McNamara, 2014). See Chapter 2 for a discussion
of the relationship between syntactic indices measured by Coh-Metrix and L2 writing.
3.3 Evaluating automatic syntactic complexity analysis tools
Evaluating automatic syntactic complexity analysis tools is not a simple endeavor; there
are a number of important characteristics that should be considered. This section discusses the
relative merits of three currently available tools on the basis of accuracy, range of indices,
availability, and portability.
3.3.1 Accuracy
Of particular import in any automatic linguistic analysis is the issue of accuracy. If one is
primarily concerned with counts of particular POS tags in well-edited texts such as newspaper or
magazine articles, we can assume that our counts will be very accurate (e.g., 96% or higher;
Brill, 1995; Toutanova et al., 2003). If our primary concern is constituency parses of similar
texts, we can assume that accuracy will be lower but still relatively high with similar texts (e.g.,
91.0%; Charniak & Johnson, 2005). More recent studies have demonstrated comparable

47
accuracies for some dependency parsers (e.g., between 85-89%; Cer et al., 2010; Chen &
Manning, 2014). While the parser accuracies cited thus far are helpful for providing general
comparisons between particular POS taggers and parsers, two caveats should be noted regarding
the usefulness of accuracy figures.
The first caveat is that syntactic complexity measures are not generally computed on
well-edited magazine and newspaper articles (though Biber’s work is an exception). Syntactic
complexity measures are generally calculated for largely unedited L1 and L2 developmental
texts (e.g., timed student essays), which may include features that are relatively infrequent in
well-edited, published texts. There is some evidence, however, that parsers work reasonably well
with student texts. Hempelmann, Rus, Graesser, & Mcnamara (2006), for example, compared the
performance (and speed) of four freely available constituency parsers on a selection of sentences
from the Penn Treebank (Marcus et al., 1993) and three L1 student texts (two from college and
one from the fifth grade). In this analysis, the Charniak (2000) parser was the most accurate
(88.69% average accuracy), followed by the Stanford Parser (83.42%) on the three student texts.
The second issue with published accuracy figures of POS taggers and syntactic parsers is
that, depending on the granularity of the syntactic complexity index, absolute parser accuracy
may not be particularly relevant. Most syntactic complexity indices are calculated using only a
few pieces of a parse. In the identification of verb phrases described earlier, for example, we
only need accurate identification of the main VP(s) in a sentence. As with parser accuracy for
student texts, very little has been published regarding the accuracy of particular measures of
syntactic complexity. The one study that provides systematic accuracy figures for indices of
syntactic complexity is (Lu, 2010). Lu reports correlations for the identification each structure of
interest in SCA between two human annotators and between the human annotators and SCA.

48
Despite using L2 texts and the Stanford Parser (which has been shown to be less accurate that the
Charniak parser), Lu’s SCA achieved very high accuracy scores, ranging from .830 for complex
nominals to .976 for T-units (sentences were identified with perfect accuracy). Such performance
information has not been made available for the Biber tagger (for reasons already discussed) or
for the specific syntactic complexity measures reported by Coh-Metrix, but we can expect that
these tools are accurate in light of Lu’s (2010) findings.
3.3.2 Range of indices
In order to systematically evaluate language development with regard to syntactic
complexity, it is important for an automatic tool to include a broad range of syntactic complexity
indices. These indices should include both clausal and phrasal attributes, as noted in the literature
(e.g., Biber et al., 2011; Ortega, 2003). Furthermore, syntactic complexity measures should be as
fine-grained as possible to allow for a systematic analysis of all syntactic changes that are
evident both longitudinally and cross-sectionally. The Biber Tagger comes the closest to meeting
this criterion because it includes a number of fine-grained indices. SCA includes fourteen
indices, nine of which provide analysis at the clausal and/or sentence level. The remaining five
provide analysis as the phrase level. Coh-Metrix also provides 10 relevant indices of syntactic
complexity (some of which are fine-grained), though these also do not represent the full range of
syntactic structures.
3.3.3 Availability
In order to allow for replication, an ideal syntactic complexity tool would be widely
available. The online version of Coh-Metrix is freely available via www.cohmetrix.com. Users
need only to register their email address on the site in order to use it. While the online format
allows for users to access the tool from virtually any operating system, it is limited with regard to

49
its functionality. Texts have to be uploaded to the Coh-Metrix website one at a time, practically
limiting the number of texts that can be processed. SCA is freely available and works on any
system equipped with the Python programming language and Java. Both Python and Java are
available on the three most popular operating systems (Mac OSX, Windows, and Linux Ubuntu)
allowing for near universal use. SCA also allows for batch processing. However, some
knowledge of Python is necessary in order to operate SCA, limiting its appeal. In contrast, the
Biber Tagger is not widely available. It was created and has been maintained by Doug Biber for
his own research. Biber is willing to process texts for interested parties (Friginal & Weigle,
2014), but one must wait for his research team to do so.
3.3.4 Portability
Portability is related to the issue of availability. This discussion of portability, however,
will focus on the potential for a particular tool to be use on a wide variety of computer systems.
One of the reasons the Biber tagger has not been widely released is that the programming
language it was written in is no longer being developed/supported (Friginal, 2014). The Charniak
parser, which Coh-Metrix uses, is restricted to use on a Windows operating system. The Stanford
Parser is written in Java, a computer language that is currently used on all major operating
systems.
3.3.5 Summary of the characteristics of extant syntactic complexity tools
Although three tools exist that automatically measure syntactic complexity, none of them
meet all of the criteria for an ideal tool. Table 3.2 summarizes the relative strengths and
weaknesses of each tool.

50
Table 3.2 Overview of current automatic analysis of syntactic complexity tools Tool Accuracy Range of indices Availability Portability
Biber Tagger
Reported to be high, but exact figures are unknown
Large range of fine-grained indices
Not Widely Available. Researchers can request for texts to be processed.
Not Portable. Currently implemented in an obsolete programming language
Coh-Metrix
Not directly reported, but uses highly accurate parser
Some large and fine-grained indices, but relatively sparse coverage
Available online, but no batch processing.
Not portable as a desktop tool. Uses Charniak Parser.
SCA Very High
Some fine-grained and large-grained indices. Relatively sparse coverage
Widely available and allows for batch processing.
Very Portable. Utilizes Python and Java
3.4 Tool for the Automatic Analysis of Syntactic Sophistication and Complexity
TAASSC was designed to measure a broad range of fine-grained indices of syntactic
sophistication and complexity in student writing. It is freely available for research and
educational purposes, is accessed through an easy to use graphical user interface (see Figure 3.3),
works on Windows, Mac, and Linux operating systems, allows for batch processing, and is
stored on the user’s hard-drive (allowing one to process sensitive data). TAASSC takes plain text
files as input and provides a comma-separated values (.csv) file, which can be opened by any
spreadsheet software, as output.

51
Figure 3.3 The TAASSC GUI
TAASSC includes four groups of indices that can be categorized based on the type of
parser used in their operationalization. The first group comprises SCA indices. SCA employs the
Stanford Parser (Klein & Manning, 2003) and Tregex (Levy & Andrew, 2006) to count
structures. The Stanford Parser creates a constituency representation of each sentence in a text,
and Tregex is used to find particular patterns in that representation.
The final three groups of indices employ the Stanford Neural Network Dependency
Parser (version 3.5.1; Chen & Manning, 2014) and a Python XML parser to count structures.
These groups include indices related to fine-grained clausal complexity, fine grained phrasal
complexity, and syntactic sophistication, respectively. The Stanford Neural Network
Dependency parser combines state of the art accuracy and processing speed. This parser provides
a dependency representation of each sentence, which includes a number of functional categories

52
such as subject and direct object (in addition to a number of other structures). The output of the
parser is in XML format, and an XML parser in Python is used to read the file. A description of
each group of indices is included below.
3.4.1 Syntactic Complexity Analyzer
Lu’s (2010) SCA includes 14 indices of syntactic complexity drawn from Wolfe-
Quintero et al. (1998) and Ortega (2003) inter alia. A discussion of each of these indices,
including their benefits, drawbacks, and performance is included in Chapter 2. Table 3.3 includes
a description of each of the structures counted by SCA, and Table 3.4 comprises a list of the 14
SCA indices including a short description of each. For further information, refer to Chapter 2 and
Lu (2010, 2011).

53
Table 3.3 A description of syntactic structures counted by SCA Structure Description Examples
word a sequence of letters that are bounded by white space
I ate
verb phrase a finite or non-finite verb phrase that is dominated by a clause marker
ate pizza was hungry
complex nominal
i. nouns with modifiers ii. nominal clauses iii. gerunds and infinitives that function as subjects
i. red car ii. I know that she is hungry iii. Running is invigorating
coordinate phrase adjective, adverb, noun and verb phrases connected by a coordinating conjunction
She eats pizza and smiles
clause a syntactic structure with a subject and a finite verb
I ate pizza because I was hungry
dependent clause a finite clause that is a nominal, adverbial, or adjective clause I ate pizza because I was hungry
T-unit an independent clause and any clauses dependent on it
I ate pizza I ate pizza because I was hungry
complex T-unit a T-unit that includes a dependent clause I ate pizza because I was hungry
sentence a group of words bounded by sentence-ending punctuation (., ?, !, ”, …)
I went running today.
Note. Adapted from Lu (2010 pp. 7-13)

54
Table 3.4 A description of SCA Variables Index Abbreviation
Index Name Index Description
MLS mean length of sentence number of words per sentence MLT mean length of T-unit number of words per T-unit MLC mean length of clause number of words per clause C/S clauses per sentence number of clauses per sentence VP/T verb phrases per T-unit number of verb phrases per sentence C/T clauses per T-unit number of clauses per T-unit DC/C dependent clauses per clause number of dependent clauses per clause DC/T dependent clauses per T-unit number of dependent clauses per T-unit T/S T-units per sentence number of T-units per sentence
CT/T complex T-unit ratio number of complex T-units divided by T-units
CP/T coordinate phrases per T-unit number of coordinate phrases per T-unit CP/C coordinate phrases per clause number of coordinate phrases per clause CN/T complex nominals per T-unit number of complex nominals per T-unit CN/C complex nominals per clause number of complex nominals per clause
3.4.2 Fine-grained clausal complexity
TAASSC includes 31 fine-grained indices of clausal complexity. 29 indices calculate the
average number of particular structures per clause. The fine-grained clausal indices included in
TAASSC differ from the clausal indices (i.e., MLC, DC/C, CP/C and CN/C) included in SCA in
three main ways. First, TAASSC counts the length of clauses as the number of direct dependents
per clause instead of the number of words. This prevents structures that inherently include more
words (e.g., prepositional phrases) to be given more weight those that do not (e.g., adjectives).
Second, instead of grouping structures (such as dependent clauses or complex nominals)
together, TAASSC counts each type separately. Finally, both finite and non-finite clauses are
considered clauses by TAASSC.
TAASSC also includes two more general indices of clausal complexity. These indices
take into account the total number of dependents per clause. The first index represents the
average number of dependents per clause, while the second represents the standard deviation of

55
the number of dependents per clause, which provides a measure of syntactic variation. Table 3.5
comprises a description of each of the fine-grained indices of clausal complexity in TAASSC.
Table 3.5 Clausal dependent types analyzed by TAASSC Structure Abbreviation Example of Structure adjective complement acomp She [looks]gov [beautiful]acomp adverbial clause advcl The accident [happened]gov [as night fell]advcl adverbial modifier advmod [Accordingly]advmod, I [ate]gov pizza. auxilliary verb aux He[is]aux [running]gov bare noun phrase temporal modifier tmod Last [night]tmod, I [swam]gov in the pool
clausal complement ccomp I am [certain]gov [that he did it]ccomp clausal coordination cc [Jill runs]gov and [Jack jumps]cc negation neg He did [not]neg [kill]gov them. clausal prepositional complement pcomp They heard [about]gov [you missing classes]pcomp
clausal subject csubj [What she said]csubj [is]gov not true conjunction conj He [runs]gov and [jumps]conj controlling subject xsubj [Tom]xsubj likes to [eat]gov fish direct object dobj She [gave]gov me a [raise]dobj discourse marker discourse [Well]discourse, I [like]gov pizza existential "there" expl [There]expl [is]gov a ghost in the room. indirect object iobj She [gave]gov [me]iobj a raise
parataxis parataxis The guy, John [said]parataxis, [left]gov early in the morning.
modal auxilliary modal He [may]modal [be]gov awesome. nominal complement ncomp He [is]gov a [teacher]ncomp nominal subject nsubj The [baby]nsubj [is]gov cute open clausal complement xcomp I am [ready]gov [to leave]xcomp agent agent The man has been [killed]gov by the [police]agent passive auxilliary verb auxpass Kennedy has [been]auxpass [killed]gov
passive clausal subject csubjpass [That she lied]csubjpass was [suspected]gov by everyone
passive nominal subject nsubjpass [Dole]nsubjpass was defeatedgov by Clinton phrasal verb particle prt They [shut]gov [down]prt the station prepositional modifier prep_ They [went]gov [into the store]prep_into
subordinating conjunction mark Forces engaged in fighting [after]mark insurgents [attacked]gov
undefined dependent dep N/A Note. “gov” represents the governor of the dependent; *prepositional modifier representations include the actual preposition

56
3.4.3 Fine-grained phrasal complexity
TAASSC includes phrasal indices for seven noun phrase types and ten phrasal dependent
types (see Table 3.6 for an overview of these structures). Three types of phrasal indices are
included in TAASSC. The first type calculates the average number of dependents per each
phrase type (e.g., nominal subjects) and for all phrase types. The second type calculates the
occurrence of particular dependent types (e.g., adjective modifiers) regardless of the type of
noun-phrase they occur in. The final phrasal index type calculates the average occurrence of
particular dependent types in particular types of noun phrases (e.g., adjective modifiers occurring
in nominal subjects).

57
Table 3.6 Phrase types and dependent types analyzed by TAASSC Structure Abbreviation Example of structure Phrase types
nominal subject nsubj [The man in the red hat]nsubj gave the tall man the money.
passive nominal subject nsubj_pass [The tall man]nsubj_pass was given money by the man in
the red hat
agent agent The tall man was given money by [the man in the red hat]agent
nominal complement ncomp He is [a tall man]ncomp direct object dobj The man in the red hat gave the tall man [the money]dobj. indirect object iobj The man in the red hat gave [the tall man]iobj the money prepositional object pobj The man in [the red hat]pobj gave the tall man the money Dependent types
determiners det [The]det man in [the]det red hat gave [the]det tall man [the]det money
adjective modifiers amod The man in the [red]amod hat gave the [tall]amod man the money
prepositional phrases prep The man [in the red hat]prep gave the tall man the money possessives poss That is [her]poss red car verbal modifiers vmod I don’t have anything [to say]vmod to you nouns as modifiers nn [Oil]nn prices are rising relative clause modifiers rcmod I saw the man [you love]rcmod
adverbial modifiers advmod We will drive the red car [tomorrow]advmod conjunction “and” conj_and Jack [and]conj_and Jill conjunction “or” conj_or Jack [or]conj_or Jill
3.4.3.1 Treatment of pronouns
Noun phrases in English can consist of pronouns, and except in very rare cases, pronouns
do not take direct dependents (relative clauses being an exception). Due to the potential for
pronouns as phrases to skew counts of dependents, TAASSC includes two versions of each
index, one that includes pronoun noun phrases in its counts, and one that does not.
3.4.3.2 Basic index calculation
Basic TAASSC phrasal indices represent the average number of phrasal dependents per
phrase type (e.g., the average number of dependents per nominal subject). The sentence The man

58
in the red hat gave the tall man the money, for example, includes four nominal phrases, which
are a nominal subject, a prepositional object, an indirect object, and a direct object. Together,
these four nominal phrases include three determiners, two adjective modifiers, and one
prepositional phrase for a total of six phrasal dependents. The average number of adjective
modifier dependents per nominal is .5 (2/4).
3.4.3.3 Standard deviations
For the largest-grained indices, standard deviations are also calculated. In a normal
distribution of data, standard deviations indicate how far from the mean values must be to
include 68.2% of the data. While a mean value indicates central tendencies in a dataset, standard
deviations indicate how well the mean represents the data. Standard deviations are potentially
useful in syntactic analysis because they can be used to measure variation.
Overall, TAASSC includes 132 indices of phrasal complexity (and variation). See Table
3.7 for an overview of the phrasal indices.
Table 3.7 An overview of the phrasal indices included in TAASSC
Index Type Average Standard Deviation Total pronouns no pronouns pronouns no pronouns
Number of Dependents per Nominal 8 8 8 8 32
Occurrence of particular dependents 10 10 20
Occurrence of particular dependents per particular nominal
40 40 80
Total 116 16 132
3.4.4 Syntactic sophistication
Indices of syntactic sophistication are grounded in usage-based theories of language
acquisition (Ellis, 2002a; Goldberg, 1995; Langacker, 1987). An in-depth treatment of usage-

59
based perspectives to language development can be found in Chapter 2. This section first
describes the reference corpus used, and then describes each index type. TAASSC calculates 15
basic indices of syntactic sophistication. Each basic index includes a number of variations (these
are described below), which result in 38 separate indices. Each index is calculated in reference to
five subcorpora in COCA (all written, academic, fiction, magazine, & newspaper), resulting in
190 total indices of syntactic sophistication.
3.4.4.1 Corpus
Much previous work on VACs has used the British National Corpus (BNC) as a reference
corpus (e.g., O’Donnell & Ellis, 2010; Römer et al., 2015). The BNC has a number of
advantages as a proxy for language experiences, mostly due to its careful design as a large,
balanced, and representative corpus of British English. Adding to its allure is the fact that tagged
and dependency parsed versions of the corpus have existed for some time (e.g., Andersen,
Nioche, Briscoe, & Carroll, 2008), which aid in the identification of VACs (e.g., O’Donnell &
Ellis, 2010). Another large reference corpus is the Corpus of Contemporary American English
(COCA; Davies, 2009, 2010). COCA is a balanced corpus of American English that includes
texts from works of fiction, popular magazines, newspapers, and academic journals.
Additionally, it includes a spoken section comprised of television transcripts. COCA is larger
(approximately 450 million words) than the BNC (100 million words) and includes more
recently published texts (1990-2012 as opposed to the most recent BNC texts, which were
published in 1993). Furthermore, COCA is likely a more appropriate proxy for language use in
the primary context of this project (the USA). For these reasons, COCA was chosen as the
reference corpus for the current project.

60
Verb argument constructions in TAASSC are defined as a main verb and all direct
dependents that verb takes. In the sentence John ran quickly the main verb is ran, which takes
two direct dependents John and quickly. John is the subject of the verb ran, and quickly is an
adverb that modifies ran. The clause John ran quickly can be represented by the VAC nominal
subject – verb – adverb modifier. TAASSC sophistication indices consider the reference-corpus
frequency of the lemma form of the main verb (e.g., run), the frequency of the VAC, and the
frequency with which they occur together. TAASSC also includes indices that calculate the
strength of association between main verb lemmas and the VACs they occur in (i.e., faith, delta
P, and collostruction strength). Each index type is described in the following sections.
3.4.4.2 Frequency
Frequency indices are calculated for main verb lemmas (see Table 3.8 for the top ten
verbs), VACs (see Table 3.9 for the top ten VACs), and main verb lemma – VAC combinations
(see Table 3.10 for the top ten combinations). Frequency indices comprise the average frequency
score of the target structures (e.g, a VAC) in a particular text. If a particular target structure (e.g.,
a VAC) that occurs in a text does not occur in the reference corpus, it is not counted toward the
index score. These indices measure how frequent the linguistic structures in a text are in
reference to their use in COCA.

61
Table 3.8 Main verb lemma frequencies in the the written section of COCA Rank Frequency (per million) Main Verb Lemma
1 160,994.48 be 2 35,711.92 say 3 30,182.42 have 4 15,366.25 make 5 15,229.85 do 6 14,840.33 go 7 13,306.69 get 8 11,900.44 see 9 11,644.46 take 10 11,608.18 know
Table 3.9 Verb argument construction frequencies in COCA
Rank Frequency (per million) Verb Argument Construction Most Frequent Main
Verb Lemma 1 64,733.43 verb – direct object make 2 48,780.10 subject – verb – direct object have 3 34,540.26 subject – verb – nominal complement be 4 33,315.86 subject – verb – adjective complement be 5 21,321.88 subject – verb say 6 20,297.22 subject – verb – clausal complement say 7 15,960.63 subject – verb – external complement have 8 11,788.37 verb – clausal complement say 9 11,117.08 verb base 10 9,879.52 subordinator – subject – verb – direct object have

62
Table 3.10 Most common verb argument construction-main verb lemma combinations in COCA Rank Frequency
(per million) Main Verb Lemma
Verb Argument Construction Example (register)
1 34,517.41 be subject – verb – nominal complement It is also an indication of the ways… (academic) 2 33,287.74 be subject – verb – adjective complement They are very discerning… (news)
3 6,843.83 be subordinator - subject – verb – adjective complement She hears that he is arrogant. (news)
4 6,318.98 say clausal complement – subject – verb [“Andy is an amalgamation of all the douchebags that I 've dealt with in my life”], Helms says . (magazine)
5 5,335.93 have subject – verb – direct object Iran has obvious interests in Iraq. (magazine) 6 5,124.34 be verb – nominal complement That’s what’s great about being a teen. (news)
7 4,986.51 be subordinator - subject – verb – nominal complement
Even before the man reached the car, she knew that it was Frank. (fiction)
8 4,258.04 be verb – adjective complement This is the reason I have found life to be harder than fiction… (fiction)
9 3,865.16 say subject – verb – clausal complement He said [that health decisions should be made by patients and doctors] (magazine)
10 3,516.17 say clausal complement – verb – subject [“We have an all-new situation now”], says Europol's Storbeck (magazine)

63
3.4.4.3 Type-token ratio
Type-token ratios (TTR) are also calculated for main verb lemmas, VACs, and main-verb
lemma – VAC combinations. A token count includes the total number of instances of a particular
structure in a text (e.g., the total number of VACs in a text). A type count includes the total
number of unique instances of a particular structure (e.g., the total number of unique VACs in a
text). Type-token ratios are calculated by dividing the number of types by the total number of
tokens. In TAASSC, any target structures (e.g., a VAC) that do not occur in the reference corpus
are not counted towards the index score. These indices measure the diversity of structures used in
a text.
3.4.4.4 Attested items
Indices are also calculated that comprise the percentage of main-verb lemmas, VACs and
main-verb lemma – VAC combinations – that occur in a target text occur in the reference corpus.
These indices comprise a rough measure of frequency.
3.4.4.5 Association strength
Strength of association indices measure the conditional probability that two items (in this
case a main-verb lemma and a VAC) will occur together. Strength of association has been
suggested to supplement (or even be a more appropriate replacement for) frequency in predicting
prototypicality and acquisition (Ellis & Ferreira-Junior, 2009a, 2009b). TAASSC calculates three
types of association strength measures2 following previous research including faith (Gries et al.,
2 Verb-VAC association strength norms in TAASSC do not include copular constructions (which are very strongly associated with the verb to be) to avoid skewing mean association strength scores.

64
2005), delta P (Ellis & Ferreira-Junior, 2009b), and collostructional strength (Stefanowitsch &
Gries, 2003). A 2x2 contingency table is used to calculate the indices of association strength. The
contingency table that comprises Table 3.11 will be used in the description of each index below.
Table 3.11 Contingency table used to calculate various indices of association strength Construction C
(nsubj-v-dobj) Not Construction C (not nsubj-v-dobj)
Totals
Verb V (have)
a (212,970)
b (991,685)
a + b = frequency of V (1,204,655)
Not Verb V (not have) c
(1,733,964) d
(30,909,494)
c + d = combinations that are not V + C (32,643,458)
Totals a + c
(1,946,934) frequency of C
b + d (37,965,533)
(a+b) + (c + d) = N (total number of VAC tokens in the corpus) = (33,635,143)
Note. adapted from Gries et al., 2005
3.4.4.5.1 Faith
Faith calculates the conditional probability that a particular item X will occur given a
particular situation Y. Faith values range from 0.0 to 1.0. Higher faith values indicate a higher
conditional probability of an outcome given a cue. For our purposes, faith can either be
calculated from the perspective of the verb or the construction. For example, we can calculate the
probability that a particular VAC X will occur given verb Y (i.e., P(construction|verb), which is
calculated as: !
!"# (Gries et al., 2005). The conditional probability that the transitive (SVO)
construction will be the outcome given the main verb have is $%$,'()
$%$,'()"''%,+,-= .177, indicating
that there is a 17.7% chance that the SVO will occur given the main verb have. For comparison,
the conditional probability that the SVO will occur given the main verb bisect is .218, indicating
that there is a 21.8% chance the the SVO construction will be cued by the main verb bisect. This
suggests that have is less faithful to SVO than bisect.

65
We can also calculate the probability that a particular VAC X will occur given a
particular verb Y (i.e., P(verb|construction), which is calculated as: ( !
!"4)). The conditional
probability that the outcome will be the main verb have given an SVO construction is calculated
$%$,'()
$%$,'()"%,((6,'+7= .109. This indicates that there is a 10.9% chance that, given the SVO
construction, the verb will be have. Conversely, the probability that the main verb will be bisect
given the SVO construction is much smaller (0.00003), suggesting that the SVO is much more
faithful to have than bisect.
3.4.4.5.2 Delta P
Ellis & Ferreira-Junior (2009a, 2009b) utilize the directional probability measure delta P
to calculate the strength between a verb and a construction (or vise-versa). Delta P is calculated
via the following formula: delta P = P(O|C) – P(O|-C), that is, delta P is the probability of an
outcome given a cue minus the probability of an outcome without the cue. With reference to
Table 3.11, we can calculate delta P with constructions as the outcomes and verbs as the cue via:
:
:";– =
=">. To calculate delta P with verbs as the outcomes and constructions as the cue we
would simply calculate: !
!"4– #
#"?. Delta P values range from -1.0 to 1.0. Positive delta P
values indicate that an outcome is more likely to occur given a particular cue than it is without
the cue.
The delta P value for the outcome of the SVO given the cue have is calculated
$%$,'()
$%$,'()"''%,+,-= .177 – %,(66,'+7
%,(66,'+7"6),')',7'7= .053 = .124. The probability of the
outcome SVO given the cue have (.177) is larger than the probability that the SVO will be the
outcome given another verb cue (.053), resulting in a positive delta P value (.124). The delta P
values for SVO as the outcome given bisect as the cue is .159, which suggests that bisect is more

66
strongly associated with the SVO than have. Delta P values for have as the outcome given an
SVO cue is .069. This value is higher than the delta P value for bisect as the outcome give an
SVO cue (.00002), which suggests that have is more strongly associated with the SVO than
bisect is.
3.4.4.5.3 Collostructional Analysis
One potential issue with indices such as faith and ΔP is the difference in the strength of
association of a particular verb-construction combination depending on the perspective (i.e. verb
to construction or construction to verb). From a verb to construction perspective, bisect is
strongly related to the SVO construction, but from a construction to verb perspective, bisect the
relationship is quite weak. One alternative association strength measure that addresses this issue
is collexeme/collostructional analysis. Collexeme analysis (Stefanowitsch & Gries, 2003)
measures the joint probability (i.e., it is not directional) that two items in a corpus will co-occur.
When collexeme analysis is used to measure the strength of verb-construction combinations, it is
termed collostructional analysis (Gries et al., 2005). With reference to the applicable data in
Table 3.11, collostructional analysis calculates the likelihood that a verb-construction
combination will occur using the Fisher-Yates exact test (Fisher, 1934; Yates, 1934), which is
calculated as: pobserved distribution = DEFD
∗ HEIH
JDEH
+ Σ pall more extreme distributions. Gries et al. (2005) used
the negative base of ten logarithm of the p value to rank-order the strength of association
between verbs and constructions. Gries et al. (2005) argue that collostructional analysis is
superior to verb occupancy frequency counts and faith figures for three reasons beyond the issue
of directionality.

67
First, collostructional analysis takes into account both the verb and the construction’s
overall frequencies. This is important because it controls for the issue of a particular verb having
a high occupancy frequency based on the overall high frequency of that verb (i.e., a high
frequency verb is going to have a higher probability of being highly frequent in a construction
than a low frequency verb). Furthermore, it controls for the tendency for low frequency verbs to
have very high faithfulness values. The verb bisect, for example, has a 21.8% chance of
occurring in the SVO construction, suggesting that (from the perspective of the verb) the bisect -
SVO combination is highly prototypical, despite the fact that bisect only occurs in COCA 64
times (and therefore is probably not actually a prototype verb for the SVO construction). Second,
in addition to calculating fine-grained joint probabilities, collostructional analysis also provides
large grained information by identifying verbs and constructions that are “attracted”, “repelled”,
or have a “neutral” strength of association. Finally, it allows for testing the (statistical)
significance of the verb occupancy in a construction. A number of indices can be calculated for a
text to determine how prototypical the particular verb/construction combinations are using
information from collostructional analysis. The strength of collostructional analysis, its use of
Fisher’s exact test, is also its Achilles’ heel. Fisher’s exact test is very slow when dealing with
high frequency items, and most programs that calculate the test end up rounding the values to
either “-1” or “1” (the logarithm of which is negative infinity and infinity, respectively). One
solution to this issue is to calculate the approximate collostructional strength by multiplying the
delta P value (construction as cue, verb as outcome) by the frequency of the verb, which
correlates almost perfectly with collostructional strength (Gries, 2015). TAASSC uses this
method, which is represented by the following formula: MNNOPQRSMTUVPWWUQUSUXTOUYZTℎ =
!
!"#– 4
4"?∗ M + \ . Collostructional analysis suggests that have and SVO are strongly

68
attracted, while bisect and SVO are weakly attracted. See Table 3.12 for a comparison of the
most frequent and most strongly attracted SVO-verb combinations.
Table 3.12 Strongly attracted SVO – Verb combinations in academic COCA Main Verb Lemma Frequency Rank Approximate Collexeme
Strength Rank have 1 1 make 2 2 get 3 3 do 4 6 see 5 4 take 6 5 include 7 8 find 8 7 know 9 4498 say 10 4512 provide 11 9 tell 12 12 need 13 10 show 14 11 love 15 14 use 16 4507 give 17 4495 call 18 32 want 19 4504 hear 20 13
3.4.4.6 Variations
TAASSC calculates three variations for a number of the basic association strength indices
(i.e., logarithm transformation, type-only, and standard deviations). Logarithm-transformed
versions of the frequency indices are calculated. Logarithm transformation is often used in
frequency research to account for the Zipfian nature of language data (Zipf, 1935). Type-only
versions of all indices (except TTR) are calculated. Type-only indices are calculated by only
counting each unique structure (e.g., a particular VAC) toward the index value once. For
example, if a particular text included three instances of the nominal subject – verb – direct object

69
VAC and two instances of the nominal subject – verb – adjective complement VAC, a type-only
index would be calculated using only one instance of each. Finally, the standard deviation of
each index (except TTR) is calculated. In contrast to the mean or average value for a particular
index (e.g., main-verb lemma frequency), which demonstrates a central tendency, standard
deviation indices provide a measure of variability. See Table 3.13 for an overview of the
syntactic sophistication indices calculated by TAASSC.
Table 3.13 An overview of the syntactic sophistication indices calculated in TAASSC for each subcorpus
Main Verb Lemma VAC Combinations Total
Mean
or Ratio
Standard Deviation
Mean or
Ratio
Standard Deviation
Mean or
Ratio
Standard Deviation
Frequency 1 1 1 1 1 1 6 Logarithm 1 1 1 1 1 1 6 Types 1 1 1 3 TTR 1 1 1 3 Attested 1 1 1 3 Association Strength 6 5 11
Types 6 6 Total 5 2 5 2 17 7 38
3.4.5 Principal component analysis
One strength of TAASSC is the flexibility afforded by the wide range of indices
calculated. For some tasks, however, the sheer number of indices may be both overwhelming for
the research and/or statistically inappropriate. One method that can be used to reduce a large
group of indices into a smaller set of indices (i.e., components) is principal components analysis
(PCA) (e.g., Crossley, Kyle, & Mcnamara, 2015; Graesser, McNamara, & Kulikowich, 2011). A
PCA clusters indices into groups that co-occur frequently within a particular dataset allowing for
a large number of variables to be reduced into a smaller set of derived variables (i.e., the

70
components). PCA has been used in a number of applications, including (but not limited to)
exploring register variation (Biber, 1988), modeling holistic scores of essay quality (Crossley,
Kyle, & Mcnamara, 2015; Friginal & Weigle, 2014), and modelling linguistic development in K-
12 education (Graesser et al., 2011).
3.4.5.1 Method
Following these studies, and particularly to allow for a wide range of statistical analyses to be
conducted using the breadth of indices afforded by TAASSC, a principal components analysis
(PCA) was conducted in order to reduce the number of indices in TAASSC to a smaller number
of components comprised of related indices. A preliminary correlational analysis suggested that
the indices of syntactic sophistication were closely related across the COCA registers. For this
reason, the 38 indices derived from the combined COCA written registers represented the indices
of syntactic sophistication (that is, the indices that represented each separate register were
precluded from the analysis because they were strongly correlated with the their respective
parallel combined corpus indices). In addition to the 38 indices of syntactic sophistication, the 31
indices of fine-grained clausal complexity and the 132 fine-grained indices of phrasal complexity
(a total of 201 indices) were used in the PCA. The 201 TAASSC indices were used in
conjunction with a stratified random sample of COCA written texts comprised of 10,000 texts
(2,500 from each register) to conduct the PCA. Any indices with non-normal distributions were
removed from further consideration. The multicollinearity threshold was set at r = .900 to ensure
that variables included in the analysis did not measure the same construct. A conservative eigen
cut-off value (.35) was set following Crossley, Kyle, & McNamara (2015) to ensure that only
related variables would be included in each component. A Varimax rotation was used to create
orthogonal components (e.g., Graesser et al., 2011), which ensures that a set of non-collinear

71
components are created. After conducting the PCA, the eigen values were then used in the
components to calculate weighted component scores.
3.4.5.2 Results
In total, 201 TAASSC indices related to syntactic complexity sophistication were
considered in the PCA. Of the 201 indices, 68 were non-normally distributed. Of the 131
normally distributed indices, 52 were removed due to multicollinearity. The remaining 79
normally distributed and non-collinear indices were entered into the PCA. The PCA reported 23
components with initial eigenvalues over 1. Within the Varimax rotated components, there was a
break in the cumulative variance explained between the ninth and tenth component, suggesting
that the first nine components explained the largest amount of the variance. These nine
components, which are comprised of 60 TAASSC indices, explained approximately 56% of the
shared variance in the data for the rotated components. Considering this break, a 9-component
solution was selected. Each of these components and the indices that inform them are discussed
below.
3.4.5.2.1 Component 1: Noun phrase elaboration
The first component seemed to capture noun phrase elaboration. This component includes
19 indices that mostly capture noun phrase elaboration in general, and prepositions, adjectives,
determiners, and verbal modifiers of nominals specifically. A text that earned a high score for
this component would include noun phrases with a higher degree of elaboration. The indices
included in the noun phrase elaboration component and their Eigen loadings are provided in
Table 3.14.

72
Table 3.14 Component 1: Noun phrase elaboration Variable Name Eigen Loading prepositions per nominal 0.916 dependents per object of the preposition 0.874 prepositions per object of the preposition 0.778 prepositions per direct object 0.777 prepositions per nominal subject 0.765 adjectival modifiers per nominal 0.752 dependents per nominal 0.722 dependents per nominal subject 0.658 adjectival modifiers per nominal subject 0.649 adjectival modifiers per object of the preposition 0.637 adjectival modifiers per direct object 0.627 determiners per nominal subject 0.614 passive nominal subjects per clause 0.590 dependents per direct object (no pronouns) 0.553 dependents per object of the preposition (no pronouns) 0.548 prepositions per clause 0.543 verbal modifiers per nominal 0.516 nominal subjects per clause -0.468 dependents per nominal complement 0.405
3.4.5.2.2 Component 2: Verb-VAC frequency
The second component seemed to capture verb-VAC frequency. This component
captures verb and verb – VAC frequency. A text that earns a high score for this component will
tend to include more frequent main verb lemmas and main verb lemma – VAC combinations.
Accordingly, it may also include more adjective complements and nominal complements (i.e.,
copular constructions), which tend to occur frequently. The indices included in the verb-VAC
frequency component and their Eigen loadings are provided in Table 3.15.

73
Table 3.15 Component 2: Verb-VAC frequency Variable Name Eigen Loading average lemma construction combination frequency - all 0.908 average lemma frequency - all 0.908 average lemma construction combination frequency, log transformed - all (standard deviation) 0.852
average lemma frequency, log transformed – all (standard deviation) 0.850 average lemma construction combination frequency, log transformed - all 0.728 nominal complements per clause 0.728 average lemma frequency (types only) - all 0.706 adjective complements per clause 0.560
3.4.5.2.3 Component 3: Nouns as modifiers and modifier variation
The third component seemed to capture nouns as modifiers and modifier variation. This
component captures the use of nouns as nominal modifiers in general and specifically direct
object and nominal subject modifiers. Additionally, this component captures variation in the
number of modifiers per nominal, both for nominals in general and specifically for prepositional
objects, direct objects, and nominal subjects. A text that earned a high score for this component
would include a higher number of nouns as modifiers and have a wider variation in the number
of dependents per nominal. The indices included in the nouns as modifiers and modifier variation
component and their Eigen loadings are provided in Table 3.16.
Table 3.16 Component 3: Nouns as modifiers and modifier variation Variable Name Eigen Loading nouns as a nominal dependent per nominal 0.810 nouns as a direct object dependent per direct object 0.797 dependents per nominal (standard deviation) 0.789 nouns as a nominal subject dependent per nominal subject (no pronouns) 0.727 dependents per object of the preposition (standard deviation) 0.667 dependents per direct object (standard deviation) 0.586 dependents per nominal subject (standard deviation) 0.576

74
3.4.5.2.4 Component 4: Determiners
The fourth component seemed to capture determiner use. This component captures the
use of determiners in noun phrases in general, and in objects of the preposition, direct objects,
and nominal subjects in particular. A text that earned a high score for this component would
include a higher number of determiners such as the, a, an, this, these, etc. The indices included in
the determiners component and their Eigen loadings are provided in Table 3.17.
Table 3.17 Component 4: Determiners Variable Name Eigen Loading determiners per nominal (no pronouns) 0.947 determiners per nominal 0.849 determiners per object of the preposition 0.819 determiners per direct object 0.719 determiners per nominal subject (no pronouns) 0.630
3.4.5.2.5 Component 5: VAC frequency and direct objects
The fifth component seemed to capture VAC frequency and direct object use. This
component captures the frequency of VACs, the incidence of direct objects, and the incidence of
direct object dependents. A text that earned a high score on this component would include more
frequent VACs, and would include more direct objects per clause and more dependents per direct
object. The indices included in the VAC frequency and direct objects component and their Eigen
loadings are provided in Table 3.18.
Table 3.18 Component 5: VAC frequency and direct objects Variable Name Eigen Loading average construction frequency - all 0.884 average construction frequency (types only) - all 0.867 average construction frequency, log transformed - all 0.710 direct objects per clause 0.490 dependents per direct object 0.445

75
3.4.5.2.6 Component 6: Association strength
The sixth component seemed to capture verb-VAC association strength. This component
captures main verb lemma – VAC association strength. A text that earns a high score for this
component will include main verb lemma – VAC combinations that are strongly associated.
Additionally, a text that earns a high score for this component may also include more clausal
complements per clause, suggesting a link between the strength of main verb lemma – VAC
associations and the use of clausal complements. The indices included in the Association
strength component and their Eigen loadings are provided in Table 3.19.
Table 3.19 Component 6: Association Strength Variable Name Eigen Loading average approximate collostructional strength - all 0.924 average approximate collostructional strength (types only) - all 0.894 average delta p score construction (cue) - verb (outcome) (types only) - all 0.825 clausal complements per clause 0.629
3.4.5.2.7 Component 7: Diversity and frequency
The seventh component seemed to capture diversity and frequency. This component
captures diversity of verb argument constructions (VACs), main verb lemmas, and main verb
lemma – VAC combinations. It also captures main verb lemma – VAC frequency. A text that
earns a high score for this component will have high diversity of VACs, verbs, and verb – VAC
combinations, and on average will also include more frequent verb – VAC combinations. The
indices included in the diversity and frequency component and their Eigen loadings are provided
in Table 3.20.

76
Table 3.20 Component 7: Diversity and frequency Variable Name Eigen Loading construction type-token ratio - all 0.926 main verb lemma type-token ratio - all 0.872 lemma construction combination type-token ratio - all 0.792 average lemma construction frequency (types only) - all 0.655
3.4.5.2.8 Component 8: Possessives
The eighth component seemed to capture possessives. This component captures the use
of possessives in general, and specifically captures the use of possessives in nominal subjects,
direct objects, and prepositional objects. A text that earned a high score on this component would
include a high number of possessives, such as my, his, her, their, etc. The indices included in the
possessives component and their Eigen loadings are provided in Table 3.21.
Table 3.21 Component 8: Possessives Variable Name Eigen Loading possessives per nominal 0.904 possessives per nominal subject 0.734 possessives per direct object 0.718 possessives per object of the preposition 0.711
3.4.5.2.9 Component 9: Frequency
The ninth component seemed to capture frequency. This component captures VAC, main
verb lemma, and main verb lemma – VAC combination frequency. A text that earned a high
score for this component would include a higher percentage of VACs and main verb lemma –
VAC combinations that are attested in the written section of COCA. Additionally, a text that
earned a high score for this component would on average include more frequent VACs and main
verb lemmas. The indices included in the frequency component and their Eigen loadings are
provided in Table 3.22.
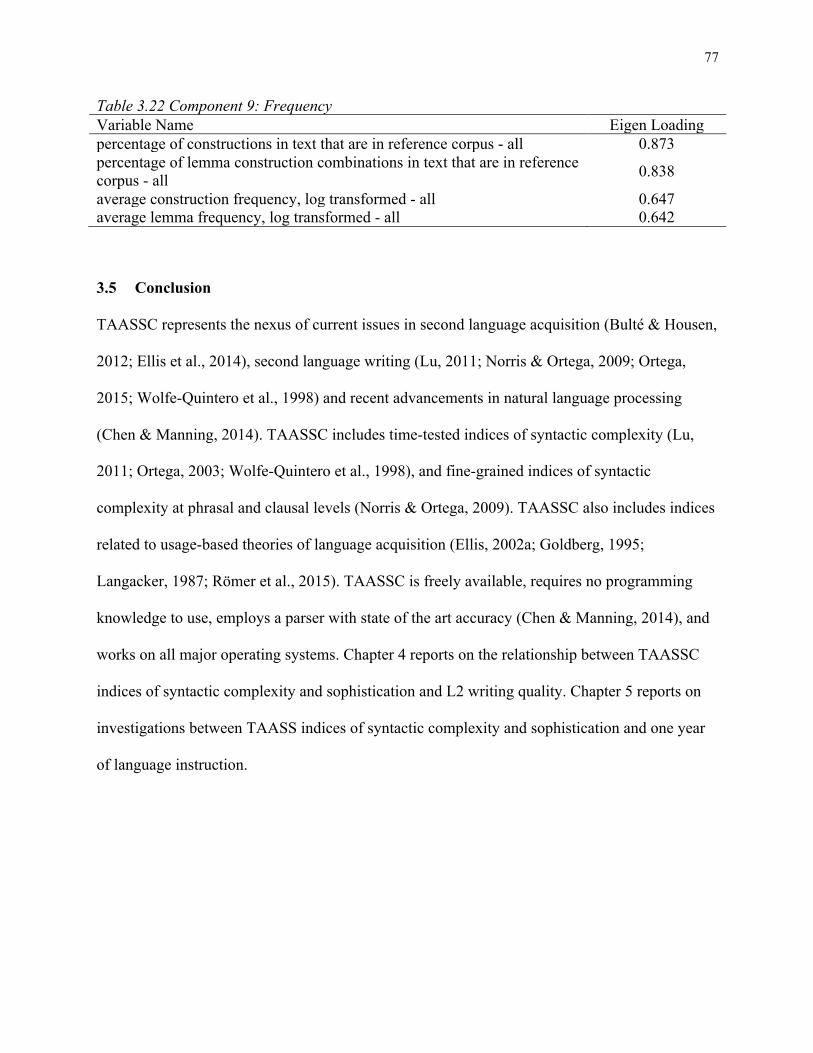
77
Table 3.22 Component 9: Frequency Variable Name Eigen Loading percentage of constructions in text that are in reference corpus - all 0.873 percentage of lemma construction combinations in text that are in reference corpus - all 0.838
average construction frequency, log transformed - all 0.647 average lemma frequency, log transformed - all 0.642
3.5 Conclusion
TAASSC represents the nexus of current issues in second language acquisition (Bulté & Housen,
2012; Ellis et al., 2014), second language writing (Lu, 2011; Norris & Ortega, 2009; Ortega,
2015; Wolfe-Quintero et al., 1998) and recent advancements in natural language processing
(Chen & Manning, 2014). TAASSC includes time-tested indices of syntactic complexity (Lu,
2011; Ortega, 2003; Wolfe-Quintero et al., 1998), and fine-grained indices of syntactic
complexity at phrasal and clausal levels (Norris & Ortega, 2009). TAASSC also includes indices
related to usage-based theories of language acquisition (Ellis, 2002a; Goldberg, 1995;
Langacker, 1987; Römer et al., 2015). TAASSC is freely available, requires no programming
knowledge to use, employs a parser with state of the art accuracy (Chen & Manning, 2014), and
works on all major operating systems. Chapter 4 reports on the relationship between TAASSC
indices of syntactic complexity and sophistication and L2 writing quality. Chapter 5 reports on
investigations between TAASS indices of syntactic complexity and sophistication and one year
of language instruction.

78
4 THE RELATIONSHIP BETWEEN SYNTACTIC COMPLEXITY AND
SOPHISTICATION AND L2 WRITING QUALITY
Syntactic complexity has been of interest to the field of L2 writing for over 45 years.
Much of the research in this area has focused on a small number of relatively large-grained
indices (e.g., mean length of clause, mean length of T-unit). The results, however, have been
mixed (e.g., Ortega, 2003; Wolfe-Quintero et al., 1998), resulting in a lack of consensus
regarding the relationship between syntactic complexity and L2 writing quality. This chapter re-
examines the relationship between syntax and L2 writing quality using both established indices
of syntactic complexity and newly developed, fine-grained indices of syntactic complexity and
sophistication. Specifically, the relationship between indices of syntactic development are used
to predict holistic scores of timed TOEFL independent essays. Traditional large-grained (e.g.,
mean length of clause) indices of syntactic complexity, in addition to newly developed fine-
grained clausal and phrasal indices of syntactic complexity and frequency-based indices of
syntactic sophistication are used to predict holistic scores of writing quality.
This chapter is guided by research questions 1a – 5a:
1a. What is the relationship between the Syntactic Complexity Analyzer indices and holistic
scores of writing proficiency?
2a. What is the relationship between fine-grained indices of clausal complexity and holistic
scores of writing proficiency?
3a. What is the relationship between fine-grained indices of phrasal complexity and holistic
scores of writing proficiency?
4a. What is the relationship between fine-grained indices of phrasal complexity and holistic
scores of writing proficiency?

79
5a. What is the relationship between all syntactic development indices included in TAASSC
and holistic scores of writing proficiency?
First the various indices of syntactic complexity and sophistication are briefly discussed,
followed by a description of the learner corpus of essays used. The statistical analyses employed
to answer the research questions are then discussed, followed by a report of the results. Finally,
implications of the results are discussed.
4.1 Method
4.1.1 Indices
TAASSC calculates four types of indices. The first type includes the indices of syntactic
complexity that are included in Lu’s (2010, 2011) Syntactic Complexity Analyzer (SCA) and
address research question 1a. The second type comprises fine-grained indices of clausal
complexity and address research question 2a. The third type comprises fine-grained indices of
phrasal complexity and address research question 3a. The fourth and final type comprises
frequency-based indices of syntactic sophistication and address research question 4a. See
Chapter 3 for an in-depth description of all indices included in TAASSC.
4.1.2 Writing proficiency corpus
The written proficiency corpus is comprised of argumentative essays written as part of
the Test of English as a Foreign Language (TOEFL). The essays comprise responses to two
independent prompts (240 texts each) that ask test-takers to compose an essay that asserts and
defends an opinion on a particular topic based on life experience (see Table 4.1). Test-takers are
given 30 minutes to complete the writing task, and are expected to produce at least 300 words.
See Table 4.2 for an overview of this corpus.

80
Table 4.1 Writing prompts for independent essays in TOEFL public use dataset Test Form Prompt Instructions 1 Do you agree or disagree with the following statement? It is more important to
choose to study subjects you are interested in than to choose subjects to prepare for a job or career. Use specific reasons and examples to support your answer.
2 Do you agree or disagree with the following statement? In today's world, the ability to cooperate well with others is far more important than it was in the past. Use specific reasons and examples to support your answer.
Table 4.2 Overview of writing proficiency corpus
Prompt N Number of Words Mean Score Standard
Deviation 1 240 77,238 3.83 0.86 2 240 74,252 3.47 0.91
Each essay was given a score on a 5-point scale by at least two raters trained by ETS. If
the scores given by the raters differed by 1 point or less, scores were averaged. If any two scores
given by raters differed by more than 1 point, a third rater was used to adjudicate the score.
Scores range from 1.0 to 5.0 in .5 point intervals. The holistic rating score used included
descriptors related to the completion of the task, organization, development of ideas, coherence,
word use, and syntax. See Table 4.3 for the score descriptors for low and high proficiency
essays. See Appendix A for the complete rating scale.

81
Table 4.3 Abbreviated TOEFL rubric for independent writing tasks Score Descriptors 5 An essay at this level largely accomplishes all of the following:
effectively addresses the topic and task is well organized and well developed, using clearly appropriate explanations, exemplifications, and/or details displays unity, progression, and coherence displays consistent facility in the use of language, demonstrating syntactic variety, appropriate word choice, and idiomaticity, though it may have minor lexical or grammatical errors
2 An essay at this level may reveal one or more of the following weaknesses: limited development in response to the topic and task inadequate organization of connection of ideas inappropriate or insufficient exemplifications, explanations, or details to support or illustrate generalizations in response to the task a noticeably inappropriate choice of words or word forms an accumulation of errors in sentence structure and/or usage
4.1.3 Statistical analysis
In order to determine how writing quality differs across writing levels in TOEFL
independent essays, a multiple linear regression analysis was conducted for each index type3.
First, normality was checked using the visualization component of the WEKA statistical package
(Hall et al., 2009). Any variables that violated a normal distribution were discarded. In most
cases, discarded variables represented syntactic features that occurred extremely rarely in the
data (and therefore were not candidates for transformation) such as indirect objects and relative
clauses. Pearson correlations were then conducted on the remaining variables to determine
whether they were meaningfully correlated with holistic essay score. Any variables that did not
reach an absolute correlation value of r ≥ .100 with holistic essay score (which represents the
threshold for a “small” effect [Cohen, 1988]) were removed from further consideration. Next, the
3 This study examines whether linear relationships exist between linguistic features and language proficiency. That linguistic development may not be strictly linear and is likely affected by a number of factors (e.g., is a complex adaptive system [Larsen-Freeman & Cameron, 2008]) is acknowledged. Linear analyses are used in order to find simple explanations, which may serve as a starting point for future analyses of factors which mitigate variability in language learning.

82
remaining variables were checked for multicollinearity to ensure that final model consisted only
of unique indices and that multicollinear indices did not exaggerate the results of the multiple
regression analysis (Tabachnick & Fidell, 2014). For each pair of variables with absolute
correlation values of r >= .700, only the variable with the highest correlation with holistic score
was kept (Crossley, Salsbury, & McNamara, 2012).
The remaining variables were entered into a ten-fold cross-validation multiple regression
using the WEKA statistical package. Ten-fold cross-validation is a method designed to avoid
overfitting a statistical or machine-learning model (Witten & Frank, 2005). In a 10-fold cross-
validation multiple regression, the dataset is randomly divided into ten sections (called “folds”).
A stepwise multiple regression is conducted using nine of the ten folds to train a statistical
model, which is then tested on the remaining fold. This procedure is repeated nine more times
until all of the folds have served as the test set. Finally, each of the ten models is averaged. After
the 10-fold multiple regression was conducted, a follow-up regression using the averaged model
was conducted in SPSS on the entire dataset. The next step in the statistical analysis was to
determine how generalizable the model was across topics by comparing the multiple regression
models between prompts using a Fisher r to z transformation. This analysis tests whether the
differences between two correlation values are due to chance (Dunn & Clark, 1969).
The accuracy of the model was also evaluated by calculating the exact and adjacent
matches between actual holistic score and the score predicted by the model. This is a common
way to evaluate the accuracy of automatic essay scoring algorithms (Shermis & Burstein, 2003).
Exact matches include predicted scores that match the actual score, while predicted and actual
scores are considered to be adjacent matches when they only differ by a prescribed number of
points. For all analyses in this study, predicted scores are considered to be adjacent matches if

83
the are within 1 point of the actual score. To facilitate this evaluation, all scores were rounded to
the nearest whole number (Shermis & Burstein, 2003). Kappa statistics were also conducted on
the rounded scores to estimate the strength of agreement between the actual scores and the
predicted scores (Landis & Koch, 1977).
4.2 Results and Discussion
4.2.1 Research Question 1a: Syntactic Complexity Analyzer
4.2.1.1 Results: Syntactic Complexity Analyzer
First, the potential for the 14 indices in Lu’s (2010, 2011) SCA to explain the variance in
holistic scores of essay quality in TOEFL independent essays was explored. All 14 indices
demonstrated normal distributions. Eight of these did not reach the minimum correlation
threshold of r ≥ 0.100 with TOEFL essay quality scores and were removed from the analysis. Of
the remaining six variables, three were removed due to multicollinearity with other variables.
The remaining three variables (mean length of clause, coordinate phrases per clause, and
complex nominals per T-unit) were entered into a 10-fold stepwise regression (see Table 4.4 for
an overview of these variables). The resulting model, which included one variable (mean length
of clause), explained 4.0% (r =.200, R2 = .040) of the variance in holistic essay scores (see Table
4.5 for the model). When the 10-fold model was applied to the entire dataset, it yielded a
significant model (F(1, 478), p < .001), which explained 5.8% (r = .240, R2 = .058) of the
variance. The model explained 2.7% (r = .163, R2 = .027) of the variance in prompt 1 scores and
8.9% (r = .298, R2 = .089) of the variance in prompt 2 scores. A Fisher’s r to z transformation
indicated that the amount of variance explained by the model across the two prompts did not
differ significantly (z = -1.56, p = .119). The exact accuracy of the scores predicted by the model

84
was 37.3%, and the exact/adjacent accuracy was 87.9%. The reported Kappa = .174 suggests
slight agreement between the actual and predicted scores (Landis & Koch, 1977).
Table 4.4 Correlations between holistic essay score and SCA variables entered into regression model Variable Correlation with Holistic Score mean length of clause 0.240 coordinate phrases per clause 0.190 complex nominals per T-unit 0.124
Table 4.5 Summary of SCA multiple regression model Entry Predictors included B β SE T p 1 mean length of clause .240 .110 .020 5.407 < .001 Note. Estimated constant term = 2.360, β = unstandardized beta, SE = standard error; B = standardized beta.
4.2.1.1 Discussion: Syntactic Complexity Analyzer
The relationship between indices of syntactic complexity calculated by the Syntactic
Complexity Analyzer (SCA) and TOEFL independent essay scores was significant, but small. A
number of the indices calculated by SCA were collinear (e.g., complex nominals per T-unit and
mean length of T-unit), supporting Lu’s (2010, 2011) findings. Three of the fourteen indices of
syntactic complexity, including mean length of clause (MLC), coordinate phrases per clause
(CP/C) and complex nominals per T-unit (CN/T) were non-collinear and demonstrated small, but
meaningful correlations with essay scores. One index, MLC was included in a model that
explained 4.0% of the variance in essay scores. See Table 4.7 for examples of MLC from low
and high scoring essays.

85
Table 4.6 Examples from TOEFL Essays: Mean length of clause Score Example Length of Clause 1 I selected agree to this question. 6 Because I regret it. 4 Mean = 5 5 With this in mind, it is still possible to argue that 11 colleges do not exist for the sole purpose of producing effective
social agents 13
Mean = 12
Essays that tended to have longer clauses, more coordinate phrases per clause, and more
complex nominals per T-unit tended to earn higher scores. These findings support previous
studies, such as Lu (2010, 2011), who found similar results across university levels (i.e., as
university level increased, writers used longer clauses, more coordinate phrases per clause, and
more complex nominals per T-unit). These results also align with the findings from Ortega’s
(2003) synthesis of L2 writing studies, which found either neutral or positive relationships
between MLC and writing proficiency. Overall, however, these differences demonstrated small
effects and explained only a small portion of the variance in holistic scores of writing
proficiency. Futhermore, the regression model included a single index (MLC). Accordingly, their
predictive performance was quite low, as demonstrated by exact and adjacent matches between
predicted and actual scores and quadratic weighted kappa statistics. The model explained more
of the variance in prompt 2 scores (8.9%) than in prompt 1 scores (2.7%), but the results of a
Fisher’s r to z transformation indicates that these differences are not significant.
The nature of the issue of multicollinearity in this case is also important to note. Of the
six variables that demonstrated meaningful relationships with holistic score, half were strongly

86
correlated. Both mean length of unit indices (MLC and MLT) demonstrated correlations above r
= .800 with their complex nominal counterpart (CN/C and CN/T). This suggests that increase in
clause and T-unit length is likely due to the inclusion of more complex nominals. The range of
structures included as complex nominals, however is quite broad, ranging in complexity from
nouns with adjectives to nominal clauses, which obscures the types of structures being produced.
4.2.2 Research Question 2a: Fine-grained clausal complexity
4.2.2.1 Results: Fine-grained clausal complexity
Next, the potential for 31 fine-grained clausal complexity indices to explain the variance
in holistic scores of essay quality in TOEFL independent essays was explored. Sixteen of the
indices violated the assumption of normality and were removed from further consideration. Nine
of the remaining 15 variables did not reach the minimum correlation threshold of r >= 0.100 and
were removed from further consideration. The six remaining indices (see Table 4.7) were entered
into a 10-fold stepwise regression. The resulting model, which included four variables, explained
2.8% (r = .166, R2 = .028) of the variance in holistic essay scores (see Table 4.8 for the model).
When the 10-fold model was applied to the entire dataset, it yielded a significant model (F(4,
475), p < .001), that explained 6.4% (r = .254, R2 = .064) of the variance. The model explained
3.8% (r = .196, R2 = .038) of the variance in prompt 1 scores and 8.8% (r = .296, R2 = .088) of
the variance in prompt 2 scores. A Fisher’s r to z transformation indicated that the amount of
variance explained by the model across the two prompts did not differ significantly (z = -1.16, p
= .246). The exact accuracy of the scores predicted by the model was 40.2%, and the
exact/adjacent accuracy was 86.9%. The reported quadratic weighted Kappa = .151, suggests
slight agreement between the actual and predicted scores (Landis & Koch, 1977).

87
Table 4.7 Correlations between holistic essay score and clausal complexity variables entered into regression Variable Correlation with Holistic Score nominal subjects per clause -0.172 prepositions per clause 0.141 direct objects per clause -0.137 dependents per clause (standard deviation) 0.128 adverbial modifiers per clause 0.116 clausal complements per clause -0.106
Table 4.8 Summary of clausal complexity multiple regression model
Entry Predictors included r R2 R2
change β SE B
1 nominal subjects per clause .172 .030 .030 -1.230 .438 -.129
2 direct objects per clause .209 .044 .014 -1.084 .373 -.130 3 dependents per clause
(standard deviation) .240 .054 .014 .617 .230 .119
4 clausal complements per clause .254 .064 .007 -1.319 .714 -.084
Note. Estimated constant term = 4.028, β = unstandardized beta, SE = standard error; B = standardized beta.
4.2.2.1 Discussion: Fine-grained clausal complexity
The relationship between fine-grained indices of clausal complexity and writing scores
was significant but small. Over half of the indices violated the assumption of normality due to
their rare occurrence in TOEFL essays (e.g., indirect objects and clausal coordinating
conjunctions). Eight indices (e.g., modals per clause and adverb modifiers per clause) did not
demonstrate a meaningful relationship with essay quality. Six non-collinear variables were
entered into a stepwise multiple regression. The resulting model, which included four indices,
explained 6.4% of the variance in holistic essay scores.
The results suggest that essays that include fewer nominal subjects, direct objects, and
finite clausal complements per clause, and a wider range of dependents per clause tend to earn
higher scores. With the exception of the SCA indices, TAASSC counts both finite and non-finite
verb phrases as clauses. The negative correlation between nominal subjects, direct objects per

88
clause, and finite clausal complements and essay score suggests a positive relationship between
the inclusion of non-finite clauses (such as infinitive and gerund clauses) and essay score. Table
4.11 includes examples from a high-scoring essay that demonstrate the use of non-finite clauses.
Table 4.9 Examples of non-finite clauses in high-scoring essays Construction Example verb – clausal complement It is our responsibility [to make]infinitive verb [our children
understand…]clausal complement verb – direct object The issue of deciding to choose and startinfinitive verb [a career]direct
object adverb modifier – verb – direct object
Parents can contribute by signaling teachers about howadverb modifier to teachinfinitive verb their childrendirect object
The results also suggest that essays with a wider variation of dependents per clause (but not a
higher average number of dependents per clause) tend to earn higher scores. This indicates that
including a range of both shorter and longer clauses (as measured by number of clausal
dependents) is a better writing strategy than essays including only long (or short) clauses. The
use of standard deviations in operationalizing syntactic complexity is novel, though some NLP
tools do report standard deviations for lexical sophistication (e.g., Coh-Metrix). The standard
deviation does, however, align felicitously with the TOEFL independent writing rubric, which
includes descriptors related to syntactic variation.
Overall, the predictive model was significant but only explained a relatively small portion
of the variance in essay scores, and, accordingly, predicted scores only demonstrated slight
agreement with actual scores. This suggests that clausal complexity, as measured by the number
of dependents (and the variation in number of dependents) are not strong predictors of essay
quality. This finding supports Biber et al.’s (2011) suggestion that clausal complexity is not a
characteristic feature of academic writing. This finding also aligns with Biber et al.’s (2014)
findings, in which only a single clausal complexity index (incidence of verb + that clauses)

89
demonstrated a significant relationship with TOEFL writing quality. Clausal complexity does not
appear to be a particularly distinguishing factor between low and high proficiency writers. If a
strong relationship exists between syntactic development and writing proficiency, it likely lies
elsewhere.
4.2.3 Research Question 3a: Phrasal complexity
4.2.3.1 Results: Phrasal complexity
Next, the potential for the 132 medium and fine-grained phrasal complexity indices to
explain the variance in holistic scores of essay quality in TOEFL independent essays was
explored. 90 indices violated the assumption of normality and were removed from further
consideration4. Nine of the remaining 42 variables did not reach the minimum correlation
threshold of r ≥ 0.100 and were removed from further consideration. Of the remaining 33
variables, 16 were removed due to multicollinearity. The remaining 17 variables (see Table 4.10)
were entered into a 10-fold stepwise regression. An initial model included three variables with
switched signs. These variables were removed and the model was re-run with 14 variables. The
resulting model, which included six variables, explained 16.1% (r = .400, R2 = .161) of the
variance in holistic essay scores (see Table 4.11 for the model). When the 10-fold model was
applied to the entire dataset, it yielded a significant model (F(6, 473), p < .001), that explained
20.0% (r = .447, R2 = .200) of the variance. The model explained 15.7% (r = .396, R2 = .157) of
the variance in prompt 1 scores and 24.9% (r = .499, R2 = .249) of the variance in prompt 2
scores. A Fisher’s r to z transformation indicated that the amount of variance explained by the
model across the two prompts did not differ significantly (z = -1.41, p = .159). The exact
4 Note. Most of the indices removed for violation of normality were counts of features that were rare in the dataset, resulting in the majority of essays receiving index scores of “0”.

90
accuracy of the scores predicted by the model was 42.9%, and the exact/adjacent accuracy was
92.5%. The reported quadratic weighted Kappa = .336 suggests fair agreement between the
actual and predicted scores (Landis & Koch, 1977).
Table 4.10 Correlations between holistic essay score and phrasal complexity variables entered into regression
Variable Correlation with Holistic Score
dependents per nominal 0.332 dependents per object of the preposition (no pronouns) 0.290 prepositions per nominal (no pronouns) 0.288 prepositions per object of the preposition 0.287 dependents per nominal (standard deviation) 0.277 dependents per object of the preposition 0.267 adjectival modifiers per object of the preposition 0.265 dependents per direct object (standard deviation) 0.259 dependents per object of the preposition (no pronouns, standard deviation) 0.239
dependents per nominal subject (standard deviation) 0.230 dependents per direct object (no pronouns) 0.226 determiners per nominal subject 0.203 determiners per nominal (no pronouns) 0.157 dependents per direct object -0.154 adjectival modifiers per direct object (no pronouns) 0.146 determiners per direct object (no pronouns) 0.116 prepositions per direct object 0.110 Table 4.11 Summary of phrasal complexity multiple regression model Entry Predictors included r R2 R2
change β SE B
1 dependents per object of the preposition (no pronouns) .290 .084 .084 .669 .187 .164
2 prepositions per object of the preposition .346 .120 .036 1.526 .592 .121
3 dependents per direct object (standard deviation) .396 .157 .037 .698 .185 .177
4 dependents per nominal subject (standard deviation) .427 .182 .025 .445 .170 .117
5 dependents per direct object (no pronouns) .429 .184 .001 .271 .141 .099
6 dependents per direct object .447 .200 .016 -.374 .120 -.147 Note. Estimated constant term = 1.531, β = unstandardized beta, SE = standard error; B = standardized beta.

91
4.2.3.2 Discussion: Phrasal complexity
The relationship between fine-grained indices of phrasal complexity and writing scores
was significant and demonstrated a medium effect. The analysis indicated that a number of the
structures examined in TAASSC were rare in TOEFL independent essays, leading to non-normal
distributions and the exclusion of their related indices. Indirect objects, for example, were
extremely rare in the data, as were passive constructions. Seventeen non-collinear indices that
demonstrated meaningful correlations with essay score were entered into a stepwise regression.
The resulting model, which explained 20% of the variance in essay scores, included six indices
of phrasal complexity. The findings support Biber et al.’s (2011) general hypothesis that as
writers develop, their writing will be characterized by complex noun phrases. The specific
structures that emerged as important predictors of writing quality included some features Biber et
al. suggested would emerge later in L2 development (e.g., phrasal embedding), but precluded
others (e.g., relative clauses). The phrasal complexity index with the strongest relationship with
holistic writing proficiency scores (number of dependents per nominal), along with each index
included in the predictor model is discussed below, followed by a summary of the findings.
4.2.3.2.1 Number of dependents per nominal
The medium-grained index, number of dependents per nominal, demonstrated the highest
correlation with essay score (r = .332), but was not included in the predictor model. This positive
correlation suggests that higher rated essays tend to include nominal phrases with more
dependents. For example, a highly rated essay is likely to include the following object of the
proposition: I grew up in [a family of businessmen], which includes two direct dependents (a
determiner and a prepositional phrase). See Figure 4.1 for a visualization of this example. As
writers become more proficient, their writing becomes more like academic writing, in which a

92
great deal of meaning is embedded in noun phrases (Biber et al., 2011). Generally, this result
aligns with previous studies that have found a positive relationship between the related Coh-
Metrix index modifiers per noun phrase and writing quality (e.g., Guo et al., 2013).
Figure 4.1 Phrasal complexity: Dependents per nominal
4.2.3.2.2 Complexity and prepositional objects
The results suggest that highly rated essays tend to include more dependents per object of
the preposition (see Figure 4.2Error! Reference source not found.) and specifically more
prepositions per object of the preposition (see Figure 4.3Error! Reference source not found.).
The two indices dependents per object of the preposition (no pronouns) and prepositions per
object of the preposition together explain a majority of the variance in writing proficiency scores
explained by the phrasal complexity model. The findings align with Biber et al.’s (2011) model
of writing development, wherein one characteristic of the highest level of development is phrasal
embedding (and particularly strings of postmodifier prepositional phrases). As writers become
more proficient, their writing more closely models the features of academic writing.
Figure 4.2 Phrasal complexity: Dependents per object of the preposition
Figure 4.3 Phrasal complexity: Prepositions per object of the preposition

93
4.2.3.2.3 Complexity and nominal subjects
Essays that included a wider range of dependents per nominal subject tended to earn a
higher score. As with the clausal complexity, the results suggest that including only nominal
subjects with few or many dependents is not a productive writing strategy. The example
sentences in Figure 4.4Error! Reference source not found., which come from an essay that
earned a high score, include both nominal subjects without any dependents (e.g., it), and a
nominal subject with multiple dependents (i.e., theme, which has four direct dependents).
Figure 4.4 Phrasal variation: Dependents per nominal subject
These results are novel, in that previous research has not explored syntactic variation at
the phrasal level. Biber et al.’s (2011) corpus analysis of spoken and academic texts, for
example, looked at a number of fine-grained phrasal complexity indices, but not variation. The
results do align with the TOEFL rubric descriptors, which indicate that high proficiency essays
should include a variety of syntactic structures.
One would expect that standard deviation scores for complexity indices would be
correlated with mean scores. In order for a writer to use a wider range of dependents per nominal
subject, for example, one must include some structures with multiple dependents per nominal
(which would also increase the mean number of dependents per nominal). In the data,

94
dependents per nominal subject index was strongly correlated (r = .840) with the dependents per
nominal index (standard deviation). Considering this relationship, the results provide further
evidence that as writers become more proficient, their writing includes more features of
academic writing (Biber et al., 2011). In this light, the results may also align with studies that
have demonstrated a relationship with the Coh-Metrix index number of words before the main
verb and writing quality (e.g., Crossley & McNamara, 2014; McNamara et al., 2010).
4.2.3.2.4 Complexity and direct objects
Essays that included a wider range of dependents per direct object, more dependents per
direct object (ignoring direct objects that are pronouns) and fewer dependents per direct object
(when pronouns are considered) tend to earn higher writing proficiency scores. This suggests that
highly rated essays tend to include both complex direct object phrases (e.g., a piano in Figure
4.5Error! Reference source not found.) and direct object phrases with no dependents (e.g., it in
Figure 4.5Error! Reference source not found.). As writers develop, they seem to have a wider
range of direct object structures at their disposal, and employ both pronominal direct objects
(which have no direct dependents) and direct objects with dependents. This finding is novel, both
with regard to the exploration of direct object complexity, and, accordingly, to the use of
standard deviations. The Biber et al. (2011), corpus analysis, for example, did not include
functional attributes (e.g., nominal subject, direct object, or indirect object) as part of their
corpus analysis. This is clearly an area for future research.
Figure 4.5 Phrasal complexity and variation: Direct objects

95
4.2.3.2.5 Phrasal complexity discussion summary
Overall, the results indicate that higher proficiency essays include complex noun phrases.
Generally, these results support Biber et al.’s (2011) corpus-based hypotheses regarding writing
development. As writers become more proficient, their essays tend to be more characteristic of
academic writing: They include nominals (e.g., subjects and objects) that are more complex, and
in particular that have prepositional phrases as modifiers. These findings also align with the
findings of research with Coh-Metrix indices number of words before the main verb and
modifiers per noun phrase (Crossley & McNamara, 2014; Guo et al., 2013; McNamara et al.,
2010), which found that essays with more words before the main verb (including nominal
subjects) and essays that include more modifiers per noun phrase tend to earn higher scores.
The results highlighted the predictive validity of both standard deviation indices, which
align with TOEFL rubric descriptors. The results also suggested that the inclusion of fine-grained
indices that take into account the function of a particular nominal (e.g., subject or direct object)
and type of dependent (e.g., prepositional phrases) not only provide detailed information about
writing proficiency, but also lead to stronger models than indices than larger-grained indices.
Based on correlation alone, the index dependents per nominal, for example, explained 11.0% of
the variance in essay scores (r = .332, R2 = .110). The full regression model, which was
comprised of six fine-grained indices and did not include dependents per nominal, explained
20.0% of the variance.
Previous research (e.g., Cumming et al., 2005) has suggested that syntactic complexity
plays but a small role in rater’s judgments of writing quality. In a similar fashion as Cumming et
al., this study found that traditional clause and T-unit indices explain a small percentage of the
variance in essay scores. Similarly, this study found that fine-grained clausal indices explain a

96
small amount of the variance in essay scores. These two findings would support the notion that
syntactic complexity is not a critical determiner of writing proficiency. At the phrasal level,
however, a substantial amount of the variance was explained by complexity measures,
suggesting that syntactic complexit indeed contributes to the construct of writing proficiency.
This suggests that AES models may be enriched by the inclusion of indices related to phrasal
complexity (and variation). The inclusion of such indices may not only increase model accuracy,
but would also increase construct coverage. The results also suggest that academic writing
classrooms may benefit from the inclusion of instruction and practice in embedding information
in noun phrases.
4.2.4 Research Question 4a: Syntactic sophistication
4.2.4.1 Results: Syntactic sophistication
Next, the potential for the 190 indices of syntactic sophistication to explain the variance
in holistic scores of essay quality in TOEFL independent essays was explored. Eleven indices
violated the assumption of normality and were removed from further consideration. Of the
remaining 179 variables, 93 did not reach the minimum correlation threshold of r >= 0.100 and
were removed from further consideration. Of the remaining 86 variables, 72 were removed due
to multicollinearity. The remaining 14 variables (see Table 4.12) were entered into a 10-fold
stepwise regression. The resulting model, which included seven variables, explained 15.8% (r =
.398, R2 = .158) of the variance in holistic essay scores (see Table 4.13 for the model). When the
10-fold model was applied to the entire dataset, it yielded a significant model (F(7, 472), p <
.001) that explained 18.3% (r = .427, R2 = .183) of the variance. The model explained 15.2% (r
= .391, R2 = .152) of the variance in prompt 1 scores and 20.6% (r = .454, R2 = .206) of the
variance in prompt 2 scores. A Fisher’s r to z transformation indicated that the amount of

97
variance explained by the model across the two prompts did not differ significantly (z = -0.84, p
= .400). The exact accuracy of the scores predicted by the model was 39.2%, and the
exact/adjacent accuracy was 89.6%. The reported Kappa = .232, suggests slight agreement
between the actual and predicted scores (Landis & Koch, 1977).
Table 4.12 Correlations between holistic essay score and syntactic sophistication variables entered into regression
Variable Correlation with Holistic Score
average delta p score verb (cue) - construction (outcome) (types only) - academic 0.251
average lemma construction frequency (types only) - all -0.234 average faith score verb (cue) - construction (outcome) - fiction (standard deviation) 0.206
average delta p score construction (cue) - verb (outcome) - academic (standard deviation) 0.185
average construction frequency, log transformed - all -0.171 average lemma frequency, log transformed - fiction -0.165 collostruction ratio - all 0.160 collostruction ratio (types only) - academic 0.155 percentage of constructions in text that are in reference corpus - fiction -0.154 collostruction ratio (types only) - magazine 0.144 average construction frequency (types only) - fiction -0.113 average faith score construction (cue) - verb (outcome) - fiction (standard deviation) 0.112
collostruction ratio (types only) - fiction 0.108 construction type-token ratio - fiction -0.103

98
Table 4.13 Summary of syntactic sophistication multiple regression model
Entry Predictors included r R2 R2
change β SE B
1 average delta p score verb (cue) - construction (outcome) (types only) - academic
.251 .063 .063 11.419 4.737 .141
2 average delta p score construction (cue) - verb (outcome) - academic (standard deviation)
.256 .065 .003 4.214 2.918 .082
3 average delta p score construction (cue) - verb (outcome) - academic (standard deviation)
.312 .097 .032 2.784 .845 .139
4 average construction frequency, log transformed - all
.354 .125 .028 -1.085 .209 -.286
5 percentage of constructions in text that are in reference corpus - fiction
.359 .129 .004 -1.628 .770 -.099
6 collostruction ratio (types only) - magazine .370 .137 .008 .017 .009 .086
7 construction type-token ratio - fiction .427 .183 .046 -2.808 .545 -.271
Note. Estimated constant term = 11.299, β = unstandardized beta, SE = standard error; B = standardized beta.
4.2.4.2 Discussion: Syntactic Sophistication
The relationship between indices and TOEFL writing was significant and demonstrated a
medium effect. Seven variables were included in a model that explained 18.3% of the variance in
essay score. Essays that included more strongly associated verb – VAC combinations (see Table
4.14Error! Reference source not found.) and included less frequent VACs (see Table
4.15Error! Reference source not found.) tended to earn higher scores. Additionally, essays that
had a lower type-token ratio (e.g., repeated some VACs) tended to earn higher scores. The
findings generally support usage-based perspectives on language learning (e.g., Behrens, 2009;
Ellis, 2002a; Tomasello, 2003) in that indices related to VAC frequency and strength of
association were indicators of writing development, though some important caveats are in order.

99
Table 4.14 Examples of weak and strong verb-VAC associations in TOEFL essays Essay Score Association Verb-VAC Combination
2 weak
nsubj – agree – dobj
5 strong
subject – require – direct object – direct object
Table 4.15 Examples of high and low frequency VACs Essay Score Frequency VAC
2 high
nsubj – verb – dobj
5 low
subject – verb – direct object – direct object
Research from a usage-based perspective has demonstrated that constructions that are
more frequent in the input will be learned earlier/more easily (e.g., Ellis & Ferreira-Junior,
2009a; Lieven et al., 1997) than less frequent constructions. Methodologically, this study
diverged from previous studies in four important ways. First, previous studies have measured the
relationship between learner input and output directly, while in this study learner output is
measured directly (essays) but a reference corpus was used as a proxy for input. Second,
previous studies have been longitudinal, while this study used holistic writing proficiency scores.
Third, previous studies have examined a small number of VACs, while this study accounts for all

100
of the VACs that are extant in COCA. Finally, while other developmental studies have studied
oral construction development, this study studied construction development in writing. Despite
these important differences, the results with regard to frequency supported previous findings that
frequency is an important factor in language development (Ellis & Ferreira-Junior, 2009b;
Lieven et al., 1997).The findings of the current study suggest that lower proficiency writers tend
to use VACs that are more frequent in the input, and therefore are more easily learned. Higher
proficiency learners, on the other hand, tend to use constructions that are less frequent in the
input, which are less easily learned. This suggests from a usage-based perspective that higher
proficiency learners have had more language experiences, enabling them to learn less frequently
encountered constructions.
Beyond frequency, usage-based studies have also been interested in association strength.
For instance, Ellis and Ferreira-Junior (2009a, 2009b) found a positive relationship between
verb-VAC strength of association in the input and learner output. Learners were more likely to
use verb-VAC combinations that were more strongly associated in the interlocutor input. This
relationship was especially strong when delta P was used as the association measure with
constructions as the cue and verbs as the outcome. Extrapolating these results, we would expect
that more strongly associated verb-VAC combinations would be learned earlier/more easily, and
therefore more highly proficient language users would use less strongly associated combinations
(in addition to strongly associated ones). In the current study, however, the opposite trend was
found. Lower scoring essays (ostensibly written by lower proficiency language users) tended to
include verb-VAC combinations with lower association scores, while higher scoring essays
tended to include more strongly associated combinations. While these findings are surprising in
light of Ellis and Ferreira-Junior (2009a, 2009b), they are less surprising in light of other related

101
(but not developmental) studies. For example, Römer et al. (2014; 2015) found that advanced L2
learners had similar verb preferences as L1 speakers for the nominal subject-verb-prepositional
phrase VACs that were tested, both in elicitation tasks and in corpus data. This suggests that
advanced L2 speakers have had sufficient language exposure to have learned which verbs are
normally used in particular constructions. The findings of this study suggest that raters may be
sensitive to verb-VAC strength of association. Essays that include more strongly associated verb-
VAC combinations are judged to be of higher proficiency than essays that included less strongly
associated verb-VAC combinations.
One way to align the diverging findings is to suggest that syntactic development at the
verb-VAC interface is not strictly linear. It has been established that, at least for a relatively
small set of VACs (and at early stages of development), learners tend to learn verb-VAC
combinations as fixed chunks (Eskildsen, 2009; Ninio, 1999).Through repeated language
experiences with similar combinations, learners begin to discover that parts of fixed expressions
(e.g., verbs) are variable. A pathbreaking verb will be used in place of the verb in the “fixed”
expression, which will then be followed by the use of more verbs (Ninio, 1999). For the learners
in this study, it may be that after the verb slot becomes variable, learners overgeneralize, and use
verb-VAC combinations that are atypical. Through further language experiences, however, verb-
VAC sensitivities are formed and more typical verb-VAC combinations are used.
These findings also have important implications for writing assessment. The results
suggest that raters may be sensitive to both the relative frequency of constructions themselves
and the strength of association between constructions and the verbs that fill them. This may be
captured in the TOEFL independent writing rubric wherein verb-VAC combinations may be
subsumed under the descriptor “appropriate word choice”. Essays that include weakly associated

102
verb-VAC combinations earn lower scores, while essays that include strongly associated verb-
VAC combinations tend to earn higher scores. It may be useful to make this connection explicit
both to raters (to help reduce rater variability) and to test-takers (to explicitly outline rater
expectations), though the efficacy of both of these suggestions should be empirically
investigated. AES models could also benefit from the inclusion of indices of syntactic
sophistication. The inclusion of such indices could both increase model accuracy and construct
coverage.
Links between writing success and verb-VAC combinations suggest that it may be
valuable to include verb-VAC combination instruction in language learning classrooms in
general, and writing classrooms in particular. Such instruction could be both implicit and explicit
(Littlemore, 2009). Implicit instruction could involve the inclusion of materials that are sensitive
to verb-VAC strength of association profiles by ensuring that a high percentage of verb-VAC
combinations were strongly associated. The inclusion of such materials may facilitate the tuning
of learners verb-VAC combination sensitivities. Other instructional techniques could include
teaching VACs explicitly, not unlike vocabulary items are often taught. Such instruction would
include both form-meaning mappings and VAC verb profiles.
4.2.5 Research Question 5a: Combined syntactic complexity and sophistication
4.2.5.1 Results: Combined syntactic complexity and sophistication
Finally, the potential for the 40 syntactic complexity and sophistication variables entered
into each previous regression model to explain the variance in holistic scores of essay quality in
TOEFL independent essays was explored. All of these variables met the criteria for normality
and minimum correlation with holistic score. No variables were multicollinear. Fourty variables
(see Table 4.16) were entered into a 10-fold stepwise regression. The initial model included three

103
variables with switched signs. These were removed, and the regression was run again. The
second model included one variable with switched signs, which was removed and the regression
was run a third time. The resulting model included six phrasal complexity indices, five indices of
syntactic sophistication, two clausal complexity indices, and no SCA variables. This 13-variable
model explained 29.7% (r = .545, R2 = .297) of the variance in holistic essay scores (see Table
4.17 for the model). When the 10-fold model was applied to the entire dataset, it yielded a
significant model (F(13, 466), p < .001) that explained 34.2% (r = .584, R2 = .342) of the
variance. The model explained 26.4% (r = .514, R2 = .264) of the variance in prompt 1 scores
and 41.2% (r = .642, R2 = .412) of the variance in prompt 2 scores. A Fisher’s r to z
transformation indicated that the amount of variance explained by the model across the two
prompts differed significantly (z = -2.11, p = .035). The exact accuracy of the scores predicted
by the model was 45.8%, and the exact/adjacent accuracy was 92.7%. The reported quadratic
weighted Kappa = .416, suggests moderate agreement between the actual and predicted scores
(Landis & Koch, 1977).

104
Table 4.16 Correlations between holistic essay score and variables entered into regression Variable Category r dependents per nominal Phrasal Cx 0.332 dependents per object of the preposition (no pronouns) Phrasal Cx 0.290 prepositions per nominal (no pronouns) Phrasal Cx 0.288 prepositions per object of the preposition Phrasal Cx 0.287 dependents per nominal (standard deviation) Phrasal Cx 0.277 dependents per object of the preposition Phrasal Cx 0.267 adjectival modifiers per object of the preposition Phrasal Cx 0.265 dependents per direct object (standard deviation) Phrasal Cx 0.259 average delta p score verb (cue) - construction (outcome) (types only) - academic Sophistication 0.251
mean length of clause SCA 0.240 dependents per object of the preposition (no pronouns, standard deviation) Phrasal Cx 0.239
average lemma construction frequency (types only) - all Sophistication -0.234 dependents per nominal subject (standard deviation) Phrasal Cx 0.230 dependents per direct object (no pronouns) Phrasal Cx 0.226 average faith score verb (cue) - construction (outcome) - fiction (standard deviation) Sophistication 0.206
determiners per nominal subject Phrasal Cx 0.203 coordinate phrases per clause SCA 0.190 average delta p score construction (cue) - verb (outcome) - academic (standard deviation) Sophistication 0.185
nominal subjects per clause Phrasal Cx -0.172 average construction frequency, log transformed - all Sophistication -0.171 average lemma frequency, log transformed - fiction Sophistication -0.165 collostruction ratio - all Sophistication 0.160 determiners per nominal (no pronouns) Phrasal Cx 0.157 collostruction ratio (types only) - academic Sophistication 0.155 percentage of constructions in text that are in reference corpus - fiction Sophistication -0.154
dependents per direct object Phrasal Cx -0.154 adjectival modifiers per direct object (no pronouns) Phrasal Cx 0.146 collostruction ratio (types only) - magazine Sophistication 0.144 prepositions per clause Clausal Cx 0.141 direct objects per clause Clausal Cx -0.137 dependents per clause (standard deviation) Clausal Cx 0.128 complex nominals per T-unit SCA 0.124 adverbial modifiers per clause Sophistication 0.116 determiners per direct object (no pronouns) Phrasal Cx 0.116 average construction frequency (types only) - fiction Sophistication -0.113 average faith score construction (cue) - verb (outcome) - fiction (standard deviation) Sophistication 0.112
prepositions per direct object Phrasal Cx 0.110 collostruction ratio (types only) - fiction Sophistication 0.108

105
clausal complements per clause Sophistication -0.106 construction type-token ratio - fiction Sophistication -0.103
Table 4.17 Summary of multiple regression model
Entry Predictors included Category r R2 R2
change β SE B
1 dependents per nominal Phrasal Cx .332 .110 .110 .407 .297 .087 2 dependents per object of
the preposition (no pronouns)
Phrasal Cx .354 .125 .015 .614 .194 .150
3 prepositions per nominal (no pronouns)
Phrasal Cx .371 .138 .012 1.639 .780 .104 4 dependents per nominal
(standard deviation) Phrasal Cx .379 .144 .006 .450 .349 .071
5 dependents per direct object (standard deviation)
Phrasal Cx .407 .165 .022 .674 .177 .171
6 average faith score verb (cue) - construction (outcome) - fiction (standard deviation)
Sophistication .444 .198 .032 6.677 2.01
1 .130
7 average delta p score construction (cue) - verb (outcome) - academic (standard deviation)
Sophistication
.463 .215 .017 2.204 .791 .110
8 average construction frequency, log transformed - all
Sophistication .479 .230 .015 -.931 .197 -.246
9 dependents per direct object
Phrasal Cx .491 .241 .011 -.343 .114 -.135 10 collostruction ratio
(types only) - magazine Sophistication .505 .255 .015 .021 .008 .104
11 adverbial modifiers per clause
Clausal Cx .511 .261 .006 .775 .404 .079 12 clausal complements per
clause Clausal Cx .515 .265 .004 -.633 .631 -.040
13 construction type-token ratio - fiction
Sophistication .584 .342 .076 -3.698 .503 -.356
Note. Estimated constant term = 7.793, β = unstandardized beta, SE = standard error; B = standardized beta.
Table 4.18 includes an overview of the results for each model with regard to correlation
with holistic score, exact matches between predicted and actual scores, and exact or adjacent
matches between predicted and actual scores.

106
Table 4.18 An overview of the performance of each model tested Correlation with
Holistic Score Prediction Accuracy
(Exact) Prediction Accuracy (Exact and Adjacent)
SCA .240 37.3% 87.9% Clausal .254 40.2% 86.9% Phrasal .447 42.9% 92.5% Sophistication .427 39.2% 89.6% Combined .584 45.8% 92.7%
A series of Fisher r to z transformation tests were conducted to determine whether the
differences between models were due to chance. The results of these tests indicate that a number
of significant differences existed between the models. All models except for the fine-grained
clausal complexity model were significantly stronger than the SCA model. The phrasal,
sophistication, and combined models were also significantly stronger than the fine-grained
clausal complexity model. Additionally, the combined model was stronger than any of the other
models. See Table 4.19 for a summary of these results.
Table 4.19 A comparison of models using Fisher’s r to z transformation SCA Clausal Cx Phrasal Cx Sophistication SCA Clausal Cx p = .818 Phrasal Cx p < .001 p < .001 Sophistication p = .001 p = .002 p = .704 Combined p < .001 p < .001 p = .004 p = .001
A series of McNemar tests were conducted to determine whether the exact match
accuracies of the models differed significantly. The results of these tests indicate that a few
significant differences existed between the models. The fine-grained phrasal model and the
combined model demonstrated significantly more exact matches than the SCA model.
Additionally, the combined model demonstrated significantly more exact matches than the
clausal complexity model and the sophistication model. See Table 4.20 for a summary of the
exact accuracy results.
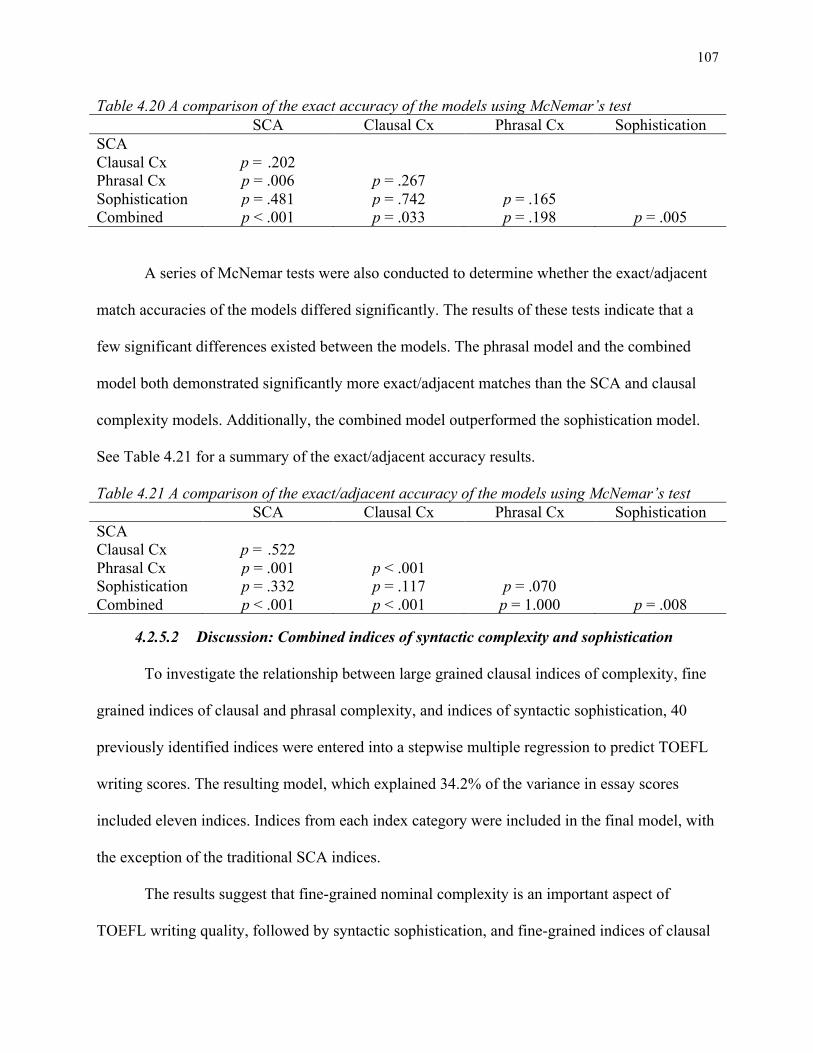
107
Table 4.20 A comparison of the exact accuracy of the models using McNemar’s test SCA Clausal Cx Phrasal Cx Sophistication SCA Clausal Cx p = .202 Phrasal Cx p = .006 p = .267 Sophistication p = .481 p = .742 p = .165 Combined p < .001 p = .033 p = .198 p = .005
A series of McNemar tests were also conducted to determine whether the exact/adjacent
match accuracies of the models differed significantly. The results of these tests indicate that a
few significant differences existed between the models. The phrasal model and the combined
model both demonstrated significantly more exact/adjacent matches than the SCA and clausal
complexity models. Additionally, the combined model outperformed the sophistication model.
See Table 4.21 for a summary of the exact/adjacent accuracy results.
Table 4.21 A comparison of the exact/adjacent accuracy of the models using McNemar’s test SCA Clausal Cx Phrasal Cx Sophistication SCA Clausal Cx p = .522 Phrasal Cx p = .001 p < .001 Sophistication p = .332 p = .117 p = .070 Combined p < .001 p < .001 p = 1.000 p = .008
4.2.5.2 Discussion: Combined indices of syntactic complexity and sophistication
To investigate the relationship between large grained clausal indices of complexity, fine
grained indices of clausal and phrasal complexity, and indices of syntactic sophistication, 40
previously identified indices were entered into a stepwise multiple regression to predict TOEFL
writing scores. The resulting model, which explained 34.2% of the variance in essay scores
included eleven indices. Indices from each index category were included in the final model, with
the exception of the traditional SCA indices.
The results suggest that fine-grained nominal complexity is an important aspect of
TOEFL writing quality, followed by syntactic sophistication, and fine-grained indices of clausal

108
complexity (no traditional indices were included in the final model). In the combined model,
fine-grained nominal complexity indices explained 17.6% of the variance, indices of syntactic
sophistication explained 15.5% of the variance, and clausal complexity indices explained 1.0%
of the variance in essay scores. This generally follows the trends observed in the individual
studies wherein indices of fine grained phrasal complexity indices and indices of syntactic
sophistication were much stronger predictors of holistic essay scores than either traditional
indices of syntactic complexity or fine-grained indices of clausal complexity. Generally, these
results support Biber et al.’s 2011 claims regarding the importance of clausal versus phrasal
elaboration in academic writing. These results also support the extension of usage-based
perspectives on language development to writing development and assessment. Individually,
indices of syntactic sophistication demonstrated meaningful but small correlations with holistic
score. These correlations tended to be stronger than their complexity counterparts (i.e.,
dependents per clause). Furthermore, writing quality predictor models consisting of syntactic
sophistication indices and phrasal complexity indices, respectively, were significantly stronger
than models consisting of traditional indices. This suggests that high proficiency writers are
characterized by their command of a number of features of phrasal complexity (e.g., embedding
of prepositional phrases), which also leads to the production of a wider range of phrasal
complexity features. This also suggests that high proficiency writers are also characterized by
their use of less frequent VACs and verb-VAC combinations that are strongly associated.
4.3 Summary
Overall, the results of this study have particularly important implications for second
language acquisition, second language writing, and second language assessment. Most SLA and
L2 writing studies that investigate syntactic development have operationalized the construct

109
using indices such as mean length of clause and mean length of T-unit (Lu, 2010, 2011; Ortega,
2003; Wolfe-Quintero et al., 1998). The relationship between these indices and syntactic
development (broadly defined) has been rather weak and at times contradictory. The
investigation of traditional indices in this chapter followed this trend with results that were
significant but with a small effect size and slight agreement between actual and predicted scores.
In this study, only a single index related to syntactic complexity, mean length of clause, which
demonstrated a small, positive relationship with holistic essay scores was included in the
predictor model.
The newly developed fine-grained indices of phrasal complexity and indices of
sophistication, however, contributed to predictor models that demonstrated moderate effect sizes.
Furthermore, the results from the traditional indices of syntactic complexity study provide very
little information regarding the nature of syntactic development (i.e., write longer clauses). The
fine-grained complexity indices and indices of syntactic sophistication, on the other hand,
provide much more detailed information. With regard to clausal structure, more proficient
writers tend to include more direct dependents, and also a wider range of dependents. In
particular, more proficient writers tend to include more non-finite clauses, more adverbials, and
more adverbial prepositions than less proficient writers. More proficient writers also use more
complex and varied phrases, and in particular include more prepositional phrases and adjectival
modifiers. The results in regard to syntactic sophistication are slightly more opaque, but suggest
that more proficient writers use less frequent verb argument construction combinations, and
verb-VAC combinations that are more strongly associated (and have a wider range of association
scores) than less proficient writers.

110
4.4 Limitations and future directions
Exact and adjacent matches were reported for each study, along with quadratic weighted
Kappa statistics, following related work in automatic essay scoring (AES; e.g., Attali & Burstein,
2006). The agreement between scores predicted by models including indices of syntactic
development and actual scores ranges from slight to fair. Exact and adjacent matches also failed
to reach state of the art levels of 55% adjacent and 98% exact agreement (Attali & Burstein,
2006; Crossley, Kyle, Allen, Guo, & McNamara, 2014). This demonstrates the multi-faceted
nature of writing assessment, and is not surprising given that most (if not all) essay scoring
rubrics include descriptors from a range of different language proficiency areas (e.g., lexical
proficiency, cohesion, etc.) in addition to syntax. Accordingly, state of the art AES systems
include a variety of index types in their models. Future work in this area should explore the
degree to which fine-grained indices of syntactic complexity and sophistication can add to the
accuracy (and construct coverage) of AES systems. Future research should also address the
relationship between prompt and syntax. Across syntactic development index types, prompt 2
consistently demonstrated a larger effect between syntactic features and essay score. These
differences reached significance in two of the five studies (the syntactic sophistication study and
the combined study).
A potential limitation for the sophistication indices is the use of COCA as a proxy for L2
language experience. COCA was designed to be representative of general English language use
in America (Davies, 2009, 2010), but likely does not fully represent the types of language
exposure that L2 learners are exposed to. A corpus that included the types of language that
language learners are commonly exposed to would likely serve as a better proxy for language
experience, and may yield stronger (and more representative) results. Outlining the

111
characteristics for such a corpus, collecting appropriate texts, and replicating the studies in this
dissertation may be rich areas of investigation. A starting point for such a task may be to create
an L2 version of the Touchstone Applied Science Associates (TASA) corpus (Landauer, Foltz, &
Laham, 1998), which includes the types of written texts (e.g., textbooks) public school students
in the United States are likely to encounter. An L2 version of the TASA corpus could include a
number of popular second language textbook series, including extensive reading texts. A second
step might be to create an L2 language classroom version of a corpus such as the Michigan
Corpus of Academic Spoken English (MICASE) (Simpson-Vlach & Leicher, 2006), with a
related third step of developing accurate methods of parsing (transcribed) spoken data.
One area of particular interest for future work in syntactic development beyond
replicating and expanding on the studies in this chapter and in Chapter 5 is the investigation of
phrasal sophistication. Clausal indices of syntactic sophistication demonstrated a stronger
relationship with essay score than clausal complexity indices. Considering that phrasal
sophistication indices were generally stronger than clausal complexity indices, the area of
phrasal sophistication may yield even stronger results. In this chapter, indices of syntactic
complexity and sophistication were used to model holistic essay scores. Future research should
focus on using these indices to model analytic syntactic development scores, which may help to
avoid some of the measurement error associated with holistic scores.
4.5 Conclusion
This chapter has tested and validated the newly developed indices of fine-grained clausal
and phrasal complexity and clausal sophistication. The newly developed TAASSC indices
outperform traditional indices of syntactic complexity such as mean length of clause in
explaining the variance in TOEFL independent essay scores. In addition to validating fine-

112
grained complexity indices and indices of syntactic sophistication, this study suggests that
syntactic variation (as measured using standard deviations) are useful indicators of writing
proficiency.
5 LONGITUDINAL SYNTACTIC DEVELOPMENT
Syntactic development has been of interest to the field of L2 writing (and SLA) for over 45
years. Much of the research in this area has focused on a small number of relatively large-
grained indices (e.g., mean length of clause, mean length of T-unit). The results, however, have
been mixed (e.g., Ortega, 2003; Wolfe-Quintero et al., 1998), resulting in a lack of consensus
regarding how L2 syntax develops. Additionally, most syntactic development studies have
adopted cross-sectional designs (e.g., Lu, 2011), and most longitudinal studies have tracked
development over a relatively short period of time (e.g., one semester; Crossley & McNamara,
2014; c.f., Knoch et al., 2014). This chapter re-examines L2 syntactic development using both
established indices of syntactic complexity and newly developed, fine-grained indices of
syntactic complexity and sophistication, which are implemented in the freely available Tool for
the Automatic Analysis of Syntactic Sophistication and Complexity (TAASSC). Specifically,
longitudinal development is measured with regard to two student populations who differ with
regard to age, context, time of data collection, and writing genre. Furthermore, this study
examines syntactic development over a relatively long period of time (1-2 years). Traditional
large-grained (e.g., mean length of clause) indices of syntactic complexity, in addition to newly
developed fine-grained clausal and phrasal indices of syntactic complexity and frequency-based
indices of syntactic sophistication are used to determine how L2 syntax develops over time.
This chapter is guided by research questions 1b-5b:

113
1b. What is the relationship between the Syntactic Complexity Analyzer indices and
longitudinal writing development?
2b. What is the relationship between fine-grained indices of clausal complexity and
longitudinal writing development?
3b. What is the relationship between fine-grained indices of phrasal complexity and
longitudinal writing development?
4b. What is the relationship between usage-based indices of syntactic sophistication
longitudinal writing development?
5b. What is the relationship between all syntactic development indices included in TAASSC
and longitudinal writing development?
5.1 Method
5.1.1 Indices
For this analysis, two sets of indices were used. First, to address research question 1b,
indices included in the syntactic complexity analyzer, which represents syntactic complexity
indices commonly used in L2 writing research (e.g., mean length of T-unit) were used to
measure syntactic development (see Chapter 3 for an in-depth treatment of these indices). To
address research questions 2b-5b, the nine component scores included in TAASSC were used
(see Chapter 3 for an in-depth description of these components).
5.1.2 Learner corpora
Two small longitudinal learner corpora were used to analyze the relationship between
indices of syntactic development and writing development with regard to time spent studying
English. The use of longitudinal corpora in this chapter complements the use of a larger cross-

114
sectional corpus in Chapter 4. Cross-sectional learner corpora allow for the analysis of a
relatively large number of texts that represent a wide range of proficiency levels, which may
increase the generalizability of the results. Longitudinal corpora tend to be smaller due to factors
such as attrition (Mackey & Gass, 2005), but allow one to control for the random effects
introduced by individual differences between writers. In a longitudinal corpus, such effects
become fixed because individual variability can be accounted for (since we have multiple
samples from the same individuals; Winter, 2013). Each learner corpus used is described below.
5.1.2.1 Salsbury written corpus
The Salsbury written corpus (Salsbury, 2000) consists of 337 unstructured, untimed free
writes (totaling 63,700 words) written by 6 L2 English language learners enrolled in an Intensive
English Program at an American university. The free writes were collected over the course of
one year. Free writes were collected from the participants every one to two weeks, and the
average length of time between the first and last collected texts is 49.33 weeks. Of the six
participants, three were L1 Arabic users, one was an L1 Spanish user, one was an L1 Japanese
user, and the remaining participant was an L1 Korean user. Participants chose to write on a
number of topics over the course of the year, ranging from descriptions of their daily life to
argumentative treatments of controversial issues. See Table 5.1 for an overview of this corpus.
Table 5.1 Overview of Salsbury written corpus data
Name L1 Gender Number of
Texts Collected
Weeks Between First and Last Text
Number of Words
Collected
Average Number of Words per
Text EunHui Korean Female 89 50 13,072 146.88 Faisal Arabic Male 39 49 6,305 161.67 Jalil Arabic Female 43 47 10,400 241.86 Kamal Arabic Male 26 50 4,389 168.81 Marta Spanish Female 53 50 11,574 218.38 Takako Japanese Female 87 50 17,960 206.44

115
Institutional TOEFL examinations were administered every two months during the
collection period. The entire cohort of six participants were present for four of the
administrations of the TOEFL. A repeated measures ANOVA indicated that a significant
positive linear relationship existed between time and TOEFL scores (p = .001, η2 p = .889).
Figure 5.1 includes an overview of the TOEFL data.
Figure 5.1 Increase in TOEFL scores over time (Salsbury)
For the purposes of this chapter, a subcorpus was created. The subcorpus was comprised
of ten weeks in which each participant submitted at least one free write. During the fall semester
(Weeks 1-15), collection points were 3 weeks apart. During the spring and summer semesters
collection points ranged from 5-7 weeks apart. All free writes from a particular participant for
each week were included as a single .txt file. In two cases, free writes from an adjacent week
were used. Faisal’s free writes from week 2 were counted as week 3 and his free writes from
30
32
34
36
38
40
42
44
46
48
50
1 2 3 4
Faisal Kamal Jalil Takako Marta EunHui Mean

116
week 44 were counted as week 43. An average of 4,383 words were collected each week, and in
total 26,298 words were collected. See Table 5.2 for a summary of this data.
Table 5.2 Number of words collected per participant in Salsbury subcorpus Time Week EunHui Faisal Jalil Kamal Marta Takako 1 3 442 401 326 118 328 290 2 6 143 291 193 201 205 354 3 9 643 280 544 143 506 566 4 12 529 801 588 101 266 525 5 15 176 846 1022 257 300 513 6 21 461 440 540 157 746 1300 7 26 281 586 374 232 492 230 8 34 259 293 519 305 260 263 9 43 288 141 510 355 412 2202 10 50 258 1114 488 342 268 284 Total 3480 5193 5104 2211 3783 6527
5.1.2.2 Verspoor longitudinal corpus
The Verspoor longitudinal corpus (Verspoor et al., 2012) includes essays written by nine
Dutch students at a competitive secondary school in the Netherlands over two years. Essays were
collected three times per year, for a total of six essays per student. Essays were completed using
a computer and were untimed, but limited to 1000 characters. All participants wrote on the same
topic for a particular collection point, but were novel at each collection point. Each prompt was
designed in a manner that avoided the need for specialized language. See Table 5.3 for a list of
the topics used.

117
Table 5.3 Essay topics in the Verspoor longitudinal corpus Essay Prompt 1 Write a short story about your new school, friends and teachers.
2 Pretend you have a foreign pen-pal. Tell him/her about your favorite holiday and explain what you find so special about it.
3 Write about the most awful (or best) thing that happened to you at school so far. It does not have to be truthful.
4 Write a short story about the most awful (or best) thing that happened to you during summer vacation. It does not have to be truthful.
5 Pretend you have just won 1000 euros. Write a short story about what you would do with the money.
6 Pretend your school principal has stated that from now on anyone should wear a school uniform. Write him/her a short letter to explain why you agree/do not agree with this new rule.
Each essay was also assigned a holistic proficiency score, which ranged from 0-7. Raters
included 8 experienced ESL teachers. Raters were split into two groups, who evaluated essays
based on a holistic rubric created iteratively for the dataset. If three of four raters agreed on a
particular score, the score was kept. The score for any essay that did not receive the same score
from three of the four raters was then adjudicated by the raters until sufficient agreement was
reached (Verspoor et al., 2012). Table 5.4 includes an overview of the essays included in the
Verspoor longitudinal corpus.
Table 5.4 Overview of Verspoor longitudinal corpus data
Participant Gender Average Score Number of Words Collected
Average number of words
Anneke Female 3.833 1030 171.667 Aart Male 4.500 1057 176.167 Betje Female 4.333 1239 206.500 Corrie Female 4.167 1257 209.500 Drika Female 4.000 1001 166.833 Elke Female 4.000 974 162.333 Fenna Female 4.167 1087 181.167 Gertruida Female 4.333 966 161.000 Braam Male 3.833 1202 200.333 Average N/A 4.130 1090.333 181.722

118
A repeated measures analysis of variance (RM ANOVA) indicated a significant positive
linear relationship between time and holistic essay scores (p < .001, η2 p = .823). This indicates
that the participants’ writing proficiency increased over the two-year time period. Figure 5.2
includes an overview of this data.
Figure 5.2 Increase in holistic scores over time in Verspoor longitudinal corpus
5.1.3 Statistical analyses
In order to determine whether linear development occurred over time with regard to the
syntactic variables of interest, repeated measure analysis of variance (RM ANOVA) statistics
were performed. Normality of the data was first checked, and any indices that violated this
assumption were removed from the analysis. In most cases, this occurred due to extremely
skewed data. Second, the variables of interest were checked for multicollinearity to ensure that
1.00
2.00
3.00
4.00
5.00
6.00
7.00
1 2 3 4 5 6
Anneke Aart Betje Corrie Drika
Elke Fenna Gertruida Braam Mean

119
only unique variables were being considered. The remaining variables were entered into a RM
ANOVA.
5.2 Results and Discussion
5.2.1 Research Question 1b results: Syntactic Complexity Analyzer
5.2.1.1 Salsbury corpus results: Syntactic Complexity Analyzer
Eight of the 14 SCA indices met the assumption of approximate normality. Two groups
of indices demonstrated strong collinearity. The first group included mean length of T-unit
(MLT), mean length of sentence (MLS), clauses per T-unit (C/T) and dependent clauses per
clause (DP/C). The second group included coordinate phrases per clause (CP/C) and coordinate
phrases per T-unit (CP/T). MLT was selected from the first group in order to maximize
comparisons with other studies, while CP/C was selected from the second group in order to
permit clear comparisons with complex nominals per clause (CN/C). See Table 5.5 for
descriptive statistics for the selected indices.

120
Table 5.5 Salsbury corpus: Mean (standard deviation) for selected SCA indices at each collection point Index T1 T2 T3 T4 T5 T6 T7 T8 T9 T10 Mean length of T-unit
9.857 11.251 10.324 12.090 13.927 12.440 13.574 14.054 13.512 15.888 (2.171) (2.853) (2.993) (4.079) (5.468) (3.892) (3.231) (2.730) (3.204) (3.065)
T-units per sentence 1.098 1.096 1.111 1.082 1.043 1.248 1.194 1.187 1.167 1.121 (0.131) (0.106) (0.048) (0.141) (0.084) (0.253) (0.214) (0.184) (0.103) (0.069)
Complex nominals per clause
0.611 0.659 0.541 0.687 0.657 0.543 0.703 0.628 0.852 0.785 (0.169) (0.197) (0.151) (0.205) (0.223) (0.146) (0.135) (0.092) (0.409) (0.206)
Coordinate phrases per clause
0.143 0.157 0.197 0.148 0.169 0.164 0.130 0.166 0.142 0.143 (0.074) (0.079) (0.075) (0.069) (0.122) (0.079) (0.076) (0.076) (0.059) (0.091)

121
Repeated measures analysis of variance (RM ANOVA) statistics were then conducted
using the four selected indices (MLT, T/S, CP/C, and CN_C). The results indicate a positive,
significant linear relationship between time and two indices: MLT (p < .001, η2 p = .960) and T/S
(p = .023, η2 p = .676). The results also indicated that a positive (but non-significant) linear
relationship was observed between time and CN/C (p = .078, η2 p = .495). No significant linear
relationship was observed between time and CP/C (p = .301, η2 p = .057). The effects for MLT,
T/S, and CN/C were large, while the effect for CP/C was small. See Table 5.6 for a summary of
the data.
Table 5.6 Repeated measure analysis of variance results for SCA variables Index F p η2
p Mean length of T-unit 118.826 < .001 .960 T-units per sentence 10.455 .023 .676 Complex nominals per clause 4.905 .078 .495 Coordinate phrases per clause .301 .607 .057
5.2.1.2 Verspoor corpus results: Syntactic Complexity Analyzer
Ten of the 14 SCA indices met the assumption of approximate normality.
Multicollinearity was an issue in this data set as well. Four, non-collinear indices emerged from
the analysis (mean length of T-unit, mean length of clause, clauses per sentence, and complex
nominals per sentence. See Table 5.7 for descriptive statistics for the selected indices.
Table 5.7 Verspoor corpus: Mean (standard deviation) for selected SCA indices at each collection point Index T1 T2 T3 T4 T5 T6
Mean length of T-unit 9.697 10.364 11.474 11.404 13.321 12.843 (2.043) (1.654) (3.779) (2.719) (2.556) (1.811)
Mean length of clause 7.023 7.012 6.435 6.913 7.944 6.936 (1.954) (0.488) (0.531) (1.020) (1.346) (0.909)
clauses per sentence 1.968 1.726 2.358 2.207 2.055 2.154 (1.311) (0.324) (0.938) (0.595) (0.620) (0.357)
complex nominals per clause
0.489 0.483 0.480 0.413 0.523 0.548 (0.109) (0.186) (0.158) (0.099) (0.113) (0.173)

122
Repeated measures analysis of variance (RM ANOVA) statistics were then conducted
using these four indices. The results indicated that a significant positive linear relationship
existed between time and the mean length of T-unit (p = .005, η2 p = .640). See Table 5.8 for a
summary of the results.
Table 5.8 Repeated measure analysis of variance results for SCA variables Index F p η2
p Mean length of T-unit 14.199 .005** .640 Mean length of clause .757 .410 .086 clauses per sentence .727 .419 .083 complex nominals per sentence .620 .454 .072 Note. * indicates p < .05, ** indicates p < .01
5.2.2 Research Question 1b discussion: Syntactic Complexity Analyzer
Between the two studies conducted, linear relationships were found between time and
two SCA variables. Each index of syntactic development is discussed below.
5.2.2.1 Mean length of T-unit
A positive, linear relationship between time spent studying English as a second/foreign
language and mean length of T-unit was found in both the Salsbury written longitudinal corpus
(p < .001, η2 p = .960) and the Verspoor longitudinal corpus (p = .005, η2
p = .640). Over a one-
year period, the ESL students in the Salsbury corpus on average made gains of six words per T-
unit (from 9.857 to 15.888). During week 3 (the first collection point) for example, Jalil averaged
10.866 words per T-unit. As can be seen in the examples in Table 5.9, her T-units are not
uniform, and include both relatively short and relatively long T-units. By week 50 (the final
collection point), Jalil averages 16.828 words per T-unit. T-unit length still varies, but very short
T-units are much less common.

123
Table 5.9 Examples from the Salsbury corpus: Mean length of T-unit Collection point
Example Length of T-unit
T1 (Week 3)
In this weekend I am very happy because I am going out of the Indiana with my friend Kevin. 19
He is an American friends. 5 He is a nice boy to speak. 6 Mean = 10 T10 (Week 50)
The man kind always imagine what he would like to do or where he will visit in the future. 19
Some body thinking about his plan for job in future. 10 Mean = 15 Note. Examples at each collection point represent contiguous sentences.
The EFL students in the Verspoor corpus on average made gains of three words per T-
unit (from 9.697 to 12.843) over a two-year period. For example, Anneke wrote an average of
8.833 words per T-unit at the beginning of the first year, but by the end of the second year wrote
an average of 12.933 words per T-unit for a gain of 4 words per T-unit. Table 5.10 includes
examples of the types of T-units written by Anneke at the first and last collection points. Anneke
uses both relatively short and relatively long T-units in her writing both at the beginning of the
study and at the end. At the first collection point, Anneke wrote a number of relatively short T-
units that were comprised of simple sentences or clauses in compound sentences with few
modifiers (e.g., I often buy toast.), but also wrote longer T-units with more modifiers (e.g., I
don’t like lessons of biology and geography). By the end of the second year of study, she is using
more modifiers and complex verb phrases, which results in longer T-units.

124
Table 5.10 Examples from the Verspoor corpus: Mean length of T-unit Collection point
Example Length of T-unit
T1 I don't like lessons of biology and geography. 8 With gymnastics we go to a other gym hall 9 [and] in the winter it's cold to go cycle to there. 10 In the break you can buy candy or bread. 9 I often buy a toast. 5 Mean = 8.2 T6 I think some people won't be happy after a while, and maybe
feel down. 14
They think the uniforms look nicer when other people wear it 11 [and] they can't let other people see how they really are. 10 Mean = 11.7 Note. Examples at each collection point represent contiguous sentences.
On average, students in both corpora increased the length of their T-units in a relatively
linear fashion, though peaks and valleys existed. This general trend held true among a number of
students in each study, but some students did not follow this pattern. Figure 5.3 comprises a line
graph with the average mean length of T-unit score at each collection point in the Salsbury
corpus plotted with each student’s score. This demonstrates that although some students (such as
EunHui and Takako) developed in a relatively consistent manner, others (such as Kamal and
Marta) did not. Marta, for example, made a steady rise to her highest score for mean length of T-
unit (23.077) at collection point five (week 15), but then also made a steady decline, and finished
at 15.764 words per T-unit. Figure 5.4, which provides the average mean length of T-unit score
plotted with actual scores for each student in the Verspoor corpus shows a similar pattern. Drika
and Lysanne, for example, follow a relatively linear trend. Other students, such as Gertruida and
Braam, however, peak at collection point three, but end with an average of four words fewer per
T-unit by the final collection point. This suggests that the syntactic development with regard to
T-unit length use is not strictly linear.

125
Figure 5.3 MLTU (Salsbury)
5
7
9
11
13
15
17
19
21
23
25
0 2 4 6 8 10
EunHui Faisal Jalil Kamal Marta Takako Average

126
Figure 5.4 MLTU (Verspoor)
Overall, the results with regard to MLTU align with previous (mostly cross-sectional)
studies (e.g., Ortega, 2003) in that MLTU increased as a function of time spent studying English
(c.f., Knoch et al., 2014). The findings also support Ortega’s (2003) suggestion that ESL students
may achieve larger gains in a shorter amount of time than EFL students. The participants in the
Salsbury corpus, for example, on average wrote 6.031 more words per T-unit after one year of
study in an ESL context. In comparison, the participants in the Verspoor corpus averaged 3.146
more words per T-unit after two years of study. In addition to context of study, the differences in
gains may be due to factors such as age, hours per week studied, and motivation.
5.2.2.2 T-units per sentence
A positive, linear relationship between time spent studying English as a second/foreign
language and mean length of T-unit was found in the Salsbury corpus (p = .023, η2 p = .676). As
6
8
10
12
14
16
18
20
1 2 3 4 5 6
Anneke Aart Betje Corrie Drika
Elke Fenna Gertruida Braam Mean

127
students spent more time studying, they tended to include more T-units per sentence. Jalil, for
example, had an average of one T-unit per sentence at the second collection point (week six). As
shown in Table 5.11, which shows examples of Jalil’s writing near the beginning and the end of
the year, Jalil tended to use simple and complex sentences (which are comprised of a single T-
unit) but avoided using compound sentences (which include at least two T-units). By collection
point nine (week 43) she had increased to 1.333 T-units per sentence through the inclusion of
compound/complex sentences.
Table 5.11 Examples from the Salsbury corpus: T-units per sentence Collection point
Example T-units per sentence
T2 (Week 6)
Yesterday is nice day for me because The sky is raining and no sunny. 1
I like the rain because I remember my country. 1 T9 (Week 43)
In your thinking you can not imagine how many people die per hour because of smoking and how many person die per day because they set in smoking places.
2
If I can do something, the first thing I will do it is ban the smoking from all the public places and try to help the people how to quit this big problem.
2
Note. Examples at each collection point represent contiguous sentences.
Figure 5.6 includes the average score for T-units per sentence plotted with each students’
score. This trend was relatively linear for most students, though peaks and valleys did exist (see,
for example the trajectories of Takako and Kamal). The exception to the general trend was again
Marta, who at collection points six through eight (weeks 21-34) had her highest number of T-
units per sentence (between 1.5 and 1.7), but then fell to 1.333 at the final collection point.

128
Figure 5.5 T-units per sentence (Salsbury)
The positive, significant trend for the index T-units per sentence is surprising in light of
previous studies. Of the five studies reviewed that employed the index (Cooper, 1976; Homburg,
1984; Ishikawa, 1995; Lu, 2011; Monroe, 1975), only Monroe’s study of the development of
second language French reported a significant relationship. Monroe found that clausal
coordination decreased with proficiency, while in the Salsbury corpus clausal coordination
increased with proficiency. Further research is warranted to determine the factors that contribute
to this finding.
0.8
0.9
1
1.1
1.2
1.3
1.4
1.5
1.6
1.7
1.8
0 2 4 6 8 10
EunHui Faisal Kamal Jalil Marta Takako Average

129
5.2.3 Research Questions 2b-5b results: Other TAASSC index types
5.2.3.1 Salsbury corpus results: Other TAASSC index types
To address research questions 3b-5b, repeated measure analysis of variance (RM
ANOVA) statistics were used to determine whether a linear relationship existed between time
studying English and indices of fine-grained clausal complexity, fine-grained phrasal
complexity, and syntactic sophistication. TAASSC includes 353 indices related to these
constructs. To meet the expectations of the statistical analyses used to examine the relationship
between TAASSC indices and time (i.e., repeated measures ANOVA), the nine component
scores outlined in Chapter 3 were used. All indices demonstrated a roughly normal distribution.
None of the components demonstrated multicollinearity. See Table 5.12 for descriptive statistics
for the selected indices.

130
Table 5.12 Salsbury corpus: Mean (standard deviation) for component scores at each collection point Index T1 T2 T3 T4 T5 T6 T7 T8 T9 T10 Noun phrase elaboration
-0.939 -1.733 -3.061 0.977 0.012 -2.529 -1.018 0.178 4.670 3.442 (8.905) (4.914) (4.836) (8.651) (5.440) (4.679) (5.219) (3.947) (10.385) (5.531)
Verb-VAC frequency
4.010 1.555 2.317 -1.001 0.060 1.830 -3.839 -1.188 -0.849 -2.895 (4.298) (5.004) (3.829) (3.142) (4.543) (2.913) (6.852) (5.695) (8.084) (1.650)
Nouns as modifiers and modifier variation
0.659 -1.984 -0.664 1.848 -0.291 0.557 -0.229 0.727 -0.707 0.083
(5.207) (1.189) (2.338) (4.139) (2.527) (1.927) (3.164) (1.093) (2.965) (2.375)
Determiners -2.370 0.842 0.003 0.074 1.248 0.487 0.097 -0.774 -1.395 1.788 (3.304) (3.606) (3.260) (3.756) (2.289) (3.517) (2.706) (3.917) (4.171) (2.792)
VAC frequency and direct objects
-0.785 0.686 -0.043 1.025 1.072 0.824 0.165 -2.608 -0.679 0.342 (1.939) (2.879) (2.622) (3.236) (1.732) (3.258) (1.729) (4.610) (2.404) (1.095)
Association Strength
0.654 -1.947 -1.412 1.114 -0.294 0.354 0.035 1.369 0.961 -0.834 (5.187) (1.851) (1.598) (2.733) (1.613) (2.010) (1.871) (2.138) (2.062) (1.426)
Diversity and Frequency
-0.928 1.405 -0.436 0.405 -0.058 -1.526 -0.070 0.319 -0.008 0.897 (4.840) (2.711) (1.640) (3.633) (2.998) (2.044) (0.619) (1.569) (2.555) (2.202)
Possessives 0.101 0.524 1.770 -0.210 0.940 -0.168 0.250 0.281 -1.141 -2.345 (3.564) (2.880) (4.051) (1.134) (1.389) (1.105) (1.429) (1.093) (1.303) (1.338)
Frequency 0.689 0.949 0.233 -0.574 0.894 0.877 0.676 -1.115 -0.607 -2.022 (1.808) (2.259) (2.792) (2.690) (1.309) (2.313) (2.086) (1.829) (2.980) (2.164)

131
RM ANOVA statistics were conducted using the nine TAASSC component indices. The
results indicated that significant negative linear trends with large effects existed between time
and verb-VAC frequency (p = .010, η2 p = .768), and possessives (p = .035, η2
p = .624). See
Table 5.13 for a summary of the results.
Table 5.13 Repeated measure analysis of variance results for TAASSC component indices Index F p η2
p Noun phrase elaboration 3.011 .143 .376 Verb-VAC frequency 16.595 .010* .768 Nouns as modifiers and modifier variation .065 .810 .013
Determiners 1.107 .341 .181 VAC frequency and direct objects 1.925 .224 .278
Association Strength .437 .538 .080 Diversity and Frequency .166 .701 .032 Possessives 8.282 .035* .624 Frequency 3.246 .131 .394 Note. * indicates p < .05
5.2.3.2 Verspoor corpus results: Other TAASSC index types
To address research questions 2b-5b, repeated measure analysis of variance (RM
ANOVA) statistics were used to determine whether a linear relationship existed between time
studying English and indices of fine-grained clausal complexity, fine-grained phrasal
complexity, and syntactic sophistication. TAASSC includes 353 indices related to these
constructs. To meet the expectations of the statistical analyses used to examine the relationship
between TAASSC indices and time, the nine component scores, which are described in Chapter
3, were used. All indices demonstrated a roughly normal distribution. None of the components
demonstrated multicollinearity. See Table 5.14 for descriptive statistics for the selected indices.

132
Table 5.14 Verspoor corpus: Mean (standard deviation) for component scores at each collection point Index T1 T2 T3 T4 T5 T6 Noun phrase elaboration
-1.306 2.075 0.948 1.425 -2.110 -1.033 (3.132) (4.828) (4.201) (5.606) (4.132) (6.186)
Verb-VAC frequency 5.344 4.177 -0.003 -1.704 -4.557 -3.258 (4.771) (3.771) (4.656) (1.683) (3.456) (3.158)
Nouns as modifiers and modifier variation
-0.410 0.144 0.131 -0.463 -0.204 0.801
(2.857) (2.550) (2.248) (2.805) (2.692) (2.946)
Determiners -0.841 1.596 0.648 1.271 -1.753 -0.921 (1.964) (3.760) (3.157) (3.528) (2.156) (2.671)
VAC frequency and direct objects
2.698 -1.210 0.126 -2.090 -0.444 0.919 (3.032) (1.902) (2.185) (1.709) (3.301) (2.178)
Association Strength -1.737 -0.556 1.727 0.816 -0.133 -0.118 (3.401) (2.514) (1.989) (2.630) (1.513) (2.056)
Diversity and Frequency
-1.494 -0.689 -0.345 1.491 0.968 0.070 (2.080) (2.252) (2.464) (1.459) (0.963) (1.415)
Possessives 0.207 0.293 -0.713 1.667 -0.658 -0.797 (2.781) (2.851) (1.370) (2.589) (1.439) (1.850)
Frequency 1.538 0.408 0.226 -1.571 -0.837 0.236 (1.858) (2.743) (1.075) (2.624) (1.419) (1.486)
Repeated measures analysis of variance (RM ANOVA) statistics were then conducted
using the nine TAASSC component indices. The results indicated that significant negative linear
trends with large effects existed between time and verb-VAC frequency (p < .001, η2 p = .855),
diversity and frequency (p = .014, η2 p = .551) and frequency (p = .019, η2
p = .518). See Table
5.15 for a summary of the results.

133
Table 5.15 Repeated measure analysis of variance results for TAASSC component indices Index F p η2
p Noun phrase elaboration .521 .491 .061 Verb-VAC frequency 47.295 .000** .855 Nouns as modifiers and modifier variation .260 .624 .031
Determiners 1.349 .279 .144 VAC frequency and direct objects 1.803 .216 .184
Association Strength .974 .353 .109 Diversity and Frequency 9.798 .014* .551 Possessives .839 .386 .095 Frequency 8.608 .019* .518 Note. * indicates p < .05; ** indicates p < .001
5.2.4 Research Questions 2b-5b discussion: Other TAASSC index types
In order to address Research Questions 3b-6b, RM ANOVA statistics were conducted to
determine if a linear relationship existed between any of the TAASSC component scores and
time spent studying English. Significant linear results were observed for three components,
including the possessives component, the diversity and frequency component, and the frequency
component. The results varied according to learner corpus, and are discussed in detail below.
5.2.4.1 Discussion: Verb-VAC frequency
A significant negative linear trend was observed between time spent studying English and
the verb-VAC frequency component in both the Salsbury corpus (p = .010, η2 p = .768) and the
Verspoor corpus (p < .001, η2 p = .855). Figure 5.6 and Figure 5.7 show the trends for each index
included in the component in the Salsbury and Verspoor data, respectively. In both datasets, all
indices follow a similar trend over time, suggesting component convergence.

134
Figure 5.6 Trends for indices included in the Verb-VAC frequency component (Salsbury)
-1.5
-1
-0.5
0
0.5
1
1.5
1 2 3 4 5 6 7 8 9 10
average lemma construction combination frequency - all
average lemma frequency - all
average lemma construction combination frequency, log transformed - all (standard deviation)
average lemma frequency, log transformed – all (standard deviation)
average lemma construction combination frequency, log transformed - all
nominal complements per clause
average lemma frequency (types only) - all
adjective complements per clause
Component

135
Figure 5.7 Trends for indices included in the Verb-VAC frequency component (Verspoor)
The results suggest that as individuals spend time studying English, they tend to use less
frequent verb-VAC combinations. In the Salsbury corpus, Marta’s free writes from the first
collection point (week 3) have an average verb-VAC combination frequency score of
-1.5
-1
-0.5
0
0.5
1
1.5
1 2 3 4 5 6
average lemma construction combination frequency - all
average lemma frequency - all
average lemma construction combination frequency, log transformed - all (standard deviation)
average lemma frequency, log transformed – all (standard deviation)
average lemma construction combination frequency, log transformed - all
nominal complements per clause
average lemma frequency (types only) - all
adjective complements per clause
Component

136
315,730.121, which is near the mean. Table 5.16 includes example sentences from Marta, and
Table 5.17 includes frequency information for each VAC in the examples. Early in the study,
Marta uses some relatively low-frequency verb-VAC combinations (see examples 1a, 2a, and 3).
However, she also uses a large percentage of high-frequency verb-VAC combinations (see
example 1b). By the final collection point, however, Marta’s writing is characterized by lower
frequency verb-VAC combinations. She still uses high frequency verb-VAC combinations as in
example 4, but verb-VAC combinations such as those in example 5 are much more common.
Table 5.16 Examples from Marta, T1 (week 3) and T10 (week 50)
T1 (week 3)
Ex. 1 (2 VACs)
Ex. 2 (2 VACs)
Ex. 3 (1 VAC)
T10 (week 50)
Ex. 4 (1 VAC)
Ex. 5 (2 VACs)

137
Table 5.17 Examples from the Salsbury corpus: Verb-VAC combination frequency Collection point
Example Verb VAC Frequency
T1 (week 3) Ex. 1a think nsubj-v-ccomp 80,783
Ex. 1b be nsubj-v-acomp 1,328,596
Ex. 2a think nsubj-v-ccomp 80,783 Ex. 2b put nsubj-v-acomp 10 Ex. 3 eat prep_in-nsubj-v-dobj 43 T10 (week 50) Ex. 4 be nsubj-v-acomp 1,328,596
Ex. 5a have nsubj-v-dobj 212,970 Ex. 5b convince nsubj-v-dobj 321
These results provide support for usage-based theories of language development
(Behrens, 2009; Ellis, 2002a; Tomasello, 2003). Usage-based theories suggest that frequency is
the driving force in language learning: More frequently occurring items in the input will be
learned earlier/more easily than less frequent items. This seems to be evidenced in the results
across writing types (free writes vs. essays), instructional settings (ESL vs. EFL), and ages
(middle-school students vs. adults). Learners tend to use more frequent verb-VAC combinations,
which are hypothesized to be easier to learn, near the beginning of each study, but after exposure
to English tend to use less frequent verb-VAC combinations, which are hypothesized to be more
likely to be learned at later stages of development. Previous studies (Ellis & Ferreira-Junior,
2009b; Lieven et al., 1997) have demonstrated this phenomenon in oral modes, with regard to a
small set of VACs, and with a small amount of input recorded. This study has indicated that
usage-based theories of language acquisition are evident in written modes, and across a
comprehensive set of VACs. This study has also suggested that reference corpus frequencies are
workable proxies for language learner input (see also Römer et al., 2015, 2014). A strong

138
relationship between COCA frequencies and language development was found, suggesting (from
a usage-based perspective) that the frequency profiles of VACs experienced by the participants
in each study is comparable to those in COCA.
Although a significant negative linear trend was observed between time spent studying
English and the verb-VAC frequency component, individual results varied somewhat for
individuals in each dataset. Figure 5.8 and Figure 5.9 include individual component scores
plotted with the mean component score at each time point for the Salsbury and Verspoor corpora
respectively. This data suggests that although participants generally use less frequent verb-VAC
combinations, the pattern is not strictly linear, which may be explained by theories related to
Complex Systems (Larsen-Freeman & Cameron, 2008; Larsen-Freeman, 1997). In the Salsbury
corpus, for example (see Figure 5.8), pronounced peaks and valleys can be seen in the values for
each participant. In particular, at collection point one (week 3), Faisal’s scores for the verb-VAC
frequency component generally follow a negative trend until collection point seven (week 26).
Between collection points seven and nine, however, his scores rise sharply, followed by a decline
for collection point ten. Similar (but less pronounced) trends can be found in the Verspoor
corpus. The component scores for some participants, such as Bram and Drika follow a consistent
negative trend, but others have scores that are much more erratic. Eike, for example, begins the
study with component scores near the mean. At the second collection point she reaches a high
point, followed by her lowest overall component score at collection point 3, after which she
maintains relatively stable scores.

139
Figure 5.8 Verb-VAC frequency component results (Salsbury)
Figure 5.9 Verb-VAC frequency component results (Verspoor)
-15
-10
-5
0
5
10
15
1 2 3 4 5 6 7 8 9 10
EunHui Faisal Jalil Kamal Marta Takako Mean
-15
-10
-5
0
5
10
15
1 2 3 4 5 6Anneke Aart Betje Corrie Drika
Elke Fenna Gertruida Braam Mean

140
5.2.4.2 Discussion: Diversity and frequency
In the Verspoor corpus (but not in the Salsbury corpus), a significant positive linear trend
was observed for the diversity and frequency component (p = .014, η2 p = .551). Figure 5.10
shows the trends for each index included in the component. The three TTR indices in the
component, follow similar positive trends. The index average lemma construction frequency
(types only), however, followed a negative trend, demonstrating non-convergence in the
component. Further discussion of this component will focus on the three TTR indices that are
representative of the component scores.

141
Figure 5.10 Indices included in the diversity and frequency component (Verspoor)
The results suggest that as individuals spend time studying English, they tend to produce
more diverse VACs, main-verb lemmas, and verb-VAC combinations. At the first collection
point, participants averaged a VAC TTR of .707, indicating that approximately 30% of VAC
instances are repeated. Of the 203 VAC instances written by the Dutch students at the first
collection point, 34.5% of the tokens are nsubj-v-acomp (13.3%), nsubj-v-ncomp (10.8%), or
nsubj-v-dobj (10.3%), while 42.4% comprise VAC tokens that only occur once. By collection
-1.5
-1
-0.5
0
0.5
1
1.5
1 2 3 4 5 6
constructiontype-tokenratio- all
mainverblemmatype-tokenratio- all
lemmaconstructioncombinationtype-tokenratio- all
averagelemmaconstructionfrequency(typesonly)- all
Component

142
point four participants averaged a VAC TTR of .891, indicating that only approximately 11% of
VAC instances are repeated. Of the 238 VAC tokens written by Dutch students at collection
point 4, only 14.3% of the tokens are nsubj-v-acomp (6.3%), nsubj-v-ncomp (2.9%), or nsubj-v-
dobj (5.0%), while 61.3% comprise VAC tokens that only occur once. By the final collection
point, the average drops to .818, indicating that approximately 18% of VAC instances are
repeated. Overall, this suggests that as individuals spend time studying English, they tend to rely
less on “teddy bear” (Ellis & O’Donnell, 2014) VACs such as copular constructions (i.e., nsubj-
v-acomp and nsubj-v-ncomp) and monotransitives (e.g., nsubj-v-dobj) to express their ideas, and
use a wider variety of VACs. However, this trend was not observed in both corpora, suggesting
that this finding may be context specific. Future research in this area is warranted.
Although a significant positive linear trend was observed between time spent studying
English and the diversity and frequency component, individual results varied somewhat for
individuals in each dataset. Figure 5.11 includes individual component scores plotted with the
mean component score at each time point. Some students (e.g., Aart and Braam), follow
relatively linear positive trends. Others, such as Betje and Gertruida, however, clearly do not.

143
Figure 5.11 Diversity and frequency component results (Verspoor)
5.2.4.3 Discussion: Possessives
In the Salsbury corpus (but not the Verspoor corpus), a significant negative linear trend
was observed between time spent studying English and the use of possessive noun modifiers (p =
.035, η2 p = .624). Figure 5.12 shows the trends for each index included in the component. All
component indices follow a similar trend over time, suggesting component convergence.
-6
-5
-4
-3
-2
-1
0
1
2
3
4
5
1 2 3 4 5 6
Anneke Aart Betje Corrie Drika
Elke Fenna Gertruida Braam Mean

144
Figure 5.12 Trends for indices included in the possessives component (Salsbury)
The results suggest that near the beginning of the year studying English, the students used
more possessives, and as the year progressed they used fewer. EunHui, for example, used
possessives (e.g., my country’s peoples, their family) relatively frequently during the first
collection period (Week 3), and uses very few at collection points nine and ten (weeks 43 and
50) near the end of the year. See Table 5.18 for examples of the types of nominal phrases written
by EunHui at the beginning and end of the year. To some degree, the results align with Biber et
al.’s (2011) proposed complexity developmental stages. Biber et al. suggest that one
characteristic of intermediate level writing (i.e., stage 3 of 5) is possessive nouns as premodifiers,
which are a feature of fiction writing. Within this framework, it could be hypothesized that
individuals in the Salsbury corpus began at an intermediate level of proficiency and moved
toward more academic and higher proficiency writing. A potentially complementary explanation
-1.5
-1
-0.5
0
0.5
1
1.5
1 2 3 4 5 6 7 8 9 10
possessives per nominal possessives per nominal subject
possessives per direct object possessives per object of the preposition
Component

145
for the change in use of possessives is the different registers/genres used in EunHui’s writing.
During week 3, she discusses her thoughts and feelings regarding daily life as she adjusts to
living in a new country. During weeks 43 and 50, however, she addresses argumentative topics,
which she addresses in a less personal manner. What is not clear, however, is whether her shift
from writing that is more characteristic of fiction to more academic topics is due to an increase in
proficiency or an unrelated shift in genre. At some points in the study, for example, it is apparent
that some participants used their free writes as a site for practicing essays that were assigned by a
teacher. Furthermore, this trend was not observed in the Verspoor corpus, suggesting that this
finding may be context specific. Future research is warranted in this area.
Table 5.18 Examples from the Salsbury corpus: Possessives component Collection point
Example
T1 (Week 3)
Life style is different to my country.
My country's peoples work until on Saturday in the noon so they go to the rest place their family together.
T9 (Week 43)
In Korea, the educational system has to change from remembering studying to finding basic principle system. [no possessives]
When the system is changed, a lot of students can have interesting in their studying and study much more with their joyful mind.
T10 (Week 50)
You can often experience that people smoke in permitted public places. [no possessives]
What do you feel after watching it? [no possessives] I always felt the smell caused my bad feeling. Note. Examples at each collection point represent contiguous sentences written by EunHui.
Although a significant linear trend was observed with regard to the use of pronouns,
individual results varied. Figure 5.13 comprises the average possessive component scores for
each collection point plotted with the individual scores. Some students, such as EunHui followed
a general negative trend in possessive use (though peaks and valley are observed). Others,

146
however, varied widely. During the first collection period (week three), Faisal used no
possessives, but by the third collection period he (along with Takako) reached his high point in
possessive use.
Figure 5.13 Possessives component results (Salsbury)
5.2.4.4 Discussion: Frequency
In the Verspoor corpus (but not in the Salsbury corpus), significant negative linear trends
were observed for the frequency component (p = .019, η2 p = .518). Figure 5.14 shows the trends
for each index included in the component. All component indices follow a relatively similar
trend over time, suggesting component convergence.
-6
-4
-2
0
2
4
6
8
1 2 3 4 5 6 7 8 9 10
EunHui Faisal Jalil Kamal Marta Takako Mean

147
Figure 5.14 Trends for indices included in the frequency component (Verspoor)
The results suggest that as students spend more time studying English they tend to use
fewer constructions and verb-VAC combinations that are attested in COCA, and tend to use
lower frequency VACs and main verb lemmas. Fenna, for example, tended to use more frequent
main verb lemmas near the beginning of the study, but near the end was on average using less
frequent main verb lemmas. See Table 5.19 for examples of frequent and infrequent main verb
lemmas used by the students in the Verspoor corpus during the first two and last two essays. This
generally supports usage-based theories of language learning, which posit that frequent items in
the input will be learned earlier/more easily than items that are less frequent in the input
(Behrens, 2009; Ellis, 2002a; Tomasello, 2003).
-1
-0.5
0
0.5
1
1.5
1 2 3 4 5 6
percentage of constructions in text that are in reference corpus - all
percentage of lemma construction combinations in text that are in reference corpus - all
average construction frequency, log transformed - all
average lemma frequency, log transformed - all
Component
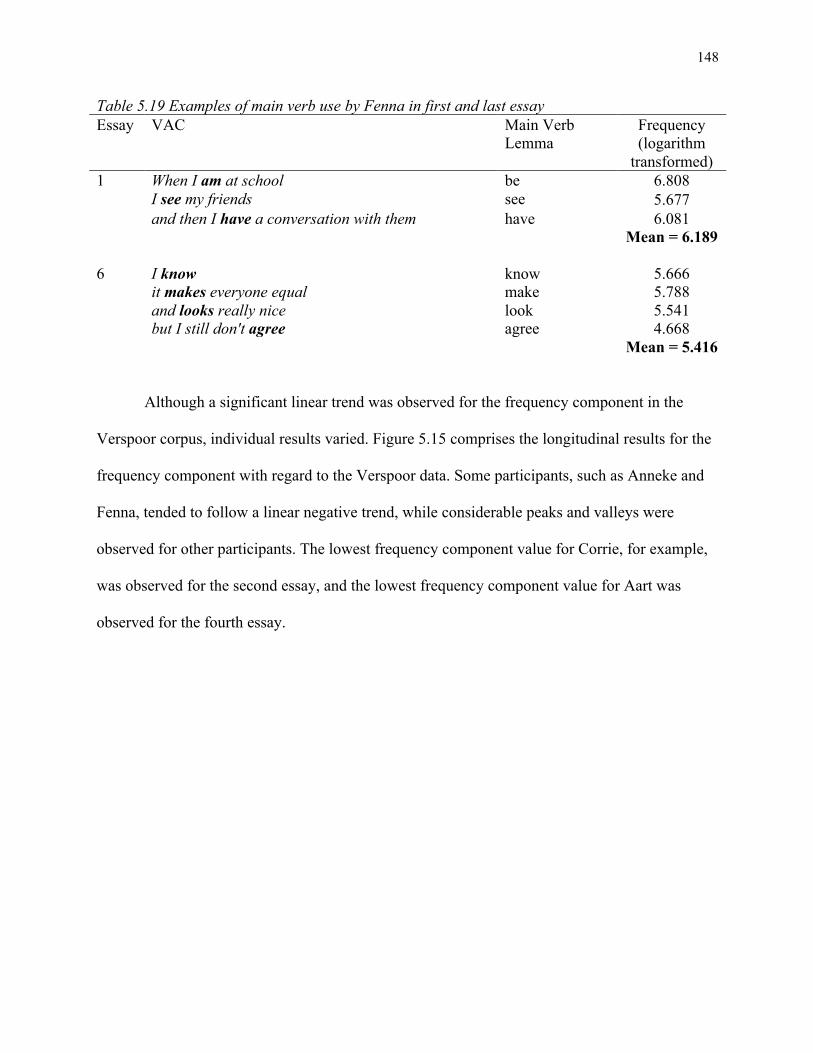
148
Table 5.19 Examples of main verb use by Fenna in first and last essay Essay VAC Main Verb
Lemma Frequency (logarithm
transformed) 1 When I am at school be 6.808 I see my friends see 5.677 and then I have a conversation with them have 6.081 Mean = 6.189 6 I know know 5.666 it makes everyone equal make 5.788 and looks really nice look 5.541 but I still don't agree agree 4.668 Mean = 5.416
Although a significant linear trend was observed for the frequency component in the
Verspoor corpus, individual results varied. Figure 5.15 comprises the longitudinal results for the
frequency component with regard to the Verspoor data. Some participants, such as Anneke and
Fenna, tended to follow a linear negative trend, while considerable peaks and valleys were
observed for other participants. The lowest frequency component value for Corrie, for example,
was observed for the second essay, and the lowest frequency component value for Aart was
observed for the fourth essay.

149
Figure 5.15 Frequency component results (Verspoor)
5.3 Summary of findings
This chapter investigated longitudinal syntactic development in language learners in two
distinct contexts. Below, the findings related to each research question are summarized, followed
by overall implications, limitations, and future directions.
5.3.1 Research Question 1b: Syntactic Complexity Analyzer indices
A significant linear trend with a large effect was observed for the index mean length of T-
unit in both longitudinal learner corpora. These results, along with a number of previous studies
(Lu, 2011; Ortega, 2003; Wolfe-Quintero et al., 1998) provide strong evidence that as language
learners become more proficient, they tend to write longer T-units. Another traditional index, T-
-8
-6
-4
-2
0
2
4
6
1 2 3 4 5 6
Anneke Aart Betje Corrie Drika
Elke Fenna Gertruida Braam Mean

150
units per sentence demonstrated a significant linear trend with large effects in the Salsbury
longitudinal corpus, but not in the Verspoor corpus. Writers included more clausal coordination
in their sentences as they became more proficient in English. These results were somewhat
surprising in light of previous research that has either found no connection or a negative
relationship between T-units per sentence and proficiency (Wolfe-Quintero et al., 1998). This
suggests that this finding for the Salsbury corpus may be due to construct irrelevant factors such
as writing topic (and bears further investigation).
5.3.2 Research Question 2b: Fine-grained clausal complexity
None of the TAASSC component indices feature fine-grained indices of clausal
complexity prominently, making conclusions regarding the relationship between fine-grained
clausal complexity and longitudinal growth somewhat difficult. Two indices of clausal
complexity (nominal complements per clause and adjective complements per clause) were
included in the verb-VAC component, both of which demonstrated a significant linear trend with
large effects in both the Salsbury and the Verspoor data. The results suggest that as individuals
become more proficient users of English, they tend to use fewer copular constructions. This can
be explained in relation to usage-based theories of language learning (Behrens, 2009; Ellis,
2002a; Tomasello, 2003), which suggests that frequent constructions will be learned earlier than
less frequent constructions. Both copular constructions with nominal complements and adjective
complements are highly frequent in COCA, suggesting that they are frequent in learner input and
therefore are learned early. Following this supposition, as learners have more exposure to
linguistic input, they may learn to use less frequent constructions, which may lead to less
reliance on copular constructions.

151
5.3.3 Research Question 3b: Fine-grained phrasal complexity
Four of the nine TAASSC indices feature indices of fine-grained phrasal complexity. Of
these four, only one component index (possessives) demonstrated significant linear trends with
time spent studying English. This trend was observed only in the Salsbury corpus, and there is
some evidence to suggest that this trend may have been due to construct irrelevant factors (e.g.,
writing topic). The lack of a strong relationship between proficiency and fine-grained clausal
complexity is unexpected in light of current theories of academic writing complexity
development (Biber et al., 2011). Biber et al. hypothesize that writers will move from using
features of conversation (e.g., finite complement clauses) to features of fiction (e.g., possessives
as pre-modifiers), and finally to features of academic writing (e.g., phrasal elaboration). Based
on this hypothesized developmental sequence, we would expect to see a small number of phrasal
complexity features near the beginning of each longitudinal corpus, moving to writing that is
characterized by these features near the end. These trends are not evident in either corpus,
suggesting that either the Biber et al. developmental sequence is inaccurate, the TAASSC
components are not fine-grained enough to capture the features in the sequence adequately, or
the development in the Verspoor and Salsbury corpora fall outside the sequence. Future research
is warranted here.
5.3.4 Research Question 4b: Syntactic sophistication
The results indicate a significant linear trend with a large effect for the verb-VAC
component in both the Salsbury and the Verspoor corpora. The direction of the trend suggests
that as individuals spend time studying English, they tend to use less frequent verb-VAC
combinations. This trend supports usage-based perspectives on language learning (Behrens,
2009; Ellis, 2002a; Tomasello, 2003). Verb-VAC combinations that are more frequent in the

152
input seem to be learned (and used) earlier, while less frequent verb-VAC combinations seem to
be learned (and used) later. A significant trend was also observed for the frequency component in
the Verspoor corpus, and similarly a trend with a meaningful effect size (but that did not reach
significance, likely due to the small sample) was observed in the Salsbury corpus. The direction
of the trend suggested participants use less frequent items (e.g., main verb lemmas) as they spend
time studying English. Additionally, in the Verspoor corpus, a significant linear trend with a
large effect was observed for the diversity and frequency component. The positive trend suggests
that participants may have learned more VACs, and therefore may have used a wider range of
VACs as they spent time studying English. This trend was not evident in the Salsbury corpus,
and therefore more research is needed before they results can be generalized. Overall, the results
provide supporting evidence for usage-based perspectives.
5.3.5 Research Question 5b: All TAASSC indices
Mean length of T-unit and the verb-VAC frequency component demonstrate the largest
linear trends across the two corpora that varied by educational context, age of learners, and
register. As individuals spent time studying English (and become more proficient) they tend to
write T-units that are longer, and also use verb-VAC combinations that are less frequent. These
results support longstanding theories of writing development (Ortega, 2003; Wolfe-Quintero et
al., 1998), which suggest that as language learners develop, they will produce more complex
language. These results also support the application of usage-based perspectives on language
learning, which suggest that frequent constructions in the input will be learned earlier/more
easily, to writing development. See Table 5.20 for the ten strongest effect sizes found in the
statistical analyses. Other findings, which are outlined above also generally support this finding,
but were specific to one of the two corpora.

153
Table 5.20 The ten strongest effect sizes across the two longitudinal studies Index Corpus p η2
p mean length of T-unit Salsbury < .001 0.960 verb-VAC frequency Verspoor < .001 0.855 verb-VAC frequency Salsbury .010 0.768 T-units per sentence Salsbury .023 0.676 mean length of T-unit Verspoor .005 0.640 possessives Salsbury .035 0.624 diversity and frequency Verspoor .014 0.551 frequency Verspoor .019 0.518 complex nominals per clause Salsbury 0.078 0.495 frequency Salsbury 0.131 0.394
5.3.6 Limitations
This study had two main limitations that should be considered when interpreting the
results. The first limitation concerns writing topic. In the Salsbury corpus, English free writes
were collected from participants. Near the beginning of the year of study, most participants wrote
free writes about their lives in a new place (that is, they did indeed write free writes in English).
At various points during the year, however, it was clear that the participants occasionally
practiced writing argumentative essays (ostensibly based on required work in their writing
courses), which may have affected the results (i.e., some observed differences in syntactic
features may be due to genre/topic effects). Additionally, in the Verspoor corpus the six writing
prompts were not counterbalanced. The topics were relatively similar over the two-year period,
but may have increased in task complexity, potentially affecting the results.
The second limitation concerns the analyses conducted. This study sought to find linear
relationships between particular linguistic variables and language development over time. This
approach, which is well represented in applied linguistics research, has recently been
problematized (e.g., Larsen-Freeman & Cameron, 2008; Larsen-Freeman, 1997). An over-
arching assumption of linear approaches is that language development with regard to such

154
linguistic variables (e.g., complex or infrequent syntactic/lexicogrammatical structures) is linear.
Another assumption that tends to be made in linear approaches is that the development and/or
use of particular linguistic features occurs independently of other features (both linguistic and
otherwise). While significant linear trends with large effect sizes were observed with regard to
some syntactic variables (e.g., verb-VAC frequency), the results may suppress the variability that
exists between participants. Thus, a useful future approach would be to adopt a complex adaptive
systems perspective (Larsen-Freeman & Cameron, 2008; Larsen-Freeman, 1997). Such a
perspective may better explain both individual variability in syntactic development and the
factors which contribute to this variability.
A third limitation is the size of the corpora explored. Each learner corpus was quite small.
The Salsbury corpus includes writings from six participants, while the Verspoor corpus includes
essays from nine students. As such, the generalizations that can be made about language learning
in terms of syntactic complexity and sophistication may be limited.
5.3.7 Future directions
Future research should represent principled replications of the analyses conducted in this
study in other writing and learning contexts to determine how stable the findings are.
Additionally, every effort should be made to control for construct irrelevant variables (such as
writing topic). Furthermore, the principled use of micro-features (as opposed to component
scores) may be a rich area for investigation to determine the precise structures that emerge as
students write longer T-units.
6 Conclusion and Outlook
This goal of this dissertation project was to supplement and refine our understanding of
syntactic development in writing by developing and testing new indices of syntactic development

155
following recent discussions in the field. To this end, fine grained clausal and phrasal indices
were developed based on recent work the nature of syntactic complexity (Biber et al., 2011;
Norris & Ortega, 2009) along with frequency-based indices that draw on usage-based
perspectives (Ellis, 2002a; Goldberg, 1995; Tomasello, 2003). These indices, in addition to the
traditional indices of syntactic complexity were used to analyze syntactic development across
TOEFL writing proficiency scores and two longitudinal corpora. A number of developmental
trends were observed, some of which were stable across all datasets, but others were restricted to
only one or two of the datasets. A summary of the outcomes and findings of this dissertation is
provided below.
6.1 The Tool for the Automatic Analysis of Syntactic Sophistication and Complexity
An important outcome of this dissertation is the release of the Tool for the Automatic
Analysis of Syntactic Sophistication and Complexity (TAASSC). Chapter 3 described the indices
included in TAASSC, which comprise the 14 indices measured by Lu’s (2010, 2011) Syntactic
Complexity analyzer, 31 fine-grained indices or clausal complexity, 132 fine-grained indices of
phrasal complexity, 190 usage-based indices of syntactic sophistication, and nine component
indices. These indices are based on and draw heavily from previous research (e.g., Biber et al.,
2011; Bulté & Housen, 2012; Ellis & Ferreira-Junior, 2009b; Gries et al., 2005; Norris & Ortega,
2009; Wolfe-Quintero et al., 1998), and their implementation is possible due to recent advances
in natural language processing (Chen & Manning, 2014; de Marneffe et al., 2006). TAASSC
requires no programming knowledge, works on a variety of operating systems, and is freely
available at http://www.kristopherkyle.com/taassc.html. It is hoped that TAASSC will benefit the
research community and further work in the area of syntactic development.

156
TAASSC may be particularly useful for researchers testing theories of language
development generally and writing development specifically (e.g., Biber et al., 2011; Ellis,
2002a; Norris & Ortega, 2009). TAASSC is particularly well suited for learner corpus research
(e.g, Granger et al., 2009; Granger & Leech, 2014), in that large collections of learner texts can
be analyzed with regard to syntactic features in a short amount of time and at no cost. TAASSC
indices may also be of particular use in language assessment contexts. For example, TAASSC
indices of syntactic complexity and sophistication may increase construct coverage of existing
automatic essay scoring systems (e.g., Attali & Burstein, 2006). TAASSC indices could also be
used in conjunction with other freely available text analysis tools such as the tool for the
automatic analysis of lexical sophistication (TAALES) (Kyle & Crossley, 2015) and the tool for
the automatic analysis of cohesion (TAACO) (Crossley, Kyle, & McNamara, 2016, 2015) to
create new essay scoring models. In addition to modelling syntactic development directly,
TAASSC indices may also prove useful in analyzing the effects of writing task types on test-
taker production (e.g., Ramineni, Trapani, Williamson, Davey, & Bridgeman, 2012; Weiwei
Yang, Lu, & Weigle, 2015). Furthermore, TAASSC indices may be beneficial in rater cognition
studies (e.g., Eckes, 2008, 2012) to compare survey-based rater bias models with textual
features. TAASSC indices may also prove useful in intelligent tutoring systems (ITS) such as W-
PAL (Crossley, Allen, & Mcnamara, in press) by providing focused syntactic feedback.
TAASSC indices may also be useful to corpus linguists and/or sociolinguists interested in
studying diachronic language change (e.g., Kulick, Kroch, & Santorini, 2014; Nevalainen, 2013)
and/or synchronic language variation (Biber & Conrad, 2014; e.g., Friginal & Hardy, 2013;
Grieve, Biber, Friginal, & Nekrasova, 2010). TAASSC indices may also be useful for controlling
for syntactic differences in language stimuli for psychological and psycholinguistic studies

157
(Harley, 2013). These are but a few examples of the applications of TAASSC indices. In short,
TAASSC indices may be useful for anyone interested in syntactic features of written texts. In
this project, TAASSC was used to explore the relationship between syntactic features and
language development. A summary of these findings can be found below.
6.2 Summary of Findings
6.2.1 Research Question 1: Syntactic complexity analyzer indices
What is the relationship between the Syntactic Complexity Analyzer indices and
a. holistic scores of writing proficiency?
b. longitudinal writing development?
The results indicated that there was a significant (but weak) positive relationship between
mean length of clause and holistic writing scores of writing proficiency, suggesting that higher
rated essays tend to include longer clauses. This aligns with previous studies, such as Lu (2010,
2011), who found that mean length of clause increased across university levels. This relationship,
however, was significantly weaker than the relationship between holistic scores of writing
proficiency and indices of fine-grained phrasal complexity and indices of syntactic
sophistication. Furthermore, the relationship between mean length of clause and writing
development was not observed in either of the longitudinal corpora, suggesting that the
predictive nature of the mean length of clause index is not independent of tasks such as high-
stakes timed writing assignments, low-stakes timed writing assignments, and freewrites.
The longitudinal results indicated a significant positive relationship with a large effect
between mean length of T-unit and time in both corpora. This suggests that as individuals spend
time studying English (and become more proficient writers), they tend to write longer T-units.
By and large, this aligns with previous findings (Lu, 2011; Ortega, 2003; Wolfe-Quintero et al.,

158
1998). At least two questions remain with regard to these results, however. First, based solely on
the mean length of T-unit index, it is unclear what syntactic structures are being produced to
increase T-unit length. The second regards the extent to which the mean length of T-unit index is
predictive across writing tasks and contexts, given the lack of a relationship between mean
length of T-unit and holistic scores of writing proficiency.
6.2.2 Research Question 2: Fine-grained clausal complexity indices
What is the relationship between fine-grained indices of clausal complexity and
a. holistic scores of writing proficiency?
b. longitudinal writing development?
The results indicated that there was a significant (but weak) relationship between fine-
grained indices of clausal complexity and holistic scores of writing proficiency. The results
suggest that higher proficiency essays tend to include more non-finite clauses (such as infinitive
and gerund clauses) and a wider range of dependents per clause. The relationship between fine-
grained indices of clausal complexity and holistic scores of writing proficiency was significantly
weaker than the relationship between writing proficiency and fine-grained indices of phrasal
complexity. This finding generally supports Biber et al.’s (2011) assertion that phrasal
complexity (not clausal complexity) is a feature of academic writing. The relationship between
writing proficiency and fine-grained indices of clausal complexity was also significantly weaker
than the relationship between writing proficiency and indices of syntactic sophistication. This
finding generally supports usage-based theories of language development (e.g., Ellis, 2002),
which posit that frequency (and not complexity) is a key component of development.
The results between fine-grained indices of clausal complexity and longitudinal
development were also weak. Two fine-grained indices of clausal complexity related to the use

159
of copular constructions (nominal complements per clause and adjective complements per
clause) were included in the verb-VAC frequency component, which demonstrated a negative
linear trend over time with a large effect. This suggests that as individuals spend time studying
English (and become more proficient writers) they tend to use fewer copular constructions. This
finding may be more closely related to sophistication than complexity however, in that copular
constructions tend to be highly frequent in COCA. Following usage-based perspectives
(Behrens, 2009; Ellis, 2002a; Tomasello, 2003), this finding would suggest that individuals learn
copular constructions at early stages of development, and use them less heavily as they become
more proficient and are more likely to use less frequent constructions.
Overall, only weak relationships were found between fine-grained indices of clausal
complexity and writing development. These results support Biber et al.’s (2011) assertions that
clausal complexity is not a feature of academic writing.
6.2.3 Research Question 3: Fine-grained phrasal complexity indices
What is the relationship between fine-grained indices of phrasal complexity and
a. holistic scores of writing proficiency?
b. longitudinal writing development?
The results indicated that there was a significant relationship with a medium effect size
between fine grained indices of phrasal complexity and holistic scores of writing proficiency.
The results suggest that higher proficiency essays tend to include more dependents, and
specifically more prepositions per object of the pronoun, a wider range of dependents per
nominal subject and direct object, non-pronominal direct objects with more dependents, and
more pronominal direct objects. These results generally support Biber et al.’s (2011)
hypothesized developmental scale, which suggests that as individuals become more proficient,

160
their writing will be characterized by noun phrase complexity (which is a feature of academic
writing).
The results from the longitudinal studies indicate that of the four TAASSC components
that feature fine-grained indices of phrasal complexity, only one (the possessives component)
demonstrated a significant linear trend with time. Furthermore, the possessives component only
demonstrated a significant linear trend in the Salsbury corpus, suggesting that Biber et al.’s
(2011) findings may only be applicable to holistic writing proficiency scores in timed,
argumentative essays, but not to the EFL and ESL longitudinal corpora analyzed in this study.
The longitudinal results generally suggest that Biber et al.’s (2011) hypothesized developmental
scale may be inappropriate for the contexts and writing tasks represented (i.e., untimed,
unstructured free writes by adult ESL learners and untimed, descriptive essays written by
middle-school EFL students). The conflicting results between the TOEFL writing proficiency
corpus and the longitudinal corpora warrant further research to determine the validity of Biber et
al.’s proposed developmental scale across contexts.
6.2.4 Research Question 4: Indices of syntactic sophistication
What is the relationship between usage-based indices of syntactic sophistication
a. holistic scores of writing proficiency?
b. longitudinal writing development?
The results indicated that there was a significant relationship with a medium effect
between indices of syntactic sophistication and holistic scores of writing proficiency. The results
suggest that higher proficiency essays tend to include less frequent VACs, a higher VAC type-
token ratio, and verb-VAC combinations that are more strongly associated. These findings
suggest that individual first learn (and use) a small number of frequent VACs at early proficiency

161
levels and likely use a wide variety of verbs that may not always be appropriate. As learners
develop, their cumulative language experiences allow them to learn (and use) less frequent
VACs while also learning which verbs tend to fit with particular VACs. This interpretation of the
results supports usage-based perspectives of language learning (Behrens, 2009; Ellis, 2002a;
Tomasello, 2003) and suggest that a) usage-based perspectives are applicable to a wide range of
VACs, b) usage-based perspectives apply to writing development, and c) indices of syntactic
sophistication, which are based on usage-based perspectives, can be used to model essay scores.
Overall, the longitudinal results support the findings related to holistic essay scores of
writing proficiency. The verb-VAC frequency component demonstrated a significant negative
linear trend with a large effect in both longitudinal corpora. The results suggest that as
individuals spend time learning English (and become more proficient) that they tend to use less
frequent verb-VAC combinations, which supports usage-based perspectives. Other components
related to syntactic sophistication also supported these trends, including the frequency
component and the frequency and diversity component in the Verspoor corpus, but significant
trends were not found for these components in the Salsbury corpus.
One point of departure between the TOEFL writing proficiency corpus and the
longitudinal corpus with regard to indices of syntactic sophistication was the role of verb-VAC
strength of association measures. In the TOEFL writing proficiency corpus, these indices played
an important role, while in the longitudinal corpora no significant and/or meaningful trend was
observed with regard to the association strength component. One explanation for this may be that
there is no overlap in the verb-VAC strength of association predictor indices in the TOEFL study
and the indices included in the association strength component, leading to varying results.
Another explanation for this may be a difference in proficiency levels between the TOEFL

162
writing proficiency corpus and either longitudinal corpus. Individuals’ verb-VAC combination
sensitivities may not have reached a point at which they begin to use strongly associated verb-
VAC combinations regularly. This is an area for future work.
6.2.5 Research Question 5: All TAASSC indices
What is the relationship between all syntactic development indices included in TAASSC and
a. holistic scores of writing proficiency?
b. longitudinal writing development?
The results indicated that a significant predictor model with a medium effect included
fine-grained indices of clausal complexity, fine-grained indices of phrasal complexity, and
indices of syntactic sophistication. Of the 34.2% of the variance in holistic scores of writing
proficiency explained by the model, the largest variance was explained by fine-grained indices of
phrasal complexity (17.6%), followed closely by indices of syntactic sophistication (15.5%).
Fine-grained indices of clausal complexity explained the least amount of the variance (1.0%),
and no traditional indices of syntactic complexity were included in the model. These results,
along with the cumulative results of the other TOEFL writing proficiency studies conducted as
part of this dissertation, generally support both Biber et al.’s (2011) hypothesized developmental
scale and usage-based perspectives on language learning. From the phrasal complexity
perspective, the results suggest that as writers become more proficient, their writing is
characterized by complex noun phrases, which is a feature of academic writing (Biber et al.,
2011). From a usage-based perspective, the results suggest that individuals learn (and use) VACs
that occur frequently in the input at earlier stages of proficiency, and as they become more
proficient they learn (and use) less frequent VACs in addition to the frequent ones (e.g., Ellis,
2002a). The results also suggest that as learners become more proficient writers, they tend to

163
become more sensitive to the verbs that are strongly associated with particular VACs and use
strongly associated verb-VAC combinations more often.
The longitudinal results generally support the TOEFL writing proficiency findings with
regard to indices of syntactic sophistication, further supporting usage-based perspectives of
language learning (Behrens, 2009; Ellis, 2002a; Tomasello, 2003). The longitudinal results
diverge, however, with regard to both the traditional indices measured by the Syntactic
Complexity Analyzer (Lu, 2010, 2011) and fine-grained indices of phrasal complexity. In both
longitudinal corpora, mean length of T-unit demonstrated positive linear trends with strong
effects. These results diverge from the TOEFL writing proficiency results, but generally align
with the bulk of studies that have used the index to measure syntactic growth (Lu, 2010; Ortega,
2003; Wolfe-Quintero et al., 1998). It appears clear that as writers become more proficient, they
tend to write longer T-units. Syntactic elaboration is not explicitly included as a TOEFL rubric
descriptor, which may explain the lack of a relationship between T-unit length and holistic scores
of writing proficiency. No linear relationship was observed between fine-grained indices of
phrasal complexity and time, despite being the strong predictor of holistic writing proficiency
scores. These results bear further investigation to determine why raters appear to value phrasal
sophistication as an indicator of proficiency, but phrasal complexity development was not
observed in either of the longitudinal datasets.
6.2.6 Summary of findings
Across the cross-sectional (TOEFL independent essays) and longitudinal (Salsbury
corpus and Verspoor corpus) datasets, both convergence and divergence was observed. The
strongest and most constant finding across datasets was the relationship between indices of
syntactic sophistication and language development. In all three datasets, verb-VAC combination

164
frequency demonstrated a negative relationship with language proficiency/development. As
learners became more proficient writers/language users, then tended to use less frequent verb-
VAC combinations. This finding generally supports usage-based theories of language
development (e.g., Behrens, 2009; Ellis, 2002; Tomasello, 2003), and extends previous L2
usage-based findings in aural/oral modes (e.g., Ellis & Ferreira-Junior, 2009b) to writing
development. Another strong finding, which was observed in both longitudinal datasets (but not
in the cross-sectional TOEFL data), was the positive relationship between mean length of T-unit
(MLTU) and language development. In both the Salsbury corpus and the Verspoor corpus,
writers wrote longer T-units as they became more proficient in English. These longitudinal
results support a number of previous cross-sectional and longitudinal studies (c.f., Knoch et al.,
2014; e.g., Lu, 2011; Ortega, 2003).
Other results were dataset specific. Fine-grained indices of noun-phrase complexity, for
example, were the strongest predictors of writing quality in the cross-sectional TOEFL
independent essay dataset. TOEFL independent essays that included more noun-phrase
elaboration (and in particular more dependents per object of the preposition) tended to earn
higher scores. These results were not observed in either of the longitudinal corpora. Future
research is warranted to explore the degree to which these differences are due to variables such
as task type and writing context.
6.3 Contributions
This dissertation project has two main contributions to the field of applied linguistics.
The first contribution is that it has tested multiple theories of syntactic development both cross-
sectionally and longitudinally. The results support usage-based theories of language acquisition
(e.g., Behrens, 2009; Ellis, 2002a; Tomasello, 2003) with regard to the development of verb

165
argument constructions. In all three datasets, a negative relationship between language
proficiency and verb-VAC combination frequency, suggesting that as learners experience more
language input, they learn (and use) less frequent verb-VAC combinations. Additionally, some
support was found for Biber et al.’s (2011) developmental scale in that phrasal complexity
features were positively correlated with writing proficiency (in the cross-sectional TOEFL
dataset), and clausal complexity features were not particularly predictive of writing proficiency.
The second contribution of this dissertation project is the development and release of the
Tool for the Automatic Analysis of Syntactic Sophistication and Complexity (TAASSC).
TAASSC is freely available, easy to use, and works on all major operating systems (Windows,
Mac OSX, and Linux) making it accessible to a wide range of researchers. TAASSC allows for
the replication of this study using any written dataset a researcher desires to use (provided texts
are formatted in plain .txt files). TAASSC also includes frequency and strength of association
norms for all of the verb-argument constructions in the Corpus of Contemporary American
English (Davies, 2009), which may prove to be of particular interest to corpus linguists.
Additionally, the release of TAASSC should enable developers of automatic scoring systems
(AES) and automatic writing evaluation (AWE) to both increase construct coverage and provide
more detailed writing feedback.
6.4 Implications
The findings of this dissertation project have important implications for second language
acquisition, writing assessment, and second language pedagogy.
6.4.1 Second language acquisition
First, the findings support usage-based theories of language learning (e.g., Behrens, 2009;
Ellis, 2002a; Tomasello, 2003), which suggest that frequency is the driving force in language

166
learning. Usage-based theories of language learning have previously been explored in L1 and L2
contexts with regard to aural/oral modes and with regard to a small set of verb-argument
constructions. This study has extended these findings to a large set of VACs and to writing
development. Second, the results also provide some support for Biber et al.’s (2011) proposed
developmental scale, which suggests that as writers develop, they move from using features of
oral communication (e.g., clausal subordination) to features of academic writing (e.g., phrasal
complexity/elaboration).
6.4.2 Writing assessment
The findings also have important implications for writing assessment. In particular, the
results suggest that rating scales should include descriptors related to lexico-grammatical
language features. This is appropriate in light of the finding that a consistent relationship was
observed between writing development/proficiency and lexico-grammatical features (i.e., verb-
VAC frequency). Additionally, rating scales for academic writing tasks (i.e., TOEFL
independent essays) should also include descriptors related to noun phrase complexity. This is
appropriate in light of the finding that noun phrase complexity was the strongest predictor of
holistic scores of writing proficiency with regard to TOEFL independent essays. Furthermore,
the results suggest that including features such as noun phrase complexity indices and indices
related to verb-VAC frequency and strength of association in automatic essay scoring systems
may increase construct coverage.
6.4.3 Second language pedagogy
The findings also have tentative implications for second language pedagogy. First, the
results support the notion that learners’ sensitivity to input frequency goes beyond single
vocabulary items (e.g., Ellis, 2002). It may be beneficial to teach verb-VAC combinations, both

167
explicitly and explicitly in addition to teaching vocabulary and grammar. A particularly helpful
resource for such an approach is reported byLittlemore (2009), who suggested a number of
practical ways to teach in a manner that is consistent with usage-based theories of language
learning and cognitive grammar. Additionally, academic writing pedagogy may benefit from a
focus on noun-phrase elaboration, which has been shown to be a feature of both advanced
academic writing (Biber et al., 2011) and high scoring TOEFL independent essays in this project.
6.5 Limitations
As with most studies, the studies that comprise this dissertation have a number of
limitations. First, the samples sizes (especially in the longitudinal corpora) were quite small,
which may limit the generalizations that can be made. Another important limitation of the
longitudinal studies was the (lack of) consistency in writing prompts across collection points. In
the Salsbury corpus, participants wrote “free-writes”, which may have included writing samples
that represent a range of registers/genres. Additionally, the writing tasks in the Verspoor corpus
were not counterbalanced (though they were on similar topics), which may have affected the
linguistics features produced in each set of essays.
Another limitation that could be addressed in future studies is the reference corpus that
was used as a proxy for linguistic input. While the Corpus of Contemporary American English
(COCA; Davies, 2009) may be representative of an American, adult L1 English user’s language
experiences, it is likely not representative of the varied input to which a language learner is
exposed. A fruitful exercise may be to first determine a systematic method for modelling the
types of input a typical language learner receives (if a “typical” language learner exists). A
second step would then be to collect such a corpus and use it to obtain the types of frequency
norms obtained from COCA for this dissertation.

168
Furthermore, the definition of a verb argument construction was largely determined based
on the features analyzed by the Stanford Neural Network Dependency Parser (Chen & Manning,
2014). While this approach was straightforward and likely reduced error rates, it is possible that
distinctions between VACs were made that were not appropriate. For example, a VAC (e.g.,
subject-verb-object) that includes a subordinating conjunction (i.e, because) was counted as a
separate VAC type from its non-subordinated counterpart. Future research may work to
problematize and improve upon the definition of VACs used in this study. One such approach
would be to use a resource such as the grammar patterns found in Hunston and Francis (2000).
Another potentially useful approach would be to determine a verb similarity threshold for
combining two VACs with similar verb occupancy profiles. If, for example, subordinated and
un-subordinated subject-verb-object constructions included similar verb frequency profiles, it
may be appropriate to combine them.
Additionally, the use of computational tools for L2 language analysis has some
limitations. While computational tools have a number of advantages for such a task, they are not
without fault. Studies have shown that the Stanford Neural Network Dependency Parser, which
was used in this dissertation, achieves approximately 90% labeling accuracy with well-formatted
and edited texts (such as newspaper and magazine articles; Chen & Manning, 2014). While we
are fairly confident in the results of the study, the accuracy of the parser is likely less accurate
with learner texts, which introduces a certain amount of noise.
6.6 Outlook
Over the past twenty years, natural language processing technology has steadily
advanced. Although some applied linguists have been involved with and leveraged these
advancements (Biber, 1988; Lu, 2011; MacWhinney & Snow, 1990; McNamara et al., 2010;

169
O’Donnell & Ellis, 2010), by and large, second language acquisition (SLA) researchers have not
done so. Computational methods in general, and syntactic parsers in particular are not perfect,
but they have been improving at a consistently rapid pace (Chen & Manning, 2014; de Marneffe
et al., 2006; Klein & Manning, 2003). This improvement has led to analysis techniques that rival
(and in some cases surpass) the reliability of humans (Attali & Burstein, 2006) while using a
fraction of the resources (Higgins et al., 2011; Lu, 2010). It is hoped that second language
researchers will increasingly explore the degree to which computational analyses may (or may
not) aid in addressing important questions in the field. By problematizing and improving upon
tools that already exist, second language researchers can help to mold (and create) tools that are
designed specifically for the needs of such researchers.

170
REFERENCES
Andersen, O., Nioche, J., Briscoe, E., & Carroll, J. (2008). The BNC parsed with RASP4UIMA.
In Proceedings of the Sixth International Language Resources and Evaluation Conference
(LREC’08) (pp. 865–869).
Attali, Y., & Burstein, J. (2006). Automated essay scoring with e-rater® V. 2. The Journal of
Technology, Learning and Assessment, 4(3).
Bardovi-Harlig, K., & Bofman, T. (1989). Attainment of Syntactic and Morphological Accuracy
by Advanced Language Learners. Studies in Second Language Acquisition, 11(01), 17–34.
http://doi.org/10.1017/S0272263100007816
Behrens, H. (2009). Usage-based and emergentist approaches to language acquisition.
Linguistics, 47(2), 383–411. http://doi.org/10.1515/LING.2009.014
Bencini, G. M. ., & Goldberg, A. E. (2000). The Contribution of Argument Structure
Constructions to Sentence Meaning. Journal of Memory and Language, 43(4), 640–651.
http://doi.org/10.1006/jmla.2000.2757
Biber, D. (1988). Variation across speech and writing. Cambridge, England: Cambridge
University Press.
Biber, D., & Conrad, S. (2014). Variation in English: Multi-dimensional studies. Routledge.
Biber, D., Conrad, S. M., Reppen, R., Byrd, P., Helt, M., Clark, V., … Urzua, A. (2004).
Representing Language Use in the University: Analysis of the TOEFL 2000 Spoken and
Written Academic Language Corpus. TOEFL Monograph Series.
Biber, D., Gray, B., & Poonpon, K. (2011). Should We Use Characteristics of Conversation to
Measure Grammatical Complexity in L2 Writing Development? TESOL Quarterly, 45(1),
5–35.

171
Biber, D., Gray, B., & Poonpon, K. (2013). Pay Attention to the Phrasal Structures: Going
Beyond T-Units—A Response to WeiWei Yang. TESOL Quarterly, 47(1), 192–201.
http://doi.org/10.1002/tesq.84
Biber, D., Gray, B., & Staples, S. (2014). Predicting Patterns of Grammatical Complexity Across
Language Exam Task Types and Proficiency Levels. Applied Linguistics, amu059.
http://doi.org/10.1093/applin/amu059
Brill, E. (1995). Transformation-based error-driven learning and natural language processing: a
case study in part-of-speech tagging. Computational Linguistics, 21(4), 543–565.
Briscoe, T. (2006). grammars and the RASP system parser.
Bulté, B., & Housen, A. (2012). Defining and operationalising L2 complexity. Dimensions of L2
Performance and Proficiency: Complexity, Accuracy and Fluency in SLA, 32, 21.
Bulté, B., & Housen, A. (2014). Conceptualizing and measuring short-term changes in L2
writing complexity. Journal of Second Language Writing, 26, 42–65.
http://doi.org/10.1016/j.jslw.2014.09.005
Bybee, J. (2006). From Usage to Grammar: The Mind’s Response to Repetition. Language,
82(4), 711–733.
Casanave, C. P. (1994). Language development in students’ journals. Journal of Second
Language Writing, 3(3), 179–201. http://doi.org/10.1016/1060-3743(94)90016-7
Cer, D., Marneffe, M. De, Jurafsky, D., Manning, C. D., & de Marneffe, M.-C. (2010). Parsing
to Stanford Dependencies: Trade-offs between Speed and Accuracy. In Proceedings of the
Seventh International Conference on Language Resources and Evaluation (LREC’10) (Vol.
0, pp. 1628–1632). http://doi.org/10.1.1.178.3262
Chang, F., Bock, K., & Goldberg, A. E. (2003). Can thematic roles leave traces of their places?

172
Cognition, 90(1), 29–49. http://doi.org/10.1016/S0010-0277(03)00123-9
Charniak, E. (2000). A Maximum-Entropy-Inspired Parser, (c), 132–139.
Charniak, E., & Johnson, M. (2005). Coarse-to-fine n-best parsing and MaxEnt discriminative
reranking. In Proceedings of the 43rd Annual Meeting of the Association for Computational
Linguistics (ACL ’05) (Vol. 1, pp. 173–180). http://doi.org/10.3115/1219840.1219862
Chen, D., & Manning, C. D. (2014). A Fast and Accurate Dependency Parser using Neural
Networks. In Proceedings of the 2014 Conference on Empirical Methods in Natural
Language Processing (EMNLP) (pp. 740–750).
Chomsky, N. (1965). Aspects of the Theory of Syntax. Aspects of the Theory of Syntax.
Chomsky, N. (1988). Language and problems of knowledge: The Managua lectures (Vol. 16).
MIT press.
Cohen, J. (1988). Statistical Power Analysis for the Behavioral Sciences. 2nd edn. Hillsdale,
New Jersey: L. New York: Erlbaum.
Collins, M. (2003). Head-Driven Statistical Models for Natural Language Parsing.
Computational Linguistics, 29(4), 589–637. http://doi.org/10.1162/089120103322753356
Condon, W. (2013). Large-scale assessment, locally-developed measures, and automated scoring
of essays: Fishing for red herrings? Assessing Writing, 18(1), 100–108.
http://doi.org/10.1016/j.asw.2012.11.001
Cooper, T. C. (1976). Measuring Written Syntactic Patterns of Second Language Learners of
German. The Journal of Educational Research, 69(5), 176–183.
http://doi.org/10.1080/00220671.1976.10884868
Crossley, S. A., Allen, L. K., & Mcnamara, D. S. (n.d.). Writing Pal: A writing strategy tutor. In
S. A. Crossley & D. S. McNamara (Eds.), Adaptive Educational Technologies for Literacy

173
Instruction. New York: Routledge.
Crossley, S. A., Cai, Z., & McNamara, D. S. (2012). Syntagmatic, Paradigmatic, and Automatic
N-Gram Approaches to Assessing Essay Quality. In Twenty-Fifth International FLAIRS
Conference.
Crossley, S. A., Kyle, K., Allen, L. K., Guo, L., & McNamara, D. S. (2014). Linguistic
microfeatures to predict L2 writing proficiency: A case study in Automated Writing
Evaluation. The Journal of Writing Assessment, 7.
Crossley, S. A., Kyle, K., & McNamara, D. S. (2015). The tool for the automatic analysis of text
cohesion (TAACO): Automatic assessment of local, global, and text cohesion. Behavior
Research Methods, 1–11. http://doi.org/10.3758/s13428-015-0651-7
Crossley, S. A., Kyle, K., & Mcnamara, D. S. (2015). To aggregate or not? Linguistic features in
automatic essay scoring and feedback systems. The Journal of Writing Assessment, 8(1), 1–
14.
Crossley, S. A., Kyle, K., & McNamara, D. S. (2016). The development and use of cohesive
devices in L2 writing and their relations to judgments of essay quality. Journal of Second
Language Writing, 32, 1–16. http://doi.org/10.1016/j.jslw.2016.01.003
Crossley, S. A., & McNamara, D. S. (2014). Does writing development equal writing quality? A
computational investigation of syntactic complexity in L2 learners. Journal of Second
Language Writing, 26, 66–79.
Crossley, S. A., Salsbury, T., & McNamara, D. S. (2012). Predicting the proficiency level of
language learners using lexical indices. Language Testing, 29(2), 243–263.
http://doi.org/10.1177/0265532211419331
Cumming, A., Kantor, R., Baba, K., Erdosy, U., Eouanzoui, K., & James, M. (2005). Differences

174
in written discourse in independent and integrated prototype tasks for next generation
TOEFL. Assessing Writing, 10(1), 5–43.
Davies, M. (2009). The 385+ million word Corpus of Contemporary American English (1990–
2008+): Design, architecture, and linguistic insights. International Journal of Corpus
Linguistics, 14(2), 159–190. http://doi.org/10.1075/ijcl.14.2.02dav
Davies, M. (2010). The Corpus of Contemporary American English as the first reliable monitor
corpus of English. Literary and Linguistic Computing , 25 (4 ), 447–464.
http://doi.org/10.1093/llc/fqq018
de Marneffe, M.-C., MacCartney, B., & Manning, C. D. (2006). Generating typed dependency
parses from phrase structure parses. In Proceedings of LREC (Vol. 6, pp. 449–454).
http://doi.org/10.1.1.74.3875
Dunn, O. J., & Clark, V. (1969). Correlation Coefficients Measured on the Same Individuals.
Journal of the American Statistical Association, 64(325), 366–377.
http://doi.org/10.1080/01621459.1969.10500981
Eckes, T. (2008). Rater types in writing performance assessments: A classification approach to
rater variability. Language Testing, 25(2), 155–185.
Eckes, T. (2012). Operational Rater Types in Writing Assessment: Linking Rater Cognition to
Rater Behavior. Language Assessment Quarterly, 9(3), 270–292.
http://doi.org/10.1080/15434303.2011.649381
Ellis, N. C. (2002a). FREQUENCY EFFECTS IN LANGUAGE PROCESSING. Studies in
Second Language Acquisition, 24(02), 143–188.
Ellis, N. C. (2002b). REFLECTIONS ON FREQUENCY EFFECTS IN LANGUAGE
PROCESSING. Studies in Second Language Acquisition, 24(02), 297–339.

175
Ellis, N. C., & Ferreira-Junior, F. (2009a). Construction Learning as a Function of Frequency,
Frequency Distribution, and Function. The Modern Language Journal, 93(3), 370–385.
http://doi.org/10.1111/j.1540-4781.2009.00896.x
Ellis, N. C., & Ferreira-Junior, F. (2009b). Constructions and their acquisition: Islands and the
distinctiveness of their occupancy. Annual Review of Cognitive Linguistics, 7(1), 188–221.
http://doi.org/10.1075/arcl.7.08ell
Ellis, N. C., O’Donnell, M. B., & Römer, U. (2014). The processing of verb-argument
constructions is sensitive to form, function, frequency, contingency and prototypicality.
Cognitive Linguistics. http://doi.org/10.1515/cog-2013-0031
Eskildsen, S. W. (2009). Constructing another Language—Usage-Based Linguistics in Second
Language Acquisition. Applied Linguistics , 30 (3 ), 335–357.
http://doi.org/10.1093/applin/amn037
Eskildsen, S. W., & Cadierno, T. (2007). Are recurring multi-word expressions really syntactic
freezes? Second language acquisition from the perspective of usage-based linguistics. In
Nordic Conference on Syntactic Freezes.
Ferris, D. R. (1994). Rhetorical Strategies in Student Persuasive Writing: Differences between
Native and Non-Native English Speakers. Research in the Teaching of English, 28(1), 45–
65.
Fisher, R. A. (1934). Two New Properties of Mathematical Likelihood. Proceedings of the Royal
Society of London. Series A, Containing Papers of a Mathematical and Physical Character,
144(852), 285–307.
Francis, H. S., Gregory, M. L., & Michaelas, L. A. (1999). Are lexical subjects deviant? Chicago
Linguistic Society, 35(1), 85–98.

176
Friginal, E. (2014). Personal Communication.
Friginal, E., & Hardy, J. (2013). Corpus-based sociolinguistics: A guide for students. Routledge.
Friginal, E., & Weigle, S. (2014). Exploring multiple profiles of L2 writing using multi-
dimensional analysis. Journal of Second Language Writing, 26, 80–95.
http://doi.org/10.1016/j.jslw.2014.09.007
Fromkin, V., Rodman, R., & Hyams, N. (2013). An introduction to language. Cengage Learning.
Garside, R., Leech, G. N., & McEnery, T. (1997). Corpus annotation: linguistic information
from computer text corpora. Londpon: Longman.
Gilquin, G., De Cock, S., & Granger, S. (2010). The Louvain International Database of Spoken
English Interlanguage. Handbook and CD-ROM.
Goldberg, A. E. (1995). Constructions: A construction grammar approach to argument
structure. (G. Fauconnier, G. Lakoff, & E. Sweetser, Eds.)Culture (Vol. 25). University of
Chicago Press.
Goldberg, A. E., Casenhiser, D., & Sethuraman, N. (2004). Learning argument structure
generalizations. Cognitive Linguistics. http://doi.org/10.1515/cogl.2004.011
Graesser, A. C., McNamara, D. S., & Kulikowich, J. M. (2011). Coh-Metrix: Providing
Multilevel Analyses of Text Characteristics. Educational Researcher, 40(5), 223–234.
http://doi.org/10.3102/0013189X11413260
Graesser, A. C., McNamara, D. S., Louwerse, M. M., & Cai, Z. (2004). Coh-Metrix: Analysis of
text on cohesion and language. Behavior Research Methods, Instruments, & Computers,
36(2), 193–202. http://doi.org/10.3758/BF03195564
Granger, S., Dagneaux, E., Meunier, F., & Paquot, M. (2009). The international corpus of learner
English. Version 2. Handbook and CD-ROM.

177
Granger, S., & Leech, G. (2014). Learner English on computer. Routledge.
Graves, D. H. (1975). An Examination of the Writing Processes of Seven Year Old Children.
Research in the Teaching of English, 9(3), 227–241.
Gries, S. T. (2015). Personal Communication.
Gries, S. T., Hampe, B., & Schönefeld, D. (2005). Converging evidence: Bringing together
experimental and corpus data on the association of verbs and constructions. Cognitive
Linguistics, 16(4), 635–676. http://doi.org/10.1515/cogl.2005.16.4.635
Gries, S. T., & Wulff, S. (2005). Do foreign language learners also have constructions? Annual
Review of Cognitive Linguistics, 3(1), 182–200. http://doi.org/10.1075/arcl.3.10gri
Grieve, J., Biber, D., Friginal, E., & Nekrasova, T. (2010). Variation among blogs: A multi-
dimensional analysis. In Genres on the Web (pp. 303–322). Springer.
Guo, L., Crossley, S. A., & McNamara, D. S. (2013). Predicting human judgments of essay
quality in both integrated and independent second language writing samples: A comparison
study. Assessing Writing, 18(3), 218–238.
Hall, M., Frank, E., Holmes, G., Pfahringer, B., Reutemann, P., & Witten, I. H. (2009). The
WEKA data mining software. ACM SIGKDD Explorations Newsletter, 11(1), 10.
http://doi.org/10.1145/1656274.1656278
Hare, M. L., & Goldberg, A. E. (1999). Structural priming: Purely syntactic. In Proceedings of
the 21st annual meeting of the Cognitive Science Society (pp. 208–211). Lawrence Erlbaum
Associates London.
Harley, T. A. (2013). The psychology of language: From data to theory. Psychology Press.
Hempelmann, C. F., Rus, V., Graesser, A. C., & Mcnamara, D. S. (2006). Evaluating State-of-
the-Art Treebank-style Parsers for Coh-Metrix and Other Learning Technology

178
Environments. Natural Language Engineering, 12(02), 131–144.
Higgins, D., Xi, X., Zechner, K., & Williamson, D. (2011). A three-stage approach to the
automated scoring of spontaneous spoken responses. Computer Speech & Language, 25(2),
282–306. http://doi.org/10.1016/j.csl.2010.06.001
Hirvela, A., & Belcher, D. (2001). Coming back to voice. Journal of Second Language Writing,
10(1-2), 83–106. http://doi.org/10.1016/S1060-3743(00)00038-2
Homburg, T. J. (1984). Holistic Evaluation of ESL Compositions: Can It Be Validated
Objectively? TESOL Quarterly, 18(1), 87–107. http://doi.org/10.2307/3586337
Hunston, S., & Francis, G. (2000). Pattern grammar: A corpus-driven approach to the lexical
grammar of English. MIT Press.
Hunt, K. W. (1965). Grammatical Structures Written at Three Grade Levels. NCTE Research
Report No. 3.
Ishikawa, S. (1995). Objective measurement of low-proficiency EFL narrative writing. Journal
of Second Language Writing, 4(1), 51–69. http://doi.org/10.1016/1060-3743(95)90023-3
Jurafsky, D., & Manning, C. D. (2008). Speech and language processing: An introduction to
natural language processing, speech recognition, and computational linguistics (2nd ed.).
New Jersey: Prentice-Hall.
Kameen, P. T. (1979). Syntactic skill and ESL writing quality. In C. Yorio, K. Perkins, & J.
Schachter (Eds.), On TESOL ’79: The learner in focus (pp. 343–364). Washington, D.C.:
TESOL.
Kellogg, R. T., & Raulerson, B. A. (2007). Improving the writing skills of college students.
Psychonomic Bulletin & Review, 14(2), 237–242. http://doi.org/10.3758/BF03194058
Klein, D., & Manning, C. D. (2003). Accurate unlexicalized parsing. In Proceedings of the 41st

179
Annual Meeting on Association for Computational Linguistics - ACL ’03 (Vol. 1, pp. 423–
430). http://doi.org/10.3115/1075096.1075150
Knoch, U., Rouhshad, A., & Storch, N. (2014). Does the writing of undergraduate ESL students
develop after one year of study in an English-medium university? Assessing Writing, 21, 1–
17. http://doi.org/10.1016/j.asw.2014.01.001
Kulick, S., Kroch, A., & Santorini, B. (2014). The Penn Parsed Corpus of Modern British
English: First Parsing Results and Analysis. In ACL (2) (pp. 662–667).
Kyle, K., & Crossley, S. A. (2015). Automatically Assessing Lexical Sophistication: Indices,
Tools, Findings, and Application. TESOL Quarterly, 49(4), 757–786.
http://doi.org/10.1002/tesq.194
Landauer, T. K., Foltz, P. W., & Laham, D. (1998). An introduction to latent semantic analysis.
Discourse Processes, 25(2-3), 259–284.
Landis, J. R., & Koch, G. G. (1977). The Measurement of Observer Agreement for Categorical
Data. Biometrics, 33(1), 159–174. http://doi.org/10.2307/2529310
Langacker, R. W. (1987). Foundations of cognitive grammar: Theoretical prerequisites (Vol. 1).
Stanford university press.
Larsen-Freeman, D. (1978). An ESL Index of Development. TESOL Quarterly, 12(4), 439–448.
http://doi.org/10.2307/3586142
Larsen-Freeman, D. (1997). Chaos/Complexity Science and Second Language Acquisition.
Applied Linguistics, 18(2), 141–165. http://doi.org/10.1093/applin/18.2.141
Larsen-Freeman, D. (2006). The Emergence of Complexity, Fluency, and Accuracy in the Oral
and Written Production of Five Chinese Learners of English. Applied Linguistics , 27 (4 ),
590–619. http://doi.org/10.1093/applin/aml029

180
Larsen-Freeman, D. (2009). Adjusting Expectations: The Study of Complexity, Accuracy, and
Fluency in Second Language Acquisition. Applied Linguistics , 30 (4 ), 579–589.
http://doi.org/10.1093/applin/amp043
Larsen-Freeman, D., & Cameron, L. (2008). Research Methodology on Language Development
from a Complex Systems Perspective. The Modern Language Journal, 92(2), 200–213.
Laufer, B., & Nation, P. (1995). Vocabulary Size and Use: Lexical Richness in L2 Written
Production. Applied Linguistics, 16(3), 307–322. http://doi.org/10.1093/applin/16.3.307
Levy, R., & Andrew, G. (2006). Tregex and Tsurgeon: tools for querying and manipulating tree
data structures. Citeseer.
Lieven, E. V. M., Pine, J. M., & Baldwin, G. (1997). Lexically-based learning and early
grammatical development. Journal of Child Language, 24(01), 187–219.
Linnarud, M. (1986). Lexis in composition: A performance analysis of Swedish. Lund, Sweden:
Liber Forlag Malmo.
Littlemore, J. (2009). Applying Cognitive Linguistics to Second Language Learning and
Teaching. Houndsmill, UK: Palgrave Macmillan. http://doi.org/10.1007/978-0-230-24525-9
Lu, X. (2010). Automatic analysis of syntactic complexity in second language writing.
International Journal of Corpus Linguistics, 15(4), 474–496.
http://doi.org/10.1075/ijcl.15.4.02lu
Lu, X. (2011). A Corpus-Based Evaluation of Syntactic Complexity Measures as Indices of
College-Level ESL Writers’ Language Development. TESOL Quarterly, 45(1), 36–62.
Mackey, A., & Gass, S. M. (2005). Second language research: Methodology and design. New
York: Routledge.
MacWhinney, B., & Snow, C. (1990). The child language data exchange system: An update.

181
Journal of Child Language, 17(02), 457–472.
Marcus, M. P., Marcinkiewicz, M. A., & Santorini, B. (1993). Building a large annotated corpus
of English: the penn treebank. Computational Linguistics, 19(2), 313–330.
McNamara, D. S., Crossley, S. A., & McCarthy, P. M. (2010). Linguistic Features of Writing
Quality. Written Communication, 27(1), 57–86. http://doi.org/10.1177/0741088309351547
McNamara, D. S., Graesser, A. C., McCarthy, P. M., & Cai, Z. (2014). Automated evaluation of
text and discourse with Coh-Metrix. Cambridge University Press.
Moldovan, D., Clark, C., Harabagiu, S., & Maiorano, S. (2003). COGEX. In Proceedings of the
2003 Conference of the North American Chapter of the Association for Computational
Linguistics on Human Language Technology - NAACL ’03 (Vol. 1, pp. 87–93). Morristown,
NJ, USA: Association for Computational Linguistics.
http://doi.org/10.3115/1073445.1073467
Monroe, J. H. (1975). Measuring and Enhancing Syntactic Fluency in French. The French
Review, 48(6), 1023–1031.
Nation, I. S. P. (2001). Learning Vocabulary in Another Language. Cambridge: Cambridge
University Press.
Nevalainen, T. (2013). English historical corpora in transition: from new tools to legacy corpora.
New Methods in Historical Corpora. Tübingen: Narr Verlag, 37–53.
Ninio, A. (1999). Pathbreaking verbs in syntactic development and the question of prototypical
transitivity. Journal of Child Language, 26(03), 619–653.
Nivre, J., Hall, J., & Nilsson, J. (2006). MaltParser:: A Data-Driven Parser-Generator for
Dependency Parsing. In Proceedings of the fifth international conference on Language
Resources and Evaluation (LREC2006), May 24-26, 2006, Genoa, Italy. European

182
Language Resource Association, Paris.
Norris, J. M., & Ortega, L. (2009). Towards an Organic Approach to Investigating CAF in
Instructed SLA: The Case of Complexity. Applied Linguistics .
http://doi.org/10.1093/applin/amp044
O’Donnell, M. B., & Ellis, N. (2010). Towards an inventory of English verb argument
constructions, 9–16.
Ortega, L. (2003). Syntactic complexity measures and their relationship to L2 proficiency: A
research synthesis of college-level L2 writing. Applied Linguistics, 24(4), 492–518.
Ortega, L. (2015). Syntactic complexity in L2 writing: Progress and expansion. Journal of
Second Language Writing, 29, 82–94. http://doi.org/10.1016/j.jslw.2015.06.008
Parkinson, J., & Musgrave, J. (2014). Development of noun phrase complexity in the writing of
English for Academic Purposes students. Journal of English for Academic Purposes, 14,
48–59. http://doi.org/10.1016/j.jeap.2013.12.001
Polio, C. G. (1997). Measures of linguistic accuracy in second language writing research.
Language Learning, 47(1), 101–143.
Ramineni, C., Trapani, C. S., Williamson, D. M., Davey, T., & Bridgeman, B. (2012).
Evaluation of the e-rater® Scoring Engine for the TOEFL® Independent and Integrated
Prompts. ETS Research Report Series, 2012(1), i–51.
Römer, U. (2009). The inseparability of lexis and grammar: Corpus linguistic perspectives.
Annual Review of Cognitive Linguistics, 7(1), 140–162. http://doi.org/10.1075/arcl.7.06rom
Römer, U., O’Donnell, M. B., & Ellis, N. C. (2015). Using COBUILD grammar patterns for a
large-scale analysis of verb-argument constructions. In N. Groom, M. Charles, & J.
Suganthi (Eds.), Corpora, Grammar and Discourse: In honour of Susan Hunston (Vol. 73,

183
p. 43). Amsterdam: John Benjamins Publishing Company.
Römer, U., Roberson, A., O’Donnell, M. B., & Ellis, N. C. (2014). Linking learner corpus and
experimental data in studying second language learners’ knowledge of verb-argument
constructions. ICAME Journal, 38(1), 115–135.
Salsbury, T. (2000). The acquisitional grammaticalization of unreal conditionals and modality in
L2 English: A longitudinal perspective. Indiana University.
Shermis, M. D., & Burstein, J. (2003). Automated essay scoring a cross-disciplinary perspective.
Mahwah, N.J.: L. Erlbaum Associates.
Simpson-Vlach, R. C., & Leicher, S. (2006). The MICASE handbook: A resource for users of the
Michigan corpus of academic spoken English. University of Michigan Press.
Stefanowitsch, A., & Gries, S. T. (2003). Collostructions: Investigating the interaction of words
and constructions. International Journal of Corpus Linguistics, 8(2), 209–243.
http://doi.org/10.1075/ijcl.8.2.03ste
Tabachnick, B. G., & Fidell, L. S. (2014). Using multivariate statistics. Harlow, Essex: Pearson
Education.
Taguchi, N., Crawford, W., & Wetzel, D. Z. (2013). What Linguistic Features Are Indicative of
Writing Quality? A Case of Argumentative Essays in a College Composition Program.
TESOL Quarterly, 47(2), 420–430. http://doi.org/10.1002/tesq.91
The Neglected “R.” (2003). New York, NY, US.
Tomasello, M. (2003). Constructing a language: A usage-based theory of language acquisition.
(Harvard University Press, Ed.). Cambridge, MA.
Tomasello, M., & Brooks, P. J. (1999). Early syntactic development: A Construction Grammar
approach. In The development of language (pp. 161–190). New York, NY, US:

184
Psychology Press.
Toutanova, K., Klein, D., Manning, C. D., & Singer, Y. (2003). Feature-rich part-of-speech
tagging with a cyclic dependency network. In Proceedings of the 2003 Conference of the
North American Chapter of the Association for Computational Linguistics on Human
Language Technology - NAACL ’03 (Vol. 1, pp. 173–180). Morristown, NJ, USA:
Association for Computational Linguistics. http://doi.org/10.3115/1073445.1073478
Vann, R. J. (1979). Oral and written syntactic relationships in second language learning. On
TESOL, 79, 322–329.
Verspoor, M., Schmid, M. S., & Xu, X. (2012). A dynamic usage based perspective on L2
writing. Journal of Second Language Writing, 21(3), 239–263.
http://doi.org/10.1016/j.jslw.2012.03.007
Winter, B. (2013). Linear models and linear mixed effects models in R with linguistic
applications. arXiv:1308.5499.
Witten, I. H., & Frank, E. (2005). Data mining practical machine learning tools and techniques.
Amsterdam; Boston, MA: Morgan Kaufman.
Wolfe-Quintero, K., Inagaki, S., & Kim, H.-Y. (1998). Second language development in writing:
Measures of fluency, accuracy. & Complexity. Hawaii: University of Hawaii.
Wundt, W. M. (1900). Völkerpsychologie: Eine Untersuchung der Entwicklungsgesetze von
Sprache, Mythus und Sitte (Vol. 1). W. Engelmann.
Yang, W. (2013). Response to Biber, Gray, and Poonpon (2011). TESOL Quarterly, 47(1), 187–
191. http://doi.org/10.1002/tesq.76
Yang, W., Lu, X., & Weigle, S. C. (2015). Different topics, different discourse: Relationships
among writing topic, measures of syntactic complexity, and judgments of writing quality.

185
Journal of Second Language Writing, 28, 53–67. http://doi.org/10.1016/j.jslw.2015.02.002
Yates, F. (1934). Contingency Tables Involving Small Numbers and the χ2 Test.
Supplement to the Journal of the Royal Statistical Society, 1(2), 217–235.
http://doi.org/10.2307/2983604
Zipf, G. K. (1935). The Psycho-Biology of Language. An Introduction to Dynamic Philology.
1935. Cambridge, Mass: The MIT Press.

186
APPENDICES
Appendix A: TOEFL Independent Essay Rubric
4
3
2
1
0
A response at this level is generally good in selecting the important information from the lectureand in coherently and accurately presenting this information in relation to the relevant informationin the reading, but it may have minor omission, inaccuracy, vagueness, or imprecision of somecontent from the lecture or in connection to points made in the reading. A response is also scoredat this level if it has more frequent or noticeable minor language errors, as long as such usageand grammatical structures do not result in anything more than an occasional lapse of clarity or inthe connection of ideas.
A response at this level contains some important information from the lecture and conveys somerelevant connection to the reading, but it is marked by one or more of the following:
● Although the overall response is definitely oriented to the task, it conveys only vague, global,unclear, or somewhat imprecise connection of the points made in the lecture to points made in the reading.
● The response may omit one major key point made in the lecture.
● Some key points made in the lecture or the reading, or connections between the two, may be incomplete, inaccurate, or imprecise.
● Errors of usage and/or grammar may be more frequent or may result in noticeably vagueexpressions or obscured meanings in conveying ideas and connections.
A response at this level contains some relevant information from the lecture, but is marked by sig-nificant language difficulties or by significant omission or inaccuracy of important ideas from thelecture or in the connections between the lecture and the reading; a response at this level ismarked by one or more of the following:
● The response significantly misrepresents or completely omits the overall connection betweenthe lecture and the reading.
● The response significantly omits or significantly misrepresents important points made in the lecture.
● The response contains language errors or expressions that largely obscure connections ormeaning at key junctures, or that would likely obscure understanding of key ideas for a readernot already familiar with the reading and the lecture.
A response at this level is marked by one or more of the following:
● The response provides little or no meaningful or relevant coherent content from the lecture.
● The language level of the response is so low that it is difficult to derive meaning.
A response at this level merely copies sentences from the reading, rejects the topic or is other-wise not connected to the topic, is written in a foreign language, consists of keystroke characters,or is blank.
5
Score
A response at this level successfully selects the important information from the lecture and coher-ently and accurately presents this information in relation to the relevant information presented inthe reading. The response is well organized, and occasional language errors that are present donot result in inaccurate or imprecise presentation of content or connections.
Task Description
Copyright © 2004 by Educational Testing Service. All rights reserved.
iBT/Next Generation TOEFL TestIntegrated Writing Rubrics (Scoring Standards)