CO 2-H 2O mixtures in the geological sequestration of CO 2. II. Partitioning in chloride brines at...
40
CO 2 -H 2 O MIXTURES IN THE GEOLOGICAL SEQUESTRATION OF CO 2 . II. PARTITIONING IN CHLORIDE BRINES AT 12–100°C AND UP TO 600 BAR. NICOLAS SPYCHER KARSTEN PRUESS Earth Sciences Division, Lawrence Berkeley National Laboratory MS 90-1116, 1 Cyclotron Road, Berkeley, California, USA Submitted to Geochimica et Cosmochimica Acta September 2004 Revised January 2005
Transcript of CO 2-H 2O mixtures in the geological sequestration of CO 2. II. Partitioning in chloride brines at...
CO2-H2O MIXTURES IN THE GEOLOGICAL SEQUESTRATION
OF CO2. II. PARTITIONING IN CHLORIDE BRINES AT 12–100°C
AND UP TO 600 BAR.
NICOLAS SPYCHER
KARSTEN PRUESS
Earth Sciences Division, Lawrence Berkeley National Laboratory MS 90-1116, 1 Cyclotron Road, Berkeley, California, USA
Submitted to Geochimica et Cosmochimica Acta
September 2004
Revised January 2005
nspycher
Text Box
Geochimica et Cosmochimica Acta, Vol. 69, No. 13, pp. 3309–3320, 2005 Copyright © 2005 Elsevier Ltd doi:10.1016/j.gca.2005.01.015
1/13/2005 1 Spycher and Pruess REV 01
CO2-H2O Mixtures in the Geological Sequestration of CO2. II. Partitioning in Chloride Brines at 12−100°C and up to 600 bar.
Nicolas Spycher and Karsten Pruess
Lawrence Berkeley National Laboratory, MS 90-1116, 1 Cyclotron Road, Berkeley, California, USA
September 2004
ABSTRACT
Correlations presented by Spycher et al. (2003) to compute the mutual solubilities of CO2
and H2O are extended to include the effect of chloride salts in the aqueous phase. This is
accomplished by including, in the original formulation, activity coefficients for aqueous
CO2 derived from several literature sources, primarily for NaCl solutions. Best results
are obtained when combining the solubility correlations of Spycher et al. (2003) with the
activity coefficient formulation of Rumpf et al. (1994) and Duan and Sun (2003), which
can be extended to chloride solutions other than NaCl. This approach allows computing
mutual solubilities in a noniterative manner with an accuracy typically within
experimental uncertainty for solutions up to 6 molal NaCl and 4 molal CaCl2.
1. INTRODUCTION
In Part I of this study (Spycher et al., 2003), a noniterative approach was presented to
compute the mutual solubilities of pure H2O and CO2 in a temperature and pressure range
most relevant to the geologic sequestration of CO2. The method was intended primarily
for efficient numerical simulations of CO2 flows. Most practical modeling applications
related to CO2 sequestration (e.g., Xu et al., 2004; Pruess et al., 2004; Garcia, 2003) deal
with subsurface waters containing dissolved salts. For this reason, in Part II of this study,
we extend the solubility model to include moderately saline solutions up to 6 m NaCl and
4 m CaCl2. As before, the objective is to compute in the most efficient manner the
solubility of CO2 in the aqueous phase, as well as the H2O solubility in the compressed-
gas phase at equilibrium with the aqueous phase.
1/13/2005 2 Spycher and Pruess REV 01
Several theoretical studies of the CO2-H2O-NaCl system have been published to date,
following various approaches and equations of state (EOS). Two of the more
comprehensive solubility models developed for this system (Bowers and Helgeson, 1983;
Duan et al., 1995) lie outside the pressure-temperature-composition (P-T-X) range of
interest here. These studies covered elevated pressures and temperatures mostly relevant
to the study of hydrothermal systems and fluid inclusions. More recently, Duan and Sun
(2003) presented a model for CO2 solubility in NaCl and other electrolyte solutions
applicable to a wide P-T-X range (0– 2000 bar, 0–260°C, 0–4.3 m NaCl), overlapping
low temperatures and moderate pressures applicable to the investigation of geologic CO2
sequestration. Their model relies on an exhaustive set of experimental data from the
literature and reproduces published solubilities of CO2 in NaCl and CaCl2 solutions, as
well as in seawater, with accuracies close to experimental uncertainty. One drawback of
Duan and Sun’s model, however, is that it relies on a fifth-order virial EOS (Duan et al.,
1992) that cannot be efficiently implemented in numerical flow simulations. Also, this
model was not intended to compute the H2O solubility in the compressed CO2 gas phase,
which is one of our objectives. Nevertheless, in their study, Duan and Sun (2003) present
useful Pitzer expressions (Pitzer, 1973) and parameters to compute activity coefficients
for aqueous CO2, which are needed to account for salting-out effects. When taking into
account assumptions made by these authors, their activity coefficient formulation can be
used with our solubility correlations (Spycher et al. 2003) to yield, in a noniterative
manner, CO2 solubilities with an accuracy comparable to their results, as discussed later.
Models presented by Li and Nghiem (1986) and Enick and Klara (1990) make use of
simpler and more efficient cubic EOS. Duan et al. (2003) show that the model of Li and
Nghiem (1986), based on a Peng-Robinson EOS, is not as accurate as theirs and,
therefore, this model is not further evaluated here. Enick and Klara (1990) fitted a large
number of solubility measurements to a Henry’s-law/Peng-Robinson-EOS model, using
an approach similar to that followed in Spycher et al. (2003). They then extended their
solubility model to include electrolyte solutions by correlating solubilities with total
dissolved solids (on a weight percent basis), using a large set of experimental and field
data. In their correlation, however, these authors did not distinguish between the various

1/13/2005 3 Spycher and Pruess REV 01
types of dissolved salts in the solutions for which CO2 solubilities were regressed (NaCl,
CaCl2, and unspecified brines). Because their correlation for saline solutions inevitably
shows significant scatter and is approximate at best, it was not considered further.
Rumpf and Maurer (1993) presented a comprehensive solubility model for CO2 in
electrolyte solutions. Their model relied on solution-chemistry correlations similar to
those adopted in the present study, but used a standard virial EOS truncated after the
second term to compute fugacity coefficients. Rumpf et al. (1994) fitted this model to
their own measurements of CO2 solubility from 40 to 160°C and up to ~100 bar, in 4 and
6 m NaCl solutions. These authors used Pitzer expressions similar to those adopted by
Duan and Sun (2003) to compute activity coefficients. As shown later in this study, their
activity coefficient formulation can be extended and combined with our solubility model
(Spycher et al., 2003) to cover our entire P-T range of interest (12–100°C and up to 600
bar) with an accuracy as good as, if not better than, that of Duan and Sun’s model.
Because reasonable aqueous CO2 solubilities can be determined without considering non-
ideal mixing effects in the gas phase, other studies have focused primarily on the aqueous
phase without integrating an accurate solubility model for the compressed gas phase.
Such studies include those of Ellis and Golding (1963), Malinin and Savelyeva (1972),
Malinin and Kurovskaya (1975), Drummond (1981), and Cramer (1982), all of whom
conducted their own CO2 solubility experiments. These authors determined Henry’s
constants for pure H2O and saline solutions, from which salting-out effects could be
quantified, as further discussed later and in Appendix A-1. Nesbitt (1984) and Barta and
Bradley (1985) developed similar models using experimental data from others, but
further expanded the formulation of activity coefficients for aqueous CO2 as specified
later.
In all studies discussed above, the solubility of CO2 in water was expressed through some
form of gas-liquid partitioning function relating either directly or indirectly to a
thermodynamic equilibrium constant. If an EOS was used, this was done merely to
account for gas phase non-ideality. With this “Henry’s law” or “solution chemistry”
1/13/2005 4 Spycher and Pruess REV 01
approach, the effect of dissolved salts on CO2 solubility is treated by using an activity (or
salting-out) coefficient expressing the departure from solubility in pure water. This
approach is followed here as well. In the last decade or so, however, other solubility
models have been developed that make use of one single EOS (e.g., Peng-Robinson) to
compute the properties of both the aqueous and compressed-gas phases at equilibrium.
These models, reported primarily in the chemical engineering literature, have been
applied to pure CO2-H2O systems (e.g., Shyu et al., 1997) and to systems including
electrolyte solutions (e.g., Harvey and Prausnitz, 1989; Zuo and Guo, 1991; Soreide and
Whitson, 1992; Sorensen et al., 2002; Masoudi et al., 2004). The main drawback of these
models is that an iterative procedure must be used to solve the EOS twice, once for the
gas-phase composition and a second time for the liquid-phase composition. Furthermore,
while conceptually elegant, these models have not been shown to be superior to
traditional “Henry’s law” models and produce large errors when their parameters are
extrapolated beyond the range of measured solubilities, particularly in multicomponent
systems (e.g., Patel et al., 2001). For these reasons, and because of their incompatibility
with the more traditional correlations adopted in Spycher et al. (2003), these models were
not considered further.
2. SOLUBILITY MODEL
The formulation of the basic model (Spycher et al., 2003) is extended with an activity
coefficient for aqueous CO2 and a correction to the activity of water to account for the
effects of dissolved salts. The extended formulation is presented below, followed by a
review of available models and/or data from which activity coefficients for aqueous CO2
can be derived.
2.1 Extended Solubility Correlations
The reader is referred to Spycher et al. (2003) for the derivation of the basic correlations
and a description of conventions and standard states. In the P–T range of interest here,
dissolved salts are essentially nonvolatile and, therefore, the extended formulation hardly
changes. The water mole fraction in the CO2-rich phase (yH2O) and the CO2 mole
fraction in the aqueous phase (xCO2) are respectively expressed as:
1/13/2005 5 Spycher and Pruess REV 01
(1)
and
(2)
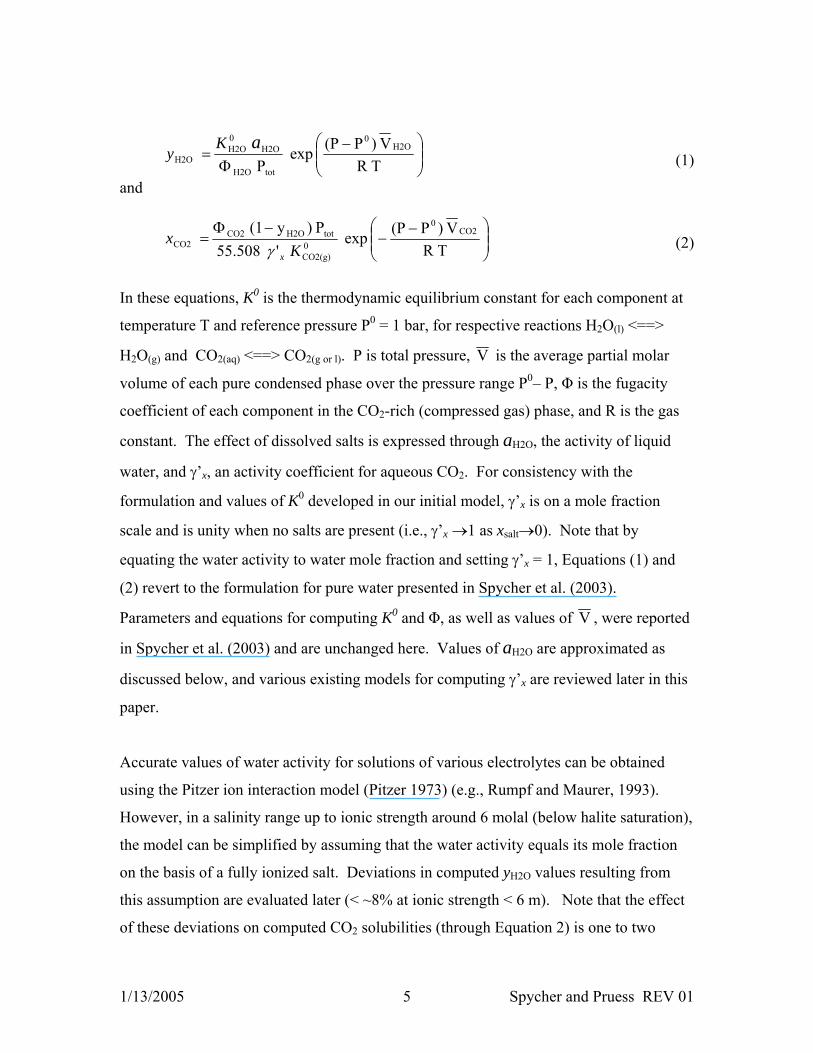
In these equations, K0 is the thermodynamic equilibrium constant for each component at
temperature T and reference pressure P0 = 1 bar, for respective reactions H2O(l) <==>
H2O(g) and CO2(aq) <==> CO2(g or l). P is total pressure, V is the average partial molar
volume of each pure condensed phase over the pressure range P0– P, Φ is the fugacity
coefficient of each component in the CO2-rich (compressed gas) phase, and R is the gas
constant. The effect of dissolved salts is expressed through aH2O, the activity of liquid
water, and γ’x, an activity coefficient for aqueous CO2. For consistency with the
formulation and values of K0 developed in our initial model, γ’x is on a mole fraction
scale and is unity when no salts are present (i.e., γ’x →1 as xsalt→0). Note that by
equating the water activity to water mole fraction and setting γ’x = 1, Equations (1) and
(2) revert to the formulation for pure water presented in Spycher et al. (2003).
Parameters and equations for computing K0 and Φ, as well as values of V , were reported
in Spycher et al. (2003) and are unchanged here. Values of aH2O are approximated as
discussed below, and various existing models for computing γ’x are reviewed later in this
paper.
Accurate values of water activity for solutions of various electrolytes can be obtained
using the Pitzer ion interaction model (Pitzer 1973) (e.g., Rumpf and Maurer, 1993).
However, in a salinity range up to ionic strength around 6 molal (below halite saturation),
the model can be simplified by assuming that the water activity equals its mole fraction
on the basis of a fully ionized salt. Deviations in computed yH2O values resulting from
this assumption are evaluated later (< ~8% at ionic strength < 6 m). Note that the effect
of these deviations on computed CO2 solubilities (through Equation 2) is one to two
T R
V )P(P exp P
H2O
0
totH2O
H2O0H2O
H2O ⎟⎟⎠
⎞⎜⎜⎝
⎛ −Φ
=aK
y
T R
V )P(P exp ' 55.508
P )y(1 CO2
0
0CO2(g)
totH2OCO2CO2 ⎟⎟
⎠
⎞⎜⎜⎝
⎛ −−
−Φ=
Kx
xγ

1/13/2005 6 Spycher and Pruess REV 01
orders of magnitude smaller, because yH2O in Equation (2) typically remains quite small
(a few percent or less at temperatures below 100°C and pressures above 25 bars or so).
Equations (1) and (2) are solved as previously by setting:
(3)
(4)
Taking the water mole fraction as a reasonable approximation of water activity, we
rewrite Equation (1) as
yH2O = A (1 – xco2 – xsalt) (5)
and the mutual solubilities are then computed as:
(6)
(7)
In Equations (5) and (6), xsalt is the mole fraction of the dissolved salt on a fully ionized
basis and including dissolved CO2. It is defined as:
(8)
where m stands for molality and υ is the stoichiometric number of ions contained in the
dissolved salt (i.e., 2 for NaCl, 3 for CaCl2, etc.). Accordingly, the CO2 molality is
expressed from the mole fraction as
T R
V )P(P exp P
A H2O0
totH2O
0H2O
⎟⎟⎠
⎞⎜⎜⎝
⎛ −Φ
=K
T R
V )P(P exp ' 55.508
P B CO2
0
0CO2(g)
totCO2⎟⎟⎠
⎞⎜⎜⎝
⎛ −−
Φ=
Kxγ
)(1 B H2OCO2 yx −=
55.508
CO2(aq)salt
saltsalt mm
mx
++=
υυ
( )( )B1/A
B1 y salt
H2O −−−
=x

1/13/2005 7 Spycher and Pruess REV 01
( )( )CO2
saltCO2CO2 1
508.55
xmx
m−
+=
υ (9)
or also as
H2O
CO2CO2
508.55
xx
m = (10)
It is more practical to use the salt molality instead of mole fraction as an input parameter
because it is independent from the CO2 solubility. This is done (see Appendix B) by
substituting Equation (7) into Equation (9), then substituting the resulting expression for
CO2 molality into Equation (8), which then yields xsalt in terms salt mυ , B, and yH2O. The
resulting expression for xsalt is then substituted into Equation (6) which, after some
rearrangement yields:
(11)
By computing fugacity coefficients as presented in Spycher et al. (2003), Equations (7)
and (11) can be solved without iteration to provide the mutual solubilities of CO2 and
H2O-salt solutions.
2.2 Activity Coefficients for Aqueous CO2
Studies by Duan and Sun (2003), Rumpf et al. (1994), He and Morse (1993), Barta and
Bradley (1985), Nesbitt (1984), Cramer (1982), and Drummond (1981) present data
and/or equations from which activity coefficients can be derived for aqueous CO2 in
NaCl and other electrolyte solutions. Activity coefficient values from these studies,
however, are not all directly comparable and yield a significant scatter (Figure 1), for
various reasons discussed below and in Appendix A.1. Note that all these studies show a
temperature dependence of salting-out effects, but only that of Duan and Sun (2003) also
include a pressure dependence to reasonably reproduce experimental solubilities.
( )( )( ) B m 508.55m B1/A
55.508 B1 saltsalt
H2O υυ ++−−
=y
1/13/2005 8 Spycher and Pruess REV 01
He and Morse (1993) determined activity coefficients of aqueous CO2 at 1.032 bar (1
atm) from 0 to 90°C for solutions of various compositions (0.1–3 m HCl, 0.5–6 m NaCl,
0.1–5 m KCl, 0.1–5 m CaCl2, 0.1–5 m MgCl2, 0.01–3 m Na2SO4, 0.01–0.9 m K2SO4 and
0.1–4 m MgSO4). These authors computed activity coefficients on a molal scale from
measurements of Henry’s law ratios (Equation A-1). They used Henry’s constants (kH)
for saline solutions determined from their own experimental data, but a Henry’s constant
at infinite dilution (k0H) determined by others (Plummer and Busenberg, 1982). Their
activity coefficients deviate significantly from other values shown in Figure 1, possibly
because of inconsistencies between their measurements and adopted k0H value. These
authors fitted their activity coefficients to a Pitzer formulation with temperature-
dependent ion-interaction parameters. Their regression with temperature appears to have
been conducted on the same number of data points as fit parameters, which could explain
the somewhat wavy behavior displayed in Figure 1. For these reasons, their activity
coefficient formulation was not considered further.
Barta and Bradley (1985) regressed the experimental data of Ellis and Golding (1963)
and Drummond (1981) for solutions up to 6.5 m NaCl, covering a P-T range around 20–
400°C and 1–400 bar, using a Pitzer ion-interaction model. These authors fitted these
data to expressions yielding Henry’s constants, as a function of temperature. Activity
coefficients on a molality scale (γ’m), with the convention that γ’m→1 as msalt→0, were
derived from their Henry’s law formulation (using Equation A-1). The values obtained
in this way are within the range of other data (Figure 1) but display a convex instead of
concave trend with temperature. These authors were not able to regress simultaneously
data for pure water and for NaCl solutions, and possibly overfitted their results.
Therefore, their model was not considered either.
In the remaining cited studies, CO2 solubilities in pure water and in saline solutions were
simultaneously considered, presenting an advantage by reducing the risk of
inconsistencies when evaluating salting-out effects. Duan and Sun (2003) simultaneously
fitted a Pitzer ion-interaction model and a thermodynamic equilibrium formulation to a
large number of solubility data for pure water and electrolyte solutions, as a function of
1/13/2005 9 Spycher and Pruess REV 01
both pressure and temperature. The experimental data regressed by Duan and Sun (2003)
cover a wide P-T-X range spanning 0–260°C, 0–2000 bar, 0–6.5 m NaCl and 0–3.9 m
CaCl2. Their activity coefficient formulation is given in Appendix A.2. This model,
however, does not yield γ’x values that can be used directly in Equation (2). This is
because these authors assumed ideal mixing and did not take into account salt effects
when expressing the partial pressure of H2O in the gas phase (however, these effects were
indirectly absorbed in their model by separate fit parameters expressing reference
chemical potential). Therefore, in their regression, the CO2 partial pressure remains the
same over pure and saline water, such that the pressure terms in Henry’s ratios in
Equation A-1 cancel out. As such, their activity coefficient formulation yields the
quantity γ* = mo/m, where mo is the CO2 molality in pure water and m the molality in
saline water (at the same given P and T). This relationship was verified from computed
values of mo and m tabulated by Duan and Sun (2003) and values of γ* calculated with
their Pitzer expression (Equation A-4). Their activity coefficient formulation can thus be
implemented with our solubility model by first applying our correlations for pure water
(setting xsalt = 0 and γ’x= 1) to determine mo, then computing the CO2 solubility in saline
solutions as m = mo/γ*. The composition of the gas phase is then determined directly
from Equation (5) after converting the salt and aqueous CO2 molalities to mole fractions
(Equations 8 and 10).
Rumpf et al. (1994) fitted the correlations of Rumpf and Maurer (1993) to their CO2
solubility measurements in the range 40–160°C and 5 – 96 bar, at 4 and 6 m NaCl. In
doing so, these authors determined Pitzer ion-interaction parameters for activity
coefficient expressions similar to those implemented by Duan and Sun (2003) (Appendix
A.2). In their limited P-T range, Rumpf et al. (1994) neglected the effect of pressure on
these parameters and included a temperature dependence only on the binary interaction
parameter. In their analysis, Rumpf et al. (1994) used a Henry’s constant for pure
solutions previously fitted to published data using the same model (Rumpf and Maurer,
1993), thus providing consistency. Their expression yields activity coefficients on a
molality scale (γ’m) with the convention that γ’m→1 as msalt→0 (Appendix A.2). For use
1/13/2005 10 Spycher and Pruess REV 01
with Equations (2) and (4), these coefficients were converted to a mole fraction scale
with the convention that γ’x→1 as xsalt→0, as shown in Appendix A.2.
Battistelli et al. (1997) regressed, as a function of temperature, salting-out coefficients
determined by Cramer (1982) for NaCl solutions from 0 to 300°C. Cramer (1982) used
his own experimental data up to 240°C, 62 bar, and 1.95 m NaCl, as well as data from
others up to ~330°C and ~200 bar at similar NaCl concentrations. The regression
equation from Battistelli et al. (1997) is given in Appendix A.2 and can be used to
compute activity coefficients through Equation A-2. Cramer’s salting-out coefficients
were derived on the basis of Henry’s constants (Equation A-1) expressed in terms of
mole fraction (and later correlated to a Setchenow equation expressed in terms of
molality). Therefore, the Cramer/Battistelli model provides activity coefficients on a
mole fraction scale (γ’x), with the convention that γ’x→1 as xsalt→0, which can be entered
directly into Equations (2) and (4) without further correction. Note that Cramer (1982)
did not see a need to take pressure into account in his fit of salting-out coefficients.
Using primarily his own experimental data, Drummond (1981) provided a useful
regression of Henry’s constants as a function of both temperature and salt molality for
solutions up to around 6.5 m NaCl and a P-T range covering approximately 20–400°C
and 1–400 bar. He expressed Henry’s law in terms of molality, and obtained a
reasonable fit of Henry’s constants without introducing a pressure dependency. Activity
coefficients on a molal scale (γ’m) can be derived from his data, with the convention that
γ’m→1 as msalt→0 (Appendix A.2). Conversion to a mole fraction scale with the
convention that γ’x→1 as xsalt→0 (Appendix A.2) yields activity coefficients within about
5% of the values given by the Cramer/Battistelli regression.
Nesbitt (1984) derived a simple relation to compute activity coefficients on a mole
fraction scale (γx) with the convention that γx→1 as xH2O→1 (Appendix A.2). This author
fitted his formulation to existing experimental data covering a P-T-X range 0–500°C, 1–

1/13/2005 11 Spycher and Pruess REV 01
1500 bar, and 0–6 m NaCl. For use with Equation (4), his model must be corrected for
the convention that γ’x→1 as xsalt→0 (Appendix A.2).
Note that the activity coefficient formulation of Nesbitt (1984), as well as the molality- to
mole fraction-scale conversion required with activity coefficients derived from
Drummond (1981) and Rumpf et al. (1994), introduce a dependency of the activity
coefficient on CO2 solubility. This requires further manipulation of Equations (7) and
(11) to solve these equations directly, because B in Equation 11 is no longer independent
of xCO2. A more practical alternative, adopted here, is to simply iterate between
Equations (7) and (11). Because the coupling between B and xCO2 is weak, values of γ’x
always converge within 3–4 iterations without any provisions to speed convergence.
3. RESULTS
CO2 solubilities calculated1 using Equations (3) to (11), in combination with the various
activity coefficient formulations discussed earlier and in Appendix A.2, were compared
to both experimental and computed data reported in the literature (Table 1). Results of
these comparisons are discussed below.
Most experimental data on CO2 solubility in aqueous electrolyte solutions have been
summarized in Scharlin (1996). Very few experimental data have been published on CO2
solubility in saline solutions at low temperatures and high pressures. Prutton and Savage
(1945) reported solubility for CaCl2 solutions near 76 and 101°C up to pressures of ~650
bar. For NaCl solutions, usable data at temperatures below 100°C are limited to
pressures up to 200 bar. These data include CO2 solubilities measured by Bando et al.
(2003), Kiepe et al. (2002), Rumpf et al. (1994), Nighswander et al. (1989), Drummond
(1981), Malinin and Kurovskaya (1975), and Malinin and Savelyeva (1972) (Table 1).
Because of the lack of experimental solubility data at low temperatures and high
pressures, we first compare our results to the computed CO2 solubilities tabulated by
Duan and Sun (2003) at 30, 60, and 90°C and 1–600 bar for solutions up to 4 m NaCl

1/13/2005 12 Spycher and Pruess REV 01
(Figure 2). Duan and Sun (2003) fitted their solubility model to all the experimental data
mentioned above, except for those of Bando et al. (2003) and Kiepe et al. (2002), and to
data from other sources covering a much wider P-T range than considered here. Their
model reproduces experimental data close to or within experimental uncertainty
(estimated by Duan and Sun at around 7%).
Combining the activity coefficient formulation of Duan and Sun (2003) (Appendix A.2)
and the solubility correlations presented earlier, the CO2 solubilities reported by Duan
and Sun (2003) (i.e., computed using their full model) are reproduced with a root-mean-
square error (RMSE) around 2% at all salt molalities (Table 1 and Figure 2). This
deviation expresses differences between the pure-water solubilities computed by each
model. The other activity coefficient formulations (Appendix A.2) produce somewhat
larger deviations but still reasonably good results, with an RMSE increasing from ~3% at
1 m NaCl up to ~10% at 4m NaCl (Table 1). Note that Duan and Sun (2003) limit their
model application to 4 m NaCl, although these authors seem to have fitted solubilities at
concentrations up to 6 m NaCl.
No experimental or computed data were available for comparing water concentrations in
the compressed gas phase (yH2O) for saline CO2-H2O solutions (Figure 2). As discussed
earlier, the accuracy of yH2O directly relates (through Equation 1) to the accuracy of the
liquid water activity, which is approximated in our model by the liquid water mole
fraction (on the basis of a fully ionized salt). The deviation between water mole fraction
and activity was evaluated using osmotic coefficient values reported by Pitzer et al.
(1984) for sodium chloride solutions and by Ananthaswamy and Atkinson (1985),
Phutela and Pitzer (1983), and Holmes et al. (1994) for calcium chloride solutions. In our
P–T range of interest, assuming that aH2O = xH2O leads to computed yH2O values deviating
positively from “true” values by about 1, 3, 5, and 8% for solutions 3, 4, 5, and 6 m NaCl,
and about 0.4, 5, 15, and 30% for solutions 1, 2, 3, and 4 m CaCl2 (ionic strength 3, 6, 9,
and 12), respectively. For these ranges in composition, differences between activity and
mole fraction due solely to temperature and pressure remain below ~1% for NaCl
1 A Fortran computer program to carry out these calculations is available from the authors upon request

1/13/2005 13 Spycher and Pruess REV 01
solutions and below ~10% for CaCl2 solutions (the temperature effect being largely
dominant). These approximate deviations in yH2O do not include the average fit error
around 5% (Spycher et al., 2003) determined from experimental data for the pure CO2-
H2O system.
Results of our solubility model combined with the various activity coefficient
formulations (Appendix A.2) were also compared directly to experimental solubilities
(Table 1 and Figures 3–6). For pure water, most of the solubility data listed in Table 1
are reproduced with RMSE values less than 5%, even though these data were not
included in the original regression (Spycher et al., 2003). The experimental CO2
solubilities of Drummond (1981) for pure water are reproduced with RMSE values about
8% (Figure 3). Solubilities reported by Kiepe et al. (2002) for pure water deviate
somewhat from the rest of the data and are reproduced with RMSE values around 10%.
For NaCl solutions, the various activity coefficient formulations reproduce experimental
data with RMSE values generally less than 10%. The activity coefficient formulations
from Duan and Sun (2003) and Rumpf et al. (1994) provide the best results (Table 1).
The latter reproduces best the solubilities measured by Rumpf et al. (1994) at 6 m NaCl
(RMSE about 2%) (Figure 4), which is to be expected, because their activity coefficient
formulation was fitted to these data. The more recent data of Bando et al. (2003) at low
salinity (~0.5 m NaCl) up to 200 bar are also reproduced with RMSE values about 2%
(Table 1 and Figure 5). Data from Kiepe et al. (2002) at higher salinity but lower
pressures are reproduced with RMSE values mostly below 10% (Table 1 and Figure 4).
The various activity coefficient formulations were also tested against data for CaCl2
solutions. Duan and Sun (2003) extended their formulation to deal with salts other than
NaCl by assuming that interaction parameters for ions with the same charge have roughly
the same values. The same method was used, here, to extend the formulation of Rumpf
et al. (1994) to CaCl2 solutions (Appendix A.2). The activity coefficient formulation
from Drummond (1981) and Cramer (1982) were extended to CaCl2 solutions by using
ionic strength in place of salt molality. The formulation of Nesbitt (1984) was extended
1/13/2005 14 Spycher and Pruess REV 01
using CaCl2 mole fractions (on a fully ionized basis) in place of NaCl mole fractions. As
expected, the activity coefficient expression of Duan and Sun (2003) and Rumpf et al.
(1994) are clearly superior in reproducing solubilities in CaCl2 solutions, showing similar
RMSE values within a 3–10% range for solutions up to 6 m CaCl2, compared to
deviations up to 95% with the other formulations (Table 1 and Figure 6). Note that even
though the computed CO2 solubility is reasonably accurate up to 6 m CaCl2, large errors
in computed yH2O values (>30%) are expected to occur at concentrations > 4 m CaCl2
because aH2O is approximated by xH2O in Equation 1.
4. DISCUSSION AND CONCLUSIONS
For NaCl solutions up to 2 molal, all activity coefficient formulations provide reasonable
CO2 aqueous solubilities within ~10% of the experimental and computed reference data
shown in Table 1. At molalities up to 6 m NaCl and 4 m CaCl2, the activity coefficient
expressions of Duan and Sun (2003) and Rumpf et al. (1994) provide more accurate
results, reflecting the superiority of the Pitzer formulation over simpler models. Overall,
the activity coefficient formulation of Rumpf et al. (1994) yields slightly smaller RMSE
values relative to experimental data, most visibly (and expectedly) so when comparing
results against the solubility measurements made by these authors at 6 m NaCl (Figure 4).
However, in the absence of more experimental data at these salinities and at high
pressures, it is difficult to assess which of these two formulations is more accurate. Note
that the formulation of Rumpf et al. (1994) yields good results within a P-T range
significantly larger than the range covered by these authors when regressing their data
(pressures limited to ~100 bar and no temperatures below 40°C). Also, their formulation
(which is only a function of temperature) yields an accuracy similar to that of Duan and
Sun’s formulation (which is pressure and temperature dependent), indicating that within
the pressure range considered here (up to ~600 bars) a pressure correction to activity
coefficients is not necessary.
Using the activity coefficient formulation of Duan and Sun (2003) allows computing the
mutual solubilities of CO2 and H2O in a noniterative manner. As discussed earlier, the
formulation of Rumpf et al. (1994) is most easily implemented using a few iterations

1/13/2005 15 Spycher and Pruess REV 01
because of the (weak) dependence of activity coefficients on the CO2 solubility
(introduced by the conversion from a molality to a mole fraction scale). This is not seen
as a disadvantage, however, because the type of iterative procedure and equations
involved would not significantly decrease performance when implemented into large
numerical simulations. In any case, using either approach, the EOS required to calculate
mutual solubilities is solved noniteratively (Spycher et al., 2003).
By combining either of these two activity coefficient formulations (Appendix A.2) with
our solubility correlations, mutual CO2-H2O solubilities in the range 12–100°C, 1–600
bar, and 0–6 m NaCl (or 4 m CaCl2) can be computed in a direct manner, yielding CO2
solubilities with an accuracy (typically < 7%) within the spread of experimental data.
We tend to favor the formulation of Duan and Sun (2003) because it was fitted over a
wider P-T range than the formulation of Rumpf et al. (1994) and is somewhat easier to
implement. It must be recalled, however, that CO2 aqueous solubilities computed at
pressures above ~100 bar and temperatures below ~100°C may have a large uncertainty,
because they rely on very few experimental data points. As more experimental data
become available in this P-T range, a refit of ion-interaction parameters, as done
previously by Duan and Sun (2003) and Rumpf et al. (1994), but using our solubility
correlations, may increase the model confidence and accuracy for applications to
geologic CO2 sequestration.
Acknowledgment
We thank two anonymous reviewers and the Associate Editor, D. Wesolowski, for their
useful comments. We also thank John Apps and Carl Steefel for their internal review of
this paper. This work was supported by the US Department of Energy through the Office
of Basic Energy Sciences under Contract No. DE-AC03-76SF00098.
References
Bando, S., Takemura, F., Nishio, M., Hihara, E., and Akai, M., 2003. Solubility of CO2
in aqueous solutions of NaCl at 30 to 60°C and 10 to 20 MPa. J. Chem. Eng. Data, 48,
576-579.
1/13/2005 16 Spycher and Pruess REV 01
Barta, L., Bradley D.J., 1985. Extension of the specific interaction model to include gas
solubilities in high temperatures brines. Geochimica Cosmochimica Acta 49, 195–203.
Battistelli, A., Calore, C., Pruess, K., 1997. The simulator TOUGH2/EWASG for
modeling geothermal reservoirs with brines and non-condensible gas. Geothermics 26,
437–464.
Bowers, T.S., Helgeson, H.C., 1983. Calculation of the thermodynamic and geochemical
consequences of nonideal mixing in the system H2O-CO2-NaCl on phase relations in
geologic systems: Equation of state for H2O-CO2-NaCl fluids at high pressures and
temperatures. Geochimica Cosmochimica Acta 47, 1247–1275.
Cramer, S.D., 1982. The solubility of methane, carbon dioxide, and oxygen in brines
from 0 to 300°C. Report of Investigations 8706, U.S. Department of the Interior, Bureau
of Mines.
Denbigh, K., 1983. The Principles of Chemical Equilibrium, 4th. ed., Cambridge Univ.
Press, 494 p.
Diamond, L.W., Akinfiev, N.N., 2003. Solubility of CO2 in water from –1.5 to 100°C
and from 0.1 to 100 MPa: evaluation of literature data and thermodynamic modeling.
Fluid Phase Equilibria 208, 265–290.
Drummond, S.E., 1981. Boiling and mixing of hydrothermal fluids: chemical effects on
mineral precipitation. Ph.D. thesis, Pennsylvania State University.
Duan, Z., Sun, R., 2003. An improved model calculating CO2 solubility in pure water
and aqueous NaCl solutions from 257 to 533 K and from 0 to 2000 bar. Chemical
Geology 193, 257–271.

1/13/2005 17 Spycher and Pruess REV 01
Duan, Z., Møller, N., Weare, H., 1995. Equation of state for the NaCl-H2O-CO2 system:
Prediction of phase equilibria and volumetric properties. Geochimica Cosmochimica
Acta 59, 2869–2882.
Duan, Z., Møller, N., Weare, J.H., 1992. An equation of state for the CH4-CO2-H2O
system: II. Mixtures from 50 to 1000°C and 0 to 1000 bars. Geochim. Cosmochim. Acta
56, 2619-2631.
Ellis, A.J., Golding, R.M., 1963. The solubility of carbon dioxide above 100°C in water
and in sodium chloride solutions. Am. J. Sci. 261, 47–60.
Enick, R.M., Klara, S.M., 1990. CO2 solubility in water and brine under reservoir
conditions. Chem. Eng. Comm., 90, 23–33.
Garcia, J.E., 2003. Fluid dynamics of carbon dioxide disposal into saline aquifers. Ph.D.
thesis, University of California, Berkeley. LBNL Report 54280, Lawrence Berkeley
National Laboratory, Berkeley, California.
Harvey, A.H., Prausnitz, J.M., 1989. Thermodynamics of high-pressure aqueous systems
containing gases and salts. AIChE J. 35, 635–644.
He, S., Morse, W., 1993. The carbonic acid system and calcite solubility in aqueous Na-
K-Ca-Mg-Cl-SO4 solutions from 0 to 90°C. Geochimica Cosmochimica Acta 57, 3533–
3554.
Holmes, H.S., Busey, R.H., Simonson, J.M., Mesmer, R.E., 1994. CaCl2(aq) at elevated
temperatures. Enthalpies of dilution, isopiestic molalities, and thermodynamic
properties. J. Chem. Thermodynamics, 26, 271–298.
Kiepe, J., Horstmann, S., Fisher, K., and Gmehling, J., 2002. Experimental
determination and prediction of gas solubility data for CO2 + H2O mixtures containing
1/13/2005 18 Spycher and Pruess REV 01
NaCl or KCl at temperatures between 313 and 393 K and pressures up to 10 MPa. Ind.
Eng. Chem. Res., 41, 4393-4398.
Li, Y., Nghiem, L.X., 1986. Phase equilibria of oil, gas, and water/brine mixtures from a
cubic equation of state and Henry’s law. Can. J. Chem. Eng., 64, 486–496.
Malinin, S.D., Kurovskaya, N.A., 1975. Investigations of CO2 solubility in a solution of
chlorides at elevated temperatures and pressures of CO2. Geokhymia 4, 547–551.
Malinin, S.D., Savelyeva, N.I., 1972. The solubility of CO2 in NaCl and CaCl2 solutions
at 25, 50, and 75°C under elevated CO2 pressures. Geokhymia 6, 643–653.
Masoudi, R., Tohidi, B., Danesh, A., Todd, A.C., 2004. A new approach in modeling
phase equilibria and gas solubility in electrolyte solutions and its applications to gas
hydrates. Fluid Phase Equilibria 215, 163–174.
Nesbitt, H.W., 1984. Calculation of the solubility of CO2 in NaCl-rich hydrothermal
solutions using regular solution equations. Chemical Geology 43, 319–330.
Nighswander, J.A., Kalogerakis, N., Mehotra, A.K., 1989. Solubilities of carbon dioxide
in water and 1 wt% NaCl solution at pressures up to 10MPa and temperatures from 80 to
200°C. C. J. Chem. Eng. Data 34, 355–360.
Patel, N.C., Abovsky, V., Watanasiri, S., 2001. Calculation of vapor-liquid equilibria for
a 10-component system: comparison of EOS, EOS-GE and GE-Henry’s law models.
Fluid Phase Equilibria 185, 297–405.
Phutela, R.C., Pitzer, K.S., 1983. Thermodynamics of aqueous calcium chloride. J.
Solution Chem. 12, 201–207.
1/13/2005 19 Spycher and Pruess REV 01
Pitzer, K.S., 1973. Thermodynamics of electrolytes: I. Theoretical basis and general
equations. J. Phys. Chem. 77, 268–277.
Pitzer, K.S., Peiper, J.C., Busey, R.H., 1984. Thermodynamic properties of aqueous
sodium chloride solutions. J. Phys. Chem. Ref. Data 13, 1-64.
Plummer, N.L., Busengerg, E., 1982. The solubility of calcite, aragonite, and vaterite in
CO2-water solutions between 0 and 90°C and an evaluation of the aqueous models for the
system CO2-H2O-CaCO3. Geochimica Cosmochimica Acta 46, 1011–1040.
Pruess, K., Garcia, J., Kovscek, T., Oldenburg, C., Rutvist, J., Steefel, C., and Xu, T.,
2004. Code intercomparison builds confidence in numerical simulation models for
Geologic disposal of CO2. Energy, 29, (9-10), 1431-1444.
Prutton, C.F., Savage, R.L., 1945. The solubility of carbon dioxide in calcium chloride-
water solutions at 75, 100, 120°C and high pressures. J. Am. Chem.Soc. 67, 1550–1554.
Rumpf, B., Nicolaisen, H., Ocal, C., Maurer, G., 1994. Solubility of carbon dioxide in
aqueous solutions of sodium chloride: experimental results and correlation. J. Solution
Chem. 23, 431–448.
Sharlin, P., 1996. Carbon dioxide in water and aqueous electrolyte solutions. Solubility
Data Series, Volume 62, International Union of Pure and Applied Chemistry, Oxford
University Press, 383 p.
Shyu, G.-S., Hanif, N.S.M, Hall, K.R., Eubank, P.T., 1997. Carbon dioxide-water phase
equilibria results from the Wong-Sandler combining rules. Fluid Phase Equilibria 130,
73-85.
Søreide, I., Whitson, C.H., 1992. Peng-Robinson predictions for hydrocarbons, CO2, N2,
and H2S with pure water and NaCl brine. Fluid Phase Equilibria 77, 217–240.

1/13/2005 20 Spycher and Pruess REV 01
Sørensen, H., Pedersen, K.S., Christensen, P.L., 2002. Modeling of gas solubility in
brine. Organic Geochemistry 33, 635–642.
Spycher, N., Pruess, K., and Ennis-King, J., 2003. CO2-H2O mixtures in the geological
sequestration of CO2. I. Assessment and calculation of mutual solubilities from 12 to
100°C and up to 600 bar. Geochimica Cosmochimica Acta, 67, 3015–3031.
Takenouchi, S. and Kennedy, G.C., 1964. The binary system H2O-CO2 at high
temperatures and pressures. Am. J. Sci., 262, 1055–1074.
Wolery, T., 1992. EQ3/6: software package for geochemical modeling of aqueous
systems: package overview and installation guide (version 8.0). Lawrence Livermore
National Laboratory Report UCRL-MA-110662 PTI. Livermore, California.
Xu, T., Apps, J.A., and Pruess, K., 2004. Numerical simulation of CO2 disposal by
mineral trapping in deep aquifers. Applied Geochemistry, 19, 917–936.
Zuo, Y., Guo, T.M., 1991. Extension of the Patel-Teja equation of state to the prediction
of the solubility of natural gas in formation water. Chem. Eng. Sci. 46, 3251–3258.
1/13/2005 21 Spycher and Pruess REV 01
Appendix A
Activity Coefficient Formulations for Aqueous CO2
1/13/2005 22 Spycher and Pruess REV 01
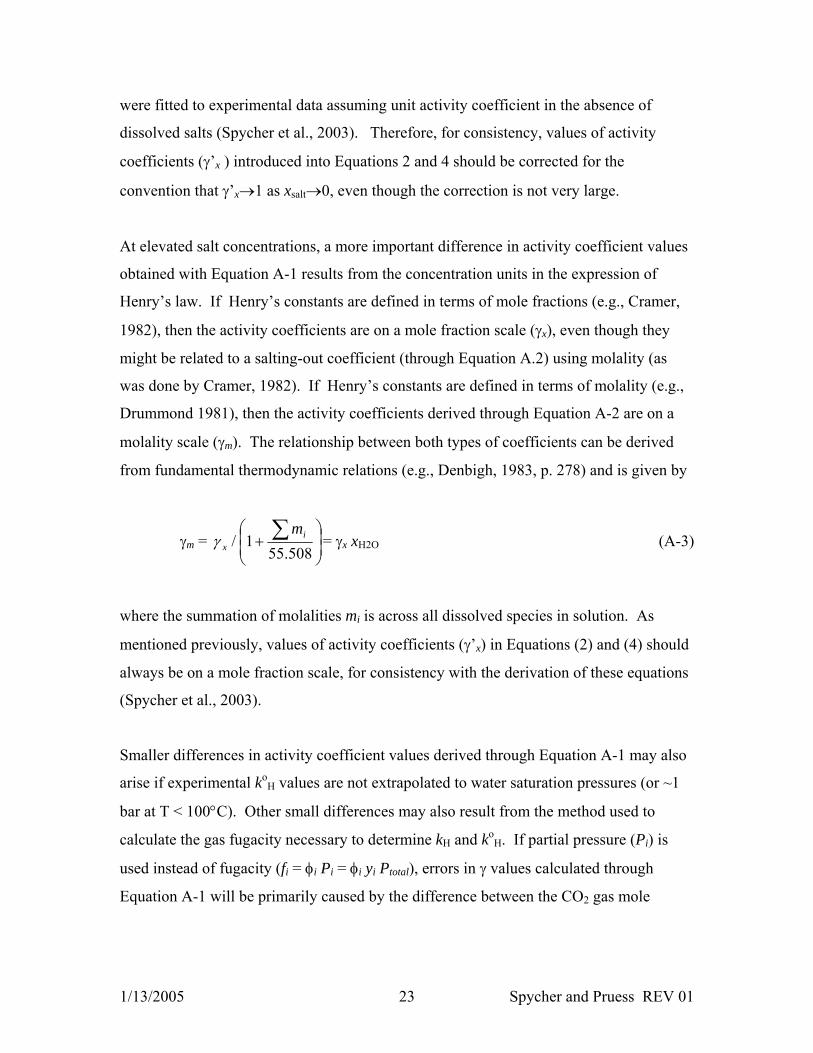
A.1 General Considerations
The usual approach to determining activity coefficients of dissolved gases in water is to
make use of the relationship
ln(γ) = ln(kH / koH) (A-1)
where kH and koH is the ratio of gas fugacity (f) to aqueous molality (m) or mole fraction
(x) (Henry’s constant) in saline and pure water, respectively (i.e., kH = f/m or kH = f/x, as
discussed below).
When using Equation A-1, the definition and concentration units used for expressing kH
and koH are crucial in the definition of γ. Fundamentally, ko
H should be a true
equilibrium constant extrapolated to conditions of infinite dilution (at ~1 bar, or water
saturation pressure above 100°C), in which case Equation (A-1) yields a “true” activity
coefficient, depending not only on salt concentration but also deviating from unity at non-
zero concentrations of the dissolved gas (i.e., the convention that γ→1 as xCO2 or
mCO2→0). Practically, however, koH is often taken as the ratio of the gas fugacity to the
gas solubility in pure water but not extrapolated to infinite dilution. In this case, the
activity coefficients obtained with Equation (A-1) are unity in pure water (i.e., γ’→1 as
xsalt or msalt→0), and can be related to the salting-out coefficient, ks, through the
Sechenow equation
ln(γ’) = ks msalt (A-2)
Note that the salt molality (msalt) in Equation A-2 is commonly replaced by ionic strength
for salts other than 1:1 electrolytes.
The difference between γ and γ’ can be evaluated using expressions presented by
Diamond and Akinfiev (2003) to compute the activity coefficient of CO2 in pure water.
In our P-T range of interest, the difference is always less than 7%. Note that this
difference is absorbed into the values of K0CO2 in Equations 2 and 4, because these values
1/13/2005 23 Spycher and Pruess REV 01
were fitted to experimental data assuming unit activity coefficient in the absence of
dissolved salts (Spycher et al., 2003). Therefore, for consistency, values of activity
coefficients (γ’x ) introduced into Equations 2 and 4 should be corrected for the
convention that γ’x→1 as xsalt→0, even though the correction is not very large.
At elevated salt concentrations, a more important difference in activity coefficient values
obtained with Equation A-1 results from the concentration units in the expression of
Henry’s law. If Henry’s constants are defined in terms of mole fractions (e.g., Cramer,
1982), then the activity coefficients are on a mole fraction scale (γx), even though they
might be related to a salting-out coefficient (through Equation A.2) using molality (as
was done by Cramer, 1982). If Henry’s constants are defined in terms of molality (e.g.,
Drummond 1981), then the activity coefficients derived through Equation A-2 are on a
molality scale (γm). The relationship between both types of coefficients can be derived
from fundamental thermodynamic relations (e.g., Denbigh, 1983, p. 278) and is given by
γm = ⎟⎟⎠
⎞⎜⎜⎝
⎛+ ∑
508.551 / i
x
mγ = γx xH2O (A-3)
where the summation of molalities mi is across all dissolved species in solution. As
mentioned previously, values of activity coefficients (γ’x) in Equations (2) and (4) should
always be on a mole fraction scale, for consistency with the derivation of these equations
(Spycher et al., 2003).
Smaller differences in activity coefficient values derived through Equation A-1 may also
arise if experimental koH values are not extrapolated to water saturation pressures (or ~1
bar at T < 100°C). Other small differences may also result from the method used to
calculate the gas fugacity necessary to determine kH and koH. If partial pressure (Pi) is
used instead of fugacity (fi = φi Pi = φi yi Ptotal), errors in γ values calculated through
Equation A-1 will be primarily caused by the difference between the CO2 gas mole
1/13/2005 24 Spycher and Pruess REV 01
fraction (yi) over pure and saline water (the difference between fugacity coefficient values
(φCO2) over pure and saline water is negligible in our P-T range of interest).
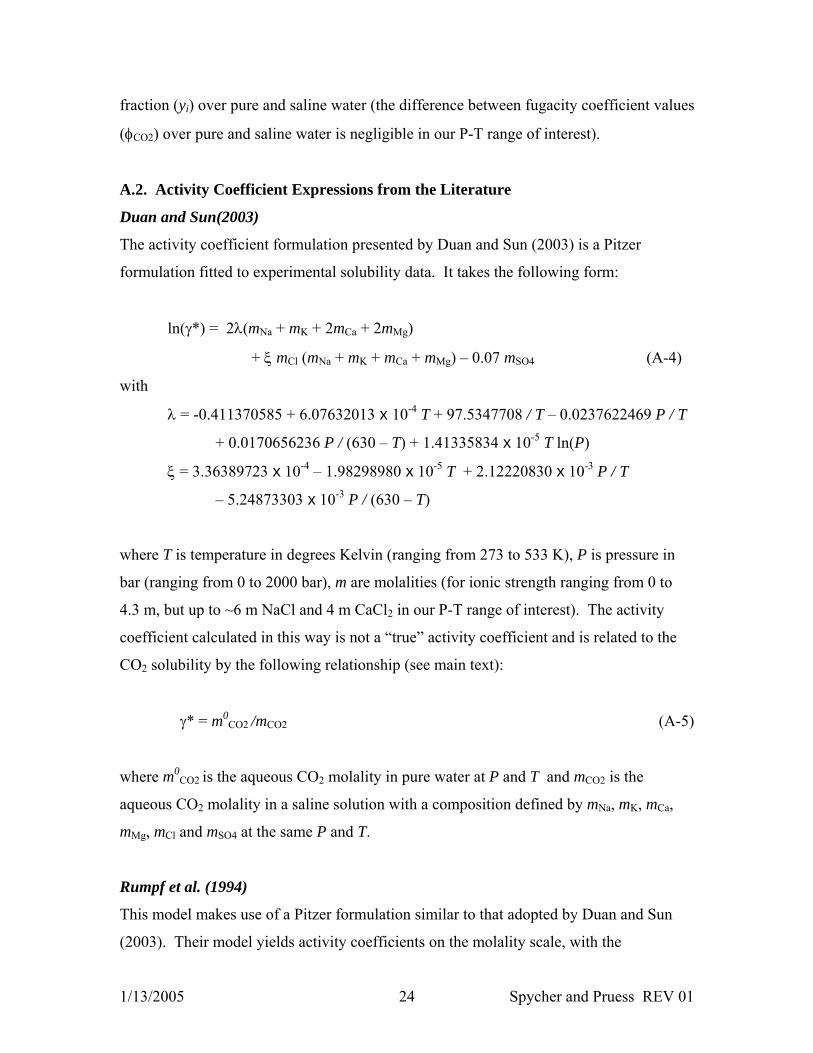
A.2. Activity Coefficient Expressions from the Literature
Duan and Sun(2003)
The activity coefficient formulation presented by Duan and Sun (2003) is a Pitzer
formulation fitted to experimental solubility data. It takes the following form:
ln(γ*) = 2λ(mNa + mK + 2mCa + 2mMg)
+ ξ mCl (mNa + mK + mCa + mMg) – 0.07 mSO4 (A-4)
with
λ = -0.411370585 + 6.07632013 x 10⁻⁴ T + 97.5347708 / T – 0.0237622469 P / T
+ 0.0170656236 P / (630 – T) + 1.41335834 x 10⁻⁵ T ln(P)
ξ = 3.36389723 x 10⁻⁴ – 1.98298980 x 10⁻⁵ T + 2.12220830 x 10⁻³ P / T
– 5.24873303 x 10⁻³ P / (630 – T)
where T is temperature in degrees Kelvin (ranging from 273 to 533 K), P is pressure in
bar (ranging from 0 to 2000 bar), m are molalities (for ionic strength ranging from 0 to
4.3 m, but up to ~6 m NaCl and 4 m CaCl2 in our P-T range of interest). The activity
coefficient calculated in this way is not a “true” activity coefficient and is related to the
CO2 solubility by the following relationship (see main text):
γ* = m0CO2 /mCO2 (A-5)
where m0CO2 is the aqueous CO2 molality in pure water at P and T and mCO2 is the
aqueous CO2 molality in a saline solution with a composition defined by mNa, mK, mCa,
mMg, mCl and mSO4 at the same P and T.
Rumpf et al. (1994)
This model makes use of a Pitzer formulation similar to that adopted by Duan and Sun
(2003). Their model yields activity coefficients on the molality scale, with the

1/13/2005 25 Spycher and Pruess REV 01
convention that γ’m→1 as msalt→0. Rumpf et al. (1994) use solubility correlations
(Rumpf and Maurer, 1993) without simplifications, and their activity coefficients are
appropriate for use in Equations (2) and (4) after conversion to a mole fraction scale, as
shown below. The activity coefficients are given by
ln(γ’m) = 2 msalt B(0) + 3 msalt 2 Γ (A-6)
with
B(0) = 0.254 – 76.82/T – 10656/T 2 + 6312 x 103/T 3
Γ = – 0.0028
where T is temperature in degrees Kelvin (ranging from 313 to 433 K) and msalt is NaCl
molality (up to 6 molal). For extension to other chloride solutions, we extend their model
using the same simplifications as proposed by Duan et al. (1992) (and applied by Duan et
al. 2003), based on the assumption that interaction parameters for ions with the same
charge have roughly the same values. Doing so yields
ln(γ’m) = 2 B(0) (mNa + mK + 2mCa + 2mMg)
+ 3 Γ mCl (mNa + mK + mCa + mMg) (A-7)
where m stands for the molality of each individual ion in solution. For compatibility
with Equations (2) and (4), the activity coefficients are converted (Equation A-3) to a
mole fraction scale and convention that γ’x→1 as xsalt→0 using the following relationship:
γ’x = ⎟⎟⎠
⎞⎜⎜⎝
⎛+⎟
⎟⎠
⎞⎜⎜⎝
⎛ ++ ∑ ≠
508.551
508.551 ' CO2(aq)CO2(aq)CO2(aq) mmm i
mγ
(A-8)

1/13/2005 26 Spycher and Pruess REV 01
Cramer (1982)/Battistelli et al. (1997)
This model is derived from salting-out coefficients (ks) reported by Cramer (1982), for
NaCl solutions, and regressed as a function of temperature by Battistelli et al. (1997).
The model takes the form:
log10(γ’x) = ks msalt (A-9)
with
ks = 1.19784 x 10⁻¹ –7.17823 x 10⁻⁴ T + 4.93854 x 10⁻⁶ T 2 – 1.03826 x 10⁻⁸ T 3
+ 1.08233 x 10⁻¹¹ T 4
where T is temperature in degrees centigrade (ranging 0 – 350°C) and msalt is NaCl
molality (ranging 0–1.95 m). As discussed earlier, values of γ’x in this particular case are
on a mole fraction scale, with the convention that γ’x→1 as xsalt→0, and can be used
directly in Equations (2) and (4) without further correction.
Drummond (1981)
Drummond (1981) reported regression equations to compute Henry’s law constants as a
function of temperature and NaCl molality. From his Henry’s law expressions and
Equation A-1, the following activity coefficient formulation can be derived:
ln(γ’m) = ( – 1.0312 + 1.2806 x 10⁻³ T + 255.9 / T ) ms
– (0.4445 – 1.606 x 10⁻³ T ) ms / (ms + 1) (A-10)
where T is temperature in degrees Kelvin (for ~20 – 400°C) and ms is NaCl molality (for
0–6.5 m). The activity coefficient values given by this equation are on a molality scale
with the convention that γ’m→1 as ms→0. Identical expressions have been derived by
others for implementation into geochemical modeling codes (e.g., Wolery 1986). For
compatibility with Equations (2) and (4), these activity coefficients are converted to a
mole fraction scale, with the convention that γ’x→1 as xsalt→0, using Equation A-8.
1/13/2005 27 Spycher and Pruess REV 01
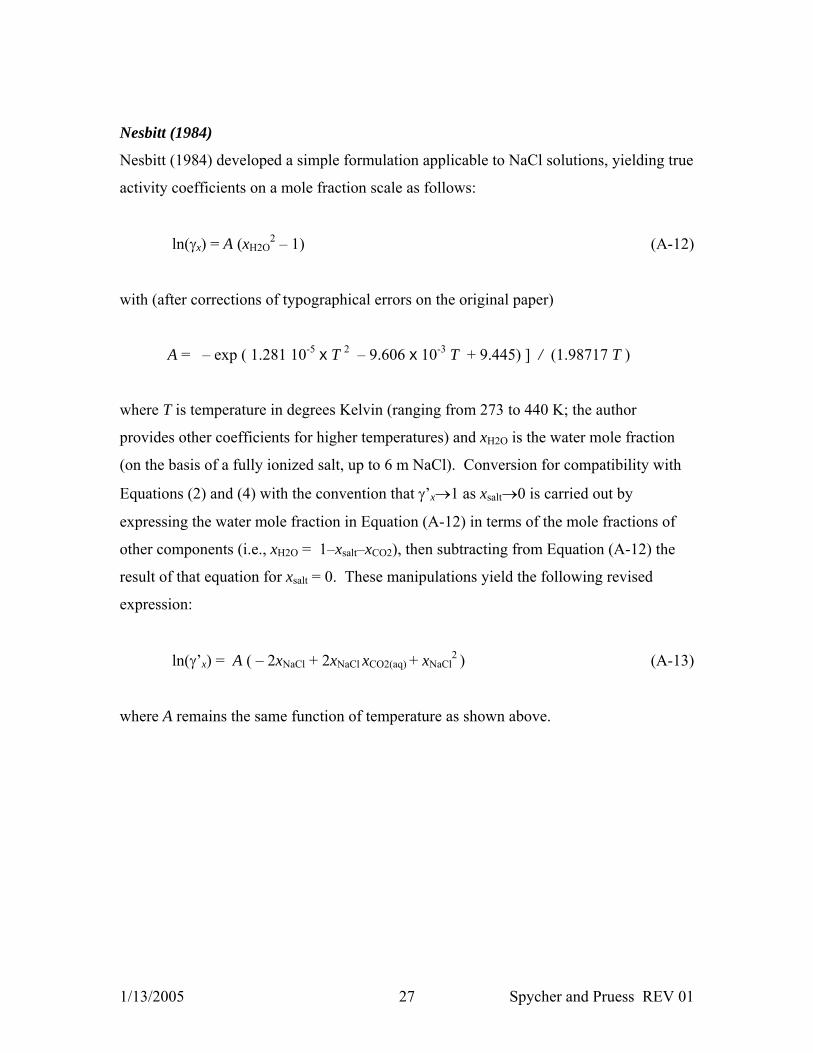
Nesbitt (1984)
Nesbitt (1984) developed a simple formulation applicable to NaCl solutions, yielding true
activity coefficients on a mole fraction scale as follows:
ln(γx) = A (xH2O2 – 1) (A-12)
with (after corrections of typographical errors on the original paper)
A = – exp ( 1.281 10-5 x T 2 – 9.606 x 10⁻³ T + 9.445) ] / (1.98717 T )
where T is temperature in degrees Kelvin (ranging from 273 to 440 K; the author
provides other coefficients for higher temperatures) and xH2O is the water mole fraction
(on the basis of a fully ionized salt, up to 6 m NaCl). Conversion for compatibility with
Equations (2) and (4) with the convention that γ’x→1 as xsalt→0 is carried out by
expressing the water mole fraction in Equation (A-12) in terms of the mole fractions of
other components (i.e., xH2O = 1–xsalt–xCO2), then subtracting from Equation (A-12) the
result of that equation for xsalt = 0. These manipulations yield the following revised
expression:
ln(γ’x) = A ( – 2xNaCl + 2xNaCl xCO2(aq) + xNaCl2 ) (A-13)
where A remains the same function of temperature as shown above.

1/13/2005 28 Spycher and Pruess REV 01
Appendix B Derivation of Equation 11

1/13/2005 29 Spycher and Pruess REV 01
First, the CO2 molality is expressed by substituting Equation (7) into Equation (9):
( ))B(11
508.55 m )B(1
H2O
saltH2OCO2 y
ym
−−+−
=υ
(B-1)
The salt mole fraction is then obtained by substituting Equation (B-1) into Equation (8):
( ))B(11
508.55 m )(1 B508.55m
m
H2O
saltH2Osalt
saltsalt
yy
x
−−+−
++=
υυ
υ (B-2)
Equation (B-2) is then expanded to yield:
( )508.55 m )B(1)]B(11[ 508.55)]B(11[m )]B(11[m
saltH2OH2OH2Osalt
H2Osaltsalt +−+−−+−−
−−=
υυυ
yyyyx
(B-3)
which, after further expansion and cancellation of several terms becomes:
508.55m Bm Bm m
salt
H2Osaltsaltsaltsalt +
+−=
υυυυ y
x (B-4)
Substituting Equation (B-4) into Equation (6) and rearranging yields final Equation (11):
( )( )( ) B m 508.55m B1/A
55.508 B1 saltsalt
H2O υυ ++−−
=y
1/13/2005 30 Spycher and Pruess REV 01
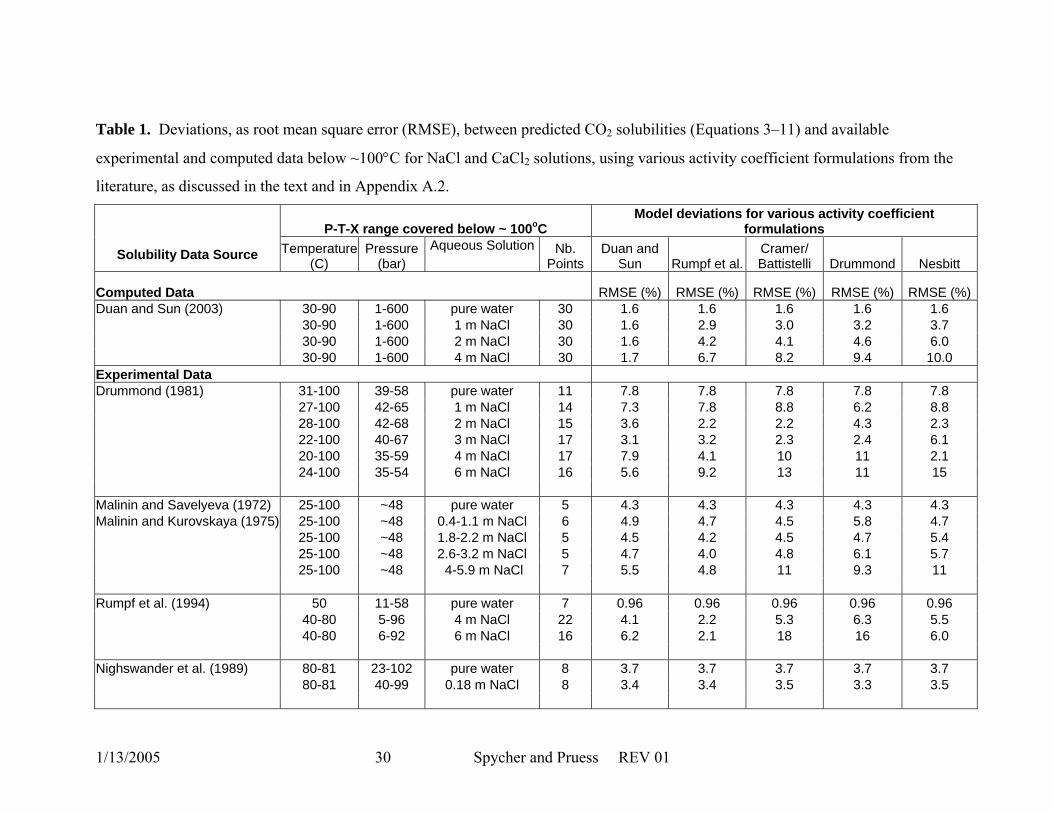
Table 1. Deviations, as root mean square error (RMSE), between predicted CO2 solubilities (Equations 3–11) and available
experimental and computed data below ~100°C for NaCl and CaCl2 solutions, using various activity coefficient formulations from the
literature, as discussed in the text and in Appendix A.2.
P-T-X range covered below ~ 100oC Model deviations for various activity coefficient
formulations
Solubility Data Source Temperature (C)
Pressure (bar)
Aqueous Solution Nb. Points
Duan and Sun Rumpf et al.
Cramer/ Battistelli Drummond Nesbitt
Computed Data RMSE (%) RMSE (%) RMSE (%) RMSE (%) RMSE (%) Duan and Sun (2003) 30-90 1-600 pure water 30 1.6 1.6 1.6 1.6 1.6 30-90 1-600 1 m NaCl 30 1.6 2.9 3.0 3.2 3.7 30-90 1-600 2 m NaCl 30 1.6 4.2 4.1 4.6 6.0 30-90 1-600 4 m NaCl 30 1.7 6.7 8.2 9.4 10.0 Experimental Data Drummond (1981) 31-100 39-58 pure water 11 7.8 7.8 7.8 7.8 7.8 27-100 42-65 1 m NaCl 14 7.3 7.8 8.8 6.2 8.8 28-100 42-68 2 m NaCl 15 3.6 2.2 2.2 4.3 2.3 22-100 40-67 3 m NaCl 17 3.1 3.2 2.3 2.4 6.1 20-100 35-59 4 m NaCl 17 7.9 4.1 10 11 2.1 24-100 35-54 6 m NaCl 16 5.6 9.2 13 11 15 Malinin and Savelyeva (1972) 25-100 ~48 pure water 5 4.3 4.3 4.3 4.3 4.3 Malinin and Kurovskaya (1975) 25-100 ~48 0.4-1.1 m NaCl 6 4.9 4.7 4.5 5.8 4.7 25-100 ~48 1.8-2.2 m NaCl 5 4.5 4.2 4.5 4.7 5.4 25-100 ~48 2.6-3.2 m NaCl 5 4.7 4.0 4.8 6.1 5.7 25-100 ~48 4-5.9 m NaCl 7 5.5 4.8 11 9.3 11 Rumpf et al. (1994) 50 11-58 pure water 7 0.96 0.96 0.96 0.96 0.96 40-80 5-96 4 m NaCl 22 4.1 2.2 5.3 6.3 5.5 40-80 6-92 6 m NaCl 16 6.2 2.1 18 16 6.0 Nighswander et al. (1989) 80-81 23-102 pure water 8 3.7 3.7 3.7 3.7 3.7 80-81 40-99 0.18 m NaCl 8 3.4 3.4 3.5 3.3 3.5
1/13/2005 31 Spycher and Pruess REV 01
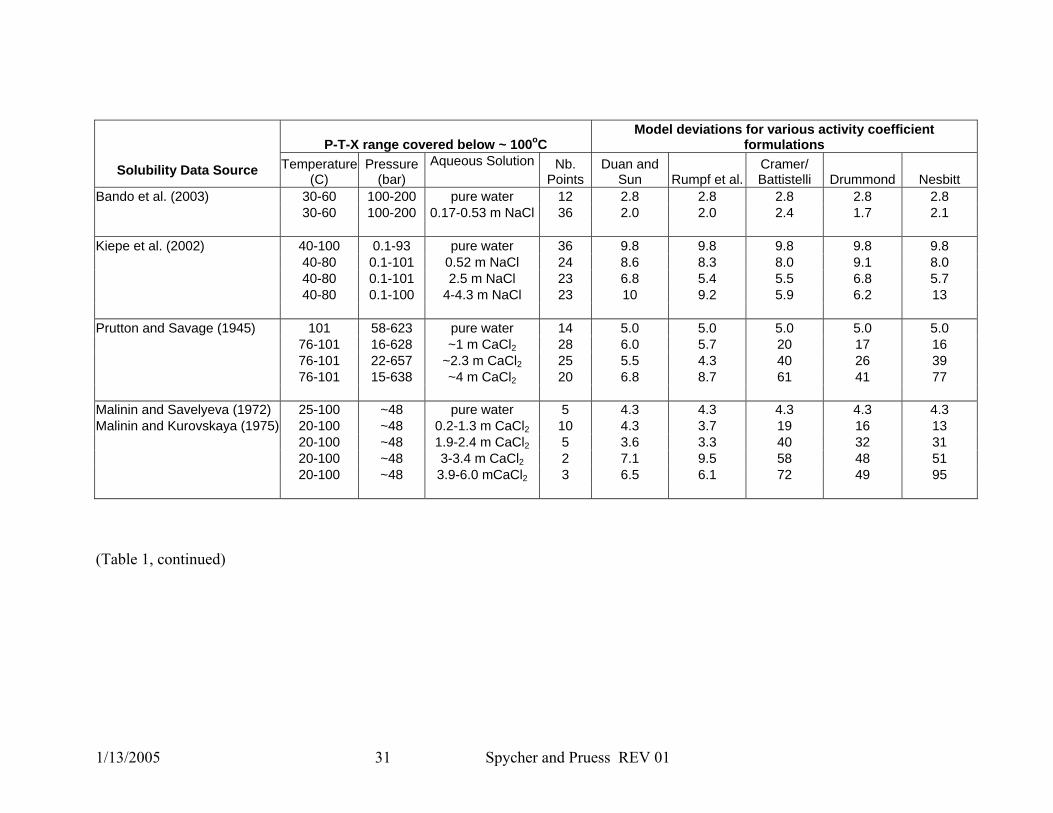
P-T-X range covered below ~ 100oC Model deviations for various activity coefficient
formulations
Solubility Data Source Temperature (C)
Pressure (bar)
Aqueous Solution Nb. Points
Duan and Sun Rumpf et al.
Cramer/ Battistelli Drummond Nesbitt
Bando et al. (2003) 30-60 100-200 pure water 12 2.8 2.8 2.8 2.8 2.8 30-60 100-200 0.17-0.53 m NaCl 36 2.0 2.0 2.4 1.7 2.1 Kiepe et al. (2002) 40-100 0.1-93 pure water 36 9.8 9.8 9.8 9.8 9.8 40-80 0.1-101 0.52 m NaCl 24 8.6 8.3 8.0 9.1 8.0 40-80 0.1-101 2.5 m NaCl 23 6.8 5.4 5.5 6.8 5.7 40-80 0.1-100 4-4.3 m NaCl 23 10 9.2 5.9 6.2 13 Prutton and Savage (1945) 101 58-623 pure water 14 5.0 5.0 5.0 5.0 5.0 76-101 16-628 ~1 m CaCl2 28 6.0 5.7 20 17 16 76-101 22-657 ~2.3 m CaCl2 25 5.5 4.3 40 26 39 76-101 15-638 ~4 m CaCl2 20 6.8 8.7 61 41 77 Malinin and Savelyeva (1972) 25-100 ~48 pure water 5 4.3 4.3 4.3 4.3 4.3 Malinin and Kurovskaya (1975) 20-100 ~48 0.2-1.3 m CaCl2 10 4.3 3.7 19 16 13 20-100 ~48 1.9-2.4 m CaCl2 5 3.6 3.3 40 32 31 20-100 ~48 3-3.4 m CaCl2 2 7.1 9.5 58 48 51 20-100 ~48 3.9-6.0 mCaCl2 3 6.5 6.1 72 49 95
(Table 1, continued)
1/13/2005 32 Spycher and Pruess REV 01
FIGURE CAPTIONS
Figure 1. Activity coefficients for aqueous CO2 from various sources (see text and
Appendix A.2). Data from Cramer (1982) (and regressed by Battistelli, 1997) and
Nesbitt (1984) are on a mole fraction scale; other data are on a molality scale. As
discussed in the text, data from these sources are not directly comparable, yielding
significant scatter.
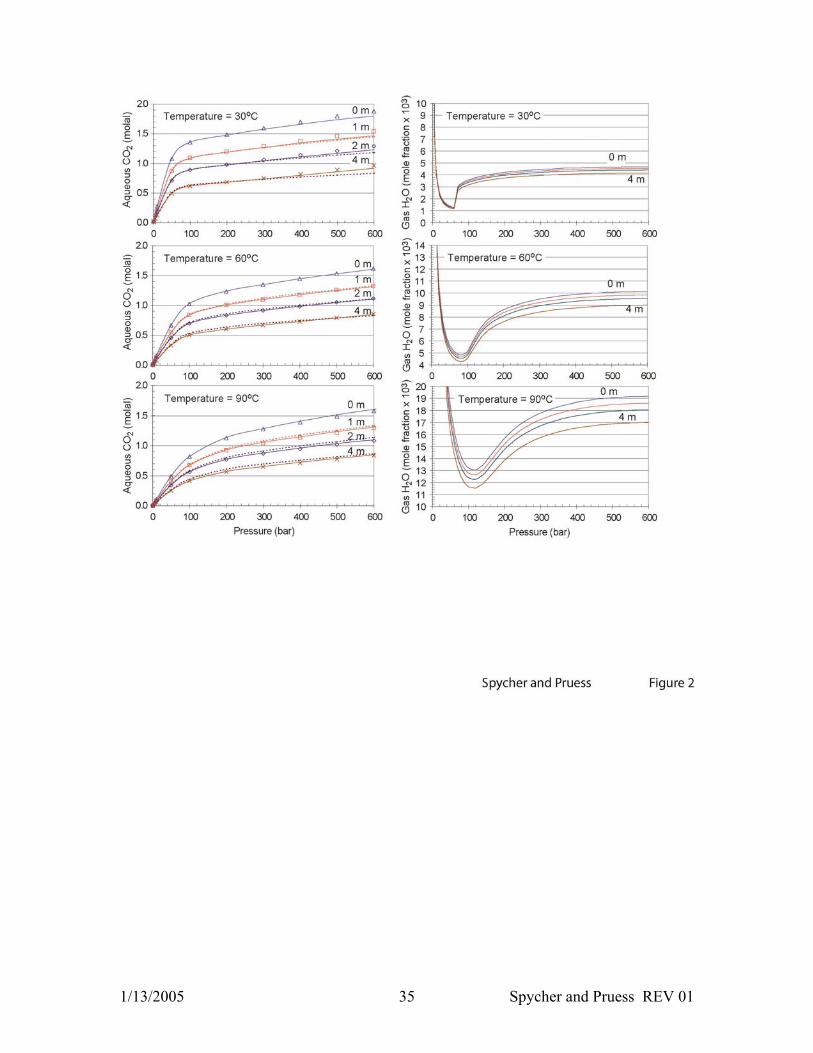
Figure 2. Predicted mutual solubilities of CO2 and H2O (Equations 3-11) using the
activity coefficient formulations of Duan and Sun (2003) (solid lines) and Rumpf et al.
(1984) (dashed lines) (see text and Appendix A.2). CO2 solubilities computed by Duan
and Sun (2003) using their full solubility model are also shown for comparison
(symbols). Note that computed solubilities of H2O in CO2 at 30°C (below critical
temperature) display a sharp discontinuity as gaseous CO2 changes to liquid CO2 with
increased pressure (see Spycher et al., 2003).
Figure 3. Deviations between model results (Equations 3-11) and experimental CO2
solubilities in NaCl solutions (Drummond 1981), using various activity coefficient
formulations (symbols) as discussed in the text and Appendix A.2. The P-T range of the
experimental data is approximately 20–100°C and 35–68 bar (see Table 1). Note the
different scale of the vertical axis at 6 m NaCl.
Figure 4. Comparison between model results (Equations 3-11) (lines) and experimental
CO2 solubilities in NaCl solutions (Rumpf et al.,1994, solid symbols and Kiepe et al.,
2002, open symbols), using various activity coefficient formulations as discussed in the
text and Appendix A.2.
Figure 5. Comparison between model results (Equations 3-11) (lines) and experimental
CO2 solubilities in NaCl solutions (Bando et al., 2003) (symbols), using various activity
coefficient formulations as discussed in the text and Appendix A.2.
1/13/2005 33 Spycher and Pruess REV 01
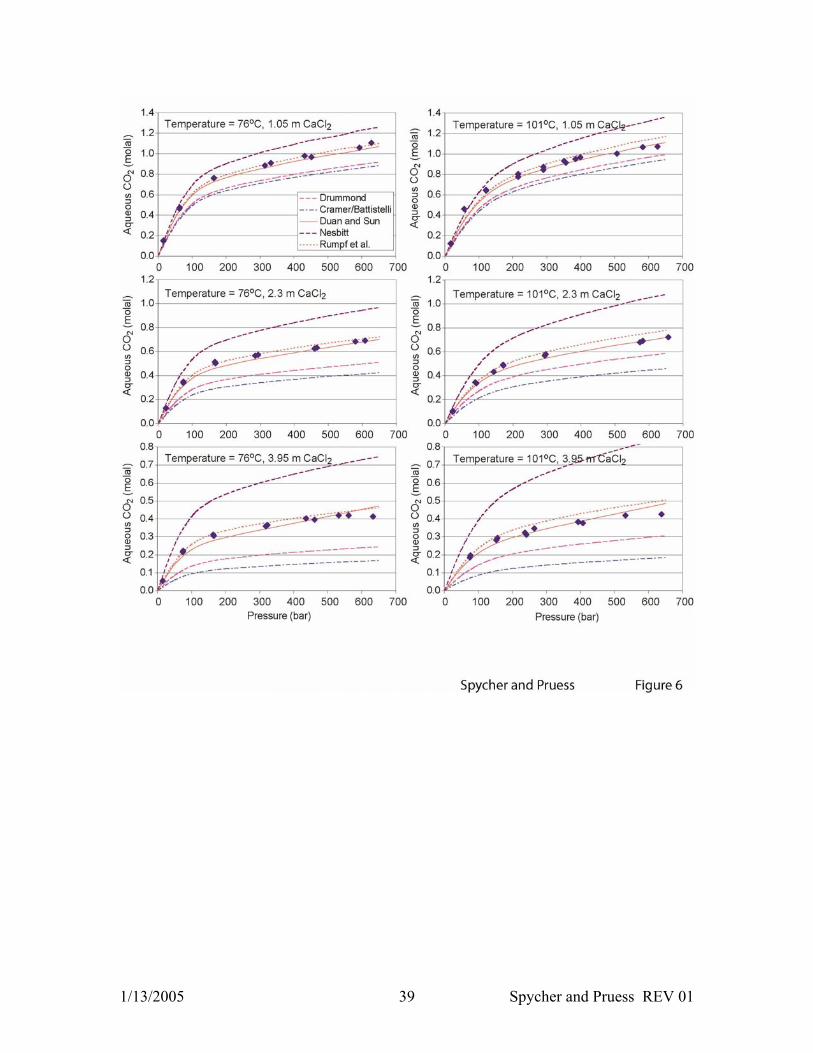
Figure 6. Comparison between model results (Equations 3-11) (lines) and experimental
CO2 solubilities in CaCl2 solutions (Prutton and Savage, 1945) (symbols), using various
activity coefficient formulations as discussed in the text and Appendix A.2.

1/13/2005 34 Spycher and Pruess REV 01
1/13/2005 35 Spycher and Pruess REV 01

1/13/2005 36 Spycher and Pruess REV 01

1/13/2005 37 Spycher and Pruess REV 01

1/13/2005 38 Spycher and Pruess REV 01
1/13/2005 39 Spycher and Pruess REV 01


![Lippke (2014.2), Verbindungslinien [RVO 2|CO 1,1]](https://static.fdokumen.com/doc/165x107/6320792ea3cd9cf896067893/lippke-20142-verbindungslinien-rvo-2co-11.jpg)