Dissolution of aragonite-strontianite solid solutions in nonstoichiometric Sr (HCO 3 ) 2 - Ca (HCO 3...
28
a_h,ml<u", Cmnl<lchi"';(Q Aela Vol. 56. pp. 3045-J072 Copyrishl e 1992 Pc1gamon Press Lid. Prinl<d in U.S.A. 0016.70J7J92JS5.oo +.00 s. Dissolution of aragonite-strontianite solid solutions in nonstoichiometric Sr(HC0 3h-Ca(HC03h-COrH20 solutions L. N. PLUMMER, IE. BUSENBERG,I P. D. GLYNN,I and A. E. BLUM 2 I us GeologicalSurvey, 432 National Center, Reston. VA 22092, USA. 2 US GeologicalSurvey. Mail Stop 420. 345 Middlefield Rd., Menlo Park, CA 94025, USA. (ReceivedJI/ly 23. 1990: accepted in revised/arm August 5, 1991) Abstract-Synthetic strontianite-aragonite solid-solution minerals were dissolved in CO 2-saturated non- stoichiometric solutions of Sr(HC0 3 )2 and Ca(HC0 3 h at 25°C. The results show that none of the dissolution reactions reach thermodynamic equilibrium. Congruent dissolution in Ca( HC0 3 )2 solutions either attains or closely approaches stoichiometric saturation with respect to the dissolving solid. In Sr( HC0 3 h solutions the reactions usually become incongruent, precipitating a Sr-rich phase before reaching stoichiometric saturation. Dissolution of mechanical mixtures of solids approaches stoichiometric satu- ration with respect to the least stable solid in the mixture. Surface uptake from subsaturated bulk solutions was observed in the initial minutes of dissolution. This surficial phase is 0-10 atomic layers thick in Sr(HC0 3 )2 solutions and 0-4 layers thick in Ca(HC0 3 )2 solutions, and subsequently dissolves and/or recrystallizes, usually within 6 min of reaction. The initial transient surface precipitation (recrystallization) process is followed by congruent dissolution of the original solid which proceeds to stoichiometric satu- ration, or until the precipitation of a more stable Sr-rich solid. The compositions of secondary precipitates do not correspond to thermodynamic equilibrium or stoichiometric saturation states. X-ray photoelectron spectroscopy (XPS) measurements indicate the formation of solid solutions on surfaces of aragonite and strontianite single crystals immersed in Sr(HC0 3 h and Ca(HC03h solutions, respectively. In Sr(HC0 3 )2 solutions, the XPS signal from the outer -60 Aon aragonite indicates a composition of 16 mol% SrC0 3 after only 2 min of contact, and 14-18 mol% SrCO) after 3 weeks of contact. The strontianite surface averages approximately 22 mol% CaCO J after 2 min of contact with Ca(HC0 3 h solution, and is 34-39 mol% CaC0 3 after 3 weeks of contact. XPS analysis suggests the surface composition is zoned with somewhat greater enrichment in the outer -25 A (as much as 26 mol% SrC0 3 on aragonite and 44 mol% Caco 3 on strontianite). The results indicate rapid formation ofasolid-solution surface phase from subsaturated aqueous solutions. The surface phase continually adjusts in composition in response to changes in composition of the bulk fluid as net dissolution proceeds. Dissolution rates of the endmembers are greatly reduced in nonstoichiometric solutions relative to dissolution rates observed in stoichiometric solutions. All solids dissolve more slowly in solutions spiked with the least soluble component « Sr( HC0 3 )2) than in solutions spiked with the more soluble component (Ca(HCO J )2), an effect that becomes increas- ingly significant as stoichiometric saturation is approached. It is proposed that the formation of a non- stoichiometric surface reactive zone significantly decreases dissolution rates. INTRODUCTION IN AN EARLIER PAPER (PLUMMER and BUSENBERG, 1987) the congruent dissolution of synthetic solids in the aragonite- strontianite solid-solution series was followed in initially pure CO 2-H 20 solutions. The observed maximum congruent sol- ubilities were interpreted as closely approximating stoichio- metric saturation" and were used to define the compositional dependence of the equilibrium constant and thermodynamic mixing properties of the Ca(l-xlSrCxlCOJ solids. Stoichiometric saturation and equilibrium define identical compositional states for one-component solids. But when solids react as • Stoichiometricsaturation is a limiting state representingequilib- rium between a solid of invariant composition and an aqueous s0- lution (THORSTENSON and PLUMMER, 1977). At stoichiometricsat- umtion the chemical potential of the (fixed composition) solid is equal to its chemical potential in aqueous solution and can be ex- pressed as an equivalence of the ion activity product (lAP) and the equilibrium constant (K) for a congruent dissolution reaction. The concept of stoichiometric saturation has been carefully examined recentlyby GLYNN and REARDON (1990) and GLYNN et al, (1990). 3045 part of a solid-solution series, stoichiometric saturation and thermodynamic equilibrium can represent very different compositional states, depending on the differences in end- member solubilities and the excess mixing properties (GLYNN, 1990; GLYNN et al., 1990). Little is known of the dissolution behavior of solid-solution minerals and of the extent to which thermodynamic equilibrium, stoichiometric saturation. or reaction kinetics control reaction progress. Solubility measurements of Mg-calcites in aqueous solu- tions spiked with MgCh, CaCh, NaCI, and Na 2S04 have been previously reported as a means of testing the stoichio- metric saturation concept. MARIJNS ( 1978) and WOlLAST and MARIJNS (1980) concluded that MgC0 3 in Mg-calcites acted as an inert component having little influence on the solubility product in spiked CaCh and MgCh solutions. WALTER (1983), WALTER and MORSE (1984), and MAC· KENZIE et al. ( 1983), however, found constant values of the ion activity product only when both the CaC0 3 and MgCO J components were considered in the solubility product expression and attributed the discrepancy in findings to in- sufficient sample preparation in the earlier studies ofMARUNS
-
Upload
unitedstatesgeologicalsurvey -
Category
Documents
-
view
3 -
download
0
Transcript of Dissolution of aragonite-strontianite solid solutions in nonstoichiometric Sr (HCO 3 ) 2 - Ca (HCO 3...

a_h,ml<u", Cmnl<lchi"';(Q AelaVol. 56. pp. 3045-J072Copyrishle 1992Pc1gamon Press Lid. Prinl<d in U.S.A.
0016.70J7J92JS5.oo +.00
s.
Dissolution of aragonite-strontianite solid solutions in nonstoichiometricSr(HC03h-Ca(HC03h-COrH20 solutions
L. N. PLUMMER, IE. BUSENBERG,I P. D. GLYNN,I and A. E. BLUM 2
I usGeologicalSurvey, 432 National Center, Reston. VA 22092, USA.2 US GeologicalSurvey. Mail Stop 420. 345 Middlefield Rd., Menlo Park, CA 94025, USA.
(ReceivedJI/ly 23. 1990:accepted in revised/arm August5, 1991)
Abstract-Synthetic strontianite-aragonite solid-solution minerals were dissolved in CO2-saturated nonstoichiometric solutions of Sr(HC03)2 and Ca(HC03h at 25°C. The results show that none of thedissolution reactions reach thermodynamic equilibrium. Congruent dissolution in Ca( HC03)2solutionseither attains or closely approaches stoichiometric saturation with respect to the dissolving solid. InSr( HC03h solutions the reactions usually become incongruent, precipitating a Sr-rich phase before reachingstoichiometric saturation. Dissolution of mechanical mixtures of solids approaches stoichiometric saturation with respect to the least stable solid in the mixture. Surface uptake from subsaturated bulk solutionswas observed in the initial minutes of dissolution. This surficial phase is 0-10 atomic layers thick inSr(HC03)2 solutions and 0-4 layers thick in Ca(HC03)2 solutions, and subsequently dissolves and/orrecrystallizes, usually within 6 min of reaction. The initial transient surface precipitation (recrystallization)process is followed by congruent dissolution of the original solid which proceeds to stoichiometric saturation, or until the precipitation ofa more stable Sr-rich solid. The compositions ofsecondary precipitatesdo not correspond to thermodynamic equilibrium or stoichiometric saturation states. X-ray photoelectronspectroscopy (XPS) measurements indicate the formation of solid solutions on surfaces ofaragonite andstrontianite single crystals immersed in Sr(HC03h and Ca(HC03h solutions, respectively. In Sr(HC03)2solutions, the XPS signal from the outer -60 Aon aragonite indicates a composition of 16 mol% SrC03after only 2 min of contact, and 14-18 mol% SrCO) after 3 weeks of contact. The strontianite surfaceaverages approximately 22 mol% CaCOJ after 2 min of contact with Ca(HC03h solution, and is 34-39mol% CaC03 after 3 weeks of contact. XPS analysis suggests the surface composition is zoned withsomewhat greater enrichment in the outer -25 A(as much as 26 mol% SrC03 on aragonite and 44mol% Caco3on strontianite). The results indicate rapid formation ofasolid-solution surface phase fromsubsaturated aqueous solutions. The surface phase continually adjusts in composition in response tochanges in composition ofthe bulk fluid as net dissolution proceeds. Dissolution rates of the endmembersare greatly reduced in nonstoichiometric solutions relative to dissolution rates observed in stoichiometricsolutions. All solids dissolve more slowly in solutions spiked with the least soluble component « Sr( HC03)2)than in solutions spiked with the more soluble component (Ca(HCOJ)2) , an effect that becomes increasingly significant as stoichiometric saturation is approached. It is proposed that the formation of a nonstoichiometric surface reactive zone significantly decreases dissolution rates.
INTRODUCTION
IN AN EARLIER PAPER (PLUMMER and BUSENBERG, 1987)the congruent dissolution ofsynthetic solids in the aragonitestrontianite solid-solution series was followed in initially pureCO2-H20 solutions. The observed maximum congruent solubilities were interpreted as closely approximating stoichiometric saturation" and were used to define the compositionaldependence of the equilibrium constant and thermodynamicmixing properties ofthe Ca(l-xlSrCxlCOJ solids. Stoichiometricsaturation and equilibrium define identical compositionalstates for one-component solids. But when solids react as
• Stoichiometricsaturation is a limitingstate representingequilibrium between a solid of invariant composition and an aqueous s0
lution (THORSTENSON and PLUMMER, 1977). At stoichiometricsatumtion the chemical potential of the (fixed composition) solid isequal to its chemical potential in aqueous solution and can be expressed as an equivalence of the ion activity product (lAP) and theequilibrium constant (K) for a congruent dissolution reaction. Theconcept of stoichiometric saturation has been carefully examinedrecentlyby GLYNN and REARDON (1990) and GLYNN et al, (1990).
3045
part of a solid-solution series, stoichiometric saturation andthermodynamic equilibrium can represent very differentcompositional states, depending on the differences in endmember solubilities and the excess mixing properties(GLYNN, 1990; GLYNN et al., 1990). Little is known of thedissolution behavior of solid-solution minerals and of theextent to which thermodynamic equilibrium, stoichiometricsaturation. or reaction kinetics control reaction progress.
Solubility measurements of Mg-calcites in aqueous solutions spiked with MgCh, CaCh, NaCI, and Na2S04 havebeen previously reported as a means of testing the stoichiometric saturation concept. MARIJNS ( 1978) and WOlLASTand MARIJNS (1980) concluded that MgC03 in Mg-calcitesacted as an inert component having little influence on thesolubility product in spiked CaCh and MgCh solutions.WALTER (1983), WALTER and MORSE (1984), and MAC·KENZIE et al. ( 1983), however, found constant values of theion activity product only when both the CaC03 and MgCOJcomponents were considered in the solubility productexpression and attributed the discrepancy in findings to insufficient sample preparation in the earlier studies ofMARUNS

3046 L. N. Plummeret al.
( 1978) and WOU.AST and MARUNS (1980). DUSENBERG andPlUMMER ( 1989) confirmed the findings OfWALTER ( 1983)and WALTER and MORSE (1984) in showing that both theCaCOJ and MgCOJ components must be included in solubility product expressions for Mg-calcites reacting in spikedsolutions.
Until recently, there has been little information on thesolubilities of solid-solution minerals in stoichiometric solutions, and insufficient data to determine conclusively if thesame solubility product attained in stoichiometric solutionsis observed for the solid in nonstoichiometric aqueous solutions. Lack of thermodynamic data for solid solutions hasalso prevented investigation ofequilibrium controls on solidsolution aqueous-solution (SSAS) reaction paths in nonstoichiometric solutions. Because natural waters are rarelystoichiometric with respect to the dissolving solid composition, the question of solubility-controlling reactions in nonstoichiometric solutions has relevance to most water-rocksystems.
The present paper examines the dissolution behavior ofsynthetic aragonite-strontianite solid solutions in nonstoichiometric aqueous CO2-H20 solutions at 25°C spiked withCa(HCOJh and/or Sr(HCOJh. The results are comparedwith dissolution/solubility behavior of the same solids instoichiometric solutions (PLUMMER and DUSENBERG, 1987)and are used to investigate several questions important tounderstanding chemical evolution in mineral-water systems:( I) Is the equilibrium constant which is observed in stoichiometric solubility measurements applicable to dissolution/solubility behavior in nonstoichiometric aqueous solutions?(2) Are reaction paths for the dissolution of solid-solutionminerals in nonstoichiometric aqueous solutions influencedby thermodynamic equilibrium or stoichiometric saturationstates, or, on laboratory time scales, are reaction paths determined entirely by reaction kinetics? (3) Are the rates ofdissolution of solid solutions affected by variations in theconcentrations of substituting foreign ions in solution? (4)What are the reaction paths for the dissolution ofmechanicalmixtures of solid solutions, and how are they influenced bychanges in bulk fluid composition?
EXPERIMENTAL METHODS
Solids
Eightsolidsin the aragonite-strontianite solid-solution series wereused in dissolution experiments. The solids were preparedat 76°Cbydropwiseaddition of 0.75 M Na2C03 solution to 10L of 0.43 MNaCi. 0.078 M MgCh. and 0.10 M CaCI2 solutions with varyingsrCh concentrationsor 0.43 M NaCl. 0.078 M MgCI2 • and 0.05 MSrC12 with varyingamountsofCaC12• asdescribed by PLUMMER andDUSENBERG (1987). The solidswereaged24 hat 76°C.washed withdistilled water until free of chloride.dried at 110°C and stored atroom temperature.Allsolidswereusedpreviously in solubility measurements in CO.H20 solutions (PLUMMER and DUSENBERG, 1987).
Solid compositions (Table I) weredetermined by X-raydiffraction(Cu K.. radiation;CaF2 internal standard) and chemical analysis, asoriginally reported in PLUMMER and DUSENBERG (1987). The Xraydiffraction determination usestheobserved linearrelation betweenthe d-spacingof the ( III) reflection and the SrCO) mole fraction
, The useofbrand namesin this reportis foridentification purposesonlyand docsnot implyendorsementby the USGeological Survey.
(FAIVRE, 1944; HOLlAND et al., 1963; FuBtNt et al., 1988). Uncertainties in interpreting the midpoint of the( III ) reflection correspondtocompositional uncertainties of ±3 mol% srC03.Solidcompositionsdetermined bychemical analysis (PLUMMER and DUSENBERG. 1987)are known within ±O.I mol% SrC03, but are regarded as averagecompositions because many appear to be physical mixtures of (atleast) several precipitated solid solutions.Examinationof the shapeof the ( III ) reflection shows peak broadening and asymmetry forseveral of the solidsindicating a likely range in composition(TableI ). Measurements of the width of the ( III ) reflection at two-thirdspeak heightabove background showthat solids 5-8.5-10.and 5-12(Table I) are of relatively narrow composition having peak widthsonlyslightly largerthan the aragoniteand strontianite endmembersand are similarto solids recrystallized for hundredsof hoursat 76°C.Solids 6-10.6-14. and 6-12havepeakwidthstwo- to three-fold larger.indicating a greatercompositional range. The X-raydiffraction patterns clearly showthat solids6-10and 6-14are mixturesof predominantly two compositional ranges. Solid 6-10. averaging about 46mol% SrC03is a mixtureof approximately two-thirds of a compositionalrangenear 36% SrC03and one-thirdofa groupingnear 56%srCo3. Solid 6-14. averaging about 56.5% SrC03 is a mixture ofcompositional rangesnear 58% and 45%srCo3•Solids5-8 and 510averaging 11.4and 32.1% SrC03showsomeasymmetry to moreSr-rich compositions. Solid6-12wasreportedto havea compositionof 67.0% SrC03 (PLUMMER and DUSENBERG. 1987) based on theSr/Ca ratio in solution during congruent dissolution in CO2-H20solutions. Examination of this solid by X-ray diffraction indicatesan average composition near 74% SrC03.
Dissolution Procedures
Stock solutions of Ca(HC03)2 (-IS mmol/kg solution) andSr(HC03h (-5.6 mmol/kg solution) were preparedbydissolvingaragonite and strontianite. respectively. in COrH 20 solutions at SOC.The solutionswerefiltered with0.2 pm membranefilters and storedin sealed glass bottlesat SoCuntil used. Fourteendissolution experiments wereconducted with the solids(Table I) in COrsaturatedaqueous solutions ofCa(HC03h or Sr(HC03h. One run (run 6)contained both Ca( HC03h and Sr(HC03h in the initial solution.At the beginning ofa run thestocksolutionwas dilutedto thedesiredconcentration.placedin the thermostated. jacketed I L Pyrex t glassreaction vessel. and warmed to 25°C (±O.05°C). A Pyrex glass gasdispersion tube, placedat 3 em depth in the coveredreaction vesselbubbled pure water-saturated COz gas at approximately 0.5 L permin.The CO2 partialpressure in solutionwascalculated as in PLUM.MER and DUSENBERG (1982) using the room barometricpressure.The calculated pH based on the ion-pairingmodelof PLUMMER andDUSENBERG ( 1987)for the strontianite-aragonlte-Coj-water system
Table 1: Solids
Sample' Surlace Mole Iraction SrCOs Run'area
tmz/gl" Average' X·,ay difto
Aragonite 0.98 0.000 0.000 75·8 1.09 0.114 0.1141+1 8,145·tO 1.23 0.321 0.321 t+1 12,136-tO 1.20 0.463 0.36>0.56 9.15IH4 1.91 0.565 0.58>0.45 5,66-t2' 1.72 0.74 0.74t·1 11,165·t2 0.69 0.877 0.877 2.10Stront. 1.74 t.OOO t.OOO 1
1 Solids 01 Plummer and Busenberg119871
2 Run number 01 dissolution experiments using the solid.3 Surlace area elter 24 hours 01 aging at 76 ·C. determinedby single point BETtNzl.
4 Average composition by chemical analysis.5 Composition of individual solids identilied by x·raydiffrection. (+ I denotes some assymelry 01 the t1111reflection to more S,.,ich solids. H denotes someassymetry of the (1111 reflection to more CiI·rich solids.
6 Dissolution results suggest solid 6- t 2 is a mixture of twosolids near 85 and 66 mole percent SrCOs (see textl.
..

Dissolution of aragonite-strontianite solid solutions 3047
using the measured solution composition and assumed equilibriumPro, is within 0.02 or better of the measured value. This indicatesthat the bulk fluid Pro, could not have deviated by more than 1.3%of the expected equilibrium value during dissolution. All thermodynamic calculations are based on the measured solution compositionand the Pro, (fixed by gas-liquid equilibria) which is judged morereliable than use of the measured pH (PLUMMER and BUSENBERG,1982). Solid/solution ratios varied between 5.6 and 6.3 gil (and4.1-11.5 m2/L). A stirring rate of200 rpm was maintained throughout the experiments.
All dissolution experiments in nonstoichiometric solutions are referred to as Series 3 runs. The Series 3 runs are compared to theSeries I and Series 2 runs reponed in PLUMMER and BUSENBERG( 1987) in which these and many other aragonite-strontianite solidsweredissolved in initially pure CO2-H20 solutions. The solid/solutionratio was approximately 20 gil in Series I and 2 runs. In Series Iruns the bulk solution was sampled infrequently over a period of Iweek and usually not before 24 h of reaction. Consequently, theinitial congruent phase of dissolution was often missed in Series Iruns. Results of the Series I runs are useful in the present study inobserving reaction paths during incongruent dissolution. Many ofthe Series I runs were repeated in Series 2 experiments with morefrequent initial sampling of the bulk fluid composition beginning at5 to 10 min in order to determine if the initial dissolution was congruent. Data from Series 2. and to some extent Series I. were usedby PLUMMER and BUSENBERG (1987) to define the maximum congruent solubilities ofthe solids. The maximum congruent solubilitieswere interpreted to represent stoichiometric saturation and used todetermine the compositional dependence of the equilibrium constant(PLUMMER and Bus ENBERG. 1987).
In the present paper. the equilibrium constants derived from theSeries 1 and Series 2 stoichiometric saturation experiments (PWM·MER and BUSENBERG, 1987) are used to test the thermodvnamicbehavior of reaction paths in nonstoichiometric solutions (Series 3).The Series 3 runs use a solid/solution ratio approximately one-thirdthat of the Series I and Series 2 runs. and solution sampling wasinitiated at I min into the reaction with frequent samples taken inthe first hour of reaction. The duration of Series 3 runs was severalhundred hours. Initial conditions for the 14 Series 3 dissolution runsare summarized in Table 2.
5- to 10-mL samples of solution and suspended solid were withdrawn from the reaction vessel using syringes so as not to alter thesolid/solution ratio. The solution was immediately filtered through0.45 pm filters. weighed. diluted with distilled water and acidifiedwith a drop of concentrated HCI. Total concentrations ofCa and Srin solution were determined by EDTA titration within I hr of sampling. Total dissolved Ca was determined on a separate acidified anddiluted sample using atomic absorption techniques. Strontium wasdetermined by difference, but independent checks on the Sr concentration using atomic absorption and ion chromatography showedagreement within the analytical precision of 5%. See PLUMMER andBUSENBERG (1982. 1987) for further details of the analytical andexperimental procedures.
XPS A08I)'sis
In a separate series ofexperiments. X-ray photoelectron spectroscopy (XPS) analysis was used to examine the chemical compositionsof the outer (approximately) 50-100 Aof natural single crystals ofaragonite and strontianite. Briefly, XPS uses an X-ray source to ejectinner-core electrons. The energies of the ejected electrons are characteristic of the element. and chemical shins may also indicate majordifferences in the local bonding environment. Because the mean freepath oflow-cnergy electrons in solids is only tens of Angstroms, onlythe electrons generated near the surface escape from the solid, andthis leads to the surface sensitivity of the XPS technique. The proportion of the ejected electrons which escape from the solid and canbe detected decreases exponentially with depth. HOCHELLA ( 1988)summarizes XPS techniques and their geological applications.
Single crystals of natural aragonite (Aragon. Spain) and well-cemented microcrystalline strontianite (Hamm, Westphalia, WestGermany) were used in the XPS measurements. The aragonite crystalswerecut perpendicular to the c-axis while the microcrystalline stron-
Table 2: Run conditions
Initial Soln. Solid Soln.mmol/kg soln. Mass Vol.
Run Solid XsrC03 ea Sr (01 (LI
1 Stront. 1.000 7.99 0.00 3.0 0.52 5·12 0.877 7.97 0.00 3.0 0.55 6·14 0.565 6.09 0.00 3.0 0.56 6·14 0.565 5.89 3.00 3.0 0.57 Arag. 0.000 0.00 3.99 3.0 0.58 5-8 0.114 0.00 4.00 3.0 0.59 6-10 0.463 0.00 3.97 5.0 0.8to 5·12 0.877 0.00 3.93 5.0 0.8t 1 6·12 0.74 0.00 3.97 5.0 0.8t2 5·10 0.321 0.00 3.94 4.5 0.813 5-10 0.321 7.62 0.00 4.5 0.8t4 5·8 0.114 7.81 0.00 5.0 0.815 6·10 0.463 8.00 0.00 5.0 0.816 6·12 0.74 8.01 0.00 5.0 0.8
tianite is of mixed orientation. The solids were cut to blocks of approximately I em X I em X 0.3 em. The faces were polished with600 grit silicon carbide. washed with ultra-pure water. etched for 30sec in 0.1 N HCI. and then washed with 0.5 L of ultra-pure water.The remaining water was removed by capillary action usingabsorbentwipes and then blown dry with dry Nz. Chemical analyses ofthe fivestrontianites used in XPS measurements averaged 86.4 ± 0.4 mol%SrCO). The aragonites contained 1.1 mol% SrCO). The initial solutions in which these aragonites and strontianites were immersedwere similar to those described above for dissolution ofthe powders,i.c.. aragonite was immersed in CO2-saturated Sr( HCO)2 solutions(4 mmol/kg) and strontianite was immersed in COrsaturatedCa(HCO)2 solutions (8 mmol/kg), In a separate experiment anaragonite crystal was immersed in a CO2-saturatedsolution containingapproximately 8 mmol/kg Cal HCO,)2 and 4 mmol / kg SrI HCO) h,a composition similar to that observed after prolonged reaction ofaragonite powders in 4 mmol/kg SrI HCO,h. The surfaces of allsolids were analyzed by XPS during a 12 h period after immersiontimes of 2 min and of 21 days.
After removal of the solid block from the experimental solutions.it was necessary to remove residual solution adhering to the surfacewithout altering the surface composition. Two procedures were used(each requiring approximately 2 min): ( I) blowing with a strong jetof Nz gas parallel to the surface. which "streams" the liquid off thesurface (STIPP et al., 1992) and (2) washing the surface with a streamofethanol. These methods were tested by addition of 0.1 mmol/kgNaCI to some of the experimental solutions to sec if residual Na orCI could be detected during the XPS analysis. Both methods seemedto quantitatively remove residual solutions and their dissolved constituents, and yielded nearly identical surface compositions.
XPS analysis was performed using a VG ESCALAB Mk II XPSinstrument with AI-Ka radiation. and an area of analysis of 2 X 5mm. Calcium concentrations were determined using the 2p peak,and Sr concentrations using the 3d peak. Detailed scans had a stepsize of0.1 ev, and peak areas were determined by digital integrationafter application ofa Shirley background correction. Peak areas werenormalized using the cross sections OfSCOFtELD (1976). In the caseof strontianite analysis. the predicted intensities of the Sr3s satellitepeaks were subtracted from the Ca2p peak areas.
The precise depth ofanalysis of the strontianite and aragonite surfaces by XPS is not presently known because the attenuation length(,\) of electrons in the carbonate solid-solutions has not been determined. HOCHELLA and CARIM (1988) found ,\ for Si2p photoelectrons ejected with a kinetic energy of 1150 ev through amorphousSiOz to be 21 A. Since 95% of the XPS signal originates within 3,\(HOCBELLA, 1988). the information depth for amorphous SiOz is63 A. The value of'\ will generally decrease with decreasing electronkinetic energy and increasing mineral density. Based on these trends.the ,\ for Ca2p is estimated to be about 5 A less than for Sr3d, and,\ for CaZp in aragonite and Sr3d in strontianite will both be -20A. or an information depth of -60 A. The major ambiguities in theinterpretation of XPS spectra are lateral chemical heterogenity andresolving the distribution of a component with depth. Several

3048 L. N. Plummer et aJ.
additional measurements were made using angle resolved XPS(ARXPS; HOCHELLA, 1988) at a sample tiltangle of65°which shouldyield compositional information on the outer -25 A. The ARXPStechnique canyield qualitative information on thedepthdistributionof a component. However, because of the exponential decrease ofthe XPS signal intensity withdepth. the intensity ratio of the Ca2pand Sr3d peaks can be explained byan infinite number of compositional profiles. Consequently, the XPSdata are presented as molepercent of the CaCOl or SrCO] component. assuming a uniformcomposition laterally and over the entire information depth (-60Aat 0° and -25 Aat 65°). Whilethis isa simplification. it gives auseful meansof comparinganalyses.
The surface compositions of blocks of strontianite and aragonitewhich had been prepared usingthe grinding. etching. and washingprocedure described above, but unreacted in Cal HCDl)z orSr(HCOlh solutions, were measured by XPS and compared withthe bulk chemical analysis. The strontianite surface was 85.1 and88.0 mol% SrCOl at tilt angles of 0 and 65·, respectively, whichcompares with86.4 mol% SrCOl bychemical analysis. In addition,a portion of the strontianite wasgroundto a fine powder to exposepreviously internal and completely untreated surfaces. The XPScomposition of this unreacted powder was85.7 mol% SrCD]. XPSanalysis of the prepared but unreacted block of aragonite indicateda surface composition of 1.3mol% SrCOl, which is nearly identicalto the bulk chemical analysis (I.I mol% SrCO]).
ofthe aragonite (pKA = 8.336) and strontianite (pKs = 9.271 )endmembers (PLUMMER and DUSENBERG, 1982; DUSENBERGet aI., 1984), R is the gasconstant and T is temperature inKelvin. The corresponding dimensionless parameters tlo andQ. are obtained bydividingAoandA. by RTin Eqn. (2)andare 3.43 and -1.82, respectively (GLYNN et al., 1990). Figurela shows the compositional dependence of the aragonite.strontianite equilibrium constants determined by PLUMMERand DUSENBERG ( 1987) from Series I and Series 2 dissolutionexperiments at 25°C. The solid line is the best fit of Eqn. (2)to the experimental stoichiometric solubilities.
Stoichiometric saturation with respect to the particularsolid being dissolved is represented by dashed lines on thesolution composition diagrams. Stoichiometric saturationlines were calculated using the reaction simulation programPHREEQE (PARKHURST et al., 1980) with Eqns. (l) and(2) at the initial PC02 for each dissolution run and the thermodynamic aqueous ion-pairing model of PLUMMER and
(a)
"
1.00.2 0.4 0.6 0.8MOLE FRACTION SrC03
- 9.5 '---I-.......--'_-'---'---'_"'----L--I.--I0.0
-7.5
-8.0
t::IN
-8.5o0...J
-9.0
-9.0
FIG. I. Stoichiometric saturation and equilibrium properties ofthe strontianite-aragonite SSAS system at 25·C. (a) Logof equilibrium constant. K, as a function of SrCO]molefraction. Circles areexperimental values from stoichiometric solubilities (PLUMMER andDUSENBERG, 1987), and the solid line is calculated using Eqn. (2).(b) Lippmann phasediagram. The parameter2:ll isdefined in Bqn.(5). The thermodynamic equilibrium properties of the aqueous phaseandcorresponding solidscanbedefined byhorizontal tielines betweenthesolutus andsolidus, respectively. Forexample, theactivity fractionofSr is near0.2 in aqueoussolutions at equilibrium witha strontianaragonite containingapproximately 93 mol% SrCOl. See GLYNN( 1990. Fig. I ) forfurtherdetailson useofLippmann phase diagrams.The solidus is shownwith a dash-dot pattern insidethe miscibilitygap. Circles define 2:" forstoichiometric saturation in stoichiometricaqueous solutions from the experimental data of PLUMMER andDUSENBERG ( 1987). Thecurvepassing through thedatapoints definesthe loci of the continuum of "minimum stoichiometric saturationpoints."The convex upward dashed linesdefine stoichiometric saturationfor the endmembers.
:.: -8.5
t.:Jo...l
-9.50.0 0.2 0.4 0.6 O.B 1.0
MOLE (OR ACTIVITY) FRACTION OF Sr
Solution Composition Diagrams
The Sr vs. Ca solution composition diagrams (sec, e.g.,Fig. 2) show the aqueous concentrations ofdissolved calciumand strontium as dissolution proceeds. Each compositionalplot shows the hypothetical congruent dissolution path fromthe (nonstoichiometric) starting point to stoichiometric saturation (solid line) for the average composition of the solid(Table I). Stoichiometric saturation is defined for a givenSrCO l mole fraction, x, as IAP(x)e K(x), where IAP(x) is theion activity product for the dissolution reaction
CaI-xSrxCOl = (I - x)Ca 2+ +xSr2t + CO~-, (I)
REPRESENTATION OF EXPERIMENTAL DATA
and K(x) is the thermodynamic equilibrium constant for asolid of composition x, For the aragonite-strontianite solidsolutions, the compositional dependence of Ktx ) is given by(PLUMMER and DUSENBERG, 1987):
x(l - x)In K'XI = RT [Ao + A.(2x - I»)
+ (l - x) In (KA(I - x» + x In (Ksx) (2)
where Aoand AI are the GUGGENHEIM ( 1937) excess mixingparameters and have values of8.49 ± 0.30 and -4.51 ± 0.20KJ/mol at 25°C, KA and Ks are the equilibrium constants
The experimental dissolution data are interpreted usingsolution composition diagrams and Lippmann phase diagrams (LJpPMANN, 1977, 1980, 1982;GLYNN and REARDON,1990, 1992; KONIGSBERGER and GAMSJAGER, 1991, 1992;GLYNN et al., 1990;GLYNN, 1991). The solution compositiondiagrams are similar in some respects to solution activityplots (see GARRElS and WOLLAST, 1978; MICHARD andOUZOUNIAN, 1978; DENIS, 1982; DENIS and MICHARD, 1983;MICHARD, 1986a,b; GAUNIER et al., 1989; PAUWELS et al.,1989), except that concentrations rather than activities arerepresented for the aqueous solution during reaction.

Dissolution of aragonite-strontianite solid solutions 3049
BUSENBERG ( 1987) for Sr( HCO l ): and Ca( HCOl h solutions.Variations in room barometric pressure during the dissolutionexperiments caused only negligible variations in PC02, andtherefore the locations of calculated stoichiometric saturationcurves based on the initial Pca, are representative for theduration of the runs.
If the reaction is congruent for a single solid composition,the positive slope of the linear reaction path on solutioncomposition diagrams implies the composition of the dissolving phase. Linear dissolution reaction paths are not,however, definitive proofof congruent dissolution ofa singlesolid because of the possibility of congruent dissolution ofmultiple compositions in constant relative proportions.Curved dissolution reaction paths (both Ca and Sr increasing)could be observed on compositional plots when ( I ) multiplesolids ofdiffering compositions dissolve congruently at varying relative rates, (2) a single solid dissolves congruently withminor precipitation ofa secondary solid (s) ofdiffering composition, and (3) some combination of interpretation ( I )and (2). As shown later, SEM and XRD data support interpretation I of curved reaction paths for the present experiments. We cannot, however, completely eliminate the possibility of minor precipitation accompanying observations ofcurved reaction paths on compositional plots.
Abrupt decreases in the concentration of Sr accompanyingincreases in the concentration ofCa and abrupt decreases inCa concentrations accompanying increasing Sr content areindications of incongruent dissolution, that is, the simultaneous dissolution of one or more solids accompanying theprecipitation of one or more secondary solids.
Lippmann Phase Diagrams
Lippmann phase diagrams (LIPPMANN, 1977, 1980, 1982)are of considerable value in describing the thermodynamicproperties of SSAS systems. GLYNN and REARDON ( 1990.1992). GLYNN et al. (1990). and KO!'IGSBERGER andGAMSJAGER (1991, 1992) discuss the theoretical basis ofLippmann phase diagrams. and the representation of thermodynamic equilibrium, stoichiometric saturation. and reaction paths in SSASsystems. The Lippmann phase diagramsused here were constructed using the MBSSAS computerprogram (GLYNN, 1991).
Thermodynamic equilibrium in the CaCOl-SrCOl-H20system is described by the equivalence of the chemical potentials of the solid and aqueous phase components, that is,by the relations.
llc4hllco~- = KA( I - x)>.cocoJ (3)
The abscissa of a Lippmann phase diagram has two scales:a mole fraction scale for the solid (for the interval 0 ~ x~ I) and a numerically identical activity-fraction scale forthe aqueous solution, where the activity fraction of SrH insolution, XSr.aq. is
(6)
The equilibrium properties of binary SSAS systems arerepresented by two curves on Lippmann phase diagrams (see,e.g., Figs. Ib and 2c): the solidus, referenced to the molefraction scale on the abscissa, and the "solutus" (LIpPMANN,1977) referenced to the aqueous activity fraction scale. Thesolidus curve defines the value of~n for the solution at equilibrium with a particular solid on the solid mole fractionscale. The activity fraction ofSr in aqueous solution at equilibrium with a given solid is defined as that correspondingto the intersection between the solutus and the horizontal tieline extending from the solidus. Together, the solidus andsolutus curves on Lippmann phase diagrams represent therange of possible thermodynamic equilibrium states for thebinary SSAS system.
The solidus curve is given by the relation (BERNDT andSTEARNS, 1973; LIPPMANN, 1977)
~nsclidu5 = asrcoJKs + QCaCOJKA' (7)
where Qsrco) and Qcoco)denote activities ofSreOl and CaCOl
in the solid and K is the equilibrium constant for the subscripted endmember. The activities of SrCO l and CaCO l inthe solid are defined as xAsrCOJ and (I - x)>.c.cop respectively. Relationships for the compositional dependence ofthe solid-phase activity coefficients can be obtained from aGibbs-Duhem integration (DENBIGH, 1968) using the GUGGENHEIM (1937) expression for the excess free energy ofmixing (SAXENA, 1973):
(I - X)2InAS<CQJ= RT [Ao+A1(4x-l» (8)
and
x 2
In >.coco) = RT[Ao+ At(4x - 3». (9)
Lippmann's solutus curve (LIPPMANN, 1980; GLYNN andREARDON, 1990) is given by
~nsclutu5 = I / ( K,x;,.OQ + (I - Xsr.aq») . ( 10)S srCOJ KA>.c.COI
and
The variable Q; denotes activity of the ith ion in solution. xis the mole fraction ofSrCOl in the solid, and A; denotes theactivity coefficients of the components CaCO l and SrCO l inthe solid. Bycombining Eqns. (3) and (4), Lippmann introduced the variable ~n which is referred to as the "total solubility product" and forms the ordinate on the Lippmannphase diagram.
(II)
GLYNN and REARDON (1990) constructed Lippmannphase diagrams for the strontianite-aragonite solid solutionsat 25 and 76°C using the stoichiometric saturation data ofPLUMMER and BUSENBERG (1987). GLYNN and REARDON( 1990) also present a relationship for ~n at stoichiometricsaturation, ~n55' thus extending Lippmann phase diagramsto include both equilibrium and stoichiometric saturationstates:
(4)
(5)

3050 l. N. Plummer et al.
0.2 0.4 0.6 0.8
MOLE (OR ACTIVITY) FRACTION OF Sr
1.0
>;II~,
;II-;;,"',
IIIIIII,I,,,
II
II
//
/,
0.8'7'7-------------
Run 7 (Sr)ArllgoniLe
---
(b)
5.0
:E 4.6
~
e: 4.2Zo
- 0:: 3.8E-Cf)
34
3.08.2 0 1 2 3 4 5 6 7 B 9
CALCIUM
Run I (CII)Stronttauite
7.8 8.0
CALCIUM
(a)
r-"1--"T-r-, I I r ,
4
8
o0.0
10
0.07.6
.....
C[;",1
2.4
..... 2.0~
:.:>..... 1.6E-
~ 120::~0.8
0.4
.-"'0 6
FIG. 2. Reaction pathsfordissolution of theendmembers strontianite and aragonite in Ca(HC03)2 and Sr(HC03haqueous solutions. respectively. (a) Compositional diagram showing the total dissolved concentration (in mmols/kgH20) ofSr and Ca (circles) duringdissolution ofstrontianite in Ca(HC03)2 solution (run I). Thedashedline(labeledstrontianite) defines stoichiometric saturation for purestrontianite. The solidlinedefines the congruent path for dissolution of strontianite in the initial solution. The solid circle is the calculated end point for congruent dissolution tostoichiometric saturation. (b) Compositional diagram showing the totaldissolved concentration (in rnmolsj'kg H20)ofSr and Ca (circles) during dissolution ofaragonite inSr(HCO)2solution (run 7). Thedashed line(labeled aragonite)defines stoichiometric saturation foraragonite. The congruent dissolution path to stoichiometric saturationisdefinedby the solid line from the initial composition to the solid circle on the stoichiometric saturation line. (c) Lippmannphase diagram for the strontianite-aragonite system at 25°C. The equilibrium properties of the aqueoussolutions andcorresponding solids aredefined by horizontal tie lines (notshown)between the solutusand solidus. respectively. Thesolidus is drawn witha heavy solidline forstable compositions in the system and witha dash-dot pattern within themiscibility gap. Dashed linesdefine stoichiometric saturation for the labeled SrC03mole fractions. The pure phasestoichiometric saturation curves for aragonite and strontianite arc shown as dotted lines. The squares define reactionpaths in nonstoichiometrie solutions shown in (a) and (b). The solid"stars" locate aqueoussolutioncompositionscorresponding to the XPS surface chemistry given in Table4. Sectext for further discussion.
KONIGSBERGER and GAMSJAGER (1987) and LIPPMANN
( 1980) used a similar expression for the solubility of huntite(CaMg3(C03)4) in nonstoichiometric solutions. TheLippmann phase diagrams used in this study are contouredwith six dashed lines corresponding to stoichiometric saturation with the six solid-solution compositions studied (Table
t The miscibility gap was incorrectly located at 25 and 76°C inPLUMMER and DUSENBERG (1987) and is corrected hereat 25°C.At 76°C the miscibility gap is in the interval 0.0232 s: x s: 0.790.Accordingly, stable aragonites having the lowest free energy of mixingcontain0.48and 2.3 mol% SrCO)at 25 and 76cC. respectively,
I ). Stoichiometric saturation states for other solid compositions can be estimated by interpolation. Dotted lines onthe Lippmann phase diagrams define stoichiometric saturation with the pure aragonite and strontianite endmembers.
A miscibility gap occurs in the strontianite-aragonite seriesover the interval 0.0048 3 s x s 0.857 at 25°C. t Although itis numerically possible to draw the solidus over the entirecompositional range, equilibrium cannot occur with solidsof composition inside the miscibility gap. To indicate this,the solidus is drawn with a dash-dot pattern inside the miscibility gap and a heavy solid line to indicate solid compositions that can attain equilibrium in the system. The synthetic

Dissolution of aragonite-strontianite solidsolutions 3051
solids were prepared under laboratory conditions that didnot allow sufficient time for recrystallization. The compositions of many of the solids fall within the spinode, and thoughunstable. have persisted for years in dry storage at room temperature. In aqueous solutions, the recrystallization of thesesolids is sluggish; and. consequently. most of the SSAS reaction paths investigated here pass through metastable compositional regions. as seen on the Lippmann phase diagrams.PALACHE et al. ( 1951) and SPEER ( 1983) give compositionaldata on naturally occurring strontianites and aragonites whichappear to be consistent with the miscibility gap calculatedfrom the data OfPWMMERand DUSENBERG (1987).
GLYNN et al. (1990) introduce other terminology whichis useful in discussing reaction behavior. Primary saturationrefers to the point of the first intersection of the congruentdissolution path (in both stoichiometric and nonstoichiometric aqueous solutions) with the solutus. At primary saturation the aqueous solution is at equilibrium with a solidof composition determined by a horizontal tie line to thesolidus curve. If the rate of recrystallization is sufficientlyrapid. further dissolution of the initial solid will cause precipitation ofsecondary solids forming near equilibrium withthe aqueous phase. The composition of the aqueous solutionwill shift along the solutus, becoming enriched in the moresoluble end member while forming corresponding solids enriched in the least soluble end member. If the secondary solidforms under partial equilibrium conditions, it is not possiblefor the aqueous solution composition to shift above the solutus. No stoichiometric saturation state can be reached beforeprimary saturation. and the unique point of(tangential) intersection of a stoichiometric saturation curve with the solutuscorresponds to equilibrium with that particular solid. Consequently. no stoichiometric saturation curve for a solid withcomposition occurring within the miscibilitygap can intersectthe solutus (see. e.g.• Fig. 2c). All other points along a stoichiometric saturation curve. except at its possible intersectionwith the solutus, represent metastable solutions.
The graphical minimum of a stoichiometric saturationcurve (drawn for a given solid composition) is termed the"minimum stoichiometric saturation point" (GLYNN andREARDON. 1990). At this point. ~n... and therefore the sumof the aqueous Sr and Ca activities in the system. is at aminimum. If a solid is dissolved in an aqueous solution witha Sr/Ca ratio initially different from that of the solid. thestoichiometric saturation state which may be reached willhave a higher ~n.. value than that of the minimum stoichiometric saturation point. The solubility ofa solid dissolvedin such a nonstoichiometric solution. however. will be smallerthan for the solid dissolved in an initially pure CO2-H20solution.
lfit is assumed that an aqueous solution isat stoichiometricsaturation. the composition of the solid can sometimes beinferred from the location of the solution composition onthe Lippmann phase diagram. given that the thermodynamicmixing properties of the system are known. Generally. twopoints on a given stoichiometric saturation curve have to beknown in order to determine the solid composition to whichit applies. the reason being that stoichiometric saturationcurves drawn for different solids can intersect each other. Insome regionsof the (Sr.Ca )C03Lippmann diagram. however.
stoichiometric saturation curves do not intersect each other(see. e.g.• Fig. 2c). and therefore a solid composition may beimplied from a single stoichiometric saturation point.
With this understanding ofapplications of compositionaldiagrams and Lippmann phase diagrams, the reaction pathsfor the dissolution of strontianite-aragonite solid solutions innonstoichiometric Sr(HC03)2-C02-H20 and Ca(HC03nCO2-H20 solutions can be examined.
RESULTS
The solution composition data for all Series 3 dissolutionexperiments are summarized in Table 3. The initial Ca andSr concentrations (approximately 8.0 and 4.0 mmol/kg H20.respectively) are slightly undersaturated with respect to ara
gonite. calcite. and strontianite in CO2-saturated solutions.The solubilities ofcalcite. aragonite. and strontianite at 25°Cin COrsaturated water are approximately 9.1. 10.6. and 4.6mmollkg H20 (PLUMMER and DUSENBERG. 1982; DUSENBERG et al., 1984). Saturation indices with respect to theaverage solid composition are given in Table 3 for each s0
lution composition. A single illustration is presented for reactions of each solid. combining the solution compositiondiagrams and Lippmann phase diagram for dissolution inCa(HC03)2-C02-H20 and Sr(HC03n-C02-H20 solutions(see. e.g., Fig. 2). All concentrations on the compositionaldiagrams are in mmol/kg H20 and reaction times are labeledfor selected points. Additional compositional data from theSeries I (triangles) and Series 2 (circles) dissolution runs ininitially pure CO2-H20 solutions (PLUMMER and DUSENBERG. 1987) are included in subsequent Lippmann phasediagrams for comparison with the nonstoichiometric Series3 experiments (squares). All reaction paths shown on theLippmann diagrams refer to the aqueous activity fractionscale.
Dissolution of Aragonite and Strontianite
Uptake of 0.16 and 0.24 mmol of Sr and Ca occurred onthe aragonite and strontianite surfaces, respectively. withinthe initial I to 3 min of reaction (Fig. 2). After 6 min. thenet dissolution reaction is 1/3 complete for strontianite (in8 mmol Ca/kg H20. Fig. 2a)and 2/3 complete for aragonite(in 4 mmol Sr/kg H20. Fig. 2b). and most of the Sr and Cataken up initially by the solids has reentered the aqueoussolution. Beyond this initial 6 min. approximately 100 h ofreaction is required for strontianite to reach stoichiometricsaturation in Ca( HC03)2 solution (strontianite saturationindex = 0.004). For a comparable surface area/solution ratio.aragonite is clearly undersaturated (SI... = -0.087) after 100h ofdissolution in Sr(HC03h solution (Fig. 2b). Essentiallyall the Sr and Ca initially taken up by the solids reenters theaqueous solution (Fig. 2a and b).
The Lippmann phase diagram (Fig. 2c) shows that mostof the reaction path of strontianite in Ca(HC03)2 solutionoccurred below primary saturation. and thus no solid couldform by homogeneous precipitation within the aqueous s0
lution. Strontianite dissolution reached primary saturationafter several hours of reaction and apparently did not follow

3052 L. N. Plummeret al,
Table 3: Experimental datal
Run 1 (Strontianite) Run 8 (XSrC03aO.l 14)
Hours Peaz Ca+5r ca 5r pH 51 Hours PCOZ Ca+8r Ca 8r pH 81
0.00 0.9653 7.989 7.99 0.00 5.94 0.000 0.00 0.9592 3.995 0.00 4.00 5.66 0.0000.05 0.9653 8.127 7.65 0.48 5.97 -0.588 0.02 0.9592 6.164 2.39 3.78 5.82 -0.9320.10 0.9653 8.540 7.89 0.65 5.98 -0.416 0.05 0.9592 8.035 3.54 4.50 5.95 -0.5930.20 0.9653 8.712 7.85 0.86 5.98 -0.282 0.11 0.9592 9.361 4.68 4.68 6.02 -0.3830.40 0.9653 8.860 7.90 0.76 5.99 -0.340 0.17 0.9591 10.048 5.25 4.80 6.05 -0.2910.67 0.9653 9.000 7.93 1.07 5.99 -0.167 0.25 0.9591 10.477 5.57 4.91 6.06 -0.2401.00 0.9653 9.027 7.86 1.15 6.00 -0.135 0.50 0.9589 10.959 5.97 4.99 6.08 -0.1832.00 0.9654 9.107 7.84 1.27 6.00 -0.085 0.92 0.9587 11.192 6.19 5.01 6.09 -0.1554.00 0.9642 9.182 7.84 1. 34 6.00 -0.056 1.83 0.9578 11.371 6.32 5.05 6.10 -0.136
11.33 0.9628 9.281 7.88 1.40 6.00 -0.029 4.30 0.9572 11. 520 6.44 5.08 6.10 -0.12027.70 0.9645 9.350 7.91 1.44 6.00 -0.015 22.20 0.9588 11.710 6.70 5.01 6.11 -0.09673.30 0.9617 9.355 7.89 1.46 6.01 -0.006 48.50 0.9580 11.778 6.72 5.06 6.11 -0.09099.80 0.9596 9.446 7.97 1.47 6.01 0.004 79.00 0.9574 11.771 6.77 5.00 6.11 -0.088
99.00 0.9613 11. 730 6.81 4.91 6.11 -0.091
Run 2 (XSrCo3"O. 877 )
Hours PC02 Ca+8r Ca 5r pH 51
0.00 0.9655 7.972 7.97 0.00 5.93 0.000 Run 9 (XSrC03"O• 46J )0.05 0.9655 8.138 7.91 0.22 5.95 -0.7750.10 0.9655 8.278 7.98 0.30 5.96 -0.650 Hour. PCOZ Ca+8r Ca 8r pH 810.20 0.9655 8.456 7.96 0.49 5.96 -0.4520.40 0.9655 8.651 7.98 0.67 5.97 -0.316 0.00 0.9558 3.971 0.00 3.97 5.69 0.0000.67 0.9654 8.832 8.00 0.84 5.98 -0.220 0.02 0.9558 4.716 0.48 4.24 5.76 -1.0411.00 0.9654 8.963 8.01 0.95 5.99 -0.162 0.05 0.9558 5.822 1.20 4.63 5.85 -0.6632.00 0.9649 9.140 8.01 1.13 6.00 -0.083 0.10 0.9558 6.847 1.80 5.05 5.93 -0.4404.00 0.9634 9.277 8.05 1.23 6.04 -0.040 0.17 0.9559 7.696 2.31 5.38 5.97 -0.290
10.83 0.9628 9.455 8.07 1.39 6.02 0.019 0.25 0.9563 8.289 2.74 5.55 6.00 -0.19526.80 0.9645 9.614 8.11 1.50 6.03 0.058 0.50 0.9567 9.026 3.16 5.86 6.03 -0.09472.20 0.9617 9.811 8.14 1.67 6.04 0.114 1.00 0.9571 9.338 3.59 5.75 6.04 -0.04698.30 0.9596 9.939 8.17 1.77 6.03 0.145 3.50 0.9600 9.484 4.26 5.23 6.04 -0.017
19.00 0.9703 9.777 5.69 4.08 6.04 0.01846.00 0.9484 9.899 6.36 3.54 6.05 0.033
Run 5 (XSrC03aO. 565] 69.00 0.9475 10.003 6.55 3.46 6.04 0.042123.00 0.9541 10.126 6.86 3.27 0.047
Hour. Pcoz Ca+Sr Ca 5r pH Sl 170.00 0.9521 10.209 6.95 3.26 6.06 0.056216.00 0.9476 10.222 6.95 3.28 6.06 0.059
0.00 0.9583 6.090 6.09 0.00 5.84 0.0000.02 0.9583 6.680 6.34 0.34 5.87 -0.7110.05 0.9583 7.383 6.58 0.80 5.92 -0.4270.10 0.9583 8.031 6.81 1.22 5.96 -0.2610.15 0.9583 8.420 6.91 1. 51 5.98 -0.1750.25 0.9583 8.919 7.08 1.84 6.00 -0.084 Run JO (XSrC03aO.877]0.43 0.9583 9.401 7.34 2.06 6.02 -0.0151.00 0.9580 9.874 7.53 2.35 6.04 0.055 Hour. Pcoz Ca+8r Ca 8r pH 512.00 0.9576 10.153 7.75 2.40 6.05 0.0834.00 0.9567 10.337 7.83 2.51 6.06 0.108 0.00 0.9713 3.932 0.00 3.93 5.70 0.000
21.00 0.9603 10.560 8.07 2.49 6.06 0.124 0.02 0.9713 4.219 0.08 4.14 5.73 -0.3670.05 0.9713 4.487 0.10 4.39 5.75 -0.2910.10 0.9713 4.739 0.13 4.61 5.78 -0.219
Run 6 (XSrC03,,0.565] 0.17 0.9713 4.988 0.20 4.79 5.80 -0.1460.25 0.9713 5.171 0.21 4.96 5.81 -0.105
Hours Pcoz ca+Sr Ca 5r pH SI 0.50 0.9709 5.336 0.25 5.08 5.82 -0.0641.00 0.9703 5.355 0.33 5.02 5.83 -0.051
0.00 0.9583 8.888 5.89 3.00 5.99 -0.001 5.50 0.9671 5.485 0.62 4.86 5.82 -0.0120.02 0.9583 8.907 5.87 3.04 5.99 0.003 24.00 0.9484 5.590 0.75 4.84 5.83 0.0180.05 0.9583 8.900 5.87 3.03 5.99 0.001 47.00 0.9475 5.636 0.91 4.72 5.84 0.0250.10 0.9583 8.945 5.87 3.07 5.99 0.007 105.00 0.9541 5.703 loll 4.60 5.84 0.0310.17 0.9583 8.990 5.91 3.08 5.99 0.013 148.00 0.9521 5.710 1.19 4.52 5.84 0.0300.33 0.9580 9.026 5.93 3.09 6.00 0.017 194.00 0.9476 5.728 1.25 4.48 5.83 0.0330.75 0.9578 9.212 6.02 3.19 6.01 0.041 219.00 0.9416 5.757 1.41 4.35 5.84 0.0351.50 0.9576 9.406 6.13 3.27 6.02 0.0643.50 0.9567 9.638 6.27 3.37 6.03 0.093
20.50 0.9603 9.793 6.39 3.40 6.03 0.107
Run 7 (Aragonite] Run Jl (XSrC03aO.670]
Hour. Pcoz Ca+5r ca 5r pH 81 Hours Pcoz Ca+8r Ca 5r pH 81
0.00 0.9597 3.993 0.00 3.99 5.66 0.000 0.00 0.9699 3.974 0.00 3.97 5.70 0.0000.02 0.9597 6.285 2.84 3.44 5.85 -0.913 0.02 0.9699 4.581 0.36 4.22 5.75 -0.6680.05 0.9597 8.041 4.33 3.72 5.98 -0.562 0.05 0.9699 5.275 0.63 4.65 5.83 -0.4640.10 0.9596 9.214 5.27 3.95 6.03 -0.386 0.10 0.9699 5.979 0.81 5.17 5.87 -0.3100.17 0.9595 5.88 3.96 6.05 -0.296 0.17 0.9699 6.396 0.99 5.41 5.90 -0.2220.22 0.9595 10.141 6.18 3.96 6.06 -0.254 0.25 0.9700 6.654 1.10 5.56 5.92 -0.1720.33 0.9595 10.451 6.41 4.04 6.07 -0.219 0.50 0.9696 6.934 1.26 5.68 5.93 -0.1190.58 0.9593 10.694 6.66 4.04 6.08 -0.187 1.00 0.9691 6.952 1.41 5.55 5.93 -0.1071.00 0.9592 10.853 6.82 4.03 6.08 -0.167 4.25 0.9671 6.934 1. 76 5.18 5.90 -0.0962.25 0.9586 11.051 7.07 3.99 6.09 -0.139 23.00 0.9484 6.853 2.44 4.41 5.91 -0.0945.40 0.9572 11.138 7.13 4.01 6.09 -0.130 46.00 0.9475 6.961 2.88 4.08 5.92 -0.082
23.30 0.9588 11.318 7.30 4.02 6.09 -0.110 103.00 0.9541 7.084 3.34 3.74 -0.07749.80 0.9580 11.410 7.37 4.04 6.09 -0.101 146.00 0.9521 7.173 3.61 3.56 5.93 -0.07180.00 0.9574 11.463 7.46 4.01 6.10 -0.092 193.00 0.9476 7.223 3.65 3.58 5.93 -0.061
100.50 0.9613 11.503 7.55 3.95 6.10 -0.087 218.00 0.9416 7.248 3.82 3.43 5.93 -0.062
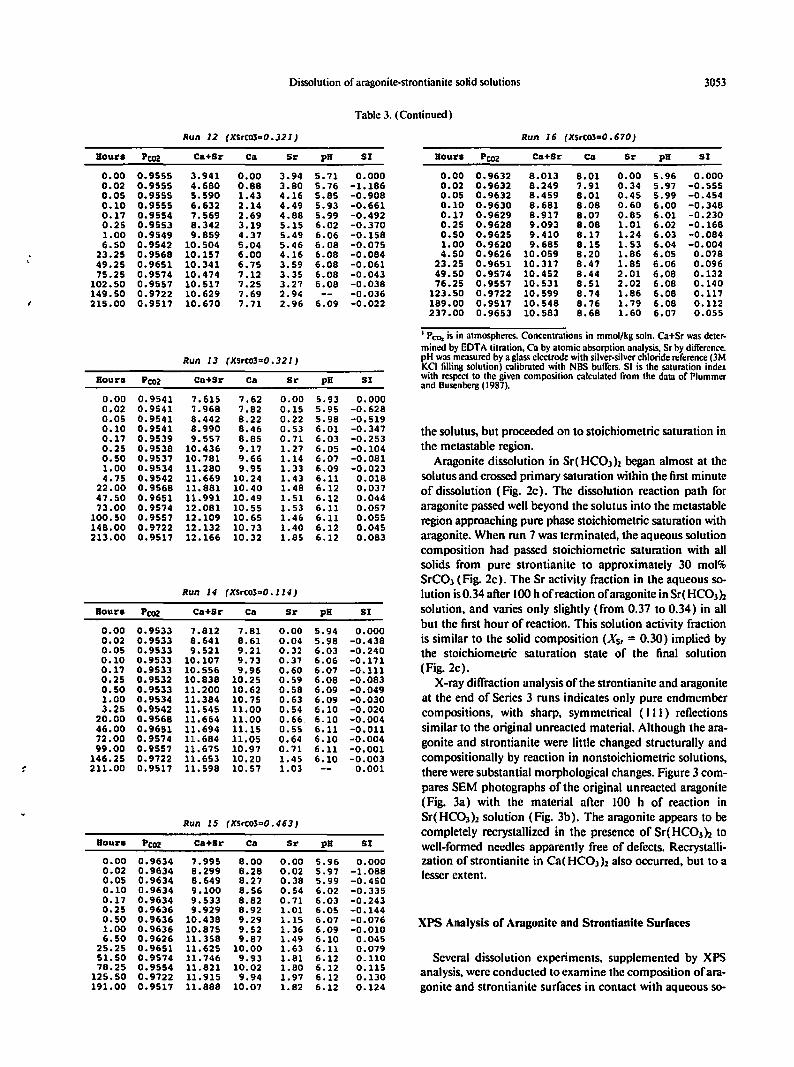
Dissolution ofaragonite-strontianite solid solutions 3053
Table 3. (Continued)
Run J2 (XSrC03=0_32J) Run J 6 (XSrt03=O. 670)
Hour. Pcoz Ca+Sr Cm 51' pH SI Houri Pcoz Ca+5r Ca 51' pH 51
0.00 0.9555 3.941 0.00 3.94 5.71 0.000 0.00 0.9632 8.013 8.01 0.00 5.96 0.0000.02 0.9555 4.680 0.88 3.80 5.76 -1.186 0.02 0.9632 8.249 7.91 0.34 5.97 -0.5550.05 0.9555 5.590 1.43 4.16 5.85 -0.908 0.05 0.9632 8.459 8.01 0.45 5.99 -0.4540.10 0.9555 6.632 2.14 4.49 5.93 -0.661 0.10 0.9630 8.681 8.08 0.60 6.00 -0.3480.17 0.9554 7.569 2.69 4.88 5.99 -0.492 0.17 0.9629 8.917 8.07 0.85 6.01 -0.2300.25 0.9553 8.342 3.19 5.15 6.02 -0.370 0.25 0.9628 9.093 8.08 1.01 6.02 -0.1681.00 0.9549 9.859 4.37 5.49 6.06 -0.158 0.50 0.9625 9.410 8.17 1.24 6.03 -0.0846.50 0.9542 10.504 5.04 5.46 6.08 -0.075 1.00 0.9620 9.685 8.15 1. 53 6.04 -0.004
.- 23.25 0.9568 10.157 6.00 4.16 6.08 -0.084 4.50 0.9626 10.059 8.20 1.86 6.05 0.07849.25 0.9651 10.341 6.75 3.59 6.08 -0.061 23.25 0.9651 10.317 8.47 1.85 6.06 0.09675.25 0.9574 10.474 7.12 3.35 6.08 -0.043 49.50 0.9574 10.452 8.44 2.01 6.08 0.132
102.50 0.9557 10.517 7.25 3.27 6.08 -0.038 76.25 0.9557 10.531 8.51 2.02 6.08 0.140149.50 0.9722 10.629 7.69 2.94 -0.036 123.50 0.9722 10.599 8.74 1.86 6.08 0.117215.00 0.9517 10.670 7.71 2.96 6.09 -0.022 189.00 0.9517 10.548 8.76 1.79 6.08 0.112
237.00 0.9653 10.583 8.68 1.60 6.07 0.055
I Pro, isin atmospheres. Concentrations inmmol/kg soln. Ca+Sr was deter-mined by EDTA titration. Ca by atomic absorption analysis. Sr by difference.
Run J3 (XSrC03=0. 32J ) pH was measured by aglass electrode with silver-silver chloride reference (3MKCI filling solution) calibrated with NBS buffers. SI isthe saturation index
Hourll Pcoz Ca+5r Cm 51' pH 51 with respect to the given composition calculated from the data ofPlummerand Dusenberg (1987).
0.00 0.9541 7.615 7.62 0.00 5.93 0.0000.02 0.9541 7.968 7.82 0.15 5.95 -0.6280.05 0.9541 8.442 8.22 0.22 5.98 -0.5190.10 0.9541 8.990 8.46 0.53 6.01 -0.347 the solutus, but proceeded on to stoichiometric saturation in0.17 0.9539 9.557 8.85 0.71 6.03 -0.2530.25 0.9538 10.436 9.17 1.27 6.05 -0.104 the metastable region.0.50 0.9537 10.781 9.66 1.14 6.07 -0.081 Aragonite dissolution in Sr( HC03)z began almost at the1.00 0.9534 11. 280 9.95 1. 33 6.09 -0.0234.75 0.9542 11.669 10.24 1.43 6.11 0.018 solutusand crossedprimary saturation within the first minute
22.00 0.9568 11.881 10.40 1.48 6.12 0.037 of dissolution (Fig. 2c). The dissolution reaction path for47.50 0.9651 11.991 10.49 1. 51 6.12 0.04473.00 0.9574 12.081 10.55 1. 53 6.11 0.057 aragonite passed wellbeyond the solutus into the metastable
100.50 0.9557 12.109 10.65 1.46 6.11 0.055 regionapproaching pure phasestoichiometricsaturation with148.00 0.9722 12.132 10.73 1.40 6.12 0.045213.00 0.9517 12.166 10.32 1.85 6.12 0.083 aragonite. When run 7 was terminated. the aqueous solution
composition had passed stoichiometric saturation with allsolids from pure strontianite to approximately 30 mol%SrC03 (Fig. 2c). The Sr activity fraction in the aqueous so-
Run J4 (XSrC03=O.J J4) lution is0.34 after 100h of reactionofaragonitein Sr(HC03hHour. PC02 Ca+Sr ell 51' pH 51 solution, and varies only slightly (from 0.37 to 0.34) in all
0.00 0.9533 7.812 7.81 0.00 5.94 0.000but the first hour of reaction. This solution activity fraction
0.02 0.9533 8.641 8.61 0.04 5.98 -0.438 is similar to the solid composition (XSt = 0.30) implied by0.05 0.9533 9.521 9.21 0.32 6.03 -0.240 the stoichiometric saturation state of the final solution0.10 0.9533 10.107 9.73 0.37 6.06 -0.1710.17 0.9533 10.556 9.96 0.60 6.07 -0.111 (Fig.2c).0.25 0.9532 10.838 10.25 0.59 6.08 -0.083 X-raydiffraction analysisof the strontianite and aragonite0.50 0.9533 11.200 10.62 0.58 6.09 -0.0491.00 0.9534 11.384 10.75 0.63 6.09 -0.030 at the end of Series 3 runs indicates only pure endmember3.25 0.9542 11.545 11.00 0.54 6.10 -0.020 compositions. with sharp, symmetrical (Ill) reflections
20.00 0.9568 11.664 11.00 0.66 6.10 -0.00446.00 0.9651 11.694 11.15 0.55 6.11 -0.011 similar to the original unreacted material. Although the ara-72.00 0.9574 11.684 11.05 0.64 6.10 -0.004 gonite and strontianite were little changed structurally and99.00 0.9557 11.675 10.97 0.71 6.11 -0.001
146.25 0.9722 11.653 10.20 1.45 6.10 -0.003 compositionally by reaction in nonstoichiometric solutions,f 211.00 0.9517 11. 598 10.57 1.03 0.001 there weresubstantial morphological changes. Figure3 com-
pares SEM photographs of the original unreacted aragonite(Fig. 3a) with the material after 100 h of reaction in
Run J5 (XSrC03=0. 463)Sr(HC03 )2 solution (Fig. 3b). The aragonite appears to becompletely recrystallized in the presence of Sr(HC03)2 to
Hour. Pe02 ca+Sr Ca 51' pH 51 well-formed needles apparently free of defects. Recrystalli-0.00 0.9634 7.995 8.00 0.00 5.96 0.000 zation of strontianite in Ca(HCOJ)z also occurred, but to a0.02 0.9634 8.299 8.28 0.02 5.97 -1.088 lesserextent.0.05 0.9634 8.649 8.27 0.38 5.99 -0.4500.10 0.9634 9.100 8.56 0.54 6.02 -0.3350.17 0.9634 9.533 8.82 0.71 6.03 -0.2430.25 0.9636 9.929 8.92 1.01 6.05 -0.1440.50 0.9636 10.438 9.29 1.15 6.07 -0.076 XPS Analysis of Aragonite and Strontianite Surfaces1.00 0.9636 10.875 9.52 1.36 6.09 -0.0106.50 0.9626 11.358 9.87 1.49 6.10 0.045
25.25 0.9651 11.625 10.00 1.63 6.11 0.07951.50 0.9574 11. 746 9.93 1.81 6.12 0.110 Several dissolution experiments. supplemented by XPS78.25 0.9554 11.821 10.02 1.80 6.12 0.115 analysis,were conducted to examine the composition of ara-125.50 0.9722 11.915 9.94 1.97 6.12 0.130
191.00 0.9517 11.888 10.07 1.82 6.12 0.124 gonite and strontianite surfaces in contact with aqueous so-
3054 L. N. Plummer et al.
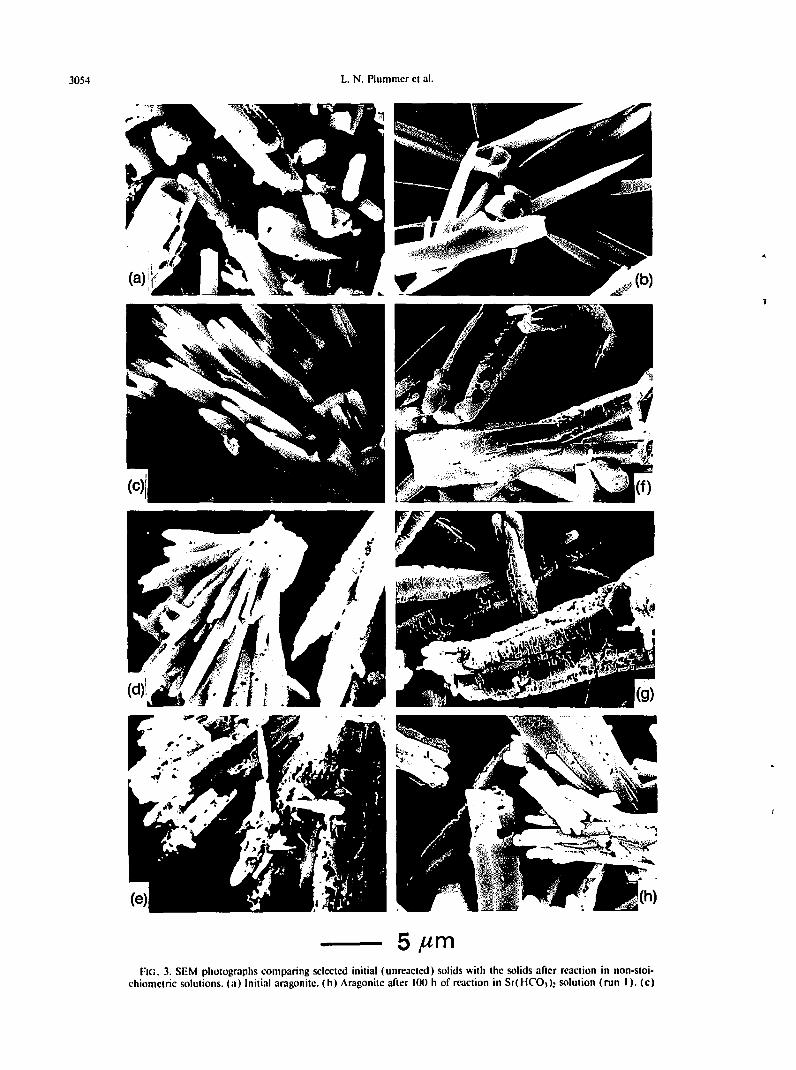
FIG. 3. SEM photographs comparing selected initial (unreactcd) solids with the solids after reaction in non-stoichiometric solutions. (a) Initial aragonite. (h) Aragonite after 100 h of reaction in SrI U('0.1)2 solution (run I). (c)

Dissolution ofaragonite-strontianite solid solutions 30SS
Table 4: Summary of XPS Results
Solid Mol' Reaction Aqueous' Wash' Angle XPS Peak Area" Surface Comp.'% Duration Solution Tech. (oegs.1 Mol %
SICOS ca Sr Ca 2p Sr3d CaCOs SrCOs
Arag. block 1.1 0 65 25513 311 98.7 1.3A1 1.1 21 day 3.03 3.98 EtOH 0 53587 9013 85.6 14.4A2 1.1 21 day 3.11 3.88 EtOH 0 48044 10813 81.6 18.4A3 1.1 21 day 7.38 3.97 EtOH 0 61989 18011 77.4 22.6A3 1.1 21 day 7.38 3.97 EtOH 65 46872 16452 73.9 26.1A4 1.1 2 min. 0.05 4.12 EtOH 0 42872 8168 83.9 16.1Stront. block 85.8 0 0 5744 28172 14.9 85.1Stront. block 85.8 0 65 5027 31938 12.0 88.0. Stront. powder 85.8 0 .. 5513 29253 14.3 85.7, S2 85.8 2 min 8.18 0.001 EtOH 0 10834 35732 22.1 77.953 86.4 21 day 8.38 0.32 N2 0 11912 17811 39.4 60.6S3 86.4 21 day 8.38 0.32 N 65 10624 13294 43.7 56.3S5 86.3 21 day 8.02 0.23 Et6H 0 14205 27387 33.5 66.5
1 Composition of the bulk solid by chemical analysis.
2 Composition of final aqueous solution in mmollkg. For A1. A2. and A4 the initial Ca was 0 and the initial Srwas approximately 4 mmollkg. The initial sOlution for A3 was essentially identical to the final composition.The initial solution compositions for 52. S3. and S5 were Sr. O. and Ca approximatley 8 mmollkg.
3 Method used to remove aqueous film from solid surface for XPS analysls. EtOH: was with stream of ethanol:N2: 810w surface film with jet of dry N2 gas.
4 The peak areas are normalized usin9 the photoionization ercss-seeuens of Scofield 119761.
5 Assumes a uniform composition over the entire information depth (see text),
lutions similar to those of Fig. 2. The XPS surface compositions and aqueous solution compositions, analyzed afterperiodsofreaction ofeither 2 min or 3 weeks,are summarizedin Table 4 and located on the Lippmann phase diagram ofFig. 2c. Three points were investigated along the compositional path for reaction ofaragonite in 4 mmol/kg Sr( HCO)nsolution. After 2 min of contact with the 4 mmol /kgSr(HCO)n solution, only 0.05 mmol of aragonite/kg H20
had dissolved, and the surface composition ofthe outer -60Awas 16.I mol%SrCO) (Sample A4, Table 4, Fig. 2c). Afterthree weeks of reaction in 4 mmot/kg Sr( HCO)h solution,the aqueous solution composition in contact with the lowsurface area blocks of aragonite had progressed along thereaction path to a composition similar to that observed forthe powders after only I min of reaction (Table 4, samplesAI and A2). The outer -60 Aof the two separate aragoniteblocks averaged 14.4 and 18.4 mol% SrCO). Because verylong reaction times would berequired for the aragonite blocksto reach the solution compositions observed near the end ofthe aragonite powder run (run 7), an initial solution wasprepared separately for XPS investigation reacting aragonitepowder with 4 mmol/kg Sr(HCO)z solution. The aqueoussolution, with composition virtually identical to that reportedin Table 4 after 3 weeksofreaetion (Sample A3), was filteredand used as the starting solution for reaction with the preparedblock of aragonite. After 3 weeks of reaction, XPS analysisindicated the outer -60 A ofsample A3 contained 22.6 mol%SrCOJ, and the outer -25 Aaveraged 26.1 mol% SrCO).Apparently, the outermost layer on the aragonite surface of
sample A3 isenriched in Sr and has a composition somewhatin excess of 26 mol% SrCO). Figure 2c indicates that theXPS surface composition of Sample A3 is similar to thatwith which the aqueous solution is at stoichiometric saturation.
The natural strontianite used in the XPS study containedapproximately 13.6 mol% CaCO), which differs from thenearly pure synthetic strontianite used in the Series 3 dissolution experiments. After 2 min of reaction in 8 mmol/kgCa( HCO)nsolution, the natural strontianite surface (originally 14 mol% CaC03) was slightly enriched in Ca in theouter -60 Aaveraging 22.1 mol%CaC03 (Sample S2, Table4, Fig. 2c), which compares with surface compositions of39.4 and 33.5 mol% CaC03 observed in the outer -60 AofSamples S3 and S5, respectively, after 3 weeks of reaction.As observed with the aragonites, the strontianites also showslightly greater enrichment in the outermost layers. XPSanalysis of the outer - 25 Aof Sample S3 yields 43.7 mol%CaCO). Figure 2c shows that the bulk Ouid wasundersaturated with respect to all compositions in the SrC03-CaC03
COz-HzOsystem during dissolution ofthe natural strontianites in 8 mmol/kg Ca(HC03n solution. Even though thesolid wasdissolving, solid solutions enriched in calcium continued to form on the mineral surface.
Dissolution or Ca-Rich Solids
Dissolution ofCa-rich solidsaveraging 11.4and 32.1 mol%SrCO) is examined in Figs. 4 and 5. In Sr( HCO) h solutions
Initial (unreacted) solid S-IO, Xs.co, = 0.321. (d) Solid S-IO after 213 h of reaction in Ca(HCOJ )2solution (run 13).(e) Solid S·IO after 21S h of reaction in Sr(HCO)2 solution (run 12). (f) Initial (unreacted) solid S-12, XSrCOl=0.877. (g) Solid S·12 after 98 h of reaction in Ca(HCO')2 solution (run 2). (h) Solid S-12 after 219 h of reactionin Sr(HCOJ)2 solution (run 10).

3056 L. N. Plummeret al.
2.5 6.0
ARun 14 (ea) B Run 8 {Sr} \Xllr"'0.114 :::s 5.5 Xs.=0.114 ":::s 2.0
\
~ r\ 25.04.3 Rn.
e:: 1.5 ~~148 Hra E- 99 Kra.Z Z \
0 -:}~ 0 4.5 ~'a:: 1.0 • ~211 Rn. a:: I It \E- \\ t; 4.0 I II \
rn .... I ~\.....~-a 1 MiD. ...... '0.5
3.5 ....,"
0.0 3.07.0 8.0 9.0 10.0 11.0 12.0 13.0 0 1 2 3 4 5 6 7 8 9
CALCIUM CALCIUM
o0.0 1.0
IIIIIIII,III/
II
I,,,,
0.2 0.4 0.6 0.8
MOLE (OR ACTIVITY) FRACTION OF Sr
" : ......e..... ;"..r·-......... I ,
\I : XSrC03 =O.114 ';;'->"/ / ". I C /\I: 6~.·:.' , " " I\t: ~"'C;, ~, I.. ~ -:-.;." ," '. I ,
"Sl l I ./'();' ,\.n I.l. ron lana e , , ,v',~ ,/ /" ,'\~,u' /.,,-' ~\.,' \~ I,,\' ~~ ..... , ..... ' \-:'p I.~ ~..... 'V \ I
\ /'""\ ....... $"" ,,' \. I
> Q >i:~ ~--'-/ \'.IF··· " I2J &.o~ .: "''\.', -; \ c-.........."0\', ............_ ~ _~---
~.,........ ...-----El------I \', <; \ .,.
'\ -, 0 o.~6.? ............I ---- __ .1 --
I ------ '0 0670 -,'1 -----,---------~------ ,I SO}Utu:- ---- -Q:. 0.:.8]: _
I
2
8
10
0;--6o->:"'-'4
FIG.4. Reaction paths for dissolution of solid5-8(XSIro) = 0.114}. (a) Compositional diagram for dissolution inCa(HCOlh solution (run 14).(b) Compositional diagram fordissolution in Sr(HCOlh solution (run 8). (c) Lippmannphasediagram. Squaresare experimental data from runs 14and 8. Triangles are stoichiometric dissolution data fromSeries I experiments (PLUMMER and DUSENBERG. 1987).SeeFig. 2 and text forfurther details.
both solids show initial uptake of Sr as observed previouslyfor aragonite in Sr(HCOl)2' Following this initial uptake.dissolution appears to be congruent for composition{s)slightly enriched in Sr relative to that of the average solid.The apparent compositions of the dissolving phases are estimated from the slopes of reaction paths on compositionaldiagrams. In Sr( HCO) h solution the 11.4 mol% SrCOl solidappears to dissolve as a solid ofapproximately 20 mol% SICO)(Fig. 4b). and the 32.1 mol% srCol solid dissolves as approximately 35 mol% SrCO) (Fig. 5b). over the first 4 andI h. respectively. Following this initial period of rapid dissolution. reaction rates are greatly reduced accompanied bya decrease in dissolved Sr. In the case of the 11.4 mol% solid.the Lippmann phase diagram indicates the final 4 reactionpoints in Sr(HCO)2 solution are near stoichiometric saturation with an aragonite containing approximately 28 mol'll>SrCO) (Fig. 4c). After I h of dissolution of the 32.1 mol%SrCO) solid in Sr(HCOlh solution. the aqueous solutionclosely follows stoichiometric saturation with a 44 mol%SrCO) solid (Fig. 5c) for the duration of the experiment (215h). While maintaining an apparent stoichiometric saturationstate for a 44 mol% SICO) solid in the bulk fluid, the dissolved
Sr concentration decreases by approximately 2.5 mmol/kgH20 with similar increases in the Ca concentration (Fig. 5b).This is evidence for incongruent dissolution. i.e.• dissolutionof a Ca-rich solid accompanied by precipitation of a Sr-richsolid. Incongruent dissolution apparently also began in thecase of 11.4 mol% SrCO) dissolving in Sr( HCOl h solution.as indicated in changes in reaction path (Fig. 4b). but notnearly to the extent observed for the 32.1 mol% SrCO) solid.
In Ca(HCO)h solution there is little evidence of initialuptake (first I to 3 min of reaction) of Ca for the solids at11.4 and 32.1 mol%SrCO) (Figs. 4aand Sa). The 32.1 mol%SICO) solid appears to dissolve congruently to stoichiometricsaturation. The final reaction point (solution composition at213 h) has shifted to slightly higher Sr content suggestingpossible incongruent dissolution to a Ca-rich phase near theend of the run.
Figure 6 compares X-ray diffraction patterns ofthe original32.1 mol% SICO) solid with the solid remaining after reactionin Sr{HCO)2 and Ca(HCO)h solutions. The un reacted material shows asymmetry to more Sr-rich compositions indicating an initial range of possible solid compositions. Afterreaction in Sr(HC03h solution, a second (III) reflection

Dissolution of aragonite-strontianite solidsolutions 3057
2 '-1
o 1 234 5 678CALCIUM
Run 12 (Sr)' , BXs.=0.321 ' '"f
0'1 Hr~~_ -0 ,."",P' .' 't:>o 15 1Iin. ,+ ,..-
.6 s, ,/ ),.0 ,
o ~'P ,--01 iii ,PD, G. \.
'()215 Hrt.
A \ Run 13 (Ca)Xar=0.321
\t'~';~,..-
, 0 213 Hrt.,
0'-'-~:l....L."""''''''''''...L..J.''''''''''...J...J1....L...'''''
6 7 8 9 10 11 12 13 14 15CALCIUM
4 .................,...,......,.....,...,..,..,...,...,.....,-,.,...,
.,10
.-010 6
X--2
4
8
o0.0 0.2 0.4 0.6 0.8 1.0
MOLE (OR ACTIVITY) FRACTION OF Sr
Cc-..l
FIG. 5. Reaction paths fordissolution of solid 5-10(XsrCO) = 0.321). (a) Compositional diagram for dissolution inCalHCO)2 solution (run 13).(b) Compositional diagram fordissolution inSrIHCO)h solution (run 12).(c) Lippmannphasediagram. Squaresare experimental data from runs 13and 12. Triangles and circles showdissolution paths inCO2-H20 solutions from Series I and Series 2 stoichiometric dissolution experiments, respectively (PLUMMER andBUSENBERG, 1987).SeeFig. 2 and text for further details.
.0
(noted ( III )B on Fig. 6) indicates precipitation of a solidnear 79 mol% SrCOl. X-ray diffraction shows no evidenceof compositional change or formation of a secondary phasewhen the 32.1 mol% SrCOl solid reacts in Ca( HCOlnsolution (Fig. 6).
The compositional diagram (Fig. 4a) shows that duringthe dissolution of the 11.4 mol% SrCOl solid in Ca(HCOlnthe solution becomes increasingly enriched in Sr initially,followed by a decrease in Sr. At 46 h of reaction the solutioncomposition is near that expected for congruent stoichiometric saturation. At this point the reaction clearly becomesincongruent to a Ca-enriched phase while maintaining stoichiometric saturation with the original 11.4 mol% SrCOlsolid. After 146 h the reaction appears to become incongruentto a Sr-enriched phase while the bulk fluid remained at stoichiometric saturation with the original solid to the end of theexperiment at 211 h (Fig. 4a). No secondary solid was detected by X-ray diffraction of the 11.4 mol% SrCO l solid atthe end of reaction in Sr( HCOlnsolution.
All reaction paths for the 11.4 and 32.1 mol% srCol solidscross the solutus into metastable regions (Figs. 4c and 5c).
In Ca(HCOln solutions the reactions closely approach stoichiometric saturation with the original solid composition andmaintain stoichiometric saturation even when incongruent(Fig. 4a). In Sr(HCOl )2 solutions the reactions appear tobecome incongruent before reaching stoichiometric saturation with the initial solid. The triangles and circles on theLippmann phase diagrams (Figs. 4c and 5c) show Series Iand Series 2 dissolution data for the solids in initially pureCOrH20 solutions (PLUMMER and BUSENBERG, 1987).
Figure 3 compares SEM photographs of the original (unreacted) solid containing 32.1 mol% SrCOl (Fig. 3c) withsolids collected at the end ofthe dissolution experiments inCa(HCOl )2 (Fig. 3d) and Sr(HCOln (Fig. 3e) solutions.The un reacted solid (Fig. 3c), similar in appearance to thepure aragonite recrystallized in Sr( HCOlnsolution (Fig. 3b),displays relatively sharp needles with no evidence of dissolution or pitting. After 213 h of reaction in Ca(HCOlh solution (termination of run 13), the remaining solid showsvarying degrees of dissolution (Fig. 3d), suggesting possiblecompositional differences in the original material or enhanceddissolution at defect or dislocation sites. Some ofthe material

3058 L. N. Plummeret al.
(111}A
(021}A
Dissolution of Mechanical Mixtures of Solid Solutions:The Midrange Compositions
X-ray diffraction analysis has revealed that the two solids(6- [0 and 6-14) of midrange composition (averaging 46.3and 56.5 mol% SrC03• respectively) are mixtures of at leasttwo compositional ranges (Table [and Fig.6). Examinationof the dissolution of these solids yields information on thedissolution behavior of mechanical mixtures of solid-solutionminerals.
Figures 7 and 8 show the compositional diagrams andLippmann phase diagrams for the dissolution of the twomidrange solids. These solids show less evidence of uptakeof Ca or Sr in the initial minutes of reaction. unlike thatobserved previously for the endmember and Ca-rich solids.
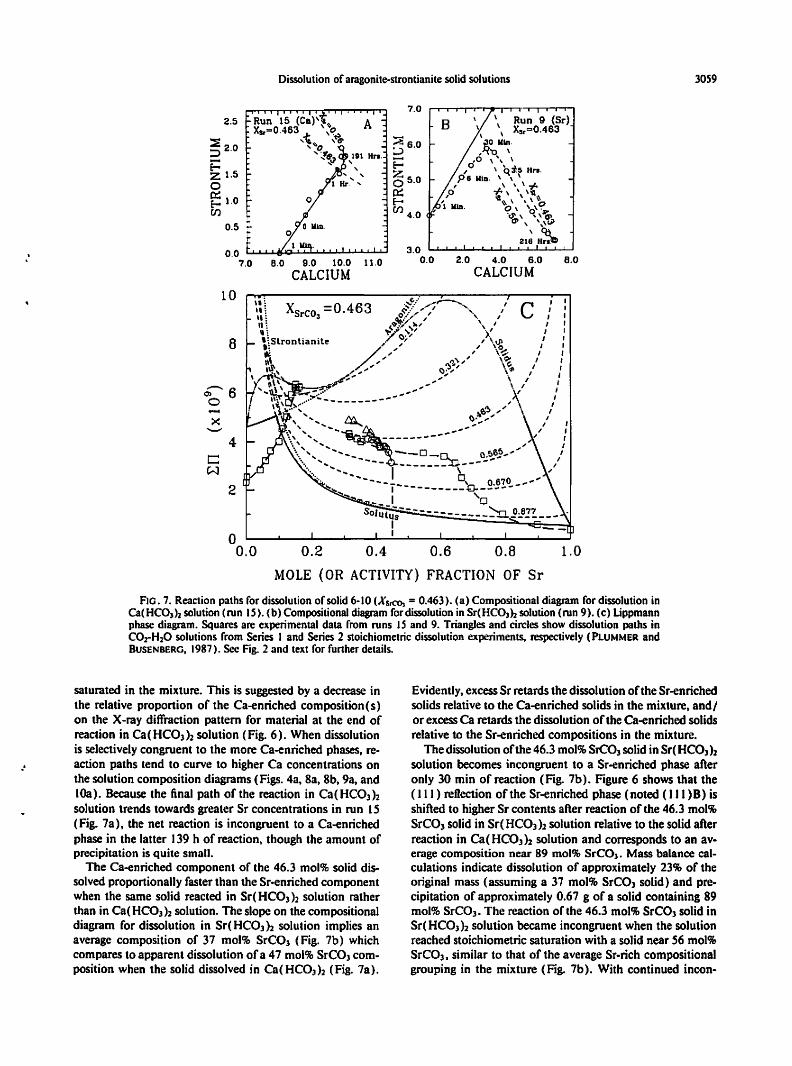
The dissolution of the solid (6-10) averaging 46.3 mol%srCo3in Ca( HC03)2solution appears to dissolvecongruentlyas a single solid (Fig. 7a). However. dissolution of the twocompositional ranges of this solid (36 and 56 mol% SrC03)in approximately equal proportions would give the appearance of congruent dissolution of a single composition near46 mol% SrC03. The dissolution of the 46.3 mol% SrC03solid appears to reach stoichiometric saturation correspondingto a composition near 26 mo[% SrC03within the first 52 hof reaction. Although the more soluble composition in thismixture averages approximately 36 mol% SrC03•the X-raydiffraction pattern does not exclude the possibility of compositions ncar 26 mo[% SrC03 • It is likely that the reactionproceeded to stoichiometric saturation with the most solublecomposition in the mixture. presumably 26 mol% SrC03.
Once stoichiometric saturation is reached with respect tosolids oflesser solubility in the mixture. their dissolution appears to cease. Further dissolution dissolves greater proportions of the more Ca-enriched solids which are still under-
in Fig. 3d shows no evidence of dissolution and is either amore stable composition that did not dissolve significantlyor a secondary solid. The compositional diagram showingthe final reaction point for run 13 [in Ca(HC03)2] suggeststhe reaction became incongruent to a Ca-enriched phaseduring the final 65 h of reaction.
More extensive dissolution of the 32.1 mol% SrC03solidis evident when reacted in Sr( HC03h solution (Fig. 3e) thanin Ca(HC03)2 solutions (Fig. 3d). The decline in Sr after Ih of reaction (run 12, Fig. 5b) indicates net precipitation ofa Sr-enriched phase. The smaller crystals showing little evidence of pitting and dissolution are thought to be this secondary phase (Fig. 3e) ofcomposition near 79 mol%SrC03•based on X-ray diffraction (Fig. 6). Mass balance calculationsbetween the initial and final solution compositions assumingdissolution (only) of 32 mol% SrC03 in run 13 and dissolution of32 mol% srCo3and precipitation of79 mol%srCo3in run 12 indicate that in Ca(HC03)2 solution. 12% of theoriginal mass was dissolved. while in Sr( HC03 h solution28% of the original solid ( [.2 g) dissolved forming 0.7 gramsof the secondary solid. The more extensive mass transfer inSr( HC03h solution is a consequence of the enhanced solubility of Ca-rich solids accompanying precipitation of Srrich solids.
(S,)
(Unreacted)
Solid 6·12
X SrCO. 0.74
Soud 6·10
Xsco, 0.463
(Ca)
(S,)
(Ca)
Solid 5·10
XS'CO. 0.321
(Sr)
(Unreacted)
1(111)8(021}A I I
I
CaF, (1I1}A
I I i
Inlernal Standard
29 28 27 26 25
DEGREES 2 e
FIG.6. X-raydiffraction patterns comparing the unreactedsolids5-10.6-10. and 6-12with the solidsafter reaction in Sr(HCOJ )2andCa(HC03h solutions.
Dissolution of aragonite-strontianite solidsolutions 3059
7.02.5 \ Run 9 (Sr)B \
\ \XSr<::!O.463
::e j6.0 ~O w.,..::,12.0 • "0 \
E= e:::: .0 \', \
Z 1.5 Z /0 ,qi'.5 Hn.
0 5.0 pe Min. \ ,\a ' , \' T-o:: 0:: ,0 -I- \ \ ''l:E- 1.0 f- ;. 'B.~, \' 'bCf) Cf) 4.0
1 Km. 0 \ '0".f.t, \,~
0.5 0'lI , '"t;)
21~ H~0.0 3.0.. 7.0 8.0 9.0 10.0 11.0 0.0 2.0 4.0 6.0 B.O
CALCIUM CALCIUM
10
1.0
IIIIIIIIIII/
II
II
II
/,
0.2 0.4 0.6 0.8
MOLE (OR ACTIVITY) FRACTION OF Sr
.....e..... "'....r-.... <c ,XSrCO~ =0.463 ~"""" ....." I
.. ~/."" ,/ ...." I~~"V.. llo' ... I I~~ »: ).' I
\~Slrontianite ,.'/?, , \Vi "~ r > / \~. ,"' /. ' .,...... ' \~ ,,,~\ , ~,,:; \ !$I "
\~~~~~:.... .......... \,''-""-'; :2-' __ -----" \.1
I 1\~, "....... ...-------- ;'\'~Io"'" e> \
~:<::---~~---_.._..--_....-~~ ....."\', <, ,"
.... "''''... --0_0.._ 0 ~65_ ...........~ ................: - ------~~---~--
'" - _!_ 0 0.670 _--'~~ I ---------~-_ .. --
....~ _... I '0501"t-- ...--------_ '- 0.877
~ Us ----~------ ..II
4
8
2
o0.0
-~6o
FlO. 7. Reaction paths for dissolutionof solid6-10 (XSrCO, = 0.463). (a) Compositionaldiagram for dissolution inCa(HCOl )2solution(run IS). (b) Compositional diagram fordissolution in Sr(HCOlh solution(run 9). (c) Lippmannphase diagram. Squares are experimental data from runs IS and 9. Triangles and circlesshow dissolution paths inCOrH20 solutions from Series I and Series 2 stoichiometric dissolution experiments. respectively (PLUMMER andRUSENBERG, 1987). See Fig. 2 and text for furtherdetails.
."
saturated in the mixture. This is suggested by a decrease inthe relative proportion of the Ca-enriched composition(s)on the X-ray diffraction pattern for material at the end ofreaction in Ca(HCO])2 solution (Fig. 6). When dissolutionis selectively congruent to the more Ca-enriched phases, reaction paths tend to curve to higher Ca concentrations onthe solution composition diagrams (Figs. 4a, 8a, 8b, 9a, andlOa). Because the final path of the reaction in Ca(HC03nsolution trends towards greater Sr concentrations in run IS(Fig. 7a), the net reaction is incongruent to a Ca-enrichedphase in the latter 139 h of reaction, though the amount ofprecipitation is quite small.
The Ca-enriched component of the 46.3 mol% solid dissolved proportionally faster than the Sr-enriched componentwhen the same solid reacted in Sr( HCO])2 solution ratherthan in Ca( HCOl )1 solution. The slope on the compositionaldiagram for dissolution in Sr( HC03 ) 2 solution implies anaverage composition of 37 mol% SrCOl (Fig. 7b) whichcompares to apparent dissolution ofa 47 mol% SrCOl composition when the solid dissolved in Ca(HCOlh (Fig. 7a).
Evidently, excessSr retards the dissolution ofthe Sr-enrichedsolids relative to the Ca-enriched solids in the mixture, and Ior excessCa retards the dissolution ofthe Ca-enriched solidsrelative to the Sr-enriched compositions in the mixture.
The dissolution of'the 46.3 mol%sreol solid in Sr(HCOlhsolution becomes incongruent to a Sr-enriched phase afteronly 30 min of reaction (Fig. 7b). Figure 6 shows that the(Ill) reOection of the Sr-enriched phase (noted (III )8) isshifted to higher Sr contents after reaction of the 46.3 mol%SrC03 solid in Sr( HCOJ)2 solution relative to the solid afterreaction in Ca( HCOJ h solution and corresponds to an average composition near 89 mol% SreOl . Mass balance calculations indicate dissolution of approximately 23% of theoriginal mass (assuming a 37 mol% SreOl solid) and precipitation of approximately 0.67 g of a solid containing 89mol% s-co., The reaction of the 46.3 mol'll SrCO l solid inSr( HC03nsolution became incongruent when the solutionreached stoichiometric saturation with a solid near 56 mol%SreO], similar to that of the average Sr-rich compositionalgrouping in the mixture (Fig. 7b). With continued incon-

3060 L. N. Plummeret al.
3.0 3.8Run 5 (CIl) , , , 21 Hn A Run 6 (CIl + Sr) B:s 2.5 XaroO.565, ~..¢,~' XaroO.565
... 'c ~o :s,~,
22.0...... £ ... ~ ... ~~ ::> 3.6
e- ~C!:"8" - '~110E-o E-oZ ' ',.tt,..o', z ~'.<'}; Hn.01.5 9 »I"c! "!?, 0 3.4, 0' ,0:: 0 0:: , ",.
",. ,&i \.0
, E-,
",.c:f,5? 3 II.... rn 3.2
, S' »lrt.
0.51 »I"
0.0 3.06.0 6.5 7.0 7.5 8.0 8.5 9.0 5.8 6.0 6.2 6.4 6.6
CALCIUM CALCIUM
10
8
";-6oX
"-"
4cw
2
a0.0
III,IIffIII,
II,
II
II
0.2 0.4 0.6 0.8 1.0
MOLE (OR ACTIVITY) FRACTION OF Sr
FtG. 8. Reaction paths fordissolution of solid 6-14 (XSrC0 1 = 0.565). (a) Compositional diagramfor dissolution inCa(HC03h solution (run 5). (b) Compositional diagram fordissolution in a Sr(HC03)2-Ca(HC03h solution(run6). (c) Lippmann phase diagram. Squares areexperimental datafrom runs5 and6. Triangles and circles showdissolutionpathsin COr H20 solutionsfrom Series I and Series 2 stoichiometric dissolution experiments. respectively (PLUMMERand DUSENBERG, 1987).See Fig. 2 and text for furtherdetails.
gruent dissolution, the bulk solution became progressivelysupersaturated with Sr-enriched compositions as stoichiometric saturation was reached with respect to compositionsmore enriched in Ca. At termination of run 9, after 216 h ofreaction in Sr( HC03h solution, the solution was near stoichiometric saturation with a 46 mol%SrC03 solid (Fig. 7b).The final two data points give virtually identical aqueoussolution compositions for a period of 48 h. Given sufficienttime the reaction path isexpected to proceed to stoichiometricsaturation with even more soluble solids in the mixture (inthe range of 26 to 36 mol% SrC03 ) , if not completely dissolved from the mixture.
The Lippmann phase diagram showsthat all reaction pathsfor dissolution of the 46.3 mol% SrC03 solid in Series I, 2.and 3 experiments cross the solutus forming metastable solutions. Although the composition of the aqueous solutionmay approach stoichiometric saturation with respect to thedissolving phase, when the reaction is incongruent the composition of the secondary phase appears to be unrelated toany thermodynamic state.
Dissolution data for the other midrange solid (6-14, averaging 56.5 mol% SrC03 ) are given in Fig. 8. This solidcontains compositional groupings near 45 and 58 mol%SrCOJ (Table I). Solid 6-14 was dissolved in Ca(HC03h
solution in run 5 and in a mixture of Ca(HC03h andSr(HCOJh in run 6 (Fig. 8). Both reactions appear to becongruent, dissolvinginitially more Sr-rich compositions, butas stoichiometric saturation with these phases is reached. dissolution of more Ca-enriched solids occurs. In Ca( HC03hsolution the 56.5 mol% Sre03 solid initially dissolves as ifcongruent for a solid near 67 mol% SrC03 (Fig. 8a). As stoichiometric saturation for a 67 mol% SrC03 solid is reached.the reaction path curves to higher Ca concentrations. as ifcongruent for more Ca-enriched phases. Run 5 was continuedfor only 21 h. and at its termination the bulk fluid composition corresponded to stoichiometric saturation with respectto the most soluble compositional grouping in the mixture.near 43 mol% SrC03 •
The starting solution composition in run 6 contained bothCa( HC03h and Sr(HC03 )2 . The initial solution wasover-

Dissolution of aragonite-strontianite solid solutions 3061
4.01.0 2.0 3.0
CALCIUM
B" " Run 11 (Sr)
/
' Xs.=0.74, ''30 ~,
J?Q ',+-9 'Q h oI t~, '~6'>
15 3 1Iin. q; '23 Hri...I V 0 ,
,dlllin. '0', "'0,
218
7.0
::.:21;:, 6.0
e::::Z0 5.00::E-rn 4.0
A Run 16 (Ca)Xs.=0.74
- &_"0.50~.:~~
- !'~-' ° -~-- -._ _ I ~.;o:ea __2~7_Hn.
- \2 - - - _ _Xrr"'0.741° 30 II - -
gJ:J8
0,0~ III
0.0 3.0 L.I................L.l.-.L.l.-.LL.......................l....l..J
7.8 8.0 8.2 8.4 8.6 8.8 9.0 9.2 0.0
CALCIUM
3.0
~
22.0E-Zo0::&; 1.0
I.
1.0
,III,I,IIIII
II
II
II
I/
0.2 0.4 0.6 0.8
MOLE (OR ACTIVITY) FRACTION OF Sr
o0.0
10
8
.--..6O'l
0....:><
""-
4t=:w
2
FIG. 9. Reaction paths for dissolution of solid 6-12 (XsrCO, = 0.74). (a) Compositional diagram for dissolution inCa(HC03h solution (run 16). (b) Compositional diagram for dissolution inSr(HC03h solution (run II). (c) Lippmannphase diagram. Squares are experimental data from runs 16 and II. Triangles and circles show dissolution paths inCOrH20 solutions from Series I and Series 2 stoichiometric dissolution experiments, respectively (PLUMMER andBUSENBERG, 1987). See Fig. 2 and text for further details.
saturated with solids containing more than about 60 mol%SrC03 and undersaturated with more Ca-rich solids. Figure8b shows that the 56.5 mol% SrCOJ solid dissolved veryslowly, with only several tenths of a millimole dissolved inthe first 45 min of reaction. There is a suggestion ofan initialuptake of a small amount of Ca and release of Sr to thesolution in the first 6 min of reaction, followed by congruentdissolution (Fig. 8b). The curvature of the reaction path tohigher Ca concentrations in solution suggestscongruent dissolution of more Ca-enriched solids. Alter 21 h of reactionthe fluid composition corresponded to stoichiometric saturation with a solid near 51 mol% SrCOJ.
Unlike dissolution experiments in Sr( HCOJ)2 solution.reaction of the 56.5 mol% SrCOJ solid (6-14) in a mixtureofCa(HCOJh and Sr(HCOJ)2 does not appear to becomeincongruent to a Sr-enriched phase. As previously shown,solidsat 11.4,32.1, and 46.3 mol%srCoJ react incongruentlyto Sr-enriched phases alter 4.3, I, and 0.5 h, respectively,when placed in initially pure Sr( HCOJh solution. And asshown below, reactions with solids containing 74 and 87.7
mol% SrC03 also become incongruent to a Sr-rich phasealter 0.5 h of reaction in Sr(HC03h solution. The presenceofCa in the initial Sr(HC03h-Ca(HC03h solution may affectthe induction period for nucleation of a secondary solid.However, as discussed earlier, it is also possible that the reoaction in Fig. 8b is incongruent to a Sr-enriched phase, whereonly minor precipitation occurs relative to dissolution. Theapparent uptake of Ca in the first 6 min of reaction maycondition the surface of the solid forming more soluble compositions that retard the nucleation of the less soluble Sr-richcompositions.
The solubility (and rate ofdissolution) of the 56.5 mol%SrC03 solid is clearly affected by the composition of thestarting solution. Assuming an average composition of approximately 50 mol% SrC03 and correcting for the volumeof water, 2.5 mmol of the solid dissolve in Ca( HC03h solution (Fig. 8a) while over the same period of reaction (21h) only 0.4 mmol dissolve in the Ca(HC03h-Sr(HC03hstarting solution (Fig. 8b). These observations are consistentwith solubilities based on stoichiometric saturation and show

3062 L. N. Plummeret al.
3.58.2 0.0
2.5
::= 2.0;:l
~ 1.5
o~ 1.0
en0.5
0.07.9
Run 2 (Ca) AX:r.=0.B77
8.0 e.iCALCIUM
5.5
::=;:l 5.0
e::Z0 4 .50::E-<en 4.0
~ 1111".
0.5 1.0CALCIUM
1.5
l.0
IIIII,,,
I,,I,
II
ff
fI,
5 -1- - - - - - 0.877 ~__
o lltlls -------~.oa&i
II
0.2 0.4 0.6 0.8
MOLE (OR ACTIVITY) FRACTION OF Sr
o0.0
10
2
4
8
cw
~6o-X--
FIG. 10. Reactionpaths for dissolution of solid 5-12 (XStCO, =0.877). (a) Compositional diagram for dissolutionin Ca(HCO)n solution (run 2). (b) Compositional diagram for dissolution in Sr(HCO)n solution (run 10). (e)Lippmannphasediagram. Squaresare experimental data from runs 2 and 10. Triangles and circles showdissolutionpathsin CO,H20 solutions fromSeries I and Series 2 stoichiometric dissolution experiments, respectively (PLUMMERand BUSENBERG, 1987). See Fig. 2 and text for further details.
that rates ofdissolution decrease as stoichiometric saturationis approached.
The Lippmann phase diagram shows that the final aqueoussolutions for Series I, 2, and 3 runs are all metastable withrespect to solids containing more than about 46 to 56 mol%SrCO) (Fig. 8c). The Series I and Series 2 runs proceed tolower Sr activity fractions in solution indicating incongruentdissolution forming Sr-enriched solid(s), as was noted previously (PLUMMER and DUSENBERG, 1987).
Dissolution of Sr-Rich Solids
The dissolution ofSr-rich solids in nonstoichiometric solutions shows somewhat analogous behavior to the previouslydiscussed dissolution behavior ofCa-rich solids. For example,when Sr-rich solids first come in contact with Ca(HC03nSOlution,there is substantial uptake ofCa (Figs. 9a and lOa),similar to the observed uptake ofSr when Ca-rich solids comein contact with Sr(HC03nsolution (Figs. 4b and 5b). Thecompositional diagrams show less evidence for uptake ofSr
by Sr-rich solids in Sr(HC03)2 solution, which is similar tothe observations for the dissolution of Ca-rich solids inCa( HC03 )2 solution. As observed for most ofthe dissolutionexperiments, the reactions appear to be congruent inCa( HC03 nsolution, dissolving solids equal to or somewhatenriched in Sr initially, and as dissolution proceeds, solidsprogressively more enriched in Ca dissolve causing the reaction path to curve to higher Ca concentrations on the compositional diagrams (Figs. 9a and lOa). Dissolution of Srrich solids in Sr(HC03nsolution appears congruent in thefirst 30 min of reaction, dissolving composition(s) either nearthat of the original solid (Fig. lOb) or composition(s) slightlyenriched in Ca (Fig. 9b), and then becomes incongruent toSr-enriched composition(s) after 30 min of reaction.
The ( III ) reflection on the X-ray diffraction pattern forthe solid averaging 74 mol% SrC03 is relatively symmetricalbut wider than that observed for pure solids such as the endmembers or solid 5-10 (Fig. 6). The peak width of the ( III )reflection for the 74 mol% SrC03 solid (measured at 71, theheight on scans run under otherwise identical conditions) is

Dissolution of aragonite-strontianite solid solutions 3063
.'
.'
0.30° 28,which is considerably larger than that of pure strontianite(0.18° 28) and the 87.7 mol% SrCO) solid (0.20° 20).This suggeststhat the solid, though averaging about 74 mol%sreo), may actually be a mixture of composition (s) in approximately equal proportions of solids both enriched anddepleted in Sr relative to the modal composition. The dissolution of the 74 mol% SrCO) solid in Ca(HCO)h andSr( HCO)h solutions suggestscompositions varying between66 and 85 mol% SrCO) may be present. After initial uptakeofCa in Ca(HCO)h solution. the 74 mol% SrCO) solid appears to dissolve congruently as a solid containing 85 mol%SrCO). In Sr(HCO)2 solution this same solid appears todissolve congruently as a single phase containing 66 mol%SrCO). In contrast, after the first few minutes of reaction.the 87.7 mol% SrCO) solid appears to dissolve congruentlyas a single composition near 89 mol% SrCO) in Ca( HCO)hsolution and near 83 mol% SrCO) in Sr(HCO)2 solution.This is further evidence that the 87.7 mol% SrCO) solid iscomposed predominantly of a very narrow compositionalrange. After passing stoichiometric saturation with respect toa solid containing 87.7 mol% SrCOl, the reaction path forthis solid in Ca(HCOlh solution curves to higher Ca concentrations indicating dissolution of more Ca-enriched compositions (Fig. lOa). The Lippmann phase diagram (Fig. IOc)indicates that the solution composition after 98 h of reactionin Ca( HCOl)2 solution corresponds to stoichiometric saturation for a composition near 60 mol% SrCOl. This suggeststhat. though the 87.7 mol% SrCO) solid is predominantly ofthis composition, the material may contain a small proportionofcomposition(s) approaching 60 mol% SrCOl. Similarly.the solution composition for reaction of the 74 mol% SrCOlsolid in Ca( HCOl)2 solution approaches that calculated forstoichiometric saturation with respect to a 50 mol% SrCOlsolid.
During incongruent dissolution of the 74 mol%sreol solidin Sr( HC03h solution. the bulk fluid is oversaturated withrespect to compositions containing more than 74 mol%SrCOl. Therefore. the fraction of solid in this mixture near85 mol% SrCO) is not expected to dissolve over most of thereaction path. Figure 6 shows that the ( III ) reflection of the74 mol% SrCOl solid is shifted to greater Sr content afterreaction in Sr( HC03h solution. the midpoint correspondingto a modal composition near 83 mol% SrCO). Although thebulk fluid remains at stoichiometric saturation with an apparent 74 mol% SrC03solid during incongruent dissolution(Fig. 9b), the initial congruent portion of the reaction indiocates that a composition near 66 mol% SrCOl is dissolving.Apparently the incongruent reaction path is determined bya steady state between the dissolution of a 66 mol% SrCOlsolid and precipitation ofa solid near 83 mol% SrCOl. Overthe duration of the experiment this steady state maintainedthe fluid composition at stoichiometric saturation with a 74mol% SrCOl solid. similar to the average composition of thesolid (Fig. 9b).
As with the 74 mol% SrCO) solid. the dissolution of the87.7 mol% SrCO) solid also becomes incongruent (to a moreSr-enriched composition) after 30 min of reaction inSr( HCO) h solution (Fig. lOb). During growth of the secondary solid. continued dissolution of the original solid
maintains the bulk fluid composition close to stoichiometric saturation with 87 to 83 mol% SrC03 compositions(Fig. lOb).
Figure 3 compares SEM photographs of the unreacted 87.7mol% SrC03 solid (Fig. 30 with the solid after reaction inCa(HCOlh solution (Fig. 3g) and Sr(HC03)2 solution (Fig.3h). More extensive pitting is evident in material reacted inCa(HC03h solution (Fig. 3g) than in Sr(HCO)h solution(Fig. 3h), even though mass balance calculations show thatlessthan 5%of the original mass wasdissolved in Ca(HC03hsolution compared to 4 to 5 times this amount ofdissolutionin Sr( HCOl h solution. Either the secondary precipitate formsin morphological continuity with dissolution sites in theoriginal solid or dissolution occurs more uniformly over thesurface in Sr( HCO) h solution. Smaller crystals with surfacesvirtually free of pitting (Fig. 3h) are probably products ofsecondary precipitation.
DISCUSSION
From the wide range of findings for the dissolution ofstrontianite-aragonite solid solutions in nonstoichiometricSr(HC03h-Ca(HC03)2 solutions, there are a number ofsimilarities and consistencies, especially when it is recalledthat multiple compositions are present in most of the solids,all of which are undersaturated in the initial solution andcan initially dissolve. Subsequent reaction paths of thesecompositional mixtures are influenced by the saturation statesof the individual compositions within the solid. Many of theexperimental findings have been summarized in Table 5which shows for each dissolution run (I) the solid used, (2)the run number, (3) the solid composition, (4) the initialsolution composition, (5) the moles of Ca or Sr taken up bythe solid per unit surfacearea in the initial minutes of reaction,(6) the calculated number of atomic layers formed on themineral surface as implied by the initial uptake of Ca or Sr(see discussion below), (7) the apparent averagecompositionof the dissolving solid during the congruent portion of dissolution, (8) an indication as to whether the congruent portion of the reaction path, as observed on the solution composition diagrams, eventually shows curvature towards dissolution of more Ca-rich compositions, (9) the duration (inhours) of the congruent portion of reaction, and the totalduration of the run, (10) the aqueous solution mole fractionofSr at termination of the dissolution run, ( II ) the apparentcomposition(s) of incongruent secondary solid(s) (ifformed), (12) the solid composition that could be in stoichiometric saturation with the final aqueous solution composition, as determined from the location ofthe endpoint onthe Lippmann phase diagrams, and ( 13) the total mmols ofsolid dissolved.
Thermodynamic Implications
The Lippmann phase diagrams show that none of the reactions approach thermodynamic equilibrium between thebulk solution and solids.The path ofthe solution compositionduring dissolution of all solids, both solid solutions and theend members. always passes the solutus proceeding into the

3064 L. N. Plummer et al.
Table 5: Comparison of Dissolution Results
50lid Run Solid' Init.' Uptake' Uptake' Cong.· ClIrves' HOllrs' Final" Precipitate" Final'· Total"1.0. No. XSrco• 501n. Mollm' Atomic Diss. Towards Cong.. 501n. Composition Apparent Mmols
mmol. le10' Layers Xs.co. Ca·rich Total XSr X&CO. 55 XSrC03 Dissolved
ReactionsIn CalHC0312Solutions5·8 14 0.114(+1 8.0Ca 0 0 0.20 yes 3,211 0.09 Ca-Rich·5r·Rich 0.11 3.15·10 13 0.3211+1 7.6Ca 0 0 0.35 no 73,213 0.15 Ca-Rich-5r·Rich 0.32 4.06·10 15 0.36>0.56 8.0Ca 0 0 0.47 yes 25, 191 0.15 Ca·Rich·5r·Rich 0.26 3.96·14 5 0.58»0.45 6.1 Ca Ca 7.0 0.8 0.67 yes 4,21 0.24 5r·Rich 0.46 4.86·12 16 0.661+1 8.0Ca Ca 12.1 1.5 0.85 yes 4.5.237 0.16 5r·Rich 0.55 2.05·12 2 0.877 8.0Ca Ca 16.9 2.1 0.89 yes 11,98 0.18 None 0.61 1.65tro. 1 1.00 8.0Ca Ca 30.7 3.9 1.00 no 100, 100 0.16 None 1.0 1.5
ReactionsIn SrlHC0312SolutionsArag. 7 0.000 4.05r 5r 93.5 10.7 0.00 no 100, 100 0.34 None 0.30 7.65·8 8 0.1141+1 4.05r 5r 76.5 8.8 0.16 no 4.3,99 0.42 5r·Rich 0.28 7.75·10 12 0.3211+1 4.05r 5r 86.7 10.2 0.35 yes? 1,215 0.28 0.79 0.42 12.06·10 9 0.36>0.56 4.05r 0 0 0.37 no 0.5,216 0.32 0.89 0.46 12.06·12 11 0.661+1 4.05r Sr 37.2 4.5 0.66 no 0.5,218 0.47 5r·Rich 0.74 12.05·12 10 0.877 4.05r 0 0 0.83 no 0.5,219 0.75 5r·Rich 0.83 12.0
Reactions In CalHC0312 • SrlHC0312 Solutions6·14 6 0.58> >0.45 3.05r Ca8.7 1.1 0.43 yes 21,21 0.35 5r-Rich? 0.51 1.2
5.9 Ca
1 Composition of solid from le-ray diffraction. I + I denotes some assymetry of the (1111 refelction to more 5r·rich solids. I-I denotes some assymetry ofthe 11111 refelction to more Ca-rich solids.
2 Initial composition of the aqueoussolution Immoleslkg H20I.
3 Uptake of calcium or strontium in the initial minutes of dissolution in non·stoichiometric solutions, in micromoles/m2•
4 Uptake of calcium or strontium expressedas numbers of atomic layers of CaC03 or 5rC0 3.5 Apparent mole fraction of strontium for initial congruent dissolution, calculatedfrom slopes on compositional diagrams.
6 Indication as to whether the congruent reaction path tends to curve to apparentdissolution of more Ca-enriched solids.
7 Duration, in hours. of congruent dissolution. and total dissolution experiment.
S Aqueous phase mole fraction of 5r at termination of run.
9 Composition of secondary precipitatelsl during incongruent dissolution, inferred from slopes on compositional diagramsand/lorl le·raydiffraction.
10 50lid composition that would be in stoichiometric saturation with the final aqueoussolutian. as indicated on the Lippmannphasediagrams.11 Total mmoles of the initial solid dissolved. based on mass balancecalculations.
metastable region above it. Although thermodynamic equilibrium isexpected to ultimately control the final compositionof the SSAS system, there is no evidence for equilibriumprocesses influencing reaction paths on the time scale of theexperiments (up to 237 h). For the present experimentalconditions, the dissolution path to equilibrium must passthrough a series of metastable solutions. The results showthat precipitation is also not an equilibrium process becausethe composition of secondary solids formed in incongruentdissolution falls within the miscibility gap.
Although equilibrium is not attained, many of the reactionsapproached stoichiometric saturation during dissolution. Ingeneral, the solid solutions reach or closely approach stoichiometric saturation when placed in Ca(HC03h solutions.In Sr( HC03)2solutions stoichiometric saturation is usuallyapproached, but not reached, before the reaction becomesincongruent to Sr-enriched compositions. This observationsupports the recent suggestion ofGALlNIER et al. ( 1989) thatstoichiometric saturation is most readily attained in SSASsystems containing an excessof the more soluble endmembercomponent. These authors studied reaction paths in the(Ba,Sr)S04 system and observed incongruent reactions whenthe initial solution contained the least soluble component,as we have found for (Ca,Sr)C03 solids.
The best examples of approach to stoichiometric saturation
in Ca( HC03)2 solution are seen for dissolution' of solids ofnarrow compositional range (Figs. 3a and 4a). Solids whichare clearly mixtures of several compositions, or a spectrumof compositions, also reach stoichiometric saturation inCa(HC03h solution, but apparently with respect to the moresoluble composition in the mixture. It appears that individualcompositions within mechanical mixtures dissolve in response to their independent stoichiometric saturation states.
Many of the reactions become incongruent to less solubleSr-enriched compositions, particularly when the initial solution is enriched in Sr( HC03)2. Although many of the dissolution reactions attain or closely approach stoichiometricsaturation, the secondary precipitates do not form at stoichiometric saturation (or equilibrium). It appears that manyofthe incongruent reaction paths. particularly those for compositions in the interval 0.2 ~ x ~ 0.8, are governed by steadystates between the rates of dissolution of Ca-rich compositionsand precipitation ofSr-rich solids (Figs. 5b, 7b, 9b, and lOb).
Several solids appear to actually attain stoichiometric saturation with respect to the dissolving composition duringincongruent dissolution (run 14, Fig. 4a, and run 10, Fig.lOb). This suggests that during dissolution ofsolid solutionsofa single composition, the aqueous solution can attain stoichiometric saturation with respect to the dissolving solid, ifthe rate of dissolution significantly exceeds that of precipi-
Dissolution of aragonite-strontianite solid solutions 3065
tation. Although not specifically investigated, it is expectedthat the attainment of stoichiometric saturation would beenhanced by higher surface area/solution ratios.
If multiple compositions are present in the mixture, stoichiometric saturation can influence the shape of both congruent and incongruent reaction paths, as evidenced by thecurvature of reaction paths in relation to the compositionallocation of stoichiometric saturation for specific solid compositions. During congruent dissolution in Ca( HCOl )2 s0
lution, reaction paths tend to curve to more Ca-rich solutioncomposition(s) once stoichiometric saturation is passed withrespect to less soluble (Sr-enriched) compositions (see, e.g.,Figs. 8a, 9a, and lOa), suggesting that the more soluble compositions selectively dissolve. In Sr( HCOJ)2solutions the incongruent reaction path (denoted by decreasing Sr concentrations) often crosses lines of constant stoichiometric saturation with respect to less soluble compositions, again drivenselectively by dissolution of more soluble compositions inthe mixture.
The experimental attainment ofstoichiometric saturationhas been demonstrated a useful means of determining thermodynamic data for solid-solution minerals when, for kineticreasons, reactions are too sluggish to reach equilibrium(THORSTENSON and PLUMMER, 1977; DUSENBERG andPLUMMER, 1985, 1989; PLUMMER and DUSENBERG, 1987).Difficulties in attaining stoichiometric saturation when reactions become incongruent have been previously noted(PLUMMER and MACKENZIE, 1974; DENIS and MICHARD,1983; MICHARD, 1986a,b; GAUNIER et al., 1989; LAFON,1990; KONIGSBERGER et al., 1991). The results of this investigation and previous studies indicate that stoichiometricsaturation is most readily attained under conditions of congruent dissolution using ( I) high surface area/solution ratios,(2) initial solutions spiked with an excess ofthe more solubleendmember component (GAUNIER et al., 1989), (3) initialsolutions spiked with a trace inhibitor that retards nucleationofsecondary precipitates (DUSENBERG and PLUMMER, 1985,1989), (4) well-characterized solids of homogeneous composition, and (5) confirmation of congruent reaction withfrequent monitoring ofsolid and solution composition.
Initial Uptake
The formation of solid-solution surface precipitates hasbeen noted previously (see, e.g., WOLLAST et al., 1980; MUCCIand MORSE, 1983; BUSENBERG and PLUMMER, 1985, 1989)in supersaturated aqueous solutions. In the present study,the compositions of the initial nonstoichiometric solutionswere designed to be slightly undersaturated with respect toall solids in the system. Although the initial bulk fluid is undersaturated, the Ca-rich solids always take up substantialamounts ofSr when first coming in contact with Sr( HCOJhsolution, and the Sr-rieh solids always take up substantialamounts ofCa when first in contact with Ca( HCOJn solution(Figs. 2a,b, 4b, 5b, 9a, and lOa). Although expected, uptakeofSr by Sr-rich solids in Sr( HCOJnsolutions and Ca by Carich solids in Ca(HCOJh solution cannot be detected in thepresent experiments without the introduction of an isotopetracer.
The greatest observable amounts of initial uptake of Caor Sr occur for the most extreme differences between solidcomposition and aqueous solution composition. Calculationsbased on the orthorhombic Pmcm structure ofaragonite andstrontianite with 4 Ca atoms per unit cell indicate cationdensities of 5.3 X 10 14 and 4.8 X 10 14 atoms per em! onaragonite and strontianite surfaces, respectively. This compares with the value of5 X 1014 Ca atoms per cm 2 calculatedby MOLLER and SASTRI ( 1974) for the calcite surface. Usingour estimates of the cation densities on aragonite and strontianite surfaces, the cation uptake in the initial minute ofdissolution in nonstoichiometric solutions indicates formation of nearly 4 atomic layers ( 12.4 A) ofaragonite on strontianite surfaces and approximately 10 atomic layers (49.0 A)of strontianite on aragonite surfaces. This is more than thefew atomic layers possible in adsorption phenomena and indicates rapid initial precipitation of solid solutions on themineral surface. The XPS results confirm the formation ofsolid solutions within at least the outer 25 to 60 A(8 to 19atomic layers) ofaragonite and strontianite surfaces after immersion in nonstoichiometric solutions.
As reaction proceeds most of the mass ofCa or Sr initiallytaken up reenters the aqueous solution (Fig. 2a and b), indicating dissolution or recrystallization of the surface phase.In the case ofCa-rich solids reacting in Sr(HCOJh solution,the bulk fluid rapidly becomes supersaturated with respectto strontianite (within the first minute of reaction), and asreaction proceeds the solution becomes progressively supersaturated with more Ca-rich strontianites (see the Lippmannphase diagrams). In this case the observed uptake could beattributed to precipitation from the bulk fluid. But for theSr-rich solids reacting in Ca(HCOJn solution, the Lippmannphase diagrams show that the entire uptake and resolutionprocess occurs while the bulk fluid is undersaturated withrespect to all phases in the system. Therefore, at least fordissolution of the Sr-rich solids in nonstoichiometric solutions, the uptake of Ca must take place on the solid surface.Presumably a similar surface precipitation (recrystallization)process is responsible for the uptake of Sr by Ca-rich solids.
The apparent formation of a surface phase in the initialminutes of reaction indicates that the surface compositiondiffers from that of the bulk fluid and that supersaturationwith respect to strontianite-aragonite solids must occur onthe mineral surface. From studies of the dissolution kineticsof calcite and aragonite (PLUMMER et al., 1978, 1979; BuSENBERG and PLUMMER, 1986), it has been proposed thatthe boundary-layer composition is determined by chemicalequilibrium with the solid due to rapid reaction with H +• Inthe case of solid-solutions, the boundary layer compositionwould likely correspond to stoichiometric saturation. Thesurface pH is thought to be greater than the bulk fluid value,as determined by stoichiometric saturation with the surfacePro,. During dissolution there is a flux of CO2 to the carbonate surface, and therefore the surface Peo, is less thanthat of the bulk fluid (PLUMMER and WIGLEY, 1976;DUHMANN and DREYBRODT, I985a,b); and during precipitation there is a CO2 flux from the surface to bulk fluid(PLUMMER et al., 1979; HOUSE, 1981). During rapid dissolution, interaction of this lower Peoz saturated surface en-

3066 L. N. Plummer et al.
1.00.0 0.2 0.4 0.6 0.6 1.0
1.00.0 0.2 0.4 0.6 0.6 1.0
MOLE FRACTION SrC03
FIG. II. Comparisonof reactiontimes in minutes for dissolutionof solids in the strontianite-aragonite system to reachsaturationpointsofn = 0.7 and n = 0.8. normalized to surfacearea/solution ratiosof I m2/L. 25°C. Trianglesshow reaction times in Ca(HC03h solution, circlesrepresent reaction times in Sr(HC03h solution. andsolidpointsshowreactiontimesfordissolution in initiallypure COrH20 (stoichiometric)solutions from the Series I and 2 runs.
0=0.6
0=0.7
4.5tr:~4.0
E-:::> 3.5
2: 3.0::=
2.5o0 2.0
...J 1.5
3.5(J)t%JE- 3.0:::>2: 2.5~
0 2.0
o~ 1.5
apparent composition of dissolving phase (Fig. lOa and b).This behavior suggests that the rate of dissolution of a solidis slower in Sr-rich solutions than in Ca-rich solutions.
Reaction times to reach saturation points, 0 (0 = lAP IK), ofO.7 and 0.8 (normalized to surface arealsolution ratiosof I m2I L) were compared for congruent dissolution ofeachsolid in Ca(HCOJ)2, Sr(HCOJh. and initially pure COTH20 (stoichiometric) solutions (Fig. II). In all cases a givensolid solution requires greater time to reach the same thermodynamic point in reaction progress when the initial solution is Sr(HCOJh than it does with Ca(HCOJ)2 startingsolutions. For the endmembers, aragonite dissolves slower inSr(HCOJh solutions than in Ca(HCOJh solutions, andstrontianite dissolves slower in Ca(HCOJh solution than inSr(HCOJ)2solution (Fig. II ). Initial rates of dissolution arerapid and comparable until the bulk solution approachesstoichiometric saturation. Increasingly, as stoichiometric saturation is approached, dissolution rates in Sr(HCOJh solutions are greatly slowed relative to dissolution in Ca( HCOJhsolution (Fig. II). In stoichiometric solutions (dissolutionin initiallypure CO2-H20 solutions) reaction times are greaterto reach the same saturation state for solid solutions than forthe endmembers. The 32.1 mol% SrCOJ solid requires approximately an order of magnitude greater time to reach saturation points of 0 0.7 and 00.8 than for the endmembers(Fig. II). Sr-rich solids dissolve faster in stoichiometric s0
lutions than in either Ca(HCOJh or Sr(HCOJh solutions.Ca-rich solids dissolve faster in Ca(HCOJh solutions than
Many of the runs, particularly for solids exhibiting a widerange of compositions, show a tendency to dissolve solidsmore rapidly from the mixture with compositions most different from that of the nonstoichiometric solution. That is,the more Ca-rich compositions tend to dissolve faster thanthe accompanying Sr-rich compositions within a mixturewhen the solid dissolves congruently in Sr(HCOJh solution.In Ca(HCOJh solution the same solid appears to dissolvecongruently as a more Sr-enriched solid (compare Figs. 7aand b, 8a and b, and 9a and b). Solids which are of morenarrow compositional range do not exhibit such extremes in
Kinetic Effects
Congruent Dissolution
After the initial few minutes, during which there are rapidreadjustments of the surface composition and largedifferencesbetween solid and aqueous solution composition, the dissolution is interpreted to be congruent. Because more thanone composition can dissolve initially, the slope of the reaction path on compositional diagrams corresponds to the(weighted) average composition of the dissolving phase(s),according to the rate of dissolution of each composition inthe mixture. Linear reaction paths on compositional diagramsindicate either dissolution ofa single phase or dissolution ofmultiple phases at constant relative rates. After the initialminutes of uptake, many of the reactions exhibit linear compositional reaction paths (see, e.g., run 8, Fig. 4b; runs 12and 13, Fig. 5b and a; runs 9 and IS, Fig. 7b and a; runs IIand 16, Fig. 9b and a; and runs 2 and 10, Fig. lOa and b).Other reaction paths are curved, suggesting changes in therelative rates ofdissolution of individual compositions withinmixtures. Curvature to Ca enrichment in the aqueous solutionoccurs as stoichiometric saturation is reached with respect toSr-rich compositions (runs 5 and 6, Fig. 8a and b; run 16,Fig. 9a; run 2, Fig. lOa).
vironment with the bulk fluid composition could cause oversaturation in the boundary layer and lead to precipitation onthe surface. It is possible that the relatively large amount ofsurface precipitation calculated for aragonite and strontianitesolids in nonstoichiometric carbonate solutions may be characteristic of these solids and other carbonate minerals withsimilar kinetic dissolution behavior. Dolomite (DUSENBERGand PLUMMER, 1982) and magnesite (FAUX et al., 1986)dissolution kinetics are thought to be entirely surface controlled and should not exhibit such extensive surface precipitation during dissolution in nonstoichiometric solutions. Asimilar conclusion may also apply to dissolution of noncarbonates in nonstoichiometric solutions. Although a kineticexplanation has been presented for precipitation ofa surfacephase in the initial minutes of reaction in nonstoichiometricsolutions, the observations can also be accounted for by rapidrecrystallization of the surface phase in response to interactions with the bulk fluid. The Ca or Sr initially taken up bythe solid would reenter the aqueous solution as surface recrystallization continued in response to changes in the CalSr in solution.

Dissolution of aragonite-strontianite solidsolutions 3067
in stoichiometric solutions. The midrange compositions dissolve at approximately the same rate, regardless of solutioncomposition. These observations are significant. but not entirely understood. The kinetic results are in part consistentwith the assumption that the rate ofdissolution is a functionof saturation state. That is, in Sr( HCO l h solutions. Sr-richsolids are closer to stoichiometric saturation than Ca-richsolids and presumably dissolve at slower rates. This dependency on stoichiometric saturation is further enhanced bythe lower solubility of Sr-rich solids. Depending on composition, the same relation may hold for Ca-rich solids inCa(HCOl )2 solutions, but it is compensated somewhat bythe higher solubility of the Ca-rich solids, particularly closerto the endmember compositions. Consider, for example, thedissolution of the 74 mol% SrCOl solid in Ca( HCOl )2 andSr( HCOl nsolutions (Fig. 9a and b) showing apparent dissolution of solids containing 85 mol% SrCOl and 66 mol%SrCOl, respectively. During the first 30 min of dissolutionin Sr(HCOl )2solution, the saturation indices ofa solid containing 85 mol% SrCOl increase from -.10 to +.21 whilethe saturation index for a solid containing 66 mol% SrCOlincreases from -.50 to -.16. In this case. from a thermodynamic standpoint, the more Ca-rich solids would tend todissolve faster than the Sr-rich solids in the mixture. as observed. An analogous conclusion is not so obvious when the74 mol%srCol solid dissolves in Ca( HCOl )2solution. Figure9a shows that in Ca(HCOlh solution the 74 mol% SrCOlsolid appears to dissolveas ifcongruent for an 85 mol%srColsolid. Although the ion activity product of the Ca-rich solidsis increased relative to the Sr-rich solids (in Ca( HCOl h solution), the equilibrium constant decreases with Sr contentin the solid. compensating for differences in stoichiometricsaturation. During the first 30 min of dissolution of the 74mol% SrCOl solid in Ca(HCOln solution, the saturationindices of66 and 85 mol% SrCOl solids are similar, varyingfrom -.57 to -.11 (66 mol% SrCOl) and -.59 to - .02 (85mol% SrCOl).
THE REACTIVE ZONE
The results of this study indicate that the kinetics of dissolution of strontianite-aragonite solid solutions are significantly influenced by interactions with the aqueous solutionin contact with the solid. The XPS results confirm that theouter tens of Angstroms of the solids dissolving in nonstoichiometric solutions are also solid solutions, but of compositions influenced significantly by the composition of theaqueous solution. Several earlier studies investigating thesurface chemistry and inhibiting effect of trace metals in solution on the rate ofdissolution and precipitation ofcarbonates have called on adsorption phenomena (see, e.g.. ERGAand TERJESEN, 1956; TERJESEN et al., 1961; NESTAAS andTERJESEN, 1969; KITANoet al., 1976; MEYER, 1984; O'CON.NORetaI.• 1984; REDDY, 1986). Koss and MOLLER (1974a)reported a decrease in the solubility ofcalcite in the presenceoflow concentrations of Mn?", These authors proposed theformation ofa monolayer solid solution on the mineral surface with ion activity product intermediate between that ofthe pure endmembers calcite and rhodochrosite. Additional
surface exchange studies on calcite have been reported forFe2+ , Mg2+ , Ni 2+, and Co2+ (Koss and MOLLER, 1974b).MUCCI and MORSE ( 1985) present Auger spectroscopic evidence to show that Mg ions are adsorbed preferentially onthe surfaces of aragonite.
LAHANN and SIEBERT ( 1982) presented a formulation forthe distribution coefficient which assumes the formation ofa surface phase of composition determined by the kineticsof interaction between the aqueous solution and solid. In astudy of chemical interactions between ionic solids andaqueous solutions. BROWN and Cnow ( 1983) concluded thatequilibrium between the "active portion of the outer layer"and inner lattice ofsolids could only be approached throughinteraction with the aqueous solution, and is not mediatedby solid-state reactions. FARLEY et al. ( 1985) proposed thatcation sorption on surfaces of metal oxides could be treatedas a continuum between adsorption and surface precipitation.The surface phase was treated as a solid solution with composition continually adjusted by reaction with the bulk fluid.DZOMBAK and MOREL ( 1986) modified the "surface precipitation model" to include a second (weaker) binding site.Cm.tANS and MIDDLEBURG (1987) tested the "surface precipitation model" of FARLEY et at. ( 1985) for sorption ofCd 2+, Mn2+, Zn2+, and C0 2+ on calcite surfaces using experimental data of Mc BRIDE (1980, 1979), JURINAK andBAUER (1956), and KORNICKER et at. (1985), respectively.The sorption data were adequately described by the "surfaceprecipitation model" which assumes monolayer adsorptionand formation of a solid solution in the outer layers of thesolid beneath the adsorption layer. The "surface precipitationmodel" has been investigated for sorption of Mn (II) on siderite and Nd (III) on calcite (WERSIN et al., 1989; BRUNO etal., 1989). DAVIS et at. ( 1987) interpreted the sorption ofCd on the calcite surface as a two-step process of rapid adsorption followed by incorporation into a solid-solution surface phase. similar to that proposed by FARLEYetal.(1985).The Cd sorption data showed that more than two atomiclayers were involved in the uptake of Cd on calcite (DAVISet al., 1987). ZACHARA et at. ( 1988) presented evidence foradsorption ofZn 2+ in exchange for Ca 2+ on the calcite surface.but found no evidence for solid-solution formation. UCHARAet at. ( 1989) give evidence for formation ofa surface precipitate of a phase similar to hydrozincite on calcite surfacesimmersed in nonstoichiometric Ca(HCOln-Zn(HCOl)~
aqueous solutions. STIPP and HOCHELLA (1990) and STIPPet al. ( 1992) presented XPS evidence for monolayer adsorption of Cd 2. on calcite surfaces followed by rapid diffusioninto the lattice on the order of tens of Awithin a few weeksin forming a solid solution.
Several isotopic exchange studies offer additional evidenceof solid-solution formation at the calcite-solution interface.In a study of 4'Ca exchange from saturated calcium bicarbonate solutions with calcite. MOLLER and SASTRI ( 1973)found a very rapid uptake of4'Ca in the first hour of reactionfollowed by a slower uptake reaching a steady state withinabout 20 h. Some 30 to 40% of the 4'Ca taken up by the solidcould not be removed from the surface by re-exchange experiments and was assumed to have become incorporatedinto the atomic layers below the crystal surface not affected
3068 L. N. Plummer et al.
by the "dynamic equilibrium processes" occurring at the surface. MOLLER and SASTRI (1973, 1974) concluded the surfaceexchange corresponds to approximately monolayer coverage.Exchange studies with 13C (TURNER, 1982; MOZETO et al.,1984) and 14C(ANDERSON,1968;GARNIER, 1985;STRIEGLand ARMSTRONG, 1990) further document the rapid uptakeand incorporation of substituting components in the calcitesurface. Finally, in a study of the 13C fractionation duringprecipitation of calcite, USOOWSKI et aI. (1982) observedthat the 13C composition ofprecipitated calcite was virtuallyidentical to the 13C composition of dissolved cor ion insolution; that is, the isotopic composition of the precipitatewas stoichiometric with that of the solution speciation anddid not correspond to isotopic equilibrium.
Our experimental resultscan best beexplained if the surfaceof the aragonite-strontianite solids in contact with the aqueoussolution is treated as a separate phase, or reactive zone, similarto that proposed by LAHANN and SIEBERT (1982) and FAR.LEY et aI. ( 1985). After the initial surface precipitation (recrystallization), the reactions of aragonite and strontianitepowders in nonstoichiometric solutions suggest approximately monolayer coverage, as observed in isotope exchangestudies in saturated solutions (MOLLER and SASTRI, 1973,1974; MOZETO et al., 1984). XPS analyses indicate formationof a thicker solid-solution zone on relatively large polishedblocks of strontianite and aragonite dissolving in nonstoichiometric solutions, on the order of ten atomic layers. It ispossible that surface precipitation occurred on the AI, A2,and A4 aragonite samples on initial contact with Sr( HC03)2prior to XPS analysis (Table 4); but from the powder runs,it is expected that the surface precipitate redissolved (or reocrystallized) within minutes of contact with Sr(HC03h.Surface precipitation is not expected for the A3 sample incontact with a Ca(HC03h-Sr(HC03)2 solution similar tothat observed at the end of the aragonite powder run inSr(HC03)2solution. However, all four XPS analyses ofaragonite surfaces suggest solid solution thicknesses of approximately 25 A.
When formed in Sr-rich solutions the composition of thereactive zone is enriched in Sr, has a lower solubility, andserves to retard the rate of dissolution of the original solid.In Ca-rich solutions the outer zone is enriched in Ca, has ahigher solubility relative to the original solid, and has shorterresidence time on the surface than Sr-rich compositions. Because of the differences in solubility (as a function of composition) ofthe reactive zone, the original solidsdissolvemoreslowly near stoichiometric saturation in Sr( HC03h solutionsthan in Ca(HC03h solutions.
If the distribution coefficients for incorporation of Sr andCa in the solid solutions are ncar unity, it is expected thatthe composition of the reactive zone would be similar to thatof the bulk fluid. It is significant that in the case ofaragonitedissolution in Sr(HC03)2solution, reaction isgreatly slowedwhen the bulk fluid is near stoichiometric saturation with a30 to 34 mol% SrC03solid (Fig. 2b and c) of compositionnearly identical to the stoichiometry of the aqueous solution(Sr mol fraction = 0.36 to 0.34). This is similar to the outermost composition on aragonite in contact with similaraqueous solutions as determined by XPS analysis (Sample
A3, Table 4, ~26.1 mol% SrC03). Overall dissolution ofaragonite continues because the chemical potential of aragonite beneath the reactive zone is greater than its chemicalpotential in the aqueous solution. This is seen in Fig. 2c whereIn for aragonite dissolution is below the pure-phase stoichiometric saturation curve for aragonite. The reaction isgreatly slowed because the forward and reverse rates of reaction of the reactive zone are nearly equal, increasing theresidence time of molecules in the reactive zone and retardinginteraction of the original solid with the aqueous solution.Further dissolution of the original aragonite must take placeby diffusion of reactants and products through the reactivezone.
In the case of dissolution of strontianite in Ca(HC03hsolution an outer reactive zone is again postulated. but inthis case the composition is presumably enriched in Ca. Ifformed in proportion to the stoichiometry of the bulk fluid,the outer zone on strontianite would contain approximately15 mol% SrC03 which is substantially more soluble thanstrontianite (Fig. 2c). Since the bulk fluid is clearly undersaturated with all Ca-enriched solids during strontianite dissolution in Ca( HC03)2 solution, the forward reaction of aCa-enriched zone would befaster than the backward reaction.In a dynamic sense, a shoner residence time is expected forthe Ca-rich zone. The presence of the Ca-enriched reactivezone retards strontianite dissolution in Ca( HC03)2solutionrelative to dissolution in stoichiometric solution; but becauseof the greater solubility of Ca-rich reactive zones relative toSr-rich zones, strontianite reaches stoichiometric saturationin Ca(HC03h solution more rapidly than aragonite inSr(HC03h solution. With sufficient time and barring recrystallization to more stable solids (approach to equilibrium), dissolution of aragonite is also expected to reach stoichiometric saturation in Sr( HC03h solution. Similar observations can be made for the dissolution of some of theintermediate-composition solids, but interpretation is moredifficult because of multiple compositions in the mixtures.
Reaction times for the endmembers to reach stoichiometricsaturation are considerably shorter in stoichiometric solutionsthan in nonstoichiometric solutions. Using a surface arealsolution ratio of approximately 20-30 m2/ L, PLUMMER andBUSENBERG ( 1987) found that stoichiometric saturation wasessentiallyestablished for many of the solids investigated herewithin 20 min to I h. For comparison with the lower surfacearea/solution ratios used here, this corresponds to reactiontimes to stoichiometric saturation in stoichiometric solutionsof I to 3 h. Substantially less time is required to reach U 0.7to U0.8 in stoichiometric solutions. These reaction times canbe compared to the observed tens to hundreds of hours required for endmember compositions to reach stoichiometricsaturation in nonstoichiometric solutions. It is expected thatin stoichiometric solutions the composition of the surfacereactive layer more closely resembles that of the solid, andfor these conditions there is less tendency to retard the rateof dissolution of the original material. Consequently, ifsurfaceprecipitation does not occur, stoichiometric saturation is morerapidly attained in stoichiometric solutions than in nonstoichiometric solutions. This supports, in pan, the conclusionof LAFON ( 1990) who claims to have reversed the solubility

Dissolution of aragonite-strontianite solid solutions 3069
of an 11.6 mol% MgCOl Mg-calcite. The equilibrium constant obtained for the Mg-calcite (of biogenic origin) fallsintermediate between the Group I and Group II solids studiedby BUSENBERG and PLUMMER (1989).
With sufficient data, a mechanistic model could be developed for the dissolution ofsolid-solution minerals as a function ofdiffusion ofreactants and products through the reactivezone. The rate of solid state diffusion through the reactivezone is expected to be a function of the thickness of the reactive zone and should control the overall dissolution rate.The thickness of the reactive zone on the mineral surface is,in tum, a function of the composition and the saturationstate of the zone with respect to the bulk fluid. The composition and thickness of the reactive zone is expected to be afunction of reaction progress. A second possible mechanismallows for dynamic, local fluctuations in the thickness of thereactive zone to expose crystal of the original compositionfor momentary dissolution. This mechanism would not require true "solid state" diffusion, but the average thicknessofthe reactive zone would dynamically affect the probabilityof exposing original solid for dissolution. Both mechanismsprobably occur to varying degrees, and in either case theoverall driving force for the dissolution reaction remains thegreater chemical potential ofcomponents in the original solidthan in the aqueous solution.
In supersaturated solutions, solids of a single compositioncan be grown from constant composition media at constantgrowth rate. During crystal growth the reactive zone becomesburied by successive growth layers and is preserved on thesolid surface. Perhaps one of the best means of observing thecomposition of the reactive zone is through coprecipitationstudies at constant composition and rapid constant growthrates. Chemical analysis ofcarbonates precipitated by seededgrowth techniques in constant temperature. constant composition, constant growth rate systems (DUSENBERG andPLUMMER, 1985, 1989; PLUMMER and BUSENBERG, 1987;LoRENS, 1981; MUCCI, 1987)define an empirical distributioncoefficient for the experimental conditions. The distributioncoefficient has been shown to be a function of growth rate(LoRENS, 1981; BUSENBERG and PLUMMER, 1985) and isoften not equal to the value expected at exchange equilibrium.For example, the distribution coefficient at exchange equilibrium for substitution ofSr in aragonite at 25°C iscalculatedusing the data of PLUMMER and BUSENBERG ( 1987) to benear 0.045 which compares to values of 1.1 to 1.2determinedin crystal growth experiments (KINSMAN, 1969; PLUMMERand BUSENBERG, 1987).
During dissolution the reactive zone also forms but is ina continuous state of dissolution and reprecipitation. Theresidence time of a particular ion in the reactive zone is increased as the saturation state of the bulk fluid approachesstoichiometric saturation. In nonstoichiometric solutions, thecation ratio in the bulk fluid changes in response to net dissolution, which then alters the composition of the reactivezone. During dissolution in stoichiometric solutions thecomposition of the reactive zone should remain relativelyconstant, and if the distribution coefficient is near unity, thecomposition of the reactive zone should be nearly stoichiometric with respect to the solid.
SUMMARY AND CONCLUSIONS
Our experiments on the dissolution of strontianitearagonite solid-solution minerals in nonstoichiometricSr(HC01h-Ca(HCOlh solutions have demonstrated theimportance of stoichiometric saturation in controlling dissolution. The results show that the dissolution reactions donot reach thermodynamic equilibrium on the time scale ofthe experiments. Many other observations have been madethat are consistent with the assumption of formation of asolid-solution "surface phase" on carbonates (LAHANN andSIEBERT, 1982; DAVIS et aI., 1987; COMANS and MIDDLEBURG, 1987; WERSIN et al., 1989; BRUNO et aI.• 1989;STIPPet al., 1992). The general findings of this study pertaining tothe thermodynamic and kinetic behavior of'strontianite-aragonite solid solutions in nonstoichiometric solutions are asfollows:
I) None of the dissolution reactions approach thermodynamic equilibrium. The path ofthe solution compositionduring dissolution ofall solids always proceeds to metastable compositions.
2) Stoichiometric saturation has been observed in nonstoichiometric solutions. Within the experimental uncertainties, the solids respond to the same equilibriumconstant in nonstoichiometric solutions as observed instoichiometric solutions. In Ca(HCOlh solutions reactions approach stoichiometric saturation with respectto the composition of the dissolving phase, and for solidswhich are mechanical mixtures, stoichiometric saturation is approached with respect to the least stable solidin the mixture. Reaction paths tend to curve, dissolvingmore Ca-rich compositions as stoichiometric saturationis reached with respect to Sr-rich solids in the mixture.
3) In Sr( HCOl h solutions the reactions usually becomeincongruent with respect to a Sr-rich solid before reaching stoichiometric saturation due to the lower solubilityof Sr-rich solids relative to Ca-rich solids.
4) The composition of secondary solids formed in incongruent reaction is unrelated to equilibrium and stoichiometric saturation states. The compositions precipitated fall within the miscibilitygap and thus form undernonequilibrium conditions from supersaturated solutions. During incongruent dissolution of solids in theinterval 0.2 s x s 0.8, the saturation state of the bulkfluid is maintained by a steady state balanced by thedissolution and precipitation rates, and the stoichiometric saturation state corresponds to a (nonexistent)solid composition intermediate to that of the reactant(s)and product(s). Several solids ofcompositions near theendmembers (11.4 and 87.7 mol% SrCOl) attain stoichiometric saturation with respect to the dissolvingsolidduring incongruent reaction. The bulk fluid can attainstoichiometric saturation with respect to the dissolvingsolid if the rate of dissolution significantly exceeds thatof precipitation.
5) Under optimum conditions, stoichiometric saturationmay be closely approached in congruent dissolution experiments. Thermodynamic data for solid solution minerals can then be derived from stoichiometric saturation

3070 L. N. Plummeret al,
compositional states. Experimental conditions whichenhance the approach to stoichiometric saturation include (I) high surface area/solution ratios, (2) nonstoichiometric solutions biased with an excess of themore soluble endmember component, (3) a trace inhibitorto minimize nucleation ofsecondary precipitates,and (4) well-characterized homogeneous solids. Frequent monitoring of the aqueous solution and solidcomposition is needed to confirm the congruentnatureof the reaction.
6) The ratesofdissolution of theendmembers strontianiteand aragonite are greatly reduced in nonstoichiometricsolutions relative to dissolution in stoichiometric solutions. Strontianite-aragonite solidsolutions dissolve moreslowly whenthe bulkfluid containsan excess of theleastsolublecomponent. The rate of congruent dissolutionof Sr-rich solids is greater in stoichiometric than nonstoichiometric solutions. Ca-rich solidsdissolve faster innonstoichiometric solutions containing an excess ofCa(HCO')2' The ratesofdissolution of individual compositions within mechanical mixtures appearto respondto their respective saturation states and surface areawithin the overall solid. For mechanical mixtures, excessSr in solution retardsthe dissolution of Sr-rich solids inthe mixture relative to Ca-rich solids. and excess Ca insolutionretardsthe dissolution ofCa-richsolidsrelativeto Sr-rich solidsin the mixture. The samesoliddissolvesmoreslowly in Sr(HCO')2 solutionthan in Ca(HCO')2solution.
7) XPSanalysis of thesurfaces ofaragonite and strontianitesolids in contact with Sr(HCO,h and Ca(HCO')2 solutions, respectively, confirm the formation of solid solutions in at least the outer 25 to 60 A. Solid solutionsenrichedin the added component formwithin2 min ofcontactand persist forcontact timesofat least3 weeks.Aragonite surfaces containas muchas 26.1 mol% SJ{:OJ,and strontianitesurfaces were enrichedin calcium to asmuch as 43.7 mol% CacoJ.
8) It is proposed that in stoichiometric solutions the composition of the surface layeris likelyto besimilarto thatof the solid, particularly if the distribution coefficientsfor incorporation of the components in the solid arenear unity. In stoichiometric solutionswithdistributioncoefficients near unity, the forward and backward reactionsare more nearlystoichiometric, as theyare identically in the case of dissolution of a one-componentsolid in pure water. When the surfacelayer is stoichiometric, it is compositionally indistinguishable from thebulksolid. In nonstoichiometric solutions thedissolutionrate isdecreased because the composition of the "surfacephase" often differs from that of the original solid andserves as a boundary layer separating the original solidfrom theaqueous solution. Consequently, reaction timesforattainmentof stoichiometric saturation mayincreasewhen the surface composition differs from that of thedissolving solid.
9) Surface precipitation wasobserved in the initialminutesof reaction even though the bulk fluid wasinitially undersaturated with respect to allsolidsin the system. The
precipitation could be due to a transient in surfacePC02causing local oversaturation and precipitation of asurface zone four to nine atomic layers in thicknesswithin the first minute of reaction. This surface zoneredissolves (or recrystallizes) within6 to 10 min of reaction, presumably in response to a relaxation in theimbalance between surface and bulk fluid Peoa. Ca-richsolids always take up substantial amounts of Sr on firstcontact withSr(HCO,h solution,and Sr-richsolidsalways take up substantial amounts ofCa whenfirst contactingsubsaturated Ca(HCO')2 solutions.
10) After the initial transient surface precipitation, thestrontianite-aragonite solid solutions dissolve congruently. In the caseof mechanical mixtureseachsoliddissolves congruently and its rate of dissolution is afunction of the individual saturation state and surfacearea. Congruent dissolution continues untilprecipitationfrom the bulk fluid occursor stoichiometric saturationis reached with respect to the least stable solid in themixture. Greater amounts of the initial solid are dissolved whenthe reactionbecomes incongruent. The reoaction will ultimately reach equilibrium, but for theseexperimental conditions the reaction paths proceedthroughmetastable states.
Acknowledgments-We havebenefined greatly from discussions withMichael F. Hochella Jr. (Stanford University). Susan L. Stipp(Universite de Geneve), and Art F. White(US Geological Survey)regarding application of the XPStechnique tocarbonates. Useof theXPSinstrumentation at the Centerfor Materials Research, StanfordUniversity, is gratefully acknowledged. Eric C. Prestemon assistedwithsomecomputercalculations and graphics. The manuscript wasimproved by review commentsfromSusanL. Stipp,JamesA. Davis(USGeological Survey),Douglas B. Kent (US Geological Survey),Donald C.Thorstenson (US Geological Survey), FredT. MacKenzie(University of Hawaii),and William D. Bischolf( WichitaStateUniversity).
Editorial handling: H. C. Helgeson
REFERENCES
ANDERSON T. F. ( 1968)Surface area measurement in calcitegrainsby isotopic exchange with C' 4·labeled carbon dioxide. Geochim.Cosmochim. Acta32, 1177-1186.
BERNDT A. F. and STEARNS R. I. ( 1973)The equilibrium betweena solid solution and an aqueous solution of its ions. J. Chem.Educ. SO, 415-417.
BROWN W.E.and CHowL. C.( 1983)Surfaceequilibriaofsparinglysolublecrystals. Coli. SIIr/. 7, 67-80.
BRUNO J., CARROL S., SANDINO A., CHARLET L., KARTHEIN R.,and WERSIN P. (1989) Adsorption, precipitation and coprecipitalion of trace metals on carbonateminerals at lowtemperatures.In Water-Rock Interaction (ed. D. L. MILES), pp. 121-124. BaIkema.
BUHMANN D. and DREYBRODT W. (1985a) The kinetics of calcitedissolution and precipitation in geologically relevant situationsofkarstareas, I. Open system. Chem. Geol. 48, 189-211.
BUHMANN D. and DREYBRODT W. (1985b)The kinetics of calcitedissolution and precipitation in geologically relevantsituationsofkarstareas, 2. Closed system. Chem. Geol. 53, 109-124.
BUSENBERG E.and PLUMMER L. N.(1982)Thekineticsofdissolutionof dolomite in CO2-H20 systems at 1.5 to 65°C and 0 to I atmPCOJ. Amer. J. Sci. 282,45-78.
DUSENBERG E. and PLUMMER L. N. (1985) Kinetic and thermodynamic factors controlling the distribution of SO~- and Na+ incalcites and selected aragonites. Geochim. Cosmochim. Acta 49,713-72S.

Dissolution of aragonite-strontianite solid solutions 3071
BUSENBERG E. and PLUMMER L. N. ( 1986) A comparative study ofthe dissolution and crystalgrowth kineticsofcalciteand aragonite.In Studies in Diagenesis(ed.F. A. MUMPTON); USGS BIIII. 1578.pp. 139-168.
BUSENBERG E. and PLUMMER L. N. (1989) Thermodynamics ofmagnesiancalcitesolid-solutionsat 25°C and I atm total pressure.Geochim. Cosmochim. Acta 53, 1189-1208.
BUSENDERG E., PLUMMER L. N., and PARKER V. B. (1984) Thesolubility of strontianite (SrCOl ) in CO2-H20 solutions between2 and 91°C, the association constants of SrHCOj(aq) andSrCO~( aq) between 5 and 80·C, and an evaluation of the thermodynamic properties of Sr2+(aq) and SrCO)(cr) at 25· and Iatm total pressure. Geochim. Cosmochim. Acta 48, 2021-2035.
COMANS R. N. J. and MIDDLEBURG J. J. (1987) Sorption of tracemetalson calcite:Applicabilityof the surface precipitation model.Geochim. Cosmochim. Acta 51,2587-2591.
DAVIS J. A., FUL'-ER C. C, and COOK A. D. (1987) A model fortrace metal sorption processesat the calcite surface: Adsorptionof Cd2+ and subsequent solid solution formation. Geochim. Cosmochim. Acta51, 1477-1490.
DENBIGH K. ( 1968) The Principles ofChemical Equilibrium, Cambridge University Press.
DENIS J. ( 1982)Comportement des Elements Traces lors de la Dissolution des Mineraux-e-Applicaticnaux Sourcesdes Alpes. Doctorat de Specialite, Universite Paris VII.
DENIS J. and MICHARD G. ( 1983) Dissolution d'une solution solide:Etude theorique et experimentale, BIIII. Mineral. 106, 309-319.
DZOMBAK D. A. and MOREL F. M. M. ( 1986) Sorption of cadmiumon hydrousferricoxideat highsorbate/sorbent ratios:Equilibrium,kinetics and modeling. J. Colloidlntetface Sci. 112, 588-598.
ERGA O. and TERJESEN S. G. ( 1956) Kinetics of the heterogeneousreaction of calcium bicarbonate formation, with special referenceto copper ion inhibition. Acta Chem. Scand. 10,872-874.
FAIVRE R. (1944) Etude. par diffraction des rayons X et analysedilarometrique, des carbonates mixtes de calcium et de strontiumet de leurs transformations. Compt. Rend. 219,73-74.
FARLEY K. J.. DZOMBAK D. A.• and MOREL F. M. M. (1985) Asurface precipitation model for the sorption of cations on metaloxides.J. ColloidInterface Sci. 106, 226-242.
FAUX R. E., BUSENBERG E., PLUMMER L. N•• and CANDELA P. A.( 1986)The dissolution kinetics of magnesite from 25°-85·C andpH's of 1to 10at atmospheric Pro:.Geol. Soc. Amer.Abstr. Prog.18, p. 599.
FUBINI B.• 01 RENZO F., and STONE F. S. (1988) Strontianite-aragonite solid solutions Sr"cal_"cO): Effectof composition on theorthorhombic-rhombohedral phase transition and the conversionto oxide solid solutionsSr.Cal_.O. J. Solid State Chem. 77,281292.
GAJ.lNIER C. DANDURAND J., and SCHOTT J. (1989) Sur Iecaracterenon-ideal des solutions solides (Ba, Sr) SO.: Mise en evidence etdetermination des parametres thermodynamiques par des essaisde dissolution Ii 25·C C. R. Acad. Sci. 308,1363-1368.
GAMSJAGER H. ( 1985) Solid state chemical model for the solubilitybehaviour of homogeneous solid Co-Mn-carbonate mixtures. BerichteBunsengesell. Pll)'sikal. Chemie 89, 1318-1322.
GARNIER J. ( 1985) Retardation of dissolved radiocarbon through acarbonated matrix. Geochim. Cosmochim. Acta49, 683-693.
GARRELS R. M. and CHRIST C L. (1965) Solutions. Minerals. andEquilibria. Harper & Row.
GARRELS R. M. and THOMPSON M. E. (1962) A chemical modelfor sea water at 25°C and one atmosphere total pressure. Amer.J. Sci. 260,57-66.
GARRELS R. M. and WOLLAST R. ( 1978) Discussion of "Equilibriumcriteria for two-component solids reacting with fixed compositionin an aqueous phase. Example: The magnesiancalcites." Amer. J.Sci. 278, 1469-1474.
GARRELS R. M., THOMPSON M. E., and SIEVER R. ( 1960) Stabilityof some carbonates at 25°C and one atmosphere total pressure.Amer. J. Sci. 258,402-418.
GARRELS R. M.• THOMPSON M. E., and SIEVER R. (1961) Controlof carbonate solubility bycarbonate complexes.AI1/{'r. J. Sci. 259,24-45.
GLYNN P. D. (1990) Modeling solid-solution reactions in low-temperature aqueous systems. In ChemicalModeling ofAqueous S)'stems II (ed. D. C. MELCllIOR and R. L. BASSETT); Amer. Chem.Soc. Symp. 4/6. 74-86. Amer. Chem. Soc.
GLYNN P. D. (1991) MBSSAS: A code for the computation of Margulesparametersand equilibrium relations in binary solid-solutionaqueous-solutions systems. Computers and Geoscience 17, 907966.
GLYNN P. D. and REARDON E. J. (1990) Solid-solution aqueoussolution equilibria: Thermodynamic theory and representation.Amer. J. Sci. 290,164-201.
GLYNN P. D. and REARDON E.J. ( 1992) Replyto Konigsberger andGamsjager's comment on "Solid-solution aqueous-solution equilibria: Thermodynamic theory and representation." Amer.J. Sci.292,215-225.
GLYNN P. D.• REARDON E. J., PLUMMER L. N., and BUSENBERG E.( 1990)Reaction paths and equilibriumend-points in solid-solutionaqueous-solution systems. Geochim. Cosmochim. Ada 54, 267282.
GUGGENItEIM E. A. ( 1937) The theoretical basis of Raoult's law.Trans. FaradaySoc. 33,151-159.
HOCHELLA M. F., JR. ( 1988)Augerelectronand X-rayphotoelectronspectroscopies. In Spectroscopic Methodsin Mineralog)' and Geolog)'(ed. F. C. HAWTHORNE); ReI'. Mineral. 18,573-637.
HOCHELLA M. F., JR., and CARIM A. H. (1988) A reassessment ofelectron escapedepths in siliconand thermallygrownsilicondioxide thin films.Surface Sci. 197, L260-L268.
HOLLAND H. D., BORCSIK M., MUNOZ J., and OXBURGH U. M.( 1963) The coprecipitation of Sr2+ with aragonite and of Ca2+with strontianite between 90· and 100·C. Geochim. Cosmochim.Acta 27, 957-977.
HOUSE w. A. ( 1981 )An experimentalinvestigation ofcarbon dioxideadsorption during calcite precipitation. Coli. Surf. 2, 119-131.
JURINAK J. J. and BAUER N. (1956) Thermodynamics of zinc adsorption on calcite, dolomite and magnesite-type minerals. SoilSci. Soc. Amer. Proc. 20,466-471.
KINSMAN D. J. J. (1969) Interpretation of Sr2+ concentrations in
carbonate minerals and rocks. J. Sediment. Petrol. 39, 486-508.KITANO Y., KANOM"RI N.. and YOSHIOKA S. (1976) Adsorption
of zinc and copper ions on calcite and aragonite and its influenceon the transformationof aragonite to calcite.Geochem. J. 10, 175179.
KONIGSBERGER E. and GAMSJAGER H. (1987) Solid-solute phaseequilibria in aqueous solution. I. Solubility constant and free enthalpy of formation of huntite. Berichte Bunsengesell. Physikal.Chemie 91, 785-790.
KONIGSBERGER E. and GAMSJ)(GER H. (1991) Graphical representation of solid-solute phase equilibria in aqueoussolution.BetichteBunsengesell. Physikal. Chemie 95,734-737.
KONIGSBERGER E. and GAMSJAGER H. ( 1992) Comment: Solidsolution aqueous-solution equilibria: Thermodynamic theory andrepresentation. Amer. J. Sci. 292, 199-214.
KONIGSBERGER E., HAUSNER R., and GAMSJAGER H. ( 1991 )Solidsolute phaseequilibria in aqueous solution. V. The system CdCOl
CaCO)-C02-H20. Geochim. Cosmochim. Acta 55,3505-3514.KORNICKER W. A.. MORSE J. W., and DAMASCENO R. N. (1985)
The chemistry ofC02+ interaction with calcite and aragonite surfaces. Chem. Geol. 53, 229-236.
Koss V. and MOLLER P. (1974a) Surface ion exchange on calcitepowder in the presence of Mn2+ ions. Inorg. Nucl. Chern. Lett.10, 849-854.
Koss V. and MOLLER P. (1974b) Oberflachenzusammensetzung,Loslichkeit und Lonenaktivitatsprodukt von Dicit in fremdionenhaltigen Losungen. Z. Anorg. AI/g. Chemie410, 165-178.
LAFON G. M. ( 1990) Reversedequilibrium solubilityof a high-magnesium calcite. In Fluid-Mineral Interactions: A Tributeto H. P.Eugster (ed. R. J. SPENCER and I-MING CHOU); GeochemicalSocietySpec. Pub. 2, 23-40.
LAHANN W. R. and SIEBERT R. M. (1982) A kinetic model for distribution coefficients and application to Mg-ealcites. Geochim.Cosmochim. Acta 46, 2229-2237.
LIPPMANN F. (1977) The solubility product of complex minerals.

3072 L. N. Plummeret al.
mixed crystals and three-layer clayminerals. Nelles Jahrb. Mineral.AM. 130,243.
LIpPMANN F. ( 1980)Phase diagramsdepicting aqueous solubility ofbinary mineral systems. Nelles Jahrb. Mineral. AM. 139, 1-25.
LIPPMANN F. ( 1982)Stableand metastable solubility diagrams forthe system CaC03-MgC03-H20 at ordinary temperatures. Blll/.Mineral. lOS, 273-279.
LoRENS R. B.(1981) Sr. Cd, Mn, and Co distribution coefficientsin calciteas a functionof calciteprecipitation rate.Geochim. Cosmochim.Acta45, 553-561.
MACKENZIE F. T., BISCHOFF W. D.• BISHOP F. C; LoUENS M.•SCHOONMAKER J. E.•and WOLLAST R. ( 1983) Magnesian calcites:Low temperature occurrences, solubility. and solid solution behavior. In Carbonates: Mineralogy and Chemistry. (ed. R. J.REEDER); Rev. Mineral. /J. 97-144.
MARIJNS A. (1978)Composition des Carbonates en Milieu Marin.Thesis, Universite Librede Bruxelles, Brussels, Belgium.
McBRIDE M. B. (1979) Chemisorption and precipitation of Mn2+at Caco3surfaces. Soil Sci. Soc. Amer. J. 43, 693-698.
McBRIDE M. B.(1980) Chemisorption of Cd2+ on calcitesurfaces.Soil Sci. Soc. Amer. J. 44, 26-28.
MEYER H. J. ( 1984)The influence of impuritieson the growth rateof calcite. J. CrystalGrowm 66, 639-646.
MICHARD G. (1986a) Partition between trace and major elementsduring mineraldissolution. In ExtendedAbstracts. Fifth lntemational Symposium on Water-Rock Interaction, 386-389. Orkustofnum.
MICHARD G. (1986b) Dissolution d'une solution solide: Cornplements et correction. Bull. Mineral. 109,239-25 I.
MICHARD G. and OUZOUNIAN G. (1978)Dissolution d'une solutionsolide: Etude preliminaire. c. R. Acad. Sci. 287,397-400.
MOLLER P. and SASTRI C. S. (1973) Exchange studies on singlecrystals ofcalcite using4SCa as the tracer.lnorg. Nucl. Chem. Leu.9,759-763.
MOLLER P. and SASTRI C. S. ( 1974)Estimation of the number ofsurface layers of calcite involved in Ca-4'Caisotopic exchange withsolution. Z. Ph)'s. Chem. (Neue Folge) 89, 80-87.
MOZETO A. A.,FRITZ P., and REARDON E. J. ( 1984)Experimentalobservations on carbon isotopeexchange in carbonate-water systems.Geochim. Cosmochim. Acta48, 495-504.
MUCCI A. ( 1987) Influence of temperatureon the composition ofmagnesian calciteovergrowths precipitated from seawater. Geochim. Cosmochim. Acta51, 1977-1984.
MUCCI A.and MORSE J. W. (1983) The incorporation ofMg2+ andSrH intocalcite overgrowths; Influences ofgrowth rateand solutioncomposition. Geochim. Cosmochim. Acta47, 217-233.
MuCCI A.and MORSEJ. W.( 1985) Auger spectroscopy determinationof the surface-most adsorbed layercomposition on aragonite, calcite,dolomite,and magnesite in syntheticseawater. Amer. J. Sci.285,306-317.
NESTAAS I. andTERJESEN S.G. ( 1969)The inhibiting effect ofscandium ions upon the dissolution ofcalciumcarbonate. ActaChem.Scand. 23, 2519-2531.
O'CONNOR G. A.,O'CONNOR C.. and CLINE G. R.( 1984)Sorptionofcadmiumbycalcareous soils: Influence ofsolution compositions.Soil Sci. Soc.Amer. J. 48, 1244-1247.
PALACHE C., BERMAN H., and FRONDEL C. (195I) Dana'sSystemofMineralogy. Vol II. J. Wiley & Sons.
PARKHURST D. L., THORSTENSON D.C.,and PLUMMER L.N.( 1980)PHREEQE-A computer program for geochemical calculations.USGS Waler Resources Invest. 80-96. NTIS Tech. Rept. PB81167801.
PAUWELS H.,ZUDDAS P.,and MICHARD G. ( 1989) Behavior of traceelements during feldspar dissolution in near-equilibrium conditions: Preliminary investigation. Chem. Geol. 78,255-267.
PlUMMER L. N.and BUSENBERG E.(1982)Thesolubilities ofcalcite,aragonite, and vateriteinCO2-H20 solutionsbetween 0 and 90·C,and an evaluationof the aqueous model for the system CaCO)"COrH,Q. Geochim. Cosmochlm. Acta46,1011-1040.
PLUMMER L. N. and BUSENBERG E. (1987) Thermodynamics ofaragonite-strontianite solidsolutions: Results fromstoichiometricsolubility at 25 and 76·C. Geochim. Cosmochim. Acta51, 13931411.
PLUMMER L. N. and MACKENZIE F. T. ( 1974)Predicting mineralsolubility fromratedata: Application to the dissolution of magnesian calcites. Amer.J. Sci. 274,61-83.
PLUMMER L. N. and WIGLEY T. M. L. ( 1976)The dissolution ofcalcite in CO2·saturated solutions at 25·C and I atmosphere totalpressure. Geochim. Cosmochim. Acta40, 191-202.
PLUMMER L. N., WIGLEY T. M. L.,and PARKHURST D. L. (1978)The kinetics of calcite dissolution in COrwater systems at 5 to60°C and 0.0 to 1.0atm CO2• Amer. J. Sci. 278,179-216.
PLUMMER L. N., WIGLEY T. M. L., and PARKHURST D. L. (1979)Critical review of the kinetics of calcitedissolution and precipitation. In Chemical Modeling in Aqueous Systems (ed. E. A.JENNE); ACS SymposiumSeries 93.537-573.Amer.Chern.Soc.
REDDY M.M.( 1986) Effect ofmagnesium ionson calcium carbonatenucleation and crystal growth in diluteaqueoussolutionsat 25·C.USGS Bllll. 1578. 169-181.
SAXENA S.K.( 1973)Thermodynamics ofRock-Forming CryslallineSollllions. Springer-Verlag.
SCOFIELD J. H. ( 1976) Hartree-Slater subshell photoionization crosssections at 1254 and 1486eV.J. Elect. Spectros. RelatedPhenomena8,129-137.
SPEER J. A. ( 1983)Crystal chemistry and phaserelations of orthorhombiccarbonates. In Carbonates: Minera/ogy and Chemistry(ed. R. J. REEDER); Rev. Mineral. 1I. 145-190.
STIPP S. L. and HOCHELLA M. F., JR. (1990) Adsorption of Cd2+on calciteand itsdiffusion into thecrystal: Asurfacespectroscopicand diffraction study(abstr.).V.M.Goldschmidt Conr., Baltimore,MD,1990.
STIPP S. L., HOCHELLA M. F•• JR., PARKS G. A.,and LECKIE J. O.( 1992)Cd2+ uptake by calcite, solid-state diffusion and the formation of solid-solution: Interface processes observed with nearsurfacesensitive techniques (XPS, AES and LEED). Geochim.Cosmochim. Acta56,1941-1954.
STRIEGL R. G. and ARMSTRONG D. E. ( 1990)Carbon dioxide reotentionand carbonexchange on unsaturated Quaternary sediments.Geochim. Cosmochim. Acta54, 2277-2283.
TERJESEN S. G., ERGA 0., THORSEN G., and VE A. (1961) Theinhibitory action of metal ions on the formation of calcium bicarbonateby the reaction of calcite withaqueouscarbondioxide.Chem. Engr. Sci. 14, 277-289.
THORSTENSON D.C.and PlUMMER L. N.(1977)Equilibrium criteriafor two-component solids reacting with fixed composition in anaqueousphase-Example: The magnesian calcites. Amer. J. Sci.277, 1203-1223.
TURNER J. V.( 1982)Kineticfraetionation ofcarbon-I3duringcalcium carbonate precipitation. Geochim. Cosmochim. Acta 46,1183-1191.
USDOWSKI E.• HOEFS J., and MENSCHEL G. (1982) Die Fraktionierungder stabilen Isotopedes Kohlenstoffs und des Sauerstoffsbeider Bildung vonCalcitan der Erdoberflache. Berichte Bensengesell. Ph)'sikal. Chem. 86, 1043-1046.
WALTER l. M.( 1983)The dissolution kinetics of shallow watercarbonategrain-types: Effects of mineralogy, microstructure and s0lutionchemistry. Ph.D.dissertation, Univ. Miami.
WALTER L. M.and MORSE J. W.(1984)Magnesian calcite stabilities:A reevaluation. Geachim. Cosmochim. ACla 48, 1059-1070.
WERSIN P., CHARLET L., KARTHEIN R., and STUMM W. (1989)Fromadsorption to precipitation: SorptionofMn 2+ on FeC03(s).Geochim. Cosmochim. Acta 53, 2787-2796.
WOLLAST R. and MARUNS A. (1980) Mechanisme de dissolutiondescalcites magnesiennes naturelles. Cristallisation, Deformation.Dissolution des Carbonates Conf; Bordeaux. France. 477-486.
WOLLAST R.,GARRELS R. M.,and MACKENZIE F.T. ( 1980) Calciteseawater reactions in oceansurface waters. Amer. J. Sci.280,831848.
ZACHARA J. M.,KlTTRICKJ. A.,and HARSH J. B.(1988)The mechanism ofZn 2+ adsorption on calcite. Geochim. Cosmochim. Acta52, 2281-2291.
ZACHARA J. M., KITTRICK J. A., DAKE L. S., and HARSH J. B.(1989)Solubility and surfacespectroscopy of zinc precipitates oncalcite. Geochim. Cosmochim. Acta 53, 9-19.