SNo. App No. Name Gender Mobile Email District Community ...
Upload
khangminh22Category
view
0download
0
HAL Id: hal-01685597https://hal.archives-ouvertes.fr/hal-01685597
Submitted on 16 Jan 2018
HAL is a multi-disciplinary open accessarchive for the deposit and dissemination of sci-entific research documents, whether they are pub-lished or not. The documents may come fromteaching and research institutions in France orabroad, or from public or private research centers.
L’archive ouverte pluridisciplinaire HAL, estdestinée au dépôt et à la diffusion de documentsscientifiques de niveau recherche, publiés ou non,émanant des établissements d’enseignement et derecherche français ou étrangers, des laboratoirespublics ou privés.
Ambient Humidity Influence on CO Detection with SnO2 Gas Sensing Materials. A Combined DRIFTS/DFT
InvestigationSusanne Wicker, Mathilde Guiltat, Udo Weimar, Anne Hémeryck, Nicolae
Barsan
To cite this version:Susanne Wicker, Mathilde Guiltat, Udo Weimar, Anne Hémeryck, Nicolae Barsan. Ambient HumidityInfluence on CO Detection with SnO 2 Gas Sensing Materials. A Combined DRIFTS/DFT Investiga-tion. Journal of Physical Chemistry C, American Chemical Society, 2017, 121 (45), pp.25064-25073.�10.1021/acs.jpcc.7b06253�. �hal-01685597�
1
Ambient Humidity Influence on CO Detection with
SnO2 Gas Sensing Materials – a Combined
DRIFTS/DFT Investigation
Susanne Wicker†,1, Mathilde Guiltat2, Udo Weimar1, Anne Hémeryck2 and Nicolae Barsan1*
1Tuebingen University, Faculty of Science, Department of Chemistry, Institute of Physical and
Theoretical Chemistry, Auf der Morgenstelle 15, 72076 Tuebingen, Germany
2LAAS-CNRS, Université de Toulouse, CNRS, UPS, Toulouse, France
ABSTRACT
Diffuse Reflectance Infrared Fourier Transform Spectroscopy (DRIFTS) and first-principles
calculations are performed to investigate the different ways in which water reacts with a SnO2
surfaces and to evaluate the cross interference of humidity on the detection of CO. Two different
materials, chosen because of their very different properties, were investigated. The experimental
results were interpreted with the help of theoretical modelling of two clean and defective
surfaces, namely (110) and (101). The experimental results show, and the theoretical calculations
confirm, that water vapor can interfere with the CO detection in different ways depending on the
active surface and the concentration of oxygen vacancies. This is related to the different ways in

2
which the water vapor reacts with tin oxide; on the one hand it can reduce the (101) surface, on
the other hand it can heal the oxygen vacancies of the defective (110) surface.
INTRODUCTION
More than 60 years ago Heiland et al.1,2 showed that the conductivity of semiconducting metal
oxides (SMOX) (in that case, single crystalline ZnO) depends on the composition of the
surrounding atmosphere. More than 50 years ago Seiyama et al.3 proposed the coupling of
SMOX with gas chromatographs (ZnO thin film). The first gas sensors based on SnO2 were
realized by Taguchi4, who later founded Figaro Eng., the first company to commercialize SMOX
based gas sensors worldwide. Due to their inherent advantages – high sensitivity, low cost,
potential for miniaturization, good stability – SMOX based sensors have been used in various
applications e.g. explosive and toxic gas alarms, controls for air intake into car cabin, monitors
for industrial processes etc.5. Most of the SMOX gas sensors are based on porous layers of SnO2
and WO3, because these oxides meet the application specific requirements of sensitivity and
stability6-8 and, currently, the drive is towards further miniaturization and increased selectivity
and sensitivity in order to make possible their integration in a host of mobile and household
devices and help make possible the Internet of Things (IoT). Gas sensing with semiconducting
metal oxides (SMOX) based sensors in ambient conditions means that a changing humidity
background needs to be taken into account. Considering how important this issue can be for
practical applications, it is surprising that not too many publications focus on that. Generally, the
publications dealing with humidity effect and SnO2, which is consider being the prototype
SMOX for gas sensing, report a resistance decrease under humidity exposure at an operation
temperature of 300°C 9-11. This implies that H2O acts as a reducing gas, when reacting with SnO2
surface.
3
The reducing effect is still best described with the reaction mechanisms proposed by Heiland
and Kohl 12 in 1988:
• The first mechanism includes the homolytic dissociation of H2O and its reaction with
one lattice oxygen, OO, to form one terminal hydroxyl group, (SnSn+-OH-), at a tin place,
SnSn, and one rooted hydroxyl group, (OH)O+, which reacts as a surface donor freeing
one electron, e-, to the conduction band. The reaction can be described by the following
equation (1):
H2O + SnSn + OO ⇌ (SnSn+-OH-) + (OH)O
+ + e- (1)
• The second proposed mechanism includes also a reaction of water with lattice oxygen
forming two terminal hydroxyl groups, (SnSn+-OH-), and one oxygen vacancy, VO
++.
The formation of the latter is providing two electrons to the conduction band. The
reaction is best described by the following equation (2):
H2O + 2 SnSn + OO ⇌ 2(SnSn+-OH-) + VO
++ + 2e- (2)
So, the formation of hydroxyl groups is linked to the reducing effect of water on SnO2 and
therefore the formation of hydroxyl groups under water vapor exposure should be directly
correlated to a decrease in resistance of SnO2. However, as already published DRIFTS spectra
and resistance data show 13, the reality is more complicated: the effect of humidity on two in-
house prepared materials show that although significantly more hydroxyl groups are formed on
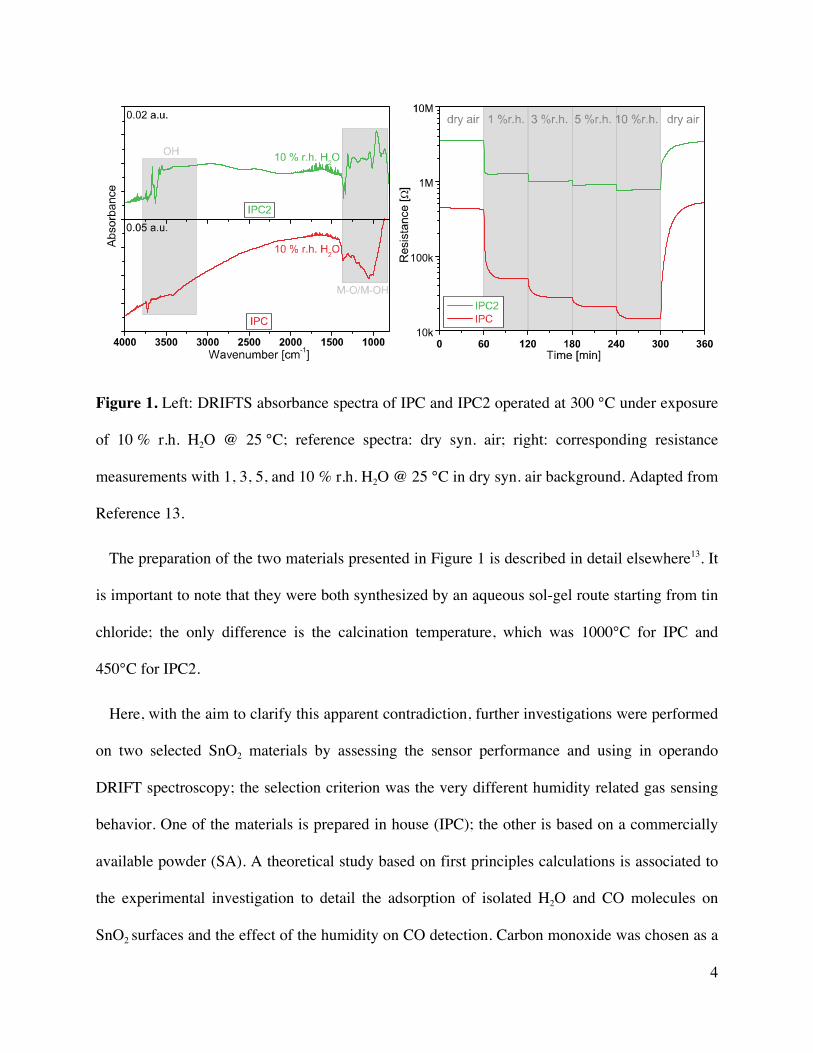
one material, IPC2, than the other, IPC, an opposite electrical effect is observable (see Fig. 1).
4
Figure 1. Left: DRIFTS absorbance spectra of IPC and IPC2 operated at 300 °C under exposure
of 10 % r.h. H2O @ 25 °C; reference spectra: dry syn. air; right: corresponding resistance
measurements with 1, 3, 5, and 10 % r.h. H2O @ 25 °C in dry syn. air background. Adapted from
Reference 13.
The preparation of the two materials presented in Figure 1 is described in detail elsewhere13. It
is important to note that they were both synthesized by an aqueous sol-gel route starting from tin
chloride; the only difference is the calcination temperature, which was 1000°C for IPC and
450°C for IPC2.
Here, with the aim to clarify this apparent contradiction, further investigations were performed
on two selected SnO2 materials by assessing the sensor performance and using in operando
DRIFT spectroscopy; the selection criterion was the very different humidity related gas sensing
behavior. One of the materials is prepared in house (IPC); the other is based on a commercially
available powder (SA). A theoretical study based on first principles calculations is associated to
the experimental investigation to detail the adsorption of isolated H2O and CO molecules on
SnO2 surfaces and the effect of the humidity on CO detection. Carbon monoxide was chosen as a
5
model gas for the understanding of the well documented interfering effect of humidity on the
detection of target gases 13-17.
EXPERIMENTAL METHODS
Material synthesis
IPC: The in house prepared SnO2 powder is gained through an aqueous sol-gel process starting
with a SnCl4 solution. An ammonia solution is added dropwise. During this process both
solutions are kept at 0°C and stirred thoroughly to ensure homogeneous and small precipitates of
Sn(OH)4. The gained gel is washed several times with distilled water until a pH-value of 7 is
achieved. It is then dried at 120 °C and finally calcined in a tube furnace (Heraeus ROK 6/30) for
8 h at 1000 °C (IPC). A more detailed description of the synthesis and characterization of the
material can be found in references 18 and 19.
SA: A SnO2 powder (Sigma-Aldrich, < 100 nm particle size (BET)) is suspended in deionized
water and a stock solution of deionized water and HCl is added. The whole suspension is stirred
for 48 h, then dried in an oven at 80 °C (Heraeus UT12) and afterwards calcined at 450°C for 1 h
in a tube furnace (Heraeus ROK 6/30).
Sensor fabrication
The sensitive layer of the sensor is applied onto the substrate by screen printing a paste of 1,2-
propanediol (Sigma Aldrich, 99.5+ % A.C.S. reagent) and the corresponding SnO2 powder. The
mixture is ground with mortar and pistil until a homogenous viscous paste is achieved. During
the screen printing process the as-prepared paste is pressed through the screen printing mask with
a rubber squeegee onto Al2O3 substrates. The sensors are left to settle at r.t. for 1 h and dried in
an oven (Heraeus UT12) at 80°C overnight. In the last step the sensors are annealed by heating

6
them for 10 min each at 400-500-400°C with two steps to cool down by moving it through a tube
furnace (Heraeus ROK 6/30).
DC resistance measurements
The changes of the sensing layer resistance are measured with a Keithley 199 electrometer. A
computer controlled gas mixing system equipped with data acquisition cards and mass flow
controllers provides various concentrations of the test gas CO as well as different humidity
backgrounds (0% r.h. to 50% r.h. H2O @ 25°C). The sensors are measured at an operation
temperature of 300 °C. The sensor signal is defined as the ratio of two resistances:
S = Rreference gas / R test gas
DRIFT spectroscopy
The DRIFTS measurements are performed with an evacuated FT-IR spectrometer (Bruker
V80v), which is equipped with a Harrick cell (“Praying Mantis”). In this cell a special sensor
DRIFTS chamber is mounted. The spectrometer consists of an interferometer, a KBr window
(beam splitter) and an infrared light is recorded with a LN-MCT-Narrow 24 h photo detector
(Liquid Nitrogen cooled - Mercury cadmium telluride). The spectra are recorded every 15 min
with a resolution of 4 cm-1 and 1024 sample scans. The apodization function Blackman-Harris-3-
Term is applied and the aperture was set to 3.5 mm to ensure that the DRIFTS measurement is
performed only on the sensitive layer. The evaluated absorbance spectra are calculated by
dividing two single channels through one another:
Absorbance = - log (sample spectrum/reference spectrum)
For a better understanding of the procedure, see Fig. S1.
7
In parallel to the DRIFTS measurements, the resistance changes of the mounted sensor are
recorded with a Keithley 617 electrometer. The sensor is heated to 300°C and a computer
controlled gas mixing system, which is equipped with mass flow controllers and a data
acquisition card, provides the DRIFTS setup with the relevant test gases (12CO, 13CO, H2O, D2O)
and gas concentrations.
Raman spectroscopy
The Raman spectra of the two sensors were recorded using a Renishaw inVia Reflex Raman
spectrometer with an excitation wavelength of 532 nm.
THEORETICAL METHODS
Details of calculations
The periodic calculations were performed using the DFT method based on the GGA
approximation employing the PBE exchange-correlation functional as implemented in the plane-
waves program VASP 20-22. Single point computations, from relaxed configurations, were
performed following the scheme proposed by Heyd, Scuseria, and Ernzerhof (HSE) which
separates the exchange energy into short-range and long-range components 23-27. The projector-
augmented wave (PAW) potentials were applied for the core electron representation 28, 29. A
converged value of Ecut = 400 eV was used for the cut-off energy of the plane wave. The
integration in reciprocal space was performed with a Monkhorst-Pack grid 30.
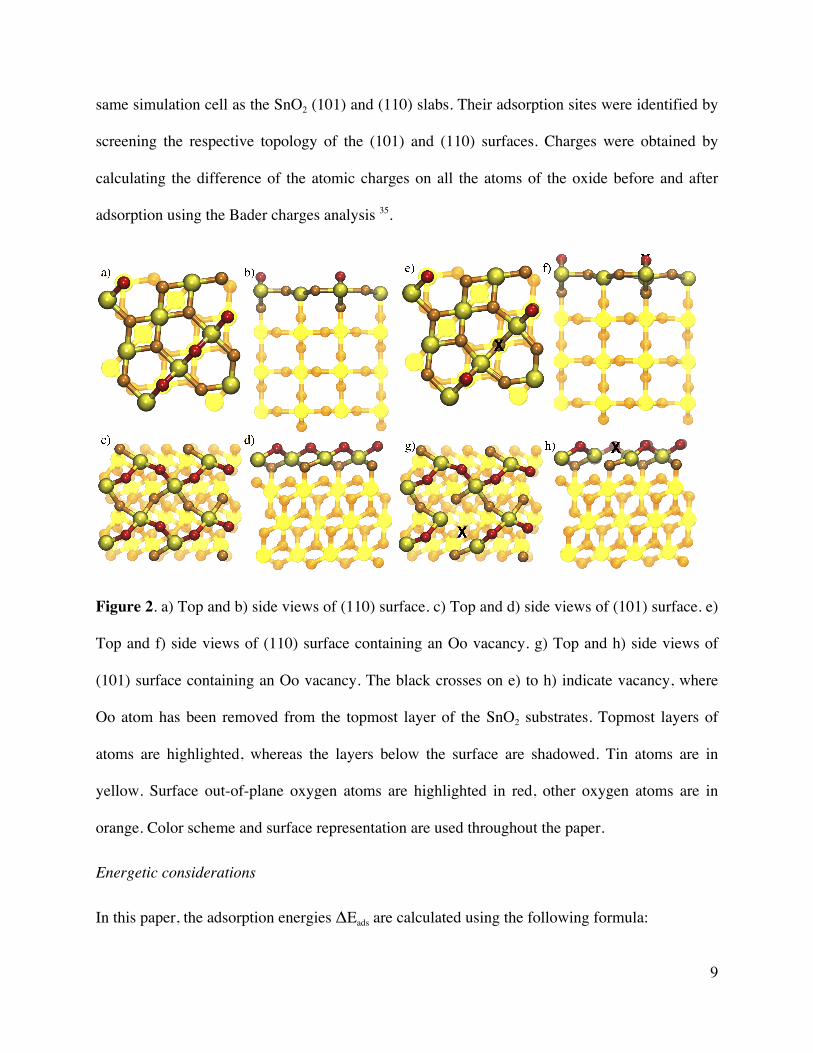
Two simulations cells are used. The stoichiometric SnO2 (101) and (110) surfaces are modeled
by periodic slabs depicted in Fig. 2 31-34. For the (101) surface, the cell is composed by a total
number of 96 atoms with 32 tin atoms and 64 oxygen atoms corresponding to a cell dimension of
11.42 x 9.47 x 25.00 Å3 with a surface area of 108.19 Å2. For the (110) surface, the cell was
8
composed by a total number of 96 atoms with 32 tin atoms and 64 oxygen atoms corresponding
to a cell dimension of 9.48 x 9.48 x 25 Å3 with a surface area of 89.87 Å2. For both slabs, a
vacuum zone of 15 Å in the z direction was used to create a surface effect. 24 Sn and O atoms
were frozen in their bulk positions at the bottom of the cell to simulate a bulk effect. All other
atoms were free to relax. The periodic slab was repeated in the three directions. A k-point mesh
of (2 x 2 x 1) was used. These simulation cell parameters have been checked to avoid any
interaction with other periodic cells.
Both (110) and (101) surfaces exhibit two types of oxygen atoms on the surface (Figure 2.a-d):
there are two-fold coordinated O atoms called out-of-plane oxygen atoms and denoted as Oo in
the following. All other oxygen atoms below the surface layer and deeper into the bulk are three-
fold coordinated.
Defective surfaces, shown as sub-stoichiometric system containing one oxygen vacancy, have
been obtained by removing a two-fold coordinated Oo atom from the surface layer. The
corresponding energies of oxygen vacancy formation are 2.30 eV and 2.25 on defective (110)
and (101) surfaces respectively. Other three-fold coordinated oxygen atoms in the topmost layer
exhibit higher energies of oxygen vacancy formation (3.45 eV and 3.64 eV on defective (110)
and (101) surfaces respectively 27,31,32), so that they were not considered in this work. The energy
of oxygen vacancy formation ΔEO was calculated by using the equation ΔE0=Evac+
1/2EO2−Esurface where EO2 is the energy of the isolated spin polarized O2 molecule, Evac is
the energy of a (110) surface or (101) surface with one oxygen vacancy per supercell, and
Esurface is the energy of the stoichiometric surface.
Adsorptions of one water molecule are thus performed considering the topology of such clean
and defective (110) and (101) surfaces. The isolated H2O and CO molecules were relaxed in the
9
same simulation cell as the SnO2 (101) and (110) slabs. Their adsorption sites were identified by
screening the respective topology of the (101) and (110) surfaces. Charges were obtained by
calculating the difference of the atomic charges on all the atoms of the oxide before and after
adsorption using the Bader charges analysis 35.
Figure 2. a) Top and b) side views of (110) surface. c) Top and d) side views of (101) surface. e)
Top and f) side views of (110) surface containing an Oo vacancy. g) Top and h) side views of
(101) surface containing an Oo vacancy. The black crosses on e) to h) indicate vacancy, where
Oo atom has been removed from the topmost layer of the SnO2 substrates. Topmost layers of
atoms are highlighted, whereas the layers below the surface are shadowed. Tin atoms are in
yellow. Surface out-of-plane oxygen atoms are highlighted in red, other oxygen atoms are in
orange. Color scheme and surface representation are used throughout the paper.
Energetic considerations
In this paper, the adsorption energies ΔEads are calculated using the following formula:

10
ΔEads = Eadsorbed molecule – Esurface – Egaseous molecule
where Eadsorbed molecule is the total energy of the system with a gaseous molecule adsorbed on the
SnO2 surface, Esurface and Egaseous molecule are the total energies of the relaxed surface and isolated
gaseous molecule (either H2O or CO), respectively. Conventionally, negative values indicate
exothermic adsorption.
Activation barriers have been determined along the Minimum Energy Path using a drag method.
Here, the system is relaxed; while one coordinate is held fixed along the diffusion pathway, all
other coordinates of freedom in the system are relaxed. The maximum energy corresponds to the
transition state and determines the activation barrier.
EXPERIMENTAL RESULTS
To investigate the impact of changing ambient humidity two different SnO2 materials were
selected. One was prepared in house, IPC, via a sol-gel route and calcined at 1000°C, while the
other one, SA, is based on a purchased SnO2 material, which underwent wet-chemical
pretreatment and a calcination temperature of 450°C. IPC shows a higher crystallinity, a larger
average nanoparticles size (110 nm vs. 30 nm) and therefore a lower surface area than SA 36-38.
The measured BET surface areas, by N2 adsorption by using a Micrometrics ASAP 2020
instrument, are 23 m2/g for SA and 12.5 m2/g for IPC. The corresponding REM pictures and
XRD spectra are shown in Fig. S2.
Humidity dependence of baseline resistance
The humidity influence on the baseline resistance of the two different SnO2 materials was
studied by exposing the sensors to eight humidity levels; ranging from 0.4% to 80% r.h. @ 25°C
(see Fig. 3).
11
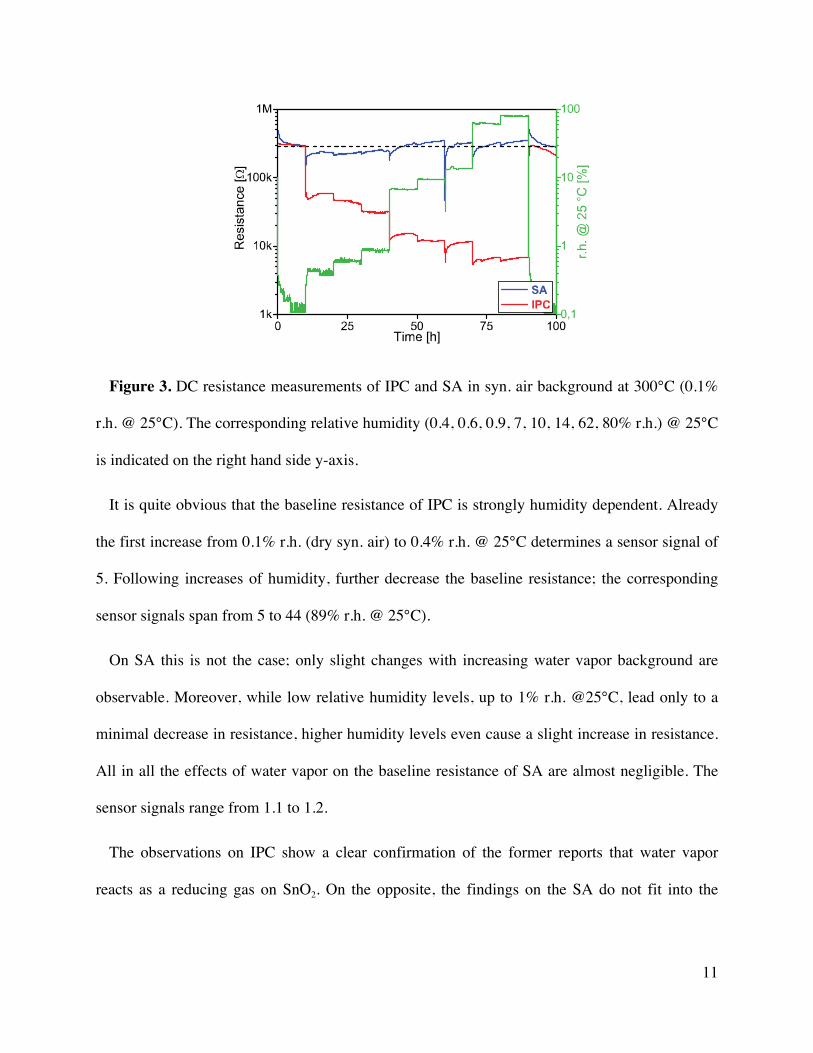
Figure 3. DC resistance measurements of IPC and SA in syn. air background at 300°C (0.1%
r.h. @ 25°C). The corresponding relative humidity (0.4, 0.6, 0.9, 7, 10, 14, 62, 80% r.h.) @ 25°C
is indicated on the right hand side y-axis.
It is quite obvious that the baseline resistance of IPC is strongly humidity dependent. Already
the first increase from 0.1% r.h. (dry syn. air) to 0.4% r.h. @ 25°C determines a sensor signal of
5. Following increases of humidity, further decrease the baseline resistance; the corresponding
sensor signals span from 5 to 44 (89% r.h. @ 25°C).
On SA this is not the case; only slight changes with increasing water vapor background are
observable. Moreover, while low relative humidity levels, up to 1% r.h. @25°C, lead only to a
minimal decrease in resistance, higher humidity levels even cause a slight increase in resistance.
All in all the effects of water vapor on the baseline resistance of SA are almost negligible. The
sensor signals range from 1.1 to 1.2.
The observations on IPC show a clear confirmation of the former reports that water vapor
reacts as a reducing gas on SnO2. On the opposite, the findings on the SA do not fit into the
12
current understanding. To get more information about the surface reaction mechanisms,
operando DRIFT spectroscopy was used.
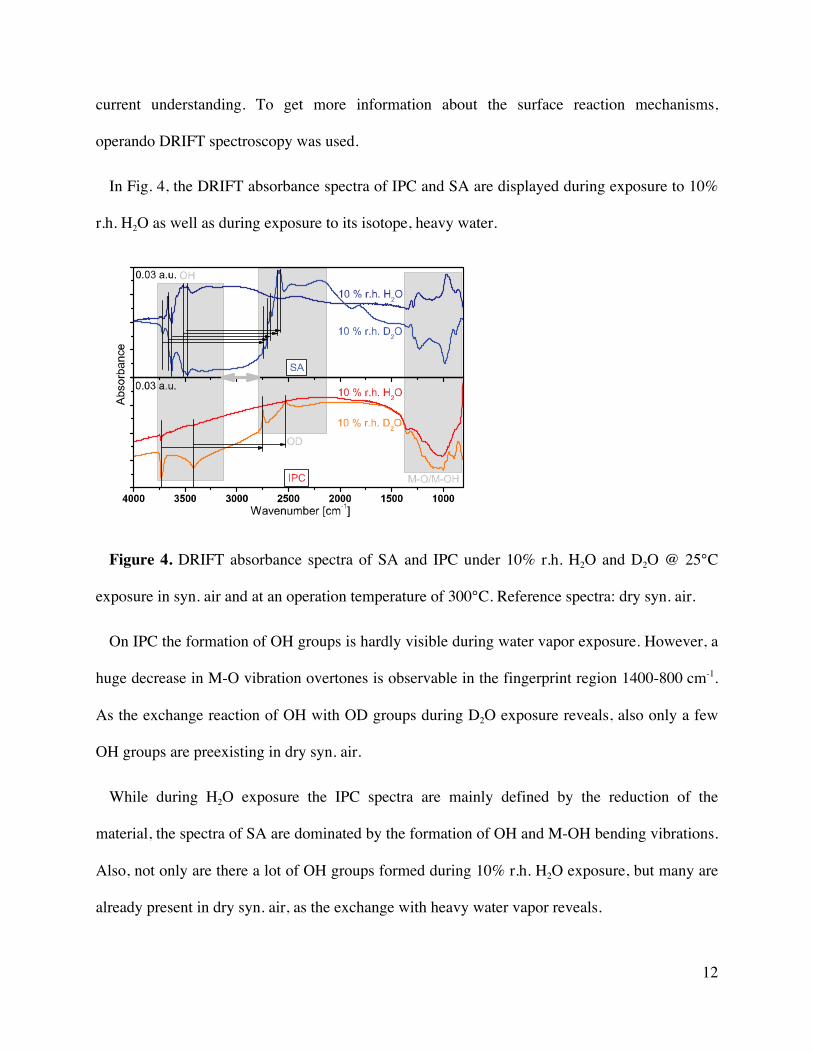
In Fig. 4, the DRIFT absorbance spectra of IPC and SA are displayed during exposure to 10%
r.h. H2O as well as during exposure to its isotope, heavy water.
Figure 4. DRIFT absorbance spectra of SA and IPC under 10% r.h. H2O and D2O @ 25°C
exposure in syn. air and at an operation temperature of 300°C. Reference spectra: dry syn. air.
On IPC the formation of OH groups is hardly visible during water vapor exposure. However, a
huge decrease in M-O vibration overtones is observable in the fingerprint region 1400-800 cm-1.
As the exchange reaction of OH with OD groups during D2O exposure reveals, also only a few
OH groups are preexisting in dry syn. air.
While during H2O exposure the IPC spectra are mainly defined by the reduction of the
material, the spectra of SA are dominated by the formation of OH and M-OH bending vibrations.
Also, not only are there a lot of OH groups formed during 10% r.h. H2O exposure, but many are
already present in dry syn. air, as the exchange with heavy water vapor reveals.
13
All in all, the reaction mechanisms of water vapor on SnO2 proposed by Heiland and Kohl in
1988 are suitable to explain the observations made on IPC with its strong reduction under
humidity and the formation of some hydroxyl groups 12. Additionally, it can be assumed that the
surrounding water vapor contributes to the reduction of the material by hindering its reoxidation,
described by equation 3.
1/2O2 + VO++ + 2e- ⇌ OO (3)
The overall effect of humidity exposure is a decrease of the negative surface charge.
The findings obtained by testing the SA material cannot be similarly explained. The electrical
measurements indicate that the surface charge remains unchanged suggesting that the reaction
with water vapor is of an electroneutral nature. This implies that either, if there is a reduction, it
is fully compensated by immediate reoxidation, or the formation of hydroxyl groups during
water vapor exposure has no reducing effect on SA.
Which approach describes the occurring reaction mechanism the best can be verified by
removing the possibility of reoxidation by dosing water in the absence of oxygen, id est. in
nitrogen. The corresponding DRIFTS and resistance measurements are shown in Fig. S3. It was
found that in the absence of oxygen even more hydroxyl groups are formed, while still hardly
any electrical effect is observable. These results imply that water does not always react as a
reducing gas on SnO2.
The findings can be best explained by an electrically neutral reaction in which an oxygen
vacancy, VO++, is filled with a rooted hydroxyl group, (OH)O
+, and the residual hydrogen
transforms an existing lattice oxygen, OO, to a second rooted hydroxyl group, (OH)O+.
H2O + VO++ + OO ⇌ 2 (OH)O
+ (4)
14
It means that the reaction with humidity on IPC is mainly dominated by the reduction of the
material, whereas an electroneutral reaction mainly dominates on SA. In general, from the
experimental results, it can be derived that the ability of a SnO2 surface to form hydroxyl groups
seems to be inversely proportional to the electrical effect humidity has.
Humidity cross-influence on CO sensing
Humidity does not only have an effect on the baseline resistance of a SMOX material itself,
but it also contributes to or interferes with the sensor response of other gases e.g. CO. It is well
known that an increasing water vapor background has a negative impact on the gas sensor signal
towards CO on undoped SnO2 37, 38. This is what is also observable on IPC and SA. In both cases
the sensor signal decreases with increasing humidity background from 47/55 to 10/23 (IPC/SA)
see Fig. S4.
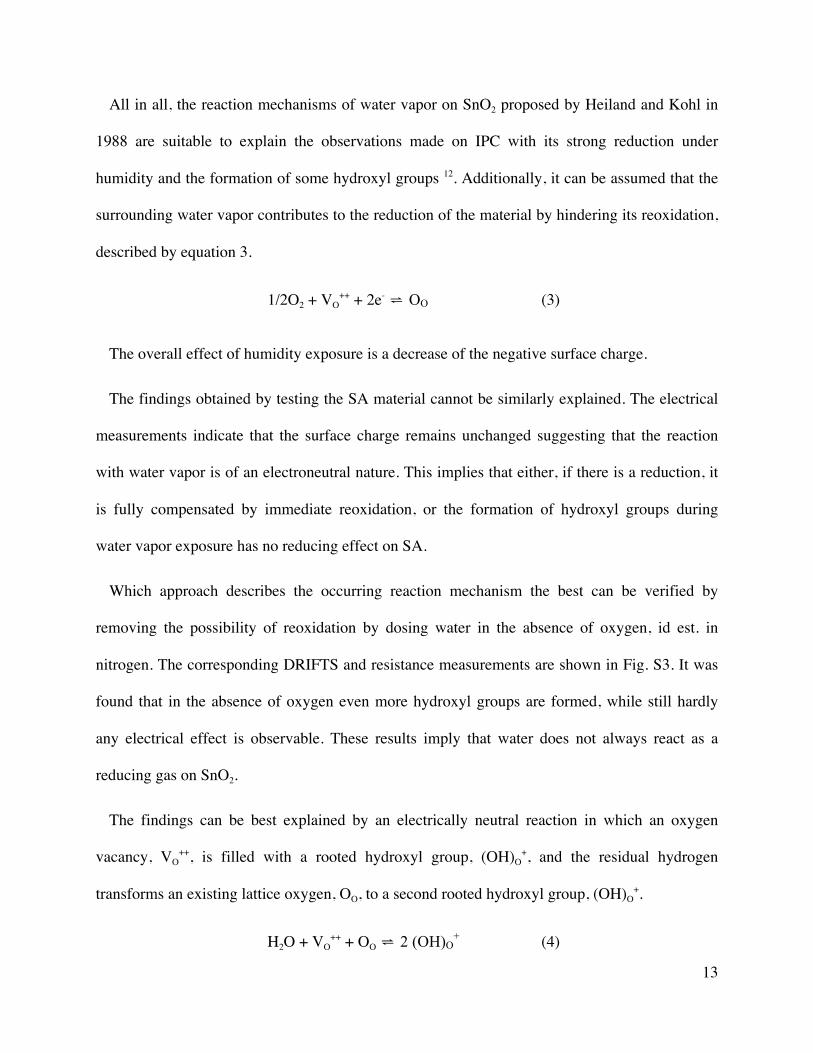
To be able to understand the occurring reactions in more detail, DRIFT spectroscopy was also
applied during CO exposure in both dry and humid conditions. The corresponding DRIFT
spectra are displayed in Fig. 5.

15
Figure 5. DRIFT absorbance spectra of 500 ppm of CO exposure in dry and in 3% r.h. H2O @
25°C background on IPC and SA at an operation temperature of 300°C. Reference spectra: dry
syn. air and 3% r.h. H2O @ 25°C, respectively.
In Fig. 5 it can be seen that on IPC both a reduction of the material as well as a decrease in the
OH groups is visible during CO exposure in dry syn. air background. Both features are a bit
more enhanced in a 3% r.h. H2O @ 25°C background. Due to the reducing nature of CO also
some CO2 is formed, in both backgrounds. Its presence in the pores of the material causes the
band at 2438 cm-1 with its rotational fine structure. The oxidation to CO2 can be expressed with
the following reaction equation:
CO + OO ⇌ CO2,gas + VO++ + 2e- (5)
Although also on SA gaseous CO2 is detectable, the other features differ. In addition to the
CO2 band, some carbonate bands are visible, which are decreased in the humid background. For
the OH bands a shift from terminal to rooted hydroxyl groups occurs in dry conditions, while in
humid ones several OH groups are removed during CO exposure.
So, on both SnO2 materials it is obvious that during CO exposure only a weak removal of
hydroxyl groups is visible, which implies that CO is hardly able to compete with humidity for
reaction partners. This is very much in line with the observation of a decrease in sensor signals to
CO in the background of water vapor.
However, if one has a look not to the relative changes (sensor signal), but to the absolute ones,
it is obvious from the electrical results that the two SnO2 materials show opposite trends. For
more details see Fig. 6.
16
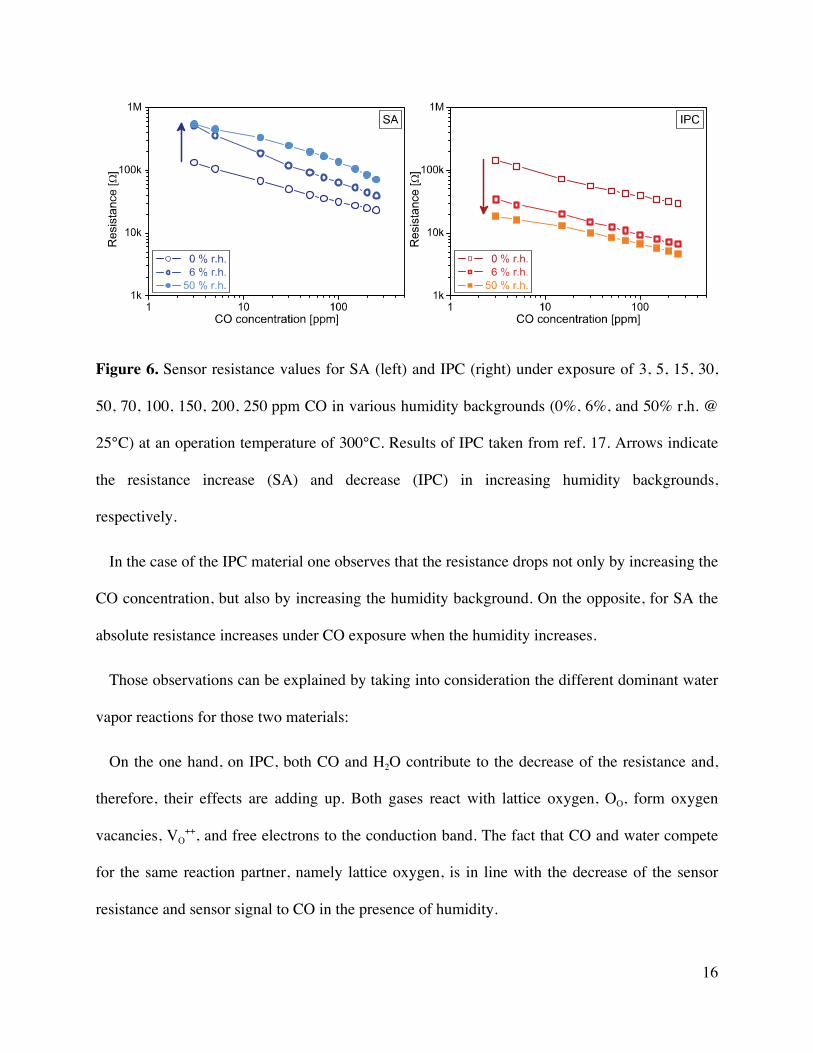
Figure 6. Sensor resistance values for SA (left) and IPC (right) under exposure of 3, 5, 15, 30,
50, 70, 100, 150, 200, 250 ppm CO in various humidity backgrounds (0%, 6%, and 50% r.h. @
25°C) at an operation temperature of 300°C. Results of IPC taken from ref. 17. Arrows indicate
the resistance increase (SA) and decrease (IPC) in increasing humidity backgrounds,
respectively.
In the case of the IPC material one observes that the resistance drops not only by increasing the
CO concentration, but also by increasing the humidity background. On the opposite, for SA the
absolute resistance increases under CO exposure when the humidity increases.
Those observations can be explained by taking into consideration the different dominant water
vapor reactions for those two materials:
On the one hand, on IPC, both CO and H2O contribute to the decrease of the resistance and,
therefore, their effects are adding up. Both gases react with lattice oxygen, OO, form oxygen
vacancies, VO++, and free electrons to the conduction band. The fact that CO and water compete
for the same reaction partner, namely lattice oxygen, is in line with the decrease of the sensor
resistance and sensor signal to CO in the presence of humidity.
17
On the other hand, on SA, the reaction of CO is assumed to follow the same mechanism as on
IPC forming CO2 by reacting with lattice oxygen. However, no direct competition for lattice
oxygen takes place between CO and water vapor as the reaction with CO creates oxygen
vacancies and water vapor fills them with rooted hydroxyl groups. It means that the presence of
humidity seems to hinder the CO sensing in a different way e.g. some lattice oxygen are replaced
by rooted hydroxyl groups and, therefore, not directly available for the reaction with CO. No
additive effect on the sensor resistance is observable.
THEORETICAL RESULTS AND DISCUSSION
H2O reactions with SnO2 surfaces
DFT calculations have been conducted in order to assess the conclusions of the experiments.
Two surface orientations are considered, id est. (110) and (101), with or without Oo vacancies,
on which H2O and CO are adsorbed.
Both H2O and CO adsorptions have been widely studied using DFT calculations 33, 39-46.
Concerning water adsorption, our findings (Fig. 7.a) indicate also a physisorbed mode on (110)
surface with adsorption energy -0.35 eV, and molecular adsorption modes are reported only on
(101) surface (see Fig. 7.b).
18
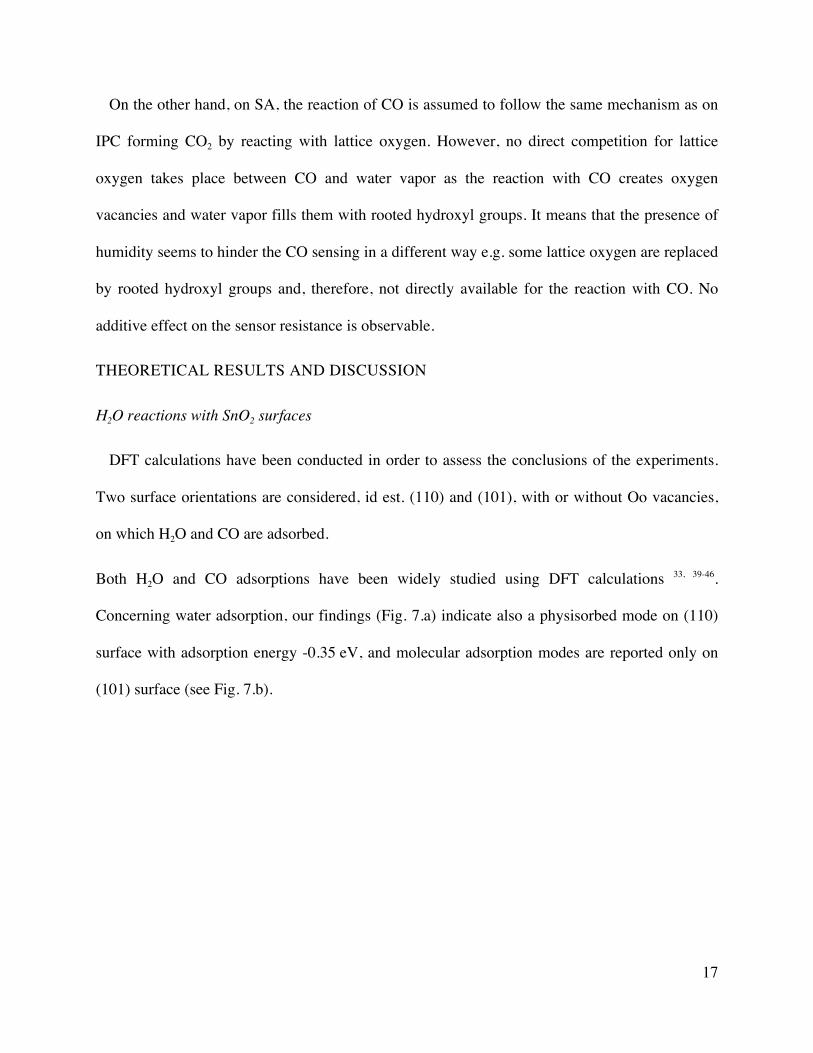
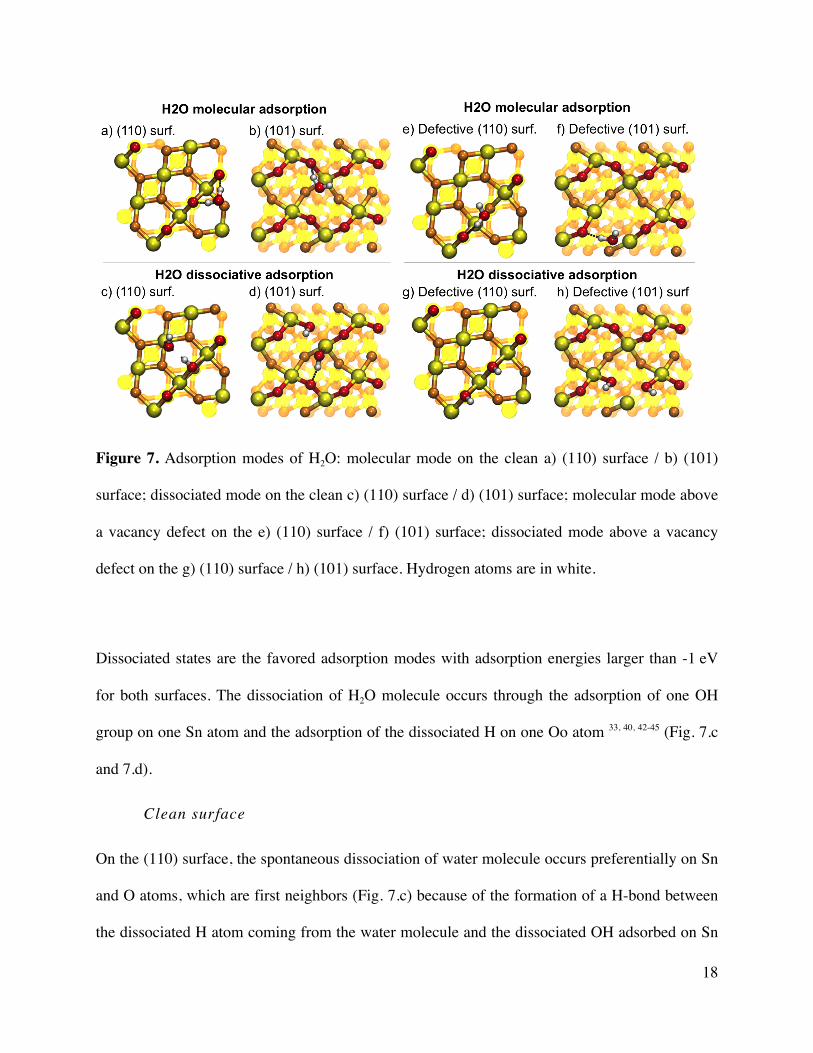
Figure 7. Adsorption modes of H2O: molecular mode on the clean a) (110) surface / b) (101)
surface; dissociated mode on the clean c) (110) surface / d) (101) surface; molecular mode above
a vacancy defect on the e) (110) surface / f) (101) surface; dissociated mode above a vacancy
defect on the g) (110) surface / h) (101) surface. Hydrogen atoms are in white.
Dissociated states are the favored adsorption modes with adsorption energies larger than -1 eV
for both surfaces. The dissociation of H2O molecule occurs through the adsorption of one OH
group on one Sn atom and the adsorption of the dissociated H on one Oo atom 33, 40, 42-45 (Fig. 7.c
and 7.d).
Clean surface
On the (110) surface, the spontaneous dissociation of water molecule occurs preferentially on Sn
and O atoms, which are first neighbors (Fig. 7.c) because of the formation of a H-bond between
the dissociated H atom coming from the water molecule and the dissociated OH adsorbed on Sn
19
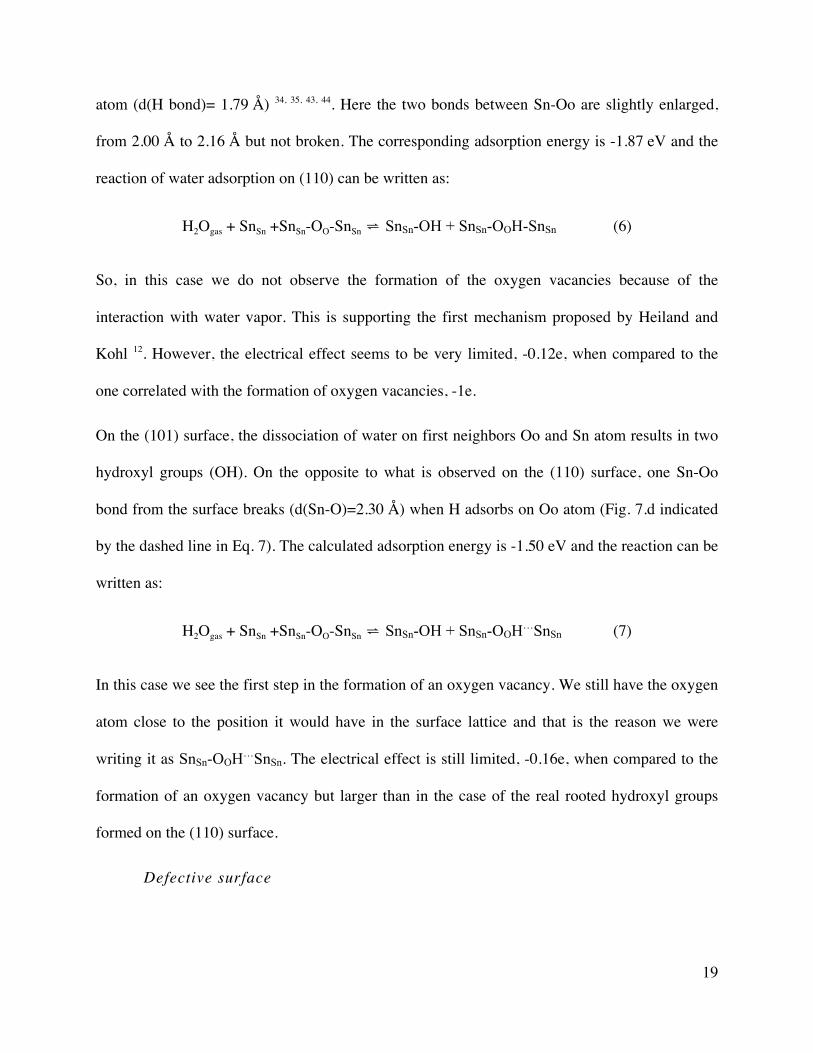
atom (d(H bond)= 1.79 Å) 34, 35, 43, 44. Here the two bonds between Sn-Oo are slightly enlarged,
from 2.00 Å to 2.16 Å but not broken. The corresponding adsorption energy is -1.87 eV and the
reaction of water adsorption on (110) can be written as:
H2Ogas + SnSn +SnSn-OO-SnSn ⇌ SnSn-OH + SnSn-OOH-SnSn (6)
So, in this case we do not observe the formation of the oxygen vacancies because of the
interaction with water vapor. This is supporting the first mechanism proposed by Heiland and
Kohl 12. However, the electrical effect seems to be very limited, -0.12e, when compared to the
one correlated with the formation of oxygen vacancies, -1e.
On the (101) surface, the dissociation of water on first neighbors Oo and Sn atom results in two
hydroxyl groups (OH). On the opposite to what is observed on the (110) surface, one Sn-Oo
bond from the surface breaks (d(Sn-O)=2.30 Å) when H adsorbs on Oo atom (Fig. 7.d indicated
by the dashed line in Eq. 7). The calculated adsorption energy is -1.50 eV and the reaction can be
written as:
H2Ogas + SnSn +SnSn-OO-SnSn ⇌ SnSn-OH + SnSn-OOH…SnSn (7)
In this case we see the first step in the formation of an oxygen vacancy. We still have the oxygen
atom close to the position it would have in the surface lattice and that is the reason we were
writing it as SnSn-OOH…SnSn. The electrical effect is still limited, -0.16e, when compared to the
formation of an oxygen vacancy but larger than in the case of the real rooted hydroxyl groups
formed on the (110) surface.
Defective surface
20
In the case of defective (101) and (110) surfaces, the molecular adsorption is enhanced above a
vacancy thanks to shorter H-bonds that can be formed between the water molecule and the OO
atoms placed in close vicinity 34, 43. Noteworthy, we observed a molecular adsorption (Fig. 7.e
and f), with calculated adsorption energies of -0.75 eV and -1.00 eV on (110)-V and (101)-V
surfaces, respectively). The dissociative adsorption of water molecule is still the favored process.
It occurs similarly to the atomistic reaction observed on clean surfaces, where OH and H react
with Sn and OO atoms, respectively.
In the case of the (110) surface, the most favorable case is obtained when OH dissociates on the
under-coordinated Sn atom, healing the vacancy by reforming the Sn-O bonds, and the H atom is
adsorbed on a distant OO atom of the surface (Fig. 7.g). The adsorption energy is larger by 0.39
eV compared to the clean surface (-2.26 eV vs. -1.87 eV). The healing of the vacancy by the
adsorption of OH into VO is the most favorable scenario for water adsorption on the (110)
defective surface and can be summarized as:
H2Ogas + SnSn-OO-SnSn + SnSn…VO
…SnSn ⇌ SnSn-OOH-SnSn + SnSn-OH-SnSn (8)
The electrical effect of the vacancy healing process on (110) is negligible, -0.07e, which
supports the assumption of electroneutrality we made.
In the case of the (101) surface, the most favorable case is obtained when the OH group,
resulting from the dissociation of water on the under-coordinated Sn atom, fills the vacancy, and
the H atom adsorbs on one of the Oo atom neighboring the vacancy (Fig. 7.h). For the former
process, the adsorption energy is larger by 0.64 eV, when compared to the clean surface (-
2.14 eV vs -1.50 eV). The Sn-O bond is still broken. For the latter process, when the H atom

21
adsorbs on the Oo atom, a Sn-Oo bond also breaks, similarly to the case of the clean surface. The
corresponding reaction can be written as:
H2Ogas + SnSn-OO-SnSn + SnSn…VO
…SnSn ⇌ SnSn-OOH…SnSn + SnSn-OH…SnSn (9)
The electrical effect is a bit larger than in the case of the (110) surface, because of the incipient
oxygen vacancy formation, namely -0.12e, but still very small, when compared to the full
formation of the oxygen vacancy.
Our calculations for water vapor adsorption on SnO2 show that it starts with the dissociation of
the water molecule. The resulting hydroxyl group will react differently on clean and defective
surfaces. In the first case, it will form a bond to the surface tin atom, id est. a terminal hydroxyl
group. In the second case, it will preferably react with the surface oxygen vacancy forming
rooted hydroxyl groups. There is a difference between the two surfaces, namely in the case of
(110) the filling of the vacancy is made by forming bonds between the oxygen from the hydroxyl
group and the two neighboring tin atoms. In the case of (101), only one bond is formed, between
the oxygen and a neighboring tin atom, the second one is broken.
The resulting hydrogen atom always reacts with out-of-plane lattice oxygen atoms for both
clean and defective surfaces. There is also a difference between the two surfaces: a bond between
a tin atom and the out-of-plane oxygen atom breaks, when a hydrogen atom adsorbs on the out-
of-plane oxygen atom on the (101), but there is no bond breaking in the case of (110).
The findings from the DFT calculations suggest that the differences between the experimental
results obtained for the two different materials could be determined by their different dominant
surface orientation and concentration of oxygen vacancies. In the case of the IPC material the
theoretical results indicate a very “clean” (101) surface. On the opposite, for the SA material one

22
expects to have a defective (110) surface. It is very difficult to have an experimental proof for the
presence of a dominant surface so, at this stage, we do not know that for sure. For the case of
oxygen vacancies, we have some indications from the results of a Raman investigation
performed on sensors at RT and presented in Figure 8.
Figure 8. Raman spectra of IPC (left) and SA (right).
The broad band of SA, which is observed between 370 and 820 cm-1, consists of a series of
bands, namely the A1g (633 cm-1), B2g (774 cm-1) and Eg (475 cm-1) lattice modes and three
additional bands. A Diéguez et al. assigned these additional bands to the IR-active A2u mode
(~ 692 cm-1) and two broad bands S1 and S2, which they found between 568-576 cm-1 and 493-
542 cm-1, respectively and that were assigned to the defective surface region of the SnO2 grains
47. L. Lui et al. found, that the S1 (~573 cm-1) band arises from oxygen vacancies 48. For IPC a
similar broad band is not observed. Consequently we do believe that the presence of the S1 and
S2 bands indicates the presence of oxygen vacancies for the SA material.
CO reactions with SnO2 surfaces
23
As already mentioned, CO reacts with Oo atom of the surface resulting in the formation of a
CO2 molecule and a vacancy on the SnO2 surfaces, as described in ref. 26 on the SnO2 (101)
surfaces. We found the same surface reduction also for the (110) surface with a calculated energy
gain of -1.55 eV.
Adsorption/reaction of CO in the presence of humidity
We studied the effect of humidity on CO detection by considering pre-adsorbed OH groups on
the SnO2 surfaces. The goal, here, is to find out if the reduction of the surface still occurs even in
the presence of hydroxyl groups. We performed the calculations on the most stable dissociated
states of water molecules on both clean and defective (110) and (101) surfaces (see Fig. 7.c and
7.d.). We observed that the spontaneous adsorption of CO found on clean (101) and (110)
surfaces are inhibited on the hydroxylated areas of (101) and (110) surfaces: a CO molecule
initially placed 2 Å far from the surface as conducted conventionally in adsorption process using
DFT study is repelled upwards further from the surface to an equilibrium adsorption state where
no more interaction exists. In conclusion, adsorbed hydroxyls act as a repelling species for CO
adsorption on SnO2 surfaces.
To force the reaction of CO with the hydroxylated surface, a drag method was applied on the –
z direction perpendicular to the surface and above the OH groups. We mainly observe the
deviation of the CO molecule from hydroxylated parts of the surface to reach clean parts
allowing the adsorption of CO on clean parts as described above. From a spontaneous adsorption
on both tin oxide surfaces, the adsorption of CO becomes thermally activated in the presence of
humidity. Activation barriers have been estimated larger than 0.40 eV.

24
Combining the insights obtained from the theoretical calculations for both humidity and CO
one can state the following:
• In the case of the IPC material, considered to be described by the clean (101) surface, we
are expecting an additive electrical effect of (1) the incipient formation of oxygen
vacancies, because of the reaction with water vapor, and (2) the formation of oxygen
vacancies, which takes place on the non-hydroxylated parts, because of the reduction
with CO. In the presence of humidity the effect of CO will be reduced, because there will
be less “free” SnO2 surface to react with. The resistance will be lower in the presence of
both gases, because both of them are having an electrical effect.
• In the case of the SA material, considered to be described by the defective (110) surface,
we are expecting that the reaction with water vapor will not change the electrical
resistance because the process of healing oxygen vacancies by filling them with hydroxyl
groups is neutral. The exposure to CO will result in a lower concentration of oxygen
vacancies in the presence of humidity due to the decrease of the reactive “free” SnO2
surface. The total resistance in the presence of both humidity and CO will be lower that
in the presence of CO only.
CONCLUSIONS
Based on this work the current understanding of water vapor impact on SnO2, namely humidity
behaving as a reducing gas, has to be changed to include the concept that humidity can also act
in an electroneutral way. A new reaction mechanism was proposed, in which two rooted
hydroxyl groups can be formed by H2O adsorption on lattice oxygen and an oxygen vacancy.
Furthermore, it was shown that the way in which humidity reacts on the respective SnO2 surface,

25
also affects its cross-interference in the detection of CO. Because the two materials chosen for
our study are describing the extreme cases we found in our extended SnO2 investigation, it is to
be expected that in most cases both types of surface reactions coexist and it is even possible that
depending on the ambient conditions their respective weights change. Our findings are also
opening up intriguing synthesis strategy avenues, because the theoretical studies suggest, that
this different type of electrical effects are associated to different surfaces and different
concentrations of oxygen vacancies. Furthermore, our results suggest that the role of oxygen
vacancies is not fully understood and complete the recent findings for WO3, where we even
observed the oxidation of the material in the presence of humidity 49.
Our attempt to explain the effect of humidity is also an example of what can be achieved by
combining advanced operando investigations with theoretical calculations. The experiments are
pointing the theory to the relevant tasks, in our case the finding of surface reactions that are
electroneutral, while the theory highlights the weaknesses of the modeling based only on
experiments, in our case the absence of a full reduction of the surface by water vapor even in the
case of the (101) clean surface. However, even if the combination of those both approaches is a
very powerful investigation tool it does not provide a definitive proof for the correctness of the
proposed models. For that to happen there is still need for additional experimental work, which
could be provided by studies on single crystalline or epitaxial layers. These type of model
systems will need to be thoroughly studied, in operando conditions.
AUTHOR INFORMATION
Corresponding Author
26
* Nicolae Barsan, Tuebingen University, Faculty of Science, Department of Chemistry, Institute
of Physical and Theoretical Chemistry, Auf der Morgenstelle 15, 72076 Tuebingen, Germany;
Present Addresses
† Bosch Sensortec GmbH, Gerhard-Kindler-Straße 9, 72770 Reutlingen/Kusterdingen, Germany
Author Contributions
The manuscript was written through contributions of all authors. All authors have given approval
to the final version of the manuscript.
ACKNOWLEDGMENT
The theoretical part of this work was conducted in the frame of the France Campus - PHC
PROCOPE 2107 – Project N°37744TG. The computer simulations were performed using HPC
resources from CALMIP (Grant 16038).
The Raman measurements were performed with the help of Dr. Christoph Berthold from the
Department of Geosciences of the University of Tuebingen and of Dr. David Degler from the
Department of Chemistry of the University of Tuebingen. The BET measurements were
performed by Leilei Luo and Dr. Yucang Liang from the Department of Chemistry of the
University of Tuebingen.
REFERENCES

27
(1) G. Heiland, Zum Einfluß von adsorbiertem Sauerstoff auf die elektrische Leitfähigkeit
von Zinkoxydkristallen, Zeitschrift Für Phys. 138 (1954) 459–464. doi:10.1007/BF01340692.
(2) G. Heiland, Zum Einfluß von Wasserstoff auf die elektrische Leitfähigkeit an der
Oberfläche von Zinkoxydkristallen, Zeitschrift Für Phys. 148 (1957) 15–27.
(3) T. Seiyama, A. Kato, K. Fujiishi, M. Nagatani, A New Detector for Gaseous Components
Using Semiconductive Thin Films, Anal. Chem. 34 (1962) 5–6.
(4) Taguchi, N., Japanese Patent S45-38200 (application in 1962).
(5) J. Watson, K. Ihokura, G.S. V Coles, The tin dioxide gas sensor, Meas. Sci. Technol. 4
(1993) 711–719. doi:10.1088/0957-0233/4/7/001.
(6) K. Ihokura, J. Watson, The Stannic Oxide Gas SensorPrinciples and Applications, CRC
Press 1994, Boca Raton, Florida, USA, 1994.
(7) D.E. Williams, Semiconducting oxides as gas-sensitive resistors, Sensors Actuators B
Chem. 57 (1999) 1–16. doi:10.1016/S0925-4005(99)00133-1.
(8) N. Barsan, D. Koziej, U. Weimar, Metal oxide-based gas sensor research: How to?,
Sensors Actuators B Chem. 121 (2007) 18–35. doi:10.1016/j.snb.2006.09.047.
(9) Rank, S. The Influence of the Electrode Material on the Sensor Characteristics of SnO2
Thick Film Gas Sensors PhD thesis, Eberhard Karls Universität Tübingen, 2014.

28
(10) Choi, K.-I.; Hübner, M.; Haensch, A.; Kim, H.-J.; Weimar, U.; Lee, J.-H. Ambivalent
Effect of Ni Loading on Gas Sensing Performance in SnO2 Based Gas Sensor. Sensors Actuators
B 2013 183, 401–410.
(11) Barsan, N.; Weimar, U. Understanding the Fundamental Principles of Metal Oxide based
Gas Sensors; the Example of CO Sensing with SnO2 Sensors in the Presence of Humidity. J.
Phys. Condens. Matter 2003, 15, R813–R839.
(12) Heiland, G.; Kohl, D. Chemical Sensor Technology, Vol.1 ed. Elsevier B.V., 1988, 15–
38.
(13) Degler, D.; Wicker, S.; Weimar, U.; Barsan, N. Identifying the Active Oxygen Species in
SnO2 Based Gas Sensing Materials: An Operando IR Spectroscopy Study. J. Phys. Chem. C
2015, 119, 11792−11799.
(14) Barsan, N.; Hübner, M.; Weimar, U. Conduction Mechanisms in SnO2 based
Polycrystalline Thick Film Gas Sensors Exposed to CO and H2 in Different Oxygen
Backgrounds. Sensors Actuators B 2011, 157, 510–517.
(15) Hübner, M.; Pavelko, R. G.; Barsan, N.; Weimar, U. Influence of Oxygen Backgrounds
on Hydrogen Sensing with SnO2 Nanomaterials. Sensors Actuators B 2011, 154, 264–269.
(16) Grossmann, K.; Pavelko, R. G.; Barsan, N.; Weimar, U. Interplay of H2, Water Vapor
and Oxygen at the Surface of SnO2 based Gas Sensors – An Operando Investigation Utilizing
Deuterated Gases. Sensors Actuators B 2012, 166–167, 787–793.

29
(17) Rebholz, J. Influence of Conduction Mechanism Changes and Related Effects on the
Sensing Performance of Metal Oxide Based Gas Sensors, PhD thesis, Eberhard Karls Universität
Tübingen, 2016.
(18) Diéguez, A.; Romano-Rodríguez, A.; Morante, J. R.; Kappler, J.; Bârsan, N.; Göpel, W.
Nanoparticle Engineering for Gas Sensor Optimisation: Improved Sol–Gel Fabricated
Nanocrystalline SnO2 Thick Film Gas Sensor for NO2 Detection by Calcination, Catalytic Metal
Introduction and Grinding Treatments. Sensors Actuators B 1999, 60, 125–137.
(19) Diéguez, A.; Vilà, A.; Cabot, A.; Romano-Rodriguez, A.; Morante, J. R.; Kappler, J.;
Bârsan, N.; Weimar, U.; Göpel, W. Influence on the Gas Sensor Performances of the Metal
Chemical States Introduced by Impregnation of Calcinated SnO2 Sol–Gel Nanocrystals. Sensors
Actuators B, 2000, 68, 94–99.
(20) Kresse, G.; Hafner, J. Ab initio molecular-dynamics simulation of the liquid-metal–
amorphous-semiconductor transition in germanium. Phys. Rev. B 1994, 49, 14251.
(21) Kresse, G.; Furthmuller, J. Efficiency Of Ab-Initio Total Energy Calculations for Metals
and Semiconductors using a Plane-Wave Basis Set. Comput. Mater. Sci. 1996, 6, 15.
(22) Perdew, J.P.; Burke, K.; Ernzerhof M. Generalized Gradient Approximation made
simple. Phys. Rev. Lett. 1996, 77, 3865.
(23) Pacchioni, G. First Principles Calculations on Oxide-Based Heterogeneous Catalysts and
Photocatalysts: Problems and Advances, Catalysis Letters 2015, 145, 80–94.
30
(24) Gerosa, M. ; Bottani, C.E. ; Caramella, L. ; Onida, G. ; Di Valentin, C. ; Pacchioni, G.
Defect calculations in semiconductors through a dielectric-dependent hybrid DFT functional:
The case of oxygen vacancies in metal oxides, J. Chem. Phys. 2015, 143, 134702.
(25) Dou, M.; Persson, C. Comparative study of rutile and anatase SnO2 and TiO2: Band-edge
structures, dielectric functions, and polaron effects, J. Appl. Phys. 2015, 113, 083703.
(26) Agoston, P. ; Albe, K. ; Nieminen, R. M. ; Puska, M. J. Intrinsic n-Type Behavior in
Transparent Conducting Oxides: A Comparative Hybrid-Functional Study of In2O3, SnO2, and
ZnO, Phys. Rev. Lett. 2009, 103, 245501.
(27) Trani, F. ; Causà, M. ; Ninno, D. ; Cantele, G. ; Barone, V. Density functional study of
oxygen vacancies at the SnO2 surface and subsurface sites, Phys. Rev. B 2008, 77, 245410.
(28) Kresse, G.; Joubert, D. From Ultrasoft Pseudopotentials to the Projector Augmented-
Wave Method. Phys. Rev. B 1999, 59, 1758.
(29) Blochl, P.E. Projector Augmented-Wave Method. Phys. Rev. B 1994, 50, 17953.
(30) Monkhorst, H. J.; Pack, J. D. Special Points for Brillouin-Zone Integrations. Phys. Rev. B
1976, 13, 5188,
(31) Bergermayer W. ; Tanaka, I. Reduced SnO2 surfaces by first-principles calculations
Appl. Phys. Lett. 2004, 84, 909
(32) Manassidis, I.; Goniakowski, J.; Kantorovich, L. N.; Gillan, M. J. The Structure of the
Stoichiometric and Reduced SnO2(110) Surface. Surf. Sci. 1995, 339, 258.
31
(33) Batzill, M.; Bergermayer, W.; Tanaka, I.; Dieblod, U. Tuning the Chemical Functionality of
a Gas Sensitive Material: Water Adsorption on SnO2(101). Surf. Sci. 2006, 600, L29-L32.
(34) Batzill, M.; Katsiev, K.; Burst, J. M.; Diebold, U.; Chaka, A. M.; Delley, B. Gas-phase-
dependent properties of SnO2 (110), (100), and (101) single-crystal surfaces: Structure,
composition, and electronic properties. Phys. Rev. B 2005, 72, 165414.
(35) Tang, W.; Sanville, E.; Henkelman, G. A Grid-Based Bader Analysis Algorithm without
Lattice Bias. J. Phys.: Condens. Matter 2009, 21, 084204.
(36) Kappler, J., Characterisation of high-performance SnO2 gas sensors for CO detection by
in situ techniques, PhD thesis, Eberhard Karls University of Tuebingen, 2001.
(37) Großmann, K.; Wicker, S.; Weimar, U.; Barsan, N. Impact of Pt Additives on the Surface
Reactions Between SnO2, Water Vapour, CO and H2: An Operando Investigation. Phys. Chem.
Chem. Phys. 2013, 15, 19151–8.
(38) Wicker S., Influence of humidity on the gas sensing characteristics of SnO2 – DRIFTS
investigation of different base materials and dopants, PhD thesis, Eberhard Karls Universität
Tübingen, 2016.
(39) Ducéré, J.M.; Hémeryck, A.; Estève, A.; Djafari Rouhani, M.; Landa, G.; Ménini, P.;
Tropis, C.; Maisonnat, A.; Fau, P.; Chaudret, B. A Computational Chemist Approach to Gas
Sensors: Modeling the Response of SnO2 to CO, O2, and H2O Gases. J. Comput. Chem. 2012, 33,
247–258.
(40) Bates, S.P. Full-Coverage Adsorption of Water on SnO2(110): the Stabilization of the
Molecular Species. Surf. Sci. 2002, 512, 29-36.
32
(41) Lindan, P.J.D. Water Chemistry at the SnO2(110) Surface: The role of Inter-molecular
Interactions and Surface Geometry. Chem. Phys. Lett. 2000, 328, 325-329.
(42) Goniakowski, J.; Gillan, M.J. The Adsorption of H2O on TiO2 and SnO2(110) Studied By
First-Principles Calculations. Surf. Sci. 1996, 350, 145-158.
(43) Santarossa, G.; Hahn, K.; Baiker, A. Free Energy And Electronic Properties Of Water
Adsorption On The SnO2(110) Surface. Langmuir 2013, 29, 5487-5499.
(44) Kumar, N.; Kent, P.R.C.; Bandura, A.V.; Kubicki, J. D.; Wesolowski, D.J.; Cole, D. R.;
Sofo, J.O. Faster Proton Transfer Dynamics of Water on SnO2 Compared to TiO2. J. Chem.
Phys. 2011, 134, 044706.
(45) Xu, H.; Zhang, R.Q.; Ng, A.M.C.; Djurisic, A.B.; Chan, H.T.; Chan, W.K.; Tong, S.Y.
Splitting Water on Metal Oxide Surfaces. J. Chem. Phys. C 2011, 115, 19710-19715.
(46) Wang, X.; Qin, H.; Chen, Y.; Hu, J. Sensing Mechanism of SnO2(110) Surface to CO:
Density Functional Theory Calculations. J. Phys. Chem. C 2014, 118, 28548-28561.
(47) Diéguez, A.; Romano-Rodriguez, A.; Vilà, A.; Morante, J. R. The complete Raman
spectrum of nanometric SnO2 particles. J. Appl. Phys., 2001, 90, 1550–1557.
(48) Liu, L. Z.; Li, T. H.; Wu, X. L.; Shen, J. C.; Chu, P. K. Identification of oxygen vacancy
types from Raman spectra of SnO2 nanocrystals. J. Raman Spectrosc., 2012, 43, 1423–1426.
(49) Staerz, A.; Berthold, C.; Russ, T.; Wicker, S.; Weimar, U.; Barsan, N. The Oxidizing
Effect of Humidity on WO3 Based Sensors. Sensors Actuators B 2016, 237, 54– 58.

33
TOC – Graphic
Copyright © 2022 FDOKUMEN