Influence of clouds and diffuse radiation on ecosystem-atmosphere CO 2 and CO 18 O exchanges
17
Influence of clouds and diffuse radiation on ecosystem-atmosphere CO 2 and CO 18 O exchanges C. J. Still, 1,2 W. J. Riley, 3 S. C. Biraud, 3 D. C. Noone, 4 N. H. Buenning, 4 J. T. Randerson, 5 M. S. Torn, 3 J. Welker, 6 J. W. C. White, 7 R. Vachon, 7 G. D. Farquhar, 8 and J. A. Berry 9 Received 20 December 2007; revised 11 November 2008; accepted 2 December 2008; published 4 March 2009. [1] This study evaluates the potential impact of clouds on ecosystem CO 2 and CO 2 isotope fluxes (‘‘isofluxes’’) in two contrasting ecosystems (a broadleaf deciduous forest and a C 4 grassland) in a region for which cloud cover, meteorological, and isotope data are available for driving the isotope-enabled land surface model (ISOLSM). Our model results indicate a large impact of clouds on ecosystem CO 2 fluxes and isofluxes. Despite lower irradiance on partly cloudy and cloudy days, predicted forest canopy photosynthesis was substantially higher than on clear, sunny days, and the highest carbon uptake was achieved on the cloudiest day. This effect was driven by a large increase in light-limited shade leaf photosynthesis following an increase in the diffuse fraction of irradiance. Photosynthetic isofluxes, by contrast, were largest on partly cloudy days, as leaf water isotopic composition was only slightly depleted and photosynthesis was enhanced, as compared to adjacent clear-sky days. On the cloudiest day, the forest exhibited intermediate isofluxes: although photosynthesis was highest on this day, leaf-to-atmosphere isofluxes were reduced from a feedback of transpiration on canopy relative humidity and leaf water. Photosynthesis and isofluxes were both reduced in the C 4 grass canopy with increasing cloud cover and diffuse fraction as a result of near-constant light limitation of photosynthesis. These results suggest that some of the unexplained variation in global mean d 18 O of CO 2 may be driven by large-scale changes in clouds and aerosols and their impacts on diffuse radiation, photosynthesis, and relative humidity. Citation: Still, C. J., et al. (2009), Influence of clouds and diffuse radiation on ecosystem-atmosphere CO 2 and CO 18 O exchanges, J. Geophys. Res., 114, G01018, doi:10.1029/2007JG000675. 1. Introduction [2] While spatial and temporal variations in atmospheric CO 2 and its 13 C/ 12 C composition have received considerable attention from the carbon cycle community [e.g., Ciais et al., 1995; Fung et al., 1997; Rayner et al., 1999, 2008; Randerson et al., 2002a, 2002b; Scholze et al., 2003], much less is known about the 18 O/ 16 O composition of atmospheric CO 2 (d 18 O a ; symbols defined in Table 1). Although global simulations of d 18 O a and its controlling processes have made good progress [Farquhar et al., 1993; Ciais et al., 1997a, 1997b; Peylin et al., 1999; Cuntz et al., 2003a, 2003b; N. Buenning et al., Modeling the response of the terrestrial biosphere and d 18 O of atmospheric CO 2 to flux, humidity, and isotope hydrol- ogy changes, manuscript in preparation, 2009], fundamental spatial and temporal variations of d 18 O a are poorly captured by state-of-the-art global model simulations. One example of unexplained behavior is the phase shift between seasonal cycles of CO 2 and d 18 O a observed at high northern latitudes, though a recent study showed how this shift is sensitive to boreal forest plant functional type composition and the d 18 O of plant source water [Welp et al., 2006]. A second, outstand- ing example of unexplained variation is the large, multiyear variation in mean d 18 O a observed at many stations. The pro- nounced downward excursion in global mean d 18 O a observed during the early and mid-1990s averaged 0.1% a 1 for extratropical, marine boundary layer stations, implying isotope fluxes, or ‘‘isofluxes,’’ on the order of tens of Pmol CO 2 % a 1 . [3] Because d 18 O a is strongly influenced by exchanges of CO 18 O between the atmosphere and terrestrial ecosystems JOURNAL OF GEOPHYSICAL RESEARCH, VOL. 114, G01018, doi:10.1029/2007JG000675, 2009 Click Here for Full Articl e 1 Department of Geography, University of California, Santa Barbara, California, USA. 2 Institute for Computational Earth System Science, University of California, Santa Barbara, California, USA. 3 Earth Sciences Division, Lawrence Berkeley National Laboratory, Berkeley, California, USA. 4 Department of Atmospheric and Oceanic Sciences and Cooperative Institute for Research in Environmental Science, University of Colorado, Boulder, Colorado, USA. 5 Earth System Science Department, University of California, Irvine, California, USA. 6 Environment and Natural Resources Institute, University of Alaska, Anchorage, Alaska, USA. 7 INSTAAR and Cooperative Institute for Research in Environmental Science, University of Colorado, Boulder, Colorado, USA. 8 Research School of Biological Sciences, Australian National University, Canberra, ACT, Australia. 9 Department of Global Ecology, Carnegie Institution of Washington, Stanford, California, USA. Copyright 2009 by the American Geophysical Union. 0148-0227/09/2007JG000675$09.00 G01018 1 of 17
-
Upload
oregonstate -
Category
Documents
-
view
0 -
download
0
Transcript of Influence of clouds and diffuse radiation on ecosystem-atmosphere CO 2 and CO 18 O exchanges

Influence of clouds and diffuse radiation on ecosystem-atmosphere
CO2 and CO18O exchanges
C. J. Still,1,2 W. J. Riley,3 S. C. Biraud,3 D. C. Noone,4 N. H. Buenning,4 J. T. Randerson,5
M. S. Torn,3 J. Welker,6 J. W. C. White,7 R. Vachon,7 G. D. Farquhar,8 and J. A. Berry9
Received 20 December 2007; revised 11 November 2008; accepted 2 December 2008; published 4 March 2009.
[1] This study evaluates the potential impact of clouds on ecosystem CO2 and CO2 isotopefluxes (‘‘isofluxes’’) in two contrasting ecosystems (a broadleaf deciduous forest and aC4 grassland) in a region for which cloud cover, meteorological, and isotope data areavailable for driving the isotope-enabled land surface model (ISOLSM). Our model resultsindicate a large impact of clouds on ecosystem CO2 fluxes and isofluxes. Despite lowerirradiance on partly cloudy and cloudy days, predicted forest canopy photosynthesis wassubstantially higher than on clear, sunny days, and the highest carbon uptake was achievedon the cloudiest day. This effect was driven by a large increase in light-limited shade leafphotosynthesis following an increase in the diffuse fraction of irradiance. Photosyntheticisofluxes, by contrast, were largest on partly cloudy days, as leaf water isotopic compositionwas only slightly depleted and photosynthesis was enhanced, as compared to adjacentclear-sky days. On the cloudiest day, the forest exhibited intermediate isofluxes: althoughphotosynthesis was highest on this day, leaf-to-atmosphere isofluxes were reduced from afeedback of transpiration on canopy relative humidity and leaf water. Photosynthesis andisofluxes were both reduced in the C4 grass canopy with increasing cloud cover and diffusefraction as a result of near-constant light limitation of photosynthesis. These results suggestthat some of the unexplained variation in global mean d18O of CO2 may be driven bylarge-scale changes in clouds and aerosols and their impacts on diffuse radiation,photosynthesis, and relative humidity.
Citation: Still, C. J., et al. (2009), Influence of clouds and diffuse radiation on ecosystem-atmosphere CO2 and CO18O exchanges,
J. Geophys. Res., 114, G01018, doi:10.1029/2007JG000675.
1. Introduction
[2] While spatial and temporal variations in atmosphericCO2 and its
13C/12C composition have received considerableattention from the carbon cycle community [e.g., Ciais et al.,1995; Fung et al., 1997; Rayner et al., 1999, 2008; Randerson
et al., 2002a, 2002b; Scholze et al., 2003], much less is knownabout the 18O/16O composition of atmospheric CO2 (d
18Oa;symbols defined in Table 1). Although global simulations ofd18Oa and its controlling processes have made good progress[Farquhar et al., 1993; Ciais et al., 1997a, 1997b; Peylinet al., 1999; Cuntz et al., 2003a, 2003b; N. Buenning et al.,Modeling the response of the terrestrial biosphere and d18Oof atmospheric CO2 to flux, humidity, and isotope hydrol-ogy changes, manuscript in preparation, 2009], fundamentalspatial and temporal variations of d18Oa are poorly capturedby state-of-the-art global model simulations. One example ofunexplained behavior is the phase shift between seasonalcycles of CO2 and d
18Oa observed at high northern latitudes,though a recent study showed how this shift is sensitive toboreal forest plant functional type composition and the d18Oof plant source water [Welp et al., 2006]. A second, outstand-ing example of unexplained variation is the large, multiyearvariation in mean d18Oa observed at many stations. The pro-nounced downward excursion in global mean d18Oa observedduring the early and mid-1990s averaged � �0.1% a�1
for extratropical, marine boundary layer stations, implyingisotope fluxes, or ‘‘isofluxes,’’ on the order of tens of PmolCO2% a�1.[3] Because d18Oa is strongly influenced by exchanges of
CO18O between the atmosphere and terrestrial ecosystems
JOURNAL OF GEOPHYSICAL RESEARCH, VOL. 114, G01018, doi:10.1029/2007JG000675, 2009ClickHere
for
FullArticle
1Department of Geography, University of California, Santa Barbara,California, USA.
2Institute for Computational Earth System Science, University ofCalifornia, Santa Barbara, California, USA.
3Earth Sciences Division, Lawrence Berkeley National Laboratory,Berkeley, California, USA.
4Department of Atmospheric and Oceanic Sciences and CooperativeInstitute for Research in Environmental Science, University of Colorado,Boulder, Colorado, USA.
5Earth System Science Department, University of California, Irvine,California, USA.
6Environment and Natural Resources Institute, University of Alaska,Anchorage, Alaska, USA.
7INSTAAR and Cooperative Institute for Research in EnvironmentalScience, University of Colorado, Boulder, Colorado, USA.
8Research School of Biological Sciences, Australian National University,Canberra, ACT, Australia.
9Department of Global Ecology, Carnegie Institution of Washington,Stanford, California, USA.
Copyright 2009 by the American Geophysical Union.0148-0227/09/2007JG000675$09.00
G01018 1 of 17

during photosynthesis and respiration [Francey and Tans,1987; Friedli et al., 1987; Farquhar et al., 1993; Ciais et al.,1997a, 1997b; Cuntz et al., 2003a, 2003b], several studieshave related the downward excursion of d18Oa to terrestrialcarbon cycle anomalies [Gillon and Yakir, 2001; Stern et al.,2001; Ishizawa et al., 2002; Flanagan, 2005]. However,water cycle anomalies can also affect d18Oa, as the d
18O ofecosystem-to-atmosphere CO2 fluxes is determined by thed18O of leaf and soil water pools which interact with CO2
during photosynthesis and respiration [Yakir and Sternberg,2000]. Leaf and soil water d18O are in turn determined by thed18O of precipitation [Welker, 2000; Vachon et al., 2007] andwater vapor and subsequent isotopic fractionations duringevaporation and diffusion [Craig and Gordon, 1965; Allisonet al., 1983]. Although either carbon or water cycle anomaliesmay drive d18Oa, unexplained multiyear variations in d18Oa
such as occurred in the 1990s likely result from linkedperturbations to both cycles.[4] Recent research has documented large variability in
tropical cloud cover [e.g.,Wielicki et al., 2002] on interannualtimescales that span part of the d18Oa record. For example,satellite measurements of earth’s shortwave and longwaveradiation budgets over the 1990s suggest decreases in tropicalmean cloudiness [Wielicki et al., 2002], in agreement withdecreases in the monthly mean global cloud fraction over the1990s (http://isccp.giss.nasa.gov/climanal1.html). Tropicalcloud cover variability may be particularly relevant forunderstanding global d18Oa variations, as tropical terrestrialecosystem CO2 fluxes comprise a large fraction of globalproductivity. Other satellite-based analyses document in-creasing spring and summer cloud cover in the Arctic region[Wang and Key, 2003]. In addition, evidence from ground-based radiometers suggests secular changes in surface globalirradiance, with a total reduction of�4–6% from about 1960to 1990 (‘‘global dimming’’) [Stanhill and Cohen, 2001;Liepert, 2002; Liepert et al., 2004] followed by a reversalfrom roughly 1990 onward that has been termed ‘‘globalbrightening’’ [Wild et al., 2005, 2007; Pinker et al., 2005;Roderick, 2006].
[5] Here we examine the hypothesis that these large-scalechanges in cloud cover and irradiance account for part of theunexplained variation observed in d18Oa, as clouds influenceseveral environmental factors important in controlling bio-sphere-atmosphere CO2 isofluxes. Clouds reduce total short-wave (global) irradiance (RS) while also increasing diffuseirradiance (RD) and the diffuse fraction (RD/RS, the ratio ofdiffuse irradiance to total or global irradiance [Roderick,1999]). Numerous empirical and theoretical studies havenoted the impact of changes in diffuse photosyntheticallyactive radiation (PAR) on canopy carbon uptake via increasesin photosynthesis of light-limited shade leaves and otherassociated changes in the environment [e.g., Price and Black,1990; Hollinger et al., 1994, 1998; Gower et al., 1999;Choudhury, 2001; Roderick et al., 2001; Freedman et al.,2001; Gu et al., 1999, 2002, 2003; Rocha et al., 2004; Min,2005; Urban et al., 2007; Oliveira et al., 2007; Knohl andBaldocchi, 2008]. In addition to increasing RD/RS and thecontribution of shade leaves to canopy photosynthesis, cloudsdecrease radiant heating of upper canopy sun leaves, poten-tially increasing net photosynthetic rates [Roderick et al.,2001; Gu et al., 2002, 2003]. Increased cloudiness is oftenalso associated with higher surface relative humidity viadecreases in air and leaf temperature and increases in specifichumidity [Freedman et al., 2001].[6] Relative humidity will influence both photosynthetic
CO2 fluxes and the d18O of leaf water via impacts onstomatal conductance, and thus can have a disproportionateimpact on ecosystem-atmosphere isofluxes. An increase inrelative humidity generally increases stomatal conduc-tance, which, coupled with increased shade leaf photo-synthesis, should increase photosynthetic isofluxes.However, increased relative humidity will also decreaseleaf water d18O because of a greater influx of depletedvapor, and this would decrease photosynthetic isofluxes.[7] Thus, the net effect of changing cloud cover on
biosphere-atmosphere CO2 and CO2 isofluxes exchanges isdifficult to assess without high-frequency ecosystem CO18Oflux measurements. However, these data are currently being
Table 1. Nomenclature Used in the Papera
Variable Description
d18Oa Background atmosphere d18O-CO2 (VPDB-CO2)RD/RS Diffuse fraction, the ratio of diffuse irradiance to total (global) irradiance or of diffuse PAR to total PARPAR Photosynthetically Active Radiation (400–700 nm).LAI Leaf area index (m2/m2)18D Discrimination against CO18O during photosynthesis
ed Kinetic fractionation during molecular diffusion of CO18O
d18Oc d18O value of CO2 in equilibrium with H2O in leavesCa, Ci, Cc CO2 concentrations in the atmosphere, stomatal pore, and in chloroplastsFal Gross CO2 flux from atmosphere to leafFla Gross CO2 flux from leaf to atmosphereAnet Net leaf photosynthesis including leaf respiration (Fal-Fla)18Fal Atmosphere-to-leaf isoflux (d18O in CO2)18Fla Leaf-to-atmosphere isoflux (d18O in CO2)Anet
18D Net photosynthetic isofluxd18Olw d18O value of leaf water (VSMOW)d18Oxy d18O composition of source water in xylem (VSMOW)d18Osw d18O composition of soil water (VSMOW)d18Ocv d18O composition of in-canopy water vapor (VSMOW)d18Ov d18O composition of background, above-canopy water vapor (VSMOW)
aHere d =�Rsam
Rstd� 1
�and Rsam and Rstd are the ratios of
18O/16O in a sample or standard, respectively. The d18O-CO2 values are reported relative to the
G01018 STILL ET AL.: CLOUDS AND CO18O EXCHANGES
2 of 17
G01018

collected at only a few sites at present [Griffis et al., 2008;McDowell et al., 2008]. The focus of this study instead isto examine potential ecosystem isoflux responses usingobserved cloud cover, radiation, meteorological and waterisotope data to drive an isotope-enabled ecosystem model(ISOLSM).We chose to focus on two contrasting ecosystemsin the Southern Great Plains over a short time period forintensive investigation of the mechanisms underlying themodeled canopy isoflux response to changing cloud cover.For our analyses, we selected a 12-day period from 11 to22 July 2004 (day of year (DOY) 193–204,) during whichstrong variations in daytime thick cloud cover occurred at ourstudy site, from less than 10% on clear days to 100% on acloudy day. In addition to cloud cover variations, we selectedthis period using the following criteria: constant LAI, onlytrace amounts of precipitation (since precipitation d18O isa primary driver of CO2 isofluxes), and no large changes inair temperature and specific humidity due to the passage ofdiffering air masses associated with storm fronts. By limitingvariability from these factors, we decomposed the predictedisoflux response to cloud cover into its component processes.
2. Methods
2.1. Site Description
[8] To capture the relevant processes that determine thenet impact of clouds on ecosystem CO18O isofluxes, weemployed a comprehensive, isotope-enabled ecosystemmodel(ISOLSM) [Riley et al., 2002, 2003; Still et al., 2005] in theDOEAtmospheric RadiationMeasurement (ARM) program’sClimate Research Facility (ACRF) in the 140,000 km2 South-ern Great Plains (SGP) region of Oklahoma and Kansas[Ackerman and Stokes, 2003]. The SGP region is particularlyamenable for such a study because of the great diversity ofcloud property, aerosol, radiation, and meteorological mea-surements available, with the most intensive data collec-tion at the Central Facility (CF) site near Lamont, OK (36�36.300N, 97� 29.100W, 320 masl). Analysis of atmosphericdata collected at the CF has shown large changes in irradiancedriven by cloud cover from 1997 to 2004 [Dong et al., 2006].The SGP region also contains natural and agricultural eco-systems representing a variety of photosynthetic pathwaysand growth forms, including tallgrass prairies, broadleafforests along riparian areas, and crops such as winter wheat,milo, and corn. Because we wanted to explore the impact ofcloud cover variations on ecosystem-atmosphere isofluxes intwo globally important but strongly contrasting naturalvegetation types also represented within the SGP region,we chose broadleaf deciduous forests and C4 grasslands forour model simulations.
2.2. Model Description
[9] ISOLSM is based on the NCAR Land Surface Model(LSM1.0) [Bonan, 1994; Bonan et al., 1997], which wasmod-ified by Riley et al. [2002] to simulate the carbon and oxygenisotope composition of terrestrial ecosystem-atmosphere CO2
and H2O exchanges. The model simulates canopy radiationtransfer using the two-stream approximation of Dickinson[1983] and Sellers [1985] to calculate direct and diffuseradiation fluxes in the visible and near-infrared wave bands.The canopy is divided into sunlit and shaded leaves using anextinction coefficient that accounts for scattering within the
canopy [Sellers, 1985]. Themodel does not vary leaf nitrogenand photosynthetic capacity between sun and shade leaves, asis done in some models [e.g., de Pury and Farquhar, 1997;Wang and Leuning, 1998]. The version of ISOLSM appliedhere differs from that described by Riley et al. [2002] byseveral changes made to the plant photosynthesis submodels.First, low- and high-temperature inhibition factors on themaximum catalytic capacity of Rubisco (Vmax) from Sellerset al. [1996] have been included. Second, we implementedthe method of Sellers et al. [1996] to smooth transitionsbetween the three limiting assimilation rates (i.e., Rubisco,light, and export limited). Finally, iterations to estimate Cc
and Ci, the leaf chloroplast and internal CO2 concentrations,are now performed using net photosynthesis (i.e., accountingfor leaf respiration occurring inside the leaf), as opposed togross photosynthesis, as done in the original version ofLSM1. Of these changes, the last had the largest impact,resulting in values for Vmax and Ci that are much closer tomeasured values. Accurate Ci and Cc are critical for simu-lating isotopic fractionations against 13CO2 and CO18O.ISOLSM models mesophyll (or internal) conductance in C3
plants to be proportional to the maximum carboxylationcapacity (Vmax (in mmol m�2 s�1)) following Evans andLoreto [2000], but without the soil moisture dependenceimplemented by Randerson et al. [2002b]. During light-saturated photosynthesis in forest sun leaves, the averagedrawdown from Ci to Cc was �4 Pa over the study period,similar to the drawdown measured by Gillon and Yakir[2000].[10] We have tested ISOLSM’s H2O and CO2 flux pre-
dictions against several sets of measurements: (1) in thedominant vegetation types using measurements [Suykerand Verma, 2001] performed in the SGP as part of theAmeriFlux program [Riley et al., 2003]; (2) against 3 yearsof surface measurements made during the FIFE campaign[Betts and Ball, 1998; Cooley et al., 2005]; (3) in a tallgrassprairie site in Kansas [Lai et al., 2006a]; (4) in an old growthconifer forest in Oregon [Aranibar et al., 2006]; and in morerecent measurements in wheat, pasture, and soy (W. J. Rileyet al., manuscript in preparation, 2009). We have also testedISOLSM’s isotopic predictions against available data inGreat Plains grassland and cropland ecosystems (i.e., d18Oin ecosystem water pools and fluxes, and d18O in ecosystemCO2 fluxes [Riley et al., 2003; Still et al., 2005; Lai et al.,2006a]). We have previously applied ISOLSM to examine(1) impacts of the atmospheric d18O value of H2O andCO2 onecosystem discrimination against CO18O [Riley et al., 2003];(2) impact of carbonic anhydrase activity in soils and leaves[Riley et al., 2002, 2003]; (3) impacts of gradients in the d18Ovalue of near-surface soil water on the d18O value of the soilsurface CO2 flux [Riley et al., 2003; Riley, 2005]; (4) impactsof land use change on regional surface CO2 and energy fluxesand near-surface climate [Cooley et al., 2005]; and (5) the useof 13C measurements to improve model parameterizations[Aranibar et al., 2006]. The isotope submodels in ISOLSMsimulate the dominant processes impacting the d18O value ofsoil (d18Osw) and leaf H2O (d18Olw) and CO2 fluxes: advec-tion of H2
18O in soil water and subsequent evaporation, leafwater isotopic enrichment, isotopic exchanges between H2Oand CO2 in the soil and leaves, the transport of CO2 andCO18O in the soil column, and the d18O of canopy watervapor (d18Ocv). The xylem source water that supplies leaves,
G01018 STILL ET AL.: CLOUDS AND CO18O EXCHANGES
3 of 17
G01018

d18Oxy, is determined in ISOLSM by the vertical distribu-tion of d18Osw, weighted by rooting density profiles for thevarious ecosystem types. d18Ocv is calculated at each timestep as a function of vapor isotope exchanges with above-canopy air (d18Ov), as well as isotope fluxes from canopytranspiration and soil and canopy evaporation when thecanopy is wet [Riley et al., 2002]. Further description ofour leaf water d18O and photosynthetic isoflux calculationsis given in section 3.
2.3. Cloud Cover, Radiation, Meteorology,and Water Isotope Forcing Data
[11] ISOLSM is forced with meteorological and waterisotope data [Riley et al., 2002, 2003], and it has recentlybeen modified to ingest satellite measurements of vegetationcharacteristics such as the projected leaf area index (LAI).For the simulations reported here, radiation, cloud property,and aerosol data were acquired from instruments at the ARMCentral Facility (CF) in Lamont, OK, which is the primarymeasurement facility within the ARM SGP region [Ackermanand Stokes, 2003]. The instrument array at the CF includessensors to measure cloud presence and cloud radiative prop-erties, which are necessary to explore the role of clouds inecosystem-atmosphere CO18O exchanges. Radiation fluxesmeasured at the CF site include downwelling shortwaveradiation (direct and diffuse) and downwelling longwaveradiation. For our analysis, early morning and late afternoonvalues (solar angles less than 15�) were screened to minimizethe impact of low solar angles on RD/RS.[12] The ARM cloud data used are the daytime percent
cover of clouds, as measured by the total sky imager (TSI),an instrument that measures the fractional sky coverage ofthin and thick (opaque) clouds (i.e., the fraction of thehemispheric field of view that contains these cloud types) fordaytime periods when the solar elevation exceeds 10 degrees.For this analysis, we focus on the percent cover of thickclouds, as these are both the dominant cloud types and havethe largest impact on irradiance, RD/RS, temperature, andrelative humidity. Min [2005] showed that diffuse radiationfluxes due to optically thick clouds have a greater impact oncanopy photosynthetic efficiency than do fluxes from opti-cally thin clouds. Because of temporal limitations on thesedata (i.e., only daytime cloud cover fractions are availablefrom the TSI), we have restricted our analysis to daytimeperiods. Although nighttime clouds can affect the surfaceenergy budget and carbon cycle through modulation oflongwave energy fluxes [e.g., Dai et al., 1999], the largestimpacts of clouds on canopy isofluxes should occur dur-ing the day. Unfortunately, cloud-screened aerosol opticaldepth data from a Sun photometer [e.g., Niyogi et al.,2004; Oliveira et al., 2007] were not available for our studyperiod to allow a separate assessment of aerosol impacts onisofluxes.[13] The meteorological data used to force ISOLSM in-
clude air temperature, pressure, water vapor content, windspeed, and precipitation amount. These data were taken fromthe Oklahoma and Kansas Mesonet program. The Mesonetconsists of 145 instrument platforms (as of April 2007)distributed throughout the two states. Each station measuresrelative humidity, wind speed and direction, air temperature,and atmospheric pressure, and reports these data as 5-min,15-min, or half-hourly averages for the state of Oklahoma
and as hourly average for the state of Kansas. Additionalexternal data sets required by ISOLSM include the following:(1) soil type from the 1 km USGS Statsgo soils database (i.e.,20% sand, 15% silt, and 65% clay around the CF); (2) month-lymean precipitation d18O values averaged over 2–5 years ofdata from analyses of archived water samples collected by theEPA National Atmospheric Deposition Program (NADP)network [Lynch et al., 1995] between 1980 and 1990 andinterpolated across the Great Plains region [Welker, 2000];and (3) the atmospheric CO2 concentration.[14] The model simulations also require the d18O compo-
sition of above-canopy water vapor (d18Ov) and backgroundatmospheric CO2 (d18Oa). Neither quantity is measuredcontinuously in this region. Many factors affect d18Ov [Leeet al., 2006], including evapotranspiration and horizontal andvertical atmospheric advection, and diurnal variations of upto 4% have been measured in this area [Helliker et al., 2002;Riley et al., 2003]; smaller diurnal variations (1–2%) havebeen observed over temperate forests [Lai et al., 2006a; Leeet al., 2006]. Other investigators have shown strong linear orlog linear relationships between specific humidity and d18Ov
[White and Gedzelman, 1984; Lee et al., 2006]. However, wehave no information on this relationship in the SGP region, asextensive d18Ov data are not available. Instead, for this set ofsimulations, we set d18Ov to be in a temperature-dependentisotopic equilibrium with the most recent precipitation event[e.g., Lee et al., 2006]. Although our approach only crudelycaptures the processes that regulate d18Ov, the sensitivity ofecosystem-atmosphere CO18O exchanges to diurnal varia-tions in d18Ov has been examined in detail by Riley et al.[2003] and found to be small, partly because the more im-portant vapor d18O is that of within-canopy vapor, d18Ocv,which interacts directly with d18Olw. Riley et al. [2003] alsoshowed that diurnal variations in d18Oa can impact CO2
isofluxes. However, since we lacked consistent diurnal mea-surements of d18Oa, we imposed a constant value of�0.5%,which is similar to the zonal annual mean value from mid-latitude, northern hemisphere stations in the NOAA airsampling network [Cuntz et al., 2003b], and is close to meanvalues measured 3–4 km above the surface by ARM andNOAA. There is no diagnostic solution for the canopy airspace CO2 and CO
18O concentrations that is analogous to theH2O and H2
18O solution [Riley et al., 2002]. We thereforeassume that canopy CO2 and CO18O concentrations are thesame as above-canopy values. To properly analyze potentialfeedbacks between leaf and canopy CO18O fluxes, a prog-nostic canopy airspace model would need to be used; to ourknowledge, no previous work has addressed this issue.
2.4. Model Sensitivity Experiments
[15] Our primary objective was to better understand theeffects of cloud cover and associated environmental factorssuch as diffuse radiation and relative humidity on ecosystem-atmosphere CO18O exchanges for two globally importantand strongly contrasting biomes that should bracket theexpected range of ecosystem responses to cloud cover: broad-leaf deciduous forests and C4 grasslands. The two types differin photosynthetic pathway (C3 forest and C4 grass), life form(tree versus grass), and canopy stature (canopy heights usedin ISOLSM are 20 m and 0.5 m, respectively [Bonan, 1996]),thereby allowing us to explore a wide range of potentialecosystem CO2 isoflux responses to cloud cover variations.
G01018 STILL ET AL.: CLOUDS AND CO18O EXCHANGES
4 of 17
G01018

The LAI values we used are particularly important becausea higher diffuse radiation fraction is more influential withhigher canopy LAI, as more leaf area is in shade during sunnyconditions dominated by direct beam radiation [cf. Rodericket al., 2001; Gu et al., 2002; Alton et al., 2005; Knohl andBaldocchi, 2008]. To assess the sensitivity of our results toLAI in the broadleaf forest, we ran our base simulation withthe mean value (5.0) for temperate broadleaf forests fromAsner et al. [2003]. We also ran simulations with LAI valuesone standard deviation above and below the mean (i.e., LAIof 3.5 and 6.5, with all other driving variables were heldconstant). An LAI of 6.5 is not uncommon in temperate andtropical broadleaf forests, which together contribute substan-tially to global primary production [e.g., Field et al., 1998]and thus are particularly relevant for understanding globald18Oa variations. We set the C4 grass canopy LAI to 3.75.This value is typical of highly productive C4 grasslands[Suyker and Verma, 2001] and C4 corn crops [Campbellet al., 1999]. To assess the C4 grass canopy LAI sensitivity,we doubled the LAI (from 3.75 to 7.5) in one simulation andreduced it by 33% (to 2.5) in another.[16] We also tested the sensitivity of our results to shade
leaf temperatures, as ISOLSM does not separately calculatethe energy balance of sun and shade leaves. Shade leaves canexperience a very different radiation environment than sunleaves, leading to leaf temperature gradients in the canopy[Gu et al., 2002; Larcher, 2003]. Shade leaf temperatures canbe lower than sun leaf temperatures during sunny days. Wetested the impact of this difference on our results by settingforest shade leaf temperatures to canopy air temperatures.Finally, we assessed the sensitivity of our results to theuniform distribution of leaf nitrogen and photosyntheticcapacity (Vmax) between sun and shade leaves in ISOLSM.This uniformity could lead to larger shade leaf photosynthe-sis than would otherwise occur if these leaves become limitedby Rubisco, which scales with leaf nitrogen. We halved Vmax
in forest shade leaves in a separate simulation.
3. Results and Analysis
[17] We analyzed consecutive growing season days tounderstand how changes in cloud cover affected the physicalenvironment and modeled ecosystem-atmosphere CO2
fluxes and isofluxes in a broadleaf deciduous forest canopyand a C4 grassland canopy. Our analysis is divided into foursections to clarify the processes impacting CO2 fluxes andisofluxes: (section 3.1) cloud cover effects on RD/RS, PAR,temperature, and humidity; (section 3.2) the response ofphotosynthesis and respiration to cloud cover; (section 3.3)the response of leaf and soil water d18O to cloud cover; and(section 3.4) the response of CO2 isofluxes to cloud cover.
3.1. Cloud Cover Impacts on RD/RS and the PhysicalEnvironment
[18] During the first 3 days (DOY 193–195) of the studyperiod, the percent of the sky obscured by thick (opaque) andthin clouds was minimal (Figure 1a). During these mostlyclear days, total irradiance was high, and the PAR flux wasdominated by direct beam radiation except for early in themorning and early in the evening when diffuse radiationincreased (Figure 1b). In this and subsequent figures, onlydaytime values are plotted. These clear-sky days provided a
useful basis for comparison with subsequent days (DOY196–199), which experienced increasing thick cloud coverand midday diffuse PAR irradiance, along with reduceddirect and total shortwave irradiance. The peak diffuse PARirradiance on partly cloudy days increased more than twofoldfrom clear days. The magnitude of midday diffuse PARirradiance was similar to direct PAR on DOY 196, and thickcloud cover exceeded 60% for several hours. DOY 198 wasby far the cloudiest day of the study period, with thick cloudcover close to 100% for much of the day (Figure 1a) andirradiance dominated by diffuse fluxes (Figure 1b). The daysbefore and after DOY 198were both partly cloudy, with dailymaximum thick cloud cover around 60%. DOY 199 is note-worthy, as the thick and thin clouds scattered and reflecteddirect beam irradiance, in the process increasing the diffuseirradiance enough to produce the highest midday shortwaveirradiance measured in the study period (i.e., total PAR wasgreater than even the clear-sky days of 193, 194, and 202).This effect of unexpectedly high midday irradiance duringpartly cloudy periods has been observed elsewhere [Gu et al.,1999, 2001; Urban et al., 2007].[19] The period from DOY 200–203 was mostly clear,
with the lowest cloud cover of the study period measured onDOY 202 (Figure 1a). On this day, direct beam PARwas veryhigh, about the same peak magnitude as on the other veryclear day, DOY 193, but diffuse PAR was slightly lower.DOY 204 was partly to mostly cloudy (cover greater than80% for much of the day), and it had high diffuse PARirradiance (Figure 1b). This day preceded a heavy rain eventon DOY 205. Stratifying the days by cloud cover thus pro-duces the following classifications: clear (sunny) days (DOY193–195, 200–203), partly cloudy days (DOY 196–197,199, and 204), and a cloudy day (DOY 198).
Figure 1. (a) The observed percent cover of thick (opaque)and thin clouds at the ARM Central Facility during daylighthours from DOY 193 to DOY 204 (11–22 July 2004).(b) Observed direct and diffuse PAR irradiance (mmol%m�2
s�1, using conversion factors of 4.6 mmol photons J�1 and4.2 mmol photons J�1 for direct and diffuse radiation[Larcher, 2003]) on consecutive summer days (DOY 193–204) with contrasting cloud cover.
G01018 STILL ET AL.: CLOUDS AND CO18O EXCHANGES
5 of 17
G01018

[20] Observed relative humidity and the diffuse PARfraction (RD/RS), are shown in Figure 2. (Our analysis focuseson the observed diffuse PAR fraction, which we denote withthe same notation (RD/RS) as the diffuse shortwave fractionfollowing Roderick 1999; although diffuse PAR and short-wave fractions can differ slightly, during our study periodthey were indistinguishable from one another). Diurnalprofiles of relative humidity largely followed the pattern ofair temperature, and RD/RS followed predictable patterns onclear days with higher morning and evening values (Figure 2).Midday RD/RS was highest on the partly cloudy and cloudydays. Notably, the partly cloudy days (DOY 196–197, 199,and 204) did not have temperatures or humidities dramati-cally different from adjacent clear-sky days. Modeled leaftemperatures in the forest simulation tracked measured airtemperatures, though they were higher by 1–3 K on sunnydays (not shown).[21] The increasing cloud cover during DOY 196–198
increased diffuse PAR and decreased direct and total PARirradiance, producing a positive relationship between day-time RD/RS and the thick cloud cover fraction (Figure 3). Thinclouds and aerosols might also have affected RD/RS andcontributed to some of the scatter shown in Figure 3. Onpartly cloudy days, midday RD/RS values were �0.4, com-pared to �0.15 on clear days, and the highest midday RD/RS
occurred on DOY 198, when it reached 1.0. The strong rela-tionship between cloud cover andRD/RS has been observed ina variety of other studies, and results from radiation absorp-tion, reflection and scattering by cloud droplets.
3.2. Photosynthetic Responses to Cloud Cover Changes
3.2.1. Broadleaf Deciduous Forest[22] The effect of cloud cover on modeled broadleaf
deciduous forest canopy photosynthesis was large. Despitethe lower total PAR on partly cloudy and cloudy days (DOY196–199, 204), simulated peak canopy photosynthesis washigher on these days than on sunny days (DOY 193–195 and200–203; Figures 1b and 4a). This enhancement was dueprimarily to increases in shade leaf photosynthesis fromincreases in diffuse PAR on these days. There were minimalchanges in modeled sun leaf photosynthesis on these daysbecause the rate was light saturated for much of the day, andeven relatively large decreases in direct PAR didn’t impactsun leaf photosynthesis. During these periods, sun leafphotosynthesis was limited by the amount and capacity of
the primary photosynthetic enzyme, Rubisco [i.e., Collatzet al., 1991]. Also, the leaf temperature was slightly lower onthe partly cloudy days compared to the sunny days because oflower radiant heating, thereby decreasing leaf respiration andphotorespiration rates. The temperature sensitivity of themaximum carboxylation capacity (Vmax) is important forsun leaf photosynthesis, as it is usually light saturated anddepends directly on Vmax, while photorespiration affects bothlight-limited and light-saturated rates [Farquhar et al., 1980;Collatz et al., 1991].
Figure 2. Observed background relative humidity (RH)and incident diffuse PAR fraction (RD/RS).
Figure 3. Observed daytime thick cloud cover fraction andincident diffuse PAR fraction (RD/RS) over the study period(DOY 193–204). Early morning and late afternoon valueswere screened to minimize the impact of low solar angles(<15�) on RD/RS.
Figure 4. (a) Modeled broadleaf deciduous tree canopyphotosynthesis per unit ground area (mmol m�2 s�1) duringDOY 193–204. (b) Modeled tree canopy photosynthesis(mmol m�2 s�1) plotted against the thick cloud cover per-centage for daylight hours from DOY 193 to DOY 204.
G01018 STILL ET AL.: CLOUDS AND CO18O EXCHANGES
6 of 17
G01018

[23] In contrast to sun leaves, forest shade leavesresponded strongly to the altered radiation regime inducedby clouds: as cloud cover increased, diffuse PAR and shadeleaf photosynthesis increased in tandem because shade leafphotosynthesis was light limited. On sunny days, peak shadeleaf cumulative photosynthetic fluxes were less than half ofsun leaf fluxes, whereas on partly cloudy and cloudy days theshade leaf fluxes equaled or exceeded the sun leaf values(Figure 4a). The overall positive simulated forest canopyphotosynthetic response to increasing cloud cover (slope0.15, r2 = 0.37; Figure 4b) thus resulted primarily fromincreased shade leaf carbon uptake with increased RD/RS.3.2.2. C4 Grassland[24] The C4 grass canopy photosynthetic response to cloud
variations was opposite that of the broadleaf deciduous forestcanopy: increasing cloud cover generally led to decreasedcanopy photosynthesis. The negative response of C4 photo-synthesis to increasing RD/RS was stronger than its responseto cloud cover (not shown). Although grass shade leafphotosynthesis responded positively to increased cloud coverdue to increased diffuse PAR, sun leaf photosynthesisresponded negatively to the decrease in direct beam radiation,and sun leaf photosynthesis was much larger than shade leafphotosynthesis during almost all cloud cover conditions(Figure 5).[25] The modeled C4 grass canopy photosynthesis closely
followed daily irradiance patterns, in agreement with leaf andcanopy-scale observations for C4 plants [Suyker and Verma,2001; Larcher, 2003]. In general, the highest predicted C4
grass canopy photosynthesis rates occurred during the clear-sky days (DOY 193–195, 200–203), and the lowest ratesoccurred during the cloudiest days (DOY 196, 198, 204). Theone important exception (on DOY 199, which was partlycloudy) proves the rule: peak insolation values on this daywere the highest of the study period because of cloud scat-tering and reflection, and modeled peak C4 grass photosyn-thesis was also highest on this day (Figure 5). Modeled peakcanopy photosynthesis was large because of the high LAIvalues we imposed, although there are examples of well-watered and fertilized natural C4 grassland and C4 cropcanopies exhibiting even higher productivity [Piedade et al.,
1991; Jones, 1992;Morison et al., 2000]. The net ecosystemexchange (NEE) values predicted by ISOLSM (not shown)ranged from �15 to �35 mmol m�2 s�1, similar to NEEmeasured in a C4 grass-dominated pasture in this region[Suyker and Verma, 2001].[26] The fundamentally different response to cloud cover
of the C4 grass canopy (as opposed to the forest canopy) wasat least partly due to canopy stature and the lower effectiveshade leaf area (and higher effective sun leaf area) in themuch shorter grass canopy. Grass leaves have a more verticalorientation (erectophile morphology), and broadleaf decidu-ous tree leaves have a more horizontal orientation, so that athigh solar angles the sun leaf area in grass canopies is higherthan the comparable sun leaf area of broadleaf deciduous treecanopies [Jones, 1992; Larcher, 2003]. Another reason forthe different response to irradiance is that both sun and shadeleaf photosynthetic rates are almost always limited by lightin the C4 grass simulation. A hallmark of C4 plants is theirdominance in high-light and high-temperature environmentssuch as grasslands and savannas [Long, 1999; Sage et al.,1999]. Photosynthesis in unstressed C4 plants does not satu-rate on sunny days, unlike the typical light saturation for C3
plants [Collatz et al., 1991, 1992].[27] The decline in C4 grass canopy photosynthesis with
increasing cloud cover and RD/RS parallels the empiricalresults from eddy flux studies assessed by Niyogi et al.[2004], who found that increasing aerosol optical depthincreased RD/RS and reduced RS. This led to increases innet carbon uptake by C3 ecosystems, but strong reductions innet carbon uptake for a C4 natural grassland. Although notexplicitly a response to cloud cover variations per se, thisstudy supports our modeling results: increasing RD/RS anddecreasing RS reduces C4 photosynthesis, without the diffuselight photosynthetic enhancement often seen in C3 canopies.Our predictions also agree with Turner et al. [2003], whostudied the relationship between measured gross primaryproduction (GPP) and absorbed PAR in a cross-biomecomparison. The C4-dominated tallgrass prairie displayed anearly linear relationship between GPP and APAR, unlikeother biomes, which exhibited more typical light saturationresponses (i.e., a hyperbolic relationship between GPP andAPAR). Thus, decreases in RS and increases in RD/RS,whether caused by clouds or aerosols, should decrease GPPin C4 grasses, but not necessarily in C3 plants.3.2.3. Response of Canopy Light Use Efficiencyto Cloud Cover and RD/RS Variations[28] The response of forest photosynthesis to cloud cover
and irradiance is related to how efficiently the canopyconverts solar radiation to chemical energy, a quantityreferred to as gross or GPP light use efficiency (LUE) (molCO2 mol�1 APAR). The broadleaf deciduous forest grossLUE was inversely proportional to irradiance. Indeed, theforest canopy strongly increased its gross LUE as RD/RS
increased (Figure 6a). The daily averaged forest grossLUE for clear/sunny days (DOY 193–195, 200–203) was0.031 mol CO2 mol�1 APAR, for partly cloud days (DOY196–197, 199, 204) was 0.038 mol CO2 mol�1 APAR, andfor the cloudy day (DOY 198) was 0.048 mol CO2 mol�1
APAR. This pattern follows the expectations of increasingLUE with increasing cloud cover and RD/RS demonstratedpreviously in eddy flux [e.g.,Hollinger et al., 1994;Gu et al.,2002; Rocha et al., 2004;Min, 2005] and modeling [Norman
Figure 5. Modeled C4 grass canopy photosynthesis (mmolm�2 s�1) during DOY 193–204.
G01018 STILL ET AL.: CLOUDS AND CO18O EXCHANGES
7 of 17
G01018

and Arkebauer, 1991; Choudhury, 2001] studies. The in-crease of LUE with RD/RS depends on canopy structure andopenness [Alton et al., 2005], and, as we show below, onphotosynthetic pathway.[29] During periods of high RD/RS, both sun and shade
leaves in the forest were light limited and thus displayed alinear response to APAR. The linear slope between photo-synthesis and APAR is defined as the quantum yield ofphotosynthesis [Larcher, 2003]. In C3 plants the highestintrinsic quantum yield is �0.085 mol CO2 mol�1 incidentPAR, and its temperature sensitivity is largely driven byphotorespiration [Collatz et al., 1998; Ehleringer et al.,1997]. Therefore, canopy LUE under low light closelyfollows the temperature-dependent photorespiration rate.Forest LUE values reached their lowest values aroundmidday when sun leaves were light saturated and leaf temper-atures were high. Forest canopy LUE dropped nonlinearlywith temperature and reached its lowest values on the sun-niest, hottest days when RD/RS was lowest (Figure 6a).[30] The C4 canopy maintained high gross LUE over the
study period, and was relatively insensitive to variations incloud cover, irradiance, and leaf temperature. Since C4 sunand shade leaf photosynthesis was almost always lightlimited, the relationship between canopy photosynthesisand APAR was linear across the entire PAR range, and thuscanopy LUE was very close to the leaf quantum yield. Theintrinsic modeled leaf C4 quantum yield is 0.06 mol CO2
mol�1 incident PAR [Collatz et al., 1998], although naturalC4 monocots can occasionally exceed this value [Ehleringeret al., 1997]. C4 plants typically maintain nearly constantquantum yields across a range of temperatures under low-light conditions [Ehleringer et al., 1997;Collatz et al., 1998].During most daytime hours of the study period, the C4 grasscanopy LUE varied from �0.035–0.05 mol CO2 mol�1
APAR, and, unlike the forest canopy, there was no consistent
relationship with cloud cover or leaf temperature. There wasa relationship with RD/RS, although it was weak comparedwith the forest LUE response to RD/RS (Figures 6a and 6b).
3.3. Leaf and Soil Water d18O Responsesto Cloud Cover Changes
[31] The simplest formulation for leaf water d18O iscaptured in the steady state prediction for d18O of anevaporating surface, in this case within leaves [Craig andGordon, 1965; Farquhar et al., 1989; Yakir and Sternberg,2000]:
d18Olws ¼ d18Oxy þ ek þ e*þ d18Ocv � ek � d18Oxy
� � eaei: ð1Þ
In this equation, d18Oxy and d18Ocv are the 18O/16O com-position of stem xylem (source) water and within-canopyatmospheric water vapor; ek is the weighted mean of kineticfractionations against H2
18O molecules diffusing through thestomata and across the leaf boundary layer (32 and 21%,respectively [Cappa et al., 2003]); e* is the equilibriumfractionation between liquid and vapor phases over asaturated surface (�9.4% at 298K [Horita and Wesolowski,1994]); and ea and ei are the water vapor pressures (Pa) in thecanopy atmosphere and inside leaf stomata, respectively.[32] Bulk leaf water d18O is often not accurately repre-
sented by a steady state formulation [Dongmann et al., 1974;Zundel et al., 1978;Wang et al., 1998; Harwood et al., 1998;Cernusak et al., 2002; Cuntz et al., 2003a; Barbour et al.,2004; Farquhar and Cernusak, 2005; Cernusak et al., 2005;Seibt et al., 2006]. Dongmann et al. [1974] first proposed anonsteady state leaf water model; our treatment in ISOLSMfollows closely from their work, and describes the change inleaf water d18O as an asymptotic approach to a steady statevalue. The nonsteady state leaf water d18O at time t (i.e.,d18Olw (t)) is calculated implicitly from the steady stateestimate (d18Olws(t)) and the nonsteady state d18Olw (i.e.,d18Olw (t � 1)) from the previous time step as follows:
d18Olw tð Þ ¼ e�Dtt d18Olw t � 1ð Þ þ 1� e
�Dtt
� �d18Olws tð Þ: ð2Þ
Here, t is the leaf water time constant (s) and in practice Dtis the model time step (s). t is calculated separately for sunand shade leaves as the ratio between the leaf stock of waterinteracting with transpiration (Ml) and the gross water vaporflux out of leaves:
t ¼ Ml
eiRTv
� �gs
: ð3Þ
Here, R is the universal gas constant (8.314 J mol�1 K�1), Tvis vegetation temperature (K), and gs is stomatal conductance(sun or shade leaf, m s�1). The leaf water content,Ml, of bothsun and shade leaves is set to a constant value of 10 mol m�2,which is consistent with limited available observations from atemperate needleleaf forest [Seibt et al., 2006] and a tropicalbroadleaf forest [Forstel, 1978]. In reality, the water contentof the average shade leaf is undoubtedly different from theaverage sun leaf, since there are well-known differences inspecific leaf area between sun and shade leaves [Chapin et al.,2002; Larcher, 2003]. However, we lacked data to reliably
Figure 6. (a) Modeled gross LUE (mol CO2 mol�1 APAR)in the broadleaf deciduous tree canopy plotted againstobserved RD/RS during daylight hours (solar angles >15�).(b) Modeled C4 grass canopy gross LUE (mol CO2 mol�1
APAR) plotted against observed RD/RS during daylighthours.
G01018 STILL ET AL.: CLOUDS AND CO18O EXCHANGES
8 of 17
G01018
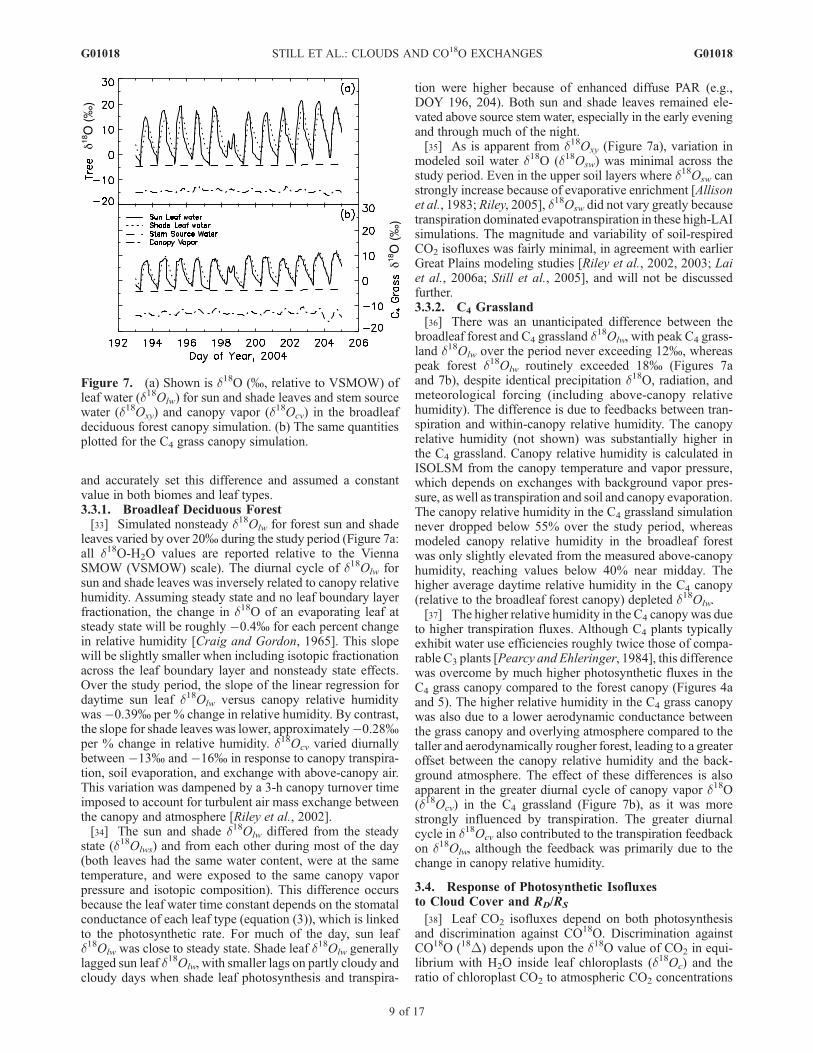
and accurately set this difference and assumed a constantvalue in both biomes and leaf types.3.3.1. Broadleaf Deciduous Forest[33] Simulated nonsteady d18Olw for forest sun and shade
leaves varied by over 20% during the study period (Figure 7a:all d18O-H2O values are reported relative to the ViennaSMOW (VSMOW) scale). The diurnal cycle of d18Olw forsun and shade leaves was inversely related to canopy relativehumidity. Assuming steady state and no leaf boundary layerfractionation, the change in d18O of an evaporating leaf atsteady state will be roughly �0.4% for each percent changein relative humidity [Craig and Gordon, 1965]. This slopewill be slightly smaller when including isotopic fractionationacross the leaf boundary layer and nonsteady state effects.Over the study period, the slope of the linear regression fordaytime sun leaf d18Olw versus canopy relative humiditywas�0.39% per % change in relative humidity. By contrast,the slope for shade leaves was lower, approximately�0.28%per % change in relative humidity. d18Ocv varied diurnallybetween �13% and �16% in response to canopy transpira-tion, soil evaporation, and exchange with above-canopy air.This variation was dampened by a 3-h canopy turnover timeimposed to account for turbulent air mass exchange betweenthe canopy and atmosphere [Riley et al., 2002].[34] The sun and shade d18Olw differed from the steady
state (d18Olws) and from each other during most of the day(both leaves had the same water content, were at the sametemperature, and were exposed to the same canopy vaporpressure and isotopic composition). This difference occursbecause the leaf water time constant depends on the stomatalconductance of each leaf type (equation (3)), which is linkedto the photosynthetic rate. For much of the day, sun leafd18Olw was close to steady state. Shade leaf d18Olw generallylagged sun leaf d18Olw, with smaller lags on partly cloudy andcloudy days when shade leaf photosynthesis and transpira-
tion were higher because of enhanced diffuse PAR (e.g.,DOY 196, 204). Both sun and shade leaves remained ele-vated above source stem water, especially in the early eveningand through much of the night.[35] As is apparent from d18Oxy (Figure 7a), variation in
modeled soil water d18O (d18Osw) was minimal across thestudy period. Even in the upper soil layers where d18Osw canstrongly increase because of evaporative enrichment [Allisonet al., 1983; Riley, 2005], d18Osw did not vary greatly becausetranspiration dominated evapotranspiration in these high-LAIsimulations. The magnitude and variability of soil-respiredCO2 isofluxes was fairly minimal, in agreement with earlierGreat Plains modeling studies [Riley et al., 2002, 2003; Laiet al., 2006a; Still et al., 2005], and will not be discussedfurther.3.3.2. C4 Grassland[36] There was an unanticipated difference between the
broadleaf forest and C4 grassland d18Olw, with peak C4 grass-
land d18Olw over the period never exceeding 12%, whereaspeak forest d18Olw routinely exceeded 18% (Figures 7aand 7b), despite identical precipitation d18O, radiation, andmeteorological forcing (including above-canopy relativehumidity). The difference is due to feedbacks between tran-spiration and within-canopy relative humidity. The canopyrelative humidity (not shown) was substantially higher inthe C4 grassland. Canopy relative humidity is calculated inISOLSM from the canopy temperature and vapor pressure,which depends on exchanges with background vapor pres-sure, as well as transpiration and soil and canopy evaporation.The canopy relative humidity in the C4 grassland simulationnever dropped below 55% over the study period, whereasmodeled canopy relative humidity in the broadleaf forestwas only slightly elevated from the measured above-canopyhumidity, reaching values below 40% near midday. Thehigher average daytime relative humidity in the C4 canopy(relative to the broadleaf forest canopy) depleted d18Olw.[37] The higher relative humidity in the C4 canopy was due
to higher transpiration fluxes. Although C4 plants typicallyexhibit water use efficiencies roughly twice those of compa-rable C3 plants [Pearcy and Ehleringer, 1984], this differencewas overcome by much higher photosynthetic fluxes in theC4 grass canopy compared to the forest canopy (Figures 4aand 5). The higher relative humidity in the C4 grass canopywas also due to a lower aerodynamic conductance betweenthe grass canopy and overlying atmosphere compared to thetaller and aerodynamically rougher forest, leading to a greateroffset between the canopy relative humidity and the back-ground atmosphere. The effect of these differences is alsoapparent in the greater diurnal cycle of canopy vapor d18O(d18Ocv) in the C4 grassland (Figure 7b), as it was morestrongly influenced by transpiration. The greater diurnalcycle in d18Ocv also contributed to the transpiration feedbackon d18Olw, although the feedback was primarily due to thechange in canopy relative humidity.
3.4. Response of Photosynthetic Isofluxesto Cloud Cover and RD/RS
[38] Leaf CO2 isofluxes depend on both photosynthesisand discrimination against CO18O. Discrimination againstCO18O (18D) depends upon the d18O value of CO2 in equi-librium with H2O inside leaf chloroplasts (d18Oc) and theratio of chloroplast CO2 to atmospheric CO2 concentrations
Figure 7. (a) Shown is d18O (%, relative to VSMOW) ofleaf water (d18Olw) for sun and shade leaves and stem sourcewater (d18Oxy) and canopy vapor (d18Ocv) in the broadleafdeciduous forest canopy simulation. (b) The same quantitiesplotted for the C4 grass canopy simulation.
G01018 STILL ET AL.: CLOUDS AND CO18O EXCHANGES
9 of 17
G01018
(Cc/Ca). Gaseous CO2 equilibrates with liquid water in themesophyll cells lining the bottom of the stomatal pore via theactivity of the carbonic anhydrase enzyme. This equilibrationlabels CO2 with the isotopic signature of leaf water plus anequilibrium offset [Farquhar and Lloyd, 1993; Farquharet al., 1993; Gillon and Yakir, 2000; Affek et al., 2005], andhas been shown to be lower in C4 grasses [Gillon and Yakir,2001]. The discrimination can be estimated as [Farquhar andLloyd, 1993;Farquhar et al., 1993;Ciais et al., 1997a;Gillonand Yakir, 2000; Yakir and Sternberg, 2000]
18D ¼ ed þCc
Ca � Cc
d18Oc � d18Oa
� �: ð4Þ
ed is the weighted kinetic fractionation accompanying diffu-sion of CO18O molecules across the stomata, boundary layer,and the mesophyll walls (�7.4% [Farquhar and Lloyd,1993; Gillon and Yakir, 2001]), d18Oc is calculated fromd18Olw and a temperature-dependent fractionation factor[Brenninkmeier et al., 1983], and d18Oa is the d
18O value of
background atmospheric CO2. TheCc
Ca�Ccterm arises from
mass balance of CO18O molecules, and when multipliedby net leaf uptake, quantifies the back diffusion or retro-diffusion flux of CO2 molecules, which have a different d18Ofrom when they entered the leaf. This change occurs becauseonly some of the CO2 entering the leaf is fixed by photo-synthesis, while the remainder diffuses out after full or partialisotopic equilibration with leaf water [Farquhar et al., 1993;Flanagan et al., 1994; Gillon and Yakir, 2001].[39] These bidirectional fluxes, termed Fal (atmosphere-to-
leaf) and Fla (leaf-to-atmosphere), together sum to net pho-tosynthesis, Anet (which includes leaf respiration). Each ofthese global fluxes (roughly 300 and 200 Pg C a�1 for Fal
and Fla, respectively [Ciais et al., 1997a]) is larger than anyother carbon flux term in the contemporary carbon budget.Equation (4) can be recast as a function of Fal and Fla:
18D ¼ Fla
Anet
d18Oc � ed � d18Oa
� �þ Fal
Anet
ed : ð5Þ
[40] The first, right-hand side term captures the effectivediscrimination associated with the return, or retro-diffused,flux from leaves, and its sign and magnitude vary directlywith changes in d18Oc. The combined net photosyntheticisoflux, in units of mmol % m�2 s�1, is the product ofphotosynthetic discrimination (18D) and net leaf photosyn-thesis (Anet):
Anet18D ¼ Fla d18Oc � ed � d18Oa
� �þ Faled ¼18Fla þ18Fal:
ð6Þ
[41] Bidirectional CO2 isofluxes across leaf stomata canoccur during nighttime periods [e.g., Cernusak et al., 2004;Barbour et al., 2007]. Although this effect is potentiallyimportant, accurate quantification requires a model with acanopy air space and prognostic calculations of CO2 andCO18O concentrations throughout the night [e.g., Seibt et al.,2006], along with a model that accurately predicts stomatalconductance and the concentration of CO2 in the substomatal
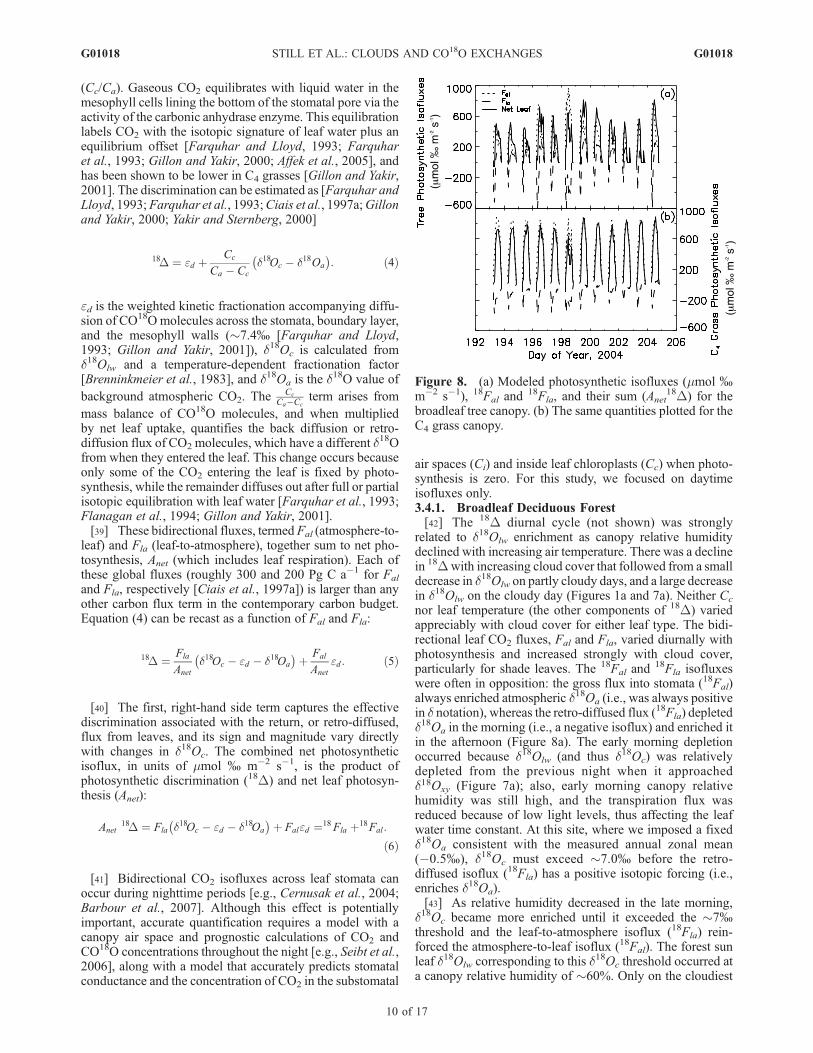
air spaces (Ci) and inside leaf chloroplasts (Cc) when photo-synthesis is zero. For this study, we focused on daytimeisofluxes only.3.4.1. Broadleaf Deciduous Forest[42] The 18D diurnal cycle (not shown) was strongly
related to d18Olw enrichment as canopy relative humiditydeclined with increasing air temperature. There was a declinein 18Dwith increasing cloud cover that followed from a smalldecrease in d18Olw on partly cloudy days, and a large decreasein d18Olw on the cloudy day (Figures 1a and 7a). Neither Cc
nor leaf temperature (the other components of 18D) variedappreciably with cloud cover for either leaf type. The bidi-rectional leaf CO2 fluxes, Fal and Fla, varied diurnally withphotosynthesis and increased strongly with cloud cover,particularly for shade leaves. The 18Fal and
18Fla isofluxeswere often in opposition: the gross flux into stomata (18Fal)always enriched atmospheric d18Oa (i.e., was always positivein d notation), whereas the retro-diffused flux (18Fla) depletedd18Oa in the morning (i.e., a negative isoflux) and enriched itin the afternoon (Figure 8a). The early morning depletionoccurred because d18Olw (and thus d18Oc) was relativelydepleted from the previous night when it approachedd18Oxy (Figure 7a); also, early morning canopy relativehumidity was still high, and the transpiration flux wasreduced because of low light levels, thus affecting the leafwater time constant. At this site, where we imposed a fixedd18Oa consistent with the measured annual zonal mean(�0.5%), d18Oc must exceed �7.0% before the retro-diffused isoflux (18Fla) has a positive isotopic forcing (i.e.,enriches d18Oa).[43] As relative humidity decreased in the late morning,
d18Oc became more enriched until it exceeded the �7%threshold and the leaf-to-atmosphere isoflux (18Fla) rein-forced the atmosphere-to-leaf isoflux (18Fal). The forest sunleaf d18Olw corresponding to this d18Oc threshold occurred ata canopy relative humidity of �60%. Only on the cloudiest
Figure 8. (a) Modeled photosynthetic isofluxes (mmol %m�2 s�1), 18Fal and
18Fla, and their sum (Anet18D) for the
broadleaf tree canopy. (b) The same quantities plotted for theC4 grass canopy.
G01018 STILL ET AL.: CLOUDS AND CO18O EXCHANGES
10 of 17
G01018

and coolest day (DOY 198) did d18Olw stay below this valuethroughout the day (Figures 7a and 8a). The greatest d18Olw
enrichment occurred on the sunniest, hottest day when can-opy relative humidity was lowest (DOY 202), and 18Fla wasmostly positive. Because of high leaf temperatures on DOY202, however, Anet and net leaf isofluxes (Anet
18D or 18Fal +18Fla) were lowest of the study period.[44] If d18Olw and d18Oc are sufficiently negative, the net
leaf isoflux can deplete d18Oa. The d18Oc where negative net
photosynthetic isotope fluxes (18Fal +18Fla < 0) occur is a
function of d18Oa, the Cc/Ca ratio, and ed. d18Oc values more
depleted than approximately �4.2% caused net forest pho-tosynthetic isofluxes to be negative. During the 12-day studyperiod, negative CO2 isofluxes occurred only briefly onDOY 193 when d18Olw approached d18Oxy and photosynthe-sis was just beginning (Figure 8a). Because the d18O ofgrowing season precipitation is rarely more depleted than�5% at these latitudes [Welker, 2000; Bowen and Wilkinson,2002], forest photosynthetic isofluxes will almost alwaysenrich d18Oa. At higher latitudes where precipitation d18O islower, leaf CO2 isofluxes can deplete d18Oa [e.g., Franceyand Tans, 1987; Farquhar et al., 1993; Ciais et al., 1997b],because of 18Fla outweighing
18Fal.[45] The net photosynthetic isoflux (Anet
18D, solid line inFigure 8a) generally followed the daily variations in canopyphotosynthesis (Figure 4a), with larger isofluxes on partlycloudy days (DOY 196–197, 199, 204) than on clear, sunnydays (DOY 193–195, 201–203), an effect driven by shadeleaves. However, the cloudy day (DOY 198) exhibitedintermediate CO2 isofluxes: although it had the largest peakphotosynthesis, this was countered by the lowest d18Olw and18D of the study period (Figures 4a, 7a, and 8a). Partitioningthe net leaf isoflux (Anet
18D) into 18Fal and18Fla (equation
(6)) reveals the canopy response to cloud cover in moredetail. The 18Fal isoflux increased strongly with increasingcloud cover because of an increase in shade leaf and canopyphotosynthesis with cloud cover. By contrast, 18Fla did notexhibit a strong relationship with cloud cover during daytimehours of the study period. Indeed, both negative and positive18Fla values occurred for a range of cloud cover, as d18Olw
and thus d18Oc alternated from relatively depleted values inthe morning to enriched values in the afternoon after theycrossed the �7.0% threshold. Thus, for the sum of 18Fal and18Fla (i.e., Anet
18D), no clear response to cloud cover oc-curred. When net photosynthetic isofluxes are plotted againstRD/RS, however, there was a weak negative relationship, withthe highest isofluxes centered at an RD of �0.4. This wasdriven by 18Fla, which peaked around this value in oursimulations; at RD/RS values above �0.6, 18Fla was alwaysnegative. The peak isoflux at an RD/RS of 0.4 was not drivensolely by photosynthetic responses to diffuse irradiance, aspeak canopy photosynthesis occurred at higher RD/RS values.Rather, it was the combination of enhanced photosynthesiswith higher d18Olw due to lower canopy relative humidity atthis particular RD/RS. These conditions occurred aroundmidday on the partly cloudy days (DOY 196, 199, 204) thathave the largest peak and cumulative daily isofluxes.3.4.2. C4 Grassland[46] There were large differences in leaf isofluxes between
the forest and C4 grassland simulations that arose fromdifferences in the internal CO2 concentrations between thesedifferent physiological types, as well as differences in their
d18Oc values (section 3.3). Comparing chloroplast CO2
concentrations between C3 and C4 plants is difficult since theC4 pathway concentrates CO2 around Rubisco in the bundlesheath cell chloroplasts, and raises CO2 concentrations tomuch higher levels than occur in mesophyll cell chloroplastsof C3 plants [von Caemmerer and Furbank, 2003]. For thesesimulations, we used the Ci value calculated in ISOLSM.Typical Ci/Ca ratios for C4 plants range from 0.2 to 0.4,whereas those for most C3 plants are 0.6–0.8 [Pearcy andEhleringer, 1984; Collatz et al., 1991, 1992]. At similarphotosynthetic rates, Fla can be much higher in C3 than C4
plants [Still et al., 2005; Hoag et al., 2005]. For example, aCi/Ca ratio of 0.8 produces a Fla four times larger than a ratioof 0.2 produces for the same net leaf flux.[47] The C4 grass photosynthetic isoflux, dominated by
18Fal from sun leaves, is almost always larger and lessvariable than the forest isoflux (Figure 8b). However, 18Fla
is smaller in the grass than in the forest, and it remainsnegative throughout the day and never reinforces 18Fal,except for three brief periods on DOY 199, 203, and 204(Figures 8a and 8b). This negative isotopic forcing on theatmosphere is due to the lower d18Olw (Figures 7a and 7b) andthe larger ed in the C4 grass simulation. d18Oc must exceed athreshold value of�7.9% before the 18Fla from C4 plants hasa positive isotopic forcing on the atmosphere. However,because leaf temperatures exceeded 30�C on the days withhighest d18Olw (DOY 199, 200, 202), and the CO2-H2Ofractionation has a sensitivity of�0.2%K�1 [Brenninkmeieret al., 1983; Ciais et al., 1997a], 18Fla is almost alwaysnegative during the study period (Figure 8b).[48] Because the magnitude of 18Fla will be much smaller
in C4 plants compared to C3 plants because of lower Ci/Ca
ratios [Still et al., 2005] and reduced equilibration betweenCO2 and H2O from lower carbonic anhydrase activity [Gillonand Yakir, 2001], photosynthesis by C4 plants will almostalways enrich d18Oa. The positive isotopic forcing associatedwith 18Fal will in almost every case be much larger than thenegative isotopic forcing from 18Fla. Because C4 plants arelargely restricted to tropical and subtropical savannas andgrasslands [Still et al., 2003], the d18O of precipitation andthus of plant xylem water (d18Oxy), is relatively enriched[Bowen and Wilkinson, 2002]. For example, Ometto et al.[2005] measured Amazonian C4 pasture grasses with d18Oxy
values between �3% and �9%, and mean values around�5%. These values, and measurements from C4-dominatedtallgrass prairies in Oklahoma and Kansas [Helliker et al.,2002; Riley et al., 2003; Lai et al., 2006b], are similar to themean predicted d18Oxy at our site (Figure 7). Given a typicalmidday C4 plant Ci/Ca ratio of 0.3 and assuming completeequilibration, d18Oc at this site would have to be belowapproximately �17.3% for net C4 photosynthetic isofluxesto deplete d18Oa. Using precipitation d18O regressions fromBowen and Wilkinson [2002], d18Olw and thus d18Oc valuesthat are sufficiently depleted occur above �60�N. AlthoughC4 plants do grow north of 50� N [e.g., Schwarz andRedmann, 1988; Beale and Long, 1995], they are uncommonand do not substantially affect regional carbon fluxes.[49] While C4 canopy photosynthesis decreased slightly
with increasing cloud cover, net photosynthetic isofluxes(Anet
18D) exhibited no clear relationship with cloud cover.18D did not vary with cloud cover, as an increase in the Fal
component of 18D due to an increase in Cc with cloud cover
G01018 STILL ET AL.: CLOUDS AND CO18O EXCHANGES
11 of 17
G01018
was countered by a decrease in the Fla component of 18Ddriven by the slight decrease of d18Olw and d18Oc with cloudcover. Over the study period, the flux-weighted mean C4
grassland canopy 18Dwas�12%, with�2/3 of this from ed.There was a weak negative response of Anet
18D to increasingRD/RS, just as there was between C4 canopy photosynthesisand RD/RS. In both cases, peak uptake occurred at RD/RS
values between 0.2 and 0.4, and declined sharply above 0.4.There was a strong positive relationship (slope = 0.46; r2 =0.89) between the net C4 photosynthetic isoflux and incidentPAR (i.e., the canopy isotope light response curve; Figure 9).
3.5. Sensitivity to Leaf Area Index
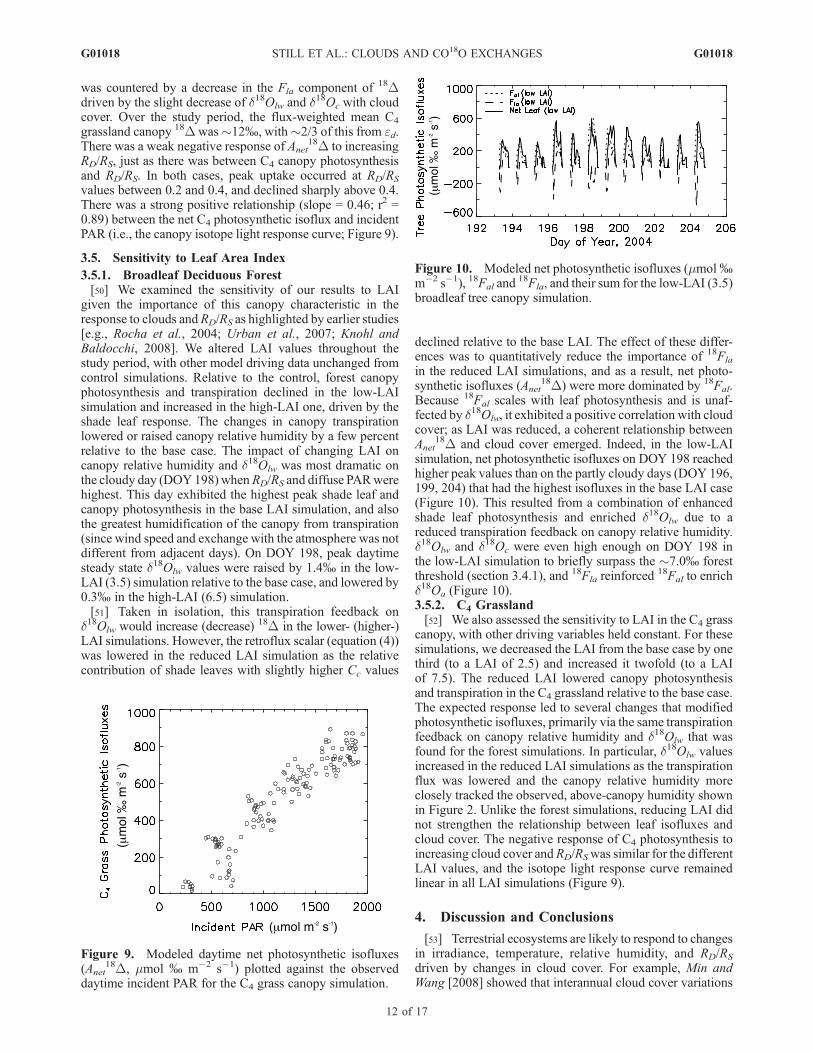
3.5.1. Broadleaf Deciduous Forest[50] We examined the sensitivity of our results to LAI
given the importance of this canopy characteristic in theresponse to clouds andRD/RS as highlighted by earlier studies[e.g., Rocha et al., 2004; Urban et al., 2007; Knohl andBaldocchi, 2008]. We altered LAI values throughout thestudy period, with other model driving data unchanged fromcontrol simulations. Relative to the control, forest canopyphotosynthesis and transpiration declined in the low-LAIsimulation and increased in the high-LAI one, driven by theshade leaf response. The changes in canopy transpirationlowered or raised canopy relative humidity by a few percentrelative to the base case. The impact of changing LAI oncanopy relative humidity and d18Olw was most dramatic onthe cloudy day (DOY 198) whenRD/RS and diffuse PARwerehighest. This day exhibited the highest peak shade leaf andcanopy photosynthesis in the base LAI simulation, and alsothe greatest humidification of the canopy from transpiration(since wind speed and exchange with the atmosphere was notdifferent from adjacent days). On DOY 198, peak daytimesteady state d18Olw values were raised by 1.4% in the low-LAI (3.5) simulation relative to the base case, and lowered by0.3% in the high-LAI (6.5) simulation.[51] Taken in isolation, this transpiration feedback on
d18Olw would increase (decrease) 18D in the lower- (higher-)LAI simulations. However, the retroflux scalar (equation (4))was lowered in the reduced LAI simulation as the relativecontribution of shade leaves with slightly higher Cc values
declined relative to the base LAI. The effect of these differ-ences was to quantitatively reduce the importance of 18Fla
in the reduced LAI simulations, and as a result, net photo-synthetic isofluxes (Anet
18D) were more dominated by 18Fal.Because 18Fal scales with leaf photosynthesis and is unaf-fected by d18Olw, it exhibited a positive correlation with cloudcover; as LAI was reduced, a coherent relationship betweenAnet
18D and cloud cover emerged. Indeed, in the low-LAIsimulation, net photosynthetic isofluxes on DOY 198 reachedhigher peak values than on the partly cloudy days (DOY 196,199, 204) that had the highest isofluxes in the base LAI case(Figure 10). This resulted from a combination of enhancedshade leaf photosynthesis and enriched d18Olw due to areduced transpiration feedback on canopy relative humidity.d18Olw and d18Oc were even high enough on DOY 198 inthe low-LAI simulation to briefly surpass the �7.0% forestthreshold (section 3.4.1), and 18Fla reinforced
18Fal to enrichd18Oa (Figure 10).3.5.2. C4 Grassland[52] We also assessed the sensitivity to LAI in the C4 grass
canopy, with other driving variables held constant. For thesesimulations, we decreased the LAI from the base case by onethird (to a LAI of 2.5) and increased it twofold (to a LAIof 7.5). The reduced LAI lowered canopy photosynthesisand transpiration in the C4 grassland relative to the base case.The expected response led to several changes that modifiedphotosynthetic isofluxes, primarily via the same transpirationfeedback on canopy relative humidity and d18Olw that wasfound for the forest simulations. In particular, d18Olw valuesincreased in the reduced LAI simulations as the transpirationflux was lowered and the canopy relative humidity moreclosely tracked the observed, above-canopy humidity shownin Figure 2. Unlike the forest simulations, reducing LAI didnot strengthen the relationship between leaf isofluxes andcloud cover. The negative response of C4 photosynthesis toincreasing cloud cover andRD/RSwas similar for the differentLAI values, and the isotope light response curve remainedlinear in all LAI simulations (Figure 9).
4. Discussion and Conclusions
[53] Terrestrial ecosystems are likely to respond to changesin irradiance, temperature, relative humidity, and RD/RS
driven by changes in cloud cover. For example, Min andWang [2008] showed that interannual cloud cover variations
Figure 9. Modeled daytime net photosynthetic isofluxes(Anet
18D, mmol % m�2 s�1) plotted against the observeddaytime incident PAR for the C4 grass canopy simulation.
Figure 10. Modeled net photosynthetic isofluxes (mmol%m�2 s�1), 18Fal and
18Fla, and their sum for the low-LAI (3.5)broadleaf tree canopy simulation.
G01018 STILL ET AL.: CLOUDS AND CO18O EXCHANGES
12 of 17
G01018

drive interannual carbon fluxes in a temperate broadleafforest. Clouds influence other ecological processes like shootgrowth and reproduction [Graham et al., 2003], photo-synthesis of understory species [Johnson and Smith, 2006,2008], tree growth [Williams et al., 2008], and range bound-aries [Fischer et al., 2009]. At the leaf scale, diffuse light isused less efficiently for photosynthesis than direct light[Brodersen et al., 2008], whereas at the canopy scale, theopposite response is observed. Yakir and Israeli [1995]documented how artificially reducing irradiance reducedgrowth but increased 13C discrimination in an experimentalplantation; this result is buttressed by work showing thatincreasing RD/RS in a multilayer canopy model increasesCi/Ca and 13C discrimination [Knohl and Baldocchi, 2008].[54] Our results illustrate the myriad impacts that clouds
have on biosphere-atmosphere CO18O exchanges. We ex-amined a sequence of midsummer days in which the lightintercepted by the canopy varied from irradiance dominatedby direct beam radiation (sunny) to days with high totalirradiance but an increasing diffuse fraction (partly cloudy) todays in which almost all irradiance was diffuse (cloudy). Thisvariation allowed a detailed examination of the mechanismsthat drive ecosystem isotopic states and exchanges, and toexplore how ecological properties influence the mechanismsand responses. Although this study only examined a portionof the growing season, we can hypothesize that, whenintegrated to a larger scale, clouds have a substantial impacton biosphere-atmosphere CO18O exchanges through theirvaried impacts on direct and diffuse radiation, leaf tempera-ture, relative humidity, leaf water enrichment, and bidirec-tional leaf fluxes (Fal and Fla). These effects vary stronglywith canopy structure, LAI, precipitation d18O, and photo-synthetic pathway.[55] The forest canopy increased photosynthesis with
increasing cloud cover and RD/RS, whereas the C4 grasscanopy exhibited a negative response to both increasingcloud cover and RD/RS. The LUE of the forest canopy wasstrongly related to RD and leaf temperature, whereas the grasscanopy LUE was relatively insensitive to environmentalconditions. Compared to sunny conditions, the forest canopyexhibited larger photosynthetic isofluxes on partly cloudydays. The response of forest leaf isofluxes to cloud coverdepends strongly on LAI, primarily via a feedback of tran-spiration on canopy relative humidity and d18Olw. Whereasthe relationship between forest canopy photosynthesis andcloud cover (i.e., Figure 4b) became stronger with increas-ing LAI, the relationship between canopy photosyntheticisofluxes (Anet
18D) and cloud cover weakened with increas-ing LAI.[56] In contrast, photosynthesis and isofluxes in the C4
grass canopy declined with increasing cloud cover and RD/RS,regardless of LAI. This opposite response resulted primarilyfrom the lower effective shade leaf LAI in the lower-staturegrass canopy compared to the broadleaf forest, as well as thenear-constant light limitation on photosynthesis in C4 sun andshade leaves. These different responses represent a funda-mental functional distinction between these globally impor-tant vegetation types.[57] It is important to acknowledge some of the modeling
limitations in the work reported here. One deficiency is thelack of a separate energy balance and leaf temperature calcu-lation for shade leaves. High LAI values are not uncommon
in many forests, and the fraction of canopy photosynthesisattributable to shade leaves increases with LAI. An incorrectshade leaf temperature will impact canopy CO18O exchangesin several ways. First, d18Olw is sensitive to leaf temperaturebecause of its impact on the saturation vapor pressure insideleaves. Second, each 1�C increase in leaf temperature reducesthe equilibrium liquid-vapor fractionation by �0.07% fortypical ambient temperatures [Horita andWesolowski, 1994],and also reduces the equilibration fractionation between CO2
and H2O by �0.2% [Brenninkmeier et al., 1983]. Leaftemperature also influences the leaf surface relative humidityand stomatal conductance, which in turn impacts Ci andbidirectional CO2 fluxes across stomata. Finally, leaf tem-perature affects photosynthesis and respiration [Collatz et al.,1991, 1992]. However, we tested the sensitivity of our resultsby varying shade leaf temperature and found the impact to besmall (not shown).[58] We also tested the impact of varying photosynthetic
capacity (Vmax) between sun and shade leaves. When wehalved shade leaf Vmax in the forest simulation, there was nochange in shade leaf or total canopy photosynthesis, simplybecause shade leaf photosynthesis is always light limited.This prediction confirms the results of Leuning et al. [1995],who showed with a multilayer canopy model that totalphotosynthesis of shaded leaves is insensitive to the nitrogendistribution within a canopy. And, as shown by de Pury andFarquhar [1997], even with nitrogen and photosyntheticcapacity distributed between sun and shade leaves as afunction of optical depth in the canopy, the photosyntheticrate of shade leaves is always limited by light (i.e., by electrontransport rate) and not by Rubisco.[59] We contend that these model limitations have small
impacts on our conclusions.One could test this assumption byconducting similar site-scale analyses with a one-dimensional,multilayer canopy models that also included turbulent trans-port and leaf nitrogen variations within the canopy [e.g.,Baldocchi and Bowling, 2003; Knohl and Baldocchi, 2008].However, for predictions of the impact of cloudiness onecosystem-atmosphere CO18O exchanges at regional to globalscales, a sun/shade model like ISOLSM that has already beenintegrated into global climate models [Noone et al., 2004;Buenning et al., manuscript in preparation, 2009] is prefer-able for computational reasons.[60] Although the differences in the response to cloudiness
between C3 and C4 vegetation is largely due to differing Fal
and Fla and photosynthetic rates, there are additional phys-iological and anatomical differences that would furtherimpact CO18O exchanges that we did not consider. Thedifferences between forest and grassland isofluxes wouldhave been even larger if we had reduced the C4 grass carbonicanhydrase activity [Gillon and Yakir, 2001]. For the workpresented here we assumed complete equilibration betweenCO2 and d18Olw for both vegetation types, as we were inter-ested primarily in ecosystem responses to changes in cloudcover as mediated by canopy structure and photosyntheticpathway. Also, we lacked field data on equilibration in thisregion, and recent studies suggest conflicting results forassigning appropriate values in modeling studies. Gillonand Yakir [2001] suggest a mean equilibration value of0.4 for C4 grasses; recent work with C4 corn plants suggestsvalues closer to C3 plants [Affek et al., 2005]. Laboratorymeasurements with both wild-type and transgenic individuals
G01018 STILL ET AL.: CLOUDS AND CO18O EXCHANGES
13 of 17
G01018

of a C4 dicot also suggest higher values from in vitro carbonicanhydrase assays [Cousins et al., 2006]. Moreover, a recentphylogenetic analysis suggests that reduced carbonic anhy-drase activity may not be simply a trait of grasses with the C4
photosynthetic pathway, but may be more widespread amongtropical grass lineages, including several widespread andproductive C3 grass species [Edwards et al., 2007]. We alsodid not consider the large d18Olw enrichment observed alongleaf veins of C4 grasses [Helliker and Ehleringer, 2000],which can affect leaf CO18O fluxes.[61] This study demonstrates the complex responses of
terrestrial ecosystems to changes in cloud cover, particularlywith respect to oxygen isotope fluxes of CO2. The broadleafforest and C4 grassland are predicted to have fundamentallydifferent responses to changes in cloud cover. Our findingsalso identify a potentially important feedback of transpirationon canopy relative humidity, d18Ocv, and d
18Olw, and thus onleaf-to-atmosphere CO2 isofluxes. We believe that some ofthe unexplained variation in d18Oa is driven by changes inclouds given the strong responses we show here and decadal-scale changes in cloud cover and aerosols observed in manylocations.
[62] Acknowledgments. We gratefully acknowledge support from theNOAA Climate Program Office (grant NA03OAR4310059). Data wereobtained from the Atmospheric Radiation Measurement program sponsoredby the U.S. Department of Energy, Office of Science, Office of Biologicaland Environmental Research, Environmental Sciences Division. We alsoacknowledge meteorological data support provided by the Oklahoma andKansas Mesonet program. The U.S. Network for Isotopes in Precipitation(http://www.uaa.alaska.edu/enri/usnip/index.cfm) contributed d18O data forour simulations and was supported in part by NSF Earth System Historyprogram (0080952). Comments from anonymous reviewers and the asso-ciate editor improved the manuscript.
ReferencesAckerman, T. P., and G. Stokes (2003), The Atmospheric Radiation Mea-surement program, Phys. Today, 56, 38–45, doi:10.1063/1.1554135.
Affek, H. P., M. J. Krisch, and D. Yakir (2005), Effects of intraleaf varia-tions in carbonic anhydrase activity and gas exchange on leaf C18OOisoflux in Zea mays, New Phytol., 169(2), 321–329, doi:10.1111/j.1469-8137.2005.01603.x.
Allison, G. B., C. J. Barnes, and M. W. Hughes (1983), The distribution ofdeuterium and 18O in dry soils 2. Experimental, J. Hydrol., 64(1–4),377–397, doi:10.1016/0022-1694(83)90078-1.
Alton, P. B., P. North, J. Kaduk, and S. Los (2005), Radiative transfermodeling of direct and diffuse sunlight in a Siberian pine forest,J. Geophys. Res., 110, D23209, doi:10.1029/2005JD006060.
Aranibar, J. N., et al. (2006), Combining meteorology, eddy fluxes, isotopemeasurements, and modeling to understand environmental controls ofcarbon isotope discrimination at the canopy scale, Global Change Biol.,12, 710–730, doi:10.1111/j.1365-2486.2006.01121.x.
Asner, G. P., et al. (2003), Global synthesis of leaf area index observations:Implications for ecological and remote sensing studies, Global Ecol.Biogeogr., 12(3), 191–205, doi:10.1046/j.1466-822X.2003.00026.x.
Baldocchi, D. D., and D. R. Bowling (2003), Modelling the discriminationof 13CO2 above and within a temperate broad-leaved forest canopy onhourly to seasonal time scales, Plant Cell Environ., 26, 231 –244,doi:10.1046/j.1365-3040.2003.00953.x.
Barbour, M. M., J. S. Roden, G. D. Farquhar, and J. R. Ehleringer (2004),Expressing leaf water and cellulose oxygen isotope ratios as enrichmentabove source water reveals evidence of a Peclet effect, Oecologia,138(3), 426–435, doi:10.1007/s00442-003-1449-3.
Barbour, M. M., et al. (2007), A new measurement technique reveals tem-poral variation in d18O of leaf-respired CO2, Plant Cell Environ., 30,456–468, doi:10.1111/j.1365-3040.2007.01633.x.
Beale, C. V., and S. P. Long (1995), Can perennial C4 grasses attain highefficiencies of radiant energy conversion in cool climates?, Plant CellEnviron., 18, 641–650, doi:10.1111/j.1365-3040.1995.tb00565.x.
Betts, A. K., and J. H. Ball (1998), FIFE surface climate and site-averagedataset 1987–89, J. Atmos. Sci., 55(7), 1091–1108, doi:10.1175/1520-0469(1998)055<1091:FSCASA>2.0.CO;2.
Bonan, G. B. (1994), Comparison of two land surface process models usingprescribed forcings, J. Geophys. Res., 99, 25,803–25,818, doi:10.1029/94JD02188.
Bonan, G. (1996), A land surface model (LSM version 1.0) for ecological,hydrological, and atmospheric studies: Technical description and user’sguide, Tech. Note TN-417+STR, Natl. Cent. for Atmos. Res., Boulder,Colo.
Bonan, G. B., K. J. Davis, D. Baldocchi, D. Fitzjarrald, and H. Neumann(1997), Comparison of the NCAR LSM1 land surface model withBOREAS aspen and jack pine tower fluxes, J. Geophys. Res., 102,29,065–29,076, doi:10.1029/96JD03095.
Bowen, G. J., and B. Wilkinson (2002), Spatial distribution of d18O inmeteoric precipitation, Geology, 30(4), 315–318, doi:10.1130/0091-7613(2002)030<0315:SDOOIM>2.0.CO;2.
Brenninkmeier, C., K. Kraft, and W. Mook (1983), Oxygen isotope fraction-ation between CO2 and H2O, Isot. Geosci., 1, 181–190.
Brodersen, C. R., T. C. Vogelmann, W. E. Williams, and H. L. Gorton(2008), A new paradigm in leaf-level photosynthesis: Direct and diffuselights are not equal, Plant Cell Environ., 31, 159–164.
Campbell, J. L., S. Burrows, S. T. Gower, and W. B. Cohen (1999), Big-Foot: Characterizing land cover, LAI, and NPP at the landscape scale forEOS/MODIS validation. Field manual 2.1, Publ. 4937, Environ. Sci.Div., Oak Ridge Natl. Lab., Oak Ridge, Tenn.
Cappa, C. D., M. B. Hendricks, D. J. DePaolo, and R. C. Cohen (2003),Isotopic fractionation of water during evaporation, J. Geophys. Res.,108(D16), 4525, doi:10.1029/2003JD003597.
Cernusak, L. A., J. S. Pate, and G. D. Farquhar (2002), Diurnal variation inthe stable isotope composition of water and dry matter in fruiting Lupinusangustifolius under field conditions, Plant Cell Environ., 25, 893–907,doi:10.1046/j.1365-3040.2002.00875.x.
Cernusak, L. A., G. D. Farquhar, S. C. Wong, and H. Stuart-Williams(2004), Measurement and interpretation of the oxygen isotope composi-tion of carbon dioxide respired by leaves in the dark, Plant Physiol., 136,3350–3363, doi:10.1104/pp.104.040758.
Cernusak, L. A., G. D. Farquhar, and J. S. Pate (2005), Environmental andphysiological controls over oxygen and carbon isotope composition ofTasmanian blue gum, Eucalyptus globulus, Tree Physiol., 25, 129–146.
Chapin, F. S., III, P. A. Matson, and H. A. Mooney (2002), Principles ofTerrestrial Ecosystem Ecology, 436 pp., Springer, New York.
Choudhury, B. J. (2001), Modeling radiation- and carbon-use efficienciesof maize, sorghum, and rice, Agric. For. Meteorol., 106, 317–330,doi:10.1016/S0168-1923(00)00217-3.
Ciais, P., P. P. Tans, M. Trolier, J. W. C. White, and R. J. Francey (1995), Alarge Northern Hemisphere terrestrial CO2 sink indicated by the 13C/12Cratio of atmospheric CO2, Science, 269, 1098 –1102, doi:10.1126/science.269.5227.1098.
Ciais, P., et al. (1997a), A three-dimensional synthesis study of d18O inatmospheric CO2: 1. Surface fluxes, J. Geophys. Res., 102, 5857–5872,doi:10.1029/96JD02360.
Ciais, P., et al. (1997b), A three-dimensional synthesis study of d18O inatmospheric CO2: 2. Simulations with the TM2 transport model,J. Geophys. Res., 102, 5873–5883, doi:10.1029/96JD02361.
Collatz, G. J., et al. (1991), Physiological and environmental regulation ofstomatal conductance, photosynthesis and transpiration: A model thatincludes a laminar boundary layer, Agric. For. Meteorol., 54, 107–136,doi:10.1016/0168-1923(91)90002-8.
Collatz, G. J., et al. (1992), Coupled photosynthesis-stomatal conductancemodel for leaves of C4 plants, Aust. J. Plant Physiol., 19, 519–538.
Collatz, G. J., J. A. Berry, and J. S. Clark (1998), Effects of climate andatmospheric CO2 partial pressure on the global distribution of C4 grasses:Present, past, and future, Oecologia, 114(4), 441–454, doi:10.1007/s004420050468.
Cooley, H. S., W. J. Riley, M. S. Torn, and Y. He (2005), Impact ofagricultural practice on regional climate in a coupled land surface meso-scale model, J. Geophys. Res., 110, D03113, doi:10.1029/2004JD005160.
Cousins, A. B., M. R. Badger, and S. von Caemmerer (2006), A transgenicapproach to understanding the influence of carbonic anhydrase on C18OOdiscrimination during photosynthesis, Plant Physiol., 142, 662–672,doi:10.1104/pp.106.085167.
Craig, H., and L. Gordon (1965), Deuterium and oxygen-18 variations inthe ocean and the marine atmosphere, paper presented at Stable Isotopesin Oceanographic Studies and Paleotemperatures, Cons. Naz. delle Ric.Lab. di Geol. Nucl., Spoleto, Italy.
Cuntz, M., P. Ciais, G. Hoffmann, and W. Knorr (2003a), A comprehensiveglobal three-dimensional model of d18O in atmospheric CO2: 1. Valida-tion of surface processes, J. Geophys. Res., 108(D17), 4527, doi:10.1029/2002JD003153.
Cuntz, M., P. Ciais, G. Hoffmann, C. E. Allison, R. J. Francey, W. Knorr,P. P. Tans, J. W. C. White, and I. Levin (2003b), A comprehensive globalthree-dimensional model of d18O in atmospheric CO2: 2. Mapping the
G01018 STILL ET AL.: CLOUDS AND CO18O EXCHANGES
14 of 17
G01018

atmospheric signal, J. Geophys. Res., 108(D17), 4528, doi:10.1029/2002JD003154.
Dai, A., K. E. Trenberth, and T. R. Karl (1999), Effects of clouds, soilmoisture, precipitation, and water vapor on diurnal temperature range,J. Clim., 12, 2451– 2473, doi:10.1175/1520-0442(1999)012<2451:EOCSMP>2.0.CO;2.
de Pury, D. G. G., and G. D. Farquhar (1997), Simple scaling of photo-synthesis from leaves to canopies, Plant Cell Environ., 20, 537–557,doi:10.1111/j.1365-3040.1997.00094.x.
Dickinson, R. (1983), Land surface processes and climate-surface albedosand energy balance, Adv. Geophys., 25, 305–353.
Dong, X., B. Xi, and P. Minnis (2006), Observational evidence of changesin water vapor, clouds, and radiation at the ARM SGP site, Geophys. Res.Lett., 33, L19818, doi:10.1029/2006GL027132.
Dongmann, G., H. W. Nurnberg, H. Forstel, and K. Wagener (1974), On theenrichment of H2
18O in the leaves of transpiring plants, Radiat. Environ.Biophys., 11, 41–52, doi:10.1007/BF01323099.
Edwards, E. J., C. J. Still, and M. J. Donoghue (2007), The relevanceof phylogeny to studies of global change, Trends Ecol. Evol., 22(5),243–249, doi:10.1016/j.tree.2007.02.002.
Ehleringer, J. R., T. E. Cerling, and B. R. Helliker (1997), C4 photosynth-esis, atmospheric CO2, and climate, Oecologia, 112(3), 285 – 299,doi:10.1007/s004420050311.
Evans, J. R., and F. Loreto (2000), Acquisition and diffusion of CO2 inhigher plant leaves, in Photosynthesis: Physiology and Metabolism, editedby R. C. Leegood, T. D. Sharkey, and S. von Caemmerer, pp. 321–351,Kluwer Acad, Dordrecht, Netherlands.
Farquhar, G. D., and L. A. Cernusak (2005), On the isotopic composition ofleaf water in the non-steady state, Funct. Plant Biol., 32(4), 293–303,doi:10.1071/FP04232.
Farquhar, G. D., and J. Lloyd (1993), Carbon and oxygen isotope effects inthe exchange of carbon dioxide between plants and the atmosphere, inStable Isotopes and Plant Carbon-Water Relations, edited by J. R. Ehleringer,A. E. Hall, and G. D. Farquhar, pp. 47–70, Academic, New York.
Farquhar, G. D., S. von Caemmerer, and J. A. Berry (1980), A biochemicalmodel of photosynthetic CO2 assimilation in leaves of C3 species, Planta,149(1), 78–90, doi:10.1007/BF00386231.
Farquhar, G. D., J. R. Ehleringer, and K. T. Hubick (1989), Carbon isotopediscrimination and photosynthesis, Annu. Rev. Plant Physiol. Plant Mol.Biol., 40, 503–537, doi:10.1146/annurev.pp.40.060189.002443.
Farquhar, G. D., et al. (1993), Vegetation effects on the isotope compositionof oxygen in atmospheric CO2, Nature, 363, 439–443, doi:10.1038/363439a0.
Field, C. B., et al. (1998), Primary production of the biosphere: Integratingterrestrial and oceanic components, Science, 281, 237–240, doi:10.1126/science.281.5374.237.
Fischer, D. T., C. J. Still, and A. P. Williams (2009), Significance of sum-mer fog and overcast for drought stress and ecological functioning ofcoastal California endemic plant species, J. Biogeogr., in press.
Flanagan, L. B. (2005), Ecosystem CO2 exchange and variation in the d18Oof atmospheric CO2, in Stable Isotopes and Biosphere-Atmosphere Inter-actions, Physiological Ecology, edited by L. B. Flanagan, J. R. Ehleringer,and D. E. Pataki, pp. 171–181, Elsevier, San Diego, Calif.
Flanagan, L. B., et al. (1994), Effect of changes in leaf water oxygenisotopic composition on discrimination against O18O16 during photosyn-thetic gas exchange, Aust. J. Plant Physiol., 21, 221–234.
Forstel, H. (1978), The enrichment of 18O in leaf water under natural con-ditions, Radiat. Environ. Biophys., 15, 323–344, doi:10.1007/BF01323459.
Francey, R. J., and P. P. Tans (1987), Latitudinal variation in oxygen-18 ofatmospheric CO2, Nature, 327, 495–497, doi:10.1038/327495a0.
Freedman, J. M., D. R. Fitzjarrald, K. E. Moore, and R. K. Sakai (2001),Boundary layer clouds and vegetation-atmosphere feedbacks, J. Clim., 14,180–197, doi:10.1175/1520-0442(2001)013<0180:BLCAVA>2.0.CO;2.
Friedli, H., U. Siegenthaler, D. Rauber, and H. Oeschger (1987), Measure-ments of concentration, 13C/12C and 18O/16O ratios of tropospheric car-bon dioxide over Switzerland, Tellus, Ser. B, 39, 80–88.
Fung, I., et al. (1997), Carbon 13 exchanges between the atmosphere andbiosphere, Global Biogeochem. Cycles, 11, 507 –533, doi:10.1029/97GB01751.
Gillon, J. S., and D. Yakir (2000), Naturally low carbonic anhydrase activityin C4 and C3 plants limits discrimination against C18OO during photo-synthesis, Plant Cell Environ., 23, 903 – 915, doi:10.1046/j.1365-3040.2000.00597.x.
Gillon, J., and D. Yakir (2001), Influence of carbonic anhydrase activity interrestrial vegetation on the 18O content of atmospheric CO2, Science,291, 2584–2587, doi:10.1126/science.1056374.
Gower, S. T., C. J. Kucharik, and J. M. Norman (1999), Direct and indirectestimation of leaf area index, fAPAR, and net primary production of ter-restrial ecosystems, Remote Sens. Environ., 70(1), 29–51, doi:10.1016/S0034-4257(99)00056-5.
Graham, E. A., S. S. Mulkey, K. Kitajima, N. G. Phillips, and S. J. Wright(2003), Cloud cover limits net CO2 uptake and growth of a rainforest treeduring tropical rainy seasons, Proc. Natl. Acad. Sci. U. S. A., 100, 572–576, doi:10.1073/pnas.0133045100.
Griffis, T. J., S. D. Sargent, J. M. Baker, X. Lee, B. D. Tanner, J. Greene,E. Swiatek, and K. Billmark (2008), Direct measurement of biosphere-atmosphere isotopic CO2 exchange using the eddy covariance technique,J. Geophys. Res., 113, D08304, doi:10.1029/2007JD009297.
Gu, L., H. H. Shugart, J. D. Fuentes, T. A. Black, and S. R. Shewchuk(1999), Micrometeorology, biophysical exchanges and NEE decomposi-tion in a two-story boreal forest—Development and test of an integratedmodel, Agric. For. Meteorol., 94, 123 – 148, doi:10.1016/S0168-1923(99)00006-4.
Gu, L., et al. (2001), Cloud modulation of surface solar irradiance at apasture site in southern Brazil, Agric. For. Meteorol., 106, 117–129,doi:10.1016/S0168-1923(00)00209-4.
Gu, L., D. Baldocchi, S. B. Verma, T. A. Black, T. Vesala, E. M. Falge, andP. R. Dowty (2002), Advantages of diffuse radiation for terrestrial eco-system productivity, J. Geophys. Res., 107(D6), 4050, doi:10.1029/2001JD001242.
Gu, L., et al. (2003), Response of a deciduous forest to the Mount Pinatuboeruption: Enhanced photosynthesis, Science, 299, 2035–2038, doi:10.1126/science.1078366.
Harwood, K. G., J. S. Gillon, H. Griffiths, and M. S. J. Broadmeadow(1998), Diurnal variation in D13CO2, DC18O16O and evaporative siteenrichment of dH2
18O in Piper aduncum under field conditions in Trinidad,Plant Cell Environ., 21, 269–283, doi:10.1046/j.1365-3040.1998.00276.x.
Helliker, B. R., and J. R. Ehleringer (2000), Establishing a grassland sig-nature in veins: 18O in the leaf water of C3 and C4 grasses, Proc. Natl.Acad. Sci. U. S. A., 97, 7894–7898, doi:10.1073/pnas.97.14.7894.
Helliker, B. R., et al. (2002), A rapid and precise method for sampling anddetermining the oxygen isotope ratio of atmospheric water vapor, RapidCommun. Mass Spectrom., 16, 929–932, doi:10.1002/rcm.659.
Hoag, K. J., C. J. Still, I. Y. Fung, and K. A. Boering (2005), Triple oxygenisotope composition of tropospheric carbon dioxide as a tracer of terres-trial gross carbon fluxes, Geophys. Res. Lett., 32, L02802, doi:10.1029/2004GL021011.
Hollinger, D. Y., et al. (1994), Carbon dioxide exchange between an un-disturbed old-growth temperate forest and the atmosphere, Ecology,75(1), 134–150, doi:10.2307/1939390.
Hollinger, D. Y., et al. (1998), Forest-atmosphere carbon dioxide exchangein eastern Siberia, Agric. For. Meteorol., 90, 291–306, doi:10.1016/S0168-1923(98)00057-4.
Horita, J., and D. J. Wesolowski (1994), Liquid-vapor fractionation ofoxygen and hydrogen isotopes of water from the freezing to the criticaltemperature, Geochim. Cosmochim. Acta, 58(16), 3425 – 3437,doi:10.1016/0016-7037(94)90096-5.
Ishizawa, M., T. Nakazawa, and K. Higuchi (2002), A multi-box modelstudy of the role of the biospheric metabolism in the recent decline ofd18O in atmospheric CO2, Tellus, Ser. B, 54, 307–324.
Johnson, D. M., and W. K. Smith (2006), Low clouds and cloud immersionenhance photosynthesis in understory species of a southern Appalachianspruce-fir forest (USA), Am. J. Bot., 93(11), 1625–1632, doi:10.3732/ajb.93.11.1625.
Johnson, D. M., and W. K. Smith (2008), Cloud immersion alters micro-climate, photosynthesis and water relations in Rhododendron catawbienseand Abies fraseri seedlings in the southern Appalachian Mountains, USA,Tree Physiol., 28, 385–392.
Jones, H. G. (1992), Plants and Microclimate: A Quantitative Approach toEnvironmental Plant Physiology, 428 pp., Cambridge Univ. Press, Cam-bridge, U.K.
Knohl, A., and D. D. Baldocchi (2008), Effects of diffuse radiation oncanopy gas exchange processes in a forest ecosystem, J. Geophys.Res., 113, G02023, doi:10.1029/2007JG000663.
Lai, C.-T., J. R. Ehleringer, B. J. Bond, and U. K. T. Paw (2006a), Con-tributions of evaporation, isotopic non-steady state transpiration and at-mospheric mixing on the d18O of water vapour in Pacific Northwestconiferous forests, Plant Cell Environ., 29, 77–94, doi:10.1111/j.1365-3040.2005.01402.x.
Lai, C.-T., W. Riley, C. Owensby, J. Ham, A. Schauer, and J. R. Ehleringer(2006b), Seasonal and interannual variations of carbon and oxygen iso-topes of respired CO2 in a tallgrass prairie: Measurements and modelingresults from 3 years with contrasting water availability, J. Geophys. Res.,111, D08S06, doi:10.1029/2005JD006436.
Larcher, W. (2003), Physiological Plant Ecology, 4th ed., 513 pp., Springer,Berlin.
Lee, X., R. Smith, and J. Williams (2006), Water vapour 18O/16O isotoperatio in surface air in New England, USA, Tellus, Ser. B, 58, 293–304.
Leuning, R., F. M. Kelliher, D. G. G. de Pury, and E.-D. Schulze (1995),Leaf nitrogen, photosynthesis, conductance and transpiration: Scaling
G01018 STILL ET AL.: CLOUDS AND CO18O EXCHANGES
15 of 17
G01018
from leaves to canopy, Plant Cell Environ., 18, 1183–1200, doi:10.1111/j.1365-3040.1995.tb00628.x.
Liepert, B. G. (2002), rved reductions of surface solar radiation at sites inthe United States and worldwide from 1961 to 1990, Geophys. Res. Lett.,29(10), 1421, doi:10.1029/2002GL014910.
Liepert, B. G., J. Feichter, U. Lohmann, and E. Roeckner (2004), Canaerosols spin down the water cycle in a warmer and moister world?,Geophys. Res. Lett., 31, L06207, doi:10.1029/2003GL019060.
Long, S. P. (1999), Environmental responses, in C4 Plant Biology, edited byR. F. Sage and R. K. Monson, pp. 215–249, Academic, New York.
Lynch, J. A., J. W. Grimm, and V. C. Bowersox (1995), Trends in precipi-tation chemistry in the United States: A national perspective, 1980–1992,Atmos. Environ., 29(11), 1231–1246, doi:10.1016/1352-2310(94)00371-Q.
McDowell, N., et al. (2008), Understanding the stable isotope compositionof biosphere-atmosphere CO2 exchange, Eos Trans. AGU, 89(10), 94–95,doi:10.1029/2008EO100002.
Min, Q. (2005), Impacts of aerosols and clouds on forest-atmosphere carbonexchange, J. Geophys. Res., 110, D06203, doi:10.1029/2004JD004858.
Min, Q., and S. Wang (2008), Clouds modulate terrestrial carbon uptake in amidlatitude hardwood forest, Geophys. Res. Lett., 35, L02406, doi:10.1029/2007GL032398.
Morison, J. I. L., et al. (2000), Very high productivity of the C4 aquaticgrass Echinochloa polystachya in the Amazon floodplain confirmed bynet ecosystem CO2 flux measurements, Oecologia, 125(3), 400–411,doi:10.1007/s004420000464.
Niyogi, D., et al. (2004), Direct observations of the effects of aerosolloading on net ecosystem CO2 exchanges over different landscapes,Geophys. Res. Lett., 31, L20506, doi:10.1029/2004GL020915.
Noone, D., C. Still, W. Riley, L. Welp, and J. Randerson (2004), Isotopicdiagnosis of processes governing interannual variability of CO18O fluxes inthe tropics, Eos Trans. AGU, 85(17), Jt. Assem. Suppl., Abstract B41B-02.
Norman, J. M., and T. J. Arkebauer (1991), Predicting canopy light-useefficiency from leaf characteristics, in Modeling Plant and Soil Systems,Agronomy, vol. 31, edited by J. Hanks and J. T. Ritchie, pp. 125–143,Am. Soc. of Agron., Madison, Wis.
Oliveira, P. H. F., et al. (2007), The effects of biomass burning aerosols andclouds on the CO2 flux in Amazonia, Tellus, Ser. B, 59, 338–349.
Ometto, J. P. H., L. B. Flanagan, L. A.Martinelli, and J. R. Ehleringer (2005),Oxygen isotope ratios of waters and respired CO2 in Amazonian forest andpasture ecosystems, Ecol. Appl., 15(1), 58–70, doi:10.1890/03-5047.
Pearcy, R. W., and J. R. Ehleringer (1984), Comparative ecophysiology ofC3 and C4 plants, Plant Cell Environ., 7, 1–13.
Peylin, P., et al. (1999), A 3-dimensional study of d18O in atmospheric CO2:Contribution of different land ecosystems, Tellus, Ser. B, 51, 642–667,doi:10.1034/j.1600-0889.1999.t01-2-00006.x.
Piedade, M. T. F., W. J. Junk, and S. P. Long (1991), The productivity of theC4 grass Echinochloa polystachya on the Amazon floodplain, Ecology,72(4), 1456–1463, doi:10.2307/1941118.
Pinker, R. T., B. Zhang, and E. G. Dutton (2005), Do satellites detect trendsin surface solar radiation?, Science, 308, 850–854.
Price, D. T., and T. A. Black (1990), Effects of short-term variation inweather on diurnal canopy CO2 flux and evapotranspiration of a juvenileDouglas-Fir stand, Agric. For. Meteorol., 50, 139–158.
Randerson, J. T., et al. (2002a), Carbon isotope discrimination of arctic andboreal biomes inferred from remote atmospheric measurements and abiosphere-atmosphere model, Global Biogeochem. Cycles, 16(3), 1028,doi:10.1029/2001GB001435.
Randerson, J. T., G. J. Collatz, J. E. Fessenden, A. D. Munoz, C. J. Still,J. A. Berry, I. Y. Fung, N. Suits, and A. S. Denning (2002b), A possibleglobal covariance between terrestrial gross primary production and 13Cdiscrimination: Consequences for the atmospheric 13C budget and itsresponse to ENSO, Global Biogeochem. Cycles, 16(4), 1136, doi:10.1029/2001GB001845.
Rayner, P. J., I. G. Enting, R. J. Francey, and R. Langenfelds (1999),Reconstructing the recent carbon cycle from atmospheric CO2, d
13Cand O2/N2 observations, Tellus, Ser. B, 51, 213–232, doi:10.1034/j.1600-0889.1999.t01-1-00008.x.
Rayner, P. J., R. M. Law, C. E. Allison, R. J. Francey, C. M. Trudinger, andC. Pickett-Heaps (2008), Interannual variability of the global carboncycle (1992– 2005) inferred by inversion of atmospheric CO2 andd13CO2 measurements, Global Biogeochem. Cycles, 22, GB3008,doi:10.1029/2007GB003068.
Riley, W. J. (2005), A modeling study of the impact of the d18O value ofnear-surface soil water on the d18O value of the soil-surface CO2 flux,Geochim. Cosmochim. Acta, 69(8), 1939–1946, doi:10.1016/j.gca.2004.10.021.
Riley, W. J., C. J. Still, M. S. Torn, and J. A. Berry (2002), A mechanisticmodel of H2
18O and C18OO fluxes between ecosystems and the atmo-sphere: Model description and sensitivity analyses, Global Biogeochem.Cycles, 16(4), 1095, doi:10.1029/2002GB001878.
Riley, W. J., et al. (2003), 18O composition of CO2 and H2O ecosystempools and fluxes in a tallgrass prairie: Simulations and comparisons tomeasurements, Global Change Biol., 9, 1567–1581, doi:10.1046/j.1365-2486.2003.00680.x.
Rocha, A. V., H.-B. Su, C. S. Vogel, H. P. Schmid, and P. S. Curtis (2004),Photosynthetic and water use efficiency responses to diffuse radiation byan aspen-dominated northern hardwood forest, For. Sci., 50(6), 793–801.
Roderick, M. L. (1999), Estimating the diffuse component from daily andmonthly measurements of global radiation, Agric. For. Meteorol., 95,169–185, doi:10.1016/S0168-1923(99)00028-3.
Roderick, M. L. (2006), The ever-flickering light, Trends Ecol. Evol., 21(1),3–5, doi:10.1016/j.tree.2005.11.005.
Roderick, M. L., G. D. Farquhar, S. L. Berry, and I. R. Noble (2001), Onthe direct effect of clouds and atmospheric particles on the productivityand structure of vegetation, Oecologia, 129(1), 21–30, doi:10.1007/s004420100760.
Sage, R. F., D. A. Wedin, and M. Li (1999), The biogeography of C4
photosynthesis: Patterns and controlling factors, in C4 Plant Biology,edited by R. F. Sage and R. K. Monson, pp. 313–373, Academic,New York.
Scholze, M., J. O. Kaplan, W. Knorr, and M. Heimann (2003), Climate andinterannual variability of the atmosphere-biosphere 13CO2 flux, Geophys.Res. Lett., 30(2), 1097, doi:10.1029/2002GL015631.
Schwarz, A. G., and R. E. Redmann (1988), C4 grasses from the borealforest region of northwestern Canada, Can. J. Bot., 66, 2424–2430.
Seibt, U., L. Wingate, J. A. Berry, and J. Lloyd (2006), Non-steady stateeffects in diurnal 18O discrimination by Picea sitchensis branches in thefield, Plant Cell Environ., 29, 928–939, doi:10.1111/j.1365-3040.2005.01474.x.
Sellers, P. J. (1985), Canopy reflectance, photosynthesis and transpiration,Int. J. Remote Sens., 6, 1335–1372, doi:10.1080/01431168508948283.
Sellers, P. J., et al. (1996), A revised land surface parameterization (SiB2for atmospheric GCMs. Part 1. Model formulation, J. Clim., 9, 676–705,doi:10.1175/1520-0442(1996)009<0676:ARLSPF>2.0.CO;2.
Stanhill, G., and S. Cohen (2001), Global dimming: A review of the evi-dence for a widespread and significant reduction in global radiation withdiscussion of its probable causes and possible agricultural consequences,Agric. For. Meteorol., 107, 255–278.
Stern, L. A., R. Amundson, and W. T. Baisden (2001), Influence of soils onoxygen isotope ratio of atmospheric CO2, Global Biogeochem. Cycles,15, 753–759, doi:10.1029/2000GB001373.
Still, C. J., J. A. Berry, G. J. Collatz, and R. S. DeFries (2003), The globaldistribution of C3 and C4 vegetation: Carbon cycle implications, GlobalBiogeochem. Cycles, 17(1), 1006, doi:10.1029/2001GB001807.
Still, C. J., et al. (2005), Simulation of ecosystem C18OO isotope fluxes in atallgrass prairie: Biological and physical controls, in Stable Isotopes andBiosphere-Atmosphere Interactions, Physiological Ecology, edited byL. B. Flanagan, J. R. Ehleringer, and D. E. Pataki, pp. 154–170, Elsevier,San Diego, Calif.
Suyker, A. E., and S. B. Verma (2001), Year-round observations of the netecosystem exchange of carbon dioxide in a native tallgrass prairie, GlobalChange Biol., 7, 279–289, doi:10.1046/j.1365-2486.2001.00407.x.
Turner, D. P., et al. (2003), A cross-biome comparison of daily light useefficiency for gross primary production,Global Change Biol., 9, 383–395,doi:10.1046/j.1365-2486.2003.00573.x.
Urban, O., et al. (2007), Ecophysiological controls over the net ecosystemexchange of mountain spruce stand: Comparison of the response in directvs. diffuse solar radiation, Global Change Biol., 13, 157–168, doi:10.1111/j.1365-2486.2006.01265.x.
Vachon, R. W., J. W. White, E. Gutmann, and J. M. Welker (2007),Amount-weighted annual isotopic (d18O) values are affected by the sea-sonality of precipitation: A sensitivity study, Geophys. Res. Lett., 34,L21707, doi:10.1029/2007GL030547.
von Caemmerer, S., and R. T. Furbank (2003), The C4 pathway: An efficientCO2 pump, Photosynth. Res., 77, 191–207, doi:10.1023/A:1025830019591.
Wang, X.-F., D. Yakir, and M. Avishai (1998), Non-climatic variations inthe oxygen isotopic compositions of plants, Global Change Biol., 4,835–849.
Wang, X. J., and J. R. Key (2003), Recent trends in arctic surface, cloud,and radiation properties from space, Science, 299, 1725 – 1728,doi:10.1126/science.1078065.
Wang, Y.-P., and R. Leuning (1998), A two-leaf model for canopy conduc-tance, photosynthesis and partitioning of available energy I: Model de-scription and comparison with a multi-layered model, Agric. For.Meteorol., 91, 89–111, doi:10.1016/S0168-1923(98)00061-6.
Welker, J. (2000), Isotopic (d18O) characteristics of weekly precipitationcollected across the USA: An initial analysis with application to watersource studies, Hydrol. Processes, 14, 1449–1464, doi:10.1002/1099-1085(20000615)14:8<1449::AID-HYP993>3.0.CO;2-7.
G01018 STILL ET AL.: CLOUDS AND CO18O EXCHANGES
16 of 17
G01018

Welp, L. R., J. T. Randerson, and H. P. Liu (2006), Seasonal exchange ofCO2 and d18O-CO2 varies with postfire succession in boreal forest eco-systems, J. Geophys. Res., 111, G03007, doi:10.1029/2005JG000126.
White, J. W. C., and S. D. Gedzelman (1984), The isotope composition ofatmospheric water vapor and the concurrent meteorological conditions,J. Geophys. Res., 89, 4937–4939, doi:10.1029/JD089iD03p04937.
Wielicki, B. A., et al. (2002), Evidence for large decadal variability in thetropical mean radiative energy budget, Science, 295, 841–844, doi:10.1126/science.1065837.
Wild, M., et al. (2005), From dimming to brightening: Decadal changes insurface solar radiation, Science, 308, 847–850, doi:10.1126/science.1103215.
Wild, M., A. Ohmura, and K. Makowski (2007), Impact of global dimmingand brightening on global warming, Geophys. Res. Lett., 34, L04702,doi:10.1029/2006GL028031.
Williams, A. P., C. J. Still, D. T. Fischer, and S. W. Leavitt (2008), Theinfluence of summertime fog and overcast clouds on the growth of acoastal Californian pine: A tree-ring study, Oecologia, 156(3), 601–611,doi:10.1007/s00442-008-1025-y.
Yakir, D., and Y. Israeli (1995), Reduced solar irradiance effects on netprimary productivity (NPP) and the d13C and d18O values in plantations ofMusa sp., Musaceae, Geochim. Cosmochim. Acta, 59(10), 2149–2151,doi:10.1016/S0016-7037(99)80010-6.
Yakir, D., and L. D. L. Sternberg (2000), The use of stable isotopes to studyecosystem gas exchange, Oecologia, 123(3), 297–311, doi:10.1007/s004420051016.
Zundel, G., W. Miekeley, B. M. Grisi, and H. Forstel (1978), The H218O
enrichment in the leaf water of tropic trees: Comparison of species fromthe tropical rain forest and the semi-arid region in Brazil, Radiat. Environ.Biophys., 15, 203–212, doi:10.1007/BF01323265.
�����������������������J. A. Berry, Department of Global Ecology, Carnegie Institution of
Washington, Stanford, CA 94305, USA.S. C. Biraud, W. J. Riley, and M. S. Torn, Earth Sciences Division,
Lawrence Berkeley National Laboratory, Berkeley, CA 94720, USA.N. H. Buenning and D. C. Noone, Department of Atmospheric and
Oceanic Sciences, University of Colorado, Boulder, CO 80309, USA.G. D. Farquhar, Research School of Biological Sciences, Australian
National University, Canberra, ACT 0200, Australia.J. T. Randerson, Earth System Science Department, University of
California, Irvine, CA 92697, USA.C. J. Still, Department of Geography, University of California, 3611
Elison Hall, Santa Barbara, CA 93106-4060, USA. ([email protected])R. Vachon and J. W. C. White, INSTAAR, University of Colorado,
Boulder, CO 80309, USA.J. Welker, Environment and Natural Resources Institute, University of
Alaska, Anchorage, AK 99508, USA.
G01018 STILL ET AL.: CLOUDS AND CO18O EXCHANGES
17 of 17
G01018