Rational design of drug–polymer co-formulations by CO 2 anti-solvent precipitation
7
J. of Supercritical Fluids 48 (2009) 176–182 Contents lists available at ScienceDirect The Journal of Supercritical Fluids journal homepage: www.elsevier.com/locate/supflu Rational design of drug–polymer co-formulations by CO 2 anti-solvent precipitation Johannes Kluge a , Francesco Fusaro a , Gerhard Muhrer b , Ranjit Thakur b , Marco Mazzotti a,∗ a ETH Zurich, Institute of Process Engineering, Sonneggstrasse 3, 8092 Zurich, Switzerland b Novartis Pharma AG, Chemical and Analytical Development, 4002 Basel, Switzerland article info Article history: Received 16 May 2008 Received in revised form 6 October 2008 Accepted 7 October 2008 Keywords: Supercritical Anti-solvent Precipitation Co-formulation Class II drugs Polymer abstract The purpose of this study is to investigate the potential of the precipitation with compressed anti-solvent (PCA) process for the design of pharmaceutical drug–polymer co-formulations for solubility enhance- ment. Co-formulations of the sparingly soluble anticonvulsant phenytoin (5,5-diphenyhydantoin) and the water-soluble polymer excipient poly-(vinyl pyrrolidone) K30 (PVP) have been prepared by PCA. Solutions with drug to polymer ratios between 4:1 and 1:4 have been precipitated at sub- and super- critical conditions (80 bar and 25 ◦ C, and 150 bar and 40 ◦ C) using CO 2 as anti-solvent. Co-formulations with phenytoin concentrations below 40 wt.% were fully amorphous and similar to pure PVP in morphol- ogy, while phenytoin was also present in crystalline form in products with higher drug contents. The same threshold concentration was found to apply at both operating conditions. Fully amorphous products did not recrystallize upon one year of storage at ambient conditions. The PCA process could thus be used to maximize the drug loading in stable and fully amorphous solid dispersions of phenytoin in PVP. For the system of consideration, a phenytoin solubility in PVP of about 40 wt.% has been determined. © 2008 Elsevier B.V. All rights reserved. 1. Introduction 1.1. Drug–polymer co-formulation For most organic drug substances, pharmaceutical activity is based on the non-covalent, reversible molecular binding to a spe- cific target, i.e. a biological receptor or an enzyme, involving the interaction of complementary parts of the molecular structure of the active compound and of the receptor. The aptitude of the overall molecular structure for such specific interactions explains why molecules exhibiting pharmaceutical activity usually contain different functional groups and moieties, each characterized by specific properties with respect to charge, polarity and the presence of hydrogen bonding sites. Besides forming the basis of pharma- ceutical activity, the overall molecular structure also determines the interactions among drug molecules themselves, and there- fore also the formation of crystals with high lattice energies as well as the tendency to polymorphism and pseudo-polymorphism. These aspects are of high relevance because the morphology of a drug product largely determines pharmacokinetics, downstream processability in terms of, e.g. flowability or compactability, and ∗ Corresponding author. Tel.: +41 44 6322456; fax: +41 44 6321141. E-mail address: [email protected] (M. Mazzotti). long-term stability, which are crucial characteristic properties that define the overall quality of a pharmaceutical product. Compared to pharmaceutical activity, which is assessed at the discovery stage, all these properties are assessed only during the drug development phase. An important group of orally administered drugs, which are defined as Class II substances, is characterized by very low solubil- ity in aqueous media, and high permeability across gastrointestinal membranes. For this class of active compounds, there is a cor- relation between in vivo bio-availability and in vitro kinetics of dissolution [1]. Therefore, many research studies aim at the devel- opment of formulation techniques that enhance in vitro dissolution rates, thus promising enhanced bio-availability. Among the possible approaches to achieve this, the co- formulation of such drugs with water-soluble polymeric carriers has generally great potential in this area. The presence of such poly- mers in the drug formulation may improve bio-availability mainly by two mechanisms. First, the dispersion of pharmaceutical crystals in water-soluble excipients improves wetting and tablet disintegra- tion, thus leading to accelerated dissolution. This effect can also be achieved by mere physical mixing of the two compounds and does not involve any change in drug morphology. The second mechanism aims at dissolving the drug in the polymer matrix at a molecu- lar level, so as to stabilize the drug in an amorphous state, i.e. in a so called solid dispersion or solid solution [2]. By this, the for- mation of a stable crystal lattice is hindered, and the solubility 0896-8446/$ – see front matter © 2008 Elsevier B.V. All rights reserved. doi:10.1016/j.supflu.2008.10.005
-
Upload
independent -
Category
Documents
-
view
1 -
download
0
Transcript of Rational design of drug–polymer co-formulations by CO 2 anti-solvent precipitation
J. of Supercritical Fluids 48 (2009) 176–182
Contents lists available at ScienceDirect
The Journal of Supercritical Fluids
journa l homepage: www.e lsev ier .com/ locate /supf lu
Rational design of drug–polymer co-formulations by CO2 anti-solventprecipitation
Johannes Klugea, Francesco Fusaroa, Gerhard Muhrerb, Ranjit Thakurb, Marco Mazzotti a,∗
a ETH Zurich, Institute of Process Engineering, Sonneggstrasse 3, 8092 Zurich, Switzerlandb Novartis Pharma AG, Chemical and Analytical Development, 4002 Basel, Switzerland
a r t i c l e i n f o
Article history:Received 16 May 2008Received in revised form 6 October 2008Accepted 7 October 2008
Keywords:SupercriticalAnti-solventPrecipitation
a b s t r a c t
The purpose of this study is to investigate the potential of the precipitation with compressed anti-solvent(PCA) process for the design of pharmaceutical drug–polymer co-formulations for solubility enhance-ment. Co-formulations of the sparingly soluble anticonvulsant phenytoin (5,5-diphenyhydantoin) andthe water-soluble polymer excipient poly-(vinyl pyrrolidone) K30 (PVP) have been prepared by PCA.Solutions with drug to polymer ratios between 4:1 and 1:4 have been precipitated at sub- and super-critical conditions (80 bar and 25 ◦C, and 150 bar and 40 ◦C) using CO2 as anti-solvent. Co-formulationswith phenytoin concentrations below 40 wt.% were fully amorphous and similar to pure PVP in morphol-ogy, while phenytoin was also present in crystalline form in products with higher drug contents. The samethreshold concentration was found to apply at both operating conditions. Fully amorphous products did
Co-formulationClass II drugsPolymer
not recrystallize upon one year of storage at ambient conditions. The PCA process could thus be used tomaximize the drug loading in stable and fully amorphous solid dispersions of phenytoin in PVP. For the
phen
1
1
bcioowdsoctfwTdp
ldtap
dimrdor
fhm
0d
system of consideration, a
. Introduction
.1. Drug–polymer co-formulation
For most organic drug substances, pharmaceutical activity isased on the non-covalent, reversible molecular binding to a spe-ific target, i.e. a biological receptor or an enzyme, involving thenteraction of complementary parts of the molecular structuref the active compound and of the receptor. The aptitude of theverall molecular structure for such specific interactions explainshy molecules exhibiting pharmaceutical activity usually containifferent functional groups and moieties, each characterized bypecific properties with respect to charge, polarity and the presencef hydrogen bonding sites. Besides forming the basis of pharma-eutical activity, the overall molecular structure also determineshe interactions among drug molecules themselves, and there-ore also the formation of crystals with high lattice energies as
ell as the tendency to polymorphism and pseudo-polymorphism.hese aspects are of high relevance because the morphology of arug product largely determines pharmacokinetics, downstreamrocessability in terms of, e.g. flowability or compactability, and
∗ Corresponding author. Tel.: +41 44 6322456; fax: +41 44 6321141.E-mail address: [email protected] (M. Mazzotti).
bitanalam
896-8446/$ – see front matter © 2008 Elsevier B.V. All rights reserved.oi:10.1016/j.supflu.2008.10.005
ytoin solubility in PVP of about 40 wt.% has been determined.© 2008 Elsevier B.V. All rights reserved.
ong-term stability, which are crucial characteristic properties thatefine the overall quality of a pharmaceutical product. Comparedo pharmaceutical activity, which is assessed at the discovery stage,ll these properties are assessed only during the drug developmenthase.
An important group of orally administered drugs, which areefined as Class II substances, is characterized by very low solubil-
ty in aqueous media, and high permeability across gastrointestinalembranes. For this class of active compounds, there is a cor-
elation between in vivo bio-availability and in vitro kinetics ofissolution [1]. Therefore, many research studies aim at the devel-pment of formulation techniques that enhance in vitro dissolutionates, thus promising enhanced bio-availability.
Among the possible approaches to achieve this, the co-ormulation of such drugs with water-soluble polymeric carriersas generally great potential in this area. The presence of such poly-ers in the drug formulation may improve bio-availability mainly
y two mechanisms. First, the dispersion of pharmaceutical crystalsn water-soluble excipients improves wetting and tablet disintegra-ion, thus leading to accelerated dissolution. This effect can also bechieved by mere physical mixing of the two compounds and does
ot involve any change in drug morphology. The second mechanismims at dissolving the drug in the polymer matrix at a molecu-ar level, so as to stabilize the drug in an amorphous state, i.e. inso called solid dispersion or solid solution [2]. By this, the for-ation of a stable crystal lattice is hindered, and the solubility
itical Fluids 48 (2009) 176–182 177
ob
tbcsotmca
1
wcisCsahtpsacl
psaswcfrfs
cwipmtc
2
2
C(pnSlSKa
apsece
2
maG(cmDrb(t(
s(kHfipftwvsmb
J. Kluge et al. / J. of Supercr
f the drug is increased, thus leading to a great enhancement ofio-availability.
The production of such co-formulations requires the specifica-ion of a certain drug to polymer ratio. The amount of polymer muste high enough to guarantee a sufficient shelf life of the pharma-eutical product, whereas the content of the required excipientshould be minimized to keep dosages small. The solution of thisptimization problem requires an improved understanding of thehermodynamics of the system drug–polymer, which remains a
ajor challenge. In this work, an attractive production process foro-formulations, namely the precipitation using a compressed fluidnti-solvent (PCA), is investigated in this context.
.2. PCA process
Supercritical fluids, and especially supercritical CO2, have beenidely applied for the production of particulate products, espe-
ially for pharmaceuticals and fine chemicals. Existing processesnvolve supercritical fluids either as solvents [3,4] or as anti-olvents [4]. The main advantage in the application of compressedO2 as process medium is that a dry product with low residualolvent content is obtained in a single-step process at mild oper-ting temperatures. Furthermore, CO2 is cheap and its applicationelps reducing the consumption of organic solvents. Research inhis field over the past few years has paid special attention to therocessing of Class II pharmaceuticals. Here, processes involvingupercritical CO2 promise enhanced dissolution and increased bio-vailability either by micronization of the compounds [5] or by theiro-formulation with polymers and other well-soluble excipientsike cyclodextrins [6].
Within the field of supercritical fluid processes, the formation ofolymeric particles has its own research record [7]. Also in this case,upercritical fluids have been applied both as solvents [8] and asnti-solvents [9]. The phase behavior of the polymer–solvent–anti-olvent system has been discussed previously [6], and particularlyith reference to its effect on particle formation in such pro-
esses [10]. Research has soon focused on biodegradable polymersor pharmaceutical controlled release applications [11,12]. Moreecently, also water-soluble pharmaceutical excipients and theormation of solubility-enhancing co-formulations with sparinglyoluble drugs have been studied [13–16].
In line with these studies, it has recently been shown that theo-formulation of the sparingly soluble drug phenytoin with theater-soluble polymer poly-(vinly pyrrolidone) (PVP K30) results
n a significantly improved dissolution rate of the drug [17,18]. Theresent study is a continuation of this research effort, and presentsore systematic and comprehensive experimental data for the sys-
em phenytoin–PVP K30 obtained in an extended range of operatingonditions.
. Materials and methods
.1. Materials
The compounds 5,5 diphenyl hydantoin (phenytoin),15H12N2O2, MW = 252.3 Da, TM = 568.3 K, �Hf = 34.2 kJ/mol [19]Sigma–Aldrich, Buchs, Switzerland), poly(vinylpyrrolidone) K30urum (PVP K30; Sigma–Aldrich, Buchs, Switzerland; productumber 81420), ethanol (analytical grade, Scharlau, Sentmenat,
pain), acetone (analytical grade, J.T. Baker, Deventer, The Nether-ands) and carbon dioxide (99.9%, from PanGas, Schlieren,witzerland) were all used as received. We presume that PVP30 corresponds to the BASF product Kollidon 30, which hasnumber average molecular weight MN = 12 kDa and a weightFasr
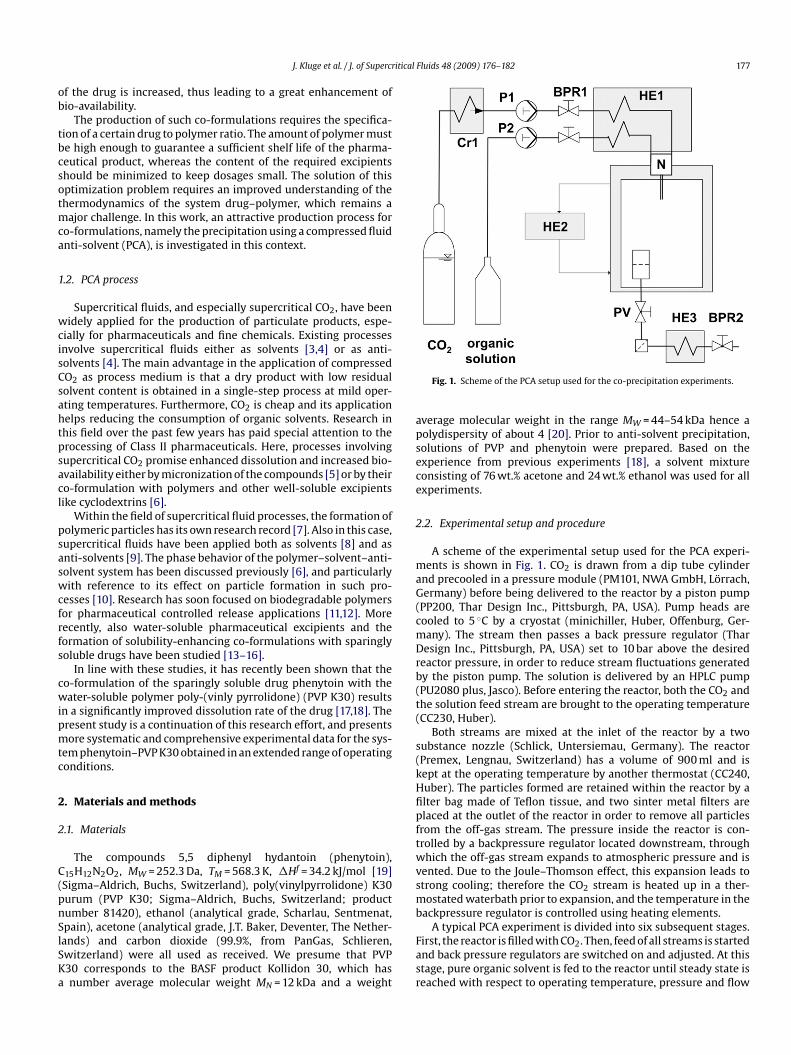
Fig. 1. Scheme of the PCA setup used for the co-precipitation experiments.
verage molecular weight in the range MW = 44–54 kDa hence aolydispersity of about 4 [20]. Prior to anti-solvent precipitation,olutions of PVP and phenytoin were prepared. Based on thexperience from previous experiments [18], a solvent mixtureonsisting of 76 wt.% acetone and 24 wt.% ethanol was used for allxperiments.
.2. Experimental setup and procedure
A scheme of the experimental setup used for the PCA experi-ents is shown in Fig. 1. CO2 is drawn from a dip tube cylinder
nd precooled in a pressure module (PM101, NWA GmbH, Lörrach,ermany) before being delivered to the reactor by a piston pump
PP200, Thar Design Inc., Pittsburgh, PA, USA). Pump heads areooled to 5 ◦C by a cryostat (minichiller, Huber, Offenburg, Ger-any). The stream then passes a back pressure regulator (Tharesign Inc., Pittsburgh, PA, USA) set to 10 bar above the desired
eactor pressure, in order to reduce stream fluctuations generatedy the piston pump. The solution is delivered by an HPLC pumpPU2080 plus, Jasco). Before entering the reactor, both the CO2 andhe solution feed stream are brought to the operating temperatureCC230, Huber).
Both streams are mixed at the inlet of the reactor by a twoubstance nozzle (Schlick, Untersiemau, Germany). The reactorPremex, Lengnau, Switzerland) has a volume of 900 ml and isept at the operating temperature by another thermostat (CC240,uber). The particles formed are retained within the reactor by alter bag made of Teflon tissue, and two sinter metal filters arelaced at the outlet of the reactor in order to remove all particlesrom the off-gas stream. The pressure inside the reactor is con-rolled by a backpressure regulator located downstream, throughhich the off-gas stream expands to atmospheric pressure and is
ented. Due to the Joule–Thomson effect, this expansion leads totrong cooling; therefore the CO2 stream is heated up in a ther-ostated waterbath prior to expansion, and the temperature in the
ackpressure regulator is controlled using heating elements.A typical PCA experiment is divided into six subsequent stages.
irst, the reactor is filled with CO2. Then, feed of all streams is startednd back pressure regulators are switched on and adjusted. At thistage, pure organic solvent is fed to the reactor until steady state iseached with respect to operating temperature, pressure and flow
1 itical Fluids 48 (2009) 176–182
rtrwntlf
2
tmcfoXat
ontam
iwisummmcw
s1mUct1a
3
3
tafffltci2
P
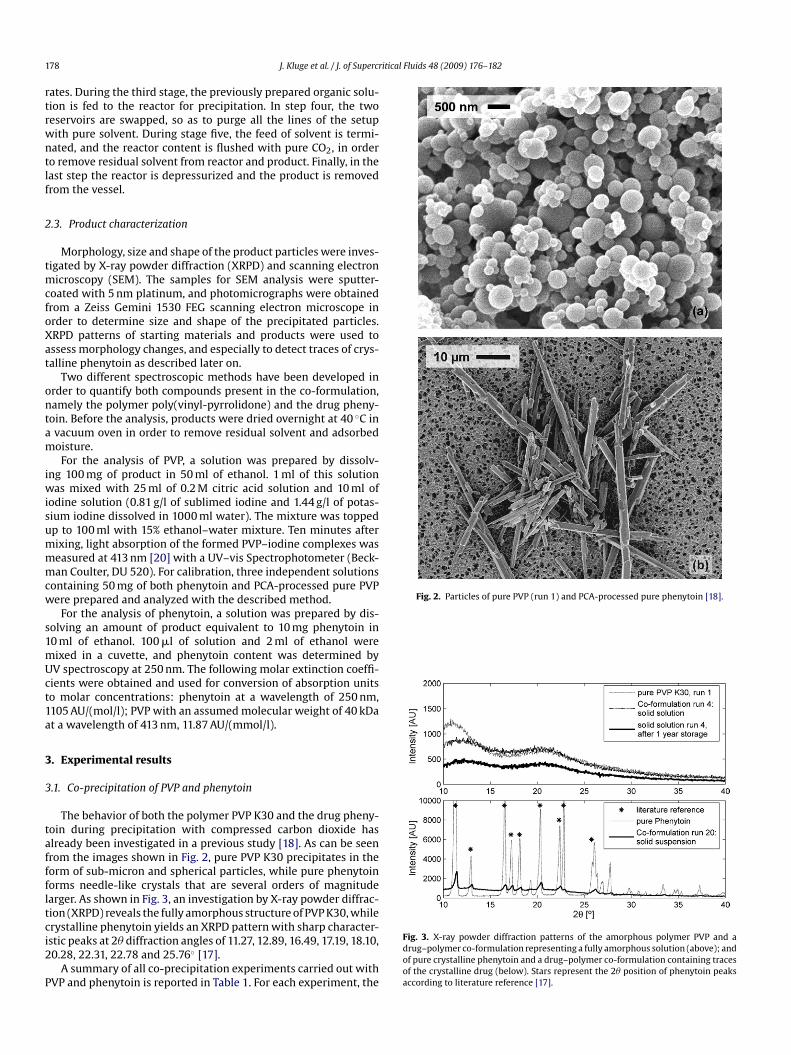
Fig. 2. Particles of pure PVP (run 1) and PCA-processed pure phenytoin [18].
78 J. Kluge et al. / J. of Supercr
ates. During the third stage, the previously prepared organic solu-ion is fed to the reactor for precipitation. In step four, the twoeservoirs are swapped, so as to purge all the lines of the setupith pure solvent. During stage five, the feed of solvent is termi-ated, and the reactor content is flushed with pure CO2, in ordero remove residual solvent from reactor and product. Finally, in theast step the reactor is depressurized and the product is removedrom the vessel.
.3. Product characterization
Morphology, size and shape of the product particles were inves-igated by X-ray powder diffraction (XRPD) and scanning electron
icroscopy (SEM). The samples for SEM analysis were sputter-oated with 5 nm platinum, and photomicrographs were obtainedrom a Zeiss Gemini 1530 FEG scanning electron microscope inrder to determine size and shape of the precipitated particles.RPD patterns of starting materials and products were used tossess morphology changes, and especially to detect traces of crys-alline phenytoin as described later on.
Two different spectroscopic methods have been developed inrder to quantify both compounds present in the co-formulation,amely the polymer poly(vinyl-pyrrolidone) and the drug pheny-oin. Before the analysis, products were dried overnight at 40 ◦C invacuum oven in order to remove residual solvent and adsorbedoisture.For the analysis of PVP, a solution was prepared by dissolv-
ng 100 mg of product in 50 ml of ethanol. 1 ml of this solutionas mixed with 25 ml of 0.2 M citric acid solution and 10 ml of
odine solution (0.81 g/l of sublimed iodine and 1.44 g/l of potas-ium iodine dissolved in 1000 ml water). The mixture was toppedp to 100 ml with 15% ethanol–water mixture. Ten minutes afterixing, light absorption of the formed PVP–iodine complexes waseasured at 413 nm [20] with a UV–vis Spectrophotometer (Beck-an Coulter, DU 520). For calibration, three independent solutions
ontaining 50 mg of both phenytoin and PCA-processed pure PVPere prepared and analyzed with the described method.
For the analysis of phenytoin, a solution was prepared by dis-olving an amount of product equivalent to 10 mg phenytoin in0 ml of ethanol. 100 �l of solution and 2 ml of ethanol wereixed in a cuvette, and phenytoin content was determined byV spectroscopy at 250 nm. The following molar extinction coeffi-ients were obtained and used for conversion of absorption unitso molar concentrations: phenytoin at a wavelength of 250 nm,105 AU/(mol/l); PVP with an assumed molecular weight of 40 kDat a wavelength of 413 nm, 11.87 AU/(mmol/l).
. Experimental results
.1. Co-precipitation of PVP and phenytoin
The behavior of both the polymer PVP K30 and the drug pheny-oin during precipitation with compressed carbon dioxide haslready been investigated in a previous study [18]. As can be seenrom the images shown in Fig. 2, pure PVP K30 precipitates in theorm of sub-micron and spherical particles, while pure phenytoinorms needle-like crystals that are several orders of magnitudearger. As shown in Fig. 3, an investigation by X-ray powder diffrac-ion (XRPD) reveals the fully amorphous structure of PVP K30, while
rystalline phenytoin yields an XRPD pattern with sharp character-stic peaks at 2� diffraction angles of 11.27, 12.89, 16.49, 17.19, 18.10,0.28, 22.31, 22.78 and 25.76◦ [17].A summary of all co-precipitation experiments carried out withVP and phenytoin is reported in Table 1. For each experiment, the
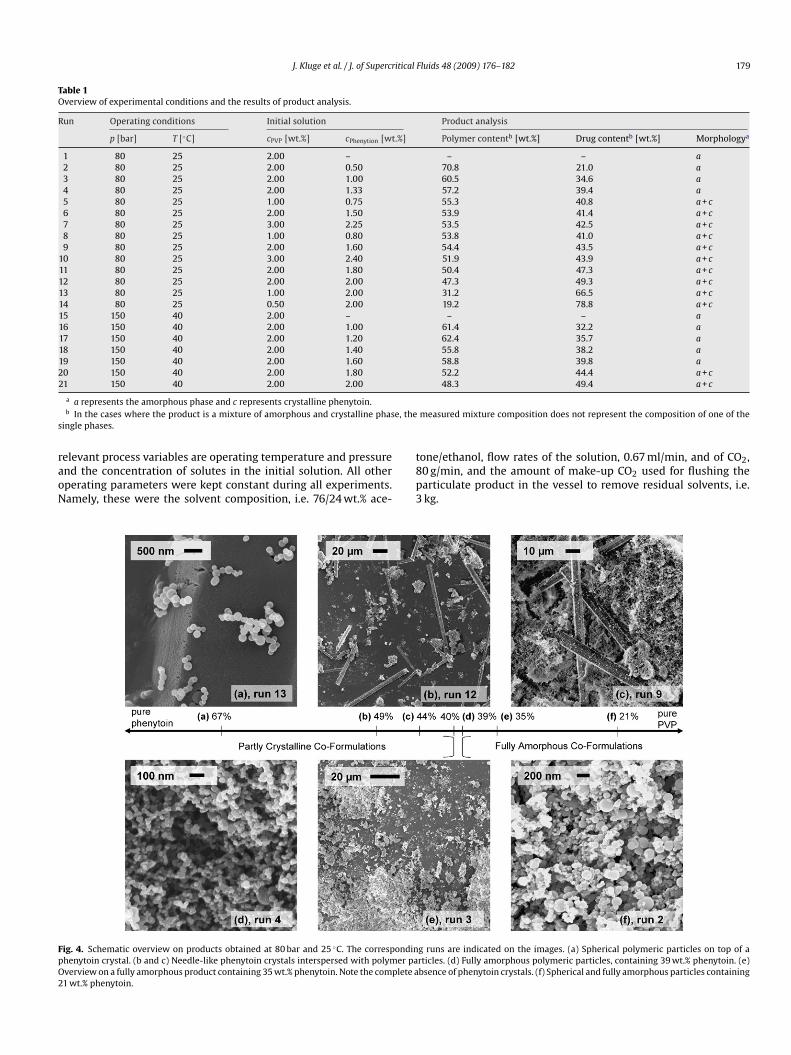
Fig. 3. X-ray powder diffraction patterns of the amorphous polymer PVP and adrug–polymer co-formulation representing a fully amorphous solution (above); andof pure crystalline phenytoin and a drug–polymer co-formulation containing tracesof the crystalline drug (below). Stars represent the 2� position of phenytoin peaksaccording to literature reference [17].
J. Kluge et al. / J. of Supercritical Fluids 48 (2009) 176–182 179
Table 1Overview of experimental conditions and the results of product analysis.
Run Operating conditions Initial solution Product analysis
p [bar] T [◦C] cPVP [wt.%] cPhenytion [wt.%] Polymer contentb [wt.%] Drug contentb [wt.%] Morphologya
1 80 25 2.00 – – – a2 80 25 2.00 0.50 70.8 21.0 a3 80 25 2.00 1.00 60.5 34.6 a4 80 25 2.00 1.33 57.2 39.4 a5 80 25 1.00 0.75 55.3 40.8 a + c6 80 25 2.00 1.50 53.9 41.4 a + c7 80 25 3.00 2.25 53.5 42.5 a + c8 80 25 1.00 0.80 53.8 41.0 a + c9 80 25 2.00 1.60 54.4 43.5 a + c
10 80 25 3.00 2.40 51.9 43.9 a + c11 80 25 2.00 1.80 50.4 47.3 a + c12 80 25 2.00 2.00 47.3 49.3 a + c13 80 25 1.00 2.00 31.2 66.5 a + c14 80 25 0.50 2.00 19.2 78.8 a + c15 150 40 2.00 – – – a16 150 40 2.00 1.00 61.4 32.2 a17 150 40 2.00 1.20 62.4 35.7 a18 150 40 2.00 1.40 55.8 38.2 a19 150 40 2.00 1.60 58.8 39.8 a20 150 40 2.00 1.80 52.2 44.4 a + c21 150 40 2.00 2.00 48.3 49.4 a + c
e, thes
raoN
FpO2
a a represents the amorphous phase and c represents crystalline phenytoin.b In the cases where the product is a mixture of amorphous and crystalline phas
ingle phases.
elevant process variables are operating temperature and pressurend the concentration of solutes in the initial solution. All otherperating parameters were kept constant during all experiments.amely, these were the solvent composition, i.e. 76/24 wt.% ace-
t8p3
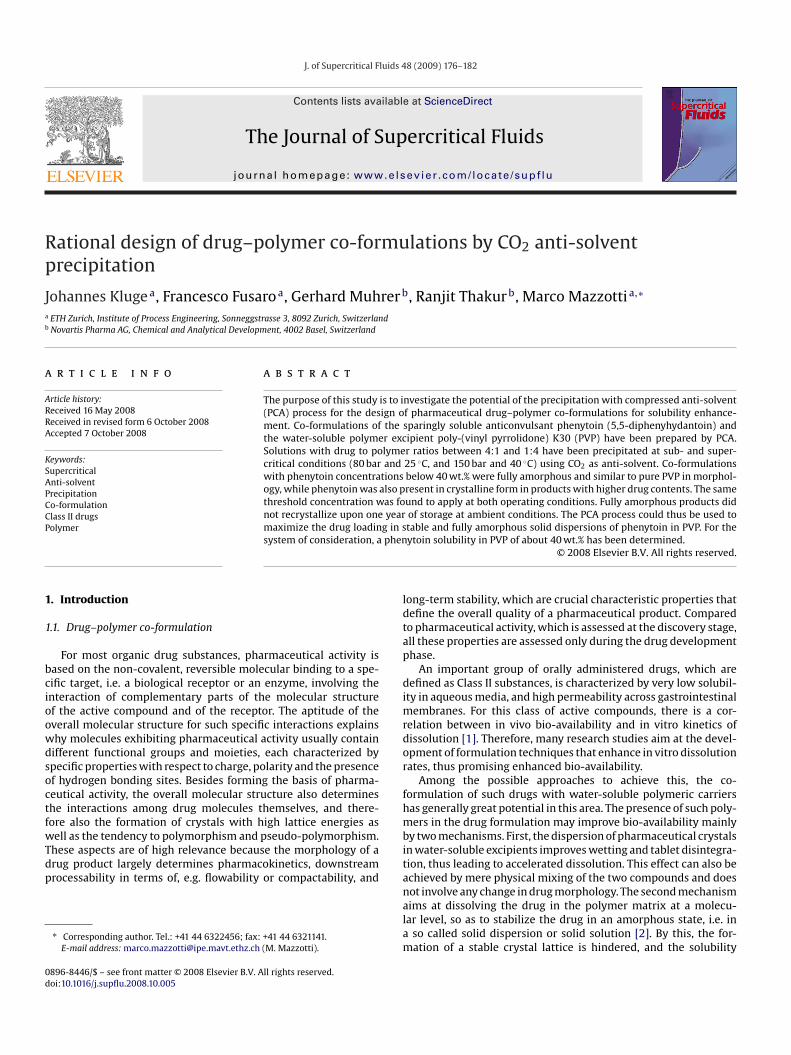
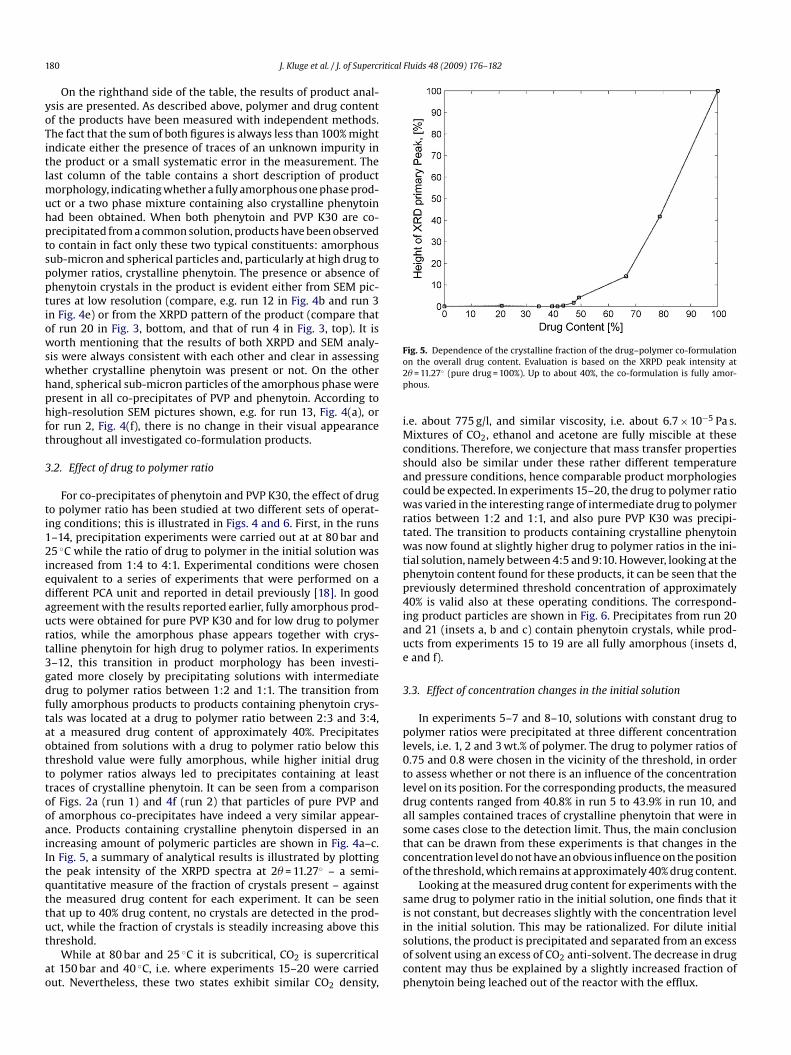
ig. 4. Schematic overview on products obtained at 80 bar and 25 ◦C. The correspondinhenytoin crystal. (b and c) Needle-like phenytoin crystals interspersed with polymer paverview on a fully amorphous product containing 35 wt.% phenytoin. Note the complete a1 wt.% phenytoin.
measured mixture composition does not represent the composition of one of the
one/ethanol, flow rates of the solution, 0.67 ml/min, and of CO2,0 g/min, and the amount of make-up CO2 used for flushing thearticulate product in the vessel to remove residual solvents, i.e.kg.
g runs are indicated on the images. (a) Spherical polymeric particles on top of articles. (d) Fully amorphous polymeric particles, containing 39 wt.% phenytoin. (e)bsence of phenytoin crystals. (f) Spherical and fully amorphous particles containing
1 itical Fluids 48 (2009) 176–182
yoTitlmuhptspptiowswhphft
3
ti12iedaurt3gdftaotttooaiItqttut
ao
Fig. 5. Dependence of the crystalline fraction of the drug–polymer co-formulationo2p
iMcsacwrtwtpp4iaue
3
pl0tldastco
si
80 J. Kluge et al. / J. of Supercr
On the righthand side of the table, the results of product anal-sis are presented. As described above, polymer and drug contentf the products have been measured with independent methods.he fact that the sum of both figures is always less than 100% mightndicate either the presence of traces of an unknown impurity inhe product or a small systematic error in the measurement. Theast column of the table contains a short description of product
orphology, indicating whether a fully amorphous one phase prod-ct or a two phase mixture containing also crystalline phenytoinad been obtained. When both phenytoin and PVP K30 are co-recipitated from a common solution, products have been observedo contain in fact only these two typical constituents: amorphousub-micron and spherical particles and, particularly at high drug toolymer ratios, crystalline phenytoin. The presence or absence ofhenytoin crystals in the product is evident either from SEM pic-ures at low resolution (compare, e.g. run 12 in Fig. 4b and run 3n Fig. 4e) or from the XRPD pattern of the product (compare thatf run 20 in Fig. 3, bottom, and that of run 4 in Fig. 3, top). It isorth mentioning that the results of both XRPD and SEM analy-
is were always consistent with each other and clear in assessinghether crystalline phenytoin was present or not. On the otherand, spherical sub-micron particles of the amorphous phase wereresent in all co-precipitates of PVP and phenytoin. According toigh-resolution SEM pictures shown, e.g. for run 13, Fig. 4(a), or
or run 2, Fig. 4(f), there is no change in their visual appearancehroughout all investigated co-formulation products.
.2. Effect of drug to polymer ratio
For co-precipitates of phenytoin and PVP K30, the effect of drugo polymer ratio has been studied at two different sets of operat-ng conditions; this is illustrated in Figs. 4 and 6. First, in the runs–14, precipitation experiments were carried out at at 80 bar and5 ◦C while the ratio of drug to polymer in the initial solution was
ncreased from 1:4 to 4:1. Experimental conditions were chosenquivalent to a series of experiments that were performed on aifferent PCA unit and reported in detail previously [18]. In goodgreement with the results reported earlier, fully amorphous prod-cts were obtained for pure PVP K30 and for low drug to polymeratios, while the amorphous phase appears together with crys-alline phenytoin for high drug to polymer ratios. In experiments–12, this transition in product morphology has been investi-ated more closely by precipitating solutions with intermediaterug to polymer ratios between 1:2 and 1:1. The transition fromully amorphous products to products containing phenytoin crys-als was located at a drug to polymer ratio between 2:3 and 3:4,t a measured drug content of approximately 40%. Precipitatesbtained from solutions with a drug to polymer ratio below thishreshold value were fully amorphous, while higher initial drugo polymer ratios always led to precipitates containing at leastraces of crystalline phenytoin. It can be seen from a comparisonf Figs. 2a (run 1) and 4f (run 2) that particles of pure PVP andf amorphous co-precipitates have indeed a very similar appear-nce. Products containing crystalline phenytoin dispersed in anncreasing amount of polymeric particles are shown in Fig. 4a–c.n Fig. 5, a summary of analytical results is illustrated by plottinghe peak intensity of the XRPD spectra at 2� = 11.27◦ – a semi-uantitative measure of the fraction of crystals present – againsthe measured drug content for each experiment. It can be seenhat up to 40% drug content, no crystals are detected in the prod-
ct, while the fraction of crystals is steadily increasing above thishreshold.While at 80 bar and 25 ◦C it is subcritical, CO2 is supercriticalt 150 bar and 40 ◦C, i.e. where experiments 15–20 were carriedut. Nevertheless, these two states exhibit similar CO2 density,
isocp
n the overall drug content. Evaluation is based on the XRPD peak intensity at� = 11.27◦ (pure drug = 100%). Up to about 40%, the co-formulation is fully amor-hous.
.e. about 775 g/l, and similar viscosity, i.e. about 6.7 × 10⁻⁵ Pa s.ixtures of CO2, ethanol and acetone are fully miscible at these
onditions. Therefore, we conjecture that mass transfer propertieshould also be similar under these rather different temperaturend pressure conditions, hence comparable product morphologiesould be expected. In experiments 15–20, the drug to polymer ratioas varied in the interesting range of intermediate drug to polymer
atios between 1:2 and 1:1, and also pure PVP K30 was precipi-ated. The transition to products containing crystalline phenytoinas now found at slightly higher drug to polymer ratios in the ini-
ial solution, namely between 4:5 and 9:10. However, looking at thehenytoin content found for these products, it can be seen that thereviously determined threshold concentration of approximately0% is valid also at these operating conditions. The correspond-
ng product particles are shown in Fig. 6. Precipitates from run 20nd 21 (insets a, b and c) contain phenytoin crystals, while prod-cts from experiments 15 to 19 are all fully amorphous (insets d,and f).
.3. Effect of concentration changes in the initial solution
In experiments 5–7 and 8–10, solutions with constant drug toolymer ratios were precipitated at three different concentration
evels, i.e. 1, 2 and 3 wt.% of polymer. The drug to polymer ratios of.75 and 0.8 were chosen in the vicinity of the threshold, in ordero assess whether or not there is an influence of the concentrationevel on its position. For the corresponding products, the measuredrug contents ranged from 40.8% in run 5 to 43.9% in run 10, andll samples contained traces of crystalline phenytoin that were inome cases close to the detection limit. Thus, the main conclusionhat can be drawn from these experiments is that changes in theoncentration level do not have an obvious influence on the positionf the threshold, which remains at approximately 40% drug content.
Looking at the measured drug content for experiments with theame drug to polymer ratio in the initial solution, one finds that its not constant, but decreases slightly with the concentration level
n the initial solution. This may be rationalized. For dilute initialolutions, the product is precipitated and separated from an excessf solvent using an excess of CO2 anti-solvent. The decrease in drugontent may thus be explained by a slightly increased fraction ofhenytoin being leached out of the reactor with the efflux.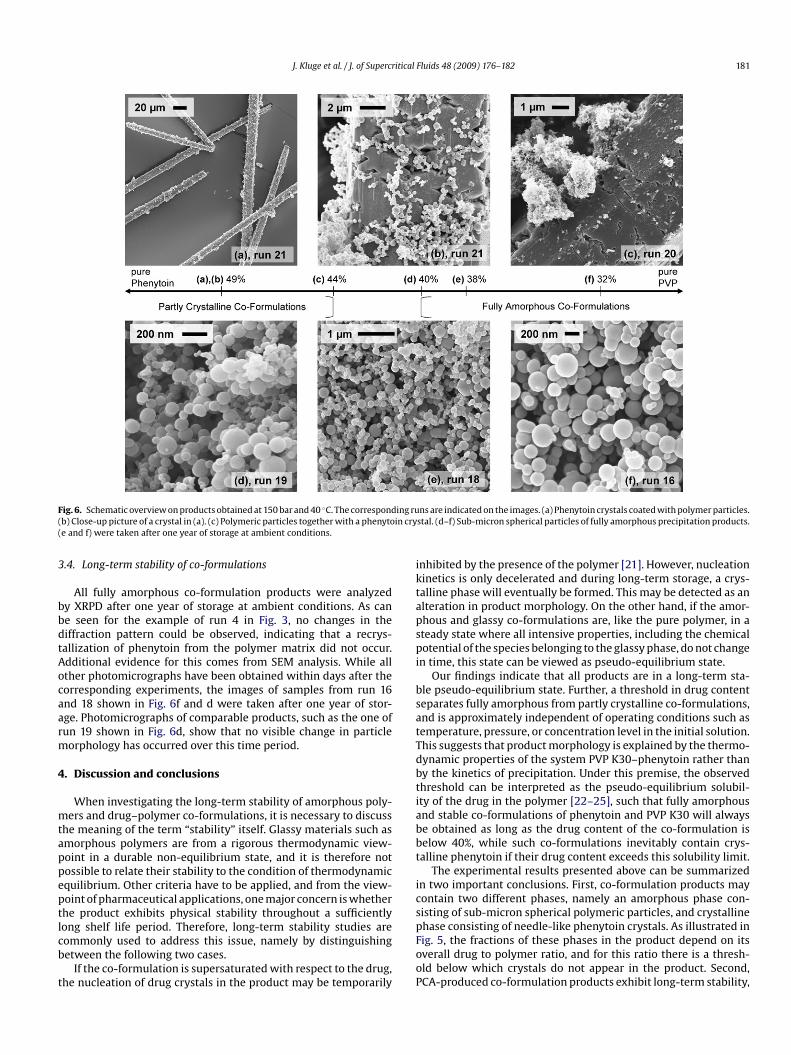
J. Kluge et al. / J. of Supercritical Fluids 48 (2009) 176–182 181
F ing ru( in cry(
3
bbdtAocaarm
4
mtappeptlcb
t
iktapspi
bsatTdbtiabbt
ics
ig. 6. Schematic overview on products obtained at 150 bar and 40 ◦C. The correspondb) Close-up picture of a crystal in (a). (c) Polymeric particles together with a phenytoe and f) were taken after one year of storage at ambient conditions.
.4. Long-term stability of co-formulations
All fully amorphous co-formulation products were analyzedy XRPD after one year of storage at ambient conditions. As cane seen for the example of run 4 in Fig. 3, no changes in theiffraction pattern could be observed, indicating that a recrys-allization of phenytoin from the polymer matrix did not occur.dditional evidence for this comes from SEM analysis. While allther photomicrographs have been obtained within days after theorresponding experiments, the images of samples from run 16nd 18 shown in Fig. 6f and d were taken after one year of stor-ge. Photomicrographs of comparable products, such as the one ofun 19 shown in Fig. 6d, show that no visible change in particleorphology has occurred over this time period.
. Discussion and conclusions
When investigating the long-term stability of amorphous poly-ers and drug–polymer co-formulations, it is necessary to discuss
he meaning of the term “stability” itself. Glassy materials such asmorphous polymers are from a rigorous thermodynamic view-oint in a durable non-equilibrium state, and it is therefore notossible to relate their stability to the condition of thermodynamicquilibrium. Other criteria have to be applied, and from the view-oint of pharmaceutical applications, one major concern is whetherhe product exhibits physical stability throughout a sufficiently
ong shelf life period. Therefore, long-term stability studies areommonly used to address this issue, namely by distinguishingetween the following two cases.If the co-formulation is supersaturated with respect to the drug,he nucleation of drug crystals in the product may be temporarily
pFooP
ns are indicated on the images. (a) Phenytoin crystals coated with polymer particles.stal. (d–f) Sub-micron spherical particles of fully amorphous precipitation products.
nhibited by the presence of the polymer [21]. However, nucleationinetics is only decelerated and during long-term storage, a crys-alline phase will eventually be formed. This may be detected as anlteration in product morphology. On the other hand, if the amor-hous and glassy co-formulations are, like the pure polymer, in ateady state where all intensive properties, including the chemicalotential of the species belonging to the glassy phase, do not change
n time, this state can be viewed as pseudo-equilibrium state.Our findings indicate that all products are in a long-term sta-
le pseudo-equilibrium state. Further, a threshold in drug contenteparates fully amorphous from partly crystalline co-formulations,nd is approximately independent of operating conditions such asemperature, pressure, or concentration level in the initial solution.his suggests that product morphology is explained by the thermo-ynamic properties of the system PVP K30–phenytoin rather thany the kinetics of precipitation. Under this premise, the observedhreshold can be interpreted as the pseudo-equilibrium solubil-ty of the drug in the polymer [22–25], such that fully amorphousnd stable co-formulations of phenytoin and PVP K30 will alwayse obtained as long as the drug content of the co-formulation iselow 40%, while such co-formulations inevitably contain crys-alline phenytoin if their drug content exceeds this solubility limit.
The experimental results presented above can be summarizedn two important conclusions. First, co-formulation products mayontain two different phases, namely an amorphous phase con-isting of sub-micron spherical polymeric particles, and crystalline
hase consisting of needle-like phenytoin crystals. As illustrated inig. 5, the fractions of these phases in the product depend on itsverall drug to polymer ratio, and for this ratio there is a thresh-ld below which crystals do not appear in the product. Second,CA-produced co-formulation products exhibit long-term stability,
1 itical
ca
dfdttm[tw
cPboctiatspfs[rcf
A
posa
R
[
[
[
[
[
[
[
[
[
[
[
[
[
[
[
[
[
[
[
[
82 J. Kluge et al. / J. of Supercr
onsequently it seems meaningful that this threshold is interpreteds the solubility of the drug in the polymer.
These observations are on one hand relevant for practicalesign problems. If, for example, a stable and fully amorphous co-ormulation with maximal drug loading is the objective, one canirectly read from Fig. 5 that this is possible up to a drug con-ent of 40 wt.%. Then, one of the most frequent problems related tohe practical application of drug–polymer co-formulations as phar-
aceutical drug delivery systems is insufficient physical stability21,22,26]. Therefore, if PCA co-formulation products exhibit long-erm stability, this is a very interesting aspect, and the question ishether it can be rationalized.
The combination of two characteristics of the PCA process mayontribute to the formation of long-term stable products. First, theCA process takes place at supercritical conditions characterizedy fast mass transfer. This is well-known and also exploited forther processes like supercritical impregnation [27], or supercriti-al extraction, e.g. of natural products [28]. Under enhanced massransfer conditions, the phases present at the end of the precip-tation are relaxed to pseudo-equilibrium, in the sense clarifiedbove, with no residual supersaturation to be consumed. Second,he PCA process yields product particles at temperatures that areimilar to the conditions of long-term storage, i.e. ambient tem-eratures. This is essentially different for all thermal processesor the production of co-formulations like melt extrusion [29] orpray drying and solvent evaporation at elevated temperatures30]. Therefore, the amorphous co-formulation particles are alreadyelaxed at room temperature, which means that if no phenytoinrystals have formed at the end of the PCA process, no crystals willorm by recrystallization during storage.
cknowledgements
The authors want to thank Markus Huber for his continuous sup-ort with XRPD measurements, SEM pictures and the developmentf a method for the analysis of product composition. The project isupported by the Swiss Federal Office for Professional Educationnd Technology (Project KTI 7783.1).
eferences
[1] G.L. Amidon, H. Lennernas, V.P. Shah, J.R. Crison, A theoretical basis for abiopharmaceutic drug classification—the correlation of in-vitro drug productdissolution and in-vivo bioavailability, Pharmaceutical Research 12 (3) (1995)413–420.
[2] C. Leuner, J. Dressman, Improving drug solubility for oral delivery using soliddispersions, European Journal of Pharmaceutics and Biopharmaceutics 50 (1)(2000) 47–60.
[3] E.M. Phillips, V.J. Stella, Rapid expansion from supercritical solutions—application to pharmaceutical processes, International Journal of Pharmaceu-tics 94 (1–3) (1993) 1–10.
[4] B. Subramaniam, R.A. Rajewski, K. Snavely, Pharmaceutical processing withsupercritical carbon dioxide, Journal of Pharmaceutical Sciences 86 (8) (1997)885–890.
[5] M. Perrut, J. Jung, F. Leboeuf, Enhancement of dissolution rate of poorly-soluble active ingredients by supercritical fluid processes. Part I: micronizationof neat particles, International Journal of Pharmaceutics 288 (1) (2005)3–10.
[6] M. Perrut, J. Jung, F. Leboeuf, Enhancement of dissolution rate of poorly sol-uble active ingredients by supercritical fluid processes. Part II: preparationof composite particles, International Journal of Pharmaceutics 288 (1) (2005)6–11.
[7] S.D. Yeo, E. Kiran, Formation of polymer particles with supercritical fluids: areview, Journal of Supercritical Fluids 34 (3) (2005) 287–308.
[
Fluids 48 (2009) 176–182
[8] R.C. Petersen, D.W. Matson, R.D. Smith, The formation of polymer fibers fromthe rapid expansion of supercritical fluid solutions, Polymer Engineering andScience 27 (22) (1987) 1693–1697.
[9] D.J. Dixon, K.P. Johnston, R.A. Bodmeier, Polymeric materials formed by pre-cipitation with a compressed fluid antisolvent, AIChE Journal 39 (1) (1993)127–139.
10] S. Palakodaty, P. York, Phase behavioral effects on particle formation pro-cesses using supercritical fluids, Pharmaceutical Research 16 (7) (1999) 976–985.
11] P.G. Debenedetti, J.W. Tom, S.D. Yeo, G.B. Lim, Application of supercritical fluidsfor the production of sustained delivery devices, Journal of Controlled Release24 (1–3) (1993) 27–44.
12] R. Ghaderi, P. Artursson, J. Carlfors, A new method for preparing biodegradablemicroparticles and entrapment of hydrocortisone in DL-PLG microparticlesusing supercritical fluids, European Journal of Pharmaceutical Sciences 10 (1)(2000) 1–9.
13] M. Moneghini, I. Kikic, D. Voinovich, B. Perissutti, J. Filipovic-Grcic, Processing ofcarbamazepine-PEG 4000 solid dispersions with supercritical carbon dioxide:preparation, characterisation, and in vitro dissolution, International Journal ofPharmaceutics 222 (1) (2001) 129–138.
14] M. Charoenchaitrakool, F. Dehghani, N.R. Foster, Utilization of supercritical car-bon dioxide for complex formation of ibuprofen and methyl-beta-cyclodextrin,International Journal of Pharmaceutics 239 (1–2) (2002) 103–112.
15] Y. Perez de Diego, H.C. Pellikaan, F.E. Wubbolts, G.J. Witkamp, P.J. Jansens, Oper-ating regimes and mechanism of particle formation during the precipitation ofpolymers using the PCA process, Journal of Supercritical Fluids 35 (2) (2005)147–156.
16] M. Moneghini, B. Perissutti, I. Kikic, M. Grassi, A. Cortesi, F. Princivalle,Preparation of theophylline-hydroxypropylmethylcellulose matrices usingsupercritical antisolvent precipitation: a preliminary study, Drug Developmentand Industrial Pharmacy 32 (1) (2006) 39–52.
17] M. Franco, G. Trapani, A. Latrofa, C. Tullio, M.R. Provenzano, M. Serra, M. Mug-gironi, G. Biggio, G. Liso, Dissolution properties and anticonvulsant activityof phenytoin-polyethylene glycol 6000 and -polyvinylpyrrolidone K-30 soliddispersions, International Journal of Pharmaceutics 225 (1–2) (2001) 63–73.
18] G. Muhrer, U. Meier, F. Fusaro, S. Albano, M. Mazzotti, Use of compressed gasprecipitation to enhance the dissolution behavior of a poorly water-solubledrug: generation of drug microparticles and drug–polymer solid dispersions,International Journal of Pharmaceutics 308 (1–2) (2006) 69–83.
19] A.H.L. Chow, J.D. Gordon, A. Szeitz, J.W.M. Young, Modification of pheny-toin crystals. 3. influence of 3-butanoyloxymethyl-5,5-diphenylhydantoin onsolution-phase crystallization and related crystal properties, InternationalJournal of Pharmaceutics 126 (1–2) (1995) 11–19.
20] Volker Bühler. Kollidon—Polyvinylpyrrolidone for the Pharmaceutical Industry,7th edition, BASF Aktiengesellschaft, Pharma Ingredients, 67056 Ludwigshafen,Germany, 2003.
21] H. Konno, L.S. Taylor, Influence of different polymers on the crystallizationtendency of molecularly dispersed amorphous felodipine, Journal of Pharma-ceutical Sciences 95 (12) (2006) 2692–2705.
22] P.J. Marsac, S.L. Shamblin, L.S. Taylor, Theoretical and practical approaches forprediction of drug–polymer miscibility and solubility, Pharmaceutical Research23 (10) (2006) 2417–2426.
23] G.C. Sarti, F. Doghieri, Predictions of the solubility of gases in glassy poly-mers based on the NELF model, Chemical Engineering Science 53 (19) (1998)3435–3447.
24] M. Vasanthavada, W.Q. Tong, Y. Joshi, M.S. Kislalioglu, Phase behavior of amor-phous molecular dispersions I: determination of the degree and mechanism ofsolid solubility, Pharmaceutical Research 21 (9) (2004) 1598–1606.
25] M. Vasanthavada, W.Q. Tong, Y. Joshi, M.S. Kislalioglu, Phase behavior of amor-phous molecular dispersions II: role of hydrogen bonding in solid solubility andphase separation kinetics, Pharmaceutical Research 22 (3) (2005) 440–448.
26] P.J. Marsac, H. Konno, L.S. Taylor, A comparison of the physical stability ofamorphous felodipine and nifedipine systems, Pharmaceutical Research 23 (10)(2006) 2306–2316.
27] E. Rodier, H. Lochard, M. Sauceau, J.J. Letourneau, B. Freiss, J. Fages, A three stepsupercritical process to improve the dissolution rate of eflucimibe, EuropeanJournal of Pharmaceutical Sciences 26 (2) (2005) 184–193.
28] E. Reverchon, I. De Marco, Supercritical fluid extraction and fractionation ofnatural matter, Journal of Supercritical Fluids 38 (2) (2006) 146–166.
29] K. Six, C. Leuner, J. Dressman, G. Verreck, J. Peeters, N. Blaton, P. Augustijns,
R. Kinget, G. Van den Mooter, Thermal properties of hot-stage extrudates ofitraconazole and eudragit E100—phase separation and polymorphism, Journalof Thermal Analysis and Calorimetry 68 (2) (2002) 591–601.30] F. Tanno, Y. Nishiyama, H. Kokubo, S. Obara, Evaluation of hypromellose acetatesuccinate (HPMCAS) as a carrier in solid dispersions, Drug Development andIndustrial Pharmacy 30 (1) (2004) 9–17.