Closed-form solutions for large strain analysis of cavity ...
45
This is a repository copy of Closed-form solutions for large strain analysis of cavity contraction in a bounded Mohr-Coulomb medium. White Rose Research Online URL for this paper: https://eprints.whiterose.ac.uk/173543/ Version: Accepted Version Article: Song, X-G, Yang, H, Yue, H-Y et al. (3 more authors) (2020) Closed-form solutions for large strain analysis of cavity contraction in a bounded Mohr-Coulomb medium. European Journal of Environmental and Civil Engineering. ISSN 1964-8189 https://doi.org/10.1080/19648189.2020.1857309 © 2020 Informa UK Limited, trading as Taylor & Francis Group. This is an author produced version of a journal article published in European Journal of Environmental and Civil Engineering. Uploaded in accordance with the publisher's self-archiving policy. [email protected] https://eprints.whiterose.ac.uk/ Reuse Items deposited in White Rose Research Online are protected by copyright, with all rights reserved unless indicated otherwise. They may be downloaded and/or printed for private study, or other acts as permitted by national copyright laws. The publisher or other rights holders may allow further reproduction and re-use of the full text version. This is indicated by the licence information on the White Rose Research Online record for the item. Takedown If you consider content in White Rose Research Online to be in breach of UK law, please notify us by emailing [email protected] including the URL of the record and the reason for the withdrawal request.
-
Upload
khangminh22 -
Category
Documents
-
view
1 -
download
0
Transcript of Closed-form solutions for large strain analysis of cavity ...

This is a repository copy of Closed-form solutions for large strain analysis of cavity contraction in a bounded Mohr-Coulomb medium.
White Rose Research Online URL for this paper:https://eprints.whiterose.ac.uk/173543/
Version: Accepted Version
Article:
Song, X-G, Yang, H, Yue, H-Y et al. (3 more authors) (2020) Closed-form solutions for large strain analysis of cavity contraction in a bounded Mohr-Coulomb medium. European Journal of Environmental and Civil Engineering. ISSN 1964-8189
https://doi.org/10.1080/19648189.2020.1857309
© 2020 Informa UK Limited, trading as Taylor & Francis Group. This is an author producedversion of a journal article published in European Journal of Environmental and Civil Engineering. Uploaded in accordance with the publisher's self-archiving policy.
[email protected]://eprints.whiterose.ac.uk/
Reuse
Items deposited in White Rose Research Online are protected by copyright, with all rights reserved unless indicated otherwise. They may be downloaded and/or printed for private study, or other acts as permitted by national copyright laws. The publisher or other rights holders may allow further reproduction and re-use of the full text version. This is indicated by the licence information on the White Rose Research Online record for the item.
Takedown
If you consider content in White Rose Research Online to be in breach of UK law, please notify us by emailing [email protected] including the URL of the record and the reason for the withdrawal request.

1
Closed-form solutions for large strain analysis of cavity
contraction in a bounded Mohr-Coulomb medium
Xiu-Guang Song 1 a, He Yang1 b, Hong-Ya Yue1,3 c,
Xu Guo2 d, Hai-Sui Yu3 e, Pei-Zhi Zhuang*1,3
1 School of Qilu Transportation, Shandong University, Jinan, 250002, China
2 Geotechnical and Structural Engineering Research Center, Shandong University, Jinan, 250061, China
3 School of Civil Engineering, University of Leeds, LS2 9JT Leeds, UK
Corresponding author, Research fellow, E-mail: [email protected]
a Professor, E-mail: [email protected]
b Master student, E-mail: [email protected]
c Ph.D. candidate, E-mail: [email protected]
d Professor, E-mail: [email protected]
e Professor, E-mail: [email protected]
Abstract: This paper presents rigorous analytical solutions for cavity contraction analysis of a
thick-walled cylinder/sphere after an arbitrary magnitude of expansion. Closed-form solutions are
given for the distribution of stress and displacement within the cylinder/sphere of soil that is
subjected to constant external pressure and monotonically decreasing internal pressure. The soil is
modelled as an elastic-perfectly plastic material obeying the Mohr-Coulomb yield criterion and a
non-associated flow rule. Large strain effects are taken into account by adopting the logarithmic
strain definition in the plastic deformation analysis. The new solutions are validated with published
results at first, then parametric studies are carried out. It is shown that the reference stress state (e.g.
in-situ, elastic, partially plastic and fully plastic) and the cavity geometry ratio may greatly affect
the unloading behaviour, in particular, when the cavity geometry ratio is smaller than a limit value.
Finally, three typical applications of the solutions are demonstrated, including (i) design of the
thickness of frozen cylinder walls accounting for large deformation effects, (ii) interpretation of
laboratory pressuremeter tests with consideration of effect of the constant stress boundary, and (iii)
shakedown analysis of a soil cylinder/sphere considering its geometry changes upon cyclic loading
and unloading.
Keywords: Cavity contraction; Boundary effect; Shakedown; Pressuremeter; Frozen earth wall

1
Introduction 1
Cavity contraction theory is concerned with the theoretical study of changes in stresses and 2
displacements of cylindrical and spherical cavities upon unloading. It provides a versatile and 3
accurate tool for study of a variety of geotechnical problems. Among them are the interpretation 4
of pressuremeter tests (Ferreira & Robertson, 1992; Houlsby et al., 1985; Houlsby & Withers, 5
1988; Jefferies, 1988; Schnaid et al., 2000; Shuttle, 2007; Withers et al., 1989; Yu, 1996) and 6
analysis of stability and deformation associated with underground excavation, tunneling and 7
drilling (Brown et al., 1983; Carter, 1988; Chen et al., 2012; Jirari et al., 2020; Mair & Taylor, 8
1993; Mo & Yu, 2017; Ogawa & Lo, 1987; Vrakas & Anagnostou, 2014; Yu & Rowe, 1999). 9
In the modelling of pressuremeter tests during unloading, the cavity contraction analysis 10
normally starts from a residual (elastic-plastic) stress state that was induced by previous loading 11
(e.g. installation and expansion of pressuremeters). However, it is usually assumed that the soil 12
is unloaded from an in-situ elastic stress state in the stability and deformation analysis of tunnels 13
and wellbores. Hence, corresponding cavity contraction analyses involve different complexity. 14
Both cases will be considered in this study. 15
Cavity contraction approaches for modelling pressuremeter tests were advocated mainly 16
because the unloading response of pressuremeters is less sensitive to the initial soil disturbance 17
(Hughes & Robertson, 1985; Schnaid & Houlsby, 1992). Over the years, a number of solutions 18
has been developed to derive soil properties from the unloading portion of pressuremeter curves 19
for both sand (Houlsby et al., 1985; Schnaid et al., 2000; Withers et al., 1989; Yu, 1996) and 20
clay (Ferreira & Robertson, 1992; Houlsby & Withers, 1988; Jefferies, 1988). For example, 21
assuming the cavity unloading from the limit expansion state, Houlsby and Withers (1988) 22
derived an analytical solution for both cylindrical and spherical cavities in clays obeying the 23
Tresca failure criterion. Using a non-associated Mohr-Coulomb plasticity model, Houlsby et al. 24
(1985) first developed an approximate small strain solution for interpreting the unloading 25
portion of pressuremeter curves in sands, which was extended later by Withers et al. (1989) to 26
include the case of a spherical cavity. Later on, Yu and Houlsby (1995) presented a more 27
rigorous large-strain solution for the analysis of unloading from any elastic-plastic stress state 28
adopting the same soil model. These unloading solutions are also of great importance for the 29
interpretation methods that consider both the loading and unloading portions of pressuremeter 30
tests (Jefferies, 1988; Schnaid et al., 2000). Nevertheless, almost without exception, the 31
previous analytical solutions for elastic-plastic contraction analysis have been developed with 32
the idealization that the surrounding soil is infinitely large. This assumption may approximately 33
represent the field conditions of site pressuremeter tests but is not suitable for tests performed 34
in small-sized containers due to the possible lateral boundary effects (Alsiny et al., 1992; Fahey 35

2
& Carter, 1993; Geng et al., 2012; Jewell et al., 1980; Schnaid & Houlsby, 1991). To capture 36
the boundary effects, many analytical/semi-analytical expansion solutions for cavities within a 37
bounded soil mass have been proposed (Cheng & Yang, 2019; Fahey, 1986; Juran & BenSaid, 38
1987; Pournaghiazar et al., 2013; Salgado et al., 1998; Yu, 1992, 1993). However, the progress 39
in developing counterpart contraction solutions in bounded soils lags much behind due to the 40
presence of residual stresses that makes the mathematics of the unloading analysis more 41
complex than that of loading. Existing elastic-plastic loading-unloading studies into this 42
problem mainly focused on the shakedown behaviour of a thick-walled cylinder or sphere, 43
which usually involves elastic unloading only and is lack of consideration for the deformation 44
(Gao et al., 2015; Hill, 1950; Wen et al., 2017; Xu & Yu, 2005; Zhao & Wang, 2010). 45
Cavity contraction analysis from an in situ stress state can be regarded as a reverse process 46
of traditional cavity expansion analysis (Chadwick, 1959; Collins & Yu, 1996; Yu & Rowe, 47
1999). As such, the solution methods between them are transferable. Meanwhile, the elastic 48
initial stress state is relatively simple. Hence, many relevant analytical/semi-analytical 49
contraction solutions have been developed in this case over the years (Brown et al., 1983; Chen 50
& Abousleiman, 2016; Mo & Yu, 2017; Park, 2014; Sharan, 2008; Vrakas & Anagnostou, 2014; 51
Yu & Rowe, 1999; Yu et al., 2019). Likewise, most of them concentrated on the case of a cavity 52
embedded in an infinite soil mass, which represents a reasonable simplification for the problem 53
of deep tunnels and un-reinforced boreholes. However, this is not suitable for the unloading 54
analysis of thick-walled soil cylinders or shallow tunnels (Abdulhadi et al., 2011; Franza et al., 55
2019; Grant, 1998; Mair, 1979), for example, in the stability and deformation analysis of 56
controlled ground freezing involved tunnels and boreholes, in which the finite thickness of the 57
frozen earth wall must be well accounted for (Andersland & Ladanyi, 2004; Sanger & Sayles, 58
1979; Zhang et al., 2018). 59
In this paper, we present analytical large strain solutions for contraction analysis of a thick-60
wall cylinder/sphere of dilatant elastic-plastic soils using the Mohr-Coulomb yield criterion and 61
a non-associated flow rule. Without loss of generality, an arbitrary residual stress state 62
(including in-situ, elastic, partially plastic and fully plastic) induced by loading prior to the 63
unloading is considered. The solutions at first are compared with other solutions in the special 64
case of an infinite soil mass for validation. This is followed by parametric studies with a focus 65
on the effects of soil thickness and loading history on cavity contraction behaviour. Finally, 66
three typical applications of the new solutions are presented to show their usefulness, including 67
(i) preliminary design of the thickness of frozen cylinder walls, (ii) prediction of pressuremeter 68
curves measured in calibration chambers in sand, and (iii) determination of the optimal 69
thickness of a hollow cylinder/sphere based on the shakedown concept considering the large 70

3
deformation effects. 71
Problem definition and reference stress state 72
Problem definition 73
Initially, the inner and outer radii of the soil cylinder/sphere are 0a and 0b , respectively, and 74
a hydrostatic pressure p0 acts throughout the soil which is assumed to be isotropic and 75
homogeneous. An additional radial pressure in 0p p ( 0 ) is then applied at the inner wall of 76
the cavity and increased gradually (i.e. loading). At the end of the loading process (i.e. 77
in 20p p ), the inner and outer radii of the cylinder/sphere are 20a and 20b , respectively. 78
Subsequently, the radial pressure acting on the inner cavity wall reduces monotonically (i.e. 79
unloading). During the loading and unloading processes, the internal cavity pressure is applied 80
or removed sufficiently slowly, thus the dynamic effects are negligible, and the radial confining 81
pressure at the outer wall of the cavity remains unchanged as 0p . The major concern of this 82
paper is the distribution of stress and displacement in the cylinder/sphere of soil during the 83
unloading process. 84
The unloading analyses of cylindrical and spherical cavities are conducted simultaneously 85
by the introduction of a parameter k which takes 1 for a cylindrical cavity and 2 for a spherical 86
cavity. For convenience, the behaviour of the cylindrical cavity is described in terms of 87
cylindrical polar coordinates (r, θ, z) and the behaviour of the spherical cavity is described in 88
terms of spherical polar coordinates (r, θ, ϕ). As a long cylindrical cavity is considered, its 89
expansion and contraction occur under plane strain conditions with respect to the z-direction of 90
the cylindrical coordinates. 91
Under axisymmetric/spherically-symmetric conditions, the equilibrium equation in the radial 92
direction can be expressed as: 93
d0
d
rr
k
r r
(1) 94
where σr and σθ represent the radial and circumferential stresses, respectively. 95
The configuration of the system at the completion of loading is used as a reference state from 96
which the stress and displacement of the unloading process are measured. For clarity, subscripts 97
‘0’, ‘1’ and ‘2’ are used in this paper to distinguish the in-situ (or initial) state, the loading 98
process and the unloading process (e.g. Figure 1). The residual stresses and radial displacement 99
during unloading are expressed as: 100

4
2 20r r r (2) 101
2 20 (3) 102
2 20 2 0=u u u r r (4) 103
where 2r , 2 and
2u represent radial stress, circumferential stress, and radial displacement 104
during unloading, and 20r , 20 and
20u represent their values at the end moment of loading 105
(or beginning of unloading), respectively. r , and u are changes in the radial stress, 106
the circumferential stress and the radial displacement due to unloading, respectively; 2r is the 107
radial coordinate of a soil particle during unloading, and 0r indicates its original location. 108
Taking tensile as positive, the stress boundary conditions during unloading are defined as: 109
2 22 2r r a
p
, 2 2
2 0r r bp
(5 a,b) 110
The surrounding soil is modelled as a linearly elastic-perfectly plastic material obeying the 111
Mohr-Coulomb criterion and a non-associated flow rule. The soil behaves elastically and obeys 112
Hooke's law until the onset of yielding. Depending on the loading history, possible reference 113
stress states within the finite soil medium at the beginning of unloading can be generally divided 114
into three cases as shown in Figure 1, namely (I) purely elastic state (including the case of 115
20 0p p ); (II) partially plastic state; and (III) fully plastic state. In Figure 1, c1 denotes the 116
radius of the elastic-plastic boundary during the loading phase, c20 represents its value at the 117
end of loading (or the beginning of unloading), and c2 denotes the outer radius of the loading-118
induced plastic zone during unloading. Note that the axial stress σz in the cylindrical case is 119
assumed to be the intermediate principal stress for the sake of analytical solutions, and it has 120
been shown that the errors that may be caused in the associated stress and displacement fields 121
by this simplification are negligible for practical purpose (Reed, 1986; Vrakas & Anagnostou, 122
2014). 123

5
Initial state of
unloading Elastic unloading
Partially plastic
unloading
Fully plastic
unloading
I
II
III
b0
a0
b2
a2
d2
b20
a20
c20
b20
a20
b2
a2
b2
a2
d2
d2
b2
a2
b2
a2
b2
Partially plastic
expansion(a1,b1,c1; p1)
(a1,b1; p1)Fully plastic
expansion
p20
p20
p20
p2
p2
p2
p0 p0
p0p0
p0p0
p2
p2
p2
p0
p0
p0
a2
c2
Figure1. Definition of the loading and unloading processes
As the cavity pressure p2 reduces from p20, the surrounding soil contracts purely elastically 124
at first (i.e. the elastic unloading phase in Figure 1). With further removal of the internal 125
pressure, plastic yielding occurs in the reverse direction (referred to as ‘reverse yielding’) once 126
the residual stresses satisfy the Mohr-Coulomb yielding criterion under unloading, which 127
initiates from the inner wall of the cavity (i.e. the partially plastic unloading phase in Figure 1). 128
The outer radius of the reverse plastic zone is denoted as d2, and its corresponding position at 129
the fully loaded state (i.e. the reference state) is denoted as d20. Upon further unloading, the 130
entire soil annulus or spherical shell may enter the plastic state (i.e. fully plastic unloading phase 131
in Figure 1). In the reverse plastic zone, the circumferential stress becomes the major principle 132
stress and the yielding function can be expressed as: 133
2 2rY (6) 134
where = 1 sin 1 sin ; 2 cos 1 sinY c . is the angle of friction and c is 135
the cohesion of soil. It has been proven that Equation (6) is satisfied throughout the whole 136
unloading process for any soil (Vrakas & Anagnostou, 2014; Yu & Houlsby, 1995). 137
6
Reference stress state for unloading 138
The soil model adopted in this study is the same as that was used by Yu (1992, 1993) in the 139
loading analysis of a cylinder/sphere. At first, following Yu (1992, 1993), the distribution of 140
stress in the soil during loading is presented to provide a reference for the analysis of the 141
subsequent unloading process. 142
Upon uniform and monotonic loading, the surrounding soil behaves elastically before the 143
cavity pressure reaches the elastic limit 1elimp , and the distribution of the elastic stresses is 144
known as: 145
1
1 1
1 0 1 0 1
1 1
1( )
1
k
r k
b rp p p
b a
(7) 146
1
1 1
1 0 1 0 1
1 1
1( )
1
k
k
b r kp p p
b a
(8) 147
1
0 1 1
1elim 0 1
1 1
1 1
/ 1 1
k
k
Y p b ap p
k b a
(9) 148
When the cavity pressure increases to be larger than 1elimp , the distribution of stresses is 149
defined as: 150
1
1 1 1 11k
r Y A c r
(10) 151
1
1 1 1 11k
Y A c r
(11) 152
for a1≤r1≤c1 (i.e. the loading plastic zone), and 153
1
1 0 1 1 1 1k
rp B b r (12) 154
1
1 0 1 1 1 1k
p B b r k (13) 155
for c1≤r1≤b1 (i.e. the loading elastic zone). In which, 156
0
1 1
1 1
1 1
1 1 1k
k Y pA
k k c b
(14) 157

7
0
1 1
1 1
1
1 1k
Y pB
k b c
(15) 158
The radius of the elastic-plastic boundary upon loading (i.e. 1c ) can be determined by: 159
11
1 1 1
1 1
0
1 1
1 1
kk k c b k Y p
c ak Y p
(16) 160
With sufficiently large loading, the entire soil mass of a finite radial extent may become 161
fully plastic (i.e. 1 1c b ). The distribution of stress in this phase can also be determined by 162
Equations (5 a,b), (10) and (11) by replacing c1 with b1 therein. 163
At the beginning of unloading, 1 20a a , 1 20b b and 1 20p p . According to the difference 164
in the residual stress state and the corresponding geotechnical applications, solutions for the 165
unloading analysis from an in-situ (or elastic) stress state and a plastic reference stress state will 166
be derived separately in the following two sections for clarity. 167
Solutions for unloading from an in-situ/elastic stress state 168
This section focuses on the analysis of a cavity unloading from an elastic stress state (namely, 169
case I in Figure 1, 0 20 1elimp p p ). In this case, the unloading from 20p back to 0p is a 170
reverse process of the previous elastic loading (fully recoverable). Thus, the distribution of 171
stress and strain during this process can be readily obtained by the corresponding loading 172
solution (e.g. (Yu, 1992, 1993)). Hence, the following analysis is carried out with reference to 173
an in-situ stress state for brevity. 174
Elastic unloading analysis 175
In the elastic unloading analysis, the small strain definition (e.g. Equations (17) and (18)) is 176
adopted as the elastic deformation is rather small (Houlsby & Withers, 1988; Yu & Houlsby, 177
1995). This is commonly used in quasi-static cavity expansion and contraction analyses and 178
consistent with the counterpart expansion analysis of Yu (1992, 1993). Hence, the elastic stress-179
strain relationships in rate forms are: 180
2
2 2
2
d 1
d 1 2r r
u kv
r M v k
(17) 181
2
2
1= 1
1 2r
u vv kv
r M v k
(18) 182

8
where εr and εθ denote radial and circumferential strains, respectively. v is the Poisson’s ratio. 183
21 2M E v k ; E is the elastic modulus of soil, and E=2G(1+v); G is the shear 184
modulus of soil. 185
Changes in the stresses and radial displacement due to purely elastic unloading from 0p to 186
2p can be determined by solving the stress equilibrium equation (i.e. Equation (1)) and the 187
strain compatibility equations (i.e. Equations (17) and (18)) with the stress boundary conditions 188
defined in Equation (5 a,b) as: 189
1
2 2
2 0 2 0 1
2 2
1( )
1
k
r k
b rp p p
b a
(19) 190
1
2 2
2 0 2 0 1
2 2
1( )
1
k
k
b r kp p p
b a
(20) 191
1 1
2 0 2 22 2 1 1
2 22 2 2
11 1
1 21 1
k k
k k k
p p r rvu r v kv
b k v k bMr a b
(21) 192
Equations (19) and (20) show that σr2 increases and σθ2 decreases upon unloading. Reverse 193
plasticity occurs once the Mohr-Coulomb yield criterion Equation (6) is satisfied. This 194
condition is firstly satisfied at the inner wall of the cavity when the internal pressure reaches its 195
reverse elastic limit 2elim 1p : 196
1
0 2 2
2elim 1 0 1
2 2
1 1
1/ 1
k
k
Y p b ap p
k b a
(22) 197
Elastic-plastic unloading analysis 198
Stress analysis 199
As the cavity pressure p2 further reduces, a plastic unloading zone a2≤r2≤d2 forms and spreads 200
outwards from the inner wall of the cavity. The distribution of stress in the soil can be obtained 201
by considering the plastic zone and elastic zone (i.e. d2≤r2≤b2) separately and matching at the 202
elastic-plastic interface r2=d2. 203
In the elastic zone (i.e. d2≤r2≤b2), the unloading-induced changes in the principal stresses 204
can be obtained by solving the stress equilibrium equation (i.e. Equation (1)) and the strain 205
compatibility equations (i.e. Equations (17) and (18)) as: 206

9
1
2 0 2 1 2 2 1k
rp B b r
(23) 207
1
2 0 2 1 2 2 1k
p B b r k
(24) 208
where the integration constant B2-1 can be determined as the yield criterion of Equation (6) is 209
satisfied at r2=d2, namely 210
0
2 1 1
2 2
1
1 1k
Y pB
k b d
(25) 211
In the reverse plastic zone (a2≤r2≤d2), the principal stresses are determined by jointly solving 212
the stress equilibrium equation and the Mohr-Coulomb yield criterion as: 213
1
2 2 1 2 21 +k
r Y A d r
(26) 214
1
2 2 1 2 21 +k
Y A d r
(27) 215
where the integration constant A2-1 can be determined from the continuity condition of stress 216
components at the outer radius of the elastic-plastic interface (i.e. r2=d2) as: 217
0
2 1 1
2 2
1 1
1 1 1k
k Y pA
k k d b
(28) 218
Then the cavity pressure 2p and the radius of the elastic-plastic interface d2 during 219
unloading can be related based on Equations (5 a), (26) and (28) as: 220
1 1
22 2
2 20
1 11
1 1
k kY pd dk
a k k bY p
(29) 221
While 2p reduces to the fully plastic limit value 2fp limp , the entire soil medium will 222
become plastic. Equation (29) gives: 223
10
2fp lim 0 2 2
11
1
kY pp p b a
(30) 224
Displacement analysis 225
In the elastic unloading zone (d2≤r2≤b2), the radial displacement at 2r can be obtained by 226
integrating Equations (17) and (18) with the inputs of Equations (23) and (24) as: 227
10
1
2 1 2 22 2
2
11
1 2 1 2
k
B r bv v v kvu r v kv
M v k v k k r
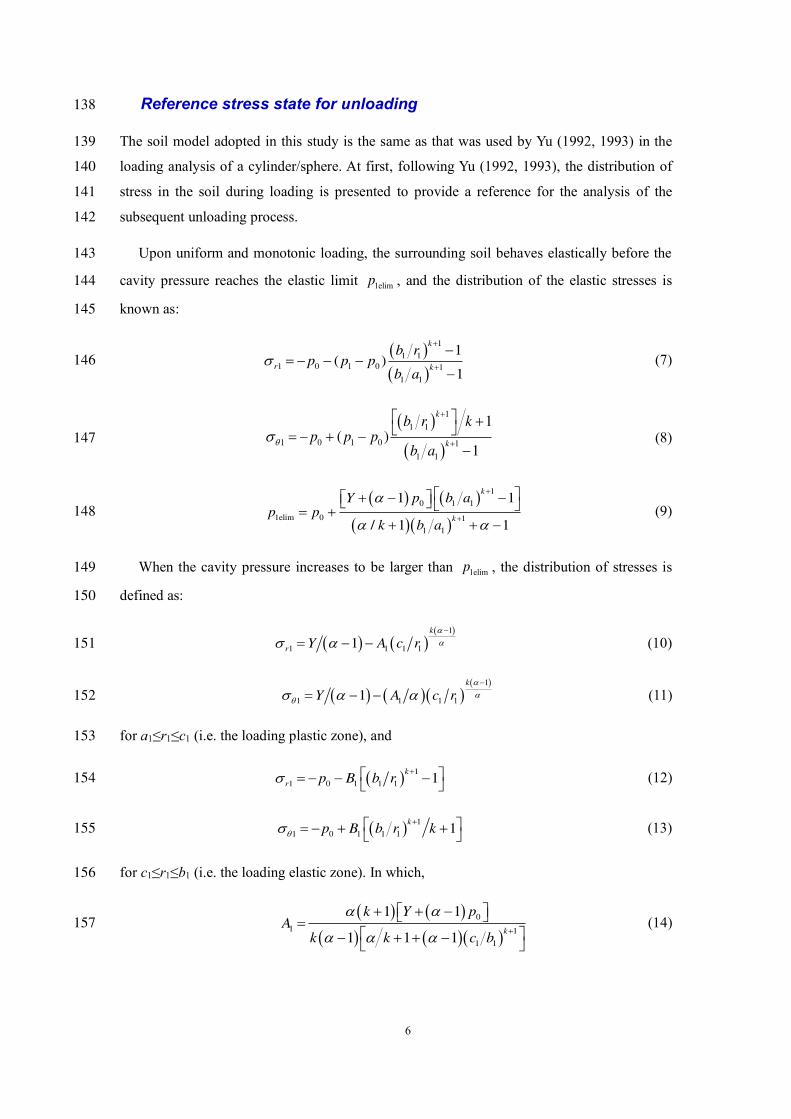
(31) 228
At the elastic-plastic interface and the outer wall of the cavity, we have: 229
20 2 2 2d d u d , 20 2 2 2b b u b (32a, b) 230
In the displacement analysis within the plastic unloading zone (a2<r2<d2), a non-associated 231
flow rule (i.e. ψ is not necessarily equal to ; ψ is the dilation angle of soil) is adapted, and ψ 232
is assumed to be constant to limit the complexity of the model so that closed-form solutions 233
can be obtained. The non-associated flow rule is expressed as: 234
=p e
r r r
p ek
(33) 235
where = 1 sin 1 sin . Note that the dilatancy of soils is in fact not constant (e.g. 236
tends to zero at critical state). Hence, the above assumption on the dilation angle may lead to 237
overprediction on the volumetric deformation at large deformation. The superscripts ‘e’ and ‘p’ 238
represent the elastic and plastic components of strain, respectively. The distribution of stress 239
and strain in the soil at the initiation of reverse plastic yielding is known with Equations (17)-240
(20) by putting 2 2elim 1p p . Subject to this initial condition, the total stress-strain relation in 241
the reverse plastic zone is obtained by integrating Equations (17), (18) and (33) as: 242
2 2 2 0 2 0
11 1
1 2 1 2r r
k v kvk p k v kv p
M v k v k
243
(34) 244
The definition of logarithmic strain is adopted to account for the effects of large strain in the 245
axisymmetric plastic deformation analysis (Chadwick, 1959; Yu & Houlsby, 1995), namely: 246
2 2 0ln d dr r r , 2 2 0ln r r (35 a,b) 247
Substituting Equations (10), (11), (26), (27) and (35 a,b) into Eq. (34) leads to: 248
12 22 2
0 0
dln ln
d
kk
k
r rd r
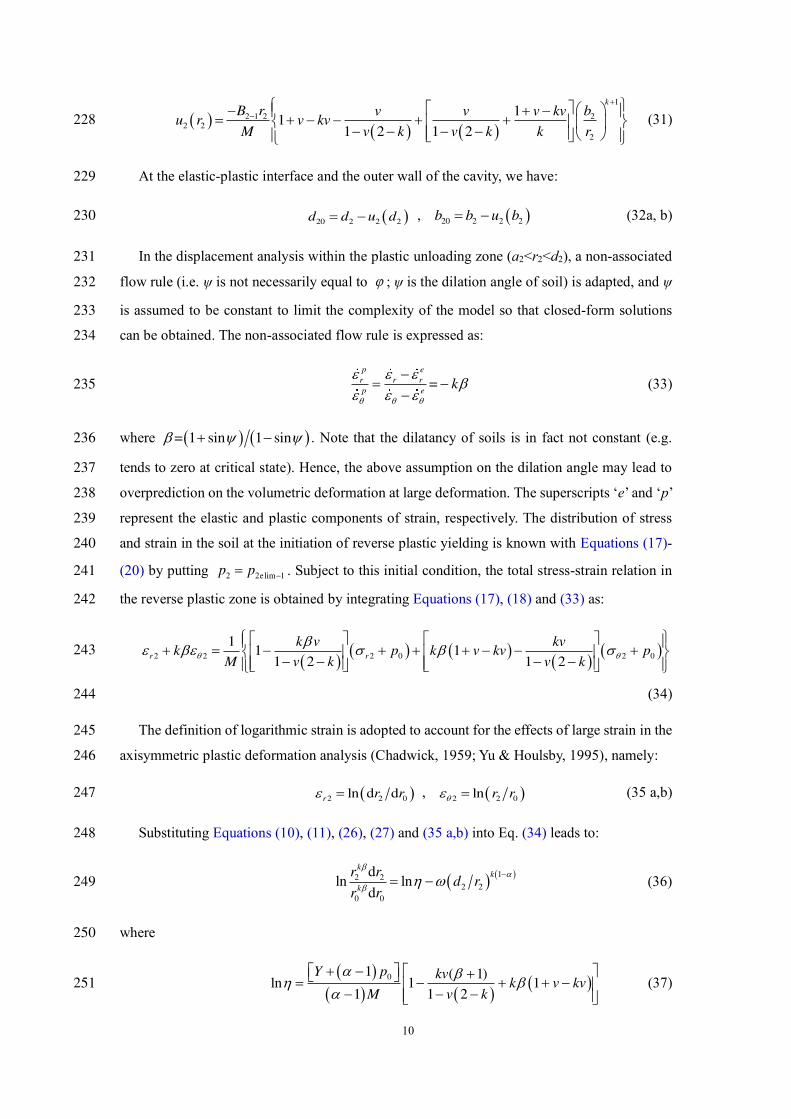
r r
(36) 249
where 250
01 ( 1)
ln 1 11 1 2
Y p kvk v kv
M v k
(37) 251
11
0
1
2 2
1 1 ( )= 1 1
1 21 1 1k
k Y p kvk v kv
v kkM k d b
(38) 252
With the aid of the transformation variable in Equation (39), 253
1
2 2 2( )=k
r d r (39) 254
the integration of Equation (36) over [r2, d2] leads to: 255
2
2
1 1
1 20 0
2 2
d
k kd
r
d re
d d
(40) 256
where = 1 1k k . 257
Then putting r0=a0 and r2=a2, Equation (40) can be solved with the aid of series expansion 258
of e (i.e.
1/ !n
ne n
, !n represents the factorial of n ) as: 259
1 1
1 20 02 2
0 2 2
1 !
k kn
k n
n
d ad a
n n d d
(41) 260
It is worth noting that the above displacement analysis can be significantly simplified by 261
ignoring the contribution of elastic strain and/or using the small strain definition within the 262
plastic zone. For example, the right-hand side of Equation (34) will become zero under the 263
former assumption (Vrakas & Anagnostou, 2014; Yu & Houlsby, 1995; Yu & Rowe, 1999). 264
However, to avoid possible errors that are accompanied by these simplifications (Vrakas & 265
Anagnostou, 2014), they are not attempted in this study. 266
Fully plastic unloading analysis 267
When the surrounding soil enters the fully plastic unlading phase (i.e. d2=b2), it is found that 268
the stress distribution can be obtained directly by replacing d2 with b2 from Equations (26), (27) 269
and (28) as: 270
1
0 22
2
1
1 1
k
r
Y p bY
r
(42) 271
1
0 22
2
1
1 1
kY p bY
r
(43) 272
A large-strain displacement solution for a fully plastic soil cylinder/sphere can be obtained 273

12
by integrating Equation (36) over [a2, b2] as: 274
2 2
1 1 1
0 02
0 2 2 2
1!
nk n k k
d b
n
b ab
n n a b b
(44) 275
For a cavity unloading from an in-situ stress state (also applicable for unloading analysis 276
from a loading-induced elastic stress state), all the necessary information for determining the 277
complete pressure-contraction curve and stress distributions has been given. Results can be 278
readily obtained following a similar procedure given by Yu (1992, 1993) or in a simplified way 279
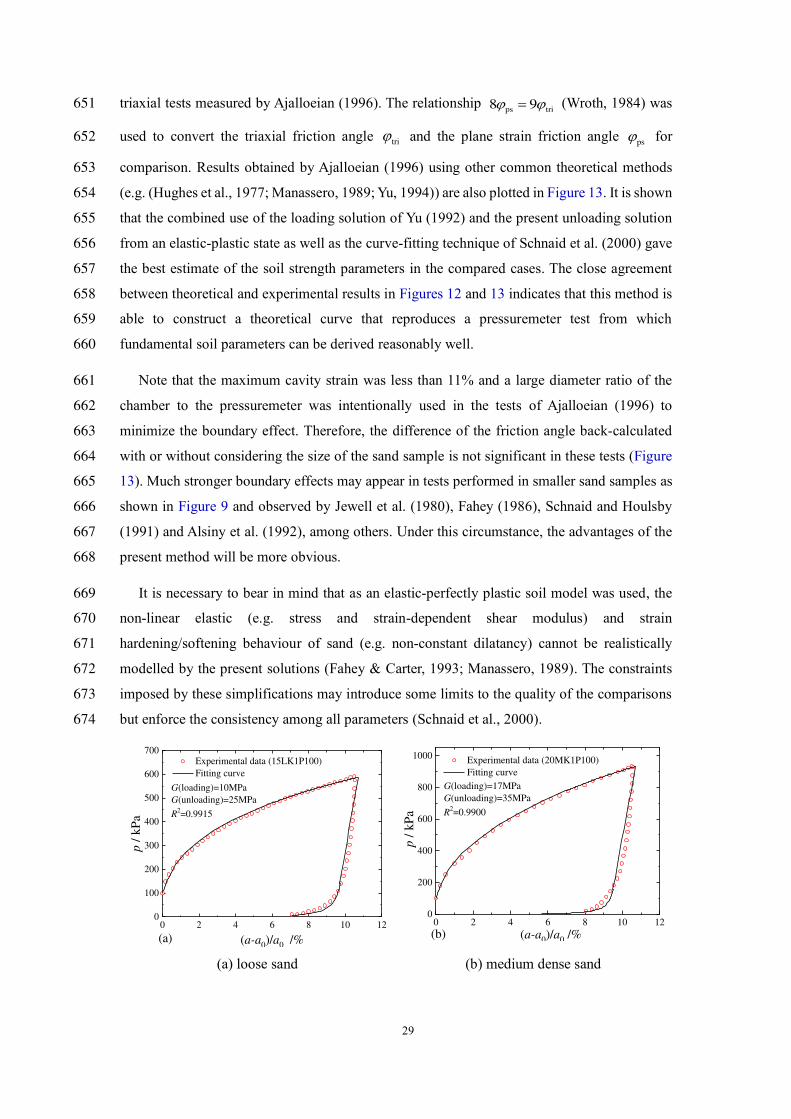
of that will be detailed in the next section. 280
Solutions for unloading from a partially/fully plastic state 281
This section presents solutions for the analysis of a cavity unloading from a partially or fully 282
plastic stress state (namely cases II and III in Figure 1, 20 le limp p ). 283
Elastic unloading analysis 284
Initially, the unloading is purely elastic. Upon elastic unloading, changes in the stress and 285
displacement can be determined by solving Equations (1), (17) and (18), which gives: 286
1
2 2
2 20 1
2 2
1( )
1
k
r k
b rp p
b a
(45) 287
1
2 2
2 20 1
2 2
1( )
1
k
k
b r kp p
b a
(46) 288
1 1
2 20 2 22 1 1
2 22 2 2
11 1
1 21 1
k k
k k k
p p r rvu r v kv
b k v k bMr a b
(47) 289
Reverse plasticity occurs once the Mohr-Coulomb yield criterion Equation (6) is satisfied. 290
This condition is firstly satisfied at the inner wall when the cavity pressure reaches its elastic 291
limit 2elim 2p . Combining Equation (6), (10), (11), (45) and (46), it gives: 292
11
1 20 20 2 2
2elim 2 20 1
2 2
1 1
1/ 1
kk
k
A c a b ap p
k b a
(48) 293
Elastic-plastic unloading analysis 294
As the cavity pressure p2 further reduces, a reverse plastic zone forms and spreads outwards 295

13
from the inner wall of the cavity (i.e. a2≤r2≤d2). Equations (2) and (3) define that the current 296
stress state in the soil depends on both the residual stresses due to previous loading and the 297
stress changes due to unloading. Hence, for a cavity unloading from a partially plastic state (i.e. 298
case II in Figure 1), the solution needs to be discussed according to the relative size of the 299
loading-induced plastic zone and the reverse plastic zone as illustrated in Figure 2. The elastic-300
plastic unloading behaviour of a cavity unloading from a fully plastic state (i.e. case III in Figure 301
1) is studied simultaneously as follows. 302
c2d2 b2a2
r2
o
(a)
c2 d2 b2
a2
r2
o
(b)
(a) Phase with 2 2 2d c b (b) Phase with 2 2 2c d b
Figure2. Distribution of stress states
Unloading Phase with 2 2 2d c b 303
(1) Stress analysis 304
The unloading-induced changes of the principal stresses in the elastic unloading zone (i.e. 305
d2≤r2≤b2, Figure 2a) can be determined by solving Equations (1), (17) and (18) as: 306
1
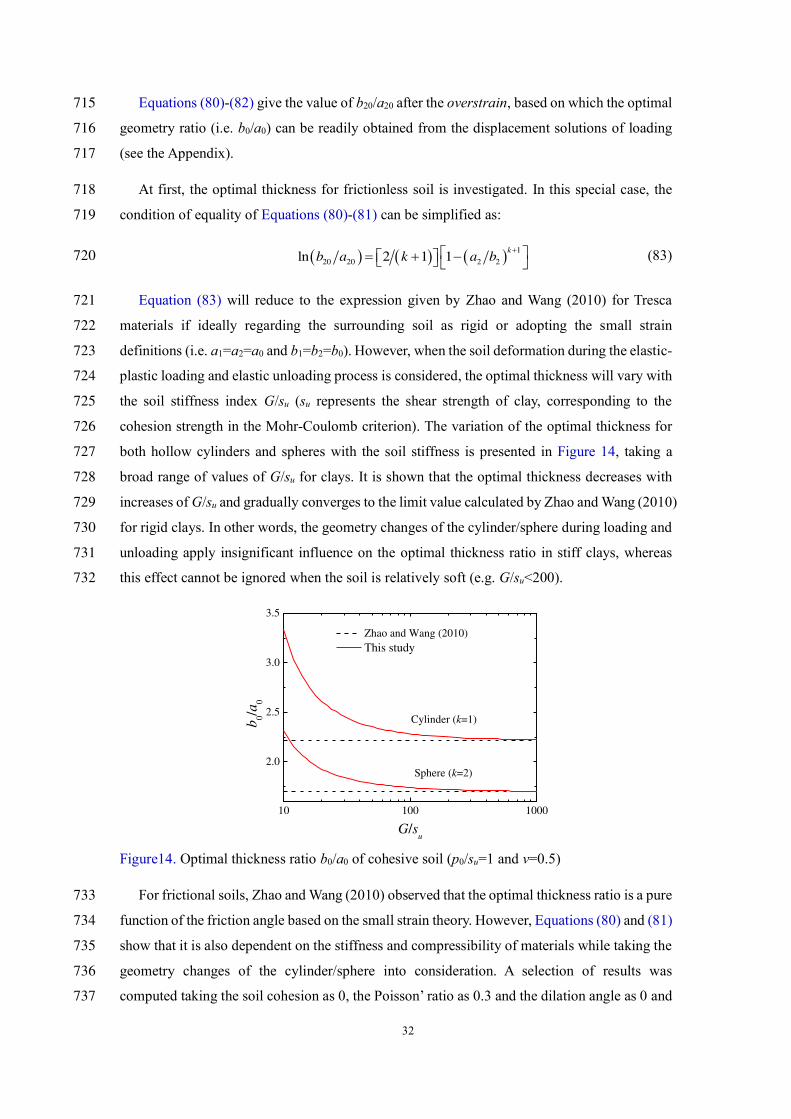
2 2 2 2 1k
rB b r
(49) 307
1
2 2 2 2 1k
B b r k
(50) 308
In the reverse plastic zone (a2≤r2≤d2), the principal stresses are determined by jointly solving 309
Equations (1) and (6) as: 310
2
1
2 22 21k
r Y A d r
(51) 311
1
2 22 2 21k
Y A d r
(52) 312
The constants B2-2 and A2-2 of integration can be determined based on the continuity 313
condition of stress components at the outer radius of the reverse plastic interface (i.e. at r2=d2) 314
as: 315

14
1
1 20 20
1
2 2
2 2
1
1 1
k
k
A c dB
k b d
(while 2 2 2d c b ) (53) 316
1
1
2 2 1 202 2 2 202 1k
kA B b d A c d
(while 2 2 2d c b ) (54) 317
(2) Displacement analysis 318
In the elastic unloading zone (d2≤r2≤b2), the radial displacement can be obtained by integrating 319
Equations (17) and (18) with inputs of Equations (49) and (50) as: 320
1
2 22
2
2 2 11
1 2 1 2
k
B r bv v v kvu r v kv
M v k v k k r
(55) 321
The below relationship between strain and stress is established with reference to the state at 322
the completion of unloading, taking a procedure akin to that of obtaining Equation (34). 323
1
1 11 2 1 2
r r
k v kvk k v kv
M v k v k
(56) 324
According to the definition of logarithmic strains, r
and are expressed as: 325
2 20ln d dr r r , 2 20ln r r (57 a,b) 326
Substituting Equations (57 a,b) into Equation (56) gives: 327
1
1
2 2 20 20 1 2 2 1 20 20ln d dk
kk kr r r r d r c r
(58) 328
in which 329
2 2
1= 1 11 2 1 2
A k v kvk v kv
M v k v k
(59) 330
1
1
1= 1 1
1 2 1 2
A k v kvk v kv
M v k v k
(60) 331
In this case, two transformation variables are introduced, namely: 332
1
2 1 2 2=k
r d r
1
20 1 20 20( )=k
r c r
(61 a,b) 333
Then integrating Equation (58) over the interval [r2, d2] leads to: 334

15
2 20
2 20
( ) ( )1 1 1 1
2 1 1 1( ) ( )
d d =0d d
k k
r rd e c e
(62) 335
Placing r20=a20 and r2=a2, Equation (62) can be solved with the aid of infinite series as: 336
1
1 12 12 2
0 0
1 0!
k nk n
n
n n
dd a
n n
(63) 337
where 338
1
20 1 20
201
1 1 120 1
20 20 20 20
1ln , if =
!
, otherwise!
k n
n k n k n k n
kc an
n d
cc d c a
n n
(64) 339
While taking 0b , the above solution reduces to the large-strain solution of Yu and 340
Houlsby (1995) for the cavity contraction analysis in an infinitely large soil mass. 341
Note that the above solution can also be applied in the analysis of a cavity unloading from 342
a fully plastic stress state before it reaches the reverse fully plastic phase because the condition 343
of 2 2d c is always fulfilled in this case. However, care should be exercised in the calculation 344
of the residual stress field in the soil as it is different between the partially plastic expansion 345
state and the fully plastic expansion state. 346
Unloading Phase with 2 2 2c d b 347
(1) Stress analysis 348
The unloading phase of 2 2 2c d b (Figure 2b) is likely to occur in a lightly pre-loaded soil 349
mass. In this phase, the stress solutions of Equations (49) and (50) for the elastic unloading 350
zone (i.e. d2≤r2≤b2) and Equation (51) and (52) for the reverse plastic zone (a2≤r2≤d2) are still 351
valid. However, the constants of integration B2-2 and A2-2 need to be replaced by B2-3 and A2-3 352
below respectively as the stress conditions at r2=d2 changed. 353
1
0 1 20 20
2 3 1
2 2
1 1 1=
1 1
k
k
Y p B k b dB
k b d
(while 2 2 2c d b ) (65) 354
1 1
0 20 22 3 1 2 3
20 2
11 1
1
k k
Y p b bA B B
d d
(while 2 2 2c d b ) (66) 355
Then according to Equation (2) and (3) (i.e. 2 20r r r and 2 20 ), the 356

16
changes in stress due to unloading can be readily determined using Equation (10), (11), (51), 357
(52), (65) and (66) for the zone a2≤r2≤c2 (named as loading plastic and reverse plastic zone) 358
and Equations (12), (13), (51), (52), (65) and (66) for the zone c2≤r2≤d2 (named as loading 359
elastic and reverse plastic zone), respectively. 360
(2) Displacement analysis 361
In this unloading phase, the radial displacement in the elastic zone (i.e. d2≤r2≤b2) can be 362
calculated by Equation (55) with the value of B2-3 of Equation (65). 363
In the reverse plastic zone a2≤r2≤d2 (Figure 2b), a large-strain displacement analysis can be 364
carried out following the same procedure of deriving Equations (31)-(64). However, due to the 365
difference in the residual stress field between the zone of a2≤r2≤c2 and the zone of c2≤r2≤d2, the 366
distribution of displacement in the soil now needs to be derived by considering these two zones 367
separately, which is continuous at the interface r2=c2. 368
In the loading-elastic and reverse plastic zone of c2≤r2≤d2, substituting Equations (12), (13), 369
(51), (52), (57 a,b), (65) and (66) into Equation (56) leads to: 370
1 1
2 2 20 20 1 2 2 2 2 20 20ln d d lnk kk k
r r r r d r b r (67) 371
where 372
1 0 1
1ln 1 1
1 2 1 2 1
k v kv Yk v kv p B
M v k v k
(68) 373
1
2 = 1 11 2 1 2
B k v vv kv
M v k v k
(69) 374
2 3
2 = 1 11 2 1 2
A k v kvk v kv
M v k v k
(70) 375
Then the integration of Equation (67) in the interval of [c2, d2] gives: 376
1
1 22 22 2
0 0
11 0
1 !
k nk n
n
n n
dkd c
k n n
(71) 377
where 378

17
1
1 20 2 20
202
1 1 11 11 20 2 1 1
20 20 20 20
1 1ln , if =
! 1
, otherwise1
!1
k n
k n k kn n k n k
k k
b k c kn
n d k
bb d b c
kn n
k
(72) 379
In the loading-plastic and reverse plastic zone of a2≤r2≤c2, the displacement at r2=a2 can be 380
obtained by integrating Equation (67) in the interval of [a2, c2], which is: 381
1
1 1 32 22 2 2 2
0 0
0!
k nk n k n
n
n n
dd c d a
n n
(73) 382
where 383
1
20 1 20
203
1 120 1
20 20
1ln , if =
!
1 , otherwise!
k n
n k n k n
kc an
n c
cc a
n n
(74) 384
Reverse fully plastic unloading analysis 385
With sufficiently large contraction, the cylinder/sphere of soil will enter a fully plastic 386
unloading phase. This may be reached from either a partially plastic state (i.e. case II in Figure 387
1) or a fully plastic state (i.e. case III in Figure 1) as studied separately below. 388
Reverse fully plastic unloading of Case II 389
This state follows the unloading phase of 2 2 2c d b that was studied previously. The stress 390
solution of Equations (51) and (52) still holds in this phase, but 2 2A and d2 therein need to be 391
replaced by 2 4A and b2, respectively. The new integration constant 2 4A is determined 392
according to the given stress boundary conditions in Equation (5 a,b) as: 393
2 4 0 1A p Y (while 2 2 2c d b ) (75) 394
The distribution of displacement in the soil can be obtained with the same procedure of 395
deriving Equations (67)-(74), considering the zone a2≤r2≤c2 and the zone of c2≤r2≤b2 separately. 396
Similarly, it is found that the displacement solution can be obtained by replacing 2 4A and d2 397
with 2 4A and b2, respectively, in Equation (67)-(74). 398
Reverse fully plastic unloading of Case III 399
This is for the fully plastic unloading analysis of the case that the soil cylinder/sphere was 400

18
previously loaded to be fully plastic ( 2 2c b ). In this case, the stress distribution in the soil can 401
be obtained by Equation (51) and (52), replacing d2 and 2 2A with b2 and the new constant 402
2 5A (i.e. Equation (76)), respectively. 403
2 5 2 4 0 1A A p Y (while 2 2 2c d b ) (76) 404
The large-strain displacement of the surrounding soil during this fully plastic unloading 405
phase can be described by Equations (55), (56), (59) and (60) as well while replacing d2, 1c , 406
and 2 2A therein with b2, b2 and 2 5A , respectively. 407
Solution procedure 408
All the necessary information for determining the pressure-contraction curve and stress 409
distributions has been given. As the pressure-expansion relationship is not expressed in terms 410
of a single equation, it is instructive to summarize the procedure that can be used to construct 411
the complete pressure-contraction curve as below: 412
(1) Choose input soil parameters: E, v, c, φ, ψ; in-situ stress: p0; cavity geometry information: 413
k, b0 and a0; and the reference state parameter: a20; 414
(2) Calculate the derived parameters G, Y, α, β, γ, M and the reverse limit 2elim 2p (Equation 415
(48)); 416
(3) Calculate the pressure-expansion curve in the loading process until the inner cavity radii 417
reaches a20, and then record c20, b20, and p20 for elastic-plastic loading process, or b20 and p20 418
for fully plastic loading process. The solution procedure is available in Yu (1992, 1993); 419
(4) Calculate A1 and B1 from Equations (14) and (15), respectively, with the known value of 420
c20 and b20. The stress field at the end of loading process (σr20 and ∆σθ20) can be obtained from 421
Equations (10) and (11) for the plastic zone and Equations (12) and (13) for the elastic zone; 422
(5) For elastic unloading analysis, choose a pressure p2 (p20<p2< 2elim 2p ) and calculate ∆σr 423
and ∆σθ from Equations (45) and (46), respectively. Then the distribution of stress can be 424
obtained from Equations (2), (3) and (10)-(13). And the relative displacement ∆u could be 425
calculated from Equation (47); 426
(6) If p2< 2elim 2p , elastic-plastic (a20<c20<b20) or fully plastic (c20=b20) unloading analysis is 427
needed; 428
(7) In the case of a20<c20<b20 (Case II in Figure 1): 429

19
(a) while 2 2 2d c b , choose a value of d20 (a20<d20<c20), calculate d2 and b2 from 430
Equation (55) with the known value of d20 and b20; then calculate a2 from Equations (63) and 431
(64) with the known values of d2, d20, b2 and c20, and p2 from Equations (51) and (54). 432
When d20, d2, b2 are known, B2-2 and A2-2 can be calculated from Equations (53) and (54), 433
and then the distribution of stress can also be derived from Equations (49)-(52). 434
(b) while 2 2 2c d b , choose a value of d20 (c20<d20<b20), calculate d2 and b2 from 435
Equation (55) with the known value of d20 and b20; calculate c2 from Equations (71) and (72) 436
with the known values of d2, d20, b2 and c20; calculate a2 from Equations (73) and (74); then 437
calculate p2 from Equation (51) by setting r2=a2. Note that in all calculations of this phase, 438
A2-2 and B2-2 need to be replaced by A2-3 and B2-3 (Equations (65) and (66)), respectively; 439
With the values of A2-3, B2-3, b2 and d2, the distribution of stress components can be 440
calculated from Equations (49)-(52) by replacing A2-2 and B2-2 with A2-3 and B2-3, respectively. 441
(c) while d2=b2, choose a value of b2/c2 (greater than b20/c20), calculate c2 and b2 from 442
Equations (71) and (72); calculate a2 from Equations (73) and (74) with the known values of 443
b2 and c2; then calculate p2 from Equation (51) with r2=a2. In this phase, A2-2 in the relevant 444
equations needs to be replaced by A2-4 (Equation (75)), and the stress components can be 445
obtained from Equations (51) and (52). 446
(d) For the case of c20<b20, repetition of steps of (a) and (b) for varying d20, and (c) for 447
varying b2/c2 provides the data for a complete pressure-contraction curve. 448
(8) In the case of c20=b20 (Case III in Figure 1): 449
(e) while d2< c2=b2, step (a) still holds; 450
(f) while c2= d2= b2, choose a value of b2/c2 (greater than the value of b2/c2 in the previous 451
step), calculate b2 and a2 from Equations (63) and (64); then calculate p2 from Equation (51) 452
with r2=a2. In this phase, A2-2 in the relevant equations needs to be replaced by A2-5 (Equation 453
(76)). Similarly, the distribution of stress components can be obtained from Equations (51) 454
and (52) by replacing A2-2 by A2-5. 455
Repetition of steps of (e) for varying d20 and (f) for varying of b2/a2 provides the data for 456
complete pressure-contraction curve. Note that, for the cases in a frictionless soil, results can 457
be calculated with the above solutions using very small φ values. 458

20
Solution validation and result analysis 459
Unloading curves from an in-situ stress state 460
At first, the unloading solution from an in-situ stress state is validated by comparing with the 461
solution of Vrakas and Anagnostou (2014) in the special case of a cavity in an infinite soil mass. 462
Taking the material parameters: p0=22.5MPa, E=2000MPa, c=0.25MPa, φ=23o, ψ=3o and 463
v=0.25 that were used by Vrakas and Anagnostou (2014), both the pressure-contraction curve 464
and the distribution of stresses and the radial displacement at the moment of p2=0MPa were 465
calculated, and they are compared with those obtained by Vrakas and Anagnostou (2014) in 466
Figure 3. The comparisons in Figure 3 indicate that their solution can be recovered by the 467
present solution assuming 0 0/b a , neglecting the out-of-plane plastic flow effect which 468
proved to be insignificant (Reed, 1986; Vrakas & Anagnostou, 2014). 469
(a) pressure-contraction curve. (b) distribution of stresses and radial displacement.
Figure3. A cylindrical cavity unloading from an in-situ stress state (Sedrun section of the
Gotthard Base Tunnel (Vrakas & Anagnostou, 2014))
(a) cylinders (b) spheres
Figure4. Pressure-contraction curves with varying b0/a0
0.0 0.5 1.0 1.5 2.0 2.50
10
20
30
40
50
60
70
[u2(a
2)/
a0]
/%
p2 / MPa
Vrakas and Anagnostou (2014)
This study
(a)
0 1 2 3 4 5 6 7 8 90
10
20
30
40
50
60
70
0
5
10
15
20
25
30
35
[u2(a
2)/
a0]
/% 2
r2 / a0
(r0-r2)/a0
r2
(b)
/
MP
a
Vrakas and Anagnostou (2014)
This study
plastic zone elastic zone
0 20 40 60 80 100
0.0
0.2
0.4
0.6
0.8
1.0
(a)
p2 /
p0
[u2(a2) / a0] /%
b0/a0=2
b0/a0=3
b0/a0=5
b0/a0=10
b0/a0=10000
fully plastic point
0 10 20 30 40 50 60
0.0
0.2
0.4
0.6
0.8
1.0
(b)
p2 /
p0
[u2(a2) / a0] /%
b0/a0=2
b0/a0=3
b0/a0=5
b0/a0=10
b0/a0=10000
fully plastic point

21
To indicate the effects of the cavity geometry ratio b0/a0, example cavity pressure-470
contraction curves with different values of b0/a0 are computed using the same material 471
parameters as above. The results in Figure 4 show that the value of b0/a0 greatly influences the 472
cavity unloading behaviour when it is smaller than a limit value for both hollow cylinders and 473
spheres. The value of this limit ratio varies with soil properties and is generally smaller for a 474
hollow sphere than a cylinder. With the same level of contraction (e.g. (a20-a0)/a0), the 475
magnitude of unloading (e.g. (p20-p0)/p0) is smaller for a thinner cylinder/sphere of soil while 476
b0/a0 is smaller than the limit ratio. In other words, with the same magnitude of unloading, 477
greater radial contraction may occur for a thinner hollow cylinder/sphere. Tunneling involves 478
the removal of soil/rock masses from their initial locations, and this is analogy to the problem 479
of cavity unloading from an in-situ stress state (Mair & Taylor, 1993; Mo & Yu, 2017; Ogawa 480
& Lo, 1987; Vrakas & Anagnostou, 2014; Yu & Rowe, 1999). Experimental results (e.g. (Franza 481
et al., 2019)) have shown that the ground response curves (GRCs) of shallow tunnels in sands 482
vary with the tunnel depth ratio (e.g. soil cover depth/tunnel radius) in a very similar fashion as 483
that is shown in Figure 4. 484
Apart from the geometry ratio b0/a0, soil strength and stiffness parameters also affect the 485
cavity unloading behaviour. Their influences are akin to those observed in unloading analyses 486
of a cavity in an infinite soil mass, which can refer to the results of Yu and Rowe (1999) and 487
Vrakas and Anagnostou (2014). 488
Unloading curves from a partially/fully plastic state 489
Using the same soil model, Yu and Houlsby (1995) developed an analytical large-strain solution 490
for unloading analysis of an infinite soil mass under a loading-induced partially plastic state. 491
The paper extended their solution to the more general case of a hollow cylinder/sphere of soil. 492
For validation, results obtained by these two solutions are compared in Figure 5. It is shown 493
that the present solution can exactly recover to their solution, taking 0 0/b a . Note that the 494
solutions of Yu (1992, 1993) were used to calculate the expansion curves and the reference 495
stress state in the validation and following analyses. 496

22
1 2 3 4 50
10
20
30
40
50
60
70
=30, =0
=40, =12.5
p/p
0
a/a0
Symbol: Yu and Houlsby (1995)
Line : This study
=50, =25
(a)
1 2 3 4 50
50
100
150
200
250
300
=30, =0
=40, =12.5p/p
0
a/a0
Symbol: Yu and Houlsby (1995)
Line : This study
=50, =25
(b)
(a) cylindrical cavities (b) spherical cavities
Figure5. Comparison with results of Yu and Houlsby (1995) (E/p0=1300, v=0.3 and c=0).
To show the effects of the reference stress state on the unloading behaviour of a finite soil 497
mass, a selection of results of loading and unloading curves with different magnitudes of 498
preloading and values of b0/a0 are presented in Figures 6-9. The soil parameters of φ=40o, ψ=20o, 499
v=0.3, c=0 and E/p0=1300 were used. In Figures 6 and 7, two typical ratios of the initial outer 500
to inner radii of a finite soil mass are considered (e.g. b0/a0=10000 or b0/a0=5), and the 501
unloading is assumed to start after different magnitudes of expansion (i.e. a20/a0). In Figures 8 502
and 9, loading and unloading curves with different values of b0/a0 are plotted, in which the 503
applied cavity pressure is removed when the expansion ratio a20/a0 is equal to 3 and 1.15, 504
respectively. In the figures, the triangle represents the point when the elastic-plastic interface 505
reaches the outer boundary of the hollow cylinder/sphere during loading (i.e. c1=b1); the circle 506
for each curve represents the point when plastic unloading occurs (i.e. d2=a2). 507
(a) b0/a0=10000 (b) b0/a0=5
Figure6. Unloading curves of soil cylinders from varying reference stress states
0.98 0.99 1.00 1.01 1.02 1.03 1.04 1.05
0
2
4
6
8
10
p/p
0
a/a0(a)
0.98 0.99 1.00 1.01 1.02 1.03 1.04 1.05
0.0
0.5
1.0
1.5
2.0
2.5
3.0
3.5
p /p
0
a/a0(b)
fully plastic
expansion

23
(a) b0/a0=10000 (b) b0/a0=5
Figure7. Unloading curves of soil spheres from varying reference stress states
(a) cylinders (b) spheres
Figure8. Variation of loading and unloading curves with b0/a0 (a20/a0=3)
(a) cylinders (b) spheres
Figure9. Variation of loading and unloading curves with b0/a0 (a20/a0=1.15)
Figures 6-9 show that initially the internal cavity pressure reduces rapidly with cavity 508
1.00 1.01 1.02 1.03 1.04 1.050
5
10
15
20
25
30
p/p
0
a/a0(a)
1.00 1.01 1.02 1.03 1.04 1.05
0
2
4
6
8
10
12
p/p
0
a/a0
fully plastic
expansion
(b)
1.0 1.5 2.0 2.5 3.0
0
10
20
30
40
a/a0
50
10
30
100
200
b0/a0=
p/p
0
(a)1.0 1.5 2.0 2.5 3.0
0
20
40
60
80
100
120
140
160
a/a0
p/p
0
b0/a0=
70
50
30
20
(b)
1.00 1.03 1.06 1.09 1.12 1.15
0
4
8
12
16
20
p/p
0
a/a0(a)
b0/a0=
50
30
20
10
1.00 1.03 1.06 1.09 1.12 1.15
0
10
20
30
40
50
60
p/p
0
a/a0(b)
b0/a0=
15
12
10
5

24
contractions in the elastic unloading phase (i.e. Equations (45)-(47)). The unloading curves in 509
the non-dimensional plot of p2/p0 against a2/a0 are almost linear and parallel with each other in 510
this phase. Although the slope of the unloading curve is insensitive to the initial geometry ratio 511
b0/a0 and the previous loading history (e.g. a20/a0), these factors affect the maximum amount of 512
the stress reduction during elastic unloading. Due to the residual stresses generated during 513
previous loading (i.e. the so-called ‘overstrain’ effect (Hill, 1950; Zhao & Wang, 2010)), the 514
elastic unloading process is much longer than the initial elastic loading process. 515
The above intrinsic characteristics of the elastic unloading process have been used in various 516
applications such as the control of unloading-reloading loops of pressuremeter tests and the 517
shakedown analysis. As pointed out by Wroth (1982), the soil stiffness can be obtained from 518
the unloading-reloading loop of self-boring pressuremeter tests. While conducting unloading-519
reloading loops, it is important to ensure that the loop deformation remains in an elastic state. 520
For a linear elastic-perfectly plastic Mohr-Coulomb material, Equations (10) and (48) can be 521
used to determine the maximum reduction of the effective pressure allowed for elastic 522
unloading in pressuremeter tests. In an infinite soil mass, the maximum cavity pressure 523
reduction is a function of soil strength parameters (e.g. friction angle and cohesion) and the 524
loading-induced stress state (e.g. p20) (Wroth, 1982; Zhao & Wang, 2010). However, it also 525
varies with the value of b0/a0 for the unloading of a finite soil mass (e.g. Figures 6(b), 7(b), 8 526
and 9). An example application to the shakedown analysis will be given in the next section. 527
Once the cavity pressure reduces to be smaller than the elastic limit (i.e. Equation (48)), the 528
unloading curve becomes highly non-linear as reverse yielding occurs in the soil. The radial 529
convergence accelerates as the plastic region spreads out with smaller internal confining 530
pressure. When the cavity pressure reaches a sufficiently low value, the radial convergence 531
increases sharply until the inner cavity is filled. In general, the speed of transition from a purely 532
elastic state to the steady or limit state during unloading is much faster than that occurred in the 533
initial loading process, and it varies with the cavity shape (normally, it is faster for a spherical 534
cavity than a cylindrical cavity). The minimum internal pressure that the soil can sustain mainly 535
depends on the soil strength parameters as defined in Equation (51), for example, it is close to 536
zero for cohesionless soils but could be negative for cohesive soils or rocks. Figures 6-9 show 537
that this limit value of unloading pressure does not significantly vary with the value of b0/a0 538
and the loading history. 539
As mentioned previously, experimental studies on both self-boring and full-displacement 540
pressuremeters (Hughes & Robertson, 1985; Schnaid & Houlsby, 1992) have shown the 541
unloading portion of pressuremeter curves is less sensitive to initial soil disturbance than the 542
loading portion. This is consistently observed in the results of Figures 6-9. Besides, the results 543
25
indicate that the shape of the unloading curve is also less sensitive to the geometry ratio b0/a0 544
than the loading curve in a finite soil mass. This suggests that the use of the unloading curve of 545
pressuremeter tests to measure the soil properties may also help to remove the boundary effects 546
that are commonly encountered in small-sized calibration chambers. 547
Example geotechnical applications 548
Thickness of frozen cylinder earth walls 549
Artificial ground freezing has been widely used to stabilize temporarily the ground in order to 550
provide ground support and/or exclude groundwater from an excavation until the final retaining 551
and lining structures are constructed (Andersland & Ladanyi, 2004; Sanger & Sayles, 1979; 552
Viggiani & Casini, 2015; Zhang et al., 2018). From a structural point of view, determination of 553
the geometry and the thickness of a frozen wall is one of the main concerns for practitioners. 554
Because of the relatively high compressive and low tensile strengths of frozen soil, curved arch 555
walls, particularly circular walls, are often selected with priority. The unloading model of a 556
cylinder unloading from an in-situ stress state that was studied previously has been commonly 557
used to determine the thickness of a circular frozen wall (Andersland & Ladanyi, 2004; Klein 558
& Gerthold, 1979; Sanger & Sayles, 1979). For example, assuming 2 2
2 0r r bp
and 559
2 22 0r r a
(i.e. no internal support), Sanger and Sayles (1979) proposed Equation (77) to 560
estimate the minimum thickness of a cylinder wall. Klein and Gerthold (1979) extended this 561
solution to the case where the internal pressure acting on the wall equals 2p (i.e. 562
2 22 2r r a
p
), thereby Equation (78) was given. These solutions were obtained by solving 563
the equilibrium equation (1) and the Mohr-Coulomb yield function (6). Therefore, they can be 564
recovered by Equation (26) or (30) considering the boundary conditions they adopted. 565
1 00 0
cot
cot
p cb a
c
(77) 566
1 00 0
2
cot
cot
p cb a
p c
(78) 567
In both Equations (77) and (78), a hidden assumption is that the cylinder wall of frozen soil 568
becomes unstable once it becomes fully plastic. This is a typical large deformation problem, 569
and displacements of the cavity during elastic-plastic contractions can be calculated by using 570
Equations (30), (32a, b) and (44). Adopting the criterion of Sanger and Sayles (1979) (i.e. 571
2fp lim 0p in Equation (30)), new results are calculated considering the large deformation 572

26
effects with typical soil properties of v=0.3, E/p0=100 and ψ=min(0, φ-20). The new results are 573
compared with the published results of Sanger and Sayles (1979) in Figure 10. It is shown that 574
Equation (77) tends to give conservative predictions of the minimum thickness of a cylinder 575
wall due to the lack of accounting for its radial convergence, whose effects become more 576
significant at larger values of the in-situ earth pressure and the friction angle of soil. 577
Figure10. Comparison of design charts for circular frozen walls
In addition to the requirement of stability, frozen earth walls may also be designed under 578
displacement control on the basis of required excavation limits and the available space on site 579
(Andersland & Ladanyi, 2004). For example, taking 2% cavity strain (i.e. a2/a0=0.98) as the 580
maximum allowable radial convergence of a cylinder wall, the minimum internal pressure 581
required can be obtained by the cylindrical unloading solution from an in-situ state. Example 582
results are presented in Figure 11 with varying strength and stiffness parameters of frozen soils. 583
It is shown that the self-stability of a cylinder wall, in general, increases with the thickness ratio, 584
the frictional strength and stiffness of the soil, thus less internal support is required accordingly. 585
Adopting different control standards, the application of the large strain in-situ unloading 586
solution to the preliminary structural design of frozen cylinder walls is illustrated in Figures 10 587
and 11. It needs to be pointed out that the boundary conditions at the outer wall of the cylinder 588
were simplified as a constant radial pressure whose value equals the in-situ stress. In fact, 589
however, the outside confining pressure may reduce with contractions of the cylinder. Thus, 590
this method still tends to be conservative as well. Additionally, it should bear in mind that the 591
above analyses focused on the short-term unloading behaviour. For the long-term stability and 592
deformation analysis, the time-dependent behaviour of frozen soils (e.g. creep strength) needs 593
to be taken into account (Andersland & Ladanyi, 2004; Sanger & Sayles, 1979). 594
1.0 1.1 1.2 1.3 1.4 1.50
1
2
3
4
5
6
=10
=20
=30p
0/c
b0/a
0
Sanger and Sayles (1979)
This Study =40

27
(a) variation with angle of friction (E/p0=100) (b) variation with stiffness (φ=30°)
Figure11. Internal cavity pressure at a radial displacement of 2% (v=0.3 and c/p0=0.3)
Prediction of pressuremeter curves 595
Based on the analogy between pressuremeter tests and a long cylindrical cavity upon loading 596
and unloading, cavity expansion and contraction solutions have been used in the interpretation 597
of pressuremeter tests with considerable success (Clarke, 1995; Mair & Wood, 1987; Wroth, 598
1984; Yu, 2000). As summarized by Schnaid et al. (2000), the methods of interpreting 599
pressuremeter tests can be broadly categorised into two groups: in the first group each 600
parameter of soil is assessed independently from one portion of the pressuremeter curve; in the 601
second the whole pressuremeter curve (both loading and unloading portions) is taken into 602
account. Using the closed-form expansion and contraction solutions of Yu and Houlsby 603
(1991,1995), Schnaid et al. (2000) analysed many site pressuremeter tests, from which a set of 604
fundamental parameters of soil can be derived. In modelling site pressuremeter tests, it is 605
reasonable to assume the surrounding soil to be horizontally infinite. However, this might be 606
questionable for the modelling of laboratory pressuremeter tests in small-sized calibration 607
chambers as highlighted previously (Alsiny et al., 1992; Fahey, 1986; Jewell et al., 1980; Juran 608
& BenSaid, 1987; Schnaid & Houlsby, 1991). 609
To account for the possible boundary effects during cavity expansion, Yu (1992, 1993) 610
extended the solution of Yu and Houlsby (1991) to the case in a finite soil mass. Likewise, an 611
extension of the solution of Yu and Houlsby (1995) was obtained in this paper for the analysis 612
of a cavity in a finite soil mass. Now, using the loading solution of Yu (1992) and the present 613
unloading solution in combination, the method proposed by Schnaid et al. (2000) can be 614
extended for the interpretation of pressuremeter tests performed in calibration chambers of a 615
constant lateral stress boundary (i.e. the BC1-type boundary (Ghionna & Jamiolkowski, 1991)). 616
This is evaluated by comparing with the experimental results of pressuremeter tests obtained 617
by Ajalloeian (1996). 618
1.0 1.2 1.4 1.6 1.8 2.00.0
0.2
0.4
0.6
0.8
1.0
p2 /
p0
b0/a0
=10
=20
=30
=40
=50
(a)
1.0 1.2 1.4 1.6 1.8 2.00.0
0.2
0.4
0.6
0.8
1.0
p2 /
p0
b0/a0
E/p0=100
E/p0=150
E/p0=200
E/p0=300
E/p0=
(b)

28
A number of pressuremeter tests were performed by Ajalloeian (1996) in a calibration 619
chamber using dry Stockton Beach sand. The ratio of the chamber diameter (1000mm) to the 620
pressuremeter diameter D (30mm) was 33.3. As the pressuremeter is assumed to be infinitely 621
long in the plane strain cylindrical cavity model, test data obtained with pressuremeters of the 622
longest membrane length L available were selected in the analysis to minimize the possible end 623
effects (Ajalloeian & Yu, 1998; Houlsby & Carter, 1993). In specific, L/D was 15 for the test in 624
the loose sand (test ID: 15LK1P100, relative density Dr=27.5%); L/D was 20 for the tests in the 625
medium dense (test ID: 20MK1P100, Dr=63.3%) and dense sand samples (test ID: 20DK1P100, 626
Dr=86.8%) (see Figure 12). 627
Based on the loading solution of Yu (1992) and the unloading solution of this study 628
(Equations (45)-(76)), the pressuremeter tests are interpreted following the curve fitting method 629
proposed by Schnaid et al. (2000) as follows: 630
(a) Initial stress state. The initial mean effective stress was 100kPa and the initial stress ratio 631
of the effective vertical stress to the effective horizontal stress was 1 in the tests (Ajalloeian, 632
1996). The same initial stress state was used in the modelling. 633
(b) Shear modulus. For the loading portion, the curve fitting was initiated using the tangent 634
stiffness value of the initial portion of the loading curve (Ajalloeian, 1996); for the unloading 635
portion, the value of the shear modulus was estimated by drawing a single line between the 636
point that defines the end of the loading and the representative point of the theoretical plastic 637
reverse of the experimental unloading curve (Schnaid et al., 2000). The Poisson’s ratio was 638
assumed to be 0.3. 639
(c) Strength parameters. The dilation angle was calculated using the correlation of Rowe 640
(1962) (i.e. Equation (79)). The critical state friction angle cv of the Stockton Beach sand 641
required in Equation (79) is 31o (Ajalloeian, 1996). The cohesion was set as zero for the dry 642
sand. Then based on the cavity expansion and contraction solutions and the measured 643
pressuremeter curves (both loading and unloading portions), the plane strain friction angle ps 644
was back-calculated using a curve fitting technique. 645
ps cv
ps cv
sin sinsin
1 sin sin
(79) 646
Figure 12 presents the predicted and the measured loading and unloading curves. The 647
comparison shows that a good fit (the correlation coefficient R2>0.99 in all three cases 648
compared) was achieved between theory and data over the whole curve of loading and 649
unloading. In Figure 13, the back-calculated friction angles are compared with the data from 650
29
triaxial tests measured by Ajalloeian (1996). The relationship ps tri8 9 (Wroth, 1984) was 651
used to convert the triaxial friction angle tri and the plane strain friction angle ps for 652
comparison. Results obtained by Ajalloeian (1996) using other common theoretical methods 653
(e.g. (Hughes et al., 1977; Manassero, 1989; Yu, 1994)) are also plotted in Figure 13. It is shown 654
that the combined use of the loading solution of Yu (1992) and the present unloading solution 655
from an elastic-plastic state as well as the curve-fitting technique of Schnaid et al. (2000) gave 656
the best estimate of the soil strength parameters in the compared cases. The close agreement 657
between theoretical and experimental results in Figures 12 and 13 indicates that this method is 658
able to construct a theoretical curve that reproduces a pressuremeter test from which 659
fundamental soil parameters can be derived reasonably well. 660
Note that the maximum cavity strain was less than 11% and a large diameter ratio of the 661
chamber to the pressuremeter was intentionally used in the tests of Ajalloeian (1996) to 662
minimize the boundary effect. Therefore, the difference of the friction angle back-calculated 663
with or without considering the size of the sand sample is not significant in these tests (Figure 664
13). Much stronger boundary effects may appear in tests performed in smaller sand samples as 665
shown in Figure 9 and observed by Jewell et al. (1980), Fahey (1986), Schnaid and Houlsby 666
(1991) and Alsiny et al. (1992), among others. Under this circumstance, the advantages of the 667
present method will be more obvious. 668
It is necessary to bear in mind that as an elastic-perfectly plastic soil model was used, the 669
non-linear elastic (e.g. stress and strain-dependent shear modulus) and strain 670
hardening/softening behaviour of sand (e.g. non-constant dilatancy) cannot be realistically 671
modelled by the present solutions (Fahey & Carter, 1993; Manassero, 1989). The constraints 672
imposed by these simplifications may introduce some limits to the quality of the comparisons 673
but enforce the consistency among all parameters (Schnaid et al., 2000). 674
(a) loose sand (b) medium dense sand
0 2 4 6 8 10 120
100
200
300
400
500
600
700
p /
kP
a
(a-a0)/a0 /%
Experimental data (15LK1P100)
Fitting curve
G(loading)=10MPa
G(unloading)=25MPa
R2=0.9915
(a)
0 2 4 6 8 10 120
200
400
600
800
1000
p /
kP
a
(a-a0)/a0 /%
Experimental data (20MK1P100)
Fitting curve
G(loading)=17MPa
G(unloading)=35MPa
R2=0.9900
(b)

30
(c) dense sand
Figure12. Comparisons between theoretical and experimental pressuremeter curves (test data
from Ajalloeian (1996)).
Figure13. Back-calculated and measured plane strain friction angles
Optimal thickness of a hollow cylinder/sphere for overstrain 675
Several stress limits are of great concern in the stress analysis and optimal design of a hollow 676
cylinder/sphere, for example, the elastic limit, the plastic limit and the shakedown limit (Hill, 677
1950; Xu & Yu, 2005; Zhao & Wang, 2010). In the process of loading, the elastic limit 1elimp 678
(i.e. while c1=a1) and plastic limit 1plimp (i.e. while c1=b1) were given in Equations (9) and 679
(16), respectively. In the subsequent unloading process, reverse yielding occurs at the inner wall 680
of the cavity (i.e. d2=a2) while the cavity pressure reduces to be equal to 2elim 2p (i.e. the 681
unloading elastic limit defined in Equation (48)); the unloading plastic limit (i.e. while d2=b2) 682
can be obtained from Equation (51). 683
As defined previously, due to the additional pressure 20 0p p , residual stresses are 684
generated within the cylinder/sphere (i.e. overstrain effect). Subsequently, as the internal 685
pressured is removed, the soil undergoes elastic unloading until the reverse yielding limit 686
2elim 2p is reached. Based on the shakedown concept, no new plastic deformation will occur in 687
0 2 4 6 8 10 120
300
600
900
1200
1500
p /
kP
a(a-a0)/a0 /%
Experimental data (20DK1P100)
Fitting curve
G(loading)=26MPa
G(unloading)=40MPa
R2=0.9919
(c)
20 30 40 50 60 70 80 90
30
40
50
60
70
Triaxial tests
from Ajalloeian (1998)
Fri
ctio
n a
ng
le /
Relative density /%
This study (b0/a
0=33.3)
This study (b0/a
0=
Hughes et al. (1977)
Manassero (1989)
Yu (1994)
31
the hollow cylinder/sphere of soil during the subsequent cyclic reloading-unloading under 688
uniform internal pressures varying within the range of ( 2elim 2p , 20p ) (neglecting the possible 689
Bauschinger effects) (Hill, 1950; Zhao & Wang, 2010). Providing that the cavity pressure varies 690
in the range of [ 0p , 20p ], the shakedown limit, within which neither fully plastic state during 691
the initial loading nor reverse plastic state during subsequent unloading will occur in the soil, 692
can be determined by two conditions: (i) 20 1plimp p , and (ii) 0 2elim 2p p , which gives, 693
respectively, 694
10
20 0 20 20
11
1
kY pp p b a
(80) 695
11
1 20 20 2 2
20 0 1
2 2
1 1
1 1
kk
k
A b a b ap p
k b a
(81) 696
The shakedown limit equals the minimum value of Equations (80) and (81) as it requires 697
that the inequalities hold simultaneously (Xu & Yu, 2005). It needs to be pointed out that 698
previous shakedown analyses of a hollow cylinder/sphere were mostly carried out in the 699
framework of small strain theory (Hill, 1950; Zhao & Wang, 2010). However, large deformation 700
may occur during the initial elastic-plastic loading process, which may affect the shakedown 701
limit, particularly in soft materials like soils. For example, Yu (1992) observed that the cavity 702
pressure reaches a peak value before the whole cylinder of soil becomes plastic due to the large 703
strain effects, which can also be seen in Figures 8 and 9. Hence, the large strain effects on the 704
shakedown limit are examined by calculating the optimal thickness of hollow cylinders/spheres 705
as follows. 706
It is known that a hollow cylinder or sphere cannot be too thin to be strengthed (Hill, 1950; 707
Zhao & Wang, 2010). The optimal thickness of a hollow cylinder/sphere for overstrain can be 708
determined by taking the equalities of Equation (80) and (81) simultaneously. Within the 709
shakedown limit, the unloading process is purely elastic. Thus, the radial displacement can be 710
determined by Equation (47), from which another relationship between the cavity pressure and 711
the geometry ratio can be obtained as: 712
1
0 20 2 220 2
120 2
0 20 2
122 2
1 1 1 1
11 1
1 2 1 21 /
k
k
k
p p M v kv k k b ab b
a a p p av v v kvv kv
v k b v k kM a b
713
(82) 714
32
Equations (80)-(82) give the value of b20/a20 after the overstrain, based on which the optimal 715
geometry ratio (i.e. b0/a0) can be readily obtained from the displacement solutions of loading 716
(see the Appendix). 717
At first, the optimal thickness for frictionless soil is investigated. In this special case, the 718
condition of equality of Equations (80)-(81) can be simplified as: 719
1
20 20 2 2ln 2 1 1k
b a k a b (83) 720
Equation (83) will reduce to the expression given by Zhao and Wang (2010) for Tresca 721
materials if ideally regarding the surrounding soil as rigid or adopting the small strain 722
definitions (i.e. a1=a2=a0 and b1=b2=b0). However, when the soil deformation during the elastic-723
plastic loading and elastic unloading process is considered, the optimal thickness will vary with 724
the soil stiffness index G/su (su represents the shear strength of clay, corresponding to the 725
cohesion strength in the Mohr-Coulomb criterion). The variation of the optimal thickness for 726
both hollow cylinders and spheres with the soil stiffness is presented in Figure 14, taking a 727
broad range of values of G/su for clays. It is shown that the optimal thickness decreases with 728
increases of G/su and gradually converges to the limit value calculated by Zhao and Wang (2010) 729
for rigid clays. In other words, the geometry changes of the cylinder/sphere during loading and 730
unloading apply insignificant influence on the optimal thickness ratio in stiff clays, whereas 731
this effect cannot be ignored when the soil is relatively soft (e.g. G/su<200). 732
10 100 1000
2.0
2.5
3.0
3.5
Sphere (k=2)
Zhao and Wang (2010)
This study
b0/a
0
G/su
Cylinder (k=1)
Figure14. Optimal thickness ratio b0/a0 of cohesive soil (p0/su=1 and v=0.5)
For frictional soils, Zhao and Wang (2010) observed that the optimal thickness ratio is a pure 733
function of the friction angle based on the small strain theory. However, Equations (80) and (81) 734
show that it is also dependent on the stiffness and compressibility of materials while taking the 735
geometry changes of the cylinder/sphere into consideration. A selection of results was 736
computed taking the soil cohesion as 0, the Poisson’ ratio as 0.3 and the dilation angle as 0 and 737
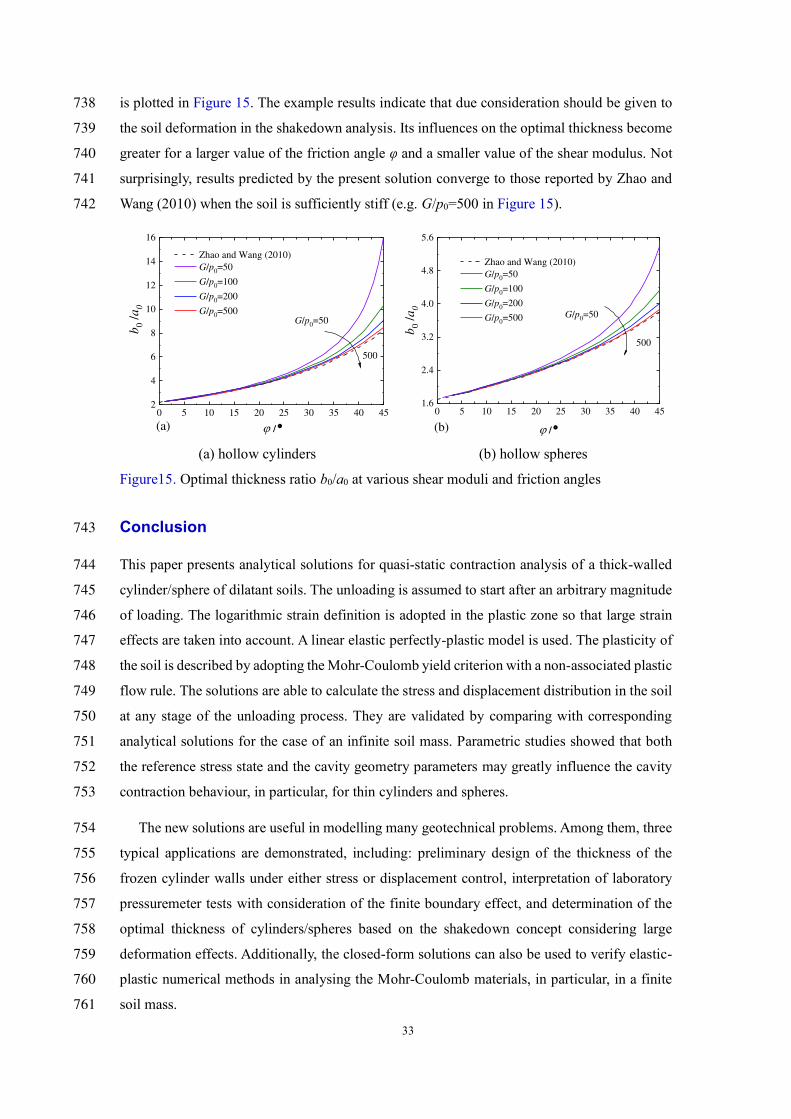
33
is plotted in Figure 15. The example results indicate that due consideration should be given to 738
the soil deformation in the shakedown analysis. Its influences on the optimal thickness become 739
greater for a larger value of the friction angle φ and a smaller value of the shear modulus. Not 740
surprisingly, results predicted by the present solution converge to those reported by Zhao and 741
Wang (2010) when the soil is sufficiently stiff (e.g. G/p0=500 in Figure 15). 742
(a) hollow cylinders (b) hollow spheres
Figure15. Optimal thickness ratio b0/a0 at various shear moduli and friction angles
Conclusion 743
This paper presents analytical solutions for quasi-static contraction analysis of a thick-walled 744
cylinder/sphere of dilatant soils. The unloading is assumed to start after an arbitrary magnitude 745
of loading. The logarithmic strain definition is adopted in the plastic zone so that large strain 746
effects are taken into account. A linear elastic perfectly-plastic model is used. The plasticity of 747
the soil is described by adopting the Mohr-Coulomb yield criterion with a non-associated plastic 748
flow rule. The solutions are able to calculate the stress and displacement distribution in the soil 749
at any stage of the unloading process. They are validated by comparing with corresponding 750
analytical solutions for the case of an infinite soil mass. Parametric studies showed that both 751
the reference stress state and the cavity geometry parameters may greatly influence the cavity 752
contraction behaviour, in particular, for thin cylinders and spheres. 753
The new solutions are useful in modelling many geotechnical problems. Among them, three 754
typical applications are demonstrated, including: preliminary design of the thickness of the 755
frozen cylinder walls under either stress or displacement control, interpretation of laboratory 756
pressuremeter tests with consideration of the finite boundary effect, and determination of the 757
optimal thickness of cylinders/spheres based on the shakedown concept considering large 758
deformation effects. Additionally, the closed-form solutions can also be used to verify elastic-759
plastic numerical methods in analysing the Mohr-Coulomb materials, in particular, in a finite 760
soil mass. 761
0 5 10 15 20 25 30 35 40 452
4
6
8
10
12
14
16
b0 /
a0
/
Zhao and Wang (2010)
G/p0=50
G/p0=100
G/p0=200
G/p0=500
500
G/p0=50
(a)
0 5 10 15 20 25 30 35 40 451.6
2.4
3.2
4.0
4.8
5.6
G/p0=50
b0 /
a0
/
Zhao and Wang (2010)
G/p0=50
G/p0=100
G/p0=200
G/p0=500
500
(b)

34
Disclosure statement 762
No potential conflict of interest was reported by the authors. 763
Funding 764
The work presented in this paper has been supported by the ‘Taishan’ Youth Scholar Program 765
of Shandong Province, China (No. tsqn201909016, No. tsqn201909044) and ‘Qilu’ Scholar 766
Program of Shandong University. 767
References 768
Abdulhadi, N. O., Germaine, J. T., & Whittle, A. J. (2011). Thick-walled cylinder 769
testing of clays for the study of wellbore instability. Geotechnical Testing Journal, 770
34(6), 746-754 771
Ajalloeian, R. (1996). An experimental study of finite pressuremeter length effects in 772
sand. (PhD), University of Newcastle, Australia. 773
Ajalloeian, R., & Yu, H. S. (1998). Chamber studies of the effects of pressuremeter 774
geometry on test results in sand. Géotechnique, 48(5), 621-636 775
Alsiny, A., Vardoulakis, I., & Drescher, A. (1992). Deformation localization in cavity 776
inflation experiments on dry sand. Géotechnique, 42(3), 395-410 777
Andersland, O. B., & Ladanyi, B. (2004). Frozen ground engineering (Second Edition). 778
Hoboken, New Jersey: John Wiley & Sons. 779
Brown, E. T., Bray, J. W., Ladanyi, B., & Hoek, E. (1983). Ground response curves for 780
rock tunnels. Journal of Geotechnical Engineering, 109(1), 15-39 781
Carter, J. (1988). A semi‐analytical solution for swelling around a borehole. 782
International Journal for Numerical and Analytical Methods in Geomechanics, 12(2), 783
197-212 784
Chadwick, P. (1959). The quasi-static expansion of a spherical cavity in metals and 785
ideal soils. The Quarterly Journal of Mechanics and Applied Mathematics, 12(1), 786
52-71 787
Chen, S. L., & Abousleiman, Y. N. (2016). Drained and undrained analyses of 788
cylindrical cavity contractions by bounding surface plasticity. Canadian 789
Geotechnical Journal, 53(9), 1398-1411 790
Chen, S. L., Abousleiman, Y. N., & Muraleetharan, K. K. (2012). Closed-form 791
elastoplastic solution for the wellbore problem in strain hardening/softening rock 792
35
formations. International Journal of Geomechanics, 12(4), 494-507 793
Cheng, Y., & Yang, H.-W. (2019). Exact solution for drained spherical cavity expansion 794
in saturated soils of finite radial extent. International Journal for Numerical and 795
Analytical Methods in Geomechanics, 43, 1594–1611. doi: doi: 796
org/10.1002/nag.2924 797
Clarke, B. G. (1995). Pressuremeters in geotechnical design. London: Blackie 798
Academic & Professional. 799
Collins, I. F., & Yu, H. S. (1996). Undrained cavity expansions in critical state soils. 800
International Journal for Numerical and Analytical Methods in Geomechanics, 20(7), 801
489-516 802
Fahey, M. (1986). Expansion of a thick cylinder of sand: a laboratory simulation of the 803
pressuremeter test. Geotechnique, 36(3), 397-424 804
Fahey, M., & Carter, J. P. (1993). A finite element study of the pressuremeter test in 805
sand using a nonlinear elastic plastic model. Canadian Geotechnical Journal, 30(2), 806
348-362 807
Ferreira, R., & Robertson, P. (1992). Interpretation of undrained self-boring 808
pressuremeter test results incorporating unloading. Canadian Geotechnical Journal, 809
29(6), 918-928 810
Franza, A., Marshall, A., & Zhou, B. (2019). Greenfield tunnelling in sands: the effects 811
of soil density and relative depth. Géotechnique, 69(4), 297-307. doi: doi: 812
org/10.1680/jgeot.17.P.091 813
Gao, X. L., Wen, J. F., Xuan, F.-Z., & Tu, S. T. (2015). Autofrettage and Shakedown 814
Analyses of an Internally Pressurized Thick-Walled Cylinder Based on Strain 815
Gradient Plasticity Solutions. Journal of Applied Mechanics, 82(4), 041010 816
Geng, Y., Yu, H. S., & McDowell, G. R. (2012). Discrete element modelling of cavity 817
expansion and pressuremeter test. Geomechanics and Geoengineering, 8(3), 179-190. 818
doi: doi: org/10.1080/17486025.2012.735375 819
Ghionna, V. N., & Jamiolkowski, M. (1991). A critical appraisal of calibration chamber 820
testing of sands the First International Symposium on Calibration Chamber Testing 821
(pp. 13-40). Potsdam, New York: Elsevier. 822
Grant, R. J. (1998). Movements around a tunnel in two-layer ground. (PhD thesis), City 823
University London, London. 824
Hill, R. (1950). The mathematical theory of plasticity. London: Oxford University Press. 825

36
Houlsby, G. T., & Carter, J. P. (1993). The effects of pressuremeter geometry on the 826
results of tests in clay. Géotechnique, 43(4), 567-576 827
Houlsby, G. T., Clarke, B. G., & Wroth, C. P. (1985). Analysis of the unloading of a 828
pressuremeter in sand the 2nd International Symposium on The Pressuremeter and 829
its Marine Applications (pp. 245-262). West Conshohocken, PA: ASTM International. 830
Houlsby, G. T., & Withers, N. J. (1988). Analysis of the cone pressuremeter test in clay. 831
Géotechnique, 38(4), 575-587 832
Hughes, J. M. O., & Robertson, P. K. (1985). Full-displacement pressuremeter testing 833
in sand. Canadian Geotechnical Journal, 22(3), 298-307 834
Hughes, J. M. O., Wroth, C. P., & Windle, D. (1977). Pressuremeter tests in sands. 835
Géotechnique, 27(4), 455-477 836
Jefferies, M. G. (1988). Determination of horizontal geostatic stress in clay with self-837
bored pressuremeter. Canadian Geotechnical Journal, 25(3), 559-573 838
Jewell, R., Fahey, M., & Wroth, C. (1980). Laboratory studies of the pressuremeter test 839
in sand. Geotechnique, 30(4), 507-531 840
Jirari, S. E., Wong, H., Deleruyelle, F., Branque, D., Berthoz, N., & Leo, C. (2020). 841
Analytical modelling of a tunnel accounting for elastoplastic unloading and reloading 842
with reverse yielding and plastic flow. Computers and Geotechnics, 121, 103441. 843
doi: doi.org/10.1016/j.compgeo.2020.103441 844
Juran, I., & BenSaid, M. (1987). Cavity expansion tests in a hollow cylinder cell. 845
Geotechnical Testing Journal, 10(4), 203-212 846
Klein, J., & Gerthold, A. (1979). Die Fliessbedingung von Drucker/Prager im Vergleich 847
zu anderen Bruchkriterien bei der Bemessung von Gefrierschächten. Bautechnik, 848
11(1979), 368-375 849
Mair, R. J. (1979). Centrifugal modelling of tunnel construction in soft clay. (PhD 850
thesis), Cambridge University, Cambridge, UK. 851
Mair, R. J., & Taylor, R. N. (1993). Prediction of clay behaviour around tunnels using 852
plasticity solutions Predictive Soil Mechanics: Proceedings of the Wroth Memorial 853
Symposium (pp. 449-463). Oxford, UK: Thomas Telford. 854
Mair, R. J., & Wood, D. M. (1987). Pressuremeter testing: methods and interpretation. 855
London, UK: CIRIA-Butterworths. 856
Manassero, M. (1989). Stress-strain relationships from drained self-boring 857
pressuremeter tests in sand. Geotechnique, 39(2), 293-307 858

37
Mo, P. Q., & Yu, H. S. (2017). Undrained Cavity-Contraction Analysis for Prediction 859
of Soil Behavior around Tunnels. International Journal of Geomechanics, 17(5), 860
04016121-04016121-04016110. doi: DOI: 10.1061/(ASCE)GM.1943-861
5622.0000816. 862
Ogawa, T., & Lo, K. Y. (1987). Effects of dilatancy and yield criteria on displacements 863
around tunnels. Canadian Geotechnical Journal, 24(1), 100-113 864
Park, K. H. (2014). Similarity solution for a spherical or circular opening in elastic-865
strain softening rock mass. International Journal of Rock Mechanics and Mining 866
Sciences, 71, 151-159 867
Pournaghiazar, M., Russell, A. R., & Khalili, N. (2013). Drained cavity expansions in 868
soils of finite radial extent subjected to two boundary conditions. International 869
Journal for Numerical and Analytical Methods in Geomechanics, 37(4), 331-352 870
Reed, M. B. (1986). Stresses and displacements around a cylindrical cavity in soft rock. 871
IMA Journal of Applied Mathematics, 36(3), 223-245 872
Rowe, P. W. (1962). The stress-dilatancy relation for static equilibrium of an assembly 873
of particles in contact the royal society of London a: mathematical, physical and 874
engineering sciences (Vol. 269, pp. 500-527): The Royal Society. 875
Salgado, R., Mitchell, J. K., & Jamiolkowski, M. (1998). Calibration chamber size 876
effects on penetration resistance in sand. Journal of Geotechnical and 877
Geoenvironmental Engineering, 124(9), 878-888 878
Sanger, F., & Sayles, F. (1979). Thermal and rheological computations for artificially 879
frozen ground construction. Engineering geology, 13(1-4), 311-337 880
Schnaid, F., & Houlsby, G. (1991). An assessment of chamber size effects in the 881
calibration of in situ tests in sand. Geotechnique, 41(3), 437-445 882
Schnaid, F., & Houlsby, G. (1992). Measurement of the properties of sand by the cone 883
pressuremeter test. Géotechnique, 42(4), 587-601 884
Schnaid, F., Ortigao, J. A., Mantaras, F., Cunha, R., & MacGregor, I. (2000). Analysis 885
of self-boring pressuremeter (SBPM) and Marchetti dilatometer (DMT) tests in 886
granite saprolites. Canadian geotechnical journal, 37(4), 796-810 887
Sharan, S. K. (2008). Analytical solutions for stresses and displacements around a 888
circular opening in a generalized Hoek–Brown rock. International Journal of Rock 889
Mechanics and Mining Sciences, 1(45), 78-85 890
Shuttle, D. (2007). Cylindrical cavity expansion and contraction in Tresca soil. 891

38
Géotechnique, 57(3), 305-308 892
Viggiani, G., & Casini, F. (2015). Artificial ground freezing: from applications and case 893
studies to fundamental research the XVI ECSMGE: Geotechnical Engineering for 894
Infrastructure and Development (pp. 65-92). Edinburgh. 895
Vrakas, A., & Anagnostou, G. (2014). A finite strain closed‐form solution for the 896
elastoplastic ground response curve in tunnelling. International Journal for 897
Numerical and Analytical Methods in Geomechanics, 38(11), 1131-1148 898
Wen, J.-F., Gao, X.-L., Xuan, F.-Z., & Tu, S.-T. (2017). Autofrettage and shakedown 899
analyses of an internally pressurized thick-walled spherical shell based on two strain 900
gradient plasticity solutions. Acta Mechanica, 228(1), 89-105 901
Withers, N., Howie, J., Hughes, J., & Robinson, P. (1989). Performance and analysis of 902
cone pressuremeter tests in sands. Geotechnique, 39(3), 433-454 903
Wroth, C. (1982). British experience with the self-boring pressuremeter the 1st 904
International Symposium on The Pressuremeter and its Marine Applications (pp. 905
143-164). Paris. 906
Wroth, C. P. (1984). The interpretation of in situ soil tests. Géotechnique, 34(4), 449-907
489 908
Xu, S. Q., & Yu, M. H. (2005). Shakedown analysis of thick-walled cylinders subjected 909
to internal pressure with the unified strength criterion. International journal of 910
pressure vessels and piping, 82(9), 706-712 911
Yu, H. S. (1992). Expansion of a thick cylinder of soils. Computers and Geotechnics, 912
14(1), 21-41 913
Yu, H. S. (1993). Finite elastoplastic deformation of an internally pressurized hollow 914
sphere. Acta Mechaniea Solida Sinica (English Edition), 6(1), 81–97 915
Yu, H. S. (1994). State parameter from self-boring pressuremeter tests in sand. Journal 916
of geotechnical engineering, 120(12), 2118-2135 917
Yu, H. S. (1996). Interpretation of pressuremeter unloading tests in sands. Géotechnique, 918
46(1), 17-31 919
Yu, H. S. (2000). Cavity expansion methods in geomechanics. Dordrecht, the 920
Netherlands: Kluwer Academic Publishers. 921
Yu, H. S., & Houlsby, G. T. (1991). Finite cavity expansion in dilatant soils: loading 922
analysis. Géotechnique, 41(2), 173-183 923
Yu, H. S., & Houlsby, G. T. (1995). A large strain analytical solution for cavity 924

39
contraction in dilatant soils. International Journal for Numerical and Analytical 925
Methods in Geomechanics, 19(11), 793-811 926
Yu, H. S., & Rowe, R. K. (1999). Plasticity solutions for soil behaviour around 927
contracting cavities and tunnels. International Journal for Numerical and Analytical 928
Methods in Geomechanics, 23(12), 1245-1279 929
Yu, H. S., Zhuang, P. Z., & Mo, P. Q. (2019). A unified critical state model for 930
geomaterials with an application to tunnelling. Journal of Rock Mechanics and 931
Geotechnical Engineering, 11(3), 464-480. doi: org/10.1016/j.jrmge.2018.09.004 932
Zhang, B., Yang, W., & Wang, B. (2018). Plastic Design Theory of Frozen Wall 933
Thickness in an Ultradeep Soil Layer Considering Large Deformation Characteristics. 934
Mathematical Problems in Engineering, 2018, 8513413. doi: doi: 935
org/10.1155/2018/8513413 936
Zhao, J., & Wang, G. (2010). Unloading and reverse yielding of a finite cavity in a 937
bounded cohesive–frictional medium. Computers and Geotechnics, 37(1), 239-245 938
Appendix 939
At the moment that the elastic-plastic boundary reaches the outer radius of the cavity upon 940
loading, the displacement at r=b20 can be calculated from the elastic displacement solution of 941
Yu (1992, 1993) as: 942
0
0 20
1 11
v kv Y pb b
M
(84) 943
The displacement of the inner wall of the cavity (i.e. r=a20) can be obtained from the large 944
strain plastic displacement solution as below. 945
1 1
4 0 0
0 20 20
k k
n
n
b a
b b
(85) 946
in which 1
k
k
, and 947
3 20
204
13
20 20
1ln , if =
!
1 , otherwise!
n
n n k n
k bn
n a
b an n
(86) 948

40
0
3
11
1 1 2 1 2
Y p kv vk v kv k
M v k v k
(87) 949
01ln 1
1 1 2 1 2
Y p kv k vk v kv
M v k v k
(88) 950

41
Notation 951
a0, b0 initial inner and outer radii of a cylinder/sphere 952
p0, p20 in-situ stress and cavity pressure at the beginning of unloading 953
pin internal cavity pressure 954
a20, b20 initial inner and outer radii of a cylinder/sphere at the beginning of 955
unloading 956
k k=1 for a cylinder and k=2 for a sphere 957
r, θ, z cylindrical polar coordinates 958
r, θ, ϕ spherical polar coordinates 959
σr, σθ, σz radial, circumferential and axial stresses 960
Δσr, Δσθ incremental radial and circumferential stresses due to unloading 961
u20, u2 radial displacement at the beginning of unloading and during unloading 962
Δu incremental radial displacement due to unloading 963
σr2, σθ2 radial and circumferential stresses during unloading 964
σr20, σθ20 radial and circumferential stresses at the beginning of unloading 965
r0 initial radius of a given soil particle 966
a2, b2 inner and outer radii of the cavity during unloading 967
p1, p2 internal cavity pressures during loading and unloading 968
c1, c20, c2 radii of the elastic-plastic interface caused by loading in the loading 969
process, at the end of loading and during unloading 970
d2, 20d radius of the elastic-plastic interface caused by unloading and its initial 971
value 972
φ, c, soil friction angle, cohesion and dilation angle 973
α, Y functions of soil cohesion and friction angle 974
function of dilation angle 975
p1elim elastic limit pressure in the loading process 976

42
a1, b1 inner and outer radii of a cavity in the loading process 977
r1, r2 radial radii during loading and unloading 978
σr1, σθ1 radial and circumferential stresses during loading 979
A1, B1 constants of integration in the loading process 980
εr, εθ radial and circumferential strains 981
v, E, G Poisson’s ratio, elastic modulus and shear modulus 982
M function of Poisson’s ratio and elastic modulus 983
a2, b2 inner and outer radii of a cavity in the unloading process 984
p2elim-1 elastic unloading limit of case I 985
A2-1, B2-1 constants of integration in the unloading process of case I 986
p2fp-lim fully plastic unloading limit of case I 987
p
r , p
plastic radial and circumferential strains 988
e
r , e
elastic radial and circumferential strains 989
η, ω, θ, γ non-dimensional coefficients of case I 990
n! factorial of n 991
A2-1, B2-1, A2-2, B2-2, 992
A2-3, B2-3, A2-4, A2-5 constants of integration in the unloading process 993
p2elim-2 elastic unloading limit of cases II and III 994
Δεr, Δεθ incremental radial and circumferential strains due to unloading 995
ω1, λ1, , ρ non-dimensional coefficients of case II 996
1
n , 2
n , 3
n , 4
n infinite power series 997
η1, ω2, λ2 non-dimensional coefficients of case III 998
L, D length and diameter of pressuremeters 999
Dr relative density of sand 1000
φcv, φps, φtri critical state friction angle, plane strain friction angle and 1001

43
triaxial friction angle of sand 1002
R2 the correlation coefficient 1003
p1plim plastic limit during loading 1004
su shear strength of clay 1005
, ω3, non-dimensional coefficients in Appendix 1006