Climate impacts in Europe:an integrated economic assessment (preliminary results of the JRC PESETA...
10
IMPACTS WORLD 2013, INTERNATIONAL CONFERENCE ON CLIMATE CHANGE EFFECTS, POTSDAM, MAY 27-30 1 Climate impacts in Europe: an integrated economic assessment (preliminary results of the JRC PESETA II project) Ciscar J-C, Feyen L, Soria A, Lavalle C, Perry M, Raes F, Nemry F, Demirel H, Rozsai M, Dosio A, Donatelli M, Srivastava A, Fumagalli D, Zucchini A, Shrestha S, Ciaian P, Himics M, Van Doorslaer B, Barrios S, Ibáñez N, Rojas R, Bianchi A, Dowling P, Camia A, Libertà G, San Miguel J, de Rigo D, Caudullo G, Barredo J-I, Paci D, Pycroft J, Saveyn B, Van Regemorter D, Revesz T, Mubareka S, Baranzelli C, Rocha Gomes C, Lung T, Ibarreta D Joint Research Center (JRC)* *The views expressed are purely those of the authors and may not in any circumstances be regarded as stating an official position of the European Commission Abstract— The JRC PESETA II study integrates the consequences of several separate climate change impacts into a macroeconomic CGE model. This enables comparison of the different impacts based on common metrics (household welfare and economic activity). The study uses a large set of climate model runs (twelve) and impact categories (agriculture, energy demand, river floods, sea-level rise, forest fires, transport infrastructure). The results show that there is a wide dispersion of impacts across EU regions, with strong geographical asymmetries, depending on the specific impact category and climate future. For instance, Northern Central Europe has negative impacts mainly related to sea level rise and river floods while Southern Europe is affected mainly by agriculture. The study also explores the significance of transboundary effects (where climate change causes economic damages outside the region directly affected. Index Terms—climate impacts, integrated assessment modeling, climate adaptation ———————————————————— 1 Introduction This article presents the methodology and preliminary results of the economic impacts assessment of the JRC PESETA II project (Projection of Economic impacts of climate change in Sectors of the European Union based on bottom-up Analysis) 1 . The integrated methodology also benefits from other impact evidence derived from the FP7 ClimateCost project (on coastal impacts and agriculture in the 2080s). 1 Preliminary results of the JRC PESETA II project (http://peseta.jrc.ec.europa.eu/), as published the Impact Assessment accompanying the EU Strategy on Adaptation to Climate Change, April 2013. The project uses climate data from the FP6 ENSEMBLES project, and impact estimates for agriculture and sea level rise from the FP7 ClimateCost project. The authors wish to thank Daniela Jacob for providing the E1 climate data, and the
-
Upload
independent -
Category
Documents
-
view
4 -
download
0
Transcript of Climate impacts in Europe:an integrated economic assessment (preliminary results of the JRC PESETA...

IMPACTS WORLD 2013, INTERNATIONAL CONFERENCE ON CLIMATE CHANGE EFFECTS, POTSDAM, MAY 27-30
1
Climate impacts in Europe: an integrated economic assessment (preliminary results of
the JRC PESETA II project) Ciscar J-C, Feyen L, Soria A, Lavalle C, Perry M, Raes F, Nemry F, Demirel H, Rozsai M, Dosio A, Donatelli
M, Srivastava A, Fumagalli D, Zucchini A, Shrestha S, Ciaian P, Himics M, Van Doorslaer B, Barrios S, Ibáñez N, Rojas R, Bianchi A, Dowling P, Camia A, Libertà G, San Miguel J, de Rigo D, Caudullo G, Barredo
J-I, Paci D, Pycroft J, Saveyn B, Van Regemorter D, Revesz T, Mubareka S, Baranzelli C, Rocha Gomes C, Lung T, Ibarreta D
Joint Research Center (JRC)*
*The views expressed are purely those of the authors and may not in any circumstances be regarded as stating an official position of the European Commission
Abstract— The JRC PESETA II study integrates the consequences of several separate climate change impacts into a macroeconomic CGE model. This enables comparison of the different impacts based on common metrics (household welfare and economic activity). The study uses a large set of climate model runs (twelve) and impact categories (agriculture, energy demand, river floods, sea-level rise, forest fires, transport infrastructure).
The results show that there is a wide dispersion of impacts across EU regions, with strong geographical asymmetries, depending on the specific impact category and climate future. For instance, Northern Central Europe has negative impacts mainly related to sea level rise and river floods while Southern Europe is affected mainly by agriculture. The study also explores the significance of transboundary effects (where climate change causes economic damages outside the region directly affected.
Index Terms—climate impacts, integrated assessment modeling, climate adaptation
————————————————————
1 Introduction
This article presents the methodology and preliminary results of the economic impacts assessment of the JRC PESETA II project (Projection of Economic impacts of climate change in Sectors of the European Union based on bottom-up Analysis)1. The integrated methodology also benefits from other impact evidence derived from the FP7 ClimateCost project (on coastal impacts and agriculture in the 2080s).
1 Preliminary results of the JRC PESETA II project (http://peseta.jrc.ec.europa.eu/), as published the Impact Assessment accompanying the EU Strategy on Adaptation to Climate Change, April 2013. The project uses climate data from the FP6 ENSEMBLES project, and impact estimates for agriculture and sea level rise from the FP7 ClimateCost project. The authors wish to thank Daniela Jacob for providing the E1 climate data, and the
IMPACTS WORLD 2013, INTERNATIONAL CONFERENCE ON CLIMATE CHANGE EFFECTS, POTSDAM, MAY 27-30
2
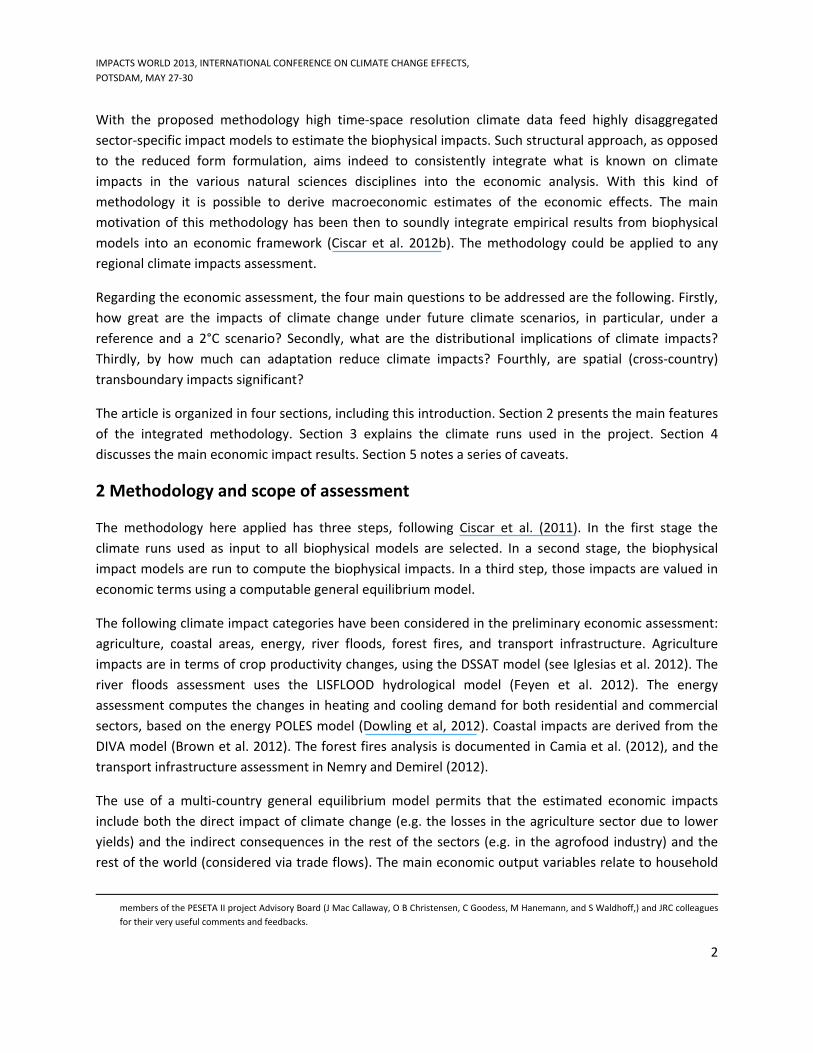
With the proposed methodology high time-space resolution climate data feed highly disaggregated sector-specific impact models to estimate the biophysical impacts. Such structural approach, as opposed to the reduced form formulation, aims indeed to consistently integrate what is known on climate impacts in the various natural sciences disciplines into the economic analysis. With this kind of methodology it is possible to derive macroeconomic estimates of the economic effects. The main motivation of this methodology has been then to soundly integrate empirical results from biophysical models into an economic framework (Ciscar et al. 2012b). The methodology could be applied to any regional climate impacts assessment.
Regarding the economic assessment, the four main questions to be addressed are the following. Firstly, how great are the impacts of climate change under future climate scenarios, in particular, under a reference and a 2°C scenario? Secondly, what are the distributional implications of climate impacts? Thirdly, by how much can adaptation reduce climate impacts? Fourthly, are spatial (cross-country) transboundary impacts significant?
The article is organized in four sections, including this introduction. Section 2 presents the main features of the integrated methodology. Section 3 explains the climate runs used in the project. Section 4 discusses the main economic impact results. Section 5 notes a series of caveats.
2 Methodology and scope of assessment
The methodology here applied has three steps, following Ciscar et al. (2011). In the first stage the climate runs used as input to all biophysical models are selected. In a second stage, the biophysical impact models are run to compute the biophysical impacts. In a third step, those impacts are valued in economic terms using a computable general equilibrium model.
The following climate impact categories have been considered in the preliminary economic assessment: agriculture, coastal areas, energy, river floods, forest fires, and transport infrastructure. Agriculture impacts are in terms of crop productivity changes, using the DSSAT model (see Iglesias et al. 2012). The river floods assessment uses the LISFLOOD hydrological model (Feyen et al. 2012). The energy assessment computes the changes in heating and cooling demand for both residential and commercial sectors, based on the energy POLES model (Dowling et al, 2012). Coastal impacts are derived from the DIVA model (Brown et al. 2012). The forest fires analysis is documented in Camia et al. (2012), and the transport infrastructure assessment in Nemry and Demirel (2012).
The use of a multi-country general equilibrium model permits that the estimated economic impacts include both the direct impact of climate change (e.g. the losses in the agriculture sector due to lower yields) and the indirect consequences in the rest of the sectors (e.g. in the agrofood industry) and the rest of the world (considered via trade flows). The main economic output variables relate to household
members of the PESETA II project Advisory Board (J Mac Callaway, O B Christensen, C Goodess, M Hanemann, and S Waldhoff,) and JRC colleagues for their very useful comments and feedbacks.

IMPACTS WORLD 2013, INTERNATIONAL CONFERENCE ON CLIMATE CHANGE EFFECTS, POTSDAM, MAY 27-30
3
welfare, and GDP. Economic impacts on welfare are provided in monetary terms, and are presented undiscounted, in 2005 Euros. The welfare changes are also compared to GDP.
The study evaluates a counterfactual situation: the impact of future climate on the economy of today. This approach is known as comparative static.
The results are presented dividing the EU into the following regions, according to their latitude and the relative economic size, as it was made in PESETA:
- Northern Europe: Sweden, Finland, Estonia, Lithuania, Latvia, and Denmark.
- UK & Ireland: UK and Ireland.
- Central Europe north: Belgium, Netherlands, Germany, and Poland.
- Central Europe south: France, Austria, Czech Republic, Slovakia, Hungary, Slovenia, and Romania.
- Southern Europe: Portugal, Spain, Italy, Greece, and Bulgaria.
All reported impacts assume that there is not public adaptation, unless otherwise stated. Therefore, the methodology can be useful to understand where to prioritise adaptation options.
3 Climate scenarios and runs
For the JRC PESETA II study climate simulation runs were obtained from the FP6 ENSEMBLES project (van der Linden and Mitchell, 2009). Runs were driven either by the SRES A1B emission scenario (Nakicenovic and Swart, 2000), or the so called E1 emission scenario. The E1 scenario was developed within ENSEMBLES as an attempt to match the European Union target of keeping global anthropogenic warming below 2 °C above pre-industrial levels.
It is important to note that climate model outputs may present significant errors (biases) when compared to observations: for instance, modeled summer temperatures in Southern Europe are usually overestimated, while large biases exist for precipitation. Consequently, the climate runs originally obtained from the ENSEMBLES project (12 A1B and 3 E1) were corrected for biases in temperature and precipitation by Dosio and Paruolo (2011), and Dosio et al. (2012).
The JRC PESETA II study considered four core climate runs:
- Reference Run. It is interpreted as representing well the central or average of the A1B runs. This run is interpreted as business as usual scenario. The two additional A1B runs show significant deviations from the average climate change signal, being usually warmer and drier (Reference Variant 1) or colder and wetter (Reference Variant 2) than the average;
- Reference Variant 1 is the climate run that is warmer and drier than the average;

IMPACTS WORLD 2013, INTERNATIONAL CONFERENCE ON CLIMATE CHANGE EFFECTS, POTSDAM, MAY 27-30
4
- Reference Variant 2 is the climate run that is colder and wetter than the average;
- The 2°C Scenario. This run is an example of the E1 scenario. This run is therefore referred to as '2°C scenario' in the project.
The combination of climate models chosen for each core run is shown in Table 1. All the models driven by the same A1B emission scenario represent an equally probable projection of the future evolution of the climate. However, the selected runs show a significant variety in climate change signal for both temperature and precipitation. One can therefore expect that by using these three simulations as an input for the study of impact assessment of climate change, the main statistical characteristics of the A1B scenario as modelled by the whole ensemble of RCMs are relatively well represented.
Table 1: Climate models chosen for PESETA II core runs
Climate Models Employed
Core run Agriculture Sea-level rise All other impacts
Reference run A1B ECHAM5 (UKMO) 30 cm sea-level rise
(median A1B projection)
A1B KNMI-RACMO2-ECHAM5
Reference Variant 1 A1B ECHAM5 (DMI) 30 cm sea-level rise
(median A1B projection)
A1B METO-HC-HadRM3Q0-HadCM3Q0
Reference Variant 2 A1B EGMAM2006 (FUB) 30 cm sea-level rise
(median A1B projection)
A1B DMI-HIRHAM5-ECHAM5
2°C run E1 ECHAM5.4 (MPI) 18 cm sea-level rise
(median E1 projection)
MPI-REMO-E4
The sea level rise projections come from the ClimateCost project (Brown et al. 2011). For the A1B scenario, the medium projection for SLR in the 2080s is 30 cm, and 18 cm for the E1 medium projection. The respective values for SLR in 2100 are 37 cm and 26 cm. The coastal impacts have been computed taking into account the projected damages for the 2080s.

IMPACTS WORLD 2013, INTERNATIONAL CONFERENCE ON CLIMATE CHANGE EFFECTS, POTSDAM, MAY 27-30
5
4 Economic impacts
4.1 Methodology
The GEM-E3 model2 is used to compute the overall economic impacts of climate change. The model uses a computable general equilibrium (CGE) approach that allows exploring the indirect economic consequences of climate change due to the cross-sectoral effects within the economy, on top of the direct economic impacts.
The GEM-E3 CGE model analyses the interactions between the economy, the energy system and the environment. The current EU version is based on EUROSTAT data (base year 2005), with most member states individually modelled. The countries are linked through endogenous bilateral trade flows. The GEM-E3 model integrates micro-economic behaviour into a macro-economic framework and allows the assessment of medium to long-term implications for policies.
The various impact categories are integrated by changing specific elements of the production structure and supply-side (capital and labour) of the different sectors and of the consumption structure of households. Table 2 summarizes how the different impact categories have been interpreted and implemented in the GEM-E3 model3. For instance, the agriculture model produces estimates of agriculture yields. They are implemented in the model as changes in productivity in the agriculture sector.
The CGE method, as it considers trade effects, can be used to estimate how impacts in one region can affect the rest of Europe. This will be applied to the assessment of the size of the possible transboundary climate impacts within Europe (see Section 4.2).
Table 2: Implementation of sectoral climate impacts in GEM-E3
Impact Biophysical model output Model implementation
Agriculture Yield change Productivity change for crops
Migration cost Additional obliged consumption Coastal areas Sea floods cost Capital loss
Residential buildings damages Additional obliged consumption River floods
Production activities losses Capital loss
Energy Heating and cooling demand changes Energy demand changes in residential and service sectors
2 www.gem-e3.net
3 A similar methodology was followed in the PESETA project (see Ciscar et al., 2012b).
IMPACTS WORLD 2013, INTERNATIONAL CONFERENCE ON CLIMATE CHANGE EFFECTS, POTSDAM, MAY 27-30
6
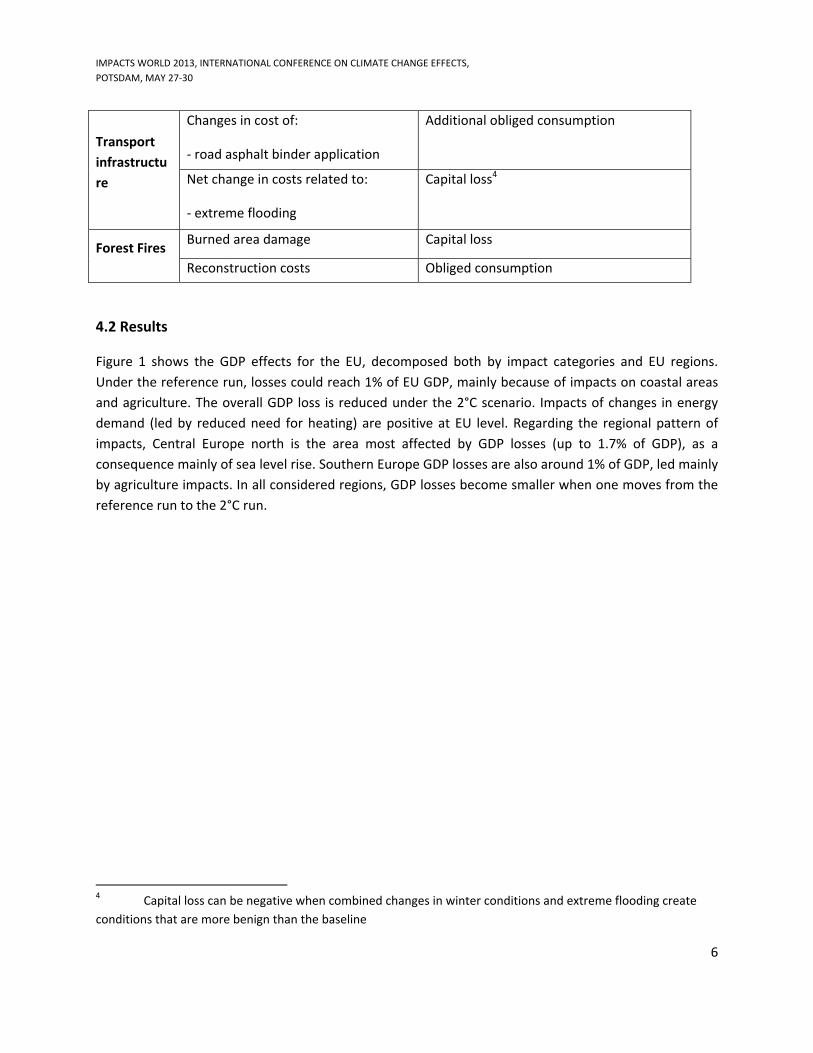
Changes in cost of:
- road asphalt binder application
Additional obliged consumption Transport infrastructure Net change in costs related to:
- extreme flooding
Capital loss4
Burned area damage Capital loss Forest Fires Reconstruction costs Obliged consumption
4.2 Results
Figure 1 shows the GDP effects for the EU, decomposed both by impact categories and EU regions. Under the reference run, losses could reach 1% of EU GDP, mainly because of impacts on coastal areas and agriculture. The overall GDP loss is reduced under the 2°C scenario. Impacts of changes in energy demand (led by reduced need for heating) are positive at EU level. Regarding the regional pattern of impacts, Central Europe north is the area most affected by GDP losses (up to 1.7% of GDP), as a consequence mainly of sea level rise. Southern Europe GDP losses are also around 1% of GDP, led mainly by agriculture impacts. In all considered regions, GDP losses become smaller when one moves from the reference run to the 2°C run.
4 Capital loss can be negative when combined changes in winter conditions and extreme flooding create conditions that are more benign than the baseline

IMPACTS WORLD 2013, INTERNATIONAL CONFERENCE ON CLIMATE CHANGE EFFECTS, POTSDAM, MAY 27-30
7
Figure 1. GDP impacts (% GDP)
Source: preliminary results of JRC PESETA II project
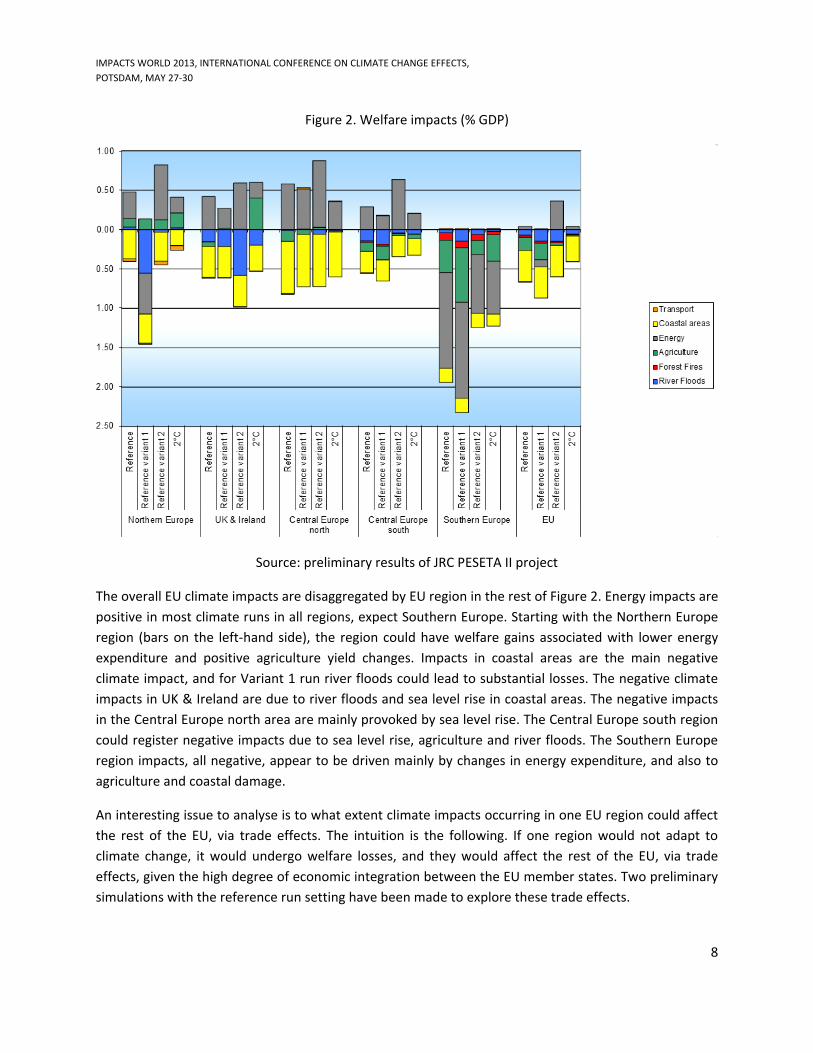
Welfare change is an appropriate metrics to interpret the results of GEM-E3, as the economic model is rooted in neoclassical economics, where households pursue the maximisation of their welfare levels. Figure 2 shows welfare changes for the core runs, expressed as a percentage of GDP. For the EU as a whole (bars on the right-hand of the figure), the net welfare loss of the reference runs is estimated to be around 0.7% of GDP.
The most significant negative impacts are linked to coastal areas, agriculture and river floods. Damage from river floods is more harmful to welfare than GDP because flood damage requires spending on repairs by households. This is compulsory consumption that brings no welfare benefit (but contributes to GDP). Moving to a 2°C scenario would reduce the impact on agriculture and river floods for the EU as a whole and would reduce coastal impacts to a lesser extent.
IMPACTS WORLD 2013, INTERNATIONAL CONFERENCE ON CLIMATE CHANGE EFFECTS, POTSDAM, MAY 27-30
8
Figure 2. Welfare impacts (% GDP)
Source: preliminary results of JRC PESETA II project
The overall EU climate impacts are disaggregated by EU region in the rest of Figure 2. Energy impacts are positive in most climate runs in all regions, expect Southern Europe. Starting with the Northern Europe region (bars on the left-hand side), the region could have welfare gains associated with lower energy expenditure and positive agriculture yield changes. Impacts in coastal areas are the main negative climate impact, and for Variant 1 run river floods could lead to substantial losses. The negative climate impacts in UK & Ireland are due to river floods and sea level rise in coastal areas. The negative impacts in the Central Europe north area are mainly provoked by sea level rise. The Central Europe south region could register negative impacts due to sea level rise, agriculture and river floods. The Southern Europe region impacts, all negative, appear to be driven mainly by changes in energy expenditure, and also to agriculture and coastal damage.
An interesting issue to analyse is to what extent climate impacts occurring in one EU region could affect the rest of the EU, via trade effects. The intuition is the following. If one region would not adapt to climate change, it would undergo welfare losses, and they would affect the rest of the EU, via trade effects, given the high degree of economic integration between the EU member states. Two preliminary simulations with the reference run setting have been made to explore these trade effects.

IMPACTS WORLD 2013, INTERNATIONAL CONFERENCE ON CLIMATE CHANGE EFFECTS, POTSDAM, MAY 27-30
9
In the first analysis (first column of Table 3), one can imagine a counterfactual situation where only Central Europe north is affected by sea level rise, while the rest of the EU regions do not suffer any direct impact. Under such a case, the economic modelling results suggest that Central Europe north would have a welfare loss of 20.5 billion Euros. There would be an additional 30% welfare loss (5.6 billion Euros) felt in the rest of the EU due to the economic linkages between EU regions.
Table 3. Transboundary effects (reference run)
Coast / Central Europe North
Agriculture / Southern
Europe
Northern Europe -491 -122UK & Ireland -1.677 -580Central Europe north -20.518 -950Central Europe south -1.966 -900Southern Europe -1.530 -10.218EU -26.181 -12.770
Source: preliminary results of JRC PESETA II project
A similar simulation regarding agriculture impacts has been estimated. The hypothetical case would be that only the Southern Europe region would be affected by agriculture impacts. It is then assumed that the rest of the EU does not experience any initial yield change. In that case the impact in Southern Europe could be 10 billion Euros. There would be an additional loss of 25% (2.5 billion Euros) in the rest of the EU regions, leading to an overall welfare loss estimated at 13 billion Euros (second column of Table 3).
5 Discussion
The preliminary results should be taken with care, due to the inherent uncertainties of the integrated assessment. The trajectory of GHG emissions and behaviour of the climate system are only a subset of the factors that could influence the consequences of climate change.
Additional limitations of the assessment are related to the fact that several large climate impact categories have not been considered, notably the case of all the impacts affecting ecosystems, biodiversity and human life. Abrupt climate change, including climate tipping points, has also not been considered in the analysis. It is also assumed that the rest of the world remains unchanged in spite of climate change, which is not realistic.

IMPACTS WORLD 2013, INTERNATIONAL CONFERENCE ON CLIMATE CHANGE EFFECTS, POTSDAM, MAY 27-30
10
References
Brown S, Nicholls RJ, Vafeidis A, Hinkel J, and Watkiss P, 2011. The Impacts and Economic Costs of Sea-Level Rise in Europe and the Costs and Benefits of Adaptation. Summary of Results from the EC RTD ClimateCost Project. In Watkiss, P (Editor), 2011. The ClimateCost Project. Final Report. Volume 1: Europe. Published by the Stockholm Environment Institute, Sweden, 2011. ISBN 978-91-86125-35-6.
Camia A, Libertà G, San Miguel J, 2012. Modelling impacts of climate change on forest fire danger Institute for Environment and Sustainability, JRC
Ciscar J-C, Iglesias A, Feyen L, Szabo L, Van Regemorter D, Amelung B, Nicholls R, Watkiss P, Christensen O, Dankers R, Garrote L, Goodess C, Hunt A, Moreno A, Richards J, Soria A, 2011. Physical and Economic Consequences of Climate Change in Europe. PNAS, 108 7 pp.2678-2683.
Ciscar J-C, Saveyn B, Van Regemorter D, 2012a. Economic Modellilng of Climate Impacts: a partial review. Review of Business and Economic Literature, Vol. 57(2):144-156.
Ciscar J-C, Szabó L, Van Regemorter D, Soria A, 2012b. The integration of PESETA sectoral economic impacts into the GEM-E3 Europe model: methodology and results. Climatic Change 112(1):127-142.
Dosio A., Paruolo P., and Rojas R. (2012). Bias correction of the ENSEMBLES high resolution climate change projections for use by impact models: analysis of the climate change signal, J. Geophys. Res, 117, DOI:10.1029/2012JD017968
Dosio A and Paruolo P (2011). Bias correction of the ENSEMBLES high-resolution climate change projections for use by impact models: Evaluation on the present climate, J. Geophys. Res., 116, D16106, DOI: 10.1029/2011JD015934
Dowling P, 2012. The Impact of Climate Change on the European Energy System submitted to Energy Policy journal
Feyen L, Rojas R and Bianchi A, 2012. River Floods in the European Union: Socio-economic impacts and cost/benefits of adaptation. Institute for Environment and Sustainability. Joint Research Centre
Iglesias A, Garrote L, Quiroga, M, Moneo M, 2012. A regional comparison of the effects of climate change on agriculture in Europe. Climatic Change (on-line access).
Nakicenovic, N. & Swart, R. 2000. Special Report on Emissions Scenarios: A Special Report of Working Group III of the Intergovernmental Panel on Climate Change. CambridgeUniversity Press, Cambridge, U.K.
Nemry F and Demirel H, 2012. Transport and Climate Change: a Focus on Road and Rail Infrastructures. JRC Scientific and Policy Reports 25553 EN.