EEG network connectivity changes in mild cognitive impairment - Preliminary results
Upload
khangminh22Category
view
2download
0
GLENCOÂE
Glencore Preliminary Results 2021 1
NEWS RELEASE Baar, 15 February 2022
Preliminary Results 2021 Highlights Glencore’s Chief Executive Officer, Gary Nagle, commented:
“In spite of the ongoing challenges of Covid-19, 2021 was an extraordinary year for Glencore, reflecting rising demand for our metals and energy products, record Adjusted EBITDA and the transition to new leadership.
“Against the strong commodity backdrop, and leveraging the unique combination of our transition and energy commodities, along with the global reach and scale of our marketing business, the Group delivered an 84% increase in Adjusted EBITDA to $21.3 billion. Marketing delivered another robust performance, with Adjusted EBIT up by 11% to $3.7 billion, while multi-year or record high prices for many of our commodities, underpinned the 118% jump in Industrial Adjusted EBITDA to $17.1 billion. Net income attributable to equity holders was $5.0 billion.
“The significant improvement in the Group’s financial results has driven Net debt down to $6.0 billion, allowing for today’s announcement of $4.0 billion of shareholder returns, comprising a recommended $3.4 billion ($0.26 per share) base distribution (in respect of 2021 cash flows), alongside a $550 million share new buyback (c.$0.04 per share) programme.
“Looking forward, we remain focused on our strategy to enable and deliver decarbonisation and meet the increasing demand for everyday metals, while responsibly meeting the energy needs of today. We look to the future confident that we have the right pathway to succeed in a net zero economy and create sustainable long-term value for all stakeholders, while operating in a responsible manner across all aspects of our business.”
US$ million 2021 2020 Change % Key statement of income and cash flows highlights1: Revenue 203,751 142,338 43 Adjusted EBITDA◊ 21,323 11,560 84 Adjusted EBIT◊ 14,495 4,416 228 Net income/(loss) attributable to equity holders 4,974 (1,903) n.m Earnings/(loss) per share (Basic) (US$) 0.38 (0.14) n.m Funds from operations (FFO)◊ 17,057 8,325 105 Cash generated by operating activities before working capital changes, interest and tax 16,725 8,568 95
US$ million 31.12.2021 31.12.2020 Change %
Key financial position highlights: Total assets 127,510 118,000 8 Total equity 36,917 34,402 7 Net funding2◊ 30,837 35,428 (13) Net debt2◊ 6,042 15,844 (62) Ratios: FFO to Net debt◊ 282.3% 52.5% 437 Net debt to Adjusted EBITDA2◊ 0.28 1.37 (79)
1 Refer to basis of presentation on page 6. 2 Includes $857 million (2020: $652 million) of Marketing related lease liabilities. ◊ Adjusted measures referred to as Alternative performance measures (APMs) which are not defined or specified under the requirements of International Financial Reporting
Standards; refer to APMs section on page 109 for definitions and reconciliations and to note 2 of the financial statements for reconciliation of Adjusted EBIT/EBITDA.
UPDATE ON INVESTIGATIONS As previously disclosed, Glencore is subject to a number of investigations by regulatory and enforcement authorities including the U.S. Department of Justice, the U.S. Commodity Futures Trading Commission, the UK Serious Fraud Office and the Brazilian Federal Prosecutor’s Office. Glencore has been cooperating extensively with the various authorities in order to resolve these investigations as expeditiously as possible. While Glencore cannot forecast with certainty the cost, extent, timing or terms of the outcomes of the investigations, the Company presently expects to resolve the U.S., UK and Brazilian investigations in 2022. Accordingly, and based on the Company’s current information and understanding, the Group has raised a provision as at 31 December 2021 in the amount of $1,500 million representing the Company’s current best estimate of the costs to resolve these investigations. The U.S. resolutions are expected to cover separate investigations into bribery and market manipulation. The resolution of the other investigations into the Group is not included within this provision and they remain ongoing. We will provide further updates on the investigations at the appropriate time.

HIGHLIGHTS continued
Glencore Preliminary Results 2021 2
STRONG FINANCIAL PERFORMANCE – $21.3 billion Adjusted EBITDA, up 84% (y/y), underpinned by robust Marketing and Industrial results
– Net income, pre-significant items: $9.1 billion, up 267%
– Net income attributable to equity holders was $5.0 billion (loss of $1.9 billion in 2020). Significant items principally comprise the required accounting recycling to the income statement of Mopani’s non-controlling interests upon its disposal ($1.0 billion), impairment charges of $1.8 billion, mainly attributable to our Koniambo nickel operation and a $1.5 billion provision raised with respect to the regulatory investigations noted above.
– Net cash purchase and sale of PP&E: $3.8 billion, down 3%
– Shareholder returns of $4.0 billion announced, comprising a proposed $0.26/share ($3.4 billion) base distribution in respect of 2021 cash flows, alongside a new $550 million share buyback program
RECORD INDUSTRIAL ASSET ADJUSTED EBITDA CONTRIBUTION – Industrial Assets Adjusted EBITDA $17.1 billion, up 118%, underpinned by significantly higher commodity prices with many
reaching record or multi-year highs, amid widespread supply/demand deficits
– Metals $12.0 billion (+65%), Energy $5.6 billion (+439%); balance is Corporate and other
– Unit cost results: Cu 67¢/lb (-27¢/lb y/y); Zn -4¢/lb (+3¢/lb y/y); Ni 454¢/lb (+78¢/lb y/y); coal $52.90/t ($50.6/t margin)
HIGHER AND BROAD-BASED MARKETING RESULTS – Marketing revenues $182 billion, up 46% y/y
– Marketing Adjusted EBIT $3.7 billion, up 11% y/y
– Energy Adjusted EBIT: $1.4 billion (-21%), as a strong 2021 coal result limited the net overall reduction, given oil’s lower contribution relative to the prior year, wherein it capitalised on the exceptional market conditions
– Metals Adjusted EBIT: $2.5 billion (+50%), as all key markets exhibited strong demand, supply constraints and inventory drawdowns
– Viterra agricultural business contributed $473 million (2020: $211 million) share of net earnings
HEALTHY BALANCE SHEET – Net debt being managed around a $10 billion cap, with sustainable deleveraging (after base distribution) below such cap
periodically returned to shareholders via special distributions / buybacks, as appropriate.
– Year-end Net debt of $6.0 billion allows for $4.0 billion of shareholder returns
– Robust cash flow coverage ratios: FFO to Net debt of 282.3% and Net debt to Adjusted EBITDA of 0.28x
– RMI of $24.8 billion, up $5.2 billion, due to the significantly higher commodity prices
– Available committed liquidity of $10.3 billion; bond maturities capped at c.$3 billion in any given year
– Spot illustrative annualized free cash flow generation of c.$14.1 billion from Adjusted EBITDA of c.$26.5 billion
MINING SECTOR-LEADING CLIMATE STRATEGY – Committed in 2021 to more aggressive total emissions reductions with a new short-term target of a 15% reduction by 2026,
and a 10% increase in our medium-term target to a 50% reduction by 2035. Net zero ambition by 2050
– Responsible decline of our coal portfolio will help meet critical regional energy needs and affordability as decarbonisation pathways will be non-linear across time and geography
– Progress on our Climate Action Transition Plan will be put to shareholders for an advisory vote at the AGM in late April 2022
For further information please contact:
Investors
Martin Fewings t: +41 41 709 2880 m: +41 79 737 5642 [email protected]
Media
Charles Watenphul t: +41 41 709 2462 m: +41 79 904 3320 [email protected]
www.glencore.com
Glencore LEI: 2138002658CPO9NBH955
This announcement contains inside information.

HIGHLIGHTS continued
Glencore Preliminary Results 2021 3
Notes for Editors Glencore is one of the world’s largest global diversified natural resource companies and a major producer and marketer of more than 60 responsibly-sourced commodities that advance everyday life. The Group's operations comprise around 150 mining and metallurgical sites and oil production assets.
With a strong footprint in over 35 countries in both established and emerging regions for natural resources, Glencore's industrial activities are supported by a global network of more than 30 marketing offices. Glencore's customers are industrial consumers, such as those in the automotive, steel, power generation, battery manufacturing and oil sectors. We also provide financing, logistics and other services to producers and consumers of commodities. Glencore's companies employ around 135,000 people, including contractors.
Glencore is proud to be a member of the Voluntary Principles on Security and Human Rights and the International Council on Mining and Metals. We are an active participant in the Extractive Industries Transparency Initiative. Our ambition is to be a net zero total emissions company by 2050.

CHIEF EXECUTIVE OFFICER’S REVIEW
Glencore Preliminary Results 2021 4
In spite of the ongoing challenges of Covid-19, 2021 was an extraordinary year for Glencore, reflecting rising demand for our metals and energy products, record Adjusted EBITDA and the transition to new leadership.
As in 2020, the pandemic overshadowed our daily lives, remaining an ongoing challenge for colleagues, our families, our local communities and society at large. As a responsible operator, our top priority is to protect the safety and health of our people and the communities that host our businesses. Sadly, we experienced four fatalities in 2021. We believe all fatalities are avoidable, and are committed to our goal of zero fatalities.
While economic activity remained below potential in many key global economies, our sector continued to perform well, given its critical function in delivering the world’s energy, food, housing, infrastructure and mobility requirements. Against the backdrop of material global central bank accommodation and government fiscal spending, prices for many of our key commodities rose to multi-year or record highs, reflecting resurgent global demand and widespread supply challenges. Copper prices rose as mine production struggled to meet general industrial expansion and new energy demand. The rapid growth in electric vehicle sales supported double-digit demand growth for nickel and cobalt, while surging power costs and environmental controls disrupted zinc and aluminium supply. Thermal coal, oil and gas markets, impacted by substantial recent underinvestment in supply capacity, and low inventory levels, were unable to efficiently respond to the rapid demand growth, significantly lifting prices.
Although 2022 is likely to see a moderation in global growth, including as authorities seek to tame inflation, many commodity markets currently exhibit low inventories and are prone to supply disruption, which, when set against the significant new investment in electrification and decarbonisation, should support prices for our key metals in 2022 and beyond.
2021 FINANCIAL SCORECARD Reflecting this environment and leveraging the unique combination of our transition and energy commodities, along with the global reach and scale of our marketing business, the Group has achieved a record Adjusted EBITDA result of $21.3 billion, up 84% over prior year. Net income before significant items increased 267% to $9.1 billion, while significant items reduced Net income attributable to equity holders to $5.0 billion, mainly due to the required accounting recycling to the statement of income of Mopani’s non-controlling interests upon its disposal, an impairment charge related to our Koniambo nickel operation and recording a provision for costs currently estimated to resolve the various government investigations discussed below.
In marketing, tight physical commodity markets and supply chain challenges, which resulted in elevated levels of volatility, generated ideal trading conditions, with Adjusted EBIT growing 11% to a record $3.7 billion. Strong trading performances were delivered across all commodity departments. Agricultural markets also offered favourable market conditions, with our 49.9% share of Viterra’s earnings contributing $473 million.
Industrial Adjusted EBITDA of $17.1 billion was 118% higher than 2020, primarily reflecting strong margin expansion at our copper, ferroalloys and coal assets. Coal (Newc), cobalt, copper, nickel and zinc average year-over-year price increases were 125%, 60%, 51%, 34% and 32% respectively.
Aided by strong cash generation, Net debt reduced during the year by $9.8 billion to $6.0 billion. Net funding also declined, however down by a lesser $4.6 billion to $30.8 billion, due to increased readily marketable inventories on hand, on account of the significantly higher prices noted above. With Net debt/Adjusted EBITDA and FFO/Net debt metrics of 0.28x and 282.3% respectively, we currently enjoy significant financial headroom and strength.
SHAREHOLDER RETURNS At our investor update in December 2021, we refined our capital allocation policy to manage Net debt, in the ordinary course of business, to around a c.$10 billion cap, with deleveraging below such cap (after the base distribution), being periodically returned to shareholders via special cash distributions and/or share buybacks as appropriate.
In 2021, we delivered c.$2.8 billion of shareholder returns, comprising a $1.6 billion base cash distribution (in respect of 2020 cash flows), a c.$500 million special cash distribution and $750 million of share purchases.
For 2022, basis 2021 cash flows, we are recommending to shareholders a $0.26 per share (c.$3.4 billion) base cash distribution, payable in two equal instalments, comprising $1 billion from Marketing cash flows and 25% ($2.4 billion) of Industrial attributable cash flows.
The application of our “Top up” returns framework generates an additional payment of c.$550 million to restore Net debt to our target optimal cap level of c.$10 billion. We are therefore announcing a new $550 million share buyback programme to be completed before release of our 2022 interim results, representing an additional c.$0.04 per share.
PATHWAY TO SUCCEED IN A NET ZERO ECONOMY During 2021 we identified further carbon reduction opportunities across the portfolio and significantly expanded our Marginal Abatement Cost Curve. Additionally, our assessment of the impact of carbon prices on industry cost curves for our key commodities illustrated that our portfolio is resilient to a range of carbon pricing scenarios given our assessment that these costs will be passed onto the consumer and the favourable emissions intensity positions that our overall weighted average industrial portfolio occupies on these curves.
Reflecting additional work on our emissions profile and opportunities to deliver reductions, we strengthened our medium-term emissions reduction target and introduced a new short-term target. We are now committed to reducing total emissions (Scope 1+2+3) by 15% by 2026 and 50% by 2035, both on 2019 levels. Post 2035, our ambition remains to achieve net zero total emissions by 2050 with a supporting policy environment.

CHIEF EXECUTIVE OFFICER’S REVIEW continued
Glencore Preliminary Results 2021 5
Our targets and ambition reflect our commitment to align our business strategy with the goals of the Paris Agreement. Our strategy of responsibly depleting our coal portfolio over time reflects our belief that the energy transition will be non-linear across time and geography, with the responsible decline of our coal portfolio meeting critical regional energy needs and affordability through this evolution.
Many of our shareholders have expressed the importance they attach to climate change considerations and their expectation for Glencore to align its business strategy with the goals of the Paris Agreement. Our 2026 target lies within the range of IPCC 1.5 degree scenarios and our 2035 target is aligned with the IEA NZE 2050 scenario, itself consistent with IPCC.
At our 2021 AGM, we provided our shareholders with their first advisory vote on our climate action transition plan, with more than 94% of shareholders voting in favour. I look forward to continued engagement with our stakeholders as we progress the implementation of our strategy and respond to the global challenges of climate change and meeting the UN’s Sustainable Development Goals.
GOVERNANCE We continue to cooperate extensively with the various authorities investigating Glencore in order to resolve these investigations as expeditiously as possible. While we cannot forecast with certainty the cost, extent, timing or terms of the outcomes of the investigations, we presently expect to resolve the U.S., UK and Brazilian investigations in 2022. Accordingly, and based on our current information and understanding, we have recorded a provision as at 31 December 2021 of $1,500 million representing the Company’s current best estimate of the costs to resolve these investigations. In addition, we continue to cooperate with the previously disclosed investigation by the Office of the Attorney General of Switzerland (OAG) and are also in contact with the Dutch authorities in connection with an investigation which has a similar scope to that of the OAG investigation and is being coordinated with the OAG. The timing and outcome of these investigations remain uncertain, but we would expect any possible resolution to avoid duplicative penalties for the same conduct.
We are committed to upholding a culture of ethics and compliance across our business. We have taken a number of remedial measures in light of what we have learned during the investigations and have dedicated substantial resources over the last few years to upgrade and implement a best-in-class Ethics and Compliance programme. This includes significant investments in compliance personnel, systems and external assurance.
We have strengthened our Values and Code of Conduct and rolled these out through a comprehensive global campaign designed to embed them throughout our business. Our Values of safety, integrity, responsibility, openness, simplicity and entrepreneurialism guide us in everything that we do. We expect all employees to commit to our Code regardless of who they are or where they work. We have also strengthened our policy framework which comprises a suite of policies, standards, procedures and guidelines. The policies are publicly available on our website and set out the commitments through which we strive to be a responsible and ethical operator.
The safety and security of our workforce and the communities living around our assets are a priority recognised across our operational activities. Our ambition is to prevent all fatalities, occupational diseases and injuries wherever we operate. We relaunched “SafeWork” during the year to address underlying issues in historical safety performance. We believe that consistent application of SafeWork through strong visible leadership will drive a culture of safe operating discipline and get our people home safe.
We are also very pleased to have appointed Kalidas Madhavpeddi as Board Chair and David Wormsley as a new independent Non-Executive Director during the year.
Kalidas’ 40 years of experience in the international mining industry is instrumental to Glencore as we focus on achieving our objectives of delivering sustainable shareholder returns, playing a leading role in the green energy transition and securing our ambition of being a net zero total emissions company by 2050. David brings 35 years of extensive experience in investment banking, both in the UK and internationally. We look forward to their continued contribution to our Board.
OUTLOOK We are focused on continuing to position our portfolio towards larger, higher-margin, longer-life assets essential to the transition. In this regard, we have progressively announced a series of transactions (primarily disposals) delivering further portfolio alignment and simplification.
In January 2022, Viterra announced that, subject to customary regulatory approvals, it would acquire Gavilon, a major US based origination and handling business, for $1.125 billion, plus working capital, with funding provided from its own balance sheet. The acquisition will give scale in this key producing region, largely completing Viterra’s coveted geographic network coverage.
Our low-carbon advantaged commodities, geographies and recycling capabilities give us the unique ability to supply the sustainable commodities that our customers increasingly need. We have the right strategy and the right business model to generate sustainable long-term value for all stakeholders.
Gary Nagle
Chief Executive Officer

FINANCIAL AND OPERATIONAL REVIEW
Glencore Preliminary Results 2021 6
BASIS OF PRESENTATION The financial information in the Financial and Operational Review is presented on a segmental measurement basis, including all references to revenue (see note 2) and has been prepared on the basis as outlined in note 1 of the financial statements, with the exception of the accounting treatment applied to relevant material associates and joint ventures for which Glencore’s attributable share of revenues and expenses are presented. In addition, the Peruvian listed Volcan, while a subsidiary of the Group, is accounted for using the equity method for internal reporting and analysis due to the relatively low economic interest (23%) held by the Group.
The Group’s results are presented on an “adjusted” basis, using alternative performance measures (APMs) which are not defined or specified under the requirements of IFRS, but are derived from the financial statements, prepared in accordance with IFRS, reflecting how Glencore’s management assesses the performance of the Group. The APMs are provided in addition to IFRS measures to aid in the comparability of information between reporting periods and segments and to aid in the understanding of the activities taking place across the Group by adjusting for Significant items and by aggregating or disaggregating (notably in the case of relevant material associates and joint ventures accounted for on an equity basis) certain IFRS measures. APMs are also used to approximate the underlying operating cash flow generation of the operations (Adjusted EBITDA). Significant items (see reconciliation below) are items of income and expense, which, due to their nature and variable financial impact or the expected infrequency of the events giving rise to them, are separated for internal reporting and analysis of Glencore’s results, to aid in providing an understanding and comparative basis of the underlying financial performance.
Alternative performance measures are denoted by the symbol ◊ and are further defined and reconciled to the underlying IFRS measures in the APMs section on page 109.
MARKET CONDITIONS Selected average commodity prices
Spot
31 Dec 2021 Spot
31 Dec 2020 Average
2021 Average
2020 Change in average %
S&P GSCI Industrial Metals Index 499 382 457 318 44 S&P GSCI Energy Index 252 164 230 138 67 LME (cash) copper price ($/t) 9,741 7,749 9,320 6,186 51 LME (cash) zinc price ($/t) 3,590 2,729 3,005 2,269 32 LME (cash) lead price ($/t) 2,338 1,976 2,202 1,826 21 LME (cash) nickel price ($/t) 20,881 16,554 18,474 13,803 34 Gold price ($/oz) 1,829 1,898 1,799 1,771 2 Silver price ($/oz) 23 26 25 21 19 Metal Bulletin cobalt standard grade, in-warehouse Rotterdam ($/lb)
32 15 24 15 60
Ferro-chrome 50% Cr import, CIF main Chinese ports, contained Cr (¢/lb)
114 73 113 70 61
Iron ore (Platts 62% CFR North China) price ($/DMT) 113 154 156 105 49 Coal API4 ($/t) 126 93 125 65 92 Coal Newcastle (6,000) ($/t) 166 82 137 61 125 Oil price – Brent ($/bbl) 78 52 71 43 65
Currency table
Spot
31 Dec 2021 Spot
31 Dec 2020 Average
2021 Average
2020 Change in average %
AUD : USD 0.72 0.77 0.75 0.69 9 USD : CAD 1.26 1.27 1.25 1.34 (7) EUR : USD 1.14 1.22 1.18 1.14 3 GBP : USD 1.35 1.37 1.37 1.28 7 USD : CHF 0.91 0.89 0.91 0.94 (3) USD : KZT 435 421 427 414 3 USD : ZAR 15.94 14.69 14.79 16.46 (10)

FINANCIAL AND OPERATIONAL REVIEW continued
Glencore Preliminary Results 2021 7
FINANCIAL RESULTS Following Covid-19’s severe economic impacts in 2020, a recovery in demand, together with multiple supply-side issues, resulted in generally significant inventory drawdowns and prices for most of our key commodities reaching multi-year highs. These higher prices, along with our industrial portfolio’s competitive cost structure, gave rise to a record Adjusted EBITDA contribution for our industrial asset segment. Our marketing segment also delivered a record performance, owing to tight physical supply / demand fundamentals for our core commodities and the associated improvement in arbitrage opportunities. Group net income attributable to equity holders improved from a loss of $1,903 million in 2020 to an income of $4,974 million in 2021, after recognising various significant items discussed below. EPS increased from negative $0.14 per share to positive $0.38 per share.
The economic recovery seen in late 2020 continued into 2021, helped significantly by major governments and central banks initiating and sustaining the provision of material stimulus to the global economy. Average year-over-year price increases for coal (Newc), cobalt, copper, nickel and zinc were 125%, 60%, 51%, 34% and 32% respectively. Owing mainly to such higher prices, Adjusted EBITDA set a record of $21,323 million and Adjusted EBIT was $14,495 million in 2021, compared to $11,560 million and $4,416 million in 2020. The positive impact of the higher commodity prices on Adjusted EBITDA was somewhat tempered by higher costs (mainly energy), the effects of a weaker US dollar against most of our producer currencies, including average year-over-year declines against the Australian dollar (9%) and the South African rand (10%) and modestly lower production levels. Adjusted EBITDA mining margins improved to 45% (2020: 36%) in our metal operations and to 47% (2020: 17%) in our energy operations. See page 18.
Adjusted EBITDA/EBIT◊ Adjusted EBITDA by business segment is as follows:
2021 2020
US$ million Marketing
activities Industrial activities
Adjusted EBITDA
Marketing activities
Industrial activities
Adjusted EBITDA
Change %
Metals and minerals 2,588 12,017 14,605 1,768 7,285 9,053 61 Energy products 1,829 5,603 7,432 2,053 1,039 3,092 140 Corporate and other1 (194) (520) (714) (89) (496) (585) 22 Total 4,223 17,100 21,323 3,732 7,828 11,560 84
Adjusted EBIT by business segment is as follows:
2021 2020
US$ million Marketing
activities Industrial activities
Adjusted EBIT
Marketing activities
Industrial activities
Adjusted EBIT
Change %
Metals and minerals 2,494 8,128 10,622 1,667 3,054 4,721 125 Energy products 1,395 3,252 4,647 1,761 (1,365) 396 1,073 Corporate and other1 (194) (580) (774) (89) (612) (701) 10 Total 3,695 10,800 14,495 3,339 1,077 4,416 228
1 Corporate and other Marketing activities includes $473 million (2020: $211 million) of Glencore’s equity accounted share of Viterra.
Marketing activities Marketing delivered record results as the scale of commodity demand recovery, intersecting with numerous primary supply and supply chain shocks and constraints, resulted in elevated levels of market volatility and rapidly and materially changing underlying supply and demand scenarios. This backdrop provided overall supportive physical commodity marketing conditions, with Adjusted EBITDA and EBIT increasing by 13% to $4,223 million and by 11% to $3,695 million, respectively. Metals and minerals Adjusted EBIT was up 50% with nearly all departments contributing double-digit % increases over the prior year. Energy products Adjusted EBIT was down 21% over 2020, with a strong 2021 coal result limiting the net overall reduction, given oil’s lower contribution relative to the prior year, wherein it capitalised on the exceptional price movements and dislocations across crude oil, refined products, storage and logistics.
Across 2021, agricultural markets also saw record prices for many commodities. On the back of strong global demand and solid production in most major origins, Viterra reported an EBITDA and Net Income of approximately $2.2 billion and $1 billion respectively. Accordingly, our 49.99% share of its net earnings (captured within Corporate and Other) was $473 million (post-interest and tax) compared to $211 million in 2020. Viterra paid Glencore a dividend of $150 million in H2 2021.
Industrial activities Industrial Adjusted EBITDA increased by 118% to $17,100 million (Adjusted EBIT was $10,800 million, compared to $1,077 million in 2020). As noted above, the increase was primarily driven by stronger average year-over-year commodity prices, particularly related to our copper, cobalt, ferrochrome, nickel and coal operations, driven by recovery of global demand and various supply challenges, most notably seen across the energy spectrum (gas, coal and oil), impacting product availability and cost.
FINANCIAL AND OPERATIONAL REVIEW continued
Glencore Preliminary Results 2021 8
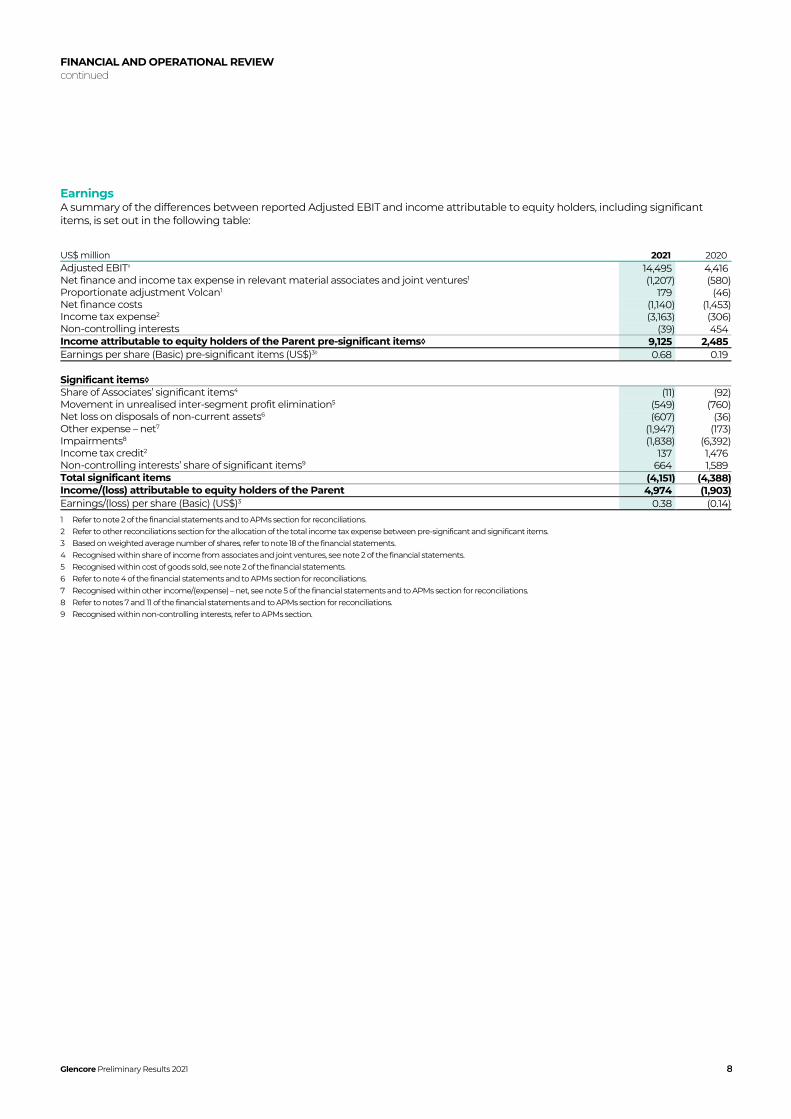
Earnings A summary of the differences between reported Adjusted EBIT and income attributable to equity holders, including significant items, is set out in the following table:
US$ million 2021 2020 Adjusted EBIT◊ 14,495 4,416 Net finance and income tax expense in relevant material associates and joint ventures1 (1,207) (580) Proportionate adjustment Volcan1 179 (46) Net finance costs (1,140) (1,453) Income tax expense2 (3,163) (306) Non-controlling interests (39) 454 Income attributable to equity holders of the Parent pre-significant items◊ 9,125 2,485 Earnings per share (Basic) pre-significant items (US$)3◊ 0.68 0.19 Significant items◊ Share of Associates’ significant items4 (11) (92) Movement in unrealised inter-segment profit elimination5 (549) (760) Net loss on disposals of non-current assets6 (607) (36) Other expense – net7 (1,947) (173) Impairments8 (1,838) (6,392) Income tax credit2 137 1,476 Non-controlling interests’ share of significant items9 664 1,589 Total significant items (4,151) (4,388) Income/(loss) attributable to equity holders of the Parent 4,974 (1,903) Earnings/(loss) per share (Basic) (US$)3 0.38 (0.14)
1 Refer to note 2 of the financial statements and to APMs section for reconciliations. 2 Refer to other reconciliations section for the allocation of the total income tax expense between pre-significant and significant items. 3 Based on weighted average number of shares, refer to note 18 of the financial statements. 4 Recognised within share of income from associates and joint ventures, see note 2 of the financial statements. 5 Recognised within cost of goods sold, see note 2 of the financial statements. 6 Refer to note 4 of the financial statements and to APMs section for reconciliations. 7 Recognised within other income/(expense) – net, see note 5 of the financial statements and to APMs section for reconciliations. 8 Refer to notes 7 and 11 of the financial statements and to APMs section for reconciliations. 9 Recognised within non-controlling interests, refer to APMs section.

FINANCIAL AND OPERATIONAL REVIEW continued
Glencore Preliminary Results 2021 9
Significant items Significant items are items of income and expense, which, due to their nature and variable financial impact or the expected infrequency of the events giving rise to them, are separated for internal reporting, and analysis of Glencore’s results, to aid in providing an understanding and comparative basis of the underlying financial performance.
In 2021, Glencore recognised a net expense, after tax and non-controlling interests, of $4,151 million (2020: $4,388 million) in significant items comprised of:
• Expenses of $11 million (2020: $92 million) relating to Glencore’s share of significant expenses recognised directly by our associates.
• Loss on disposals of non-current assets of $607 million (2020: $36 million) primarily related to the required accounting recycling to the statement of income of Mopani’s non-controlling interests upon disposal (see note 26), net of gains recognised on disposal of other investments/operations of $208 million and gains on disposal of property, plant and equipment of $207 million.
• Income tax credit of $137 million (2020: credit of $1,476 million) – see income taxes below.
• Other income/(expense) – net expense of $1,947 million (2020: $173 million) see note 5. Balance primarily comprises:
– $64 million (2020: $438 million) of mark-to-market gains on equity investments / derivative positions accounted for as held for trading, including the commodity price linked deferred consideration related to the sale of Mototolo in 2018.
– $187 million net loss (2020: $192 million) of net foreign exchange movements.
– $1,640 million (2020: $113 million) relating to various legal matters, including the provision and related costs (legal, expert and compliance) for the on-going investigations (see notes 23 and 31).
– $Nil (2020: $214 million) of closure and severance costs. 2020 related primarily to suspension of operations at Prodeco coal in Colombia and closure of the Aguilar zinc mine in Argentina.
• Impairments of $1,838 million (2020: $6,392 million), see note 7. The corresponding net impact, after income taxes and non-controlling interests was $1,137 million (2020: $3,805 million). The 2021 charge primarily relates to:
– Koniambo ($1,170 million), due to lower throughput and higher cost assumptions, and the emergence of higher discounts on non-battery application nickel relative to the LME benchmark, such having been reassessed following failures at the power plant and a slag leak at the metallurgical plant over H1 2021.
– HG Storage ($331 million), our 49% interest in an oil storage and terminals business, following a review of the carrying value against valuation benchmarks.
– Net $98 million reversal of impairments following an improvement in the underlying financial condition of various counterparties and the restructuring of certain loans and physical advances.
– $151 million relating to continued challenge and non-performance by certain government authorities in settling long outstanding VAT claims.
The 2020 impairment related primarily to the Mopani copper operations ($1,041 million), the Volcan zinc operations ($2,347 million), the Prodeco coal operations ($835 million), the Chad oil operations ($673 million) and the Astron oil refinery ($480 million).
Net finance costs Net finance costs were $1,140 million during 2021, a 22% decrease compared to $1,453 million in the comparable reporting period, due to lower average base rates (mainly US$ Libor) and lower net funding levels year-over-year. Interest expense for 2021 was $1,348 million, down 14% over 2020 and interest income was $208 million compared to $120 million in the prior year. See note 6.
Income taxes An income tax expense of $3,026 million was recognised during 2021, compared to a credit of $1,170 million in 2020. The effective tax rate is 63.6%, and when adjusting for significant items (primarily impairments, foreign exchange adjustments and tax losses not recognised), the effective tax rate reduces to 33.5% (29.7% in 2020).
FINANCIAL AND OPERATIONAL REVIEW continued
Glencore Preliminary Results 2021 10
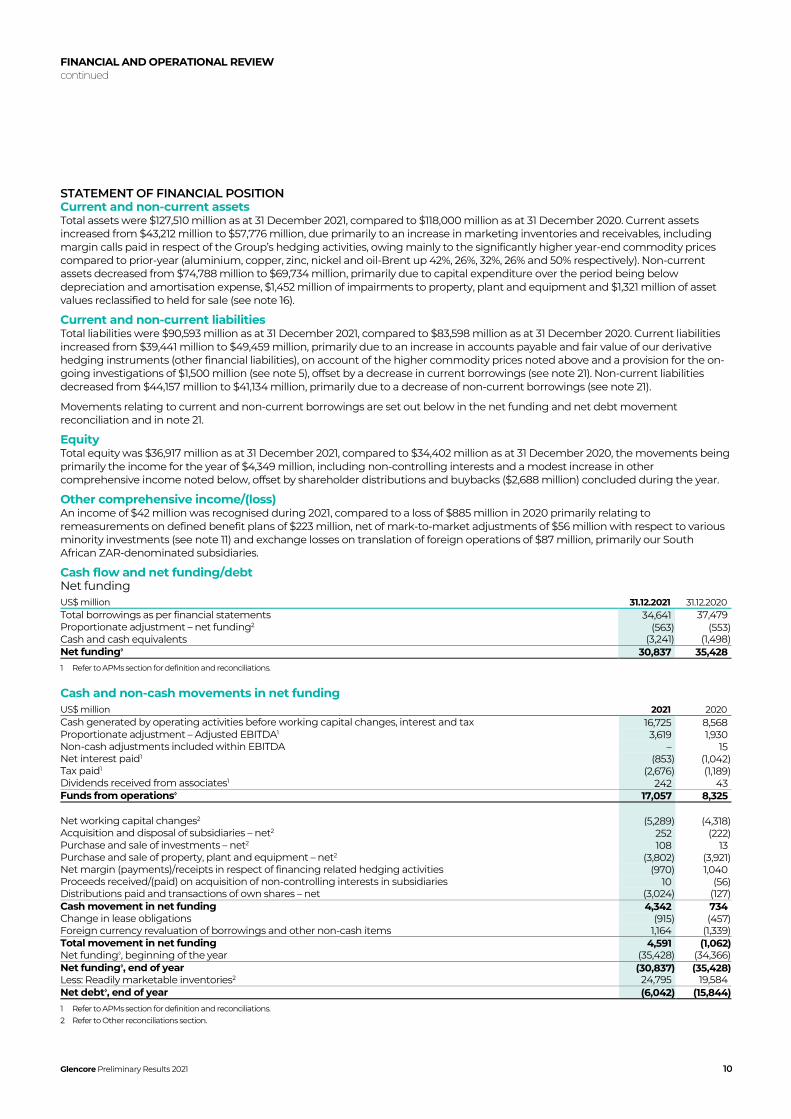
STATEMENT OF FINANCIAL POSITION Current and non-current assets Total assets were $127,510 million as at 31 December 2021, compared to $118,000 million as at 31 December 2020. Current assets increased from $43,212 million to $57,776 million, due primarily to an increase in marketing inventories and receivables, including margin calls paid in respect of the Group’s hedging activities, owing mainly to the significantly higher year-end commodity prices compared to prior-year (aluminium, copper, zinc, nickel and oil-Brent up 42%, 26%, 32%, 26% and 50% respectively). Non-current assets decreased from $74,788 million to $69,734 million, primarily due to capital expenditure over the period being below depreciation and amortisation expense, $1,452 million of impairments to property, plant and equipment and $1,321 million of asset values reclassified to held for sale (see note 16).
Current and non-current liabilities Total liabilities were $90,593 million as at 31 December 2021, compared to $83,598 million as at 31 December 2020. Current liabilities increased from $39,441 million to $49,459 million, primarily due to an increase in accounts payable and fair value of our derivative hedging instruments (other financial liabilities), on account of the higher commodity prices noted above and a provision for the on-going investigations of $1,500 million (see note 5), offset by a decrease in current borrowings (see note 21). Non-current liabilities decreased from $44,157 million to $41,134 million, primarily due to a decrease of non-current borrowings (see note 21).
Movements relating to current and non-current borrowings are set out below in the net funding and net debt movement reconciliation and in note 21.
Equity Total equity was $36,917 million as at 31 December 2021, compared to $34,402 million as at 31 December 2020, the movements being primarily the income for the year of $4,349 million, including non-controlling interests and a modest increase in other comprehensive income noted below, offset by shareholder distributions and buybacks ($2,688 million) concluded during the year.
Other comprehensive income/(loss) An income of $42 million was recognised during 2021, compared to a loss of $885 million in 2020 primarily relating to remeasurements on defined benefit plans of $223 million, net of mark-to-market adjustments of $56 million with respect to various minority investments (see note 11) and exchange losses on translation of foreign operations of $87 million, primarily our South African ZAR-denominated subsidiaries.
Cash flow and net funding/debt Net funding
US$ million 31.12.2021 31.12.2020 Total borrowings as per financial statements 34,641 37,479 Proportionate adjustment – net funding2 (563) (553) Cash and cash equivalents (3,241) (1,498) Net funding◊ 30,837 35,428
1 Refer to APMs section for definition and reconciliations.
Cash and non-cash movements in net funding
US$ million 2021 2020 Cash generated by operating activities before working capital changes, interest and tax 16,725 8,568 Proportionate adjustment – Adjusted EBITDA1 3,619 1,930 Non-cash adjustments included within EBITDA – 15 Net interest paid1 (853) (1,042) Tax paid1 (2,676) (1,189) Dividends received from associates1 242 43 Funds from operations◊ 17,057 8,325 Net working capital changes2 (5,289) (4,318) Acquisition and disposal of subsidiaries – net2 252 (222) Purchase and sale of investments – net2 108 13 Purchase and sale of property, plant and equipment – net2 (3,802) (3,921) Net margin (payments)/receipts in respect of financing related hedging activities (970) 1,040 Proceeds received/(paid) on acquisition of non-controlling interests in subsidiaries 10 (56) Distributions paid and transactions of own shares – net (3,024) (127) Cash movement in net funding 4,342 734 Change in lease obligations (915) (457) Foreign currency revaluation of borrowings and other non-cash items 1,164 (1,339) Total movement in net funding 4,591 (1,062) Net funding◊, beginning of the year (35,428) (34,366) Net funding◊, end of year (30,837) (35,428) Less: Readily marketable inventories2 24,795 19,584 Net debt◊, end of year (6,042) (15,844)
1 Refer to APMs section for definition and reconciliations. 2 Refer to Other reconciliations section.

FINANCIAL AND OPERATIONAL REVIEW continued
Glencore Preliminary Results 2021 11
The reconciliation in the table above is the method by which management reviews movements in net funding and net debt and comprises key movements in cash and any significant non-cash items.
Net funding as at 31 December 2021 decreased by $4.6 billion to $30,837 million and net debt (net funding less readily marketable inventories) decreased by $9.8 billion to $6,042 million, as funds from operations of $17,057 million significantly exceeded the $3,802 million of net capital expenditure and $3,024 million of distribution to shareholders, non-controlling interests and purchase of own shares.
Business and investment acquisitions and disposals Net inflows from business and investment disposals/acquisitions were $370 million over the year, compared to an outflow of $265 million in 2020. The net inflow comprises disposals of a number of minority interest investments, none of which were individually material and proceeds from the sale of Chemoil Terminals (oil storage facilities in the US) for $248 million (see note 26). The net outflow in 2020 was primarily cash derecognised upon disposal of Minera Alumbera, the acquisition of a 30% interest in PT CITA Mineral Investindo Tbk and the acquisition of the remaining 0.5% minority interest held in Katanga Mining Limited.
Liquidity and funding activities In 2021, the following significant financing activities took place:
• In February 2021, issued:
– 5 year $475 million, 4.375% coupon bond (Volcan)
• In March 2021, issued:
– 8 year EUR600 million, 0.75% coupon bond
– 12 year EUR500 million, 1.25% coupon bond
• In April 2021, issued:
– 5 year $600 million, 1.625% coupon bond
– 10 year $600 million, 2.85% coupon bond
– 30 year $500 million, 3.875% coupon bond
• In September 2021, issued:
– 7 year CHF150 million, 0.5% coupon bond
– 10 year $750 million, 2.625% coupon bond
– 30 year $500 million, 3.375% coupon bond
In March 2021, Glencore extended and voluntarily cancelled a portion of its committed revolving credit facilities, such that as at 31 December 2021, the facilities comprise:
– a $6,572 million one year revolving credit facility with a one-year borrower’s term-out option (to May 2023);
– a $450 million medium-term revolving credit facility (to May 2025); and
– a $4,200 million medium-term revolving credit facility (to May 2026).
As at 31 December 2021, Glencore had available committed liquidity amounting to $10.3 billion.
CREDIT RATINGS In light of the Group’s extensive funding activities, maintaining investment grade credit rating status is a financial priority. The Group’s credit ratings are currently Baa1 (stable) from Moody’s and BBB+ (stable) from Standard & Poor’s. Glencore’s publicly stated objective, as part of its overall financial policy package, is to seek and maintain strong Baa/BBB credit ratings from Moody’s and Standard & Poor’s respectively. In support thereof, Glencore targets a maximum 2x Net debt/Adjusted EBITDA ratio through the cycle, augmented by a Net debt cap objective of c.$10 billion.
VALUE AT RISK One of the tools used by Glencore to monitor and limit its primary market risk exposure, namely commodity price risk related to its physical marketing activities, is the use of a value at risk (VaR) computation. VaR is a risk measurement technique, which estimates the potential loss that could occur on risk positions as a result of movements in risk factors over a specified time horizon, given a specific level of confidence. The VaR methodology is a statistically defined, probability based approach that takes into account market volatilities, as well as risk diversification by recognising offsetting positions and correlations between commodities and markets. In this way, risks can be measured consistently across all markets and commodities and risk measures can be aggregated to derive a single risk value. Glencore’s Board has set a consolidated VaR limit (one day 95% confidence level) of $150 million (2020: $100 million) representing less than 0.4% of total equity, which the Board reviews annually. Given 2021’s elevated implied market volatilities, together with statistically higher commodity correlations and the nature / extent (e.g. increased size and tenor of the LNG business) of transaction volumes, the Board approved an increase in the VaR limit in H2 2021, initially to $130 million on a temporary basis and then to $150 million going forward, with effect from 1 January 2022.

FINANCIAL AND OPERATIONAL REVIEW continued
Glencore Preliminary Results 2021 12
Glencore uses a one-day VaR approach based on a Monte Carlo simulation with a weighted data history computed at a 95% confidence level. Average market risk VaR (1 day 95%) during 2021 was $54 million, with an observable high of $126 million and low of $27 million, while average equivalent VaR during 2020 was $39 million. There were no limit breaches during the period.
DISTRIBUTIONS The Directors have recommended a 2021 financial year base cash distribution of $0.26 per share amounting to some $3.4 billion, accounting for own shares held as at 31 December 2021. Payment will be effected as a $0.13 per share distribution in May 2022 and a $0.13 per share distribution in September 2022 (in accordance with the Company’s announcement of the 2022 Distribution timetable made on 15 February 2022). The Company will also conduct a buy-back of its own shares to the value of up to $550 million, with intended completion by the time of the Group’s interim results announcement in August 2022.
The cash distribution is to be effected as a reduction of the capital contribution reserves of the Company. As such, this distribution would be exempt from Swiss withholding tax. As at 31 December 2021, Glencore plc had CHF 25 billion of such capital contribution reserves in its statutory accounts. The distribution is subject to shareholders’ approval at Glencore’s AGM on 28 April 2022.
The distribution is ordinarily paid in US dollars. Shareholders on the Jersey register may elect to receive the distribution in sterling, euros or Swiss francs, the exchange rates of which will be determined by reference to the rates applicable to the US dollar at the time. Shareholders on the Johannesburg register will receive their distribution in South African rand. Further details on distribution payments, together with currency election and distribution mandate forms, are available from the Group’s website (www.glencore.com) or from the Company’s Registrars.
BOARD CHANGES Tony Hayward retired as Chairman and Kalidas Madhavpeddi was appointed as the new Chairman effective 30 July 2021.
Ivan Glasenberg retired as CEO and as a member of the Glencore Board on 30 June 2021, with Gary Nagle being appointed as CEO and Director with effect from 1 July 2021.
John Mack retired as a Non-Executive Director on 29 April 2021.
David Wormsley was appointed as an Independent Non-Executive Director of the Company, with effect from 15 September 2021.

MARKETING ACTIVITIES
Glencore Preliminary Results 2021 13
HIGHLIGHTS Commodity markets generally performed well throughout the year, bolstered by a widespread economic recovery, following the pandemic’s severe economic impacts in 2020, characterised by the imposition of lengthy lockdowns. In the context of resurgent industrial demand and generally low inventory balances, any supply-side issues (from primary production and supply chain) exacerbated the market tightness. The energy supply shortages and price increases that intensified in H2 2021 not only required careful risk (market and counterparty) management by our energy marketing units, but also had profound indirect impacts on metals marketing, as smelters globally faced higher energy costs and/or limitations on energy use. Overall market volatilities, measured both in relation to primary commodity prices and their associated pricing adjustments, such as premiums, refining margins, quality adjustments etc, were extremely elevated during 2021.
In this context, Marketing performed strongly across all major commodity groups. Marketing Adjusted EBIT was $3,695 million, up 11% over the prior period. Metals and minerals Adjusted EBIT increased by 50% to $2,494 million, while Energy Products was down 21% on an outsized 2020 result to $1,395 million. Our 49.9% interest in the Viterra agricultural products business recorded earnings of $473 million, on a share of net income basis.
US$ million Metals and
minerals Energy
products Corporate and other1 2021
Metals and minerals
Energy products
Corporate and other1 2020
Revenue 74,727 107,037 – 181,764 54,847 69,290 – 124,137 Adjusted EBITDA◊ 2,588 1,829 (194) 4,223 1,768 2,053 (89) 3,732 Adjusted EBIT◊ 2,494 1,395 (194) 3,695 1,667 1,761 (89) 3,339 Adjusted EBITDA margin 3.5% 1.7% n.m. 2.3% 3.2% 3.0% n.m. 3.0%
1 Corporate and other Marketing activities includes $473 million (2020: $211 million) of Glencore’s equity accounted share of Viterra.
Selected marketing volumes sold
Units 2021 2020 Change % Copper metal and concentrates1 mt 3.1 3.4 (9) Zinc metal and concentrates1 mt 2.7 2.8 (4) Lead metal and concentrates1 mt 1.1 1.0 10 Gold moz 1.8 2.0 (10) Silver moz 65.5 64.9 1 Nickel kt 202 149 36 Ferroalloys (incl. agency) mt 9.3 8.5 9 Alumina/aluminium mt 8.9 7.2 24 Iron ore mt 49.9 57.6 (13) Thermal coal2 mt 67.7 67.1 1 Metallurgical coal2 mt 4.6 1.3 254 Crude oil mbbl 706 791 (11) Oil products mbbl 704 738 (5)
1 Estimated metal unit contained. 2 Includes agency volumes.
COPPER Starting the year below $8,000/t, copper prices set a record high of $10,748/t in May, basis improved physical demand conditions, continued financial stimulus and high speculative positioning. Global copper demand remained strong during H2, particularly in North America and Europe where consumption had recovered to pre-Covid levels. Mine supply growth in 2021, however, was nominal, given the challenges faced in returning to pre-Covid operating rates. Against this backdrop, refined copper inventories reached multi-year lows in H2 2021, with exchange inventories drawing to their lowest levels since 2008. Cathode premiums moved to their highest levels in five years, while LME cash copper traded at a premium to the three-month price, with a difference of over $1,000/t in October. During 2021, net imports of refined copper to the USA were at levels not seen in more than 10 years.
Spot smelter treatment and refining charges, the fee paid by mines to smelters, reached multi-year lows in 2021, as competition for available concentrates increased. The 2022 benchmark level, however, increased year-over-year, following six years of steady declines, reflecting the market’s anticipation of concentrate mine supply growth.
Looking forward, we expect mine supply growth to be constrained by ageing assets, declining ore grades, a diminished project pipeline and the measures taken to contain the spread of Covid-19, with various new projects likely to experience delays. In the near term, we expect global demand to remain strong, with steady growth rates longer term, driven by population growth and rising living standards in emerging economies. Climate change policies will also be a key driver for copper growth sectors, given its crucial role in accelerating the clean energy transition, from renewable power generation and distribution, to energy storage and electric vehicles (EVs).
COBALT 2021 started strongly from a demand and pricing perspective, with positive momentum in Chinese and European EV demand and a level of stockpiling key strategic materials, particularly in China. Commencing 2021 at $15.30/lb, prices rallied 65% through Q1 to reach

MARKETING ACTIVITIES continued
Glencore Preliminary Results 2021 14
a H1 high of $25.30/lb. Prices then cooled off somewhat before a strong recovery in H2 saw the year-end price at $33.50/lb. While the EV sector has been the main demand catalyst for cobalt, a number of metal demand segments exhibited post-Covid recovery.
The cobalt hydroxide supply bottlenecks witnessed during H2 2020 eased in early 2021, but stronger lithium-ion battery demand from both EV and non-EV applications (e.g. phones) resulted in hydroxide payables marking a high of 94% early in the year, with major producers having limited spot availability. Payables averaged 90% during H1 and remained within a stable band of c.88-90% for H2.
There is mounting EV investment and adoption. The Chinese and European EV sales markets have developed strongly, while the North American market is emerging as a major EV growth region with key manufacturers deploying tens of billions of dollars in investment. The diminishing cobalt per kWh requirement through R&D gains is being outstripped by the rate of EV sales growth, underpinning strong cobalt demand.
Various cobalt supply projects are due to commission over the coming years, however elevated execution risk is likely to temper the rate at which new cobalt units are available, while incumbent production may also be impacted by continued logistical challenges. As a result, the cobalt market fundamental outlook remains robust.
ZINC The zinc market recorded a deficit in 2021, driven by strong recovery in global demand (+6%), combined with production disruptions and supply chain bottlenecks. Zinc price, metal premiums, market backwardation, concentrates spot TCs and metal exchange inventory levels all signalled tight market conditions at year end.
Average zinc prices increased 33% from $2,265/t in 2020 to $3,005/t in 2021, closing the year above $3,600/t. Metal premiums were particularly strong outside China (Q4 2021: USA >$300/mt and EU c.$250/mt). At the same time, China required a significant amount of metal, with China’s State Reserves Bureau (SRB) releasing 180kt in 2021. At year-end, stocks remained at low levels, both in visible metal (~350kt or c.10 days of global consumption) and concentrates (only c.4 days above typical smelter requirements of 30 days).
Mine supply ex-China is estimated to have grown c.0.5mt - 0.6mt, missing higher predictions earlier in the year. The continuation in mine disruptions eroded concentrates spot TCs, which dropped by c. $100/dmt to $78/dmt on average in 2021.
The energy price environment in Europe, where c.2.3mt p.a. of zinc metal is produced (c.17% of global supply), poses risk of further metal production cutbacks in the region. Should these materialise, both zinc price and premiums could rise as there is no SRB parallel in the EU/US to ease the market.
Looking ahead into 2022, refined zinc consumption is expected to increase, albeit not matching the percentage increase in 2021. There are risks to demand, including any Chinese construction slowdown and/or power-related demand destruction in Europe, however, there is upside from the potential comeback of the automotive sector as semiconductor shortages recede. Bottlenecks in logistics are expected to continue in the short and medium-term, creating regional differences.
Regional differences and supply disruptions were also evident in the lead market. LME stocks reduced c.60% since December 2020 and the average price increased by 20% year-over-year to $2,204/t.
NICKEL Primary nickel consumption rebounded sharply in 2021 (+17.5%), driven by record levels of stainless steel production in China and Indonesia and accelerating growth in the battery sector. The nickel market was in a substantial deficit in H1 2021, which narrowed in H2 as Indonesian nickel production continued to ramp up. Nickel stocks in LME warehouses fell by 60% in 2021.
Stainless steel production in China, accounting for more than half of global primary demand, reached historic highs driven by strong global demand. Also, in a policy change aimed at reducing pollution and carbon emissions, the Chinese government eliminated tax incentives on stainless steel exports and initiated a tax removal on imports. The resulting increase in Indonesian production was particularly pronounced, while in other regions, stainless steel production also reached multi-year highs.
Nickel demand from alloys and specialty steels continued to gradually recover towards pre-pandemic levels. Despite signs of recovery, commercial aerospace remains challenged by travel restrictions and lack of forward visibility, further delaying the recovery in the superalloys segment.
EV sales grew strongly, despite a global slowdown in total automotive sales amid a shortage of parts and semiconductors. Automakers have broadly committed to electric mobility and are actively sourcing battery cells and raw materials. Stringent ESG requirements throughout the EV supply chain have resulted in a preference for high-grade nickel with a low carbon footprint.
FERROALLOYS Ferrochrome supply from South Africa, India and Europe recovered to pre-pandemic levels, resulting in global production growth of 15% year-on-year. This supply growth was met by a strong increase in global stainless steel melt rates, with Indonesian stainless steel production increasing by 87% year-on-year to 5mt, becoming the world’s second largest producer.
Vanadium demand recovered to pre-pandemic levels with stronger carbon steel markets absorbing excess inventory. The aerospace demand sector remained weak as previously noted.
ALUMINIUM The aluminium market continued its strong recovery from the initial Covid-19 shock, backed by strong fundamentals, including a supply deficit. The price environment was volatile, as a surge in demand during H1 2021 was followed by rising energy costs first in

MARKETING ACTIVITIES continued
Glencore Preliminary Results 2021 15
China (Q2-Q3 2021) and then Europe during Q4 2021. Chinese imports of primary aluminium reached record levels, leading to a price rise on the LME, peaking at a decade-high of $3,229/t in mid-October. Prices retreated after China’s timely and effective coal reform, with the rally resuming towards year-end, mainly due to the European power crisis and subsequent smelter shutdowns.
Supported by physical tightness, Chinese imports and high logistics costs, premiums across the Americas, Asia and Europe increased significantly during 2021. The Midwest premium rose to an all-time-high of 35.4c/lb, ending the year at 30c/lb, while the Main Japanese Port premium finished the year at $170/t, up from $125/t at the beginning of the year.
Alumina prices in H1 2021 underperformed aluminium prices, which supported smelting margins. A fire at the Jamalco refinery in August and Chinese energy and emission policies led to price increases during H2, with ex-China FOB Australia alumina prices increasing by c.60% in less than two months to peak at c.$480/t before closing the year at c.$345/t.
The global bauxite market continued to be well-supplied. The military coup in Guinea in September raised concerns around supply-side risks, but these had largely eased by the end of the year, given alternative sources of supply.
IRON ORE Iron ore prices were extremely volatile throughout the year, driven by shifting policy initiatives and supply/demand rebalancing. Global resumption of construction activities and Chinese mills’ post winter restocking saw strong demand in H1 2021, supported by positive steel margins, with iron ore prices reaching 10-year highs in June. Chinese steel production cuts, instituted in large part, to achieve annual environmental goals, led to a demand decrease in H2 while seaborne supply improved. Iron ore quickly became over-supplied, resulting in a significant price correction.
COAL Strong demand driven by economic recovery and constrained supply chains beset by weather, geological and mining incidents resulted in a substantial draw on coal stocks and record high coal prices.
Global seaborne thermal coal demand rose by c.43mt (5%) during 2021. Chinese seaborne demand increased by 64mt with supply from Australia falling from 31mt to zero as Australian coal restrictions persisted. The bulk of the 95mt swing in trade flows to China was supplied by Indonesia (+71mt) and Russia (+15mt). High gas prices supported increased thermal coal demand in Europe (+11mt), Korea (+5mt) and Taiwan (+4mt).
2021 saw record high average thermal coal prices for GCNewc ($137) and API4 ($124). API2 averaged $120/t, marginally below 2011. Coal prices peaked during October which was also a high point for LNG, as consumers looked to restock ahead of the winter period. GCNewc, API4 and API2 monthly prices peaked at 258%, 232% and 341% respectively above January’s price levels, before closing the year at $170/t (198%), $136/t (150%) and $137/t (202%) respectively.
Although Chinese seaborne coking coal demand declined by 15mt during 2021, Japan, India, Europe and Brazil saw increased seaborne demand, as record global steel prices supported improved blast furnace capacity utilisation. Together with a number of temporary mine closures, the net overall increase in global seaborne coking coal demand, led spot HCC prices higher from $124/t during January to a peak of $398/t in October before moderating to close at $342/t in December, 175% above January price levels.
Forward gas prices are at relatively high levels, with thermal coal remaining the lowest cost baseload fuel for power generation in all major seaborne markets. Weather-related supply impacts in Australia during December 2021 resulted in production and export shortfalls, which together with Indonesia’s temporary ban on coal exports, substantially limited spot coal availability in early 2022.
OIL 2021 marked another year of elevated volatility as the recovery from Covid-19 drove strong underlying demand growth for oil and gas. Prices were further supported by favourable financial markets and fiscal conditions. Further outbreaks of Covid-19 related strains in Q3 (Delta) and in Q4 (Omicron) threatened the trajectory of oil demand recovery, however such concerns proved short-lived, with Brent closing the year at $78 per barrel. The rising oil price through the year also prompted some releases of strategic petroleum reserves, led by the USA. This was absorbed by the market and did little to halt the price trajectory.
In Q3, European and UK energy markets came under severe pressure due to a multitude of factors including low output from renewable energy sources during the summer and low-running gas inventories heading into winter. This was the catalyst for further disruption in global energy markets, with prices impacted throughout the energy chain. The European TTF natural gas benchmark price jumped more than 300% to over EUR100/MWh and shortages of natural gas, LNG and coal caused some utilities and major industrial users to switch to oil as a source of power.
The oil price forward curve structure remained in varying degrees of backwardation throughout the year. This steepened considerably during H2 as the energy crisis took hold and global inventories dropped below the closely tracked 5 year range levels.
Refining margins in all regions continued to improve during 2021, largely driven by the recovery in transportation fuel markets as mobility restrictions eased and refined product inventories needed to be restocked. Other factors were Hurricane Ida disrupting refining operations in the US, elevated natural gas input costs in H2 2021 and China curbing oil product exports as part of its reforms to reduce carbon emissions and protect domestic supplies.
In shipping, tanker freight markets remained depressed for most of the year. Whilst they lifted in Q4, particularly in the “clean” refined products segment, market expectations of a year-end upward momentum failed to materialise.

INDUSTRIAL ACTIVITIES
Glencore Preliminary Results 2021 16
HIGHLIGHTS Industrial Adjusted EBITDA increased by 118% to a record $17,100 million compared to the $7,828 million in 2020. The increase was primarily driven by higher commodity prices, offset by higher costs (mainly energy) and the effects of a weaker US dollar (on average) against many of our key producer country currencies.
Adjusted EBITDA contribution from Metals and minerals assets was $12,017 million, up 65% compared to the prior year, with substantial improvements across most operations, owing to higher average commodity prices over the year. Noteworthy were the increased contributions from the African copper assets (up $1,462 million), aided by higher cobalt production, Collahuasi (up $832 million) and the Ferroalloys assets (total contribution of $809 million, up 508% over prior year) owing to higher prices and recovery of production, following South Africa’s national Covid lockdown in 2020.
The Mount Isa copper mine, smelter and Townsville copper refinery were transferred for management purposes from the Copper department to the Zinc department, to be managed as an overall Mount Isa polymetallic integrated complex.
Adjusted EBITDA contribution from Energy products assets was $5,603 million, up 439% compared to 2020, mainly due to the significant increase in average realised export thermal and coking coal prices year over year and to a lesser extent, higher oil and gas prices.
Reflecting the above, Adjusted EBITDA mining margins were 45% (2020: 36%) in our metals operations and 47% (2020: 17%) in our energy operations.
Capex of $4,423 million (2020: $4,082 million) was 8% higher year over year reflecting a normalisation of sustaining activities, following delays/deferrals in the prior year, brought on by many severe pandemic-related restrictions.
US$ million Metals and
minerals Energy
products Corporate and other 2021
Metals and minerals
Energy products
Corporate and other 2020
Revenue◊ 41,535 19,269 6 60,810 30,303 11,145 5 41,453 Adjusted EBITDA◊ 12,017 5,603 (520) 17,100 7,285 1,039 (496) 7,828 Adjusted EBIT◊ 8,128 3,252 (580) 10,800 3,054 (1,365) (612) 1,077 Adjusted EBITDA mining margin 45% 47% 44% 36% 17% 29%
Production from own sources – Total1
2021 2020 Change
% Copper kt 1,195.7 1,258.1 (5) Cobalt kt 31.3 27.4 14 Zinc kt 1,117.8 1,170.4 (4) Lead kt 222.3 259.4 (14) Nickel kt 102.3 110.2 (7) Gold koz 809 916 (12) Silver koz 31,519 32,766 (4) Ferrochrome kt 1,468 1,029 43 Coal - coking mt 9.1 7.6 20 Coal - semi-soft mt 4.5 4.6 (2) Coal - thermal mt 89.7 94.0 (5) Coal mt 103.3 106.2 (3) Oil (entitlement interest basis) kboe 5,274 3,944 34 1 Controlled industrial assets and joint ventures only. Production is on a 100% basis, except for joint ventures, where the Group’s attributable share of production is included.

INDUSTRIAL ACTIVITIES continued
Glencore Preliminary Results 2021 17
FINANCIAL INFORMATION
US$ million 2021 2020 Change % Revenue◊ Copper assets Africa (Katanga, Mutanda, Mopani) 4,256 3,105 37 Collahuasi1 2,599 1,732 50 Antamina1 1,791 1,055 70 Other South America (Antapaccay, Lomas Bayas) 2,494 2,025 23 Australia (Ernest Henry, Cobar)2 889 714 25 Custom metallurgical (Altonorte, Pasar, Horne, CCR) 10,186 7,842 30 Intergroup revenue elimination (249) (308) n.m. Copper 21,966 16,165 36 Zinc assets Kazzinc 3,501 3,031 16 Australia (Mount Isa, Townsville, McArthur River)2 4,246 2,493 70 European custom metallurgical (Portovesme, San Juan de Nieva, Nordenham, Northfleet) 4,035 2,883 40 North America (Matagami, Kidd, CEZ Refinery) 1,964 1,746 12 Other Zinc (Argentina, Bolivia, Peru) 524 317 65 Intergroup revenue elimination (10) – n.m. Zinc 14,260 10,470 36 Nickel assets Integrated Nickel Operations (Sudbury, Raglan, Nikkelverk) 1,811 1,461 24 Australia (Murrin Murrin) 763 646 18 Koniambo 242 239 1 Nickel 2,816 2,346 20 Ferroalloys 2,493 1,321 89 Aluminium/Alumina – 1 (100) Metals and minerals revenue 41,535 30,303 37 Coking Australia 1,975 971 103 Thermal Australia 6,976 4,031 73 Thermal South Africa 1,488 969 54 Prodeco – 357 (100) Cerrejón1 772 208 271 Coal revenue (own production) 11,211 6,536 72 Coal other revenue (buy-in coal) 865 400 116 Oil E&P assets 294 111 165 Oil refining assets 6,899 4,098 68 Energy products revenue◊ 19,269 11,145 73 Corporate and other revenue 6 5 20 Total Industrial Activities revenue◊ 60,810 41,453 47
1 Represents the Group’s share of these JVs. 2 Mount Isa copper operations (including Townsville) previously recorded under copper department moved to zinc department. Prior year was restated accordingly.

INDUSTRIAL ACTIVITIES continued
Glencore Preliminary Results 2021 18
Adjusted EBITDA◊ Adjusted EBIT◊ US$ million 2021 2020 Change % 2021 2020 Change % Copper assets Africa 2,174 712 205 1,670 148 n.m. Collahuasi1 2,133 1,301 64 1,846 1,011 83 Antamina1 1,416 755 88 1,105 472 134 Other South America 1,400 1,042 34 885 518 71 Australia2 477 317 50 352 175 101 Polymet (13) (20) n.m. (13) (20) n.m. Custom metallurgical 325 336 (3) 166 162 2 Copper 7,912 4,443 78 6,011 2,466 144 Adjusted EBITDA mining margin3◊ 63% 48% Zinc assets Kazzinc 1,103 1,228 (10) 666 824 (19) Australia2 946 452 109 380 (159) n.m European custom metallurgical 71 327 (78) (61) 181 n.m North America 281 240 17 152 74 105 Volcan 9 (33) n.m 9 (33) n.m Other Zinc 111 (21) n.m 9 (292) n.m Zinc 2,521 2,193 15 1,155 595 94 Adjusted EBITDA mining margin3◊ 26% 28% Nickel assets Integrated Nickel Operations 836 670 25 440 235 87 Australia 196 117 68 167 92 82 Koniambo (164) (196) n.m. (245) (298) n.m. Nickel 868 591 47 362 29 n.m. Adjusted EBITDA mining margin◊ 31% 25% Adjusted EBITDA mining margin excl. Koniambo◊ 40% 37% Ferroalloys 809 133 508 694 39 n.m. Aluminium/Alumina (91) (73) – (92) (73) n.m. Iron ore (2) (2) n.m. (2) (2) n.m. Metals and minerals Adjusted EBITDA/EBIT◊ 12,017 7,285 65 8,128 3,054 166 Adjusted EBITDA mining margin3◊ 45% 36% Coking Australia 959 244 293 730 (1) n.m Thermal Australia 3,270 799 309 1,872 (528) n.m Thermal South Africa 563 183 208 125 (164) n.m Prodeco (18) (72) n.m. (29) (133) n.m Cerrejón1 452 5 n.m. 363 (105) n.m Coal 5,226 1,159 351 3,061 (931) (429) Adjusted EBITDA margin4◊ 47% 18% Oil E&P assets 229 (15) n.m. 119 (187) n.m. Oil refining assets 148 (105) n.m. 72 (247) n.m. Energy products Adjusted EBITDA/EBIT◊ 5,603 1,039 439 3,252 (1,365) n.m. Adjusted EBITDA margin4◊ 47% 17% Corporate and other (520) (496) n.m. (580) (612) n.m. Industrial activities Adjusted EBITDA/EBIT◊ 17,100 7,828 118 10,800 1,077 903 Adjusted EBITDA margin◊ 44% 29%
1 Represents the Group’s share of these JVs. 2. Mount Isa copper operations (including Townsville) previously recorded under copper department moved to zinc department. Prior year was restated accordingly. 3 Adjusted EBITDA mining margin for Metals and Minerals is Adjusted EBITDA excluding non-mining assets as described below ($11,422 million (2020: $6,448 million)) divided by
Revenue excluding non-mining assets and intergroup revenue elimination ($ 25,609 million (2020: $18,139 million) i.e. the weighted average EBITDA margin of the mining assets. Non-mining assets are the Copper custom metallurgical assets, Zinc European custom metallurgical assets, Zinc North America (principally smelting/ processing), the Aluminium/Alumina group and Volcan (equity accounted with no relevant revenue) as noted in the table above.
4 Energy products EBITDA margin is Adjusted EBITDA for coal and Oil E&P (but excluding Oil refining) ($5,455 million (2020: $1,144 million)), divided by the sum of coal revenue from own production and Oil E&P revenue ($11,504 million (2020: $6,647 million)).

INDUSTRIAL ACTIVITIES continued
Glencore Preliminary Results 2021 19
2021 2020 US$ million Sustaining Expansion Total Sustaining Expansion Total Capital expenditure◊ Copper assets Africa 258 42 300 220 196 416 Collahuasi1 292 95 387 287 44 331 Antamina1 287 9 296 180 10 190 Other South America 658 26 684 309 12 321 Australia2 81 – 81 87 – 87 Polymet 7 – 7 8 – 8 Custom metallurgical 164 – 164 144 – 144 Copper 1,747 172 1,919 1,235 262 1,497 Zinc assets Kazzinc 252 90 342 201 193 394 Australia2 281 2 283 294 – 294 European custom metallurgical 89 87 176 80 25 105 North America 33 2 35 52 – 52 Other Zinc 48 – 48 47 – 47 Zinc 703 181 884 674 218 892 Nickel assets Integrated Nickel Operations 258 312 570 142 306 448 Australia 51 – 51 33 – 33 Koniambo 16 – 16 38 – 38 Nickel 325 312 637 213 306 519 Ferroalloys 104 24 128 87 28 115 Aluminium/Alumina 5 – 5 – – – Metals and minerals capital expenditure◊ 2,884 689 3,573 2,209 814 3,023 Australia (thermal and coking) 411 154 565 394 152 546 Thermal South Africa 126 3 129 147 28 175 Prodeco – – – 44 – 44 Cerrejón1 30 – 30 22 – 22 Total Coal 567 157 724 607 180 787 Oil E&P assets 35 – 35 119 – 119 Oil refining assets 60 – 60 125 – 125 Energy products capital expenditure◊ 662 157 819 851 180 1,031 Corporate and other – 31 31 – 28 28 Industrial activities capital expenditure◊ 3,546 877 4,423 3,060 1,022 4,082
1 Represents the Group’s share of these JVs. 2 Mount Isa copper operations (including Townsville) previously recorded under copper department moved to zinc department. Prior year was restated accordingly.

INDUSTRIAL ACTIVITIES continued
Glencore Preliminary Results 2021 20
PRODUCTION DATA
Production from own sources – Copper assets1
2021 2020 Change
% African Copper (Katanga, Mutanda, Mopani) Copper metal kt 277.2 301.0 (8) Cobalt2 kt 27.7 23.9 16 Collahuasi3 Copper in concentrates kt 277.2 276.8 – Silver in concentrates koz 4,219 3,961 7 Gold in concentrates koz 45 53 (15) Antamina4 Copper in concentrates kt 150.0 127.7 17 Zinc in concentrates kt 153.7 142.4 8 Silver in concentrates koz 6,135 5,535 11 Other South America (Antapaccay, Lomas Bayas) Copper metal kt 64.3 74.1 (13) Copper in concentrates kt 170.8 185.6 (8) Gold in concentrates and in doré koz 90 90 – Silver in concentrates and in doré koz 1,382 1,298 6 Australia (Ernest Henry, Cobar)5 Copper metal kt 44.8 49.2 (9) Copper in concentrates kt 40.5 46.2 (12) Gold koz 64 93 (31) Silver koz 654 714 (8) Total Copper department Copper kt 1,024.8 1,060.6 (3) Cobalt kt 27.7 23.9 16 Zinc kt 153.7 142.4 8 Gold koz 199 236 (16) Silver koz 12,390 11,508 8
Production from own sources – Zinc assets1
2021 2020 Change
% Kazzinc Zinc metal kt 147.9 167.5 (12) Lead metal kt 19.8 25.6 (23) Copper metal6 kt 25.6 37.0 (31) Gold koz 595 659 (10) Silver koz 2,921 4,712 (38) Australia (Mount Isa, Townsville, McArthur River)5 Zinc in concentrates kt 609.4 633.5 (4) Copper metal kt 91.5 89.6 2 Lead in concentrates kt 188.1 216.8 (13) Silver koz 625 557 12 Silver in concentrates koz 6,521 7,404 (12) North America (Matagami, Kidd) Zinc in concentrates kt 96.1 114.7 (16) Copper in concentrates kt 30.3 40.7 (26) Silver in concentrates koz 1,383 2,125 (35) Other Zinc: South America (Argentina, Bolivia, Peru)7 Zinc in concentrates kt 110.7 112.3 (1) Lead in concentrates kt 14.4 17.0 (15) Copper in concentrates kt 1.7 1.6 6 Silver in concentrates koz 7,383 6,121 21 Total Zinc department Zinc kt 964.1 1,028.0 (6) Lead kt 222.3 259.4 (14) Copper kt 149.1 168.9 (12) Gold koz 595 659 (10) Silver koz 18,833 20,919 (10)

INDUSTRIAL ACTIVITIES continued
Glencore Preliminary Results 2021 21
Production from own sources – Nickel assets1
2021 2020 Change
% Integrated Nickel Operations (INO) (Sudbury, Raglan, Nikkelverk) Nickel metal kt 55.0 56.5 (3) Nickel in concentrates kt 0.2 0.4 (50) Copper metal kt 13.5 13.5 – Copper in concentrates kt 8.3 15.1 (45) Cobalt metal kt 1.1 0.6 83 Gold koz 15 21 (29) Silver koz 296 339 (13) Platinum koz 33 40 (18) Palladium koz 83 101 (18) Rhodium koz 4 4 – Murrin Murrin Nickel metal kt 30.1 36.4 (17) Cobalt metal kt 2.5 2.9 (14) Koniambo Nickel in ferronickel kt 17.0 16.9 1 Total Nickel department Nickel kt 102.3 110.2 (7) Copper kt 21.8 28.6 (24) Cobalt kt 3.6 3.5 3 Gold koz 15 21 (29) Silver koz 296 339 (13) Platinum koz 33 40 (18) Palladium koz 83 101 (18) Rhodium koz 4 4 –
Production from own sources – Ferroalloys assets1
2021 2020 Change
% Ferrochrome8 kt 1,468 1,029 43 Vanadium Pentoxide mlb 20.5 19.5 5
Total production – Custom metallurgical assets1
2021 2020 Change
% Copper (Altonorte, Pasar, Horne, CCR) Copper metal kt 490.6 482.6 2 Copper anode kt 454.0 490.1 (7) Zinc (Portovesme, San Juan de Nieva, Nordenham, Northfleet) Zinc metal kt 800.6 787.2 2 Lead metal kt 244.9 198.0 24
Coal assets1
2021 2020 Change % Australian coking coal mt 9.1 7.6 20 Australian semi-soft coal mt 4.5 4.6 (2) Australian thermal coal (export) mt 55.9 55.7 – Australian thermal coal (domestic) mt 6.0 6.4 (6) South African thermal coal (export) mt 14.7 14.8 (1) South African thermal coal (domestic) mt 5.3 9.2 (42) Cerrejón9 mt 7.8 4.1 90 Prodeco mt – 3.8 (100) Total Coal department mt 103.3 106.2 (3)

INDUSTRIAL ACTIVITIES continued
Glencore Preliminary Results 2021 22
Oil assets
2021 2020 Change % Glencore entitlement interest basis Equatorial Guinea kboe 4,141 1,960 111 Chad kbbl – 1,112 (100) Cameroon kbbl 1,133 872 30 Total Oil department kboe 5,274 3,944 34 Gross basis Equatorial Guinea kboe 20,137 10,435 93 Chad kbbl – 1,521 (100) Cameroon kbbl 2,866 2,528 13 Total Oil department kboe 23,003 14,484 59
1 Controlled industrial assets and joint ventures only. Production is on a 100% basis, except for joint ventures, where the Group’s attributable share of production is included. 2 Cobalt contained in concentrates and hydroxides. 3 The Group’s pro-rata share of Collahuasi production (44%). 4 The Group’s pro-rata share of Antamina production (33.75%). 5 Mount Isa copper operations (including Townsville) previously recorded under copper department moved to zinc department. 6 Copper metal includes copper contained in copper concentrates and blister. 7 South American production excludes Volcan Compania Minera. 8 The Group’s attributable 79.5% share of the Glencore-Merafe Chrome Venture. 9 The Group’s pro-rata share of Cerrejón production (33.3%).
OPERATING HIGHLIGHTS Copper assets Own sourced copper production of 1,195,700 tonnes was 62,400 tonnes (5%) lower than 2020, mainly due to the Mopani disposal (23,800 tonnes), expected lower copper grades at Antapaccay (14,800 tonnes) and lower copper by-products from our mature zinc and nickel mines (26,600 tonnes).
Own sourced cobalt production of 31,300 tonnes was 3,900 tonnes (14%) higher than 2020 due to the limited restart of production at Mutanda in 2021.
African Copper Own sourced copper production of 277,200 tonnes was 23,800 tonnes (8%) lower than 2020, mainly reflecting the disposal of Mopani. The contribution from Mutanda’s limited restart was largely offset by the impact of intermittent power outages at Katanga.
Own sourced cobalt production of 27,700 tonnes was 3,800 tonnes (16%) higher than 2020, reflecting Mutanda’s restart.
Collahuasi Attributable copper production of 277,200 tonnes was in line with 2020.
Antamina Attributable copper production of 150,000 tonnes and zinc production of 153,700 tonnes was respectively 22,300 tonnes (17%) and 11,300 tonnes (8%) higher than 2020 reflecting Covid-relating mining suspensions in the base period.
Other South America
Own sourced copper production of 235,200 tonnes was 24,600 tonnes (9%) lower than 2020, reflecting expected lower copper grades at Antapaccay and temporarily reduced production at Lomas Bayas due to short-term leach pad issues, now rectified..
Australia Own sourced copper production of 85,300 tonnes was 10,100 tonnes (11%) lower than 2020 due to expected changes in mine sequencing at Ernest Henry and additional mine development at Cobar.
Custom metallurgical assets Copper cathode production of 490,600 tonnes was in line with 2020.
Copper anode production of 454,000 tonnes was 36,100 tonnes (7%) lower than 2020, mainly reflecting scheduled maintenance at Altonorte in July 2021.

INDUSTRIAL ACTIVITIES continued
Glencore Preliminary Results 2021 23
Zinc assets Own sourced zinc production of 1,117,800 tonnes was 52,600 tonnes (4%) lower than 2020, mainly reflecting: (i) the expected decline of Maleevsky mine in Kazakhstan, being lagged by the slower than expected ramp-up of replacement Zhairem mine tonnage (19,600 tonnes); (ii) Mount Isa producing additional metal from ore stockpile drawdowns in the base period (24,400 tonnes); and (iii) Kidd lower grades (13,800 tonnes). These factors were partly offset by stronger zinc production at Antamina, which was suspended for part of 2020 due to Covid restrictions.
Kazzinc Own sourced zinc production of 147,900 tonnes was 19,600 tonnes (12%) lower than 2020, reflecting expected lower grades from Maleevsky mine (also affecting lead and copper noted below).
Own sourced lead production of 19,800 tonnes was 5,800 tonnes (23%) lower than 2020, and own sourced copper production of 25,600 tonnes was 11,400 tonnes (31%) down, also due to Maleevsky’s progressive depletion.
Own sourced gold production of 595,000 ounces was 64,000 ounces (10%) lower than the comparable 2020 period, mainly reflecting expected lower grades at Vasilkovsky.
The new Zhairem zinc/lead mine was commissioned in May 2021, with ramp up through 2022 and steady-state annualised production expected by 2023.
Australia Zinc production of 609,400 tonnes was 24,100 tonnes (4%) lower than 2020, mainly reflecting Mount Isa processing additional metal from ore stockpile drawdowns in 2020.
Lead production of 188,100 tonnes was 28,700 tonnes (13%) down on 2020 reflecting lower Mount Isa grades.
The Mount Isa copper operations are now reported within the Zinc business unit. Own sourced copper production of 91,500 tonnes was broadly in line with 2020, noting that this figure excludes units from the held-for-sale Ernest Henry mine.
North America Zinc production of 96,100 tonnes was 18,600 tonnes (16%) lower than 2020, reflecting the reducing production profile of both assets as they approach end of mine life.
South America Zinc production of 110,700 tonnes was 1,600 tonnes below 2020 mainly reflecting the planned cessation of mining at Aguilar (Argentina) and Iscaycruz (Peru), partly offset by higher production in Bolivia following Covid-related suspensions in 2020.
European custom metallurgical assets Zinc metal production of 800,600 tonnes was modestly higher than 2020.
Lead metal production of 244,900 tonnes was 46,900 tonnes (24%) higher than 2020, mainly reflecting the contribution of the Nordenham Metall lead smelter that was acquired in September 2021 (38,200 tonnes).
Nickel assets Nickel production of 102,300 tonnes was 7,900 tonnes (7%) lower than in 2020, mainly due to the lengthy scheduled statutory shutdown and maintenance issues at Murrin Murrin earlier in the year.
Integrated Nickel Operations (INO) Own sourced nickel production of 55,200 tonnes was 1,700 tonnes (3%) below 2020.
Murrin Murrin Own sourced nickel production of 30,100 tonnes was 6,300 tonnes (17%) below 2020, reflecting the lengthy scheduled statutory shutdown in May/June and various maintenance issues earlier in the year.
Koniambo Nickel production of 17,000 tonnes was In line with 2020 production, following a much improved Q4 2021 performance.
Ferroalloys assets Attributable ferrochrome production of 1,468,000 tonnes was 439,000 tonnes (43%) higher than 2020 mainly due to the South African national lockdown in the prior year, and a strong operating performance.
Coal assets Coal production of 103.3 million tonnes was 2.9 million tonnes (3%) lower than 2020, reflecting Prodeco’s care and maintenance status and lower domestic power demand / export rail capacity constraints in South Africa, offset by higher production at Cerrejón, following a Covid suspension and strike in 2020.
Australian coking Production of 9.1 million tonnes was 1.5 million tonnes (20%) higher than 2020 reflecting additional coking-quality production from the Collinsville mine, and various planned maintenance activities in 2020.
Australian thermal and semi-soft Production of 66.4 million tonnes was broadly in line with 2020.

INDUSTRIAL ACTIVITIES continued
Glencore Preliminary Results 2021 24
South African thermal Production of 20.0 million tonnes was 4.0 million tonnes (17%) under 2020, reflecting lower domestic power demand and export rail capacity constraints.
Cerrejón Attributable production of 7.8 million tonnes was 3.7 million tonnes (90%) higher than 2020, reflecting the base period being disrupted by both a Covid-related temporary suspension and strike action.
Oil assets Exploration and production Entitlement interest production of 5.3 million boe was 1.3 million boe (34%) higher than 2020 mainly due to commencement of the gas phase of the Alen project in Equatorial Guinea. There was no production from the Chad fields in 2021.

CONSOLIDATED STATEMENT OF INCOME FOR THE YEAR ENDED 31 DECEMBER 2021
Glencore Preliminary Results 2021 25
US$ million Notes 2021 2020 Revenue 3 203,751 142,338 Cost of goods sold (191,370) (138,640) Selling and administrative expenses (2,115) (1,681) Share of income from associates and joint ventures 11 2,618 444 Loss on disposals of non-current assets 4 (607) (36) Other income 5 186 438 Other expense 5 (2,133) (611) Impairments of non-current assets 7 (1,905) (5,715) Reversal of impairments/(impairments) of financial assets 7 67 (232) Dividend income 11 23 32 Interest income 6 208 120 Interest expense 6 (1,348) (1,573) Income/(loss) before income taxes 7,375 (5,116) Income tax (expense)/credit 8 (3,026) 1,170 Income/(loss) for the year 4,349 (3,946) Attributable to: Non-controlling interests (625) (2,043) Equity holders of the Parent 4,974 (1,903) Earnings/(loss) per share: Basic (US$) 18 0.38 (0.14) Diluted (US$) 18 0.37 (0.14)
The accompanying notes are an integral part of the consolidated financial statements.
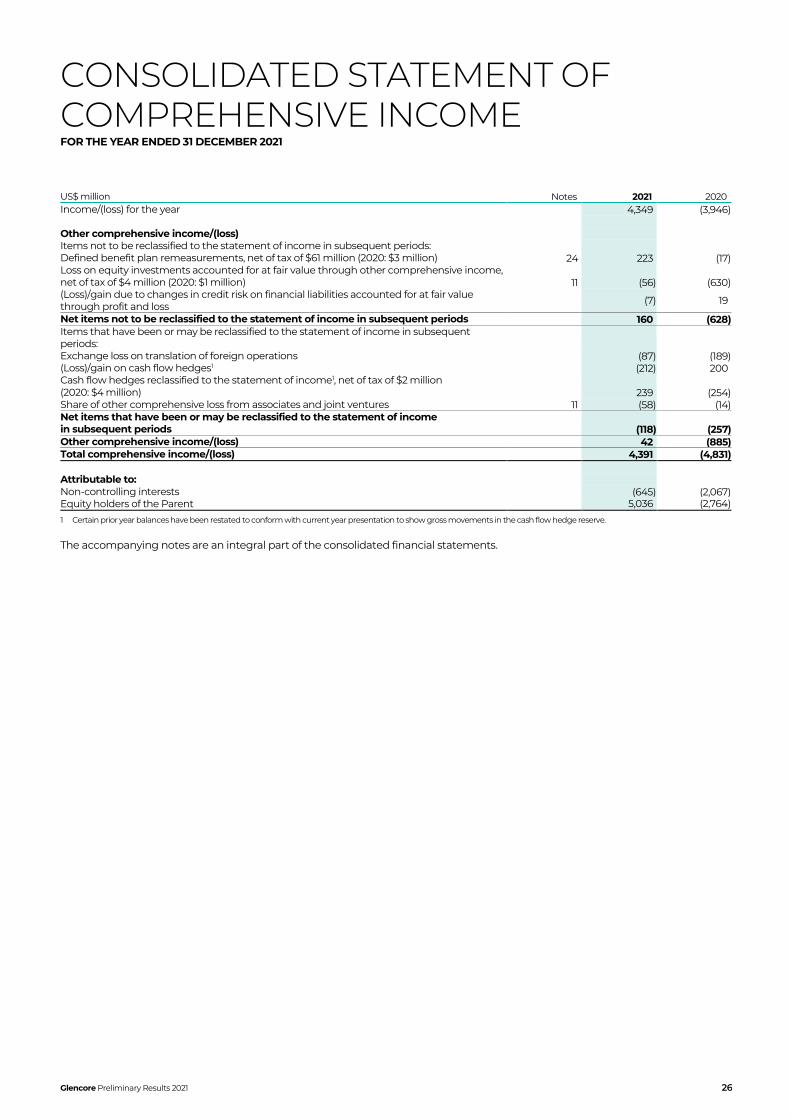
CONSOLIDATED STATEMENT OF COMPREHENSIVE INCOME FOR THE YEAR ENDED 31 DECEMBER 2021
Glencore Preliminary Results 2021 26
US$ million Notes 2021 2020 Income/(loss) for the year 4,349 (3,946) Other comprehensive income/(loss) Items not to be reclassified to the statement of income in subsequent periods: Defined benefit plan remeasurements, net of tax of $61 million (2020: $3 million) 24 223 (17) Loss on equity investments accounted for at fair value through other comprehensive income, net of tax of $4 million (2020: $1 million) 11 (56) (630) (Loss)/gain due to changes in credit risk on financial liabilities accounted for at fair value through profit and loss (7) 19
Net items not to be reclassified to the statement of income in subsequent periods 160 (628) Items that have been or may be reclassified to the statement of income in subsequent periods: Exchange loss on translation of foreign operations (87) (189) (Loss)/gain on cash flow hedges1 (212) 200 Cash flow hedges reclassified to the statement of income1, net of tax of $2 million (2020: $4 million) 239 (254) Share of other comprehensive loss from associates and joint ventures 11 (58) (14) Net items that have been or may be reclassified to the statement of income in subsequent periods (118) (257) Other comprehensive income/(loss) 42 (885) Total comprehensive income/(loss) 4,391 (4,831) Attributable to: Non-controlling interests (645) (2,067) Equity holders of the Parent 5,036 (2,764)
1 Certain prior year balances have been restated to conform with current year presentation to show gross movements in the cash flow hedge reserve.
The accompanying notes are an integral part of the consolidated financial statements.

CONSOLIDATED STATEMENT OF FINANCIAL POSITION AS AT 31 DECEMBER 2021
Glencore Preliminary Results 2021 27
US$ million Notes 2021 2020 Assets Non-current assets Property, plant and equipment 9 43,159 47,110 Intangible assets 10 6,235 6,467 Investments in associates and joint ventures 11 12,294 12,400 Other investments 11 1,620 1,733 Advances and loans 12 3,527 3,042 Other financial assets 28 458 1,106 Inventories 13 662 678 Deferred tax assets 8 1,779 2,252 69,734 74,788 Current assets Inventories 13 28,434 22,852 Accounts receivable 14 19,493 15,154 Other financial assets 28 4,636 1,998 Income tax receivable 8 364 444 Prepaid expenses 287 220 Cash and cash equivalents 15 3,241 1,498 56,455 42,166 Assets held for sale 16 1,321 1,046 57,776 43,212 Total assets 127,510 118,000 Equity and liabilities Capital and reserves – attributable to equity holders Share capital 17 146 146 Reserves and retained earnings 17 39,785 37,491 39,931 37,637 Non-controlling interests 34 (3,014) (3,235) Total equity 36,917 34,402 Non-current liabilities Borrowings 21 26,811 29,227 Deferred income 22 2,088 2,590 Deferred tax liabilities 8 4,469 4,721 Other financial liabilities 28 710 688 Provisions1 23 6,117 5,770 Post-retirement and other employee benefits1 24 939 1,161 41,134 44,157 Current liabilities Borrowings 21 7,830 8,252 Accounts payable 25 29,313 24,038 Deferred income 22 1,573 1,070 Provisions 23 2,093 693 Other financial liabilities 28 6,077 4,276 Income tax payable 8 1,785 927 48,671 39,256 Liabilities held for sale 16 788 185 49,459 39,441 Total equity and liabilities 127,510 118,000
1 In the current year, post-retirement and other employee benefits have been disaggregated from provisions. The prior year balances have been restated to conform with current year presentation.
The accompanying notes are an integral part of the consolidated financial statements.

CONSOLIDATED STATEMENT OF CASH FLOWS FOR THE YEAR ENDED 31 DECEMBER 2021
Glencore Preliminary Results 2021 28
US$ million Notes 2021 2020 Operating activities Income/(loss) before income taxes 7,375 (5,116) Adjustments for: Depreciation and amortisation 6,335 6,671 Share of income from associates and joint ventures 11 (2,618) (444) Streaming revenue and other non-current provisions (280) (205) Loss on disposals of non-current assets 4 607 36 Unrealised mark-to-market movements on other investments2 5 (64) (438) Impairments 7 1,838 5,947 Other non-cash items – net1,2 2,392 664 Interest expense – net 6 1,140 1,453 Cash generated by operating activities before working capital changes, interest and tax 16,725 8,568 Working capital changes Increase in accounts receivable3 (5,888) (385) Increase in inventories (5,660) (3,189) Increase/(decrease) in accounts payable4 6,423 (436) Total working capital changes (5,125) (4,010) Income taxes paid (1,837) (820) Interest received 100 100 Interest paid (1,003) (1,174) Net cash generated by operating activities 8,860 2,664 Investing activities Net cash received from/(used in) disposal of subsidiaries 26 252 (222) Purchase of investments (86) (122) Proceeds from sale of investments 194 135 Purchase of property, plant and equipment (3,618) (3,569) Proceeds from sale of property, plant and equipment 342 52 Dividends received from associates and joint ventures 11 2,375 1,015 Net cash used by investing activities (541) (2,711)
1 See reconciliation below. 2 Prior year balances relating to mark-to-market movements on other investments of $379 million previously included in ‘other non-cash items’ have been reclassified to unrealised
mark-to-market movements on other investments. 3 Includes movements in other financial assets, prepaid expenses and long-term advances and loans. 4 Includes movements in other financial liabilities, provisions and deferred income.
Other non-cash items comprise the following:
US$ million Notes 2021 2020 Net foreign exchange losses 5 187 192 Closed site rehabilitation costs 5 177 80 Closure and severance costs 5 – 183 Share based and deferred remuneration costs 20 476 207 Legal and regulatory proceedings 5/23 1,556 – Other (4) 2 Total 2,392 664
The accompanying notes are an integral part of the consolidated financial statements.

CONSOLIDATED STATEMENT OF CASH FLOWS FOR THE YEAR ENDED 31 DECEMBER 2021
Glencore Preliminary Results 2021 29
US$ million Notes 2021 2020 Financing activities1 Proceeds from issuance of capital market notes2 4,877 3,362 Repayment of capital market notes (2,807) (4,017) Repurchase of capital market notes (125) (72) Repayment of revolving credit facility (2,244) (870) Proceeds from other non-current borrowings 231 392 Repayment of other non-current borrowings (493) (44) Repayment of lease liabilities (634) (560) Margin (payments)/receipts in respect of financing related hedging activities (970) 1,040 (Repayment of)/proceeds from current borrowings (2,016) 217 Proceeds from U.S. commercial papers 675 415 Proceeds received on acquisition of non-controlling interests in subsidiaries 55 – Payments on acquisition of non-controlling interests in subsidiaries (45) (56) Return of capital/distributions to non-controlling interests (163) (127) Purchase of own shares 17 (746) – Distributions paid to equity holders of the Parent 19 (2,115) – Net cash used by financing activities (6,520) (320) Increase/(decrease) in cash and cash equivalents 1,799 (367) Effect of foreign exchange rate changes 11 (36) Cash and cash equivalents, beginning of year 1,498 1,901 Cash and cash equivalents, end of year 3,308 1,498 Cash and cash equivalents reported in the statement of financial position 3,241 1,498 Cash and cash equivalents attributable to assets held for sale 16 67 –
1 Refer to note 21 for reconciliation of movement in borrowings. 2 Net of issuance costs relating to capital market notes of $48 million (2020: $20 million).
The accompanying notes are an integral part of the consolidated financial statements.

CONSOLIDATED STATEMENT OF CHANGES OF EQUITY FOR THE YEAR ENDED 31 DECEMBER 2021
Glencore Preliminary Results 2021 30
Retained earnings
Share premium
Other reserves (Note 17)
Own shares
(Note 17)
Total reserves
and retained earnings
Share capital
Total equity attributable
to equity holders
Non-controlling
interests (Note 34)
Total equity
1 January 2020 4,742 45,794 (4,971) (5,437) 40,128 146 40,274 (1,038) 39,236 Loss for the year (1,903) – – – (1,903) – (1,903) (2,043) (3,946) Other comprehensive (loss)/income (32) – (829) – (861) – (861) (24) (885)
Total comprehensive loss (1,935) – (829) – (2,764) – (2,764) (2,067) (4,831) Own share disposal1 (32) – – 133 101 – 101 – 101 Equity-settled share-based expenses2 57 – – – 57 – 57 – 57 Change in ownership interest in subsidiaries3 – – (31) – (31) – (31) (3) (34) Reclassifications 17 – (17) – – – – – – Distributions paid5 – – – – – – – (127) (127) 31 December 2020 2,849 45,794 (5,848) (5,304) 37,491 146 37,637 (3,235) 34,402
Retained earnings
Share premium
Other reserves (Note 17)
Own shares
(Note 17)
Total reserves
and retained earnings
Share capital
Total equity attributable
to equity holders
Non-controlling
interests (Note 34)
Total equity
1 January 2021 2,849 45,794 (5,848) (5,304) 37,491 146 37,637 (3,235) 34,402 Income for the year 4,974 – – – 4,974 – 4,974 (625) 4,349 Other comprehensive income 164 – (102) – 62 – 62 (20) 42 Total comprehensive income 5,138 – (102) – 5,036 – 5,036 (645) 4,391 Own share disposal1 (78) – – 173 95 – 95 – 95 Own share purchases1 – – – (746) (746) – (746) – (746) Equity-settled share-based expenses2 30 – – – 30 – 30 – 30 Change in ownership interest in subsidiaries3 – – (6) – (6) – (6) 14 8 Acquisition/disposal of business4 – – – – – – – 1,017 1,017 Reclassifications (25) – 25 – – – – (2) (2) Distributions paid5 – (2,115) – – (2,115) – (2,115) (163) (2,278) 31 December 2021 7,914 43,679 (5,931) (5,877) 39,785 146 39,931 (3,014) 36,917
1 See note 17. 2 See note 20. 3 See note 34. 4 See note 26. 5 See note 19.
The accompanying notes are an integral part of the consolidated financial statements.

NOTES TO THE FINANCIAL STATEMENTS
Glencore Preliminary Results 2021 31
1. Accounting policies
CORPORATE INFORMATION Glencore plc (the “Company”, “Parent”, the “Group” or “Glencore”), is a leading integrated producer and marketer of natural resources, with worldwide activities in the production, refinement, processing, storage, transport and marketing of metals and minerals and energy products. Glencore operates on a global scale, marketing and distributing physical commodities sourced from third party producers and own production to industrial consumers, such as those in the battery, electronic, construction, automotive, steel, energy and oil industries. Glencore also provides financing, logistics and other services to producers and consumers of commodities. In this regard, Glencore seeks to capture value throughout the commodity supply chain. Glencore’s long experience as a commodity producer and merchant has allowed it to develop and build upon its expertise in the commodities which it markets and cultivate long-term relationships with a broad supplier and customer base across diverse industries and in multiple geographic regions.
Glencore is a publicly traded limited company incorporated in Jersey and domiciled in Switzerland, at Baarermattstrasse 3, 6340 Baar. Its ordinary shares are traded on the London and Johannesburg stock exchanges.
This preliminary announcement was authorised for issue in accordance with a Directors’ resolution on 14 February 2022.
The unaudited financial information for the year ended 31 December 2021 and audited financial information for the year ended 31 December 2020 contained in this document do not constitute statutory accounts as defined in Article 105 of Companies (Jersey) Law 1991. The financial information for the year ended 31 December 2021 will be included in the financial statements of Glencore which will be delivered to the Registrar in due course. The audit report for 31 December 2021 is yet to be signed by the auditor.
STATEMENT OF COMPLIANCE The financial information included in this preliminary announcement has been prepared in accordance with the recognition and measurement criteria of:
• International Financial Reporting Standards (IFRS) adopted by the United Kingdom; and
• IFRS as issued by the International Accounting Standards Board (IASB).
This announcement does not itself contain sufficient information to comply with those standards. The Company expects to publish full financial statements that comply with IFRS Standards in March 2022.
CLIMATE CHANGE RELATED CONSIDERATIONS The Group has committed to total emissions (Scope 1, 2 and 3) reductions, relative to 2019, of 15% by 2026 and 50% by 2035 and has an ambition to achieve net zero total emissions by 2050. The accounting related measurement and disclosure items that are most impacted by our commitments, and climate change risk more generally, relate to those areas of the financial statements that are prepared under the historical cost convention and are subject to estimation uncertainties in the medium to long term. Climate change impacts can also introduce more volatility in assets and liabilities carried at fair value. Future changes to the Group’s climate change strategy or realisation of global decarbonisation ambitions quicker than currently anticipated may impact some of the Group’s significant judgements and key estimates and result in material changes to financial results and the carrying values of certain assets and liabilities in future reporting periods. The Group’s current climate change strategy is reflected in the Group’s significant judgements and key estimates, and therefore the Financial Statements, as follows:
(i) Property, plant and equipment and Intangible assets – estimation of the remaining useful economic life of assets for depreciation and amortisation purposes Property, plant and equipment and intangible assets are depreciated / amortised to estimated residual values over the estimated useful lives of the specific assets concerned, or the estimated remaining life of the associated mine, field or lease, using a straight-line or a units of production over recoverable reserves method. The estimated useful lives of our specific assets and / or operations (and therefore the rate of depreciation / amortisation) aligns with our climate change commitments and ambition. Property, plant and equipment and intangible assets policies are further covered below and within impairment and impairment reversal estimation uncertainties, together with key estimates and sensitivities pertaining to a reasonably possible change in the realisation of global decarbonisation ambitions, which could also change the useful economic lives of the related assets.
(ii) Restoration, rehabilitation and decommissioning provisions – estimation of the timing of closure and rehabilitation activities A provision for future restoration, rehabilitation and decommissioning costs requires estimates and assumptions to be made around the relevant regulatory framework, the magnitude of the possible disturbance and the timing, extent and costs of the required closure and rehabilitation activities. Many of these rehabilitation and decommissioning events are expected to take place when the underlying commercial reserves are extracted and the operations move into closure mode. Our current estimates of the timing of these closure activities align with the trajectory of our climate change emission reduction commitments and ambition. Sensitivities pertaining to a reasonably possible change in the realisation of global decarbonisation ambitions (i.e. the timing of the restoration, rehabilitation and decommissioning costs) of our fossil fuel related obligations are outlined below in the key estimation uncertainty - restoration, rehabilitation and decommissioning costs.

NOTES TO THE FINANCIAL STATEMENTS continued
Glencore Preliminary Results 2021 32
1. Accounting policies continued
(iii) Property, plant and equipment and Intangible assets (including the carrying value of goodwill in our coal marketing CGU) – estimation of the valuation of assets and potential impairment charges or reversals The Group acknowledges that there is a wide range of possible energy transition scenarios, including those aligned with the Paris Agreement goals, that would indicate different outcomes for individual commodities. The decarbonisation transition could result in increasing or decreasing demand for the Group’s various commodities, due to policy, regulatory (including carbon pricing mechanisms), legal, technological, market or societal responses to climate change, which, on the negative side, may result in some or all of a cash-generating unit’s reserves becoming uneconomic to extract and / or our coal marketing CGU no-longer being able to generate returns and realise the benefits of its associated goodwill balance. While not currently the Group’s central planning case, the resilience of the Group’s portfolio to 1.5°C aligned and net zero ambition scenarios have been considered. We use carbon price scenarios to assess the potential impacts on commodity specific operating cost curves and related supply / demand outcomes, arising from existing and future potential carbon pricing regulation. A key component of this analysis is to understand the potential development of a range of underlying cost curve structures over time and to consider, identify and make reasonable judgments, on the extent to which costs are likely to be passed onto the end-consumer. Our analysis shows that in our Radical Transformation scenario, marginal supply costs would increase by 10% to over 60%, for the range of our most relevant and material commodities. Against a backdrop of generally healthy expected increasing metals demand to support decarbonisation, we anticipate that cost (via carbon) and demand forces (lower supply in the case of coal) will drive those commodity prices higher, such increases being passed through to consumers, resulting in no expected overall materially negative impacts on our business. In fact, first and second quartile (below average) emission intensity producers, where we see the weighted average of our portfolio residing, are likely to see margin expansion. Sensitivities pertaining to a reasonably possible change in the recoverable value of our assets are outlined below in the key estimation uncertainty – impairments and impairment reversals.
CRITICAL ACCOUNTING JUDGEMENTS AND KEY SOURCES OF ESTIMATION UNCERTAINTY The preparation of the consolidated financial statements requires management to make judgements, estimates and assumptions that affect the reported amounts of assets and liabilities as well as the disclosure of contingent assets and liabilities at the date of the financial statements and the reported amounts of revenues and expenses during the reporting period. Estimates and assumptions are continually evaluated and are based on historical experience and other factors, including expectations of future events that are believed to be reasonable and relevant under the circumstances, independent estimates, quoted market prices and common industry standard modelling techniques. Actual outcomes could result in a material adjustment to the carrying amount of assets or liabilities affected in future periods.
Glencore has identified the following areas as being critical to understanding Glencore’s financial position as they require management to make complex and/or subjective judgements, estimates and assumptions about matters that are inherently uncertain:
CRITICAL ACCOUNTING JUDGEMENTS In the process of applying Glencore’s accounting policies, management has made the following judgements based on the relevant facts and circumstances including macro-economic circumstances and, where applicable, interpretation of underlying agreements, which have the most significant effect on the amounts recognised in the consolidated financial statements.
(i) Determination of control of subsidiaries and joint arrangements Judgement is required to determine when Glencore has control of subsidiaries or joint control of joint or other unincorporated arrangements. This requires an assessment of the relevant activities (those relating to the operating and capital decisions of the arrangement, such as: the approval of the capital expenditure programme for each year, and appointing, remunerating and terminating the key management personnel or service providers of the operations) and when the decisions in relation to those activities are under the control of Glencore or require unanimous consent. See note 26 for a summary of the acquisitions of subsidiaries completed during 2021 and 2020 and the key judgements made in determining control thereof.
Judgement is also required in determining the classification of a joint arrangement between a joint venture or a joint operation through an evaluation of the rights and obligations arising from the arrangement and in particular, if the joint arrangement has been structured through a separate vehicle, further consideration is required of whether:
(1) the legal form of the separate vehicle gives the parties rights to the assets and obligations for the liabilities;
(2) the contractual terms and conditions give the parties rights to the assets and obligations for the liabilities; and
(3) other facts and circumstances give the parties rights to the assets and obligations for the liabilities.
Joint arrangements in which the primary activity is the provision of output to the shareholders, typically convey substantially all the economic benefits of the assets to the parties and judgement is required in assessing whether the terms of the offtake agreements and any other obligations for liabilities of the arrangement result in the parties being substantially the only source of cash flows contributing to the continuity of the operations of the arrangement.

NOTES TO THE FINANCIAL STATEMENTS continued
Glencore Preliminary Results 2021 33
1. Accounting policies continued
Certain joint arrangements that are structured through separate vehicles including Collahuasi and Viterra are accounted for as joint ventures. The Collahuasi arrangement is primarily designed for the provision of output to the shareholders sharing joint control, the offtake terms of which are at prevailing market prices and the parties are not obligated to cover any potential funding shortfalls. In management’s judgement, Glencore is not the only possible source of funding and does not have a direct or indirect obligation to the liabilities of the arrangement, but rather shares in its net assets and, therefore, such arrangements have been accounted for as joint ventures.
Differing conclusions around these judgements may materially impact how these businesses are presented in the consolidated financial statements – under the full consolidation method, equity method or recognition of Glencore’s share of assets, liabilities, revenue and expenses, including any assets or liabilities held jointly. See note 11 for a summary of these joint arrangements and the key judgements made in determining the applicable accounting treatment for any material joint arrangements entered during the year.
(ii) Classification of transactions which contain a financing element (notes 21, 22 and 25) Transactions for the purchase of commodities may contain a financing element such as extended payment terms. Under such an arrangement, a financial institution may issue a letter of credit on behalf of Glencore and act as the paying party upon delivery of product by the supplier and Glencore will subsequently settle the liability directly with the financial institution, generally from 30 up to 90 days after physical supply. Judgement is required to determine the most appropriate classification and presentation of these transactions within the statements of cash flows and financial position. In determining the appropriate classification, management considers the underlying economic substance of the transaction and the significance of the financing element to the transaction. Typically, the economic substance of the transaction is determined to be operating in nature as the financing element is insignificant and the time frame in which the original arrangement is extended by, is consistent and within supply terms commonly provided in the market. As a result, the entire cash flow is presented as operating in the statement of cash flows with a corresponding trade payable in the statement of financial position. As at 31 December 2021, trade payables include $8,565 million (2020: $7,178 million) of such liabilities arising from supplier financing arrangements, the weighted average of which extended settlement of the original payable to 77 days (2020: 91 days) after physical supply and are due for settlement 33 days (2020: 46 days) after year end. There was no significant exposure to any individual financial institution under these arrangements. These payables are not included within net funding and net debt as defined in the APMs section.
(iii) Classification of physical liquid natural gas (LNG) purchase and sale contracts at amortised cost or fair value through profit and loss (notes 28 and 29) Judgement is required to determine the appropriate IFRS 9 classification of physical LNG purchase and sale contracts as being measured at amortised cost or fair value through profit and loss. This requires an assessment of whether the contracts to buy or sell LNG (a non-financial item) can be settled net in cash or with another financial instrument, or by exchanging financial instruments, as if the contracts were financial instruments, and whether there is a past practise of net settling similar contracts. Those physical LNG contracts that can be net settled are considered to be derivatives, measured at fair value through profit or loss (see notes 28 and 29). Contracts that do not meet the definition of derivative are considered own use contacts and are to be accounted for as executory contracts measured at amortised cost.
Differing conclusions around classification of these contracts, may materially impact their presentation as financial assets or liabilities and any fair value adjustments recognised through profit and loss. As at 31 December 2021, the net fair value of physical LNG contracts on the statement of financial position is $912 million ($1,786 million forward physical asset and $874 million forward physical liability).
(iv) Investigations by regulatory and enforcement authorities – Critical judgement in relation to whether a present obligation exists (note 31) and key estimation uncertainty in relation to the measurement of the provision recognised for such investigations (note 23).
NOTES TO THE FINANCIAL STATEMENTS continued
Glencore Preliminary Results 2021 34
1. Accounting policies continued
KEY SOURCES OF ESTIMATION UNCERTAINTY In the process of applying Glencore’s accounting policies, management has made key estimates and assumptions concerning the future and other key sources of estimation uncertainty. The key assumptions and estimates at the reporting date that have a significant risk of resulting in a material adjustment to the carrying amount of assets and liabilities within the next financial year, are described below. Actual results may differ from these estimates under different assumptions and conditions and may materially affect financial results or the financial position reported in future periods.
(i) Recognition of deferred tax assets and uncertain tax positions (note 8) Deferred tax assets are recognised only to the extent it is considered probable that those assets will be recoverable. This involves an assessment of when those deferred tax assets are likely to reverse, and a judgement as to whether there will be sufficient taxable income available to offset the tax assets when they do reverse. These judgements and estimates are subject to risk and uncertainty and therefore, to the extent assumptions regarding future profitability change, there can be a material increase or decrease in the amounts recognised in the consolidated statement of income in the period in which the change occurs, notably the deferred tax asset and uncertain tax position of the Group’s DRC operations as outlined in note 8. The recoverability of the Group’s deferred tax assets and the completeness and accuracy of its uncertain tax positions, including the estimates and assumptions contained therein are reviewed regularly by management.
(ii) Impairments and impairment reversals (note 7) Investments in associates and joint ventures, advances and loans, property, plant and equipment and intangible assets are reviewed for impairment whenever events or changes in circumstances indicate that the carrying value of an individual asset or a cash-generating unit (CGU) may not be fully recoverable, or at least annually for CGUs to which goodwill and other indefinite life intangible assets have been allocated. Indicators of impairment may include changes in the Group’s operating and economic assumptions, including those arising from changes in reserves or mine planning, updates to the Group’s commodity supply, demand and price forecasts, or the possible impacts from emerging risks such as those related to climate change and the transition to a lower carbon economy. If an asset or CGU’s recoverable amount is less than its carrying amount, an impairment loss is recognised in the consolidated statement of income. For those assets or CGUs which were impaired in prior periods, if their recoverable amount exceeds their carrying amount, an impairment reversal is recorded in the consolidated statement of income. Future cash flow estimates which are used to calculate the asset’s or CGU’s recoverable amount are discounted using asset or CGU specific discount rates and are based on expectations about future operations, using a combination of internal sources and those inputs available to a market participant, which primarily comprise estimates about production and sales volumes, commodity prices (considering current and future prices and price trends including factors such as the current global trajectory of climate change), reserves and resources, operating costs and capital expenditures. Estimates are reviewed regularly by management. Changes in such estimates and in particular, deterioration in the commodity pricing outlook, could impact the recoverable amounts of these assets or CGUs, whereby some or all of the carrying amount may be impaired or the impairment charge reversed (if pricing outlook improves significantly) with the impact recorded in the statement of income.
As noted above and further described below in the ‘impairment or impairment reversals’ accounting policy, the Group carries out, at least annually, an impairment assessment. Following this review, indicators of impairment or impairment reversal were identified for various CGUs, including those due to an improvement in the underlying commodity price environment most influencing the respective operation. The Group assessed the recoverable amounts of these CGUs and as at 31 December 2021, except for those CGUs disclosed in note 7, the estimated recoverable amounts exceeded the carrying values. For certain CGUs where no impairment was recognised, should there be a significant deterioration or improvement in the key assumptions, a material impairment or reversal could result within the next financial year. The CGUs identified are:
• Thermal coal CGUs’ non-current capital employed is carried at approximately $10.6 billion, and is exposed to long-term changes in demand for fossil fuels. An adverse change in long-term price or other assumptions within the next financial year, for example due to policy changes in relevant jurisdictions, could result in an impairment. Long-term coal price assumption for Newcastle 6,000 NAR: $83/t (FOB basis, real terms);
• Mutanda’s non-current capital employed is carried at approximately $2.5 billion, net of an accumulated impairment of $955 million, and includes value recognition for long-term copper sulphide resource potential. A favourable or adverse change in commodity prices could result in an impairment or reversal of impairment; a change in prospects for the commercialisation of the sulphide resources could result in an impairment or reversal of impairment. Long-term copper and cobalt price assumptions: $7,000/t and $25/lb, respectively (real terms).
• Volcan’s non-current capital employed is carried at approximately $1.3 billion, net of an accumulated impairment of $1,903 million. A favourable or adverse change in commodity prices could result in an impairment or reversal of impairment. Long-term zinc and silver price assumptions: $2,400/t and $20/oz, respectively (real terms).
• Astron’s non-current capital employed is carried at approximately $0.8 billion, net of an accumulated impairment of $480 million and is exposed to long-term changes in demand for petroleum products in Southern Africa. A favourable or adverse change in refining margins could result in an impairment or reversal of impairment.

NOTES TO THE FINANCIAL STATEMENTS continued
Glencore Preliminary Results 2021 35
1. Accounting policies continued
(iii) Restoration, rehabilitation and decommissioning costs (note 23) A provision for future restoration, rehabilitation and decommissioning costs requires estimates and assumptions to be made around the relevant regulatory framework, the magnitude of the possible disturbance and the timing, extent and costs of the required closure and rehabilitation activities. Most of these rehabilitation and decommissioning events are expected to take place many years in the future and the currently estimated requirements and costs that will have to be met when the restoration event occurs are inherently uncertain and could materially change over time.
In calculating the appropriate provision for the expected restoration, rehabilitation or decommissioning obligations, cost estimates of the future potential cash outflows based on current studies of the expected rehabilitation activities and timing thereof, are prepared. These forecasts are then discounted to their present value using a risk-free rate specific to the liability and the currency in which they are denominated.
Any changes in the expected future costs or risk-free rate are initially reflected in both the provision and the asset and subsequently in the consolidated statement of income over the remaining economic life of the asset. As the actual future costs can differ from the estimates due to changes in laws, regulations, technology, costs and timing, the provisions including the estimates and assumptions contained therein are reviewed regularly by management. A material change in the provision within the next 12 months could arise from changes in risk-free rates. The aggregate effect of changes within 12 months as a result of revisions to cost and timing assumptions is not expected to be material.
ADOPTION OF NEW AND REVISED STANDARDS In the current year, Glencore has adopted all new and revised IFRS standards that became effective as of 1 January 2021, the changes being:
(i) Interest Rate Benchmark Reform - Phase 2 (Amendments to IFRS 9, IAS 39, IFRS 7, IFRS 4 and IFRS 16) The amendments introduce a practical expedient for modifications required by the reform, provide an exception that hedge accounting is not discontinued solely because of the IBOR reform, and introduces disclosures that allow users to understand the nature and extent of risks arising from the IBOR reform to which the entity is exposed to and how the entity manages those risks as well as the entity’s progress in transitioning from IBOR’s to alternative benchmark rates, and how the entity is managing this transition.
These amendments did not have a material impact on the Group.
REVISED STANDARDS NOT YET EFFECTIVE At the date of the authorisation of this preliminary announcement, the following revised IFRS standards, which are applicable to Glencore, were issued but not yet effective:
(i) Onerous Contracts – Cost of Fulfilling a Contract (Amendments to IAS 37) – effective for year ends beginning on or after 1 January 2022 The amendments specify that the ‘cost of fulfilling’ a contract comprises the ‘costs that relate directly to the contract’. Costs that relate directly to a contract can either be incremental costs of fulfilling that contract or an allocation of other costs that relate directly to fulfilling contracts. The Group will apply the amendments to contracts for which the Group has not yet fulfilled all its obligations at the beginning of the annual reporting period in which the entity first applies the amendments. Comparatives will not be restated.
(ii) Deferred Tax related to Assets and Liabilities arising from a Single Transaction (Amendments to IAS 12) – effective for year ends beginning on or after 1 January 2023 The amendments specify how companies should account for deferred tax on transactions such as leases and decommissioning obligations, and clarify that the initial recognition exception does not apply to transactions where both an asset and a liability are recognised in a single transaction. Accordingly, deferred tax is required to be recognised on such transactions.
(iii) Definition of Accounting Estimates (Amendments to IAS 8) – effective for year ends beginning on or after 1 January 2023 The amendments introduce the definition of accounting estimates and include other amendments to IAS 8 to help entities distinguish changes in accounting estimates from changes in accounting policies.
(iv) Materiality of Accounting Policy Disclosure (Amendments to IAS 1) – effective for year ends beginning on or after 1 January 2023 The amendments require companies to disclose their material accounting policy information rather than their significant accounting policies.
No significant changes to presentation or disclosures within these financial statements are expected following the adoption of these amendments.

NOTES TO THE FINANCIAL STATEMENTS continued
Glencore Preliminary Results 2021 36
1. Accounting policies continued
BASIS OF PREPARATION The financial statements are prepared under the historical cost convention except for certain financial assets, liabilities, marketing inventories and pension obligations that are measured at revalued amounts or fair values at the end of each reporting period as explained in the accounting policies below. Historical cost is defined as the amount of cash or cash equivalents paid or the fair value of the consideration given to acquire them at the time of their acquisition. The principal accounting policies adopted are set out below.
The Directors have assessed that they have, at the time of approving this preliminary announcement, a reasonable expectation that the Group has adequate resources to continue in operational existence for the 12 months from the expected date of approval of the 2021 Annual Report and Accounts. Therefore, they continue to adopt the going concern basis of accounting in preparing these financial statements. The Directors have made this assessment after consideration of the Group’s budgeted cash flows and related assumptions including appropriate stress testing of the identified uncertainties (being primarily commodity prices and currency exchange rates) and access to undrawn credit facilities and monitoring of debt maturities. Further information on Glencore’s objectives, policies and processes for managing its capital and financial risks are detailed in note 27.
All amounts are expressed in millions of United States Dollars, the presentation currency of the Group, unless otherwise stated.
PRINCIPLES OF CONSOLIDATION The consolidated financial statements incorporate the financial statements of the Company and entities controlled by the Company and its subsidiaries.
Control is achieved when Glencore is exposed, or has rights, to variable returns from its involvement with the investee and has the ability to affect those returns through its power over the investee. Specifically, Glencore controls an investee if, and only if, Glencore has all of the following:
• Power over the investee (i.e. existing rights that give it the current ability to direct the relevant activities of the investee);
• Exposure, or rights, to variable returns from its involvement with the investee; and
• The ability to use its power over the investee to affect its returns.
When Glencore has less than a majority of the voting rights of an investee or similar rights of an investee, it considers all relevant facts and circumstances in assessing whether it has power over the investee including:
• The size of Glencore’s holding of voting rights relative to the size and dispersion of holdings of the other vote holders;
• Potential voting rights held by Glencore, other vote holders or other parties;
• Rights arising from other contractual arrangements; and
• Any additional facts and circumstances that indicate that Glencore has, or does not have, the current ability to direct the relevant activities at the time that decisions need to be made, including voting patterns at previous shareholders’ meetings.
The Company reassesses whether or not it controls an investee if facts and circumstances indicate that there are changes to one or more of the three elements of control listed above. Consolidation of a subsidiary begins when Glencore obtains control over the subsidiary and ceases when Glencore loses control of the subsidiary. Specifically, income and expenses of a subsidiary acquired or disposed of during the year are included in the consolidated statement of income and other comprehensive income from the date Glencore gains control until the date when Glencore ceases to control the subsidiary.
Profit or loss and each component of other comprehensive income are attributed to the owners of the Company and to the non-controlling interests. Total comprehensive income of subsidiaries is attributed to the owners of the Company and to the non-controlling interests even if this results in the non-controlling interests having a deficit balance.
When necessary, adjustments are made to the financial statements of subsidiaries to bring their accounting policies into line with the Group’s accounting policies. All intragroup assets and liabilities, equity, income, expenses and cash flows relating to transactions between members of the Group are eliminated in full on consolidation.
Changes in Glencore’s interests in subsidiaries that do not result in a loss of control are accounted for as equity transactions with any difference between the amount by which the non-controlling interests are adjusted and the fair value of the consideration paid or received being recognised directly in equity and attributed to equity holders of Glencore.
When Glencore loses control of a subsidiary, a gain or loss is recognised in the consolidated statement of income and is calculated as the difference between (i) the aggregate of the fair value of the consideration received and the fair value of any retained interest and (ii) the previous carrying amount of the assets (including goodwill), and liabilities of the subsidiary and any non-controlling interests. All amounts previously recognised in other comprehensive income in relation to that subsidiary are accounted for as if Glencore had directly disposed of the related assets or liabilities of the subsidiary (i.e. reclassified to profit or loss or transferred to another category of equity as specified/permitted by applicable IFRSs). The fair value of any investment retained in the former subsidiary at the date when control is lost is regarded as the fair value on initial recognition for subsequent accounting under IFRS 9, when applicable, or the cost on the initial recognition of an investment in an associate or a joint venture.

NOTES TO THE FINANCIAL STATEMENTS continued
Glencore Preliminary Results 2021 37
1. Accounting policies continued
INVESTMENTS IN ASSOCIATES AND JOINT VENTURES Associates and joint ventures (together “Associates”) in which Glencore exercises significant influence or joint control are accounted for using the equity method. Significant influence is the power to participate in the financial and operating policy decisions of the investee but is not control or joint control over those policies. Significant influence is presumed if Glencore holds between 20% and 50% of the voting rights, unless evidence exists to the contrary. A joint venture is a joint arrangement whereby the parties that have joint control of the arrangement have rights to the net assets of the joint arrangement. Joint control is the contractually agreed sharing of control over an arrangement, which exists only when decisions about relevant strategic and/or key operating decisions require unanimous consent of the parties sharing control.
Equity accounting involves Glencore recording its share of the Associate’s net income and equity. Glencore’s interest in an Associate is initially recorded at cost and is subsequently adjusted for Glencore’s share of changes in net assets of the Associate, less any impairment in the value of individual investments. Where Glencore transacts with an Associate, unrealised profits and losses are eliminated to the extent of Glencore’s interest in that Associate.
Changes in Glencore’s interests in Associates are accounted for as a gain or loss on disposal with any difference between the amount by which the carrying value of the Associate is adjusted and the fair value of the consideration received being recognised directly in the consolidated statement of income.
JOINT OPERATIONS A joint operation is a joint arrangement whereby the parties that have joint control of the arrangement, have rights to the assets and obligations for the liabilities relating to the arrangement.
When Glencore undertakes its activities under joint operations, Glencore recognises in relation to its interest in a joint operation:
• Its assets, including its share of any assets held jointly;
• Its liabilities, including its share of any liabilities incurred jointly;
• Its revenue from the sale of its share of the output arising from the joint operation;
• Its share of the revenue from the sale of the output by the joint operation; and
• Its expenses, including its share of any expenses incurred jointly.
The Group accounts for the assets, liabilities, revenues and expenses relating to its interest in a joint operation in accordance with the IFRSs applicable to the particular assets, liabilities, revenues and expenses.
Where Glencore transacts with a joint operation, unrealised profits and losses are eliminated to the extent of Glencore’s interest in that joint operation.
OTHER UNINCORPORATED ARRANGEMENTS In some cases, Glencore participates in unincorporated arrangements where it has the rights to its share of the assets and obligations for its share of the liabilities of the arrangement, rather than a right to the net returns of the arrangement, but does not share joint control. In such cases, Glencore accounts for its share of the assets, liabilities, revenues and expenses in accordance with the IFRSs applicable to the particular assets, liabilities, revenues and expenses and obligations for the liabilities relating to the arrangement, similar to a joint operation noted above.
BUSINESS COMBINATIONS AND GOODWILL Acquisitions of subsidiaries and businesses are accounted for using the acquisition method of accounting. The cost of the acquisition is measured at fair value, which is calculated as the sum of the acquisition date fair values of the assets transferred, liabilities incurred to the former owners of the acquiree and the equity interests issued in exchange for control of the acquiree. The identifiable assets, liabilities and contingent liabilities (“identifiable net assets”) are recognised at their fair value at the date of acquisition. Acquisition related costs are recognised in the consolidated statement of income as incurred.
Where a business combination is achieved in stages, Glencore’s previously held interests in the acquired entity are remeasured to fair value at the acquisition date (i.e. the date Glencore attains control) and the resulting gain or loss, if any, is recognised in the consolidated statement of income.
Goodwill is measured as the excess of the sum of the consideration transferred, the amount of any non-controlling interests in the acquiree, and the fair value of the acquirer’s previously held equity interest in the acquiree (if any) over the net of the acquisition-date amounts of the identifiable assets acquired and the liabilities assumed.
After initial recognition, goodwill is measured at cost less any accumulated impairment losses. For the purpose of impairment testing, goodwill acquired in a business combination is, from the acquisition date, allocated to the CGUs that are expected to benefit from the synergies of the combination. CGUs to which goodwill has been allocated are tested for impairment annually, or more frequently when there is an indication that the unit may be impaired. If the recoverable amount of the CGU is less than its carrying amount, the impairment loss is allocated first to reduce the carrying amount of any goodwill allocated to the unit and then to the other assets of the unit pro-rata based on the carrying amount of each asset in the unit.

NOTES TO THE FINANCIAL STATEMENTS continued
Glencore Preliminary Results 2021 38
1. Accounting policies continued
Any impairment loss is recognised directly in profit or loss. An impairment loss recognised for goodwill is not able to be reversed in subsequent periods.
On disposal of the relevant CGU, the attributable amount of goodwill is included in the determination of the profit or loss on disposal.
If the initial accounting for a business combination is incomplete by the end of the reporting period in which the combination occurs, Glencore reports provisional amounts for the items for which the accounting is incomplete. Those provisional amounts are adjusted for additional information obtained during the “measurement period” (which cannot exceed one year from the acquisition date) about facts and circumstances that existed at the acquisition date that, if known, would have affected the amounts recognised at that date.
Non-controlling interests that are present ownership interests and entitle their holders to a proportionate share of the entity’s net assets in the event of liquidation may be initially measured either at fair value or at the non-controlling interests’ proportionate share of the recognised amounts of the acquiree’s identifiable net assets. The choice of measurement basis is made on a transaction-by-transaction basis. Other types of non-controlling interests are measured at fair value or, when applicable, on the basis specified in another IFRS.
Similar procedures are applied in accounting for the purchases of interests in Associates and joint operations. Any goodwill arising from such purchases is included within the carrying amount of the investment in Associates, but not amortised thereafter. Any excess of Glencore’s share of the net fair value of the Associate’s identifiable net assets over the cost of the investment is included in the consolidated statement of income in the period of the purchase.
NON-CURRENT ASSETS HELD FOR SALE AND DISPOSAL GROUPS Non-current assets, liabilities and those included in disposal groups are classified as held for sale if their carrying amount will be recovered principally through a sale transaction rather than through continuing use, they are available for immediate disposal and the sale is highly probable. Non-current assets, liabilities and those included in disposal groups held for sale are measured at the lower of their carrying amount or fair value less costs to sell.
REVENUE RECOGNITION Revenue is derived principally from the sale of goods (sale of commodities) and in some instances the goods are sold on Cost and Freight (CFR) or Cost, Insurance and Freight (CIF) Incoterms. When goods are sold on a CFR or CIF basis, the Group is responsible for providing these services (shipping and insurance) to the customer, sometimes after the date at which Glencore has lost control of the goods. Revenue is recognised when the performance obligations have been satisfied, which is once control of the goods and/or services has transferred from Glencore to the buyer. Revenue is measured based on consideration specified in the contract with a customer and excludes amounts collected on behalf of third parties. The same recognition and presentation principles apply to revenues arising from physical settlement of forward sale contracts that do not meet the own use exemption.
Revenue related to the sale of goods is recognised when the product is delivered to the destination specified by the customer, which is typically the vessel on which it is shipped, the destination port or the customer’s premises and the buyer has gained control through their ability to direct the use of and obtain substantially all the benefits from the asset. Where the sale of goods is connected with an agreement to repurchase goods at a later date, revenue is recognised when the repurchase terms are at prevailing market prices, the goods repurchased are readily available in the market, and the buyer gained control of the goods originally sold to them. As at 31 December 2021, the outstanding repurchase commitments under such agreements were $Nil (2020: approximately $300 million). Should it be determined that control has not transferred or the buyer does not have the ability to benefit substantially from ownership of the asset, revenue is not recognised and any proceeds received are accounted for as a financing arrangement. For certain commodities, the sales price is determined on a provisional basis at the date of sale as the final selling price is subject to movements in market prices up to the date of final pricing, normally ranging from 30 to 90 days after initial booking (provisionally priced sales). Revenue on provisionally priced sales is recognised based on the estimated fair value of the total consideration receivable. The revenue adjustment mechanism embedded within provisionally priced sales arrangements has the character of a commodity derivative.
Accordingly, the fair value of the final sales price adjustment is re-estimated continuously and changes in fair value are recognised as an adjustment to revenue. In all cases, fair value is estimated by reference to forward market prices.
Revenue from the sale of material by-products are included within revenue. Where a by-product is not regarded as significant, revenue may be credited against cost of goods sold.

NOTES TO THE FINANCIAL STATEMENTS continued
Glencore Preliminary Results 2021 39
1. Accounting policies continued
Revenue related to the provision of shipping and insurance related activities is recognised over time as the service is rendered.
Payments received for future metal (primarily gold and silver) deliveries (prepayments) are accounted for as executory contracts whereby the prepayment is initially recorded as deferred revenue in the consolidated statement of financial position. The initial deferred revenue amount is unwound and revenue is recognised in the consolidated statement of income as and when Glencore physically delivers the metal and loses control of it. Where these prepayments are in excess of one year and contain a significant financing component, the amount of the deferred revenue is adjusted for the effects of the time value of money. Glencore applies the practical expedient to not adjust the promised amount of consideration for the effects of time value of money if the period between delivery and the respective payment is one year or less.
Royalty, interest and dividend income is recognised when the right to receive payment has been established, it is probable that the economic benefits will flow to Glencore and the amount of income can be measured reliably. Royalty revenue is recognised on an accruals basis in accordance with the substance of the relevant agreement. Interest income is accrued on a time basis, by reference to the principal outstanding and the applicable effective interest rate.
FOREIGN CURRENCY TRANSLATION Glencore’s reporting currency and the functional currency of the majority of its operations is the U.S. dollar as this is assessed to be the principal currency of the economic environment in which it operates.
(i) Foreign currency transactions Transactions in foreign currencies are converted into the functional currency of each entity using the exchange rate prevailing at the transaction date. Monetary assets and liabilities outstanding at year-end are converted at year-end rates. Non-monetary items measured in terms of historical cost are translated using the exchange rate at the date of the transaction. The resulting exchange differences are recorded in the consolidated statement of income.
(ii) Translation of financial statements For the purposes of consolidation, assets and liabilities of group companies whose functional currency is in a currency other than the U.S. dollar are translated into U.S. dollars using year-end exchange rates, while their statements of income are translated using average rates of exchange for the year. Translation adjustments are included as a separate component of shareholders’ equity and have no consolidated statement of income impact to the extent that no disposal of the foreign operation has occurred. Where an intragroup balance is, in substance, part of the Group’s net investment in an entity, exchange gains and losses on that balance are taken to the currency translation reserve. Cumulative translation differences are recycled from equity and recognised as income or expense on disposal of the operation to which they relate.
Goodwill and fair value adjustments arising from the acquisition of a foreign operation are treated as assets and liabilities of the foreign operation and are translated at the closing rate.
BORROWING COSTS Borrowing costs are expensed as incurred except where they relate to the financing of construction or development of qualifying assets in which case they are capitalised up to the date when the qualifying asset is ready for its intended use.
EMPLOYEE AND RETIREMENT BENEFITS Wages, salaries, bonuses, social security contributions, paid annual and sick leave are accrued in the period in which the associated services are rendered by the employees of the Group.
Glencore operates various pension schemes in accordance with local requirements and practices of the respective countries. The annual costs for defined contribution plans that are funded by payments to separate trustee administered funds or insurance companies equal the contributions that are required under the plans and accounted for as an expense.
For defined benefit retirement plans, the cost of providing benefits is determined using the Projected Unit Credit Method, with actuarial valuations being carried out at the end of each annual reporting period. Remeasurements comprising actuarial gains and losses, the effect of the asset ceiling (if applicable) and the return on plan assets (excluding interest) are recognised immediately in the statement of financial position with a charge or credit to other comprehensive income in the period in which they occur. Remeasurements recognised in other comprehensive income are not reclassified. Past service cost is recognised in profit or loss when the plan amendment or curtailment occurs, or when the Group recognises related restructuring costs or termination benefits, if earlier. Gains or losses on settlement of a defined benefit plan are recognised when the settlement occurs. Net interest is calculated by applying a discount rate to the net defined benefit liability or asset.
Defined benefit costs are split into three categories:
• service costs, which includes current service cost, past service cost and gains and losses on curtailments and settlements;
• net interest expense or income; and
• remeasurements.
The Group recognises service costs within the consolidated statement of income.
Net interest expense or income is recognised within interest expense or income within the consolidated statement of income.

NOTES TO THE FINANCIAL STATEMENTS continued
Glencore Preliminary Results 2021 40
1. Accounting policies continued
Any past service cost (or the gain or loss on settlement) is calculated by measuring the defined benefit liability (asset) using updated assumptions and comparing benefits offered and plan assets before and after the plan amendment (or curtailment or settlement) but ignoring the effect of the asset ceiling (that may arise when the defined benefit plan is in a surplus position). The Group uses the updated assumptions from this remeasurement to determine current service cost and net interest for the remainder of the reporting period after the change to the plan. In the case of the net interest for the period post-plan amendment, the net interest is calculated by multiplying the net defined benefit liability (asset) as remeasured with the discount rate used in the remeasurement (also taking into account the effect of contributions and benefit payments on the net defined benefit liability (asset)).
The retirement benefit obligation recognised in the consolidated statement of financial position represents the deficit or surplus in the Group’s defined benefit plans. Any surplus resulting from this calculation is limited to the present value of any economic benefits available in the form of refunds from the plans or reductions in future contributions to the plans.
Glencore also provides post-retirement healthcare benefits to certain employees in Canada, South Africa and the United States. These are accounted for in a similar manner to the defined benefit pension plans, however are unfunded.
SHARE-BASED PAYMENTS (i) Equity-settled share-based payments Equity-settled share-based payments are measured at the fair value of the awards based on the market value of the shares at the grant date. Fair value excludes the effect of non-market-based vesting conditions. The fair value is charged to the consolidated statement of income and credited to retained earnings on a straight-line basis over the period the estimated awards are expected to vest.
At each balance sheet date, the Company revises its estimate of the number of equity instruments expected to vest as a result of the effect of non-market-based vesting conditions. The impact of the revision of the original estimates, if any, is recognised in the consolidated statement of income such that the cumulative expense reflects the revised estimate, with a corresponding adjustment to retained earnings.
(ii) Cash-settled share-based payments For cash-settled share-based payments, a liability is initially recognised at fair value based on the estimated number of awards that are expected to vest, adjusting for market and non-market-based performance conditions. Subsequently, at each reporting period until the liability is settled, it is remeasured to fair value with any changes in fair value recognised in the consolidated statement of income.
INCOME TAXES Income taxes consist of current and deferred income taxes. Current taxes represent income taxes expected to be payable based on enacted or substantively enacted tax rates at the period end on expected current taxable income, and any adjustment to tax payable in respect of previous years. Deferred taxes are recognised for temporary differences between the carrying amounts of assets and liabilities in the financial statements and the corresponding tax bases used in the computation of taxable income, using enacted or substantively enacted income tax rates which are expected to be effective at the time of reversal of the underlying temporary difference. Deferred tax assets and unused tax losses are only recognised to the extent that their recoverability is probable. Deferred tax assets are reviewed at reporting period end and amended to the extent that it is no longer probable that the related benefit will be realised. To the extent that a deferred tax asset not previously recognised subsequently fulfils the criteria for recognition, an asset is then recognised.
Deferred tax assets and liabilities are offset when they relate to income taxes levied by the same authority and Glencore has both the right and the intention to settle its current tax assets and liabilities on a net or simultaneous basis. The tax effect of certain temporary differences is not recognised principally with respect to the initial recognition of an asset or liability (other than those arising in a business combination or in a manner that initially impacted accounting or taxable profit) and temporary differences relating to investments in subsidiaries and Associates to the extent that Glencore can control the timing of the reversal of the temporary difference and it is probable the temporary difference will not reverse in the foreseeable future. Deferred tax is provided in respect of fair value adjustments on acquisitions. These adjustments may relate to assets such as extraction rights that, in general, are not eligible for income tax allowances.
Current and deferred tax are recognised as an expense or income in the consolidated statement of income, except when they relate to items that are recognised outside the consolidated statement of income (whether in other comprehensive income or directly in equity) or where they arise from the initial accounting for a business combination.
Royalties, extraction taxes and other levies/taxes are treated as taxation arrangements when they have the characteristics of an income tax, including being imposed and determined in accordance with regulations established by the respective government’s taxation authority and the amount payable is based on taxable income – rather than physical quantities produced or as a percentage of revenues – after adjustment for temporary differences. For such arrangements, current and deferred tax is provided on the same basis as described above for other forms of taxation. Obligations arising from royalty arrangements that do not satisfy these criteria are recognised as current provisions and included in cost of goods sold.
NOTES TO THE FINANCIAL STATEMENTS continued
Glencore Preliminary Results 2021 41
1. Accounting policies continued
Glencore assesses its liabilities and contingencies for all tax years open to audit based upon the latest information available. Inherent uncertainties exist in estimates of tax contingencies due to complexities of interpretation and changes in tax laws. For those matters where it is probable that an adjustment will be made, the Group records its best estimate of these tax liabilities, including related interest charges, taking into account the range of possible outcomes.
PROPERTY, PLANT AND EQUIPMENT Property, plant and equipment are stated at cost, being the fair value of the consideration given to acquire or construct the asset, including directly attributable costs required to bring the asset to the location or to a condition necessary for operation and the direct cost of dismantling and removing the asset, less accumulated depreciation and any accumulated impairment losses.
Property, plant and equipment are depreciated to their estimated residual value over the estimated useful life of the specific asset concerned, or the estimated remaining life of the associated mine (LOM), field or lease.
Depreciation commences when the asset is available for use. The major categories of property, plant and equipment are depreciated/amortised on a units of production (UOP) and/or straight-line basis as follows:
Buildings 10 – 45 years Freehold land not depreciated Plant and equipment 3 – 30 years/UOP Right-of-use assets 2 – 30 years Mineral and petroleum rights UOP Deferred mining costs UOP
(i) Mineral and petroleum rights Mineral and petroleum reserves, resources and rights (together “Mineral and petroleum rights”) which can be reasonably valued, are recognised in the assessment of fair values on acquisition. Mineral and petroleum rights for which values cannot be reasonably determined are not recognised. Exploitable Mineral and petroleum rights are amortised using the UOP basis over the commercially recoverable reserves and, in certain circumstances, other mineral resources. Mineral resources are included in amortisation calculations where there is a high degree of confidence that they will be extracted in an economic manner.
(ii) Exploration and evaluation expenditure Exploration and evaluation expenditure relates to costs incurred in the exploration and evaluation of potential mineral and petroleum resources and includes costs such as exploration and production licences, researching and analysing historical exploration data, exploratory drilling, trenching, sampling and the costs of pre-feasibility studies. Exploration and evaluation expenditure for each area of interest, other than that acquired from another entity, is charged to the consolidated statement of income as incurred except when the expenditure is expected to be recouped from future exploitation or sale of the area of interest and it is planned to continue with active and significant operations in relation to the area, or at the reporting period end, the activity has not reached a stage which permits a reasonable assessment of the existence of commercially recoverable reserves, in which case the expenditure is capitalised. As the intangible component (i.e. licences) represents an insignificant and indistinguishable portion of the overall expected tangible amount to be incurred and recouped from future exploitation, these costs along with other capitalised exploration and evaluation expenditure are recorded as a component of property, plant and equipment. Purchased exploration and evaluation assets are recognised at their fair value at acquisition.
As the capitalised exploration and evaluation expenditure asset is not available for use, it is not depreciated. All capitalised exploration and evaluation expenditure is monitored for indications of impairment. Where a potential impairment is indicated, an assessment is performed for each area of interest or at the CGU level. To the extent that capitalised expenditure is not expected to be recovered it is charged to the consolidated statement of income.
Administration costs that are not directly attributable to a specific exploration area are charged to the consolidated statement of income. Licence costs paid in connection with a right to explore in an existing exploration area are capitalised and amortised over the term of the permit.
DEVELOPMENT EXPENDITURE When commercially recoverable reserves are determined and such proposed development receives the appropriate approvals, capitalised exploration and evaluation expenditure is transferred to construction in progress, a component within the plant and equipment asset sub-category. All subsequent development expenditure is similarly capitalised, provided commercial viability conditions continue to be satisfied. Proceeds from the sale of product extracted during the development phase are netted against development expenditure. Upon completion of development and commencement of production, capitalised development costs are further transferred, as required, to the appropriate plant and equipment asset category and depreciated using the unit of production method (UOP) or straight-line basis.
Deferred mining costs Mainly comprises certain capitalised costs related to underground mining as well as pre-production and in-production stripping activities as outlined below. Deferred mining costs are amortised using the UOP basis over the life of the ore body to which those costs relate.

NOTES TO THE FINANCIAL STATEMENTS continued
Glencore Preliminary Results 2021 42
1. Accounting policies continued
DEFERRED STRIPPING COSTS Stripping costs incurred in the development of a mine (or pit) before production commences are capitalised as part of the cost of constructing the mine (or pit) and subsequently amortised over the life of the mine (or pit) on a UOP basis.
In-production stripping costs related to accessing an identifiable component of the ore body to realise benefits in the form of improved access to ore to be mined in the future (stripping activity asset), are capitalised within deferred mining costs provided all the following conditions are met:
(a) it is probable that the future economic benefit associated with the stripping activity will be realised;
(b) the component of the ore body for which access has been improved can be identified; and
(c) the costs relating to the stripping activity associated with the improved access can be reliably measured.
If all of the criteria are not met, the production stripping costs are charged to the consolidated statement of income as they are incurred.
The stripping activity asset is subsequently depreciated on a UOP basis over the life of the identified component of the ore body that became more accessible as a result of the stripping activity and is then stated at cost less accumulated depreciation and any accumulated impairment losses.
LEASES As lessee, the Group assesses whether a contract contains a lease at inception of the contract. The Group recognises a right-of-use asset and corresponding lease liability in the statement of financial position for all lease arrangements where it is the lessee, except for short-term leases with a term of twelve months or less and leases of low value assets. For these leases, the Group recognises the lease payments as an operating expense on a straight-line basis over the term of the lease.
The lease liability is initially measured at the present value of the future lease payments from the commencement date of the lease. The lease payments are discounted using the interest rate implicit in the lease or, if not readily determinable, the asset and company specific incremental borrowing rates. Lease liabilities are recognised within borrowings on the statement of financial position. The lease liability is subsequently measured by increasing the carrying amount to reflect interest on the lease liability (using the effective interest method) and by reducing the carrying amount to reflect the lease payments made. The Group remeasures the lease liability, with a corresponding adjustment to the related right-of-use assets, whenever:
• The lease term changes or there is a significant event or change in circumstances resulting in a change in the assessment of exercise of a purchase option, in which case the lease liability is remeasured by discounting the revised lease payments using a revised discount rate;
• The lease payments change due to the changes in an index or rate or a change in expected payment under a guaranteed residual value, in which case the lease liability is remeasured by discounting the revised lease payments using an unchanged discount rate; or
• A lease contract is modified and the lease modification is not accounted for as a separate lease, in which case the lease liability is remeasured based on the lease term of the modified lease by discounting the revised lease payments using a revised discount rate at the effective date of modification.
The right-of-use assets are initially recognised on the balance sheet at cost, which comprises the amount of the initial measurement of the corresponding lease liability, adjusted for any lease payments made at or prior to the commencement date of the lease, any lease incentive received and any initial direct costs incurred, and expected costs for obligations to dismantle and remove right-of-use assets when they are no longer used. Right-of-use assets are recognised within property, plant and equipment on the statement of financial position. Right-of-use assets are depreciated on a straight-line basis from the commencement date of the lease over the shorter of the useful life of the right-of-use asset or the end of the lease term.
The Group enters into lease arrangements as a lessor with respect to some of its time charter vessels. Leases for which the Group is an intermediate lessor are classified as finance or operating leases by reference to the right-of-use asset arising from the head lease. Income from operating leases is recognised on a straight-line basis over the term of the relevant lease. Amounts due from lessees under finance leases are recognised as receivables at the amount of the Group’s net investment in the leases. Finance lease income is allocated to accounting periods so as to reflect a constant periodic rate of return on the Group’s net investment outstanding in respect of these leases.
RESTORATION, REHABILITATION AND DECOMMISSIONING Restoration, rehabilitation and decommissioning costs arising from the installation of plant and other site preparation work, discounted using a risk-free rate specific to the liability and the currency in which they are denominated to their net present value, are provided for and capitalised at the time such an obligation arises. The costs are charged to the consolidated statement of income over the life of the operation through depreciation of the asset and the unwinding of the discount on the provision.
Costs for restoration of subsequent site disturbance, which is created on an ongoing basis during production, are provided for at their net present values and charged to the consolidated statement of income as extraction progresses.
NOTES TO THE FINANCIAL STATEMENTS continued
Glencore Preliminary Results 2021 43
1. Accounting policies continued
Changes in the estimated timing of the rehabilitation or changes to the estimated future costs are accounted for prospectively by recognising an adjustment to the rehabilitation liability and a corresponding adjustment to the asset to which it relates, provided a reduction, if any, in the provision is not greater than the depreciated capitalised cost of the related asset, in which case the capitalised cost is reduced to Nil and the remaining adjustment recognised in the consolidated statement of income. In the case of closed sites, changes to estimated costs are recognised immediately in the consolidated statement of income.
INTANGIBLE ASSETS Intangible assets acquired separately are measured on initial recognition at cost. The cost of intangible assets acquired in a business combination is their fair value at the date of acquisition. Following initial recognition, intangible assets are carried at cost less any accumulated amortisation (calculated on a straight-line basis over their useful lives) and accumulated impairment losses, if any.
Internally generated intangibles are not capitalised. Instead, the related expenditure is recognised in the consolidated statement of income in the period in which the expenditure is incurred.
Identifiable intangible assets with a finite life are amortised on a straight-line basis over their expected useful life. The amortisation method and period are reviewed annually and impairment testing is undertaken when circumstances indicate the carrying amount may not be recoverable. Other than goodwill which is not amortised, Glencore has no identifiable intangible assets with an indefinite life.
The major categories of intangibles are amortised on a units of production (UOP) and/or straight-line basis as follows:
Port allocation rights UOP Licences, trademarks and software 3 – 20 years Customer relationships 5 – 9 years
Goodwill impairment testing For the purpose of impairment testing, goodwill has been allocated to the CGUs, or groups of CGUs, that are expected to benefit from the synergies of the business combination and which represent the level at which management monitors and manages the goodwill. In assessing whether an impairment is required, the carrying value of the CGU is compared with its recoverable amount. The recoverable amount is the higher of its fair value less costs of disposal (FVLCD) and its value in use (VIU). If the recoverable amount of the CGU is less than the carrying amount of the unit, the impairment loss is allocated first to reduce the carrying amount of any goodwill allocated to the unit and then to the other assets of the unit on a pro-rata basis of the carrying amount of each asset in the unit. Any impairment loss for goodwill is recognised directly in the consolidated statement of income. An impairment loss recognised for goodwill can not be reversed in subsequent periods.
OTHER INVESTMENTS Equity investments, other than investments in Associates, are recorded at fair value. Glencore designated investments that are not held for trading as at fair value through other comprehensive income (FVTOCI). As a result, changes in fair value are recorded in the consolidated statement of other comprehensive income. Dividends from these investments are recognised in the consolidated statement of income, unless the dividend represents a recovery of part of the cost of the equity investment. Investments that are held for trading are subsequently measured at fair value through profit or loss (FVTPL).
IMPAIRMENT OR IMPAIRMENT REVERSALS Glencore conducts, at least annually, an internal review of asset values which is used as a source of information to assess for any indications of impairment or impairment reversal. Formal impairment tests are carried out, at least annually, for cash-generating units containing goodwill and for all other non-current assets, when events or changes in circumstances indicate the carrying value may not be recoverable.
A formal impairment or reversal test involves determining whether the carrying amounts are in excess (or below, as the case may be) of their recoverable amounts. An asset’s recoverable amount is determined as the higher of its FVLCD and its VIU. Such reviews are undertaken on an asset-by-asset basis, except where assets do not generate cash flows independent of other assets, in which case the review is undertaken at the CGU level.
If the carrying amount of an asset exceeds its recoverable amount, an impairment loss is recorded in the consolidated statement of income to reflect the asset at the lower amount.
For those assets which were impaired in prior periods, if their recoverable amount exceeds their carrying amount, an impairment reversal is recorded in the consolidated statement of income to reflect the asset at the higher amount to the extent the increased carrying amount does not exceed the carrying value of the asset that would have been determined had no impairment previously been recognised. Goodwill impairments cannot be subsequently reversed.

NOTES TO THE FINANCIAL STATEMENTS continued
Glencore Preliminary Results 2021 44
1. Accounting policies continued
PROVISIONS Provisions are recognised when Glencore has a present obligation (legal or constructive), as a result of past events, and it is probable that an outflow of resources embodying economic benefits that can be reliably estimated will be required to settle the liability.
The amount recognised as a provision is the best estimate of the consideration required to settle the present obligation at the balance sheet date, taking into account the risks and uncertainties surrounding the obligation, including interpretation of specific laws and likelihood of settlement. Where a provision is measured using the cash flow estimated to settle the present obligation, its carrying amount is the present value of those cash flows (when the effect of the time value of money is material).
ONEROUS CONTRACTS An onerous contract is considered to exist where Glencore has a contract under which the unavoidable costs of meeting the obligations under the contract exceed the economic benefits expected to be received from the contract. Present obligations arising under onerous contracts are recognised and measured as provisions.
UNFAVOURABLE CONTRACTS An unfavourable contract is considered to exist when Glencore, in a business combination, acquires a contract under which the terms of the contract require Glencore to sell or purchase products or services on terms which are economically unfavourable compared to current market terms at the time of the business combination. Unfavourable contracts are recognised at the present value of the economic loss and amortised into the statement of income over the term of the contract.
INVENTORIES The vast majority of inventories attributable to the marketing activities are valued at fair value less costs of disposal with the remainder valued at the lower of cost or net realisable value, with costs allocated using the first-in-first-out (FIFO) method. Unrealised gains and losses from changes in fair value are reported in cost of goods sold.
Inventories held by the industrial activities are valued at the lower of cost or net realisable value. Cost is determined using FIFO or the weighted average method and comprises material costs, labour costs and allocated production related overhead costs. Typically raw materials and consumables are measured using the FIFO method and work in progress inventories using the weighted average method. Where the production process results in more than one product being produced (joint products), cost is allocated between the various products according to the ratio of contribution of these metals to gross sales revenue. Financing and storage costs related to inventory are expensed as incurred.
Non-current inventories primarily relate to stockpiles which are not expected to be utlised within the normal operating cycle.
NON-FINANCIAL INSTRUMENTS (PHYSICAL ADVANCES OR PREPAYMENTS) The Group enters into physical advances and prepayment agreements with certain suppliers and customers. When such advances and prepayments are primarily settled in cash or another financial asset, they are classified as financial instruments (see below). When settlement is satisfied primarily through physical delivery or receipt of an underlying product they are classified as non-financial instruments. Such advances and prepayments are initially recorded at the amount of the cash paid or received and are subsequently reduced by the relevant contractual volumes of physical deliveries made.
FINANCIAL INSTRUMENTS Financial assets and financial liabilities are recognised in the Group’s consolidated statement of financial position when the Group becomes a party to the contractual provisions of the instrument.
Financial assets are classified as either financial assets at amortised cost, at fair value through other comprehensive income (FVTOCI) or at fair value through profit or loss (FVTPL) depending upon the business model for managing the financial assets and the nature of the contractual cash flow characteristics of the financial asset. Financial assets are initially recognised at fair value on the trade date, including, in the case of instruments not subsequently measured at fair value through profit or loss, directly attributable transaction costs. Trade receivables with no provisional price features and where there is no significant financing component, are initially recognised at their transaction price. Subsequently, other investments, provisionally priced trade receivables and derivatives are carried at fair value and trade receivables that do not contain provisional price features, loans and other receivables are carried at amortised cost.
Financial liabilities, other than derivatives and those containing provisional price features, are initially recognised at fair value of consideration received net of transaction costs as appropriate and subsequently carried at amortised cost. Financial liabilities that contain provisional pricing features (accounted for as embedded derivatives) were designated in their entirety as at FVTPL. Derivatives are carried at FVTPL.
Where financial assets and financial liabilities recognised at fair value are managed and reported to key management personnel on the basis of its net exposure to either market risks or credit risk, fair value of that group of financial assets and financial liabilities is measured on the basis of the net price that would be received to sell the long position and to transfer the short position for a particular risk exposure of the specific financial asset or liability being measured. When the group of financial assets and/or financial liabilities are not presented on a net basis in the statement of financial position, any portfolio level adjustments are allocated to the individual instruments that make up the group on an appropriate basis.
NOTES TO THE FINANCIAL STATEMENTS continued
Glencore Preliminary Results 2021 45
1. Accounting policies continued
(i) Impairment of financial assets A loss allowance for expected credit losses is determined for all financial assets (as well as for issued loan commitments and financial guarantee contracts), other than those at FVTPL and investments in equity instruments measured at FVTOCI, at the end of each reporting period. The expected credit loss recognised represents a probability-weighted estimate of credit losses over the expected life of the financial instrument.
The Group applies the simplified approach to measure the loss allowance for trade receivables classified at amortised cost, using the lifetime expected loss provision. The expected credit losses on these financial assets are estimated using a provision matrix by reference to past default experience and an equivalent credit rating, adjusted as appropriate for current observable data and forward-looking information.
For all other financial assets at amortised cost, the Group recognises lifetime expected credit losses when there has been a significant increase in credit risk since initial recognition, which is determined by:
• A review of overdue amounts;
• Comparing the risk of default at the reporting date and at the date of initial recognition; and
• An assessment of relevant historical and forward-looking quantitative and qualitative information.
For those balances that are beyond 30 days overdue it is presumed to be an indicator of a significant increase in credit risk.
If the credit risk on the financial instrument has not increased significantly since initial recognition, the Group measures the loss allowance for that financial instrument at an amount equal to 12-month expected credit loss, which comprises the expected lifetime loss from the instrument were a default to occur within 12 months of the reporting date.
The Group considers an event of default has materialised and the financial asset is credit impaired when information developed internally or obtained from external sources indicates that the debtor is unlikely to pay the Group without taking into account any collateral held by the Group or if the financial asset is more than 90 days past due, unless the Group has reasonable and supportable information to demonstrate that a more lagging default criterion is more appropriate. The Group writes off a financial asset when there is information indicating that the debtor is in severe financial difficulty and there is no realistic prospect of recovery.
(ii) Derecognition of financial assets and financial liabilities The Group derecognises a financial asset when the contractual rights to the cash flows from the asset expire, or when it transfers the financial asset and substantially all the risks and rewards of ownership of the asset to another party. If the Group neither transfers nor retains substantially all the risks and rewards of ownership and continues to control the transferred asset, the Group recognises its retained interest in the asset and an associated liability for amounts it may have to pay. If the Group retains substantially all the risks and rewards of ownership of a transferred financial asset, the Group continues to recognise the financial asset and also recognises a collateralised borrowing for the proceeds received.
The Group derecognises financial liabilities when the Group’s obligations are discharged, cancelled or have expired.
On derecognition of a financial asset/financial liability in its entirety, the difference between the carrying amount of the financial asset/financial liability and the sum of the consideration received and receivable/paid and payable is recognised in profit and loss. On derecognition of equity investments designated and measured at FVTOCI, the cumulative gain or loss recognised in other comprehensive income is reclassified directly to retained earnings.
OWN SHARES The cost of purchases of own shares is deducted from equity. Where they are purchased, issued to employees or sold, no gain or loss is recognised in the consolidated statement of income. Such gains and losses are recognised directly in equity. Any proceeds received on disposal of the shares or transfers to employees are recognised in equity.
DERIVATIVES AND HEDGING ACTIVITIES Derivative instruments, which include physical contracts to sell or purchase commodities that do not meet the own use exemption, are initially recognised at fair value when Glencore becomes a party to the contractual provisions of the instrument and are subsequently remeasured to fair value at the end of each reporting period. Fair values are determined using quoted market prices, dealer price quotations or using models and other valuation techniques, the key inputs for which include current market and contractual prices for the underlying instrument, time to expiry, yield curves, volatility of the underlying instrument and counterparty risk.
Gains and losses on derivative instruments for which hedge accounting is not applied, other than the revenue adjustment mechanism embedded within provisionally priced sales and mark-to-market movements on physical forward sales contracts, are recognised in cost of goods sold.
Those derivatives qualifying and designated as hedges are either (i) a Fair Value Hedge of the change in fair value of a recognised asset or liability or an unrecognised firm commitment, or (ii) a Cash Flow Hedge of the change in cash flows to be received or paid relating to a recognised asset or liability or a highly probable transaction.

NOTES TO THE FINANCIAL STATEMENTS continued
Glencore Preliminary Results 2021 46
1. Accounting policies continued
At the inception of the hedge and on an ongoing basis, Glencore documents whether the hedging instrument is effective in offsetting changes in fair values or cash flows of the hedged item attributable to the hedged risk, which is when the hedging relationship meets the qualifying hedge effectiveness requirements.
Glencore discontinues hedge accounting when the qualifying criteria for the hedged relationship is no longer met.
A change in the fair value of derivatives designated as a Fair Value Hedge is reflected together with the change in the fair value of the hedged item in the consolidated statement of income.
A change in the fair value of derivatives designated as a Cash Flow Hedge is initially recognised in the consolidated statement of comprehensive income and accumulated in the cash flow hedge reserve in shareholders’ equity. The deferred amount is then released to the consolidated statement of income in the same periods during which the hedged transaction affects the consolidated statement of income. Hedge ineffectiveness is recorded in the consolidated statement of income when it occurs.
When a hedging instrument expires or is sold, or when a hedge no longer meets the criteria for hedge accounting, any cumulative gain or loss existing in equity at that time remains in shareholders’ equity and is recognised in the consolidated statement of income when the committed or forecast transaction is ultimately recognised in the consolidated statement of income. However, if a forecast or committed transaction is no longer expected to occur, the cumulative gain or loss that was recognised in equity is immediately transferred to the consolidated statement of income.
A derivative may be embedded in a non-derivative “host contract” such as provisionally priced sales and purchases. Such combinations are known as hybrid instruments. If a hybrid contract contains a host that is a financial asset within the scope of IFRS 9, then the relevant classification and measurement requirements are applied to the entire contract at the date of initial recognition. Should the host contract not be a financial asset within the scope of IFRS 9, the embedded derivative is separated from the host contract, if it is not closely related to the host contract, and accounted for as a standalone derivative. Where the embedded derivative is separated, the host contract is accounted for in accordance with its relevant accounting policy, unless the entire instrument is designated at FVTPL in accordance with IFRS 9.
FINANCIAL GUARANTEE CONTRACTS Financial guarantee contracts are accounted for in accordance with IFRS 9 as financial liabilities. After initial recognition, any such contracts are subsequently measured at the higher of the amount of the provision for expected credit losses and the amount initially recognised less any income recognised in accordance with the principles of IFRS 15.

NOTES TO THE FINANCIAL STATEMENTS continued
Glencore Preliminary Results 2021 47
2. Segment information
Glencore is organised and operates on a worldwide basis in two core business segments – Marketing activities and Industrial activities, reflecting the reporting lines and structure used by Glencore’s Management to allocate resources and assess the performance of Glencore.
The business segments’ contributions to the Group are primarily derived from a) the net margin or premium earned from physical Marketing activities (net sale and purchase of physical commodities) and the provision of marketing and related value-add services and b) the net margin earned from Industrial asset activities (resulting from the sale of physical commodities over the cost of production and/or cost of sales). The marketing related operating segments have been aggregated under the Marketing reportable segment as their economic characteristics (historic and expected long-term Adjusted EBITDA margins and the nature of the marketing services provided) are similar. The industrial related operating segments have been aggregated under the Industrial reportable segment as the core activities (extracting raw material and / or processing it further into saleable product, as required, and then selling it at prevailing market prices), the exposure to long-term economic risks (price movements, technology, sovereign and production substitution) and the longer-term average Adjusted EBITDA margins are similar. The economic and operational characteristics of our coal operating and commercial units are not expected to change in the foreseeable future and continue to be included within the industrial assets and marketing reporting segments respectively.
Corporate and other: consolidated statement of income amounts represent Group related income and expenses (including share of Viterra earnings and certain variable bonus charges). Statement of financial position amounts represent Group related balances.
The financial performance of the operating segments is principally evaluated by management with reference to Adjusted EBIT/EBITDA. Adjusted EBIT is the net result of segmental revenue (revenue including Proportionate adjustments as defined in the Alternative performance measure section) less cost of goods sold and selling and administrative expenses plus share of income from associates and joint ventures, dividend income and the attributable share of Adjusted EBIT of relevant material associates and joint ventures, which are accounted for internally by means of proportionate consolidation, excluding significant items. Adjusted EBITDA consists of Adjusted EBIT plus depreciation and amortisation, including the related Proportionate adjustments. In addition, Volcan, while a subsidiary of the Group, is accounted for under the equity method for internal reporting and analysis due to the relatively low economic ownership held by the Group.
The accounting policies of the operating segments are the same as those described in note 1 with the exception of relevant material associates, the Collahuasi joint venture and Volcan. Under IAS 28 and IFRS 11, Glencore’s investments in the Antamina copper/zinc mine (34% owned) and the Cerrejón coal mine (33% owned) are considered to be associates as they are not subject to joint control and the Collahuasi copper mine (44% owned) is considered to be a joint venture. Associates and joint ventures are required to be accounted for in Glencore’s financial statements under the equity method. For internal reporting and analysis, Glencore evaluates the performance of these investments under the proportionate consolidation method, reflecting Glencore’s proportionate share of the revenues, expenses, assets and liabilities of the investments. For internal reporting and analysis, management evaluates the performance of Volcan under the equity method, reflecting the Group’s relatively low 23.3% economic ownership in this fully ring-fenced listed entity, with its stand-alone, independent and separate capital structure. The balances as presented for internal reporting purposes are reconciled to Glencore’s statutory disclosures in the following tables and/or in the Alternative performance measures section.

NOTES TO THE FINANCIAL STATEMENTS continued
Glencore Preliminary Results 2021 48
2. Segment information continued
Glencore accounts for intra-segment sales and transfers where applicable as if the sales or transfers were to third parties, i.e. at arm’s length commercial terms.
2021 Marketing activities
Industrial activities
Inter-segment eliminations
US$ million Total Revenue Metals and minerals 74,727 41,535 (29,915) 86,347 Energy products 107,037 19,269 (4,727) 121,579 Corporate and other – 6 – 6 Revenue - segmental 181,764 60,810 (34,642) 207,932 Proportionate adjustment – revenue1 – (4,181) – (4,181) Revenue – reported measure 181,764 56,629 (34,642) 203,751 Metals and minerals Adjusted EBITDA 2,588 12,017 – 14,605 Depreciation and amortisation (94) (3,485) – (3,579) Proportionate adjustment – depreciation1 – (404) – (404) Adjusted EBIT 2,494 8,128 – 10,622 Energy products Adjusted EBITDA 1,829 5,603 – 7,432 Depreciation and amortisation (434) (2,262) – (2,696) Proportionate adjustment – depreciation1 – (89) – (89) Adjusted EBIT 1,395 3,252 – 4,647 Corporate and other Adjusted EBITDA2 (194) (520) – (714) Depreciation and amortisation – (60) – (60) Adjusted EBIT (194) (580) – (774) Total Adjusted EBITDA 4,223 17,100 – 21,323 Total depreciation and amortisation (528) (5,807) – (6,335) Total depreciation proportionate adjustment – (493) – (493) Total Adjusted EBIT 3,695 10,800 – 14,495 Share of associates' significant items1,3 (11) Movement in unrealised inter-segment profit elimination adjustments4 (549) Loss on disposals of non-current assets (607) Other income/(expense) – net (1,947) Impairments (1,838) Interest expense – net (1,140) Income tax expense (3,026) Proportionate adjustment – net finance, impairment and income tax expense1 (1,028)
Income for the year 4,349
1 Refer to APMs section for definition. 2 Marketing activities include $473 million of Glencore’s equity accounted share of Viterra. 3 Share of associates’ significant items comprise Glencore’s share of significant charges relating to impairments and other items booked directly by various associates. 4 Represents the required adjustment to eliminate unrealised profit or losses arising on inter-segment transactions, i.e. before ultimate sale to a third party. For Glencore, such
adjustments arise on the sale of product, in the ordinary course of business, from its Industrial to Marketing operations. Management assesses segment performance prior to any such adjustments, as if the sales were to third parties.
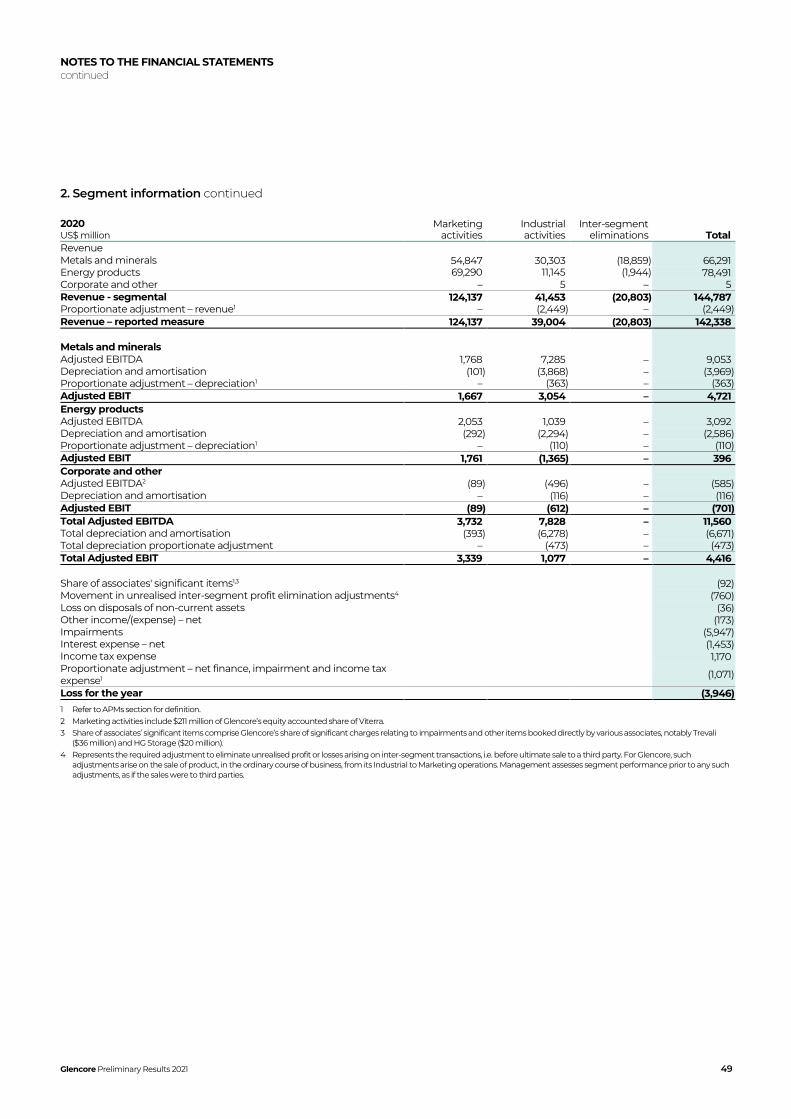
NOTES TO THE FINANCIAL STATEMENTS continued
Glencore Preliminary Results 2021 49
2. Segment information continued
2020 Marketing activities
Industrial activities
Inter-segment eliminations
US$ million Total Revenue Metals and minerals 54,847 30,303 (18,859) 66,291 Energy products 69,290 11,145 (1,944) 78,491 Corporate and other – 5 – 5 Revenue - segmental 124,137 41,453 (20,803) 144,787 Proportionate adjustment – revenue1 – (2,449) – (2,449) Revenue – reported measure 124,137 39,004 (20,803) 142,338 Metals and minerals Adjusted EBITDA 1,768 7,285 – 9,053 Depreciation and amortisation (101) (3,868) – (3,969) Proportionate adjustment – depreciation1 – (363) – (363) Adjusted EBIT 1,667 3,054 – 4,721 Energy products Adjusted EBITDA 2,053 1,039 – 3,092 Depreciation and amortisation (292) (2,294) – (2,586) Proportionate adjustment – depreciation1 – (110) – (110) Adjusted EBIT 1,761 (1,365) – 396 Corporate and other Adjusted EBITDA2 (89) (496) – (585) Depreciation and amortisation – (116) – (116) Adjusted EBIT (89) (612) – (701) Total Adjusted EBITDA 3,732 7,828 – 11,560 Total depreciation and amortisation (393) (6,278) – (6,671) Total depreciation proportionate adjustment – (473) – (473) Total Adjusted EBIT 3,339 1,077 – 4,416 Share of associates' significant items1,3 (92) Movement in unrealised inter-segment profit elimination adjustments4 (760) Loss on disposals of non-current assets (36) Other income/(expense) – net (173) Impairments (5,947) Interest expense – net (1,453) Income tax expense 1,170 Proportionate adjustment – net finance, impairment and income tax expense1 (1,071)
Loss for the year (3,946)
1 Refer to APMs section for definition. 2 Marketing activities include $211 million of Glencore’s equity accounted share of Viterra. 3 Share of associates’ significant items comprise Glencore’s share of significant charges relating to impairments and other items booked directly by various associates, notably Trevali
($36 million) and HG Storage ($20 million). 4 Represents the required adjustment to eliminate unrealised profit or losses arising on inter-segment transactions, i.e. before ultimate sale to a third party. For Glencore, such
adjustments arise on the sale of product, in the ordinary course of business, from its Industrial to Marketing operations. Management assesses segment performance prior to any such adjustments, as if the sales were to third parties.

NOTES TO THE FINANCIAL STATEMENTS continued
Glencore Preliminary Results 2021 50
2. Segment information continued
2021 Marketing activities
Industrial activities
Corporate and other
US$ million Total Current assets 38,080 15,134 – 53,214 Current liabilities (33,553) (7,288) – (40,841) Allocatable current capital employed 4,527 7,846 – 12,373 Property, plant and equipment 961 42,198 – 43,159 Intangible assets 5,149 1,086 – 6,235 Investments in associates and other investments 5,565 8,349 – 13,914 Non-current advances and loans 1,943 1,584 – 3,527 Inventories 5 657 – 662 Allocatable non-current capital employed 13,623 53,874 – 67,497 Other assets1 6,799 6,799 Other liabilities2 (49,752) (49,752) Total net assets 18,150 61,720 (42,953) 36,917 Capital expenditure Metals and minerals 145 3,573 – 3,718 Energy products 656 819 – 1,475 Corporate and other – 31 – 31 Capital expenditure - segmental 801 4,423 – 5,224 Proportionate adjustment – capital expenditure3 – (516) – (516) Capital expenditure - reported measure4 801 3,907 – 4,708
2020 Marketing activities
Industrial activities
Corporate and other
US$ million Total Current assets 27,273 13,395 – 40,668 Current liabilities (23,906) (7,098) – (31,004) Allocatable current capital employed 3,367 6,297 – 9,664 Property, plant and equipment 978 46,132 – 47,110 Intangible assets 5,188 1,279 – 6,467 Investments in associates and other investments 5,708 8,425 – 14,133 Non-current advances and loans 1,733 1,309 – 3,042 Inventories – 678 – 678 Allocatable non-current capital employed 13,607 57,823 – 71,430 Other assets1 5,902 5,902 Other liabilities2 (52,594) (52,594) Total net assets 16,974 64,120 (46,692) 34,402 Capital expenditure Metals and minerals 68 3,023 – 3,091 Energy products 420 1,031 – 1,451 Corporate and other – 28 – 28 Capital expenditure - segmental 488 4,082 – 4,570 Proportionate adjustment – capital expenditure3 – (426) – (426) Capital expenditure – reported measure4 488 3,656 – 4,144
1 Other assets include non-current financial assets, deferred tax assets, cash and cash equivalents and assets held for sale. 2 Other liabilities include borrowings, non-current deferred income, deferred tax liabilities, non-current provisions, non-current post-retirement and other employee benefits, non-
current financial liabilities and liabilities held for sale. 3 Refer to APMs section for definition. 4 Includes $1,006 million (2020: $575 million), comprising $648 million (2020: $415 million) in Marketing activities and $358 million (2020: $160 million) in Industrial activities, of ‘right-of-use
assets’ capitalised in accordance with IFRS 16 – Leases.

NOTES TO THE FINANCIAL STATEMENTS continued
Glencore Preliminary Results 2021 51
2. Segment information continued
GEOGRAPHICAL INFORMATION
US$ million 2021 2020 Revenue from third parties1 The Americas 37,930 25,762 Europe 64,284 42,682 Asia 86,576 60,360 Africa 9,991 6,701 Oceania 4,970 6,833 203,751 142,338 Non-current assets2 The Americas 16,963 17,347 Europe 11,152 11,051 Asia 4,683 4,802 Africa 12,389 13,798 Oceania 17,163 19,657 62,350 66,655
1 Revenue by geographical destination is based on the country of incorporation of the sales counterparty, however this may not necessarily be the country of the counterparty’s ultimate parent and/or final destination of product.
2 Non-current assets are non-current assets excluding other investments, advances and loans, other financial assets and deferred tax assets. Non-current assets comprise assets in Australia of $16,714 million (2020: $18,047 million), in Peru of $7,243 million (2020: $7,271 million) and the DRC of $6,555 million (2020: $6,849 million).
3. Revenue
US$ million 2021 2020 Sale of commodities 201,113 139,486 Freight, storage and other services 2,638 2,852 Total 203,751 142,338
Revenue is derived principally from the sale of commodities, recognised once control of the goods has transferred from Glencore to the buyer. Revenue from sale of commodities includes $710 million (2020: $1,217 million) of mark-to-market related adjustments on provisionally priced sales arrangements. Revenue derived from freight, storage and other services is recognised over time as the service is rendered. Revenue is measured based on consideration specified in the contract with the customer and is presented net of amounts prepaid as incentives and/or rebates paid to customers, and excludes amounts collected on behalf of third parties. This is consistent with the revenue information disclosed for each reportable segment (see note 2).
4. Loss on disposals of non-current assets
US$ million Notes 2021 2020 Derecognition of non-controlling interest on disposal of Mopani 26 (1,022) – Gain on sale of Chemoil Terminals 26 110 – Net gain on sale of other investments/operations 98 9 Gain/(loss) on disposal of property, plant and equipment 207 (45) Total (607) (36)
DISPOSAL OF MOPANI On 31 March 2021, Glencore completed the disposal of its 90% interest in Mopani to ZCCM Investments Holdings plc. The net loss on disposal reflects the derecognition to the statement of income of the previously recognised book value of the non-controlling interest equity balance, which largely related to the non-controlling interests’ share of historical impairments and losses, and net liabilities in Mopani (see note 26).
DISPOSAL OF CHEMOIL TERMINALS On 17 December 2021, Glencore completed the disposal of its 100% interest in Chemoil Terminals LLC, which owns the Long Beach and Carson oil products storage terminals in California, resulting in a gain of $110 million (see note 26).

NOTES TO THE FINANCIAL STATEMENTS continued
Glencore Preliminary Results 2021 52
5. Other income/(expense) – net
US$ million Notes 2021 2020
Net changes in mark-to-market valuations on investments 64 438 Release of onerous contract provision 22 122 – Total other income 186 438 Net foreign exchange losses (187) (192) Legal and regulatory proceedings (1,640) (113) Closed site rehabilitation costs (177) (80) Closure and severance costs – (214) Other expenses – net (129) (12) Total other expenses (2,133) (611) Total other (expense)/income - net (1,947) (173)
Together with foreign exchange movements and mark-to-market movements on investments, other net income/(expense) includes other items that, due to their nature and variable financial impact or infrequency of the events giving rise to these items, are reported separately from operating segment results.
NET CHANGES IN MARK-TO-MARKET VALUATIONS ON INVESTMENTS Primarily relates to movements on interests in investments (see note 11), the ARM Coal non-discretionary dividend obligation (see note 29) and deferred consideration related to Mototolo stake sale in 2018 (see notes 12 and 14), all carried at fair value.
LEGAL AND REGULATORY PROCEEDINGS Comprises various investigations (legal, expert and compliance) related costs and a provision for the on-going investigations of $1,584 million (2020: $95 million)(see notes 23 and 31).
In 2020, a dispute with the Strategic Fuel Fund Association of South Africa was settled, resulting in an expense of $18 million.
CLOSED SITE REHABILITATION COSTS Comprises movements in restoration, rehabilitation and decommissioning estimates related to sites that are no longer operational (see note 23).
CLOSURE AND SEVERANCE RELATED COSTS In 2020, closure and severance related costs were primarily incurred in respect of the suspension of operations at Prodeco coal in Colombia ($147 million), the Aguilar zinc mine in Argentina ($43 million) and the Lydenburg chrome smelter in South Africa ($24 million).
6. Interest income/(expense) – net
US$ million Notes 2021 2020 Bank deposits and other financial assets 110 101 Accretion on certain advances repayable with product 12 90 – Loans to associates 8 19 Interest income 208 120 Capital market notes (733) (889) Revolving credit facilities (55) (102) Post-retirement employee benefits 24 (23) (26) Deferred income 22 (115) (127) Lease liabilities 9 (98) (96) Restoration and rehabilitation 23 (153) (144) Other provisions 23 (33) (45) Bank loans (93) (98) Less: capitalised interest 9 33 33 Other interest (78) (79) Interest expense (1,348) (1,573) Total interest income/(expense) - net (1,140) (1,453)

NOTES TO THE FINANCIAL STATEMENTS continued
Glencore Preliminary Results 2021 53
7. Impairments
US$ million Notes 2021 2020 Property, plant and equipment and intangible assets 9/10 (1,452) (5,508) Investments 11 (333) (96) Advances and loans - current and non-current 12/14 98 (343) VAT receivable - non-current (151) – Total impairments1 (1,838) (5,947)
1 Impairments recognised during the year are allocated to Glencore’s operating segments as follows: Marketing activities $270 million (2020: $228 million) and Industrial activities $1,568 million (2020: $5,719 million).
As part of a regular portfolio review, Glencore carries out an assessment of whether there are indicators of cash-generating unit (CGU) or asset impairments or whether a previously recorded impairment may no longer be required.
The recoverable amounts of the property, plant and equipment and intangible assets were measured based on fair value less costs of disposal (FVLCD), or in certain cases value in use (VIU). In particular, market pressures relating to investments in Coal mining operations has impacted the availability of an active market for acquiring such operations, and thus the recoverable amounts of our Coal CGUs have been measured using a VIU approach. The FVLCD or VIU of all CGUs are determined by discounted cash flow techniques based on the most recent approved financial budgets, underpinned and supported by the life of asset plans of the respective operations. The valuation models use a combination of internal sources and those inputs available to a market participant, which comprise the most recent reserve and resource estimates, relevant cost assumptions and where possible, market forecasts of commodity price and foreign exchange rate assumptions, discounted using operation specific post-tax real discount rates (unless otherwise indicated) ranging from 6.7% – 15.5% (2020: 6.1% – 13.5%). The valuations generally remain most sensitive to price and a deterioration / improvement in the pricing outlook may result in additional impairments/reversals. The determination of FVLCD used Level 3 valuation techniques for both years. In providing sensitivity analysis (and particularly on commodity price assumptions), a 10% change, representing a typical deviation parameter common in the industry, has been provided. Where a higher percentage is reasonably possible on an operational assumption, that has been clearly identified.
As a result of the regular impairment assessment, the following significant impairment charges were recognised:
2021 Property, plant and equipment and intangible assets • In H1 2021, Koniambo incurred failures at its power plant and suffered a slag leak in line 2 of its metallurgical plant, resulting in a
suspension of production. Extensive investigation into the cause of the leak ensued, following which it was determined to target lower throughput, revise certain grade and process recovery assumptions and increase the frequency of major maintenance shut-downs, with the intention of delivering more sustainable long-term operations. These revised changes in volume and cost assumptions and the emergence of higher discounts on non-battery application nickel relative to the LME nickel benchmark price, resulted in a reduction of Koniambo’s estimated recoverable value (Industrial activities segment) to $550 million and an impairment of $1,170 million. The valuation assumed a long-term realised nickel price of approximately $13,700/t and an operation specific discount rate of 9.8%. Further revisions to the operating plans are possible. A 10% reduction in either the long-term realised nickel price or life of mine production could result in the remaining carrying value being fully impaired. A 10% increase in variable operating costs could result in an additional impairment of $170 million. Conversely, a 10% increase in the long-term realised nickel price could result in an impairment reversal of $450 million.
• The balance of the impairment charges on property, plant and equipment (none of which were individually material) relate to specific assets where utilisation is no longer required or to projects no longer progressed due to changes in production and development plans. As a result, the full carrying amount of these assets/projects was impaired, with $282 million recognised in our Industrial activities segment.
Investments Primarily comprises an impairment charge of $331 million in respect of our 49% investment in HG Storage (Marketing activities segment), to an estimated recoverable value of $189 million following a review of the carrying value against valuation benchmarks. The valuation of this investment is not considered to be a significant source of estimation uncertainty as no change in assumptions reasonably possible within the next 12 months would materially affect the carrying value. 2020 primarily comprised an impairment charge in respect of our investment in Century Aluminum ($73 million).
Advances and loans – current and non-current In 2021, impairment reversals on advances and loans of $98 million (none of which were individually material) were recognised following an improvement in the underlying financial condition of various counterparties, with $63 million recognised in our Marketing activities segment and $35 million recognised in our Industrial activities segment. Of the total $98 million of impairment reversals, $67 million relate to financial assets and $31 million relate to non-financial assets.
VAT receivable – non-current As a result of continued challenge and non-performance by certain government authorities in settling long outstanding VAT claims, an impairment charge of $151 million was recognised in our Industrial activities segment.

NOTES TO THE FINANCIAL STATEMENTS continued
Glencore Preliminary Results 2021 54
7. Impairments continued
2020 Property, plant and equipment and intangible assets • Volcan is a listed zinc / silver mining entity in Peru, in which the Group acquired a 63% controlling (23% economic) interest at the
end of 2017 (Industrial activities segment). The operations primarily comprise two cash-generating units (Yauli and Chungar) and at the time of the acquisition, approximately one third of the value was ascribed to realising the future potential of various projects / resources. Due to the impact Covid-19 had on the long-term outlook of the global economy a review of the life of mine plan and related expansion projects was carried out in Q2 2020.
It was determined that the related risk / confidence levels in deploying capital to longer-term greenfield projects and the probability of approving development and realisation of these projects had reduced. This, along with the shift in long-term zinc pricing, led to an impairment of $2,347 million (and related deferred tax obligations of $716 million were released) to its estimated recoverable value of $1,503 million. The valuation assumed a long-term zinc and silver price of $2,400/t and $20.00/lb, respectively and an operation specific discount rate of 9.2%. As at 31 December 2020, had the zinc and silver price assumptions fallen by 10% (across the curve), a further impairment of $450 million would have been recognised. A 10% reduction in estimated annual production over the life of mine would have resulted in an additional impairment of $540 million.
• As a result of persistent operational challenges, further technical analysis resulting in a reduced life of mine forecast, delays in key development projects and cost increases owing to inflation, tax and other regulatory pressures, a decision was made, in Q2 2020, to place the Mopani copper operations in Zambia (Industrial activities segment) on care and maintenance subject to government approval. As a consequence of the operational, technical and cost factors, the Mopani operations were impaired by $1,041 million, to their estimated recoverable value of $861 million, including tax receivables. In January 2021, an agreement was reached to sell Mopani to ZCCM (see note 16).
• During H1 2020, pressure on the API 2 European coal market (primary price reference market for our Colombian coal operations) increased as European economies continue to shift to a decarbonised environment, exacerbated by the significant drop in oil and gas prices (supply and demand factors). A review of Prodeco’s operations determined that, in addition to a deteriorating market environment, there were increasing challenges with respect to obtaining several key approvals from government agencies and other key stakeholders. In Q2 2020, an application was therefore made to place Prodeco operations on extended care and maintenance until these conditions improve. In Q4, the application was rejected and it was subsequently decided to relinquish the mining licenses.
Consequently, the full carrying value of the mining operations related to such licenses ($835 million) (Industrial activities segment) were fully impaired (property, plant and equipment - $789 million and non-current advances and loans - $46 million).
• As noted above, oil prices were significantly impacted by demand destruction from Covid-19 and the lack of timely effective supply response from OPEC+ and the longer term outlook for oil prices also deteriorated due to updated expectations surrounding decarbonisation. In addition, Covid-19 disrupted and restricted international mobility, which had a particularly significant impact on our workforce arrangements in Chad, resulting in these fields being placed on care and maintenance in March. As a result, in Q2 2020, the Chad oil operations (Industrial activities segment) were impaired by $673 million to their estimated recoverable amount of $145 million. The valuation remained sensitive to Covid-19 related disruptions on international mobility and a timely restart of the operations in a safe and economic manner. Should such restart have been prolonged for an extended period of time, an additional future impairment could have resulted.
• In June 2020, it was determined to keep the Lydenburg chrome smelter (Industrial activities segment) on care and maintenance. This decision reflected the challenging operating and market environment across the South African ferrochrome industry, including unsustainably increasing electricity tariffs / supply interruption and other sources of real cost inflation. These macro factors outweigh the significant efforts made over the past years to make the operation more competitive, rendering its estimated fair value as negative. As a result, the entire carrying value of the Lydenburg smelter ($116 million) was impaired.
• The global macro-economic impact of Covid-19 on refined petroleum product demand and resulting global refinery overcapacity had a negative effect on refining margins. As a result, Astron (Industrial activities segment) lowered its long term through-the-cycle outlook on refining margins by approximately 30% and the Astron oil refinery was impaired by $480 million to its estimated recoverable amount of $1,015 million, including its related downstream supply business. The operation specific discount rate used in the valuation was a pre-tax nominal discount rate of 12.3%. The valuation remained most sensitive to refining margins and a deterioration in these assumptions could have resulted in additional impairments. As at 31 December 2020, had the margin assumptions fallen by $1/bbl (across the curve), a further $243 million of impairment would have been recognised. Had the discount rate increased by 1%, a further $88 million of impairment would have been recognised.
• The balance of the impairment charges on property, plant and equipment (none of which were individually material) relate to specific assets where utilisation is no longer required or to projects no longer progressed due to changes in production and development plans. As a result, the full carrying amount of these assets/projects was impaired, with $62 million recognised in our Industrial activities segment.
Advances and loans – current and non-current In 2020, loans of $103 million were impaired in full due to financial difficulties faced by one of the Group’s associates (Marketing activities segment). The balance of the impairment charges on advances and loans classified as non-financial instruments (none of which were individually material) were recognised in our Marketing activities segment ($125 million) and our Industrial activities segment ($115 million), following the restructuring of certain loans and physical advances due to various non-performance factors.

NOTES TO THE FINANCIAL STATEMENTS continued
Glencore Preliminary Results 2021 55
8. Income taxes
Income taxes consist of the following:
US$ million 2021 2020 Current income tax expense (2,923) (931) Adjustments in respect of prior year current income tax 158 88 Deferred income tax (expense)/credit (92) 2,005 Adjustments in respect of prior year deferred income tax (169) 8 Total tax (expense)/credit reported in the statement of income (3,026) 1,170 Deferred income tax (expense)/credit recognised directly in other comprehensive income (67) 6 Total tax (expense)/credit recognised directly in other comprehensive income (67) 6
The effective Group tax rate is different from the statutory Swiss income tax rate applicable to the Company for the following reasons:
US$ million 2021 2020 Income/(loss) before income taxes 7,375 (5,116) Less: Share of income from associates and joint ventures (2,618) (444) Parent Company’s and subsidiaries’ income/(loss) before income tax and attribution 4,757 (5,560) Income tax (expense)/credit calculated at the Swiss income tax rate of 12% (2020: 12%) (571) 667 Tax effects of: Different tax rates from the standard Swiss income tax rate (1,486) 1,572 Tax-exempt income ($207 million (2020: $206 million) from recurring items
232 210 and $25 million (2020: $4 million) from non-recurring items) Items not tax deductible ($987 million (2020: $589 million) from recurring items
(1,365) (869) and $378 million (2020: $280 million) from non-recurring items) Foreign exchange fluctuations 52 (76) Changes in tax rates 15 (9) Utilisation and changes in recognition of tax losses and temporary differences 101 (249) Tax losses not recognised 15 (169) Adjustments in respect of prior years (11) 96 Other (8) (3) Income tax (expense)/credit (3,026) 1,170
The non-tax deductible items of $1,365 million (2020: $869 million) primarily relate to financing costs, impairments and various other expenses.
The impact of tax-exempt income of $232 million (2020: $210 million) primarily relates to non-taxable intra-group dividends, income that is not effectively connected to the taxable jurisdiction, and various other items.
The tax impact of foreign exchange fluctuations relates to the foreign currency movements on deferred tax balances where the underlying tax balances are denominated in a currency different to the functional currency determined for accounting purposes.

NOTES TO THE FINANCIAL STATEMENTS continued
Glencore Preliminary Results 2021 56
8. Income taxes continued
DEFERRED TAXES Deferred taxes as at 31 December 2021 and 2020 are attributable to the items in the table below:
US$ million 2021
Recognised in the statement
of income
Recognised in other
comprehensive income
Business combination
and disposal of subsidiaries
Foreign currency
exchange movements Other 2020
Deferred tax assets1 Tax losses carried forward 1,418 (532) – – – (1) 1,951 Other 361 115 (10) – (2) (43) 301 Total 1,779 (417) (10) – (2) (44) 2,252 Deferred tax liabilities1 Depreciation and amortisation (4,156) (150) – 19 98 – (4,123) Mark-to-market valuations (127) 7 (6) – – – (128) Other (186) 299 (51) – (3) 39 (470) Total (4,469) 156 (57) 19 95 39 (4,721) Total Deferred tax - net (2,690) (261) (67) 19 93 (5) (2,469)
US$ million 2020
Recognised in the statement
of income
Recognised in other
comprehensive income
Business combination
and disposal of subsidiaries
Foreign currency
exchange movements Other 2019
Deferred tax assets1 Tax losses carried forward 1,951 741 – – (2) – 1,212 Other 301 33 3 – (13) 13 265 Total 2,252 774 3 – (15) 13 1,477 Deferred tax liabilities1 Depreciation and amortisation (4,123) 1,550 – – 75 (68) (5,680) Mark-to-market valuations (128) (56) – – (1) – (71) Other (470) (255) 3 – 3 122 (343) Total (4,721) 1,239 3 – 77 54 (6,094) Total Deferred tax - net (2,469) 2,013 6 – 62 67 (4,617)
1 Asset and liability positions in the same category reflect the impact of tax assets and liabilities arising in local tax jurisdictions that cannot be offset against tax assets and liabilities arising in other tax jurisdictions.
Deferred tax assets are net of $287 million (2020: $579 million) of uncertain tax liabilities related to tax estimation and judgement uncertainties with respect to various open tax disputes discussed below.
Deferred tax assets are recognised for tax losses carried forward only to the extent that realisation of the related tax benefit is probable. As at 31 December 2021, $2,016 million (2020: $2,998 million) of deferred tax assets related to available loss carry forwards have been brought to account, of which $1,418 million (2020: $1,951 million) are disclosed as deferred tax assets with the remaining balance being offset against deferred tax liabilities arising in the same tax entity. This balance is primarily comprised of:
• $629 million (2020: $843 million) in entities domiciled in the DRC;
• $482 million (2020: $658 million) in entities domiciled in Switzerland; and
• $238 million (2020: $365 million) in entities domiciled in the U.S.
In evaluating whether it is probable that taxable profits will be earned in future accounting periods prior to any tax loss expiry as may be the case, all available evidence was considered, including approved budgets, forecasts and business plans and, in certain cases, analysis of historical operating results. These forecasts are consistent with those prepared and used internally for business planning and impairment testing purposes. Following this evaluation, it was determined there would be sufficient taxable income generated to realise the benefit of the deferred tax assets. With the exception of the deferred tax assets raised in respect of the Group’s DRC operations (see below), no reasonably possible change in any of the key assumptions would result in a material reduction in forecast headroom of tax profits so that the recognised deferred tax asset would not be realised.

NOTES TO THE FINANCIAL STATEMENTS continued
Glencore Preliminary Results 2021 57
8. Income taxes continued
The recognised losses carried forward in the DRC primarily relate to historical development, ramp-up and financing related costs at KCC. The losses carried forward have an unlimited carry forward period, but are subject to annual utilisation limitation. Following KCC’s successful ramp-up of its operations to near name plate capacity, deferred taxation assets have been recognised for the full estimated available tax losses at 31 December 2021 as sufficient future taxable profits are expected to fully utilise the recognised carry forward tax losses. In recognising these deferred tax assets, consideration was given to the range of possible outcomes to determine the expected value of the tax losses available for future offset, including to what extent previously incurred tax losses would be available to offset future taxable profits. Any adverse challenge by the DRC tax authorities could materially impact the currently recognised tax losses and could result in a reversal of part or all of the recognised deferred tax assets.
The recognised losses carried forward in Switzerland primarily relate to non-recurring events. Based on the core business activities conducted in Switzerland and taxable income forecasts going forward, sufficient taxable profits are expected to fully utilise the recognised tax losses prior to expiration.
The recognised losses carried forward in the U.S. primarily relate to non-recurring events in 2011 and have a carry forward period of 20 years. The U.S. entities comprise our core U.S. marketing activities and based on taxable income forecasts going forward, sufficient taxable profits are expected to fully utilise the recognised tax losses prior to expiration.
INCOME TAX RECEIVABLE / PAYABLE
US$ million 2021 2020 Income tax receivable 364 444 Income tax payable (1,785) (927) Net income tax payable (1,421) (483)
INCOME TAX JUDGEMENTS AND UNCERTAIN TAX LIABILITIES Glencore assesses its liabilities and contingencies for all tax years open to audit based upon the latest information available. Inherent uncertainties exist in estimates of tax contingencies due to complexities of interpretation and changes in tax laws. For those matters where it is probable that an adjustment will be made, the Group records its reasoned estimate of these tax liabilities, including related interest charges. These current open tax matters are spread across numerous jurisdictions and consist primarily of legacy transfer pricing matters that have been open for a number of years and may take several more years to resolve. In recognising a provision for these taxation exposures, consideration was given to the range of possible outcomes to determine the Group’s best estimate of the amount to provide. As at 31 December 2021, the Group has recognised $880 million (2020: $1,189 million) of uncertain tax liabilities related to possible adverse outcomes of these open matters, of which, $287 million (2020: $579 million) has been recognised net of deferred tax assets, with the balance of $593 million (2020: $610 million) recognised as an income tax payable. The change in the total uncertain tax position during the year reflects the outcome of certain settlements and court rulings.
UK Tax Audit In previous periods, HMRC have issued formal transfer pricing, unallowable purposes and diverted profits tax assessments for the 2008-2018 tax years, amounting to $837 million. The Group has appealed against, and continues to vigorously contest, these assessments, following, over the years, various legal opinions received and detailed analysis conducted, supporting its positions and policies applied. Therefore, the Group has not fully provided for the amount assessed. The matter is now proceeding through the Mutual Agreement Process, pursuant to article 24 of the Switzerland – United Kingdom Income Tax Treaty 1977. Management does not anticipate a significant risk of material changes in estimates in this matter over the following 12 months.
DRC Tax Audit As a matter of course, various tax authorities in the DRC issue draft assessments adjusting revenue and denying costs and other items, along with customs related claims for alleged non-compliance or incorrect coding on certain filings. Upon receipt of such draft assessments, the Group engages with the tax authorities to defend its filing positions. As at 31 December 2021, there are various ongoing technical discussions, the ultimate outcome of which remains uncertain, and therefore there remains a risk that the outcome could materially impact the recognised balances within the next financial year. It is impractical to provide further sensitivity estimates of potential downside variances.
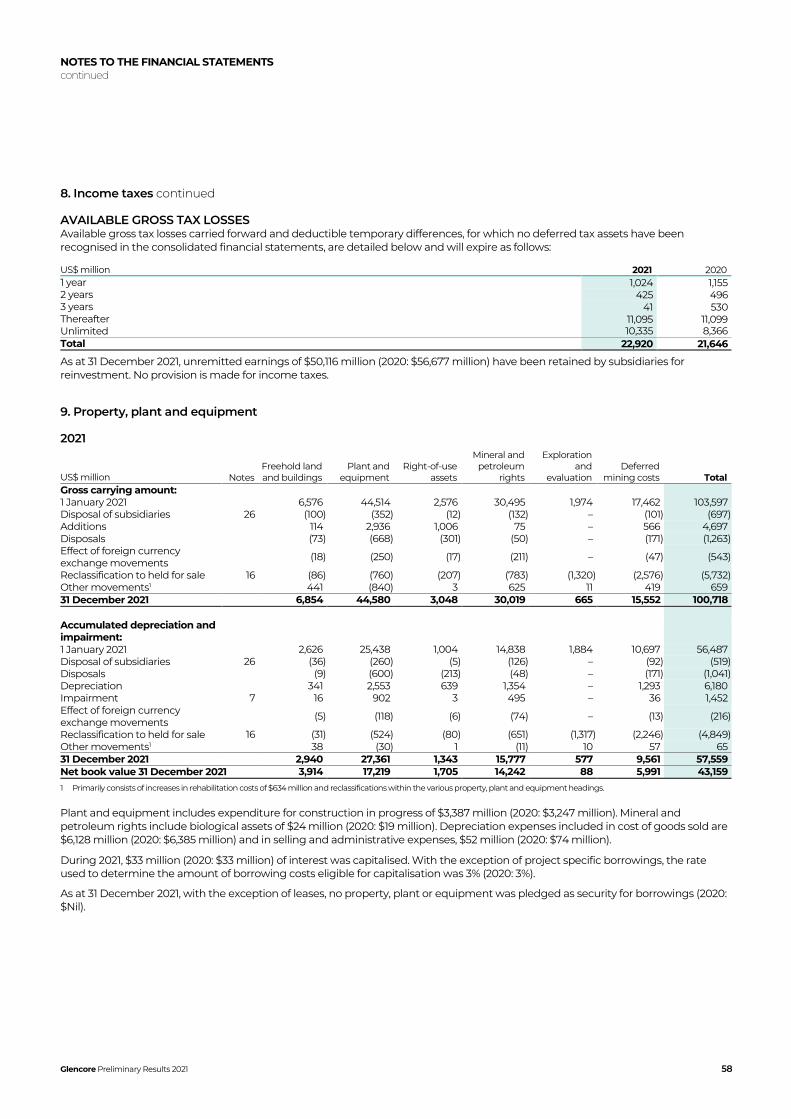
NOTES TO THE FINANCIAL STATEMENTS continued
Glencore Preliminary Results 2021 58
8. Income taxes continued
AVAILABLE GROSS TAX LOSSES Available gross tax losses carried forward and deductible temporary differences, for which no deferred tax assets have been recognised in the consolidated financial statements, are detailed below and will expire as follows:
US$ million 2021 2020 1 year 1,024 1,155 2 years 425 496 3 years 41 530 Thereafter 11,095 11,099 Unlimited 10,335 8,366 Total 22,920 21,646
As at 31 December 2021, unremitted earnings of $50,116 million (2020: $56,677 million) have been retained by subsidiaries for reinvestment. No provision is made for income taxes.
9. Property, plant and equipment
2021
US$ million Notes Freehold land and buildings
Plant and equipment
Right-of-use assets
Mineral and petroleum
rights
Exploration and
evaluation Deferred
mining costs Total Gross carrying amount: 1 January 2021 6,576 44,514 2,576 30,495 1,974 17,462 103,597 Disposal of subsidiaries 26 (100) (352) (12) (132) – (101) (697) Additions 114 2,936 1,006 75 – 566 4,697 Disposals (73) (668) (301) (50) – (171) (1,263) Effect of foreign currency exchange movements (18) (250) (17) (211) – (47) (543)
Reclassification to held for sale 16 (86) (760) (207) (783) (1,320) (2,576) (5,732) Other movements1 441 (840) 3 625 11 419 659 31 December 2021 6,854 44,580 3,048 30,019 665 15,552 100,718 Accumulated depreciation and impairment:
1 January 2021 2,626 25,438 1,004 14,838 1,884 10,697 56,487 Disposal of subsidiaries 26 (36) (260) (5) (126) – (92) (519) Disposals (9) (600) (213) (48) – (171) (1,041) Depreciation 341 2,553 639 1,354 – 1,293 6,180 Impairment 7 16 902 3 495 – 36 1,452 Effect of foreign currency exchange movements (5) (118) (6) (74) – (13) (216)
Reclassification to held for sale 16 (31) (524) (80) (651) (1,317) (2,246) (4,849) Other movements1 38 (30) 1 (11) 10 57 65 31 December 2021 2,940 27,361 1,343 15,777 577 9,561 57,559 Net book value 31 December 2021 3,914 17,219 1,705 14,242 88 5,991 43,159
1 Primarily consists of increases in rehabilitation costs of $634 million and reclassifications within the various property, plant and equipment headings.
Plant and equipment includes expenditure for construction in progress of $3,387 million (2020: $3,247 million). Mineral and petroleum rights include biological assets of $24 million (2020: $19 million). Depreciation expenses included in cost of goods sold are $6,128 million (2020: $6,385 million) and in selling and administrative expenses, $52 million (2020: $74 million).
During 2021, $33 million (2020: $33 million) of interest was capitalised. With the exception of project specific borrowings, the rate used to determine the amount of borrowing costs eligible for capitalisation was 3% (2020: 3%).
As at 31 December 2021, with the exception of leases, no property, plant or equipment was pledged as security for borrowings (2020: $Nil).
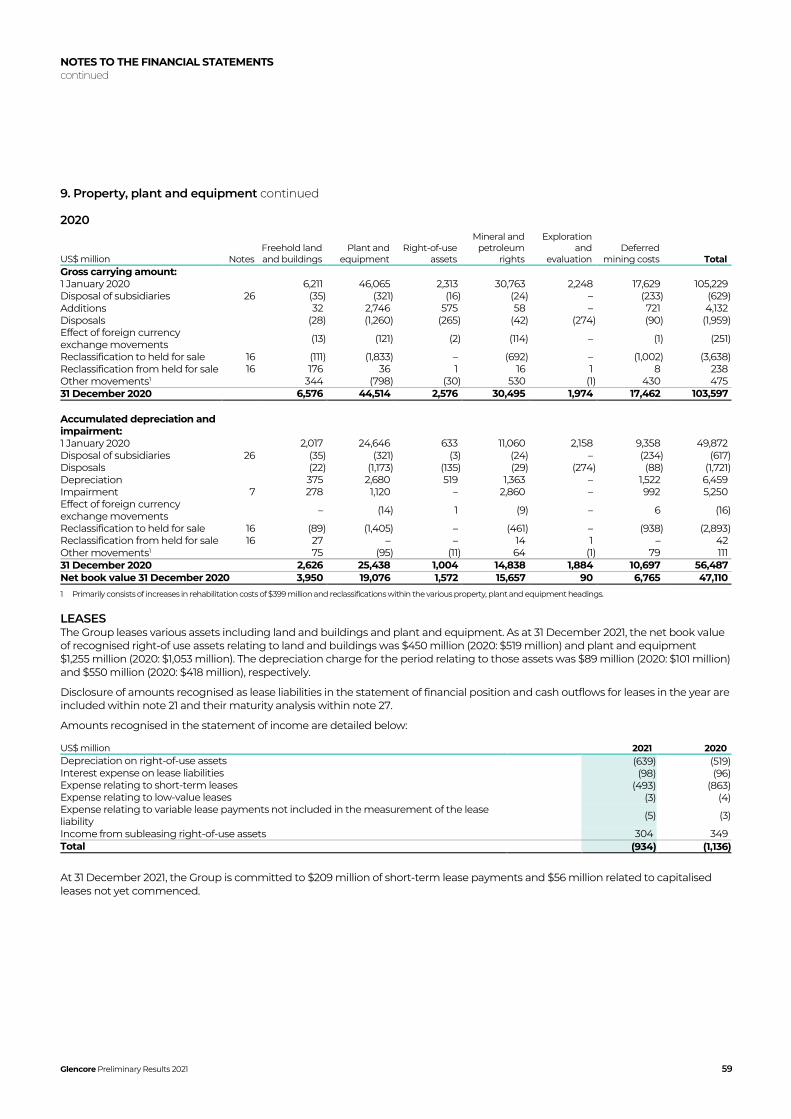
NOTES TO THE FINANCIAL STATEMENTS continued
Glencore Preliminary Results 2021 59
9. Property, plant and equipment continued
2020
US$ million Notes Freehold land and buildings
Plant and equipment
Right-of-use assets
Mineral and petroleum
rights
Exploration and
evaluation Deferred
mining costs Total Gross carrying amount: 1 January 2020 6,211 46,065 2,313 30,763 2,248 17,629 105,229 Disposal of subsidiaries 26 (35) (321) (16) (24) – (233) (629) Additions 32 2,746 575 58 – 721 4,132 Disposals (28) (1,260) (265) (42) (274) (90) (1,959) Effect of foreign currency exchange movements (13) (121) (2) (114) – (1) (251)
Reclassification to held for sale 16 (111) (1,833) – (692) – (1,002) (3,638) Reclassification from held for sale 16 176 36 1 16 1 8 238 Other movements1 344 (798) (30) 530 (1) 430 475 31 December 2020 6,576 44,514 2,576 30,495 1,974 17,462 103,597 Accumulated depreciation and impairment:
1 January 2020 2,017 24,646 633 11,060 2,158 9,358 49,872 Disposal of subsidiaries 26 (35) (321) (3) (24) – (234) (617) Disposals (22) (1,173) (135) (29) (274) (88) (1,721) Depreciation 375 2,680 519 1,363 – 1,522 6,459 Impairment 7 278 1,120 – 2,860 – 992 5,250 Effect of foreign currency exchange movements – (14) 1 (9) – 6 (16)
Reclassification to held for sale 16 (89) (1,405) – (461) – (938) (2,893) Reclassification from held for sale 16 27 – – 14 1 – 42 Other movements1 75 (95) (11) 64 (1) 79 111 31 December 2020 2,626 25,438 1,004 14,838 1,884 10,697 56,487 Net book value 31 December 2020 3,950 19,076 1,572 15,657 90 6,765 47,110
1 Primarily consists of increases in rehabilitation costs of $399 million and reclassifications within the various property, plant and equipment headings.
LEASES The Group leases various assets including land and buildings and plant and equipment. As at 31 December 2021, the net book value of recognised right-of use assets relating to land and buildings was $450 million (2020: $519 million) and plant and equipment $1,255 million (2020: $1,053 million). The depreciation charge for the period relating to those assets was $89 million (2020: $101 million) and $550 million (2020: $418 million), respectively.
Disclosure of amounts recognised as lease liabilities in the statement of financial position and cash outflows for leases in the year are included within note 21 and their maturity analysis within note 27.
Amounts recognised in the statement of income are detailed below:
US$ million 2021 2020 Depreciation on right-of-use assets (639) (519) Interest expense on lease liabilities (98) (96) Expense relating to short-term leases (493) (863) Expense relating to low-value leases (3) (4) Expense relating to variable lease payments not included in the measurement of the lease liability (5) (3)
Income from subleasing right-of-use assets 304 349 Total (934) (1,136)
At 31 December 2021, the Group is committed to $209 million of short-term lease payments and $56 million related to capitalised leases not yet commenced.

NOTES TO THE FINANCIAL STATEMENTS continued
Glencore Preliminary Results 2021 60
10. Intangible assets
2021
US$ million Notes Goodwill Port allocation
rights
Licences, trademarks
and software
Customer relationships
and other Total Cost: 1 January 2021 13,293 1,312 585 693 15,883 Additions – – 4 7 11 Disposals – – (33) (3) (36) Effect of foreign currency exchange movements – (109) (6) (12) (127) Reclassification to held for sale 16 – – (19) (5) (24) Other movements – – 30 (11) 19 31 December 2021 13,293 1,203 561 669 15,726 Accumulated amortisation and impairment: 1 January 2021 8,293 247 342 534 9,416 Disposals – – (22) (3) (25) Amortisation expense1 – 89 37 29 155 Effect of foreign currency exchange movements – (28) (2) (5) (35) Reclassification to held for sale 16 – – (16) (4) (20) Other movements – – 2 (2) – 31 December 2021 8,293 308 341 549 9,491 Net book value 31 December 2021 5,000 895 220 120 6,235
1 Recognised in cost of goods sold.
2020
US$ million Notes Goodwill Port allocation
rights
Licences, trademarks
and software
Customer relationships
and other Total Cost: 1 January 2020 13,293 1,374 596 720 15,983 Additions – – 5 7 12 Disposals – – (16) (9) (25) Effect of foreign currency exchange movements – (62) (18) (41) (121) Other movements – – 18 16 34 31 December 2020 13,293 1,312 585 693 15,883 Accumulated amortisation and impairment: 1 January 2020 8,293 198 315 171 8,977 Disposals – – (16) (9) (25) Amortisation expense1 – 52 44 116 212 Impairment 7 – – 5 253 258 Effect of foreign currency exchange movements – (3) (1) (7) (11) Other movements – – (5) 10 5 31 December 2020 8,293 247 342 534 9,416 Net book value 31 December 2020 5,000 1,065 243 159 6,467
1 Recognised in cost of goods sold.

NOTES TO THE FINANCIAL STATEMENTS continued
Glencore Preliminary Results 2021 61
10. Intangible assets continued
GOODWILL The carrying amount of goodwill has been allocated to cash-generating units (CGUs), or groups of CGUs as follows:
US$ million 2021 2020 Metals and minerals marketing business 3,326 3,326 Coal marketing business 1,674 1,674 Total 5,000 5,000
METALS AND MINERALS AND COAL MARKETING BUSINESSES Goodwill of $3,326 million and $1,674 million was recognised in connection with previous business combinations and was allocated to the metals and minerals marketing and coal marketing CGUs respectively, based on the annual synergies expected to accrue to the respective marketing departments as a result of increased volumes, blending opportunities and freight and logistics arbitrage opportunities.
PORT ALLOCATION RIGHTS Port allocation rights represent contractual entitlements to export certain amounts of coal on an annual basis from Richards Bay Coal Terminal in South Africa recognised as part of previous business combinations. The rights are amortised on a units of productions basis.
LICENCES, TRADEMARKS AND SOFTWARE Intangibles related to internally developed technology and patents were recognised in previous business combinations and are amortised over the estimated economic life of the technology which ranges between 3 – 20 years.
CUSTOMER RELATIONSHIPS Customer relationships mainly represent intangible assets related to long-standing customer relationships recognised in previous business combinations. These intangible assets are being amortised on a straight-line basis over their estimated economic life which ranges between 5 – 9 years.
GOODWILL IMPAIRMENT TESTING Given the nature of each CGU’s activities, information on its fair value is usually difficult to obtain unless negotiations with potential purchasers or similar transactions are taking place. Consequently:
• The recoverable amount for each of the marketing CGUs is determined by reference to the FVLCD which utilises a price to earnings multiple approach based on the 2022 approved financial budget which includes factors such as marketing volumes handled and operating, interest and income tax charges, generally based on past experience. The price to earnings multiple of 12 times (2020: 15 times) is derived from observable market data for broadly comparable businesses; and
• Glencore believes that no reasonably possible changes in any of the above key assumptions would cause the recoverable amount to fall below the carrying value of the CGU over the next 12 months. The determination of FVLCD for each of the marketing CGUs used Level 3 valuation techniques in both years.

NOTES TO THE FINANCIAL STATEMENTS continued
Glencore Preliminary Results 2021 62
11. Investments in associates, joint ventures and other investments
INVESTMENTS IN ASSOCIATES AND JOINT VENTURES
US$ million Notes 2021 2020
1 January 12,400 12,984 Additions 53 102 Disposals (2) (14) Share of income from associates and joint ventures 2,618 444 Share of other comprehensive loss from associates and joint ventures (58) (14) Impairments 7 (333) (96) Dividends received (2,375) (1,015) Reclassification to held for sale 16 (11) – Other movements 2 9 31 December 12,294 12,400 Of which: Investments in associates 5,567 6,038 Investments in joint ventures 6,727 6,362
As at 31 December 2021, the carrying value of our listed associates is $406 million (2020: $508 million), mainly comprising Century Aluminum and PT CITA, which have carrying values of $165 million (2020: $261 million) and $177 million (2020: $170 million), respectively. The fair value of our listed associates, using published price quotations (a Level 1 fair value measurement) is $967 million (2020: $737 million). As at 31 December 2021, Glencore’s investment in Century Aluminum was pledged under a loan facility, with proceeds received and recognised in current borrowings of $120 million (2020: $100 million)(see note 21).
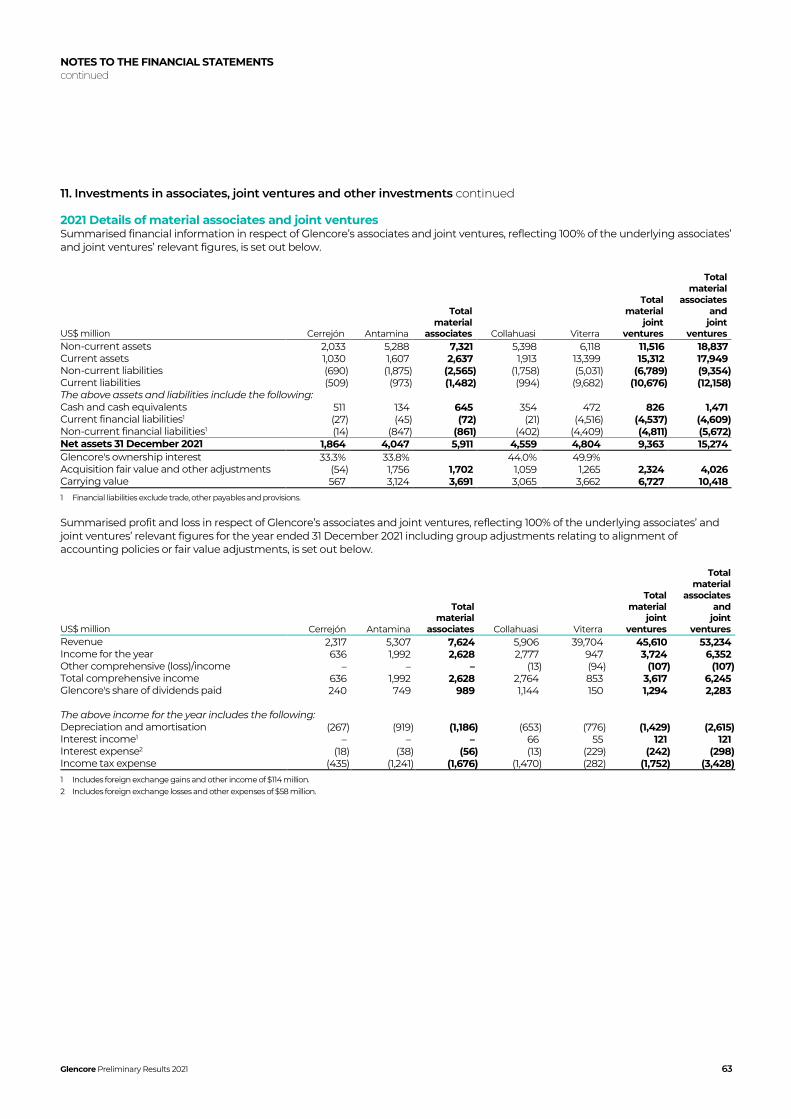
NOTES TO THE FINANCIAL STATEMENTS continued
Glencore Preliminary Results 2021 63
11. Investments in associates, joint ventures and other investments continued
2021 Details of material associates and joint ventures Summarised financial information in respect of Glencore’s associates and joint ventures, reflecting 100% of the underlying associates’ and joint ventures’ relevant figures, is set out below.
US$ million Cerrejón Antamina
Total material
associates Collahuasi Viterra
Total material
joint ventures
Total material
associates and
joint ventures
Non-current assets 2,033 5,288 7,321 5,398 6,118 11,516 18,837 Current assets 1,030 1,607 2,637 1,913 13,399 15,312 17,949 Non-current liabilities (690) (1,875) (2,565) (1,758) (5,031) (6,789) (9,354) Current liabilities (509) (973) (1,482) (994) (9,682) (10,676) (12,158) The above assets and liabilities include the following: Cash and cash equivalents 511 134 645 354 472 826 1,471 Current financial liabilities1 (27) (45) (72) (21) (4,516) (4,537) (4,609) Non-current financial liabilities1 (14) (847) (861) (402) (4,409) (4,811) (5,672) Net assets 31 December 2021 1,864 4,047 5,911 4,559 4,804 9,363 15,274 Glencore's ownership interest 33.3% 33.8% 44.0% 49.9% Acquisition fair value and other adjustments (54) 1,756 1,702 1,059 1,265 2,324 4,026 Carrying value 567 3,124 3,691 3,065 3,662 6,727 10,418
1 Financial liabilities exclude trade, other payables and provisions.
Summarised profit and loss in respect of Glencore’s associates and joint ventures, reflecting 100% of the underlying associates’ and joint ventures’ relevant figures for the year ended 31 December 2021 including group adjustments relating to alignment of accounting policies or fair value adjustments, is set out below.
US$ million Cerrejón Antamina
Total material
associates Collahuasi Viterra
Total material
joint ventures
Total material
associates and
joint ventures
Revenue 2,317 5,307 7,624 5,906 39,704 45,610 53,234 Income for the year 636 1,992 2,628 2,777 947 3,724 6,352 Other comprehensive (loss)/income – – – (13) (94) (107) (107) Total comprehensive income 636 1,992 2,628 2,764 853 3,617 6,245 Glencore's share of dividends paid 240 749 989 1,144 150 1,294 2,283 The above income for the year includes the following: Depreciation and amortisation (267) (919) (1,186) (653) (776) (1,429) (2,615) Interest income1 – – – 66 55 121 121 Interest expense2 (18) (38) (56) (13) (229) (242) (298) Income tax expense (435) (1,241) (1,676) (1,470) (282) (1,752) (3,428)
1 Includes foreign exchange gains and other income of $114 million. 2 Includes foreign exchange losses and other expenses of $58 million.
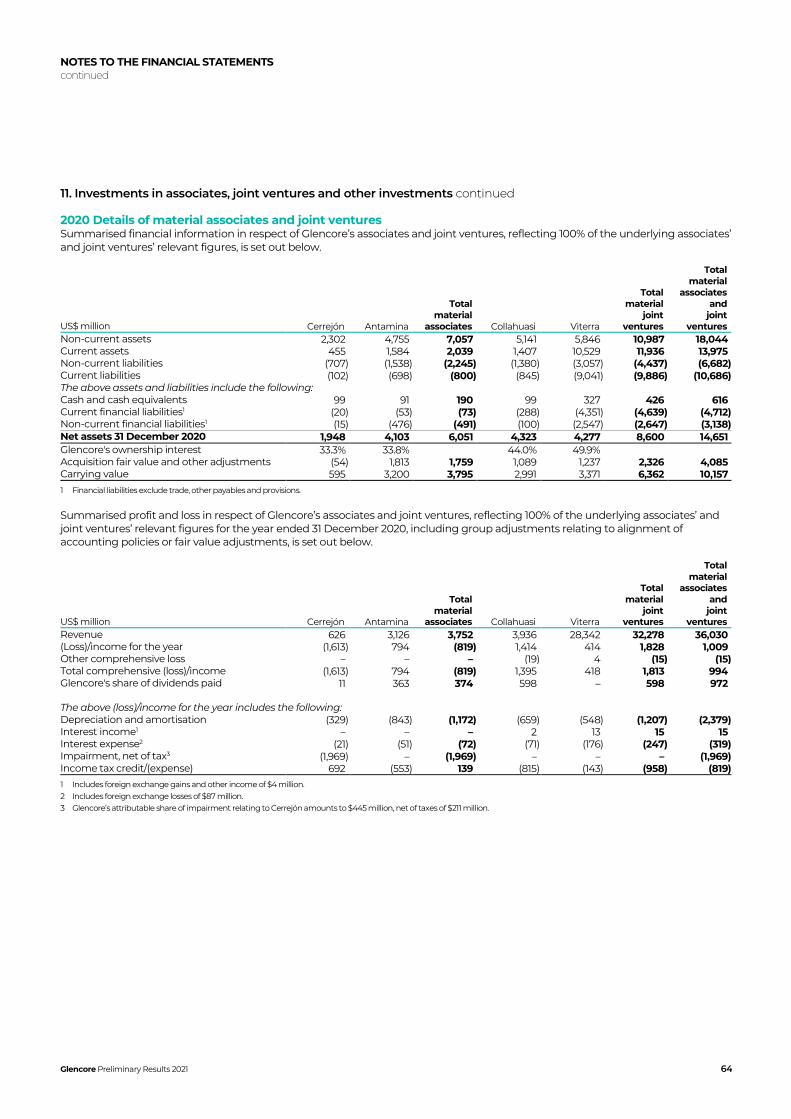
NOTES TO THE FINANCIAL STATEMENTS continued
Glencore Preliminary Results 2021 64
11. Investments in associates, joint ventures and other investments continued
2020 Details of material associates and joint ventures Summarised financial information in respect of Glencore’s associates and joint ventures, reflecting 100% of the underlying associates’ and joint ventures’ relevant figures, is set out below.
US$ million Cerrejón Antamina
Total material
associates Collahuasi Viterra
Total material
joint ventures
Total material
associates and
joint ventures
Non-current assets 2,302 4,755 7,057 5,141 5,846 10,987 18,044 Current assets 455 1,584 2,039 1,407 10,529 11,936 13,975 Non-current liabilities (707) (1,538) (2,245) (1,380) (3,057) (4,437) (6,682) Current liabilities (102) (698) (800) (845) (9,041) (9,886) (10,686) The above assets and liabilities include the following: Cash and cash equivalents 99 91 190 99 327 426 616 Current financial liabilities1 (20) (53) (73) (288) (4,351) (4,639) (4,712) Non-current financial liabilities1 (15) (476) (491) (100) (2,547) (2,647) (3,138) Net assets 31 December 2020 1,948 4,103 6,051 4,323 4,277 8,600 14,651 Glencore's ownership interest 33.3% 33.8% 44.0% 49.9% Acquisition fair value and other adjustments (54) 1,813 1,759 1,089 1,237 2,326 4,085 Carrying value 595 3,200 3,795 2,991 3,371 6,362 10,157
1 Financial liabilities exclude trade, other payables and provisions.
Summarised profit and loss in respect of Glencore’s associates and joint ventures, reflecting 100% of the underlying associates’ and joint ventures’ relevant figures for the year ended 31 December 2020, including group adjustments relating to alignment of accounting policies or fair value adjustments, is set out below.
US$ million Cerrejón Antamina
Total material
associates Collahuasi Viterra
Total material
joint ventures
Total material
associates and
joint ventures
Revenue 626 3,126 3,752 3,936 28,342 32,278 36,030 (Loss)/income for the year (1,613) 794 (819) 1,414 414 1,828 1,009 Other comprehensive loss – – – (19) 4 (15) (15) Total comprehensive (loss)/income (1,613) 794 (819) 1,395 418 1,813 994 Glencore's share of dividends paid 11 363 374 598 – 598 972 The above (loss)/income for the year includes the following: Depreciation and amortisation (329) (843) (1,172) (659) (548) (1,207) (2,379) Interest income1 – – – 2 13 15 15 Interest expense2 (21) (51) (72) (71) (176) (247) (319) Impairment, net of tax3 (1,969) – (1,969) – – – (1,969) Income tax credit/(expense) 692 (553) 139 (815) (143) (958) (819)
1 Includes foreign exchange gains and other income of $4 million. 2 Includes foreign exchange losses of $87 million. 3 Glencore’s attributable share of impairment relating to Cerrejón amounts to $445 million, net of taxes of $211 million.

NOTES TO THE FINANCIAL STATEMENTS continued
Glencore Preliminary Results 2021 65
11. Investments in associates, joint ventures and other investments continued
Aggregate information of associates that are not individually material:
US$ million 2021 2020 The Group's share of income/(loss) 38 (120) The Group's share of other comprehensive loss (5) (8) The Group's share of total comprehensive income/(loss) 33 (128) Aggregate carrying value of the Group's interests 1,876 2,243
The amount of corporate guarantees in favour of associates and joint ventures as at 31 December 2021 was $611 million (2020: $560 million). No amounts have been claimed or provided as at 31 December 2021. Glencore’s share of joint ventures’ capital commitments amounts to $213 million (2020: $105 million).
OTHER INVESTMENTS
US$ million 2021 2020 Fair value through other comprehensive income1 EN+ GROUP PLC 789 701 OAO NK Russneft2 50 309 Yancoal 160 164 OSJC Rosneft 485 357 Other 136 116 1,620 1,647 Fair value through profit and loss Century Aluminum Company cash-settled equity swaps3 – 49 Champion Iron Ore Limited share warrants3 – 37 – 86 Total 1,620 1,733
1 Fair value through other comprehensive income includes net acquisitions of $25 million (2020: $12 million net disposals) for the period. 2 In December 2021, Glencore agreed to the sale of its interest in OAO NK Russneft. Completion of the sale is conditional on receipt of certain regulatory approvals and is expected to
occur in H1 2022. Glencore’s investment in OAO NK Russneft is pledged under a loan facility issued to OAO NK Russneft. 3 During the year, the swaps settled and the warrants were exercised.
During the year, dividend income from equity investments designated as at fair value through other comprehensive income amounted to $23 million (2020: $32 million).

NOTES TO THE FINANCIAL STATEMENTS continued
Glencore Preliminary Results 2021 66
12. Advances and loans
US$ million Notes 2021 2020 Financial assets at amortised cost Loans to associates 128 246 Other non-current receivables and loans 519 600 Rehabilitation trust fund 148 148 Financial assets at fair value through profit and loss Other non-current receivables and loans 28 28 102 Deferred consideration 28 135 302 Non-financial instruments Pension surpluses 24 125 40 Advances repayable with product1 1,673 1,334 Land rights prepayment 150 150 Other tax and related non-current receivables2 621 120 Total 3,527 3,042
1 Net of $1,074 million (2020: $1,534 million) provided by various banks, the repayment terms of which are contingent upon and connected to the future delivery of contractual production.
2 As a result of continued challenge and non-performance by certain government authorities in settling long outstanding VAT claims, certain VAT receivable balances amounting to $646 million were reclassified to non-current during the period (see note 7).
FINANCIAL ASSETS AT AMORTISED COST Loans to associates Loans to associates generally bear interest at applicable floating market rates plus a premium.
Other non-current receivables and loans Other non-current receivables and loans comprise the following:
US$ million 2021 2020 Secured financing arrangements 511 585 Other 8 15 Total 519 600
Various financing facilities, generally marketing related and secured against certain assets and/or payable from the future sale of production of the counterparty. The non-current receivables and loans are interest-bearing and on average are to be repaid over a three-year period.
Rehabilitation trust fund Glencore makes contributions to controlled funds established to meet the costs of its restoration and rehabilitation liabilities, primarily in South Africa. These funds are not available for the general purposes of the Group, and there is no present obligation to make any further contributions.
Loss allowances of financial assets at amortised cost The Group determines the expected credit loss of loans to associates and other non-current receivables and loans (at amortised cost) based on different scenarios of probability of default and expected loss applicable to each of the material underlying balances. Expected credit losses for these assets are measured as either 12-month expected credit losses, taking into account prior experience regarding probability of default adjusted for forward looking information, or as lifetime expected credit losses (when there is significant increase in credit risk or the asset is credit-impaired). The movement in loss allowance for financial assets classified at amortised cost is detailed below:

NOTES TO THE FINANCIAL STATEMENTS continued
Glencore Preliminary Results 2021 67
12. Advances and loans continued
US$ million
Loans to associates
Other non-current
receivables and loans 2021
Loans to associates
Other non-current
receivables and loans 2020
Gross carrying value 31 December 190 773 963 308 940 1,248 Of which:
12-month expected credit losses 31 529 560 156 626 782 Lifetime expected credit losses (credit impaired) 159 244 403 152 314 466
Loss allowances 1 January 62 340 402 31 355 386 Released during the period1 – (28) (28) – – – Charged during the period1 – 15 15 31 33 64 Utilised during the period – (48) (48) – (48) (48) Reclassifications – (25) (25) – – – 31 December 62 254 316 62 340 402 Of which:
12-month expected credit losses – 14 14 – 37 37 Lifetime expected credit losses (credit impaired) 62 240 302 62 303 365
Net carrying value 31 December 128 519 647 246 600 846
1 $22 million (2020: $45 million impairment) recognised as a reversal of impairment (see note 7) and the balancing charge of $9 million (2020: $19 million) recognised in cost of goods sold.
FINANCIAL ASSETS AT FAIR VALUE THROUGH PROFIT AND LOSS Other non-current receivables and loans During 2021, fair value movements of positive $35 million were recognised (2020: negative $18 million)(see note 7). Fair value was determined using a Level 3 discounted cash flow model technique, with the key unobservable inputs being a discount rate specific to the operation of 12% and a repayment profile dependent upon the underlying business plans and forecasts over the next 6 years. The valuation is sensitive to the timing of the underlying cash flows and could result in a $5 million reduction of fair value if the repayment schedule is extended by an additional 4 years.
Deferred consideration In 2021, fair value movements of net positive $39 million (2020: $379 million) were recognised (see note 5).
NON-FINANCIAL INSTRUMENTS Advances repayable with product
US$ million 2021 2020 Counterparty Mopani transaction debt 881 – Société Nationale d'Electricité (SNEL) power advances 304 312 Chad State National Oil Company 293 347 Société Nationale des Pétroles du Congo 129 156 Other1 66 519 Total 1,673 1,334
1 Comprises no individually material items.
Mopani On 31 March 2021, Glencore completed the disposal of its 90% interest in Mopani to ZCCM Investments Holdings plc, the holder of the remaining 10% interest in Mopani, in exchange for $1 and the rights to offtake copper and other metals from Mopani until $1.5 billion of existing intercompany debt (the “transaction debt”) has been repaid to Glencore. The transaction debt attracts interest at a floating benchmark rate plus 3%. The repayment of the transaction debt is in substance based on Glencore receiving physical product deliveries from Mopani through its offtake rights and retaining defined percentages of Mopani’s annual gross revenues until the transaction debt is fully repaid. On the date of completion, the fair value of the transaction debt was determined to be $838 million (see note 26). As at 31 December 2021, $904 million of debt is outstanding, of which $881 million is due after 12 months and is presented above and $23 million is due within 12 months and is included in Accounts receivable.
SNEL power advances In early 2012, a joint agreement with Société Nationale d’Électricité (SNEL), the Democratic Republic of the Congo’s (DRC) national electricity utility, was signed whereby Glencore’s operations would contribute $375 million to a major electricity infrastructure refurbishment programme, including transmission and distribution systems. This facilitated a progressive increase in power availability to 450 megawatts by the end of Q1 2020. Funding commenced in the second quarter of 2012 and completed Q4 2021. The loans are being repaid via discounts on electricity purchases.

NOTES TO THE FINANCIAL STATEMENTS continued
Glencore Preliminary Results 2021 68
12. Advances and loans continued
Chad State National Oil Company Glencore has provided a net $321 million (2020: $359 million) to the Chad State National Oil Company (SHT) to be repaid through future oil deliveries over ten years. As at 31 December 2021, the advance is net of $604 million (2020: $714 million) provided by a syndicate of lenders, the repayment terms of which are contingent upon and connected to the receipt of oil due from SHT under the prepayment. Of the net amount advanced, $293 million (2020: $347 million) is receivable after 12 months and is presented within Other non-current receivables and loans and $31 million (2020: $12 million) is due within 12 months and included within Accounts receivable.
Société Nationale des Pétroles du Congo (SNPC) Glencore has provided a net $156 million (2020: $156 million) to SNPC repayable through future oil deliveries over five years. As at 31 December 2021, the advance is net of $498 million (2020: $498 million) provided by the lenders, the repayment terms of which are contingent upon and connected to the future receipt of oil contractually due from SNPC. Of the net amount advanced, $129 million (2020: $156 million) is due after 12 months and is presented within Other long-term receivables and loans and $27 million (2020: $Nil) is due within 12 months and included within Accounts receivable.
Land rights prepayment In 2019, Kamoto Copper Company (“KCC”) entered into an agreement with La Générale des Carrières et des Mines (“Gécamines”), Glencore’s 25% joint venture partner in KCC, to acquire from Gécamines a comprehensive land package covering areas adjacent to KCC’s existing mining concessions for $250 million. The package includes multiple blocks for construction of a new long-term tailings facility and the possible exploitation of additional resources that will enhance KCC’s ability to more efficiently operate its mines, facilities and other key infrastructure requirements.
In addition to the above consideration, the agreement includes the following key additional undertakings:
• obligations on KCC to remove tailings (estimated at circa 15m dmt), currently in a sub-section of these areas, to another suitable location;
• contingent obligations to pay “Pas de Porte” payments to Gécamines if KCC declares a JORC compliant reserve or otherwise elects to mine any resources in the Resource Areas; and
• a new royalty to Gécamines of 2.5% of net sales from the acquired land areas if KCC elects to mine any resources in such areas.
In August 2020, KCC advanced $150 million to Gécamines as an agreed prepayment of the consideration due. If the closing conditions as prescribed in the agreement are not fulfilled, Glencore has the right to accrue interest on the prepaid amount, terminate the agreement and, if funds are not returned, offset against future amounts owing to Gécamines. The balance of the consideration is due 5 days after the respective closing conditions of each area to be transferred are satisfied.
13. Inventories
CURRENT INVENTORY Inventories of $28,434 million (2020: $22,852 million) comprise $16,073 million (2020: $12,260 million) of inventories carried at fair value less costs of disposal and $12,361 million (2020: $10,592 million) valued at the lower of cost or net realisable value. The amount of inventories and related ancillary costs recognised as an expense during the period was $177,704 million (2020: $124,037 million).
Fair value of inventories is a Level 2 fair value measurement (see note 29) using observable market prices obtained from exchanges, traded reference indices or market survey services adjusted for relevant location and quality differentials. There are no significant unobservable inputs in the fair value measurement of such inventories.
Glencore has a number of dedicated financing facilities, which finance a portion of its inventories. In each case, the inventory has not been derecognised as the Group has not transferred control. The proceeds received are recognised as current borrowings (see note 21). As at 31 December 2021, the total amount of inventory pledged under such facilities was $17 million (2020: $804 million). The proceeds received and recognised as current borrowings were $2 million (2020: $679 million) and $80 million (2020: $80 million) as non-current borrowings.
NON-CURRENT INVENTORY $662 million (2020: $678 million) of inventories valued at lower of cost or net realisable value are not expected to be utilised or sold within the normal operating cycle and are therefore classified as non-current inventory.

NOTES TO THE FINANCIAL STATEMENTS continued
Glencore Preliminary Results 2021 69
14. Accounts receivable
US$ million Notes 2021 2020 Financial assets at amortised cost Trade receivables 4,943 3,360 Margin calls paid 5,914 3,692 Receivables from associates 413 288 Other receivables1 402 356 Financial assets at fair value through profit and loss Trade receivables containing provisional pricing features 28 5,267 4,459 Finance lease receivable 28 2 9 Other receivables 28 79 – Deferred consideration 28 175 130 Non-financial instruments Advances repayable with product2 876 922 Other tax and related receivables 1,422 1,938 Total 19,493 15,154
1 Includes current portion of non-current loans receivable of $296 million (2020: $241 million). 2 Includes advances, net of $409 million (2020: $298 million) provided by banks, the repayment terms of which are contingent upon and connected to the future delivery of contractual
production over the next 12 months.
The average credit period on sales of goods is 16 days (2020: 24 days). The carrying value of trade receivables approximates fair value.
The Group applies a simplified approach to measure the loss allowance for trade receivables classified at amortised cost, using the lifetime expected loss provision. The expected credit loss on trade receivables is estimated using a provision matrix by reference to past default experience and credit rating, adjusted as appropriate for current observable data. Expected credit loss provisions are recognised in cost of goods sold and during the period, $11 million (2020: credit of $3 million) of such losses were recognised. The following table details the risk profile of trade receivables based on the Group’s provision matrix.
US$ million Trade receivables – days past due As at 31 December 2021 Not past due <30 31 – 60 61 – 90 >90 Total Gross carrying amount 4,034 287 157 152 337 4,967 Expected credit loss rate 0.27% 0.55% 0.82% 1.10% 2.33% Lifetime expected credit loss (11) (2) (1) (2) (8) (24) Total 4,023 285 156 150 329 4,943 US$ million Trade receivables – days past due As at 31 December 2020 Not past due <30 31 – 60 61 – 90 >90 Total Gross carrying amount 2,941 224 44 21 143 3,373 Expected credit loss rate 0.27% 0.54% 0.82% 1.09% 2.31% Lifetime expected credit loss (8) (1) (1) – (3) (13) Total 2,933 223 43 21 140 3,360
The Group determines the expected credit loss of receivables from associates and other receivables (at amortised cost) based on different scenarios of probability of default and expected loss applicable to each of the material underlying balances. Expected credit losses for these assets are measured as either 12-month expected credit losses, taking into account prior experience regarding probability of default adjusted for forward looking information, or as lifetime expected credit losses (when there is significant increase in credit risk or the asset is credit-impaired). The movement in allowance for credit loss relating to receivables from associates and other receivables is detailed below:
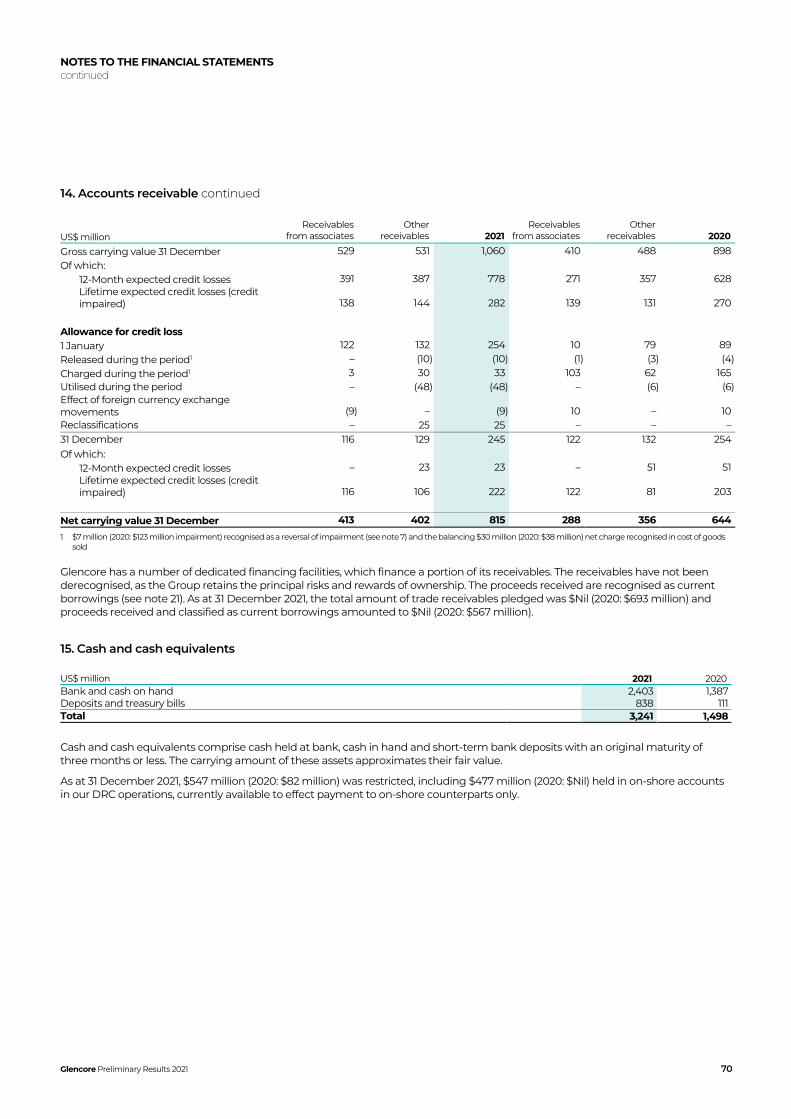
NOTES TO THE FINANCIAL STATEMENTS continued
Glencore Preliminary Results 2021 70
14. Accounts receivable continued
US$ million Receivables
from associates Other
receivables 2021 Receivables
from associates Other
receivables 2020
Gross carrying value 31 December 529 531 1,060 410 488 898 Of which:
12-Month expected credit losses 391 387 778 271 357 628 Lifetime expected credit losses (credit impaired) 138 144 282 139 131 270
Allowance for credit loss 1 January 122 132 254 10 79 89 Released during the period1 – (10) (10) (1) (3) (4) Charged during the period1 3 30 33 103 62 165 Utilised during the period – (48) (48) – (6) (6) Effect of foreign currency exchange movements (9) – (9) 10 – 10 Reclassifications – 25 25 – – – 31 December 116 129 245 122 132 254 Of which:
12-Month expected credit losses – 23 23 – 51 51 Lifetime expected credit losses (credit impaired) 116 106 222 122 81 203
Net carrying value 31 December 413 402 815 288 356 644
1 $7 million (2020: $123 million impairment) recognised as a reversal of impairment (see note 7) and the balancing $30 million (2020: $38 million) net charge recognised in cost of goods sold
Glencore has a number of dedicated financing facilities, which finance a portion of its receivables. The receivables have not been derecognised, as the Group retains the principal risks and rewards of ownership. The proceeds received are recognised as current borrowings (see note 21). As at 31 December 2021, the total amount of trade receivables pledged was $Nil (2020: $693 million) and proceeds received and classified as current borrowings amounted to $Nil (2020: $567 million).
15. Cash and cash equivalents
US$ million 2021 2020 Bank and cash on hand 2,403 1,387 Deposits and treasury bills 838 111 Total 3,241 1,498
Cash and cash equivalents comprise cash held at bank, cash in hand and short-term bank deposits with an original maturity of three months or less. The carrying amount of these assets approximates their fair value.
As at 31 December 2021, $547 million (2020: $82 million) was restricted, including $477 million (2020: $Nil) held in on-shore accounts in our DRC operations, currently available to effect payment to on-shore counterparts only.

NOTES TO THE FINANCIAL STATEMENTS continued
Glencore Preliminary Results 2021 71
16. Assets and liabilities held for sale
The carrying value of the assets and liabilities classified as held for sale are detailed below:
2021 2020
US$ million Ernest Henry Bolivia Access World E&P Chad Total Total
Mopani Non-current assets Property, plant and equipment 311 161 171 240 883 745 Intangible assets – 2 2 – 4 – Investments – – 11 – 11 – Advances and loans – – 10 – 10 5 Deferred tax assets 30 10 4 – 44 – 341 173 198 240 952 750 Current assets Inventories 16 36 – 22 74 187 Accounts receivable 26 82 93 14 215 106 Income tax receivable – – 1 – 1 – Prepaid expenses 2 – 10 – 12 3 Cash and cash equivalents 1 21 45 – 67 – 45 139 149 36 369 296 Total assets held for sale 386 312 347 276 1,321 1,046 Non-current liabilities Borrowings – (3) (111) – (114) – Deferred income (138) – – – (138) – Deferred tax liabilities – (4) (1) (4) (9) – Provisions (74) (29) (1) (85) (189) (54) Post-retirement and other employee benefits (1) (17) (1) – (19) (10) (213) (53) (114) (89) (469) (64) Current liabilities Borrowings – (7) (17) – (24) (26) Accounts payable (32) (55) (95) (6) (188) (58) Deferred income (53) – – – (53) – Provisions (1) (35) (3) – (39) (24) Income tax payable – (14) (1) – (15) (13) (86) (111) (116) (6) (319) (121) Total liabilities held for sale (299) (164) (230) (95) (788) (185) Non-controlling interest – – (2) – (2) – Total net assets held for sale 87 148 115 181 531 861
ERNEST HENRY In November 2021, Glencore agreed to dispose of its 100% interest in Ernest Henry Mining Pty Ltd, a copper-gold mine in Queensland, Australia for AUD $1 billion (c.US$720 million), comprising AUD $800 million on closing and the balance (AUD $200 million) due 12 months post closing. The transaction closed in January 2022 and a gain on disposal of some $630 million is expected.
BOLIVIA In October 2021, Glencore agreed to sell its Bolivian zinc assets (Sinchi Wayra and Illapa), to Santacruz Silver Mining Ltd, for approximately $110 million and a 1.5% NSR royalty over the life of the mines. $20 million is due on completion with the balance (c.$90 million) due over the following 4 years. The transaction is expected to close in H1 2022.
ACCESS WORLD At 31 December 2021, Glencore was in advanced negotiations with a prospective buyer to dispose of its 100% interest in the Access World Group, a global metals and softs commodities storage and logistics group, for $180 million. The share purchase agreement was subsequently signed on 31 January 2022, completion of the sale is conditional on receipt of certain regulatory approvals, which is expected to occur in 2022.
E&P CHAD In August 2021, Glencore agreed to dispose 100% of its Chad upstream oil operations to Perenco S.A.. Completion of the sale is conditional on receipt of certain regulatory approvals, which is expected to occur in H1 2022.
MOPANI In March 2021, Glencore completed the sale of its controlling interest in Mopani to the minority shareholder, ZCCM Investments Holding plc (ZCCM) for $1, leaving $1.5 billion of Glencore loans outstanding, where the pace and size of repayment instalments is linked to Mopani’s future production and copper prices (see notes 12 and 26).
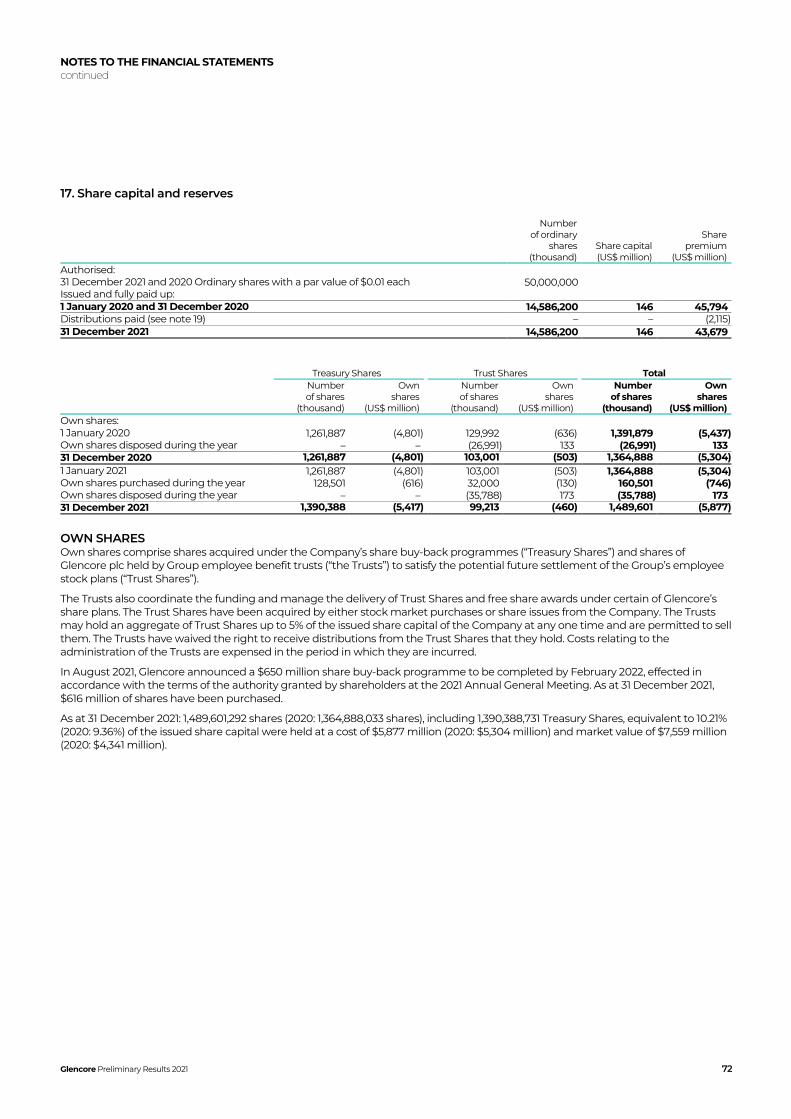
NOTES TO THE FINANCIAL STATEMENTS continued
Glencore Preliminary Results 2021 72
17. Share capital and reserves
Number of ordinary
shares (thousand)
Share capital (US$ million)
Share premium
(US$ million) Authorised: 31 December 2021 and 2020 Ordinary shares with a par value of $0.01 each 50,000,000 Issued and fully paid up: 1 January 2020 and 31 December 2020 14,586,200 146 45,794 Distributions paid (see note 19) – – (2,115) 31 December 2021 14,586,200 146 43,679
Treasury Shares Trust Shares Total
Number of shares
(thousand)
Own shares
(US$ million)
Number of shares
(thousand)
Own shares
(US$ million)
Number of shares
(thousand)
Own shares
(US$ million) Own shares: 1 January 2020 1,261,887 (4,801) 129,992 (636) 1,391,879 (5,437) Own shares disposed during the year – – (26,991) 133 (26,991) 133 31 December 2020 1,261,887 (4,801) 103,001 (503) 1,364,888 (5,304) 1 January 2021 1,261,887 (4,801) 103,001 (503) 1,364,888 (5,304) Own shares purchased during the year 128,501 (616) 32,000 (130) 160,501 (746) Own shares disposed during the year – – (35,788) 173 (35,788) 173 31 December 2021 1,390,388 (5,417) 99,213 (460) 1,489,601 (5,877)
OWN SHARES Own shares comprise shares acquired under the Company’s share buy-back programmes (“Treasury Shares”) and shares of Glencore plc held by Group employee benefit trusts (“the Trusts”) to satisfy the potential future settlement of the Group’s employee stock plans (“Trust Shares”).
The Trusts also coordinate the funding and manage the delivery of Trust Shares and free share awards under certain of Glencore’s share plans. The Trust Shares have been acquired by either stock market purchases or share issues from the Company. The Trusts may hold an aggregate of Trust Shares up to 5% of the issued share capital of the Company at any one time and are permitted to sell them. The Trusts have waived the right to receive distributions from the Trust Shares that they hold. Costs relating to the administration of the Trusts are expensed in the period in which they are incurred.
In August 2021, Glencore announced a $650 million share buy-back programme to be completed by February 2022, effected in accordance with the terms of the authority granted by shareholders at the 2021 Annual General Meeting. As at 31 December 2021, $616 million of shares have been purchased.
As at 31 December 2021: 1,489,601,292 shares (2020: 1,364,888,033 shares), including 1,390,388,731 Treasury Shares, equivalent to 10.21% (2020: 9.36%) of the issued share capital were held at a cost of $5,877 million (2020: $5,304 million) and market value of $7,559 million (2020: $4,341 million).

NOTES TO THE FINANCIAL STATEMENTS continued
Glencore Preliminary Results 2021 73
17. Share capital and reserves continued
OTHER RESERVES
US$ million
Foreign currency
translation reserve
Cash flow hedge reserve
Net unrealised gain/(loss)
Net ownership changes in
subsidiaries Total 1 January 2021 (2,832) (147) (266) (2,603) (5,848) Exchange loss on translation of foreign operations (66) – – – (66) Gain on cash flow hedges, net of tax – 23 – – 23 Loss on equity investments accounted for at fair value through other comprehensive income, net of tax – – (52) – (52)
Change in ownership interest in subsidiaries (see note 34) – – – (6) (6) Loss due to changes in credit risk on financial liabilities accounted for at fair value through profit and loss – – (7) – (7)
Reclassifications – – 25 – 25 31 December 2021 (2,898) (124) (300) (2,609) (5,931) 1 January 2020 (2,665) (97) 364 (2,573) (4,971) Exchange gain on translation of foreign operations (167) – – – (167) Loss on cash flow hedges, net of tax – (50) – – (50) Loss on equity investments accounted for at fair value through other comprehensive income, net of tax – – (631) – (631)
Change in ownership interest in subsidiaries (see note 34) – – – (31) (31) Gain due to changes in credit risk on financial liabilities accounted for at fair value through profit and loss – – 19 – 19
Reclassifications – – (18) 1 (17) 31 December 2020 (2,832) (147) (266) (2,603) (5,848)
The translation adjustment reserve is used to capture the cumulative impact of foreign currency translation adjustments arising from the Group’s non-USD denominated functional currency subsidiaries.
The cash flow hedge reserve is used to accumulate the gains and losses from the effective portion of hedging instruments contained within hedge relationships until the hedged item impacts profit or loss. Cost of hedging is recorded within the cash flow hedge reserve due to its immaterial amount.
The net unrealised gain/loss reserve is used to accumulate the gains and losses associated with the remeasurement of the Group’s investments carried at FVTOCI and changes in credit risk on financial liabilities measured at FVTPL.
The net ownership changes in subsidiaries reserve is used to capture equity movements arising from changes in the Group’s ownership in its subsidiaries.
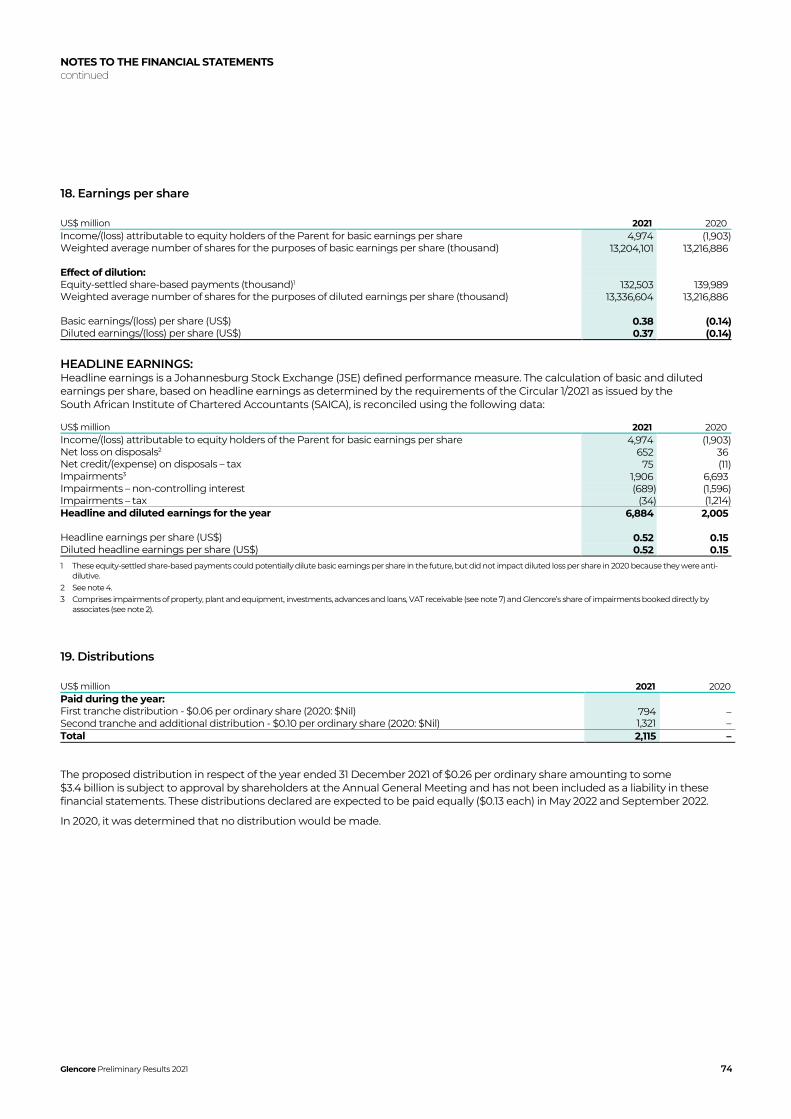
NOTES TO THE FINANCIAL STATEMENTS continued
Glencore Preliminary Results 2021 74
18. Earnings per share
US$ million 2021 2020 Income/(loss) attributable to equity holders of the Parent for basic earnings per share 4,974 (1,903) Weighted average number of shares for the purposes of basic earnings per share (thousand) 13,204,101 13,216,886 Effect of dilution: Equity-settled share-based payments (thousand)1 132,503 139,989 Weighted average number of shares for the purposes of diluted earnings per share (thousand) 13,336,604 13,216,886 Basic earnings/(loss) per share (US$) 0.38 (0.14) Diluted earnings/(loss) per share (US$) 0.37 (0.14)
HEADLINE EARNINGS: Headline earnings is a Johannesburg Stock Exchange (JSE) defined performance measure. The calculation of basic and diluted earnings per share, based on headline earnings as determined by the requirements of the Circular 1/2021 as issued by the South African Institute of Chartered Accountants (SAICA), is reconciled using the following data:
US$ million 2021 2020 Income/(loss) attributable to equity holders of the Parent for basic earnings per share 4,974 (1,903) Net loss on disposals2 652 36 Net credit/(expense) on disposals – tax 75 (11) Impairments3 1,906 6,693 Impairments – non-controlling interest (689) (1,596) Impairments – tax (34) (1,214) Headline and diluted earnings for the year 6,884 2,005 Headline earnings per share (US$) 0.52 0.15 Diluted headline earnings per share (US$) 0.52 0.15
1 These equity-settled share-based payments could potentially dilute basic earnings per share in the future, but did not impact diluted loss per share in 2020 because they were anti-dilutive.
2 See note 4. 3 Comprises impairments of property, plant and equipment, investments, advances and loans, VAT receivable (see note 7) and Glencore’s share of impairments booked directly by
associates (see note 2).
19. Distributions
US$ million 2021 2020 Paid during the year: First tranche distribution - $0.06 per ordinary share (2020: $Nil) 794 – Second tranche and additional distribution - $0.10 per ordinary share (2020: $Nil) 1,321 – Total 2,115 –
The proposed distribution in respect of the year ended 31 December 2021 of $0.26 per ordinary share amounting to some $3.4 billion is subject to approval by shareholders at the Annual General Meeting and has not been included as a liability in these financial statements. These distributions declared are expected to be paid equally ($0.13 each) in May 2022 and September 2022.
In 2020, it was determined that no distribution would be made.

NOTES TO THE FINANCIAL STATEMENTS continued
Glencore Preliminary Results 2021 75
20. Share-based payments
US$ million
Number of awards
granted (thousands)
Fair value at grant date
(US$ million)
Number of awards
outstanding 2021
(thousands)
Number of awards
outstanding 2020
(thousands)
Expense recognised
2021 (US$ million)
Expense recognised
2020 (US$ million)
Deferred awards 2018 Series 12,891 65 3,535 4,316 – – 2019 Series 10,791 37 667 7,914 – – 2020 Series 45,798 85 31,538 45,798 (18) 85 2021 Series 20,565 91 20,565 – 90 – 90,045 56,305 58,028 72 85 Performance share awards 2015 Series 79,787 109 – 9,509 2 – 2016 Series 23,984 84 – – – 3 2017 Series 19,750 95 400 5,965 1 10 2018 Series 28,499 104 9,823 18,396 12 29 2019 Series 29,705 90 18,504 28,330 23 55 2020 Series 33,583 104 31,466 19,761 55 – 2021 Series 16,005 76 16,005 – 8 – 231,313 76,198 81,961 101 97 Total 321,358 132,503 139,989 173 182
Between 2011-2021 deferred awards were made under the Company’s Deferred Bonus Plan and performance share awards were made under the Company’s Performance Share Plan. In May 2021 the Company introduced a single Incentive Plan which replaced both of these plans and under which both deferred awards and performance share awards continue to be made.
DEFERRED AWARDS Under a deferred award the payment of a portion of a participant’s annual bonus is deferred for a period of one to seven years as an award of either ordinary shares (a ‘‘Bonus Share Award’’) or cash. Awards vest over a specified period, subject to continued employment and forfeiture for malus events. The Bonus Share Awards may be satisfied, at Glencore’s option, in shares by the issue of new ordinary shares, by the transfer of ordinary shares held in treasury or by the transfer of ordinary shares purchased in the market or in cash, with a value equal to the market value of the award at settlement, including distributions paid between award and settling. Glencore currently intends to settle all Bonus Share Awards in shares. The associated expense is recorded in the statement of income/loss as part of the expense for performance bonuses. The fair value at grant date is determined as the monthly volume-weighted average share price (VWAP) of Glencore plc prior to the respective award date.
PERFORMANCE SHARE AWARDS Performance share awards vest in annual tranches over a specified period, subject to continued employment and forfeiture for malus events. At grant date, each award is equivalent to one ordinary share of Glencore. Awards vest in one, two and three tranches on 31 January or 30 June of the years following the year of grant, as may be the case. The fair value of the awards is determined by reference to the monthly volume-weighted average share price (VWAP) of Glencore plc prior to the respective award date. The awards may be satisfied, at Glencore’s option, in shares by the issue of new ordinary shares, by the transfer of ordinary shares held in treasury or by the transfer of ordinary shares purchased in the market or in cash, with a value equal to the market value of the award at vesting, including distributions paid between award and vesting. Glencore currently intends to settle these awards in shares. The fair value at grant date is determined with respect to the monthly volume-weighted average share price (VWAP) of Glencore plc prior to the respective award date.
SHARE-BASED AWARDS ASSUMED IN PREVIOUS BUSINESS COMBINATIONS
Total options outstanding (thousands)
Weighted average exercise
price (GBP) 1 January 2021 71,667 4.25 Lapsed (27,130) 4.80 Exercised – – 31 December 2021 44,537 3.91 1 January 2020 102,623 3.98 Lapsed (30,956) 3.38 Exercised – – 31 December 2020 71,667 4.25
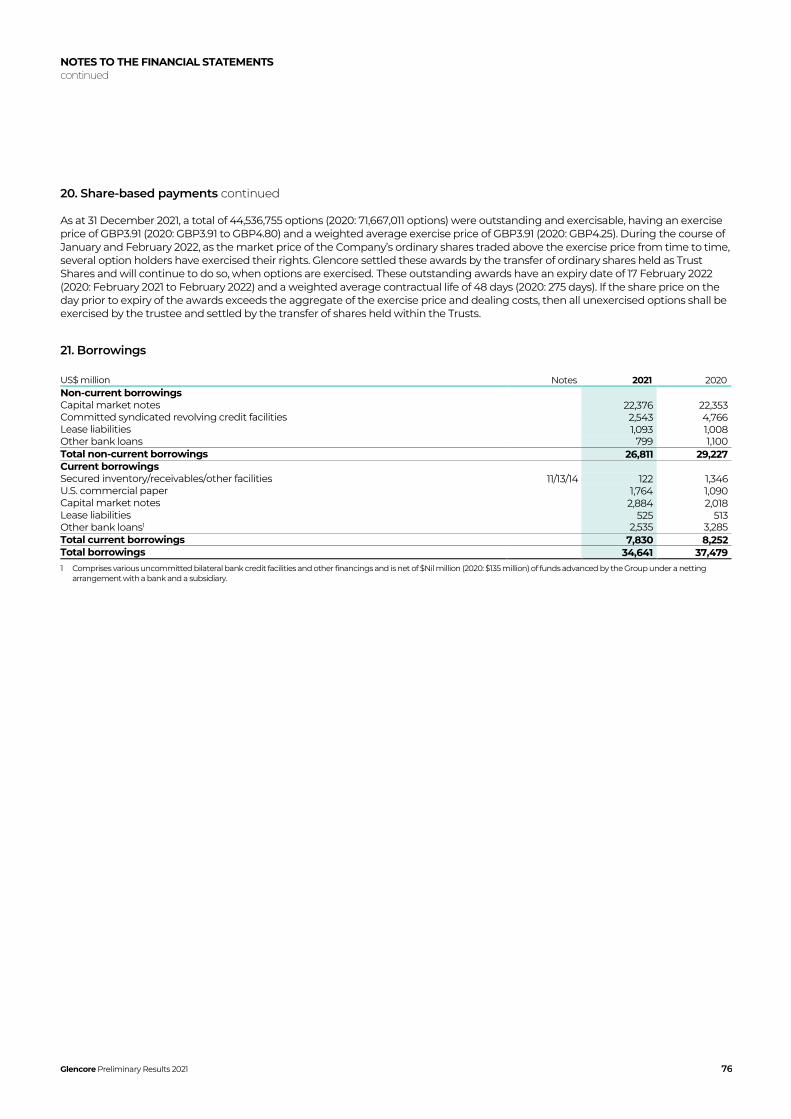
NOTES TO THE FINANCIAL STATEMENTS continued
Glencore Preliminary Results 2021 76
20. Share-based payments continued
As at 31 December 2021, a total of 44,536,755 options (2020: 71,667,011 options) were outstanding and exercisable, having an exercise price of GBP3.91 (2020: GBP3.91 to GBP4.80) and a weighted average exercise price of GBP3.91 (2020: GBP4.25). During the course of January and February 2022, as the market price of the Company’s ordinary shares traded above the exercise price from time to time, several option holders have exercised their rights. Glencore settled these awards by the transfer of ordinary shares held as Trust Shares and will continue to do so, when options are exercised. These outstanding awards have an expiry date of 17 February 2022 (2020: February 2021 to February 2022) and a weighted average contractual life of 48 days (2020: 275 days). If the share price on the day prior to expiry of the awards exceeds the aggregate of the exercise price and dealing costs, then all unexercised options shall be exercised by the trustee and settled by the transfer of shares held within the Trusts.
21. Borrowings
US$ million Notes 2021 2020 Non-current borrowings Capital market notes 22,376 22,353 Committed syndicated revolving credit facilities 2,543 4,766 Lease liabilities 1,093 1,008 Other bank loans 799 1,100 Total non-current borrowings 26,811 29,227 Current borrowings Secured inventory/receivables/other facilities 11/13/14 122 1,346 U.S. commercial paper 1,764 1,090 Capital market notes 2,884 2,018 Lease liabilities 525 513 Other bank loans1 2,535 3,285 Total current borrowings 7,830 8,252 Total borrowings 34,641 37,479
1 Comprises various uncommitted bilateral bank credit facilities and other financings and is net of $Nil million (2020: $135 million) of funds advanced by the Group under a netting arrangement with a bank and a subsidiary.

NOTES TO THE FINANCIAL STATEMENTS continued
Glencore Preliminary Results 2021 77
21. Borrowings continued
CHANGES IN LIABILITIES ARISING FROM FINANCING ACTIVITIES Liabilities arising from financing activities are those for which cash flows are classified in the Group's consolidated cash flow statement as cash flows from financing activities. The table below details changes in the Group's liabilities arising from financing activities, including both cash and non-cash changes.
2021
US$ million
Borrowings excluding
lease liabilities
Lease liabilities
Total borrowings
Cross currency and interest
rate swaps and net margins1
Total liabilities arising from
financing activities
1 January 2021 35,958 1,521 37,479 91 37,570 Cash related movements2 Proceeds from issuance of capital market notes 4,877 – 4,877 – 4,877 Repayment of capital market notes (2,807) – (2,807) – (2,807) Repurchase of capital market notes (125) – (125) – (125) Repayment of revolving credit facilities (2,244) – (2,244) – (2,244) Proceeds from other non-current borrowings 231 – 231 – 231 Repayment of other non-current borrowings (493) – (493) – (493) Repayment of lease liabilities – (634) (634) – (634) Margin payments in respect of financing related hedging activities – – – (970) (970) Proceeds from U.S. commercial papers 675 – 675 – 675 Repayment of current borrowings (2,016) – (2,016) – (2,016) (1,902) (634) (2,536) (970) (3,506) Non-cash related movements Borrowings (disposed of)/acquired in business combinations3 (1) (7) (8) – (8) Borrowings reclassified to held for sale4 – (138) (138) – (138) Fair value adjustment to fair value hedged borrowings (499) – (499) – (499) Fair value movement of hedging derivatives – – – 902 902 Foreign exchange movements (599) (45) (644) – (644) Change in lease liabilities – 922 922 – 922 Interest on convertible bonds 21 – 21 – 21 Other movements 45 (1) 44 – 44 (1,033) 731 (302) 902 600 31 December 2021 33,023 1,618 34,641 23 34,664
1 The currency and interest rate swaps are reported on the balance sheet within the headings ‘Other financial assets’ and ‘Other financial liabilities’ (see note 27) and margin calls paid/received within accounts receivable/payable (see notes 14 and 25).
2 See consolidated statement of cash flows. 3 See note 26. 4 See note 16.

NOTES TO THE FINANCIAL STATEMENTS continued
Glencore Preliminary Results 2021 78
21. Borrowings continued
2020
US$ million
Borrowings excluding
lease liabilities
Lease liabilities
Total borrowings
Cross currency and interest
rate swaps and net margins1
Total liabilities arising from
financing activities
1 January 2020 35,401 1,642 37,043 199 37,242 Cash related movements2 Proceeds from issuance of capital market notes 3,362 – 3,362 – 3,362 Repayment of capital market notes (4,017) – (4,017) – (4,017) Repurchase of capital market notes (72) – (72) – (72) Repayment of revolving credit facilities (870) – (870) – (870) Proceeds from other non-current borrowings 392 – 392 – 392 Repayment of other non-current borrowings (44) – (44) – (44) Repayment of lease liabilities – (560) (560) – (560) Margin receipts in respect of financing related hedging activities – – – 1,040 1,040 Proceeds from U.S. commercial papers 415 – 415 – 415 Proceeds from current borrowings 217 – 217 – 217 (617) (560) (1,177) 1,040 (137) Non-cash related movements Borrowings (disposed of)/acquired in business combinations3 – (13) (13) – (13) Borrowings reclassified to held for sale4 (26) – (26) – (26) Fair value adjustment to fair value hedged borrowings 344 – 344 – 344 Fair value movement of hedging derivatives – – – (1,148) (1,148) Foreign exchange movements 792 20 812 – 812 Change in lease liabilities – 435 435 – 435 Interest on convertible bonds 20 – 20 – 20 Other movements 44 (3) 41 – 41 1,174 439 1,613 (1,148) 465 31 December 2020 35,958 1,521 37,479 91 37,570
1 The currency and interest rate swaps are reported on the balance sheet within the headings ‘Other financial assets’ and ‘Other financial liabilities’ (see note 27) and margin calls paid/received within accounts receivable/payable (see notes 14 and 25).
2 See consolidated statement of cash flows. 3 See note 26. 4 See note 16.
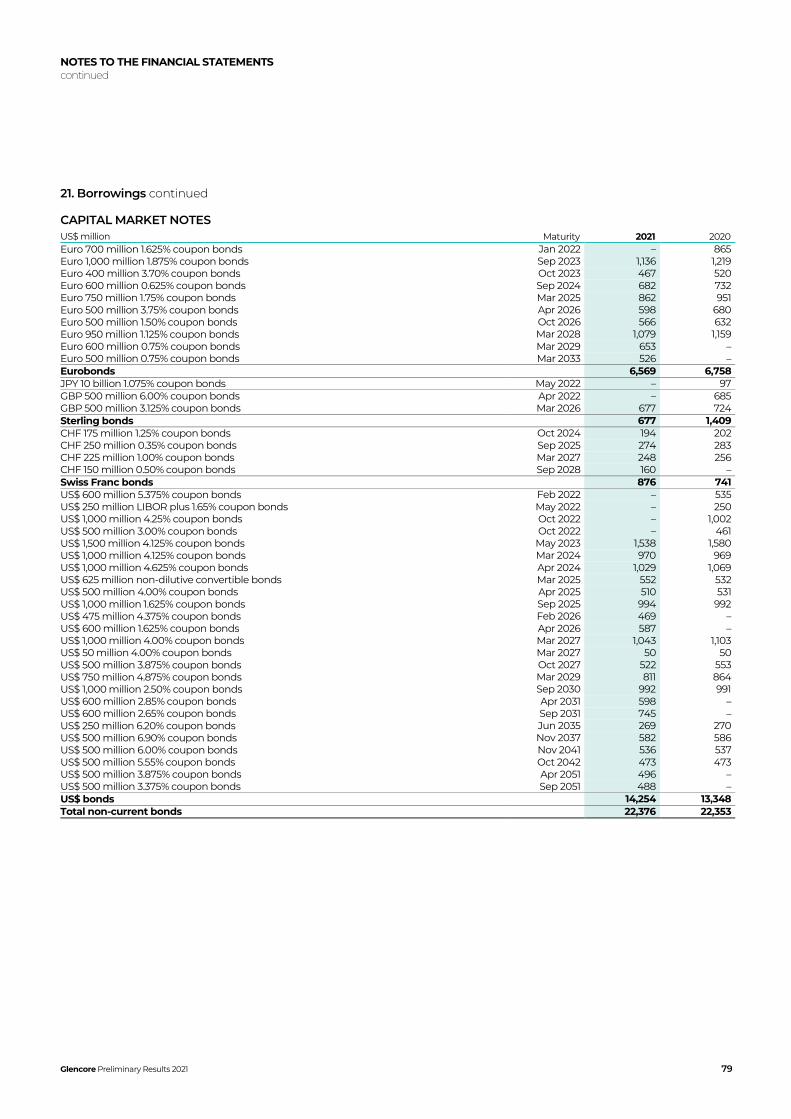
NOTES TO THE FINANCIAL STATEMENTS continued
Glencore Preliminary Results 2021 79
21. Borrowings continued
CAPITAL MARKET NOTES
US$ million Maturity 2021 2020 Euro 700 million 1.625% coupon bonds Jan 2022 – 865 Euro 1,000 million 1.875% coupon bonds Sep 2023 1,136 1,219 Euro 400 million 3.70% coupon bonds Oct 2023 467 520 Euro 600 million 0.625% coupon bonds Sep 2024 682 732 Euro 750 million 1.75% coupon bonds Mar 2025 862 951 Euro 500 million 3.75% coupon bonds Apr 2026 598 680 Euro 500 million 1.50% coupon bonds Oct 2026 566 632 Euro 950 million 1.125% coupon bonds Mar 2028 1,079 1,159 Euro 600 million 0.75% coupon bonds Mar 2029 653 – Euro 500 million 0.75% coupon bonds Mar 2033 526 – Eurobonds 6,569 6,758 JPY 10 billion 1.075% coupon bonds May 2022 – 97 GBP 500 million 6.00% coupon bonds Apr 2022 – 685 GBP 500 million 3.125% coupon bonds Mar 2026 677 724 Sterling bonds 677 1,409 CHF 175 million 1.25% coupon bonds Oct 2024 194 202 CHF 250 million 0.35% coupon bonds Sep 2025 274 283 CHF 225 million 1.00% coupon bonds Mar 2027 248 256 CHF 150 million 0.50% coupon bonds Sep 2028 160 – Swiss Franc bonds 876 741 US$ 600 million 5.375% coupon bonds Feb 2022 – 535 US$ 250 million LIBOR plus 1.65% coupon bonds May 2022 – 250 US$ 1,000 million 4.25% coupon bonds Oct 2022 – 1,002 US$ 500 million 3.00% coupon bonds Oct 2022 – 461 US$ 1,500 million 4.125% coupon bonds May 2023 1,538 1,580 US$ 1,000 million 4.125% coupon bonds Mar 2024 970 969 US$ 1,000 million 4.625% coupon bonds Apr 2024 1,029 1,069 US$ 625 million non-dilutive convertible bonds Mar 2025 552 532 US$ 500 million 4.00% coupon bonds Apr 2025 510 531 US$ 1,000 million 1.625% coupon bonds Sep 2025 994 992 US$ 475 million 4.375% coupon bonds Feb 2026 469 – US$ 600 million 1.625% coupon bonds Apr 2026 587 – US$ 1,000 million 4.00% coupon bonds Mar 2027 1,043 1,103 US$ 50 million 4.00% coupon bonds Mar 2027 50 50 US$ 500 million 3.875% coupon bonds Oct 2027 522 553 US$ 750 million 4.875% coupon bonds Mar 2029 811 864 US$ 1,000 million 2.50% coupon bonds Sep 2030 992 991 US$ 600 million 2.85% coupon bonds Apr 2031 598 – US$ 600 million 2.65% coupon bonds Sep 2031 745 – US$ 250 million 6.20% coupon bonds Jun 2035 269 270 US$ 500 million 6.90% coupon bonds Nov 2037 582 586 US$ 500 million 6.00% coupon bonds Nov 2041 536 537 US$ 500 million 5.55% coupon bonds Oct 2042 473 473 US$ 500 million 3.875% coupon bonds Apr 2051 496 – US$ 500 million 3.375% coupon bonds Sep 2051 488 – US$ bonds 14,254 13,348 Total non-current bonds 22,376 22,353

NOTES TO THE FINANCIAL STATEMENTS continued
Glencore Preliminary Results 2021 80
21. Borrowings continued
US$ million Maturity 2021 2020 GBP 500 million 6.00% coupon bonds Apr 2022 677 – JPY 10 billion 1.075% coupon bonds May 2022 87 – Euro 600 million 2.75% coupon bonds Apr 2021 – 724 CHF 250 million 2.25% coupon bonds May 2021 – 284 US$ 1,000 million 4.95% coupon bonds Nov 2021 – 1,010 US$ 600 million 5.375% coupon bonds Feb 2022 410 – US$ 250 million LIBOR plus 1.65% coupon bonds May 2022 250 – US$ 1,000 million 4.25% coupon bonds Oct 2022 999 – US$ 500 million 3.00% coupon bonds Oct 2022 461 – Total current bonds 2,884 2,018
2021 BOND ACTIVITIES • In February 2021, issued:
– 5 year $475 million, 4.375% coupon bond (Volcan)
• In March 2021, issued:
– 8 year EUR600 million, 0.75% coupon bond
– 12 year EUR500 million, 1.25% coupon bond
• In April 2021, issued:
– 5 year $600 million, 1.625% coupon bond
– 10 year $600 million, 2.85% coupon bond
– 30 year $500 million, 3.875% coupon bond
• In September 2021, issued:
– 7 year CHF150 million, 0.5% coupon bond
– 10 year $750 million, 2.625% coupon bond
– 30 year $500 million, 3.375% coupon bond
2020 BOND ACTIVITIES • In September 2020, issued:
– 7.5 year EUR 850 million, 1.125% coupon bond
– 5.5 year CHF 225 million, 1.00% coupon bond
– 5 year $1,000 million, 1.625% coupon bond
– 10 year $1,000 million, 2.50% coupon bond
• In December 2020, issued 7.5 year EUR 100 million, 1.125% coupon bond
COMMITTED SYNDICATED REVOLVING CREDIT FACILITIES In March 2021, Glencore extended its revolving credit facilities. The margins on these facilities remained unchanged, namely US$ LIBOR plus 40bps flat for the one-year, and US$ LIBOR plus 27.5bps, subject to a ratings grid, for the medium term. During the period, certain amounts were voluntarily cancelled, determined as being in excess of the Group’s liquidity headroom requirements.
As at 31 December 2021, the facilities comprise:
• a $6,572 million one year revolving credit facility with a one-year borrower’s term-out option (to May 2023);
• a $450 million medium-term revolving credit facility (to May 2025); and
• a $4,200 million medium-term revolving credit facility (to May 2026).
As in previous years, these committed unsecured facilities contain no financial covenants, no rating triggers, no material adverse change clauses and no external factor clauses.

NOTES TO THE FINANCIAL STATEMENTS continued
Glencore Preliminary Results 2021 81
21. Borrowings continued
SECURED FACILITIES
US$ million Maturity1 Interest 2021 2020 Syndicated committed metals inventory/receivables facilities2 Nov 2024 3.2% 82 81
Syndicated uncommitted metals and oil inventory/receivables facilities – 1,245
Other secured facilities Apr 2022 US$ LIBOR + 72 bps 120 100 Total 202 1,426 Current 122 1,346 Non-current 80 80
1 Uncommitted facilities are re-drawn several times until actual expiry of the facility contract. 2 Comprises various facilities. The maturity and interest detail represent the weighted average of the various debt balances outstanding at year end.

NOTES TO THE FINANCIAL STATEMENTS continued
Glencore Preliminary Results 2021 82
22. Deferred income
US$ million Notes Unfavourable
contracts Prepayments Total 1 January 2021 529 3,131 3,660 Additions – 1,336 1,336 Accretion in the year – 115 115 Revenue recognised in the year (70) (1,066) (1,136) Released in the year 5 (122) – (122) Reclassification to held for sale 16 – (191) (191) Effect of foreign currency exchange difference (1) – (1) 31 December 2021 336 3,325 3,661 Current 56 1,517 1,573 Non-current 280 1,808 2,088 1 January 2020 609 2,619 3,228 Additions – 1,047 1,047 Accretion in the year – 127 127 Revenue recognised in the year (66) (663) (729) Effect of foreign currency exchange difference (14) 1 (13) 31 December 2020 529 3,131 3,660 Current 79 991 1,070 Non-current 450 2,140 2,590
UNFAVOURABLE CONTRACTS In several business combinations, Glencore recognised liabilities related to various assumed contractual agreements to deliver tonnes of coal over various periods ending until 2032 at fixed prices lower than the prevailing market prices on the respective acquisition dates.
These amounts are released to revenue as the underlying commodities are delivered to the buyers over the life of the contracts at rates consistent with the extrapolated forward price curves at the time of the acquisitions.
During the year, certain contractual terms were renegotiated and related unfavourable contract provisions in the amount of $122 million were released (see note 5).
PREPAYMENTS Prepayments comprise various short to long-term product supply agreements whereby an upfront prepayment is received in exchange for the future delivery of a specific product, such as gold, silver or cobalt. The arrangements are accounted for as executory contracts whereby the advance payment is recorded as deferred revenue. The revenue from the advance payment is recognised as the specific product identified in the contract is delivered consistent with the implied forward price curve at the time of the transaction and an accretion expense, representing the time value of the upfront deposit, is also recognised.
Prepayments predominantly comprise:
• Life of mine arrangements - long-term streaming agreements for the future delivery of gold and/or silver produced over the life of mine from our Antamina and Antapaccay operations. In addition to the upfront payment received, for product delivered from the Antamina and Antapaccay operations, Glencore receives an ongoing amount equal to 20% of the spot silver and gold price. Once certain delivery thresholds have been met at Antapaccay, the ongoing cash payment increases to 30% of the spot gold and silver prices. As at 31 December 2021, post Ernest Henry being reclassified to ‘held for sale’, $1,068 million (2020: $1,391 million) of product delivery obligations remain, of which $35 million (2020: $118 million) are due within 12 months.
• Silver supply arrangement – Various silver prepayment arrangements for the future delivery of an average of 14 million ounces of silver per annum, over a remaining 4 year period. As at 31 December 2021, $784 million (2020: $841 million) of product delivery obligations remain, of which $408 million (2020: $292 million) are due within 12 months.
• Palladium supply arrangement – Various palladium prepayment arrangements for the future delivery of an average of 37 thousand ounces of palladium per annum, over a remaining 4 year period. As at 31 December 2021, $141 million (2020: $200 million) of product delivery obligations remain, of which $58 million (2020: $63 million) are due within 12 months.
• Gold supply arrangement – Various gold supply arrangements for the future delivery of 518 thousand ounces (2020: 228 thousand ounces) of gold over a 1-year period. As at 31 December 2021, $765 million (2020: $360 million) of product delivery obligations remain, which are due within 12 months.

NOTES TO THE FINANCIAL STATEMENTS continued
Glencore Preliminary Results 2021 83
22. Deferred income continued
• Cobalt supply arrangement – In March 2019, Glencore signed a six year cobal prepayment arrangement in exchange for an upfront advance payment of $100 million. Under the terms of the arrangement, Glencore is required to deliver an average of 1,621 metric tons of cobalt per annum, over a four year period starting 2021. As at 31 December 2021, $94 million (2020: $100 million) of product delivery obligations remain, of which $26 million (2020: $5 million) are due within 12 months.
• Iron ore supply arrangement – In November 2021, Glencore signed a 18 month iron ore prepayment arrangement in exchange for an upfront advance payment of $200 million. Under the terms of the arrangement, Glencore is required to deliver an average of 3,600,000 metric tons of iron ore per annum. As at 31 December 2021, $200 million (2020: $Nil) of product delivery obligations remain of which, $117 million (2020: $Nil) are due within 12 months.
23. Provisions
US$ million Notes Rehabilitation
costs Onerous
contracts Legal
investigations Other
provisions Total 1 January 2021 5,182 535 – 746 6,463 Utilised (190) (122) – (276) (588) Released (14) (103) – (31) (148) Accretion 153 31 – 2 186 Disposal of subsidiaries 26 (67) – – (10) (77) Additions 918 116 1,500 137 2,671 Reclassification to held for sale 16 (191) – – (37) (228) Effect of foreign currency exchange movements (60) (2) – (7) (69)
31 December 2021 5,731 455 1,500 524 8,210 Current 337 109 1,500 147 2,093 Non-current 5,394 346 – 377 6,117 1 January 2020 4,847 595 – 633 6,075 Utilised (189) (124) – (37) (350) Released – (174) – (42) (216) Accretion 144 40 – 4 188 Disposal of subsidiaries 26 (208) – – (15) (223) Additions 614 200 – 247 1,061 Reclassification to held for sale 16 (54) – – (24) (78) Reclassification from held for sale 16 45 – – 7 52 Effect of foreign currency exchange movements (17) (2) – (27) (46)
31 December 2020 5,182 535 – 746 6,463 Current 297 143 – 253 693 Non-current 4,885 392 – 493 5,770
REHABILITATION COSTS Rehabilitation provision represents the accrued costs required to provide adequate restoration and rehabilitation upon the completion of production activities. These amounts will be settled when rehabilitation is undertaken, generally at the end of a project’s life, which ranges from two to in excess of 50 years with an average for all sites, weighted by closure provision, of some 23 years (2020: 23 years).
As at 31 December 2021, the discount rate applied in calculating the restoration and rehabilitation provision is a pre-tax risk free rate specific to the liability and the currency in which they are denominated as follows: US dollar 1.5% (2020: 1.6%), South African rand 3.75% (2020: 3.6%), Australian dollar 2.0% (2020: 2.3%), Canadian dollar 1.5% (2020: 1.7%), and Chilean peso 2.5% (2020: 2.6%).
The sensitivity of the rehabilitation costs provision to changes in the discount rate assumptions as at 31 December 2021, assuming that all other assumptions are held constant, is set out below:

NOTES TO THE FINANCIAL STATEMENTS continued
Glencore Preliminary Results 2021 84
23. Provisions continued
Discount rate US$ million Increase 0.5% Decrease 0.5% Decrease/(increase) in overall rehabilitation provision 416 (484) (Decrease)/increase in property, plant and equipment (352) 409 Net increase/(decrease) in statement of income 64 (75) Effect in the following year Decrease/(increase) in depreciation expense 15 (18) (Increase)/decrease in interest expense (6) 8 Net increase/(decrease) in statement of income 9 (10)
ONEROUS CONTRACTS Onerous contracts represent liabilities related to contractual take or pay commitments for securing coal logistics capacity and LNG re-gasification capacity at fixed prices and quantities higher than the acquisition date forecasted usage and prevailing market price. The provision is released to costs of goods sold as the underlying commitments are incurred.
INVESTIGATIONS BY REGULATORY AND ENFORCEMENT AUTHORITIES The Group is subject to a number of investigations by regulatory and enforcement authorities including:
• The United States Department of Justice is investigating the Group with respect to compliance with various criminal statutes, including the Foreign Corrupt Practices Act, United States money laundering statutes and fraud statutes related to the Group’s business in certain overseas jurisdictions.
• The United States Commodity Futures Trading Commission ("CFTC") is investigating whether the Group may have violated certain provisions of the Commodity Exchange Act and/or CFTC Regulations including through corrupt practices in connection with commodities trading.
• The United Kingdom Serious Fraud Office is investigating the Group in respect of suspicions of bribery in the conduct of business of the Group.
• The Brazilian authorities are investigating the Group in relation to “Operation Car Wash”, which relates to bribery allegations concerning Petrobras.
• The Office of the Attorney General of Switzerland (“OAG”) is investigating Glencore International AG for failure to have the organisational measures in place to prevent alleged corruption.
The Board has appointed a committee, the Investigations Committee (“the Committee”), to oversee the response to the investigations on behalf of the Board. The Committee has engaged external legal counsel and forensic experts to assist in responding to the various investigations and to perform additional investigations at the request of the Committee covering various aspects of the Group’s business. The Group continues to cooperate fully with the above authorities.
The Group has also been notified by the Dutch authorities of a criminal investigation into Glencore International AG related to potential corruption pertaining to the DRC and is in contact with the Dutch authorities in respect of this investigation. The scope of the investigation is similar to that of the OAG investigation. The Dutch authorities are coordinating their investigation with the OAG and we would expect any possible resolution to avoid duplicative penalties for the same conduct.
While the Committee cannot forecast with certainty the cost, extent, timing or terms of the outcomes of the investigations, the Committee presently expects to resolve the U.S., UK and Brazilian investigations in 2022. Accordingly, and based on the Company’s current information and understanding, the Group has raised a provision as at 31 December 2021 in the amount of $1,500 million representing the Committee’s current best estimate of the costs to resolve these investigations (included in other expenses, see note 5). As the investigations are still ongoing and their ultimate outcome remains uncertain, there remains a significant risk that the final outcome could materially impact the recognised balance within the next financial year. It is impractical to provide further sensitivity estimates of potential downside variances.
The timing and outcome of the OAG and Dutch investigations remains uncertain – see note 31.
OTHER Other comprises provisions for possible demurrage, mine concession and construction related claims. This balance comprises no individually material provisions.
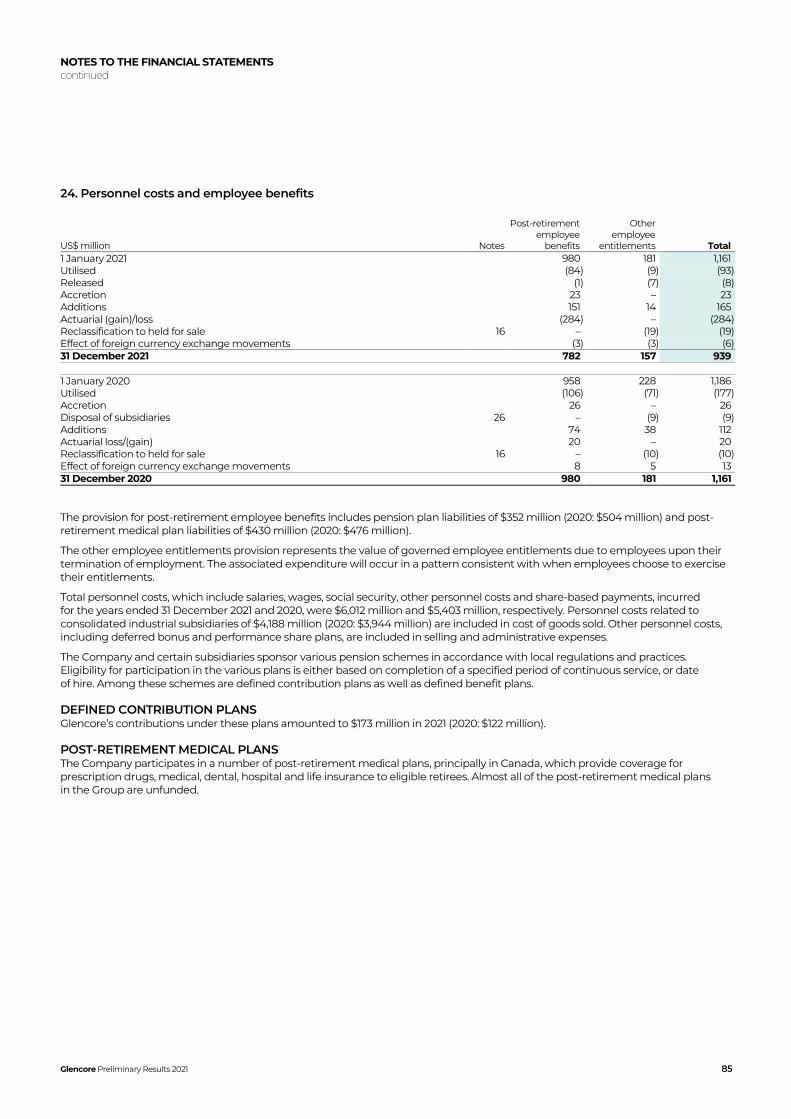
NOTES TO THE FINANCIAL STATEMENTS continued
Glencore Preliminary Results 2021 85
24. Personnel costs and employee benefits
US$ million Notes
Post-retirement employee
benefits
Other employee
entitlements Total 1 January 2021 980 181 1,161 Utilised (84) (9) (93) Released (1) (7) (8) Accretion 23 – 23 Additions 151 14 165 Actuarial (gain)/loss (284) – (284) Reclassification to held for sale 16 – (19) (19) Effect of foreign currency exchange movements (3) (3) (6) 31 December 2021 782 157 939 1 January 2020 958 228 1,186 Utilised (106) (71) (177) Accretion 26 – 26 Disposal of subsidiaries 26 – (9) (9) Additions 74 38 112 Actuarial loss/(gain) 20 – 20 Reclassification to held for sale 16 – (10) (10) Effect of foreign currency exchange movements 8 5 13 31 December 2020 980 181 1,161
The provision for post-retirement employee benefits includes pension plan liabilities of $352 million (2020: $504 million) and post-retirement medical plan liabilities of $430 million (2020: $476 million).
The other employee entitlements provision represents the value of governed employee entitlements due to employees upon their termination of employment. The associated expenditure will occur in a pattern consistent with when employees choose to exercise their entitlements.
Total personnel costs, which include salaries, wages, social security, other personnel costs and share-based payments, incurred for the years ended 31 December 2021 and 2020, were $6,012 million and $5,403 million, respectively. Personnel costs related to consolidated industrial subsidiaries of $4,188 million (2020: $3,944 million) are included in cost of goods sold. Other personnel costs, including deferred bonus and performance share plans, are included in selling and administrative expenses.
The Company and certain subsidiaries sponsor various pension schemes in accordance with local regulations and practices. Eligibility for participation in the various plans is either based on completion of a specified period of continuous service, or date of hire. Among these schemes are defined contribution plans as well as defined benefit plans.
DEFINED CONTRIBUTION PLANS Glencore’s contributions under these plans amounted to $173 million in 2021 (2020: $122 million).
POST-RETIREMENT MEDICAL PLANS The Company participates in a number of post-retirement medical plans, principally in Canada, which provide coverage for prescription drugs, medical, dental, hospital and life insurance to eligible retirees. Almost all of the post-retirement medical plans in the Group are unfunded.

NOTES TO THE FINANCIAL STATEMENTS continued
Glencore Preliminary Results 2021 86
24. Personnel costs and employee benefits continued
DEFINED BENEFIT PENSION PLANS The Company operates defined benefit plans in various countries, the main locations being Canada, Switzerland, UK and the U.S.. Approximately 64% of the present value of the pension obligations accrued relates to the defined benefit plans in Canada, which are pension plans that provide benefits to members in the form of a guaranteed level of pension payable for life. Contributions to the Canadian plans are made to meet or exceed minimum funding requirements based on provincial statutory requirements and associated federal taxation rules.
The majority of benefit payments are from trustee-administered funds; however, there are also a number of unfunded plans where Glencore meets the benefit payments as they fall due. Plan assets held in trusts are governed by local regulations and practices in each country. Responsibility for governance of the plans – overseeing all aspects of the plans including investment decisions and contribution schedules – lies with Glencore. Glencore has set up committees to assist in the management of the plans and has also appointed experienced, independent professional experts such as investment managers, actuaries, custodians, and trustees.
The movement in the defined benefit pension and post-retirement medical plans over the year is as follows:
Defined benefit pension plans
US$ million Notes Post-retirement
medical plans
Present value of defined
benefit obligation
Fair value of plan assets
Net liability for defined
benefit pension plans
1 January 2021 476 3,138 (2,674) 464 Current service cost 7 62 – 62 Past service cost - plan amendments (6) – – – Settlement of pension plan disposal – (137) 138 1 Interest expense/(income) 18 64 (59) 5 Total expense/(income) recognised in consolidated statement of income
19 (11) 79 68
Gain on plan assets, excluding amounts included in interest expense - net – – (46) (46) Gain from change in demographic assumptions – (12) – (12) Gain from change in financial assumptions (37) (188) – (188) (Gain)/loss from actuarial experience (4) 3 – 3 Actuarial (gains)/losses recognised in consolidated statement of comprehensive income (41) (197) (46) (243) Employer contributions – – (63) (63) Employee contributions – 1 (1) – Benefits paid directly by the Company (22) (8) 8 – Benefits paid from plan assets – (165) 166 1 Net cash (outflow)/inflow (22) (172) 110 (62) Exchange differences (2) 2 (2) – 31 December 2021 430 2,760 (2,533) 227 Of which: Pension surpluses 12 – (125) Pension deficits 430 352
The actual return on plan assets in respect of defined benefit pension plans amounted to a gain of $107 million (2020: $273 million), comprising interest income and the re-measurement of plan assets.
During the next financial year, the Group expects to make a contribution of $84 million in respect of the defined benefit pension and post-retirement medical plans across all countries, including current service costs and contributions required by pension legislation. Contributions over the next five years for the Canadian plans only, based on the most recently filed actuarial reports, approximate $117 million. Future funding requirements and contributions are reviewed and adjusted on an annual basis.

NOTES TO THE FINANCIAL STATEMENTS continued
Glencore Preliminary Results 2021 87
24. Personnel costs and employee benefits continued
Defined benefit pension plans
US$ million Notes Post-retirement
medical plans
Present value of defined
benefit obligation
Fair value of plan assets
Net liability for defined
benefit pension plans
1 January 2020 512 2,951 (2,547) 404 Current service cost 8 59 – 59 Past service cost - plan amendments – 2 – 2 Settlement of pension plan disposal – (41) 48 7 Interest expense/(income) 19 75 (68) 7 Total expense/(income) recognised in consolidated statement of income
27 95 (20) 75
Gain on plan assets, excluding amounts included in interest expense - net – – (150) (150) Gain from change in demographic assumptions (75) (3) – (3) Loss from change in financial assumptions 28 211 – 211 Loss from actuarial experience 4 5 – 5 Actuarial losses/(gains) recognised in consolidated statement of comprehensive income (43) 213 (150) 63 Employer contributions – – (83) (83) Employee contributions – 1 (1) – Benefits paid directly by the Company (23) (8) 8 – Benefits paid from plan assets – (174) 174 – Net cash (outflow)/inflow (23) (181) 98 (83) Exchange differences 3 60 (55) 5 31 December 2020 476 3,138 (2,674) 464 Of which: Pension surpluses 12 – (40) Pension deficits 476 504
The defined benefit obligation accrued in Canada represents the majority for the Company. The breakdown below provides details of the Canadian plans for both the statement of financial position and the weighted average duration of the defined benefit obligation as at 31 December 2021 and 2020. The net liability of any of the Group’s defined benefit plans outside of Canada as at 31 December 2021 does not exceed $70 million (2020: $92 million).

NOTES TO THE FINANCIAL STATEMENTS continued
Glencore Preliminary Results 2021 88
24. Personnel costs and employee benefits continued
2021 US$ million Canada Other Total Post-retirement medical plans Present value of defined benefit obligation 379 51 430 of which: amounts owing to active members 123 11 134 of which: amounts owing to pensioners 256 40 296 Defined benefit pension plans Present value of defined benefit obligation 1,753 1,007 2,760 of which: amounts owing to active members 434 484 918 of which: amounts owing to non-active members 25 167 192 of which: amounts owing to pensioners 1,294 356 1,650 Fair value of plan assets (1,772) (761) (2,533) Net defined benefit liability(asset) at 31 December 2021 (19) 246 227 Of which: Pension surpluses (115) (10) (125) Pension deficits 96 256 352 Weighted average duration of defined benefit obligation - years 13 15 13
2020 US$ million Canada Other Total Post-retirement medical plans Present value of defined benefit obligation 415 61 476 of which: amounts owing to active members 142 11 153 of which: amounts owing to pensioners 273 50 323 Defined benefit pension plans Present value of defined benefit obligation 2,041 1,097 3,138 of which: amounts owing to active members 501 533 1,034 of which: amounts owing to non-active members 37 192 229 of which: amounts owing to pensioners 1,503 372 1,875 Fair value of plan assets (1,917) (757) (2,674) Net defined benefit liability at 31 December 2020 124 340 464 Of which: Pension surpluses (38) (2) (40) Pension deficits 162 342 504 Weighted average duration of defined benefit obligation - years 13 16 14
Estimated future benefit payments of the Canadian plans, which reflect expected future services but exclude plan expenses, up until 2031 are as follows:
US$ million Post-retirement
medical plans Defined benefit
pension plans Total 2022 19 99 118 2023 19 98 117 2024 19 98 117 2025 19 135 154 2026 19 95 114 2027-2031 92 470 562 Total 187 995 1,182

NOTES TO THE FINANCIAL STATEMENTS continued
Glencore Preliminary Results 2021 89
24. Personnel costs and employee benefits continued
The plan assets consist of the following:
2021 2020
Active market Non-active
market Active market Non-active
market Cash and short-term investments 40 – 24 21 Fixed income 823 195 844 213 Equities 851 – 979 – Other 416 208 393 200 Total 2,130 403 2,240 434
The fair value of plan assets includes none of Glencore’s own financial instruments and no property occupied by or other assets used by Glencore. For many of the plans, representing a large portion of the global plan assets, asset-liability matching strategies are in place, where the fixed-income assets are invested broadly in alignment with the duration of the plan liabilities, and the proportion allocated to fixed-income assets is raised when the plan funding level increases. The asset mix for each plan reflects the nature, expected changes in, and size of the liabilities and the assessment of long-term economic conditions, market risk, expected investment returns as considered during a formal asset mix study, including sensitivity analysis and/or scenario analysis, conducted periodically for the plans.
Through its defined benefit plans, Glencore is exposed to a number of risks, the most significant of which are detailed below:
Asset volatility: The plan liabilities are calculated using a discount rate set with reference to corporate bond yields; if plan assets underperform this yield, this will create a deficit. The funded plans hold a significant proportion of equities, which are expected to outperform bonds in the long term while contributing volatility and risk in the short term. Glencore believes that due to the long-term nature of the plan liabilities, a level of continuing equity investment is an appropriate element of Glencore’s long-term strategy to manage the plans efficiently.
Change in bond yields: A decrease in bond yields will increase plan liabilities, although this will be partially offset by an increase in the value of the plans’ bond holdings.
Inflation risk: Some of the plans’ benefit obligations are linked to inflation, and higher inflation will lead to higher liabilities, although, in most cases, caps on the level of inflationary increases are in place to protect the plan against extreme inflation.
Life expectancy: The majority of the plans’ obligations are to provide benefits for the life of the member, so increases in life expectancy will result in an increase in the plans’ liability.
Salary increases: Some of the plans’ benefit obligations related to active members are linked to their salaries. Higher salary increases will therefore tend to lead to higher plan liabilities.
The principal weighted-average actuarial assumptions used were as follows:
Post-retirement medical plans Defined benefit pension plans 2021 2020 2021 2020 Discount rate 4.1% 3.6% 2.7% 2.2% Future salary increases – – 2.6% 2.6% Future pension increases – – 0.5% 0.4% Ultimate medical cost trend rate 4.6% 4.6% – –
Mortality assumptions are based on the latest available standard mortality tables for the individual countries concerned. As at 31 December 2021, these tables imply expected future life expectancy, for employees aged 65, 16 to 23 years for males (2020: 16 to 23) and 20 to 25 years for females (2020: 20 to 25). The assumptions for each country are reviewed regularly and are adjusted where necessary to reflect changes in fund experience and actuarial recommendations.

NOTES TO THE FINANCIAL STATEMENTS continued
Glencore Preliminary Results 2021 90
24. Personnel costs and employee benefits continued
The sensitivity of the defined benefit obligation to changes in principal assumptions as at 31 December 2021 is set out below, assuming that all other assumptions are held constant and the effect of interrelationships is excluded.
Increase/(decrease) in pension obligation
US$ million Post-retirement
medical plans Defined benefit
pension plans Total Discount rate Increase by 50 basis points (28) (170) (198) Decrease by 50 basis points 32 186 218 Rate of future salary increase Increase by 100 basis points – 34 34 Decrease by 100 basis points – (33) (33) Rate of future pension benefit increase Increase by 100 basis points – 56 56 Decrease by 100 basis points – (46) (46) Medical cost trend rate Increase by 100 basis points 51 – 51 Decrease by 100 basis points (41) – (41) Life expectancy Increase in longevity by one year 12 69 81
25. Accounts payable
US$ million Notes 2021 2020
Financial liabilities at amortised cost Trade payables 10,397 8,021 Margin calls received 729 1,033 Associated companies 1,124 1,209 Other payables and accrued liabilities 889 850 Financial liabilities at fair value through profit and loss Trade payables containing provisional pricing features 28 13,806 11,264 Non-financial instruments Advances settled in product 459 289 Other payables and accrued liabilities 1,460 994 Other tax and related payables 449 378 Total 29,313 24,038
Trade payables are obligations to pay for goods and services. Trade payables typically have maturities up to 90 days depending on the type of material and the geographic area in which the purchase transaction occurs and the agreed terms. As at 31 December 2021, Nil (2020: 10%) of total trade payables of $24,203 million (2020: $19,285 million) include liabilities under supplier financing arrangements with maturities beyond 91 days (refer to note 1 for critical judgements associated with classification of liabilities which contain a financing element). The carrying value of trade payables approximates fair value.

NOTES TO THE FINANCIAL STATEMENTS continued
Glencore Preliminary Results 2021 91
26. Acquisition and disposal of subsidiaries and other entities
2021 & 2020 ACQUISITIONS In 2021 and 2020, there were no material acquisitions.
2021 DISPOSALS The carrying value of the assets and liabilities over which control was lost and consideration receivable from the 2021 disposals are detailed below:
US$ million Mopani1 Chemoil
Terminals Others Total Non-current assets Property, plant and equipment 748 158 20 926 Advances and loans 5 – – 5 753 158 20 931 Current assets Inventories 168 – – 168 Accounts receivable 99 3 14 116 Prepaid expenses 3 – – 3 Cash and cash equivalents – 10 10 20 270 13 24 307 Non-current liabilities Non-current borrowings – (6) – (6) Deferred tax liabilities – (18) (1) (19) Non-current provisions (55) – (61) (116) Post-retirement and other employee benefits (9) – – (9) (64) (24) (62) (150) Current liabilities Borrowings – (1) (1) (2) Accounts payable (81) (8) – (89) Provisions (23) – (16) (39) Income tax payable (12) – – (12) (116) (9) (17) (142) Carrying value of net assets disposed 843 138 (35) 946 Cash and cash equivalents received – (248) (24) (272) Future consideration (838) – – (838) Net loss/(gain) on disposal before non-controlling interest 5 (110) (59) (164) Derecognition of non-controlling interest 1,017 – – 1,017 Net loss/(gain) on disposal after non-controlling interest 1,022 (110) (59) 853 Cash and cash equivalents received – 248 24 272 Less: cash and cash equivalents disposed – (10) (10) (20) Net cash received/(used) in disposal – 238 14 252
1 As at 31 December 2020, total assets and liabilities were presented as current assets and liabilities “held for sale“ (see note 16).
Mopani On 31 March 2021, Glencore completed the disposal of its 90% interest in Mopani to ZCCM Investments Holdings plc, the holder of the remaining 10% interest in Mopani, in exchange for $1 and the rights to offtake copper and other metals from Mopani until $1.5 billion of existing intercompany debt (the “transaction debt”) has been repaid to Glencore. The repayment of the transaction debt is based on Glencore receiving physical commodities from Mopani through its offtake rights and applying fixed percentages of annual gross revenues generated from the sale of such commodities against the transaction debt until it is fully repaid. As Glencore is no longer able to unilaterally direct the key strategic, operating and capital decisions of Mopani, it was deemed to have disposed of its controlling interest at the fair value of the transaction debt on the date of completion, being $838 million. Fair value was determined using a discounted cash flow model of the projected amount and timing of metal volumes received from Mopani under the offtake rights and market forecasts of commodity prices, discounted using an asset specific discount rate of 11.4%.
The net loss on disposal reflects the derecognition to the statement of income of the previously recognised book value of the non-controlling interest equity balance, which largely related to the non-controlling interests’ share of historical impairments and losses, and resulting net liabilities in Mopani.
Chemoil Terminals On 17 December 2021, Glencore completed the disposal of its 100% interest in Chemoil Terminals LLC, which owns the Long Beach and Carson oil products storage terminals in California, for a consideration of $248 million.

NOTES TO THE FINANCIAL STATEMENTS continued
Glencore Preliminary Results 2021 92
26. Acquisition and disposal of subsidiaries and other entities continued
2020 DISPOSALS In 2020, Glencore disposed of its controlling interest in Minera Alumbrera Limited. The carrying value of the assets and liabilities over which control was lost and the net cash used in the disposal are detailed below:
US$ million Alumbrera Non-current assets Property, plant and equipment 12 12 Current assets Inventories 2 Accounts receivable 14 Cash and cash equivalents 222 238 Non-controlling interest 2 Non-current liabilities Provisions (182) (182) Current liabilities Borrowings (13) Accounts payable (9) Provisions (50) (72) Carrying value of net assets disposed (2) Net gain on disposal (2) Cash and cash equivalents received – Less: cash and cash equivalents disposed (222) Net cash used in disposal (222)
Minera Alumbrera Limited In December 2020, Glencore disposed of its 50% interest in Minera Alumbrera Limited, a copper-gold operation in Argentina, in return for a 24.99% interest in Minera Agua Rica Alumbrera Limited. Glencore is no longer able to unilaterally direct the key strategic, operating and capital decisions of Minera Alumbrera Limited and was deemed to have disposed of its controlling interest at fair value. The difference to the net carrying value was recognised through the statement of income, with Glencore subsequently accounting for its share in Minera Agua Rica Alumbrera Limited using the equity method in accordance with IAS 28.

NOTES TO THE FINANCIAL STATEMENTS continued
Glencore Preliminary Results 2021 93
27. Financial and capital risk management
Financial risks arising in the normal course of business from Glencore’s operations comprise market risk (including commodity price risk, interest rate risk and currency risk), credit risk (including performance risk) and liquidity risk. It is Glencore’s policy and practice to identify and, where appropriate and practical, actively manage such risks (for management of “margin” risk within Glencore’s extensive and diversified industrial portfolio, refer net present value at risk below) to support its objectives in managing its capital and future financial security and flexibility. Glencore’s overall risk management programme focuses on the unpredictability of financial markets and seeks to protect its financial security and flexibility by using derivative financial instruments where possible to substantially hedge these financial risks. Glencore’s finance and risk professionals, working in coordination with the commodity departments, monitor, manage and report regularly to senior management and the Board of Directors on the approach and effectiveness in managing financial risks along with the financial exposures facing the Group.
Glencore’s objectives in managing its “capital attributable to equity holders” include preserving its overall financial health and strength for the benefit of all stakeholders, maintaining an optimal capital structure in order to provide a high degree of financial flexibility at an attractive cost of capital and safeguarding its ability to continue as a going concern, while generating sustainable long-term profitability. Central to meeting these objectives is maintaining an investment grade credit rating status. Glencore’s current credit ratings are Baa1 (stable) from Moody’s and BBB+ (stable) from S&P.
DISTRIBUTION POLICY AND OTHER CAPITAL MANAGEMENT INITIATIVES Glencore’s base cash distribution policy comprises two components: (1) a fixed $1 billion component and (2) a variable element representing 25% of free cash flow generated by our industrial assets during the proceding year. Distributions are expected to be formally declared by the Board annually (with the preliminary full-year results). Distributions, when declared, will be settled equally in May and September of the year they are declared in. In addition, reflecting the Group’s through the cycle Net debt objective of c.$10 billion, and consideration of the cyclical nature of the industry and other relevant factors, the Board could declare additional distributions to be included with the distribution confirmed with respect to the prior year, consider top-up distributions during the year and/or initiate or continue share buy-back programmes. Notwithstanding that the cash distribution is declared and paid in U.S. dollars, shareholders will be able to elect to receive their distribution payments in Pounds Sterling, Euros or Swiss Francs based on the exchange rates in effect around the date of payment. Shareholders on the JSE will receive their distributions in South African Rand.
COMMODITY PRICE RISK Glencore is exposed to price movements for the inventory it holds and the products it produces which are not held to meet priced forward contract obligations and forward priced purchase or sale contracts. Glencore manages a significant portion of this exposure through futures and options transactions on worldwide commodity exchanges or in over the counter (OTC) markets, to the extent available. Commodity price risk management activities are considered an integral part of Glencore’s physical commodity marketing activities and the related assets and liabilities are included in other financial assets from and other financial liabilities to derivative counterparties, including clearing brokers and exchanges. Whilst it is Glencore’s policy to substantially hedge its commodity price risks, there remains the possibility that the hedging instruments chosen may not always provide effective mitigation of the underlying price risk. The hedging instruments available to the marketing businesses may differ in specific characteristics to the risk exposure to be hedged, resulting in an ongoing and unavoidable basis risk exposure. Residual basis risk exposures represent a key focus point for Glencore’s commodity department teams who actively engage in the management of such.
VALUE AT RISK One of the tools used by Glencore to monitor and limit its primary market risk exposure, principally commodity price risk related to its physical marketing activities, is a value at risk (VaR) computation. VaR is a risk measurement technique which estimates a threshold for potential loss that could occur on risk positions as a result of movements in risk factors over a specified time horizon, given a specific level of confidence and based on a specific price history. The VaR methodology is a statistically defined, probability-based approach that takes into account market volatilities, as well as risk diversification by recognising offsetting positions and correlations between commodities and markets. In this way, risks can be measured consistently across markets and commodities and risk measures can be aggregated to derive a single risk value.
Glencore uses a VaR approach based on Monte Carlo simulations computed at a 95% confidence level and utilising a weighted data history for a one-day time horizon. Glencore’s Board has set a consolidated VaR limit (one day 95% confidence level) of $150 million (2020: $100 million) representing less than 0.4% of total equity, which the Board reviews annually. Given 2021’s elevated implied market volatilities, together with statistically higher commodity correlations and the nature / extent (e.g. increased size and tenor of LNG business) of transaction volumes, the Board approved an increase in the VaR limit in H2 2021, initially to $130 million on a temporary basis and then to $150 million going forward, with effect from 1 January 2022.
Position sheets are regularly distributed and monitored and daily Monte Carlo simulations are applied to the various business groups’ net marketing positions to determine potential losses.

NOTES TO THE FINANCIAL STATEMENTS continued
Glencore Preliminary Results 2021 94
27. Financial and capital risk management continued
Market risk VaR (one-day 95% confidence level) ranges and year-end positions were as follows:
US$ million 2021 2020 Year-end position 72 33 Average during the year 54 39 High during the year 126 102 Low during the year 27 14
VaR does not purport to represent actual gains or losses in fair value in earnings to be incurred by Glencore, nor does Glencore claim that these VaR results are indicative of future market movements or representative of any actual impact on its future results. VaR should always be viewed in the context of its limitations; notably, the use of historical data as a proxy for estimating future events, market illiquidity risks and tail risks. Glencore recognises these limitations, and thus complements and continuously refines its VaR analysis by analysing forward looking stress scenarios, benchmarking against an alternative VaR computation based on historical simulations and back testing calculated VaR against the hypothetical portfolio returns arising in the next business day.
Glencore’s VaR computation currently covers its business in the key base metals (including aluminium, nickel, zinc, copper and lead), coal, iron ore and oil/natural gas/LNG and assesses the open priced positions which are subject to price risk, including inventories of these commodities. Due to the lack of a liquid terminal market, Glencore does not include a VaR calculation for products such as alumina, molybdenum, freight and some risk associated with metals’ concentrates as it does not consider the nature of these markets to be suited to this type of analysis. Alternative measures are used to monitor exposures related to these products.
NET PRESENT VALUE AT RISK Glencore’s future cash flows related to its forecast Industrial production activities are also exposed to commodity price movements. Glencore manages this exposure through a combination of portfolio diversification, occasional shorter-term hedging via futures and options transactions, insurance products and continuous internal monitoring, reporting and quantification of the underlying operations’ estimated cash flows and valuations.
INTEREST RATE RISK Glencore is exposed to various risks associated with the effects of fluctuations in the prevailing levels of market interest rates on its assets and liabilities and cash flows. Matching of assets and liabilities is utilised as the dominant method to hedge interest rate risks; other methods include the use of interest rate swaps and similar derivative instruments with the same critical terms as the underlying interest rate exposures. See details on swap instruments used below.
Floating rate debt which is predominantly used to fund fast turning working capital (interest is internally charged on the funding of this working capital) is primarily based on US$ LIBOR plus an appropriate premium. Accordingly, prevailing market interest rates are continuously factored into transactional pricing and terms.
Assuming the amount of floating rate liabilities at the reporting period end were outstanding for the whole year, interest rates were 50 basis points higher/lower and all other variables held constant, Glencore’s income for the year ended 31 December 2021 would decrease/increase by $98 million (2020: $112 million).
Interest rate benchmark reform Whereas initially the UK FCA announced that they would not compel the 20 panel banks to submit into the LIBOR interest rate setting mechanism by the end of 2021, in November 2020 they issued a revised timetable, with the consequence that overnight, 1, 3 and 6 month USD LIBOR’s will continue to be quoted until 30 June 2023.
To cater for the envisaged transition of interest rate hedging arrangements, which have an accelerated timetable, the Group has already agreed to align with the ISDA fall-back protocol. Therefore, all existing and new derivative arrangements referencing LIBORs, will be amended in line with the timelines and announcements made by regulators in the respective currency jurisdiction.
The Group has additionally established a multidisciplinary working group, to prepare and implement a LIBOR transition plan. This working group is assessing on an ongoing basis the potential impact of LIBOR reform. This transition plan includes updating policies, systems and processes, in order to anticipate the appropriate changes as and when deemed necessary.
During the year, the Group already also transitioned some of its non-derivative contractual exposures from LIBOR based to alternative fixed rates. However the Group’s remaining non-derivative LIBOR linked contracts do not yet include adequate and robust fall-back provisions for cessation of the referenced benchmark interest rate.
The Group continues to monitor the market and the output from various industry groups managing the transition to new benchmark interest rates, and will look to implement a new benchmark, which is expected to be based broadly around the US Secured Overnight Financing Ratee (SOFR), or at the very least, implement robust fall-back language for different instruments and LIBORs, when appropriate.

NOTES TO THE FINANCIAL STATEMENTS continued
Glencore Preliminary Results 2021 95
27. Financial and capital risk management continued
The following table sets out the hedging relationships as at 31 December 2021, which include IBOR benchmarks and are yet to be transitioned to risk-free rate benchmarks.
Carrying amount
Notional Assets Liabilities Interest rate benchmark Hedged item Hedge relationship US$ million
Hedging instruments Interest rate swaps 4,950 224 (11) LIBOR US$ bonds Fair value hedge Cross-currency interest rate swaps 4,792 110 (284) LIBOR EMTN Fair value hedge Basis swaps 9,142 3 – LIBOR US$ bonds/EMTN Fair value hedge Non-derivative financial liabilites – – – Committed syndicated revolving credit facilities1 – – (2,543) LIBOR
Secured facilities1 – – (120) LIBOR
1 See note 21.
CURRENCY RISK The U.S. dollar is the predominant functional currency of the Group. Currency risk is the risk of loss from movements in exchange rates related to transactions and balances in currencies other than the U.S. dollar. Such transactions include operating expenditure, capital expenditure and to a lesser extent purchases and sales in currencies other than the functional currency. Purchases or sales of commodities concluded in currencies other than the functional currency, apart from certain limited domestic sales at industrial operations which act as a hedge against local operating costs, are ordinarily economically hedged through forward exchange contracts. Consequently, foreign exchange movements against the U.S. dollar on recognised transactions would have an immaterial financial impact. Glencore enters into currency hedging transactions with leading financial institutions.
Glencore’s debt related payments (both principal and interest) are primarily denominated in or swapped using hedging instruments into U.S. dollars. Glencore’s operating expenses, being a small portion of its revenue base, are incurred in a mix of currencies of which the U.S. dollar, Swiss Franc, Pound Sterling, Canadian dollar, Australian dollar, Euro, Kazakhstan Tenge, Colombian Peso and South African Rand are the predominant currencies.
Glencore has issued Euro, Swiss Franc, Sterling and Yen denominated bonds (see note 21). Cross currency swaps were concluded to hedge the currency risk on the principal and related interest payments of these bonds. These contracts were designated as fair value or cash flow hedges of the associated foreign currency risks. The critical terms of these swap contracts and their corresponding hedged items are matched and the Group expects a highly effective hedging relationship with the swap contracts and the value of the corresponding hedged items to change systematically in opposite direction in response to movements in the underlying exchange rates. The corresponding fair value and notional amounts of these derivatives is as follows:
Notional amounts Average FX
rates
Carrying amount Assets
(Note 29)
Carrying amount Liabilities (Note 29)
Average maturity1
US$ million 2021 2020 2021 2020 2021 2020 2021 2020 Cross currency swap agreements Cash flow hedges - currency risk Eurobonds 2,907 2,907 1.14 1.14 3 164 42 – 2025 Sterling bonds 798 798 1.60 1.60 – – 129 126 2022 Swiss franc bonds 504 504 1.06 1.06 12 16 – – 2026 Fair value hedges - currency and interest rate risk Eurobonds 3,947 4,323 1.22 1.27 67 232 285 120 2027 Yen bonds 81 81 0.01 0.01 5 16 – – 2022 Sterling bonds 663 663 1.33 1.33 33 81 – – 2026 Swiss franc bonds 347 440 1.07 1.04 11 48 5 – 2026 9,247 9,716 131 557 461 246 Interest rate swap agreements Fair value hedges - interest rate risk US$ bonds 6,450 5,250 – – 272 525 12 4 2026 15,697 14,966 403 1,082 473 250
1 Refer to note 21 for details.
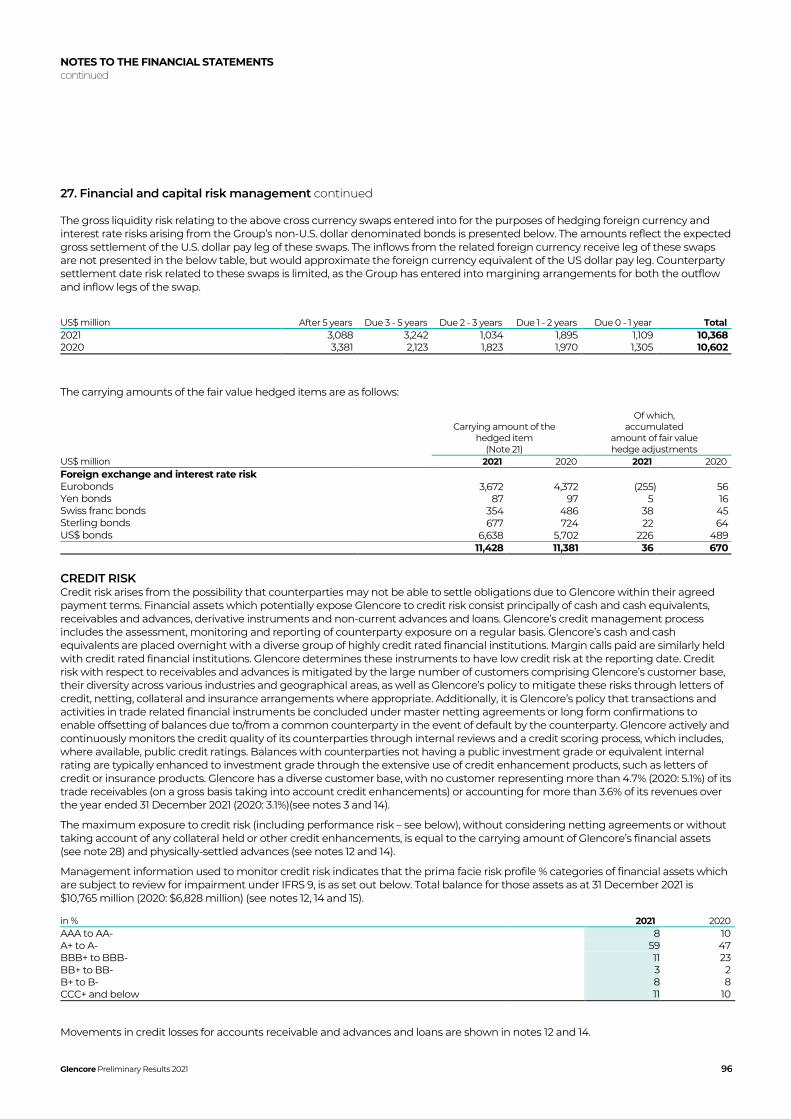
NOTES TO THE FINANCIAL STATEMENTS continued
Glencore Preliminary Results 2021 96
27. Financial and capital risk management continued
The gross liquidity risk relating to the above cross currency swaps entered into for the purposes of hedging foreign currency and interest rate risks arising from the Group’s non-U.S. dollar denominated bonds is presented below. The amounts reflect the expected gross settlement of the U.S. dollar pay leg of these swaps. The inflows from the related foreign currency receive leg of these swaps are not presented in the below table, but would approximate the foreign currency equivalent of the US dollar pay leg. Counterparty settlement date risk related to these swaps is limited, as the Group has entered into margining arrangements for both the outflow and inflow legs of the swap.
US$ million After 5 years Due 3 - 5 years Due 2 - 3 years Due 1 - 2 years Due 0 - 1 year Total 2021 3,088 3,242 1,034 1,895 1,109 10,368 2020 3,381 2,123 1,823 1,970 1,305 10,602
The carrying amounts of the fair value hedged items are as follows:
Carrying amount of the hedged item
(Note 21)
Of which, accumulated
amount of fair value hedge adjustments
US$ million 2021 2020 2021 2020 Foreign exchange and interest rate risk Eurobonds 3,672 4,372 (255) 56 Yen bonds 87 97 5 16 Swiss franc bonds 354 486 38 45 Sterling bonds 677 724 22 64 US$ bonds 6,638 5,702 226 489 11,428 11,381 36 670
CREDIT RISK Credit risk arises from the possibility that counterparties may not be able to settle obligations due to Glencore within their agreed payment terms. Financial assets which potentially expose Glencore to credit risk consist principally of cash and cash equivalents, receivables and advances, derivative instruments and non-current advances and loans. Glencore’s credit management process includes the assessment, monitoring and reporting of counterparty exposure on a regular basis. Glencore’s cash and cash equivalents are placed overnight with a diverse group of highly credit rated financial institutions. Margin calls paid are similarly held with credit rated financial institutions. Glencore determines these instruments to have low credit risk at the reporting date. Credit risk with respect to receivables and advances is mitigated by the large number of customers comprising Glencore’s customer base, their diversity across various industries and geographical areas, as well as Glencore’s policy to mitigate these risks through letters of credit, netting, collateral and insurance arrangements where appropriate. Additionally, it is Glencore’s policy that transactions and activities in trade related financial instruments be concluded under master netting agreements or long form confirmations to enable offsetting of balances due to/from a common counterparty in the event of default by the counterparty. Glencore actively and continuously monitors the credit quality of its counterparties through internal reviews and a credit scoring process, which includes, where available, public credit ratings. Balances with counterparties not having a public investment grade or equivalent internal rating are typically enhanced to investment grade through the extensive use of credit enhancement products, such as letters of credit or insurance products. Glencore has a diverse customer base, with no customer representing more than 4.7% (2020: 5.1%) of its trade receivables (on a gross basis taking into account credit enhancements) or accounting for more than 3.6% of its revenues over the year ended 31 December 2021 (2020: 3.1%)(see notes 3 and 14).
The maximum exposure to credit risk (including performance risk – see below), without considering netting agreements or without taking account of any collateral held or other credit enhancements, is equal to the carrying amount of Glencore’s financial assets (see note 28) and physically-settled advances (see notes 12 and 14).
Management information used to monitor credit risk indicates that the prima facie risk profile % categories of financial assets which are subject to review for impairment under IFRS 9, is as set out below. Total balance for those assets as at 31 December 2021 is $10,765 million (2020: $6,828 million) (see notes 12, 14 and 15).
in % 2021 2020 AAA to AA- 8 10 A+ to A- 59 47 BBB+ to BBB- 11 23 BB+ to BB- 3 2 B+ to B- 8 8 CCC+ and below 11 10
Movements in credit losses for accounts receivable and advances and loans are shown in notes 12 and 14.

NOTES TO THE FINANCIAL STATEMENTS continued
Glencore Preliminary Results 2021 97
27. Financial and capital risk management continued
Performance risk Performance risk (part of the broader credit risk subject matter, discussed above) is inherent in contracts, with agreements in the future, to physically purchase or sell commodities with fixed price attributes, and arises from the possibility that counterparties may not be willing or able to meet their future contractual physical sale or purchase obligations to/from Glencore. Glencore undertakes the assessment, monitoring and reporting of performance risk within its overall credit management process. Glencore’s market breadth, diversified supplier and customer base as well as the standard pricing mechanism in the vast majority of Glencore’s commodity portfolio which does not fix the primary commodity price beyond three months, ensure that performance risk is adequately mitigated. The commodity industry has trended towards shorter term fixed price contract periods, in part to mitigate against such potential performance risk, but also due to the continuous development of transparent and liquid spot commodity markets, with their associated derivative products and indexes.
LIQUIDITY RISK Liquidity risk is the risk that Glencore is unable to meet its payment obligations when due, or that it is unable, on an ongoing basis, to borrow funds in the market on an unsecured or secured basis at an acceptable price to fund actual or proposed commitments. Prudent liquidity risk management implies maintaining sufficient cash and cash equivalents and availability of adequate committed funding facilities. Glencore has set itself an internal minimum liquidity target to maintain at all times, including via available committed undrawn credit facilities, of $3 billion (2020: $3 billion), which has purposely been substantially exceeded in recent years, accounting for the more volatile market backdrop. Glencore’s credit profile, diversified funding sources and committed credit facilities, ensure that sufficient liquid funds are maintained to meet its liquidity requirements. As part of its liquidity management, Glencore closely monitors and plans for its future capital expenditure, working capital needs and proposed investments, as well as credit facility refinancing/extension requirements, well ahead of time (see notes 1, 12, 21, 22 and 25).
As at 31 December 2021, Glencore had available committed undrawn credit facilities and cash amounting to $10,296 million (2020: $10,259 million), refer to Other reconciliations section. The maturity profile of Glencore’s financial liabilities based on the contractual terms is as follows:
2021 US$ million After 5 years Due 3 - 5 years Due 2 - 3 years Due 1 - 2 years Due 0 - 1 year Total Borrowings excluding lease liabilities, fair value hedge adjustments and other non-hedged items
10,310 6,365 3,014 6,106 7,496 33,291
Expected future interest payments 3,219 861 547 716 830 6,173 Lease liabilities - undiscounted 730 257 209 345 596 2,137 Accounts payable – – – – 26,945 26,945 Other financial liabilities 195 131 21 32 5,850 6,229 Total 14,454 7,614 3,791 7,199 41,717 74,775 Current assets 57,776 57,776 2020 US$ million After 5 years Due 3 - 5 years Due 2 - 3 years Due 1 - 2 years Due 0 - 1 year Total Borrowings excluding lease liabilities, fair value hedge adjustments and other non-hedged items
8,473 6,306 3,536 9,215 7,814 35,344
Expected future interest payments 2,415 782 550 690 846 5,283 Lease liabilities - undiscounted 592 209 209 378 593 1,981 Accounts payable – – – – 22,377 22,377 Other financial liabilities 381 52 31 53 4,200 4,717 Total 11,861 7,349 4,326 10,336 35,830 69,702 Current assets 43,212 43,212
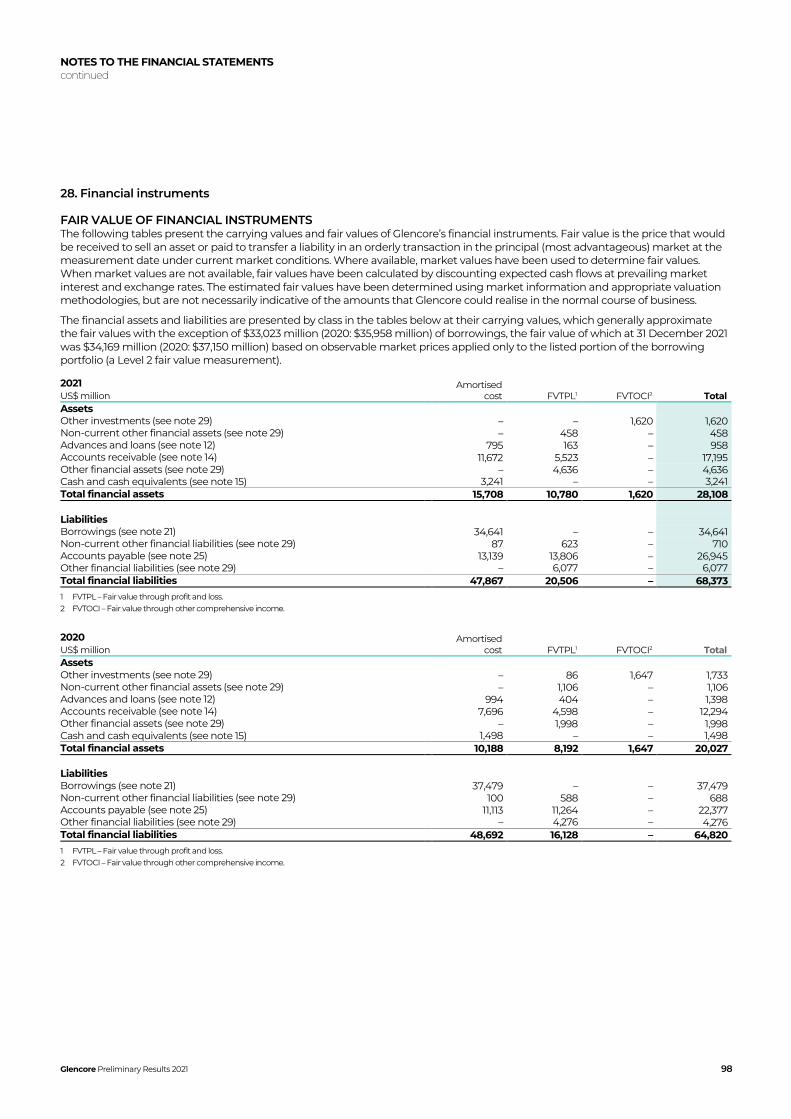
NOTES TO THE FINANCIAL STATEMENTS continued
Glencore Preliminary Results 2021 98
28. Financial instruments
FAIR VALUE OF FINANCIAL INSTRUMENTS The following tables present the carrying values and fair values of Glencore’s financial instruments. Fair value is the price that would be received to sell an asset or paid to transfer a liability in an orderly transaction in the principal (most advantageous) market at the measurement date under current market conditions. Where available, market values have been used to determine fair values. When market values are not available, fair values have been calculated by discounting expected cash flows at prevailing market interest and exchange rates. The estimated fair values have been determined using market information and appropriate valuation methodologies, but are not necessarily indicative of the amounts that Glencore could realise in the normal course of business.
The financial assets and liabilities are presented by class in the tables below at their carrying values, which generally approximate the fair values with the exception of $33,023 million (2020: $35,958 million) of borrowings, the fair value of which at 31 December 2021 was $34,169 million (2020: $37,150 million) based on observable market prices applied only to the listed portion of the borrowing portfolio (a Level 2 fair value measurement).
2021 Amortised
cost FVTPL1 FVTOCI2 Total US$ million Assets Other investments (see note 29) – – 1,620 1,620 Non-current other financial assets (see note 29) – 458 – 458 Advances and loans (see note 12) 795 163 – 958 Accounts receivable (see note 14) 11,672 5,523 – 17,195 Other financial assets (see note 29) – 4,636 – 4,636 Cash and cash equivalents (see note 15) 3,241 – – 3,241 Total financial assets 15,708 10,780 1,620 28,108 Liabilities Borrowings (see note 21) 34,641 – – 34,641 Non-current other financial liabilities (see note 29) 87 623 – 710 Accounts payable (see note 25) 13,139 13,806 – 26,945 Other financial liabilities (see note 29) – 6,077 – 6,077 Total financial liabilities 47,867 20,506 – 68,373
1 FVTPL – Fair value through profit and loss. 2 FVTOCI – Fair value through other comprehensive income.
2020 Amortised cost FVTPL1 FVTOCI2 Total US$ million
Assets Other investments (see note 29) – 86 1,647 1,733 Non-current other financial assets (see note 29) – 1,106 – 1,106 Advances and loans (see note 12) 994 404 – 1,398 Accounts receivable (see note 14) 7,696 4,598 – 12,294 Other financial assets (see note 29) – 1,998 – 1,998 Cash and cash equivalents (see note 15) 1,498 – – 1,498 Total financial assets 10,188 8,192 1,647 20,027 Liabilities Borrowings (see note 21) 37,479 – – 37,479 Non-current other financial liabilities (see note 29) 100 588 – 688 Accounts payable (see note 25) 11,113 11,264 – 22,377 Other financial liabilities (see note 29) – 4,276 – 4,276 Total financial liabilities 48,692 16,128 – 64,820
1 FVTPL – Fair value through profit and loss. 2 FVTOCI – Fair value through other comprehensive income.

NOTES TO THE FINANCIAL STATEMENTS continued
Glencore Preliminary Results 2021 99
28. Financial instruments continued
OFFSETTING OF FINANCIAL ASSETS AND LIABILITIES In accordance with IAS 32 the Group reports financial assets and liabilities on a net basis in the consolidated statement of financial position only if there is a legally enforceable right to set off the recognised amounts and there is intention to settle on a net basis, or to realise the asset and settle the liability simultaneously. The financial assets and liabilities subject to offsetting, enforceable master netting and similar agreements as at 31 December 2021 and 2020 were as follows:
Amounts not subject
to netting agreements
Total as presented
in the consolidated
statement of financial
position
Amounts eligible for set off under netting agreements
Related amounts not set off under netting agreements
2021 Gross amount
Amounts offset
Net amount
Financial instruments
Financial collateral
Net amount US$ million
Derivative assets1 19,327 (17,846) 1,481 (437) (315) 729 3,613 5,094 Derivative liabilities1 (22,166) 17,846 (4,320) 437 3,522 (361) (2,467) (6,787)
1 Presented within current and non-current other financial assets and other financial liabilities.
Amounts not subject to netting agreements
Total as presented in the consolidated statement of financial position
Amounts eligible for set off under netting agreements
Related amounts not set off under netting agreements
2020 Gross amount
Amounts offset
Net amount
Financial instruments
Financial collateral
Net amount US$ million
Derivative assets1 11,575 (9,678) 1,897 (246) (925) 726 1,207 3,104 Derivative liabilities1 (12,941) 9,678 (3,263) 246 2,389 (628) (1,701) (4,964)
1 Presented within current and non-current other financial assets and other financial liabilities.
For the financial assets and liabilities subject to enforceable master netting or similar arrangements above, each agreement between the Group and the counterparty allows for net settlement of the relevant financial assets and liabilities in the ordinary course of business. Where practical reasons may prevent net settlement, financial assets and liabilities may be settled on a gross basis, however, each party to the master netting or similar agreement will have the option to settle all such amounts on a net basis in the event of default of the other party. Per the terms of each agreement, an event of default includes failure by a party to make payment when due, failure by a party to perform any obligation required by the agreement (other than payment) if such failure is not remedied within periods of 30 to 60 days after notice of such failure is given to the party or bankruptcy.
29. Fair value measurements
Fair values are primarily determined using quoted market prices or standard pricing models using observable market inputs where available and are presented to reflect the expected gross future cash in/outflows. Glencore classifies the fair values of its financial instruments into a three level hierarchy based on the degree of the source and observability of the inputs that are used to derive the fair value of the financial asset or liability as follows:
Level 1 Inputs are quoted prices (unadjusted) in active markets for identical assets or liabilities that Glencore can assess at the measurement date; or
Level 2 Inputs other than quoted inputs included in Level 1 that are observable for the assets or liabilities, either directly or indirectly; or
Level 3 Unobservable inputs for the assets or liabilities, requiring Glencore to make market-based assumptions.
Level 1 classifications primarily include futures with a tenor of less than one year and options that are exchange traded, whereas Level 2 classifications primarily include futures with a tenor greater than one year, over the counter options, swaps and physical forward transactions which derive their fair value primarily from exchange quotes and readily observable broker quotes. Level 3 classifications primarily include physical forward transactions which derive their fair value predominantly from models that use broker quotes and applicable market-based estimates surrounding location, quality and credit differentials and financial liabilities linked to the fair value of certain mining operations. In circumstances where Glencore cannot verify fair value with observable market inputs (Level 3 fair values), it is possible that a different valuation model could produce a materially different estimate of fair value.

NOTES TO THE FINANCIAL STATEMENTS continued
Glencore Preliminary Results 2021 100
29. Fair value measurements continued
It is Glencore’s policy that transactions and activities in trade related financial instruments be concluded under master netting agreements or long form confirmations to enable balances due to/from a common counterparty to be offset in the event of default, insolvency or bankruptcy by the counterparty.
The following tables show the fair values of the derivative financial instruments including trade related financial and physical forward purchase and sale commitments by type of contract and non-current other financial assets and liabilities as at 31 December 2021 and 2020. Other assets and liabilities which are measured at fair value on a recurring basis are marketing inventories, other investments, cash and cash equivalents. There are no non-recurring fair value measurements.
FINANCIAL ASSETS
2021 US$ million Level 1 Level 2 Level 3 Total Financial assets Accounts receivable (see note 14) – 5,269 175 5,444 Deferred consideration (see note 12) – – 135 135 Other investments (see note 11) 1,536 84 – 1,620 Financial assets 1,536 5,353 310 7,199 Other financial assets Commodity related contracts Futures 180 118 – 298 Options 133 31 – 164 Swaps 256 254 40 550 Physical forwards – 2,878 646 3,524 Financial contracts Cross currency swaps – 5 – 5 Foreign currency and interest rate contracts – 95 – 95 Current other financial assets (see note 28) 569 3,381 686 4,636 Non-current other financial assets Cross currency swaps – 125 – 125 Foreign currency and interest rate contracts – 272 – 272 Purchased call options over Glencore shares1 – 61 – 61 Non-current other financial assets (see note 28) – 458 – 458 Total 2,105 9,192 996 12,293
2020 US$ million Level 1 Level 2 Level 3 Total Financial assets Accounts receivable (see note 14) – 4,468 130 4,598 Deferred consideration (see note 12) – – 302 302 Other investments (see note 11) 1,691 42 – 1,733 Financial assets 1,691 4,510 432 6,633 Other financial assets Commodity related contracts Futures 107 75 – 182 Options 19 13 – 32 Swaps 142 249 – 391 Physical forwards – 916 258 1,174 Financial contracts Cross currency swaps – 219 – 219 Current other financial assets (see note 28) 268 1,472 258 1,998 Non-current other financial assets Cross currency swaps – 529 – 529 Foreign currency and interest rate contracts – 569 – 569 Purchased call options over Glencore shares1 – 8 – 8 Non-current other financial assets (see note 28) – 1,106 – 1,106 Total 1,959 7,088 690 9,737
1 Call options over the Company’s shares in relation to conversion rights of the $500 million non-dilutive convertible bond, due in 2025.

NOTES TO THE FINANCIAL STATEMENTS continued
Glencore Preliminary Results 2021 101
29. Fair value measurements continued
FINANCIAL LIABILITIES
2021 US$ million Level 1 Level 2 Level 3 Total Financial liabilities Accounts payable (see note 25) – 13,806 – 13,806 Current financial liabilities – 13,806 – 13,806 Other financial liabilities Commodity related contracts Futures 1,993 344 – 2,337 Options 52 92 – 144 Swaps 999 175 – 1,174 Physical forwards – 1,872 235 2,107 Financial contracts Cross currency swaps – 227 – 227 Foreign currency and interest rate contracts – 88 – 88 Current other financial liabilities (see note 28) 3,044 2,798 235 6,077 Non-current other financial liabilities Cross currency swaps – 331 – 331 Foreign currency and interest rate contracts – 12 – 12 Non-discretionary dividend obligation1 – – 148 148 Option over non-controlling interest in Ale – – 22 22 Deferred consideration – – 49 49 Embedded call options over Glencore shares2 – 61 – 61 Non-current other financial liabilities (see note 28) – 404 219 623 Total 3,044 17,008 454 20,506
2020 US$ million Level 1 Level 2 Level 3 Total Financial liabilities Accounts payable (see note 25) – 11,264 – 11,264 Current financial liabilities – 11,264 – 11,264 Other financial liabilities Commodity related contracts Futures 2,652 264 – 2,916 Options 29 14 – 43 Swaps 228 224 – 452 Physical forwards – 537 252 789 Financial contracts Cross currency swaps – 76 – 76 Current other financial liabilities (see note 28) 2,909 1,115 252 4,276 Non-current other financial liabilities Cross currency swaps – 171 – 171 Foreign currency and interest rate contracts – 181 – 181 Non-discretionary dividend obligation1 – – 150 150 Option over non-controlling interest in Ale – – 22 22 Deferred consideration – – 56 56 Embedded call options over Glencore shares2 – 8 – 8 Non-current other financial liabilities (see note 28) – 360 228 588 Total 2,909 12,739 480 16,128
1 A ZAR denominated derivative liability payable to ARM Coal, a partner in one of the Group’s principal coal joint operations based in South Africa. The liability arises from ARM Coal’s rights as an investor to a share of agreed free cash flows from certain coal operations in South Africa and is valued based on those cash flows using a risk-adjusted discount rate. The derivative liability is settled over the life of those operations (modelled mine life of 11 years as at 31 December 2021) and has no fixed repayment date and is not cancellable within 12 months.
2 Embedded call option bifurcated from the 2025 convertible bond.

NOTES TO THE FINANCIAL STATEMENTS continued
Glencore Preliminary Results 2021 102
29. Fair value measurements continued
The following table shows the net changes in fair value of Level 3 other financial assets and other financial liabilities:
US$ million Accounts
Receivable Physical
forwards Swaps Other Total
Level 3 1 January 2021 130 6 – 74 210 Total gain recognised in revenue – 117 337 – 454 Total gain/(loss) recognised in cost of goods sold – 389 (297) – 92 Non-discretionary dividend obligation – – – 2 2 Fair value movement of deferred consideration 186 – – (160) 26 Realised (141) (101) – – (242) 31 December 2021 175 411 40 (84) 542 1 January 2020 37 109 – (211) (65) Total gain recognised in revenue – 1 – – 1 Total loss recognised in cost of goods sold – (63) – – (63) Non-discretionary dividend obligation – – – 11 11 Option over non-controlling interest – – – 14 14 Fair value movement of deferred consideration 133 – – 260 393 Realised (40) (41) – – (81) 31 December 2020 130 6 – 74 210
During the year, no amounts were transferred between Level 1 and Level 2 of the fair value hierarchy and no amounts were transferred into or out of Level 3 of the fair value hierarchy for either other financial assets or other financial liabilities.
FAIR VALUE OF FINANCIAL ASSETS / FINANCIAL LIABILITIES Some of the Group’s financial assets and financial liabilities are measured at fair value at the end of each reporting period.
Futures, options and swaps classified as Level 1 financial assets and liabilities are measured using quoted prices in an active market.
Accounts receivable and payables, and certain futures, options, swaps, physical forwards, cross currency swaps, foreign currency and interest rate contracts classified as Level 2 financial assets and liabilities are measured using discounted cash flow models. Key inputs include observable quoted prices sourced from exchanges or traded reference indices in active markets for identical assets or liabilities. Prices are adjusted by a discount rate which captures the time value of money and counterparty credit considerations, as required.
Call options over Glencore shares classified as Level 2 financial assets and liabilities are measured using an option pricing model. Key inputs include the current price of Glencore shares, strike price, maturity date of the underlying convertible debt security, risk-free rate and volatility.
The following table provides information on the valuation techniques and inputs used to determine the fair value of Level 3 financial assets and financial liabilities.

NOTES TO THE FINANCIAL STATEMENTS continued
Glencore Preliminary Results 2021 103
29. Fair value measurements continued
US$ million 2021 2020 Swaps – Level 3 Assets 40 – Liabilities – – Valuation techniques and key inputs: Discounted cash flow model Significant and other unobservable inputs: - Long term commodity prices The significant unobservable inputs represent the long-term commodity prices to which the
valuation remains sensitive to. A 10% increase/decrease in commodity price assumptions would result in a $4 million adjustment to the current carrying value.
Physical Forwards – Level 3 Assets 646 258 Liabilities (235) (252) Valuation techniques and key inputs: Discounted cash flow model Significant and other unobservable inputs: Valuation of the Group’s commodity physical forward contracts categorised within
this level is based on observable market prices that are adjusted by unobservable differentials, as required, including:
– Quality; – Geographic location; – Local supply & demand; – Customer requirements; and – Counterparty credit considerations.
These unobservable inputs generally represent 1%–30% of the overall value of the instruments. The valuation prices are applied consistently to value physical forward sale and purchase contracts, and changing a particular input to reasonably possible alternative assumptions does not result in a material change in the underlying value of the portfolio.
Deferred consideration (Mototolo) – Level 3 Assets 282 391 Liabilities – – Valuation techniques and key inputs: Discounted cash flow model Significant and other unobservable inputs: – Long-term forecast commodity prices;
– Discount rates using weighted average cost of capital methodology;
The significant unobservable inputs represent the long-term forecast commodity prices to which the valuation remains sensitive to. A 10% increase/decrease in commodity price assumptions would result in a $27 million adjustment to the current carrying value.
Deferred consideration (Orion) – Level 3 Assets 28 41 Liabilities – – Valuation techniques and key inputs: Discounted cash flow model Significant and other unobservable inputs: – Estimated production plan; – Long-term forecast commodity prices;
– Discount rates using weighted average cost of capital methodology;
The significant unobservable inputs represent the long-term forecast commodity prices to which the valuation remains sensitive to. A 10% increase/decrease in gold price would result in no adjustment to the current carrying value of the asset, while a 10% decrease in gold price would result in a $9 million negative adjustment
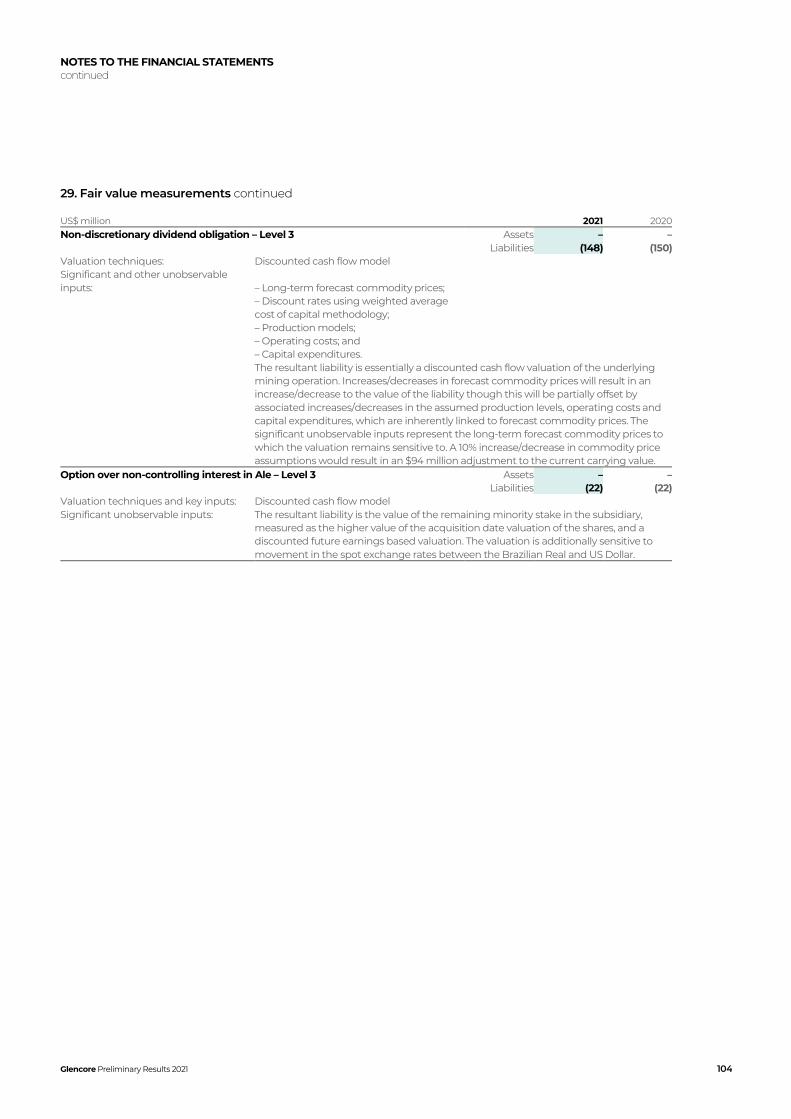
NOTES TO THE FINANCIAL STATEMENTS continued
Glencore Preliminary Results 2021 104
29. Fair value measurements continued
US$ million 2021 2020 Non-discretionary dividend obligation – Level 3 Assets – – Liabilities (148) (150) Valuation techniques: Discounted cash flow model Significant and other unobservable inputs: – Long-term forecast commodity prices;
– Discount rates using weighted average cost of capital methodology;
– Production models; – Operating costs; and – Capital expenditures.
The resultant liability is essentially a discounted cash flow valuation of the underlying mining operation. Increases/decreases in forecast commodity prices will result in an increase/decrease to the value of the liability though this will be partially offset by associated increases/decreases in the assumed production levels, operating costs and capital expenditures, which are inherently linked to forecast commodity prices. The significant unobservable inputs represent the long-term forecast commodity prices to which the valuation remains sensitive to. A 10% increase/decrease in commodity price assumptions would result in an $94 million adjustment to the current carrying value.
Option over non-controlling interest in Ale – Level 3 Assets – – Liabilities (22) (22) Valuation techniques and key inputs: Discounted cash flow model Significant unobservable inputs: The resultant liability is the value of the remaining minority stake in the subsidiary,
measured as the higher value of the acquisition date valuation of the shares, and a discounted future earnings based valuation. The valuation is additionally sensitive to movement in the spot exchange rates between the Brazilian Real and US Dollar.

NOTES TO THE FINANCIAL STATEMENTS continued
Glencore Preliminary Results 2021 105
30. Future commitments
Capital expenditure for the acquisition of property, plant and equipment is generally funded through the cash flow generated by the respective industrial entities. As at 31 December 2021, $1,111 million (2020: $859 million), of which 86% (2020: 87%) relates to expenditure to be incurred over the next year, was contractually committed for the acquisition of property, plant and equipment.
Certain of Glencore’s exploration tenements and licences require it to spend a minimum amount per year on development activities, a significant portion of which would have been incurred in the ordinary course of operations. As at 31 December 2021, $118 million (2020: $128 million) of such development expenditures are to be incurred, of which 27% (2020: 27%) are for commitments to be settled over the next year.
As part of Glencore’s ordinary sourcing and procurement of physical commodities and other ordinary marketing obligations, the selling party may request that a financial institution act as either a) the paying party upon the delivery of product and qualifying documents through the issuance of a letter of credit or b) the guarantor by way of issuing a bank guarantee accepting responsibility for Glencore’s contractual obligations. Similarly, Glencore is required to post rehabilitation and pension guarantees in respect of some of these future, primarily industrial, long-term obligations. As at 31 December 2021, $8,965 million (2020: $6,334 million) of procurement and $4,353 million (2020: $4,138 million) of rehabilitation and pension commitments have been issued on behalf of Glencore, which will generally be settled simultaneously with the payment for such commodity and rehabilitation and pension obligations.
ASTRON RELATED COMMITMENTS As part of the regulatory approval process relating to the acquisition of a 75% shareholding in Astron Energy, Glencore and Astron Energy entered into certain commitments (subject to variation for good cause) with the South Africa Competition Tribunal and the South African Economic Development Department. These commitments include investment expenditure of up to ZAR 6.5 billion ($410 million) over the period to 2024 so as to debottleneck and improve the performance of the Cape Town oil refinery, contribute to the rebranding of certain retail sites and establish a development fund to support small and black-owned businesses in Astron Energy’s value chain.
CERREJON ACQUISITION COMMITMENTS In June 2021, Glencore entered into agreements to acquire the remaining 66.67% interest in the Cerrejón joint venture that it does not own. The transaction closed in January 2022, refer to note 34. The purchase price consideration of $588 million was based on an economic effective date of 31 December 2020 then being subject to purchase price adjustments calculated at closing. After taking into account the dividends generated during 2021, together with certain other adjustments, the completion cash payment by Glencore amounted to $101 million.
31. Contingent liabilities
There were no corporate guarantees in favour of third parties as at 31 December 2021 (2020: None), except those disclosed in note 11. The Group is subject to various legal and regulatory proceedings as detailed below. These contingent liabilities are reviewed on a regular basis and where appropriate an estimate is made of the potential financial impact on the Group. As at 31 December 2021 and 2020, it was not feasible to make such an assessment.
LEGAL AND REGULATORY PROCEEDINGS Under IAS 37 Provisions, Contingent Liabilities and Contingent Assets, a provision is recognised when Glencore has a present obligation (legal or constructive), as a result of a past event, and it is probable that an outflow of resources embodying economic benefits, that can be reliably estimated, will be required to settle the liability. A contingent liability is a possible obligation that arises from a past event and whose existence will be confirmed only by the occurrence or non-occurrence of one or more uncertain future events not wholly within the control of Glencore. If it is not clear whether there is a present obligation, a past event is deemed to give rise to a present obligation if, taking account of all available evidence, it is more likely than not that a present obligation exists at the end of the reporting period. When a present obligation arises but it is not probable that an outflow of resources embodying economic benefits will be required to settle the obligation or the amount of the obligation cannot be measured with sufficient reliability, a contingent liability is disclosed.
INVESTIGATIONS BY REGULATORY AND ENFORCEMENT AUTHORITIES As described in note 23 the Group is subject to various legal and regulatory proceedings and as at December 2021 a provision for certain of these matters of $1,500 million has been recognised.
At 31 December 2021, taking account of all available evidence, the Committee concluded that, with respect only to the OAG and Dutch investigations, it is not probable that a present obligation existed at the end of the reporting period. In addition, the timing and amount, if any, of the possible financial effects (such as fines, penalties or damages, which could be material) or other consequences, including external costs, from the OAG and Dutch investigations and any change in their scope are not currently possible to predict or estimate.

NOTES TO THE FINANCIAL STATEMENTS continued
Glencore Preliminary Results 2021 106
31. Contingent liabilities continued
In addition to any pending investigations as described, other authorities may commence investigations or bring proceedings against the Group in connection with the matters under investigation and the Group may be the subject of legal claims brought by other parties in connection with these matters, including class action suits. Taking into account all available evidence, the Committee does not consider it probable that a present obligation existed in relation to these potential additional investigations or claims as at the balance sheet date, and the amount of any financial effects, which could be material, is not currently possible to predict or estimate.
OTHER LEGAL PROCEEDINGS Other claims and unresolved disputes are pending against Glencore. However, based on the Group’s current assessment of these matters any future individually material financial obligations are considered to be remote.
ENVIRONMENTAL CONTINGENCIES Glencore’s operations are subject to various environmental laws and regulations. Glencore is not aware of any material non-compliance with those laws and regulations. Glencore accrues for environmental contingencies when such contingencies are probable and reasonably estimable. Such accruals are adjusted as new information develops or circumstances change. Recoveries of environmental remediation costs from insurance companies and other parties are recorded as assets when the recoveries are virtually certain. At this time, Glencore is unaware of any material environmental incidents at its locations. Any potential liability arising from environmental incidents in the ordinary course of the Group’s business would not usually be expected to have a material adverse effect on its consolidated income, financial position or cash flows.
32. Related party transactions
In the normal course of business, Glencore enters into various arm’s length transactions with related parties, including fixed price commitments to sell and to purchase commodities, forward sale and purchase contracts, agency agreements and management service agreements. Outstanding balances at period end are unsecured and settlement occurs in cash (see notes 12, 14 and 25). There have been no guarantees provided or received for any related party receivables or payables.
All transactions between Glencore and its subsidiaries are eliminated on consolidation along with any unrealised profits and losses between its subsidiaries, associates and joint ventures. In 2021, sales and purchases with associates and joint ventures amounted to $3,828 million (2020: $2,710 million) and $6,469 million (2020: $5,033 million) respectively.
33. Principal subsidiaries with material non-controlling interests
Non-controlling interest is comprised of the following:
US$ million 2021 2020 Volcan (106) (136) Kazzinc 1,368 1,362 Koniambo (5,180) (4,098) Kamoto Copper Company (KCC) 474 232 Mopani1 – (1,009) Other2 430 414 Total (3,014) (3,235)
1 See note 26. 2 Other comprises various subsidiaries in which no individual balance attributable to non-controlling interests is material.

NOTES TO THE FINANCIAL STATEMENTS continued
Glencore Preliminary Results 2021 107
33. Principal subsidiaries with material non-controlling interests continued
Summarised financial information in respect of Glencore’s subsidiaries that have material non-controlling interest as at 31 December 2021 and 2020, reflecting 100% of the underlying subsidiary’s relevant figures, is set out below.
US$ million Mopani1 Kazzinc Koniambo KCC Volcan 31 December 2021 Non-current assets – 4,210 434 5,266 1,796 Current assets – 1,515 461 1,135 400 Total assets – 5,725 895 6,401 2,196 Non-current liabilities – 721 13,822 9,313 980 Current liabilities – 480 104 804 789 Total liabilities – 1,201 13,926 10,117 1,769 Net assets – 4,524 (13,031) (3,716) 427 Equity attributable to owners of the Company – 3,156 (7,851) (4,190) 533 Non-controlling interest – 1,368 (5,180) 474 (106) Non-controlling interest % 0.0% 30.3% 51.0% 25.0% 76.7% 2021 Revenue 125 3,502 242 3,899 981 Expenses (1,155) (2,940) (2,364) (2,820) (941) Net (loss)/profit for the year (1,030) 562 (2,122) 1,079 40 (Loss)/profit attributable to owners of the Company (1,027) 392 (1,040) 837 9 (Loss)/profit attributable to non-controlling interests (3) 170 (1,082) 242 31 Total comprehensive (loss)/income for the year (1,030) 562 (2,122) 1,079 40 Dividends paid to non-controlling interests – (150) – – – Net cash inflow/(outflow) from operating activities 56 837 (165) 1,708 318 Net cash outflow from investing activities (4) (318) (13) (301) (174) Net cash (outflow)/inflow from financing activities (26) (394) 193 (1,294) (28) Total net cash inflow 26 125 15 113 116
1 See note 26.
US$ million Mopani Kazzinc Koniambo KCC Volcan 31 December 2020 Non-current assets – 4,407 1,594 5,194 1,793 Current assets 1,083 1,167 307 1,668 293 Total assets 1,083 5,574 1,901 6,862 2,086 Non-current liabilities 4,601 737 12,719 9,983 1,350 Current liabilities 197 333 91 1,566 348 Total liabilities 4,798 1,070 12,810 11,549 1,698 Net assets (3,715) 4,504 (10,909) (4,687) 388 Equity attributable to owners of the Company (2,706) 3,142 (6,811) (4,919) 524 Non-controlling interest (1,009) 1,362 (4,098) 232 (136) Non-controlling interest % 26.9% 30.3% 51.0% 25.0% 76.7% 2020 Revenue 731 3,032 239 2,431 547 Expenses (1,649) (2,418) (1,201) (2,080) (2,307) Net (loss)/profit for the year (918) 614 (962) 351 (1,760) (Loss)/profit attributable to owners of the Company (616) 428 (471) 256 (413) (Loss)/profit attributable to non-controlling interests (302) 186 (491) 95 (1,347) Total comprehensive (loss)/income for the year (918) 614 (962) 351 (1,760) Dividends paid to non-controlling interests – (120) – – – Net cash (outflow)/inflow from operating activities (19) 1,010 (194) 144 129 Net cash outflow from investing activities (84) (388) (36) (472) (117) Net cash inflow/(outflow) from financing activities 103 (597) 233 146 67 Total net cash inflow/(outflow) – 25 3 (182) 79

NOTES TO THE FINANCIAL STATEMENTS continued
Glencore Preliminary Results 2021 108
34. Subsequent events
On 11 January 2022, the Group completed the acquisition of the remaining 66.67% interest in Cerrejon that it did not own. The purchase price consideration of $588 million was based on an economic effective date of 31 December 2020. After taking into account the dividends generated during 2021, together with certain other adjustments, the completion cash payment made by Glencore amounted to $101 million.
The acquisition increases Glencore’s total ownership to 100% providing it with the ability to exercise control. As a result, effective the acquisition date, Glencore will fully consolidate Cerrejon which as at 31 December 2021 reported assets and liabilities of:
US$ million Cerrejón Non-current assets 2,033 Current assets 1,030 Non-current liabilities (690) Current liabilities (509) The above assets and liabilities include the following: Cash and cash equivalents 511 Current financial liabilities1 (27) Non-current financial liabilities1 (14) Net assets 31 December 2021 1,864
1 Financial liabilities exclude trade, other payables and provisions.
Due to the timing of the transaction, management is in the preliminary stages of determining fair values of the assets and liabilities acquired and the associated accounting for the acquisition. Certain disclosures in terms of IFRS 3 relating to the business combination such as the estimated fair value of net assets acquired have not been presented. Notwithstanding these circumstances, should the above book value of net assets approximate fair value and, adjusting for the consideration paid and the 31 December 2021 carrying value of our 33.33% interest (see note 11), a gain on acquisition of some $1.2 billion could result.

ALTERNATIVE PERFORMANCE MEASURES
Glencore Preliminary Results 2021 109
Alternative performance measures are denoted by the symbol ◊
When assessing and discussing the Group’s reported financial performance, financial position and cash flows, Glencore makes reference to Alternative performance measures (APMs), which are not defined or specified under the requirements of IFRS, but are derived from the financial statements prepared in accordance with IFRS. The APMs are consistent with how business performance is measured and reported within the internal management reporting to the Board and management and assist in providing meaningful analysis of the Group’s results both internally and externally in discussions with the financial analyst and investment community.
The Group uses APMs to aid the comparability of information between reporting periods and segments and to aid the understanding of the activity taking place across the Group by adjusting for items that are of an infrequent nature and by aggregating or disaggregating (notably in the case of relevant material associates and joint ventures accounted for on an equity basis) certain IFRS measures. APMs are also used to approximate the underlying operating cash flow generation of the operations (Adjusted EBITDA).
Investments in the extractive industry are typically significant and the initial spend generally occurs over several years, “upfront”, prior to the operations generating cash. As a result, the investments are sometimes made with partners and an assessment to approximate the operating cash flow generation/pay-back of the investment (Adjusted EBITDA) is required. Against this backdrop, the key APMs used by Glencore are Adjusted EBITDA, Net funding/Net debt and the disaggregation of the equivalent key APMs of our relevant material associates and joint ventures (“Proportionate adjustment”) to enable a consistent evaluation of the financial performance and returns attributable to the Group.
Adjusted EBITDA is a useful approximation of the operating cash flow generation by eliminating depreciation and amortisation adjustments. Adjusted EBITDA is not a direct measure of our liquidity, which is shown by our cash flow statement and needs to be considered in the context of our financial commitments.
Proportionate adjustments are useful to enable a consistent evaluation of the financial performance and returns available to the Group, irrespective of the differing accounting treatments required to account for our minority/joint ownership interests of our relevant material investments.
Net funding is an aggregation of IFRS measures (Borrowings less cash and cash equivalents) and Net debt is Net funding less Readily marketable inventories and provides a measure of our financial leverage and, through Net debt to Adjusted EBITDA relationships, provides an indication of relative financial strength and flexibility.
APMs used by Glencore may not be comparable with similarly titled measures and disclosures by other companies. APMs have limitations as an analytical tool, and a user of the financial statements should not consider these measures in isolation from, or as a substitute for, analysis of the Group’s results of operations; and they may not be indicative of the Group’s historical operating results, nor are they meant to be a projection or forecast of its future results.
Listed below are the definitions and reconciliations to the underlying IFRS measures of the various APMs used by the Group.
Proportionate adjustment For internal reporting and analysis, management evaluates the performance of Antamina copper/zinc mine (34% owned), Cerrejón coal mine (33% owned) and Collahuasi copper mine (44% owned) under the proportionate consolidation method reflecting Glencore’s proportionate share of the revenues, expenses, assets and liabilities of these investments.
Although Glencore has a voting interest in Volcan of 63%, its total economic interest is only 23.3%. For internal reporting and analysis, management evaluates the performance of Volcan under the equity method, reflecting the Group’s relatively low 23.3% economic ownership in this fully ring-fenced listed entity, with its stand-alone, independent and separate capital structure. The impact is that we reflect 23.3% of Volcan’s net income in the Group’s Adjusted EBIT/EBITDA and its consolidated results are excluded from all other APM’s, including production data.
The Viterra joint venture is a stand-alone group with a fully independent capital structure, governance and credit profile, supporting a global business, across many geographies, products and activities. Glencore’s management evaluates this investment’s financial performance on a net return basis, as opposed to an Adjusted EBITDA basis and thus, the financial results of Viterra are presented on a basis consistent with its underlying IFRS treatment (equity accounting).
See reconciliation of revenue and relevant material associates’ and joint ventures’ Adjusted EBIT to “Share of net income from associates and joint ventures” below.

ALTERNATIVE PERFORMANCE MEASURES continued
Glencore Preliminary Results 2021 110
APMS DERIVED FROM THE STATEMENT OF INCOME Revenue Revenue represents revenue by segment (see note 2 of the financial statements), as reported on the face of the statement of income plus the relevant Proportionate adjustments. See reconciliation table below.
US$ million 2021 2020 Revenue – Marketing activities 181,764 124,137 Revenue – Industrial activities 60,810 41,453 Intersegment eliminations (34,642) (20,803) Revenue - segmental 207,932 144,787 Proportionate adjustment material associates and joint ventures – revenue (5,162) (2,996) Proportionate adjustment Volcan – revenue 981 547 Revenue – reported measure 203,751 142,338
Share of income from material associates and joint ventures
US$ million 2021 2020 Associates’ and joint ventures’ Adjusted EBITDA 4,001 2,061 Depreciation and amortisation (687) (683) Associates’ and joint ventures’ Adjusted EBIT 3,314 1,378 Impairment, net of tax1 – (445) Net finance costs 4 (56) Income tax expense (1,211) (524) (1,207) (1,025) Share of income from relevant material associates and joint ventures 2,107 353 Share of income from other associates and joint ventures 511 91 Share of income from associates and joint ventures2 2,618 444
1 In 2020, Industrial activities segment comprised an impairment of $445 million, net of taxes of $211 million, relating to Cerrejón, resulting from lower API2 coal price assumptions and reduced production estimates, including updated mine-life approval expectations.
2 Comprises share in earnings of $492 million (2020: $197 million) from Marketing activities and share in earnings of $2,126 million (2020: $247 million) from Industrial activities.
Adjusted EBIT/EBITDA Adjusted EBIT/EBITDA provide insight into our overall business performance (a combination of cost management, seizing market opportunities and growth), and are the corresponding flow drivers towards our objective of achieving industry-leading returns.
Adjusted EBIT is the net result of revenue less cost of goods sold and selling and administrative expenses, plus share of income from associates and joint ventures, dividend income and the attributable share of Adjusted EBIT of relevant material associates and joint ventures, which are accounted for internally by means of proportionate consolidation, excluding Significant items, see below.

ALTERNATIVE PERFORMANCE MEASURES continued
Glencore Preliminary Results 2021 111
Adjusted EBITDA consists of Adjusted EBIT plus depreciation and amortisation, including the related Proportionate adjustments. See reconciliation table below.
US$ million 2021 2020 Reported measures
Revenue 203,751 142,338 Cost of goods sold (191,370) (138,640) Selling and administrative expenses (2,115) (1,681) Share of income from associates and joint ventures 2,618 444 Dividend income 23 32
12,907 2,493 Adjustments to reported measures
Share of associates’ significant items 11 92 Movement in unrealised inter-segment profit elimination 549 760 Proportionate adjustment material associates and joint ventures – net finance, impairment and income tax expense 1,207 1,025 Proportionate adjustment Volcan – net finance, income tax expense and non-controlling interests (179) 46
Adjusted EBIT 14,495 4,416 Depreciation and amortisation 6,335 6,671 Proportionate adjustment material associates and joint ventures – depreciation 687 683 Proportionate adjustment Volcan - depreciation (194) (210) Adjusted EBITDA 21,323 11,560
Significant items Significant items of income and expense which, due to their variable financial impact or the expected infrequency of the events giving rise to them, are separated for internal reporting and analysis of Glencore’s results to aid in an understanding and comparative basis of the underlying financial performance. Refer to reconciliation below.
Reconciliation of net significant items 2021
US$ million
Gross significant
charges Non-controlling interests’ share
Significant items tax
Equity holders’ share
Share of Associates' significant items1 (11) – – (11) Movement in unrealised inter-segment profit elimination1 (549) – 77 (472) Loss on disposals of non-current assets2 (607) – (23) (630) Other expense – net3 (1,947) (4) (6) (1,957) Tax significant items in their own right4 – – 56 56 (3,114) (4) 104 (3,014) Impairments attributable to equity holders
Impairments5 (1,838) 668 33 (1,137) (1,838) 668 33 (1,137) Total significant items (4,952) 664 137 (4,151)
1 See note 2 of the financial statements. 2 See note 4 of the financial statements. 3 See note 5 of the financial statements. 4 Relates to foreign exchange fluctuations ($52 million) and tax losses not recognised ($15 million) less adjustments in respect of prior years ($11 million), see note 8 of the financial
statements. 5 See note 7 of the financial statements.

ALTERNATIVE PERFORMANCE MEASURES continued
Glencore Preliminary Results 2021 112
Reconciliation of net significant items 2020
US$ million
Gross significant
charges Non-controlling interests’ share
Significant items tax
Equity holders’ share
Share of Associates' significant items1 (92) – – (92) Movement in unrealised inter-segment profit elimination1 (760) – 80 (680) Loss on disposals of non-current assets2 (36) – – (36) Other expense – net3 (173) (12) (69) (254) Tax significant items in their own right4 – – 479 479 (1,061) (12) 490 (583) Impairments attributable to equity holders
Impairments5 (3,600) 350 270 (2,980) Impairment Volcan5 (2,347) 1,251 716 (380) Impairments - net, related to material associates and joint ventures6 (445) – – (445)
(6,392) 1,601 986 (3,805) Total significant items (7,453) 1,589 1,476 (4,388)
1 See note 2 of the financial statements. 2 See note 4 of the financial statements. 3 See note 5 of the financial statements. 4 Tax expenses related to certain recognition of tax adjustments ($724 million), offset by tax expenses related to foreign exchange fluctuations ($76 million) and tax losses not recognised
($169 million), see note 8 of the financial statements. 5 See note 7 of the financial statements. 6 See Proportionate adjustment reconciliation above.
Net income attributable to equity shareholder pre-significant items Net income attributable to equity shareholders pre-significant items is a measure of our ability to generate shareholder returns. The calculation of tax items to be excluded from Net income, includes the tax effect of significant items and significant tax items themselves. Refer to reconciliation below.
US$ million 2021 2020 Income/(loss) attributable to equity holders of the Parent 4,974 (1,903) Significant items 4,151 4,388 Income attributable to equity holders of the Parent pre-significant items 9,125 2,485
APMS DERIVED FROM THE STATEMENT OF FINANCIAL POSITION
Net funding/Net debt and Net debt to Adjusted EBITDA Net funding/debt demonstrates how our debt is being managed and is an important factor in ensuring we maintain investment grade credit rating status and a competitive cost of capital. Net funding is defined as total current and non-current borrowings less cash and cash equivalents and related Proportionate adjustments. Net debt is defined as Net funding less readily marketable inventories and related Proportionate adjustments. Consistent with the general approach in relation to our internal reporting and evaluation of Volcan, its consolidated net debt has also been adjusted to reflect the Group’s relatively low 23.3% economic ownership (compared to its 63% voting interest) in this still fully ring-fenced listed entity, with its standalone, independent and separate capital structure. Furthermore, the relationship of Net debt to Adjusted EBITDA provides an indication of financial flexibility. See reconciliation table below.
Readily marketable inventories (RMI) RMI comprising the core inventories which underpin and facilitate Glencore’s marketing activities, represent inventories, that in Glencore’s assessment, are readily convertible into cash in the short term due to their liquid nature, widely available markets and the fact that price risk is primarily covered either by a forward physical sale or hedge transaction. Glencore regularly assesses the composition of these inventories and their applicability, relevance and availability to the marketing activities. As at 31 December 2021, $24,795 million (2020: $19,584 million) of inventories were considered readily marketable. This comprises $16,073 million (2020: $12,260 million) of inventories carried at fair value less costs of disposal and $8,722 million (2020: $7,324 million) carried at the lower of cost or net realisable value. Total readily marketable inventories includes $125 million (2020: $128 million) related to the relevant material associates and joint ventures (see note 2) presented under the proportionate consolidation method, comprising inventory carried at lower of cost or net realisable value. Given the highly liquid nature of these inventories, which represent a significant share of current assets, the Group believes it is appropriate to consider them together with cash equivalents in analysing Group net debt levels and computing certain debt coverage ratios and credit trends.
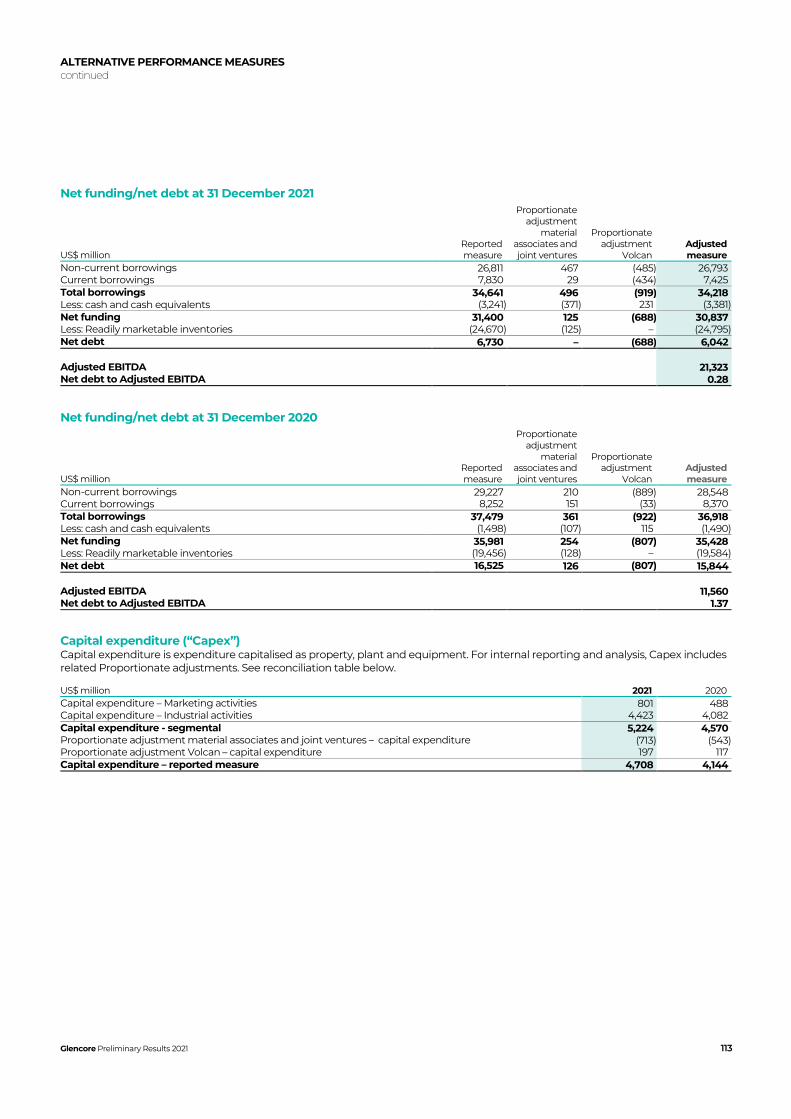
ALTERNATIVE PERFORMANCE MEASURES continued
Glencore Preliminary Results 2021 113
Net funding/net debt at 31 December 2021
US$ million Reported measure
Proportionate adjustment
material associates and joint ventures
Proportionate adjustment
Volcan Adjusted measure
Non-current borrowings 26,811 467 (485) 26,793 Current borrowings 7,830 29 (434) 7,425 Total borrowings 34,641 496 (919) 34,218 Less: cash and cash equivalents (3,241) (371) 231 (3,381) Net funding 31,400 125 (688) 30,837 Less: Readily marketable inventories (24,670) (125) – (24,795) Net debt 6,730 – (688) 6,042 Adjusted EBITDA 21,323 Net debt to Adjusted EBITDA 0.28
Net funding/net debt at 31 December 2020
US$ million Reported measure
Proportionate adjustment
material associates and joint ventures
Proportionate adjustment
Volcan Adjusted measure
Non-current borrowings 29,227 210 (889) 28,548 Current borrowings 8,252 151 (33) 8,370 Total borrowings 37,479 361 (922) 36,918 Less: cash and cash equivalents (1,498) (107) 115 (1,490) Net funding 35,981 254 (807) 35,428 Less: Readily marketable inventories (19,456) (128) – (19,584) Net debt 16,525 126 (807) 15,844 Adjusted EBITDA 11,560 Net debt to Adjusted EBITDA 1.37
Capital expenditure (“Capex”) Capital expenditure is expenditure capitalised as property, plant and equipment. For internal reporting and analysis, Capex includes related Proportionate adjustments. See reconciliation table below.
US$ million 2021 2020 Capital expenditure – Marketing activities 801 488 Capital expenditure – Industrial activities 4,423 4,082 Capital expenditure - segmental 5,224 4,570 Proportionate adjustment material associates and joint ventures – capital expenditure (713) (543) Proportionate adjustment Volcan – capital expenditure 197 117 Capital expenditure – reported measure 4,708 4,144
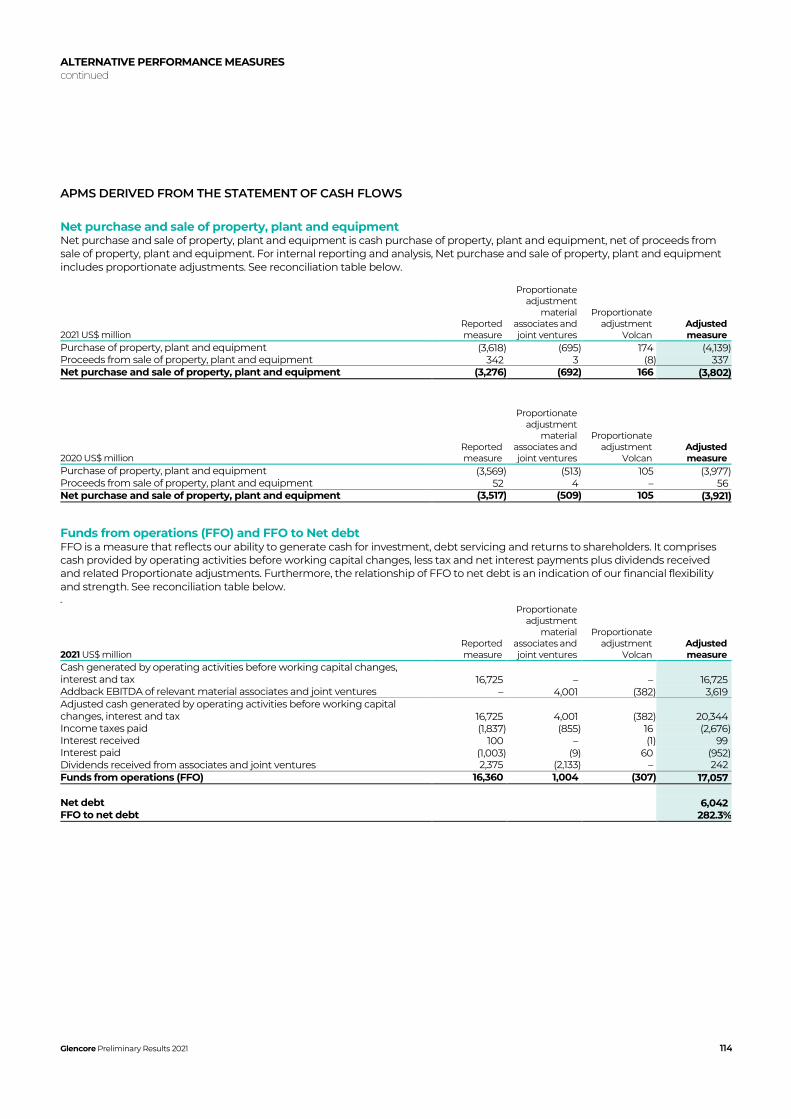
ALTERNATIVE PERFORMANCE MEASURES continued
Glencore Preliminary Results 2021 114
APMS DERIVED FROM THE STATEMENT OF CASH FLOWS
Net purchase and sale of property, plant and equipment Net purchase and sale of property, plant and equipment is cash purchase of property, plant and equipment, net of proceeds from sale of property, plant and equipment. For internal reporting and analysis, Net purchase and sale of property, plant and equipment includes proportionate adjustments. See reconciliation table below.
2021 US$ million Reported measure
Proportionate adjustment
material associates and joint ventures
Proportionate adjustment
Volcan Adjusted measure
Purchase of property, plant and equipment (3,618) (695) 174 (4,139) Proceeds from sale of property, plant and equipment 342 3 (8) 337 Net purchase and sale of property, plant and equipment (3,276) (692) 166 (3,802)
2020 US$ million Reported measure
Proportionate adjustment
material associates and joint ventures
Proportionate adjustment
Volcan Adjusted measure
Purchase of property, plant and equipment (3,569) (513) 105 (3,977) Proceeds from sale of property, plant and equipment 52 4 – 56 Net purchase and sale of property, plant and equipment (3,517) (509) 105 (3,921)
Funds from operations (FFO) and FFO to Net debt FFO is a measure that reflects our ability to generate cash for investment, debt servicing and returns to shareholders. It comprises cash provided by operating activities before working capital changes, less tax and net interest payments plus dividends received and related Proportionate adjustments. Furthermore, the relationship of FFO to net debt is an indication of our financial flexibility and strength. See reconciliation table below. 2021
2021 US$ million Reported measure
Proportionate adjustment
material associates and joint ventures
Proportionate adjustment
Volcan Adjusted measure
Cash generated by operating activities before working capital changes, interest and tax 16,725 – – 16,725 Addback EBITDA of relevant material associates and joint ventures – 4,001 (382) 3,619 Adjusted cash generated by operating activities before working capital changes, interest and tax 16,725 4,001 (382) 20,344 Income taxes paid (1,837) (855) 16 (2,676) Interest received 100 – (1) 99 Interest paid (1,003) (9) 60 (952) Dividends received from associates and joint ventures 2,375 (2,133) – 242 Funds from operations (FFO) 16,360 1,004 (307) 17,057 Net debt 6,042 FFO to net debt 282.3%

ALTERNATIVE PERFORMANCE MEASURES continued
Glencore Preliminary Results 2021 115
2020 US$ million Reported measure
Proportionate adjustment
material associates and joint ventures
Proportionate adjustment
Volcan Adjusted measure
Cash generated by operating activities before working capital changes, interest and tax 8,568 – – 8,568 Addback EBITDA of relevant material associates and joint ventures – 2,061 (131) 1,930 Non-cash adjustments included within EBITDA – 15 – 15 Adjusted cash generated by operating activities before working capital changes, interest and tax 8,568 2,076 (131) 10,513 Income taxes paid (820) (383) 14 (1,189) Interest received 100 1 (1) 100 Interest paid (1,174) (12) 44 (1,142) Dividends received from associates and joint ventures 1,015 (972) – 43 Funds from operations (FFO) 7,689 710 (74) 8,325 Net debt 15,844 FFO to net debt 52.5%

OTHER RECONCILIATIONS
Glencore Preliminary Results 2021 116
AVAILABLE COMMITTED LIQUIDITY1
US$ million 2021 2020 Cash and cash equivalents – reported 3,241 1,498 Proportionate adjustment – cash and cash equivalents 140 (8) Headline committed syndicated revolving credit facilities 11,222 14,625 Amount drawn under syndicated revolving credit facilities (2,543) (4,766) Amounts drawn under U.S. commercial paper programme (1,764) (1,090) Total 10,296 10,259
1 Presented on an adjusted measured basis.
CASH FLOW RELATED ADJUSTMENTS 2021
US$ million Reported measure
Proportionate adjustment
material associates and joint ventures
Proportionate adjustment
Volcan Adjusted measure
Funds from operations (FFO) 16,360 1,004 (307) 17,057 Working capital changes (5,125) (179) 15 (5,289) Net cash received from disposal of subsidiaries 252 – – 252 Purchase of investments (86) – – (86) Proceeds from sale of investments 194 – – 194 Purchase of property, plant and equipment (3,618) (695) 174 (4,139) Proceeds from sale of property, plant and equipment 342 3 (8) 337 Margin payments in respect of financing related hedging activities (970) – – (970) Proceeds received on acquisition of non-controlling interests in subsidiaries 10 – – 10 Return of capital/distributions to non-controlling interests (163) – – (163) Purchase of own shares (746) – – (746) Distributions paid to equity holders of the Parent (2,115) – – (2,115) Cash movement in net funding 4,335 133 (126) 4,342
CASH FLOW RELATED ADJUSTMENTS 2020
US$ million Reported measure
Proportionate adjustment
material associates and joint ventures
Proportionate adjustment
Volcan Adjusted measure
Funds from operations (FFO) 7,689 710 (74) 8,325 Working capital changes (4,010) (314) 6 (4,318) Net cash received from disposal of subsidiaries (222) – – (222) Purchase of investments (122) – – (122) Proceeds from sale of investments 135 – – 135 Purchase of property, plant and equipment (3,569) (513) 105 (3,977) Proceeds from sale of property, plant and equipment 52 4 – 56 Margin receipt in respect of financing related hedging activities 1,040 – – 1,040 Proceeds paid on acquisition of non-controlling interests in subsidiaries (56) – – (56) Return of capital/distributions to non-controlling interests (127) – – (127) Cash movement in net funding 810 (113) 37 734

OTHER RECONCILIATIONS continued
Glencore Preliminary Results 2021 117
Applicable tax rate The applicable tax rate represents the effective tax rate which is computed based on the income tax expense, pre-significant items and related Proportionate adjustments, divided by the earnings before tax, pre-significant items and related Proportionate adjustments. See reconciliation table below.
RECONCILIATION OF TAX EXPENSE 2021
US$ million Total Adjusted EBIT, pre-significant items 14,495 Net finance costs (1,140) Adjustments for:
Net finance costs from material associates and joint ventures 4 Proportional adjustment and net finance costs - Volcan 55
Share of income from other associates pre-significant items (522) Profit on a proportionate consolidation basis before tax and pre-significant items 12,892 Income tax expense, pre-significant items (3,163) Adjustments for:
Tax expense from material associates and joint ventures (1,211) Tax expense from Volcan 54
Tax expense on a proportionate consolidation basis (4,320) Applicable tax rate 33.5%
US$ million Pre-significant
tax expense Significant items tax1
Total tax expense
Tax expense/(income) on a proportionate consolidation basis 4,320 (137) 4,183 Adjustment in respect of material associates and joint ventures – tax (1,211) – (1,211) Adjustment in respect of Volcan – tax 54 – 54 Tax expense/(income) on the basis of the income statement 3,163 (137) 3,026
1 See table above.
RECONCILIATION OF TAX EXPENSE 2020
US$ million Total Adjusted EBIT, pre-significant items 4,416 Net finance costs (1,453) Adjustments for:
Net finance costs from material associates and joint ventures (56) Proportional adjustment and net finance costs - Volcan 84
Share of income from other associates pre-significant items (183) Profit on a proportionate consolidation basis before tax and pre-significant items 2,808 Income tax expense, pre-significant items (306) Adjustments for:
Tax expense from material associates and joint ventures (524) Tax credit from Volcan (3)
Tax expense on a proportionate consolidation basis (833) Applicable tax rate 29.7%
US$ million Pre-significant
tax expense Significant items tax1
Total tax expense
Tax expense/(credit) on a proportionate consolidation basis 833 (971) (138) Adjustment in respect of material associates and joint ventures – tax (524) 211 (313) Adjustment in respect of Volcan – tax (3) (716) (719) Tax expense/(credit) on the basis of the income statement 306 (1,476) (1,170)
1 See table above.
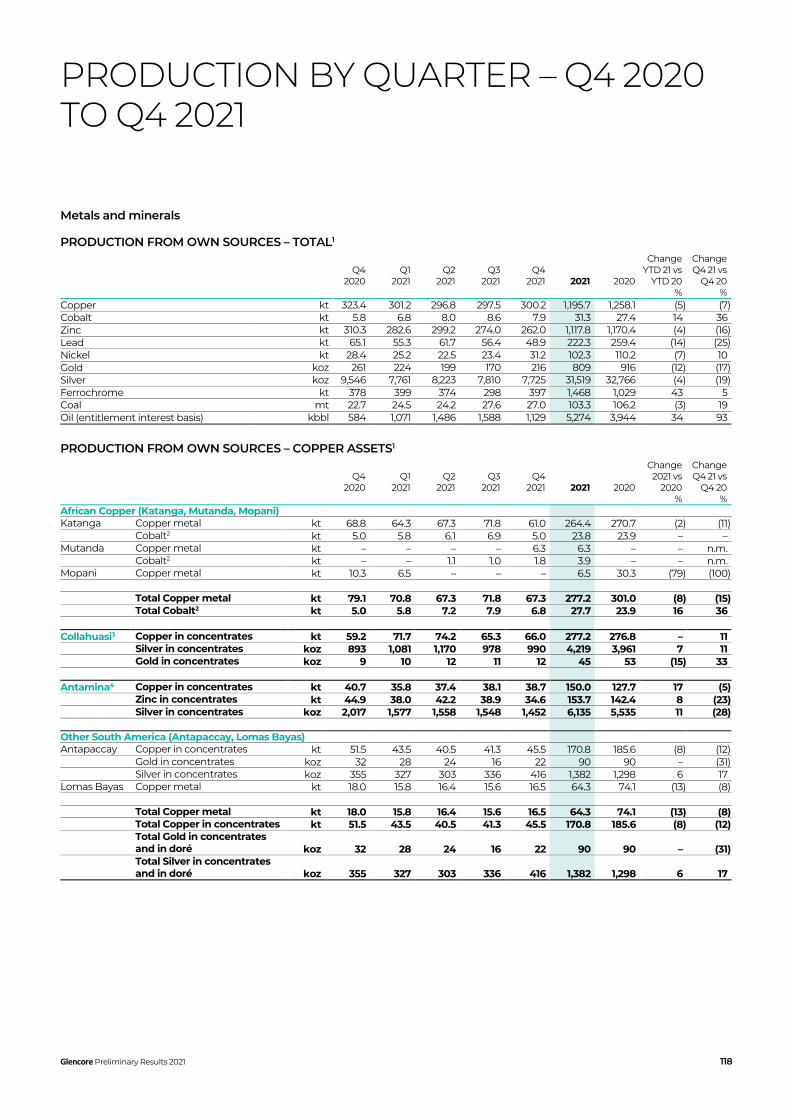
PRODUCTION BY QUARTER – Q4 2020 TO Q4 2021
Glencore Preliminary Results 2021 118
Metals and minerals
PRODUCTION FROM OWN SOURCES – TOTAL1
Q4 2020
Q1 2021
Q2 2021
Q3 2021
Q4 2021
2021
2020
Change YTD 21 vs
YTD 20 %
Change Q4 21 vs
Q4 20 %
Copper kt 323.4 301.2 296.8 297.5 300.2 1,195.7 1,258.1 (5) (7) Cobalt kt 5.8 6.8 8.0 8.6 7.9 31.3 27.4 14 36 Zinc kt 310.3 282.6 299.2 274.0 262.0 1,117.8 1,170.4 (4) (16) Lead kt 65.1 55.3 61.7 56.4 48.9 222.3 259.4 (14) (25) Nickel kt 28.4 25.2 22.5 23.4 31.2 102.3 110.2 (7) 10 Gold koz 261 224 199 170 216 809 916 (12) (17) Silver koz 9,546 7,761 8,223 7,810 7,725 31,519 32,766 (4) (19) Ferrochrome kt 378 399 374 298 397 1,468 1,029 43 5 Coal mt 22.7 24.5 24.2 27.6 27.0 103.3 106.2 (3) 19 Oil (entitlement interest basis) kbbl 584 1,071 1,486 1,588 1,129 5,274 3,944 34 93
PRODUCTION FROM OWN SOURCES – COPPER ASSETS1
Q4 2020
Q1 2021
Q2 2021
Q3 2021
Q4 2021
2021
2020
Change 2021 vs
2020 %
Change Q4 21 vs
Q4 20 %
African Copper (Katanga, Mutanda, Mopani) Katanga Copper metal kt 68.8 64.3 67.3 71.8 61.0 264.4 270.7 (2) (11) Cobalt2 kt 5.0 5.8 6.1 6.9 5.0 23.8 23.9 – – Mutanda Copper metal kt – – – – 6.3 6.3 – – n.m. Cobalt2 kt – – 1.1 1.0 1.8 3.9 – – n.m. Mopani Copper metal kt 10.3 6.5 – – – 6.5 30.3 (79) (100) Total Copper metal kt 79.1 70.8 67.3 71.8 67.3 277.2 301.0 (8) (15) Total Cobalt2 kt 5.0 5.8 7.2 7.9 6.8 27.7 23.9 16 36 Collahuasi3 Copper in concentrates kt 59.2 71.7 74.2 65.3 66.0 277.2 276.8 – 11 Silver in concentrates koz 893 1,081 1,170 978 990 4,219 3,961 7 11 Gold in concentrates koz 9 10 12 11 12 45 53 (15) 33 Antamina4 Copper in concentrates kt 40.7 35.8 37.4 38.1 38.7 150.0 127.7 17 (5) Zinc in concentrates kt 44.9 38.0 42.2 38.9 34.6 153.7 142.4 8 (23) Silver in concentrates koz 2,017 1,577 1,558 1,548 1,452 6,135 5,535 11 (28) Other South America (Antapaccay, Lomas Bayas) Antapaccay Copper in concentrates kt 51.5 43.5 40.5 41.3 45.5 170.8 185.6 (8) (12) Gold in concentrates koz 32 28 24 16 22 90 90 – (31) Silver in concentrates koz 355 327 303 336 416 1,382 1,298 6 17 Lomas Bayas Copper metal kt 18.0 15.8 16.4 15.6 16.5 64.3 74.1 (13) (8) Total Copper metal kt 18.0 15.8 16.4 15.6 16.5 64.3 74.1 (13) (8) Total Copper in concentrates kt 51.5 43.5 40.5 41.3 45.5 170.8 185.6 (8) (12)
Total Gold in concentrates and in doré koz 32 28 24 16 22 90 90 – (31)
Total Silver in concentrates and in doré koz 355 327 303 336 416 1,382 1,298 6 17

PRODUCTION BY QUARTER – Q4 2020 TO Q4 2021 continued
Glencore Preliminary Results 2021 119
Metals and minerals
PRODUCTION FROM OWN SOURCES – COPPER ASSETS1 CONTINUED
Q4 2020
Q1 2021
Q2 2021
Q3 2021
Q4 2021
2021
2020
Change 2021 vs
2020 %
Change Q4 21 vs
Q4 20 %
Australia (Ernest Henry, Cobar)5 Ernest Henry Copper metal kt 12.0 11.0 10.9 12.2 10.7 44.8 49.2 (9) (11) Gold koz 25 18 21 10 15 64 93 (31) (40) Silver koz 48 53 46 51 45 195 198 (2) (6) Cobar Copper in concentrates kt 12.7 8.9 10.3 9.5 11.8 40.5 46.2 (12) (7) Silver in concentrates koz 144 95 111 117 136 459 516 (11) (6) Total Copper metal kt 12.0 11.0 10.9 12.2 10.7 44.8 49.2 (9) (11) Total Copper in concentrates kt 12.7 8.9 10.3 9.5 11.8 40.5 46.2 (12) (7) Total Gold koz 25 18 21 10 15 64 93 (31) (40) Total Silver koz 192 148 157 168 181 654 714 (8) (6) Total Copper department Copper kt 273.2 257.5 257.0 253.8 256.5 1,024.8 1,060.6 (3) (6) Cobalt kt 5.0 5.8 7.2 7.9 6.8 27.7 23.9 16 36 Zinc kt 44.9 38.0 42.2 38.9 34.6 153.7 142.4 8 (23) Gold koz 66 56 57 37 49 199 236 (16) (26) Silver koz 3,457 3,133 3,188 3,030 3,039 12,390 11,508 8 (12)

PRODUCTION BY QUARTER – Q4 2020 TO Q4 2021 continued
Glencore Preliminary Results 2021 120
Metals and minerals
PRODUCTION FROM OWN SOURCES – ZINC ASSETS1
Q4 2020
Q1 2021
Q2 2021
Q3 2021
Q4 2021
2021
2020
Change 2021 vs
2020 %
Change Q4 21 vs
Q4 20 %
Kazzinc Zinc metal kt 38.7 37.8 33.2 34.2 42.7 147.9 167.5 (12) 10 Lead metal kt 7.6 4.3 4.9 5.7 4.9 19.8 25.6 (23) (36) Copper metal6 kt 8.9 8.7 4.9 4.7 7.3 25.6 37.0 (31) (18) Gold koz 190 164 139 129 163 595 659 (10) (14) Silver koz 1,714 816 485 640 980 2,921 4,712 (38) (43) Kazzinc – total production including third party feed Zinc metal kt 75.2 76.2 70.6 68.2 76.4 291.4 298.2 (2) 2 Lead metal kt 30.1 28.7 26.4 27.1 28.9 111.1 125.0 (11) (4) Copper metal kt 14.7 15.2 11.0 10.1 15.9 52.2 60.7 (14) 8 Gold koz 294 233 211 212 269 925 965 (4) (9) Silver koz 6,399 5,759 5,132 5,185 6,378 22,454 22,140 1 – Australia (Mount Isa, McArthur River)5 Mount Isa Zinc in concentrates kt 88.2 85.0 86.4 82.8 75.6 329.8 354.2 (7) (14) Copper metal kt 21.9 19.9 20.7 25.9 25.0 91.5 89.6 2 14 Lead in concentrates kt 38.9 36.2 39.4 32.8 24.5 132.9 161.9 (18) (37) Silver koz 178 116 115 159 235 625 557 12 32 Silver in concentrates koz 1,295 1,176 1,427 1,246 869 4,718 5,790 (19) (33) Mount Isa, Townsville – total production including third party feed Copper metal kt 54.5 54.2 55.5 65.2 51.9 226.8 217.2 4 (5) Gold koz 41 41 43 35 42 161 158 2 2 Silver koz 372 323 366 440 700 1,829 1,417 29 88 McArthur River Zinc in concentrates kt 76.4 63.5 74.2 69.9 72.0 279.6 279.3 – (6) Lead in concentrates kt 15.0 10.9 14.2 14.4 15.7 55.2 54.9 1 5 Silver in concentrates koz 487 270 471 460 602 1,803 1,614 12 24 Total Zinc in concentrates kt 164.6 148.5 160.6 152.7 147.6 609.4 633.5 (4) (10) Total Copper kt 21.9 19.9 20.7 25.9 25.0 91.5 89.6 2 14 Total Lead in concentrates kt 53.9 47.1 53.6 47.2 40.2 188.1 216.8 (13) (25) Total Silver koz 178.0 116 115 159 235 625 557 12 32 Total Silver in concentrates koz 1,782 1,446 1,898 1,706 1,471 6,521 7,404 (12) (17) North America (Matagami, Kidd) Matagami Zinc in concentrates kt 13.5 14.1 11.0 12.3 10.0 47.4 52.2 (9) (26) Copper in concentrates kt 1.9 1.6 1.6 2.2 1.7 7.1 6.7 6 (11) Kidd Zinc in concentrates kt 12.7 12.3 15.8 9.9 10.7 48.7 62.5 (22) (16) Copper in concentrates kt 9.5 7.6 6.8 5.7 3.1 23.2 34.0 (32) (67) Silver in concentrates koz 517 362 405 309 307 1,383 2,125 (35) (41) Total Zinc in concentrates kt 26.2 26.4 26.8 22.2 20.7 96.1 114.7 (16) (21) Total Copper in concentrates kt 11.4 9.2 8.4 7.9 4.8 30.3 40.7 (26) (58) Total Silver in concentrates koz 517 362 405 309 307 1,383 2,125 (35) (41)

PRODUCTION BY QUARTER – Q4 2020 TO Q4 2021 continued
Glencore Preliminary Results 2021 121
Metals and minerals
PRODUCTION FROM OWN SOURCES – ZINC ASSETS1 CONTINUED
Q4 2020
Q1 2021
Q2 2021
Q3 2021
Q4 2021
2021
2020
Change 2021 vs
2020 %
Change Q4 21 vs
Q4 20 %
Other Zinc: South America (Argentina, Bolivia, Peru)7 Zinc in concentrates kt 35.9 31.9 36.4 26.0 16.4 110.7 112.3 (1) (54) Lead in concentrates kt 3.6 3.9 3.2 3.5 3.8 14.4 17.0 (15) 6 Copper in concentrates kt 0.5 0.5 0.4 0.3 0.5 1.7 1.6 6 – Silver in concentrates koz 1,832 1,809 2,051 1,889 1,634 7,383 6,121 21 (11) Total Zinc department Zinc kt 265.4 244.6 257.0 235.1 227.4 964.1 1,028.0 (6) (14) Lead kt 65.1 55.3 61.7 56.4 48.9 222.3 259.4 (14) (25) Copper kt 42.7 38.3 34.4 38.8 37.6 149.1 168.9 (12) (12) Gold koz 190 164 139 129 163 595 659 (10) (14) Silver koz 6,023 4,549 4,954 4,703 4,627 18,833 20,919 (10) (23)
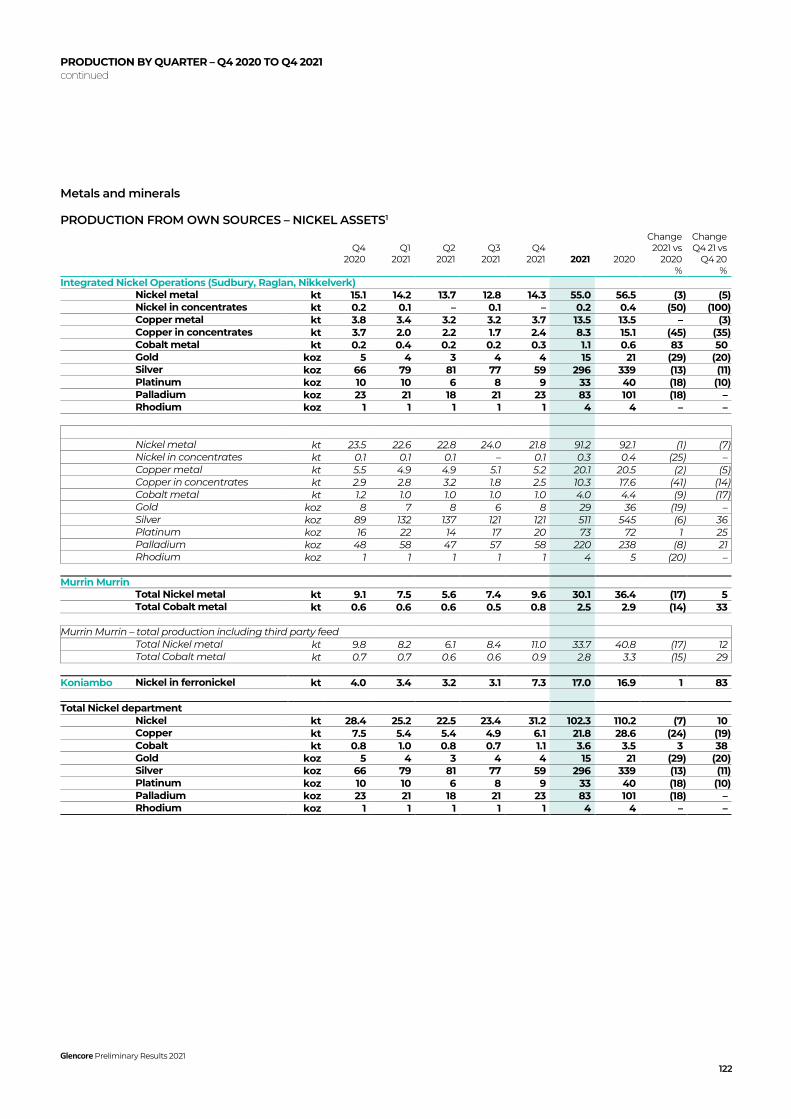
PRODUCTION BY QUARTER – Q4 2020 TO Q4 2021 continued
Glencore Preliminary Results 2021 122
Metals and minerals
PRODUCTION FROM OWN SOURCES – NICKEL ASSETS1
Q4 2020
Q1 2021
Q2 2021
Q3 2021
Q4 2021
2021
2020
Change 2021 vs
2020 %
Change Q4 21 vs
Q4 20 %
Integrated Nickel Operations (Sudbury, Raglan, Nikkelverk) Nickel metal kt 15.1 14.2 13.7 12.8 14.3 55.0 56.5 (3) (5) Nickel in concentrates kt 0.2 0.1 – 0.1 – 0.2 0.4 (50) (100) Copper metal kt 3.8 3.4 3.2 3.2 3.7 13.5 13.5 – (3) Copper in concentrates kt 3.7 2.0 2.2 1.7 2.4 8.3 15.1 (45) (35) Cobalt metal kt 0.2 0.4 0.2 0.2 0.3 1.1 0.6 83 50 Gold koz 5 4 3 4 4 15 21 (29) (20) Silver koz 66 79 81 77 59 296 339 (13) (11) Platinum koz 10 10 6 8 9 33 40 (18) (10) Palladium koz 23 21 18 21 23 83 101 (18) – Rhodium koz 1 1 1 1 1 4 4 – – Nickel metal kt 23.5 22.6 22.8 24.0 21.8 91.2 92.1 (1) (7) Nickel in concentrates kt 0.1 0.1 0.1 – 0.1 0.3 0.4 (25) – Copper metal kt 5.5 4.9 4.9 5.1 5.2 20.1 20.5 (2) (5) Copper in concentrates kt 2.9 2.8 3.2 1.8 2.5 10.3 17.6 (41) (14) Cobalt metal kt 1.2 1.0 1.0 1.0 1.0 4.0 4.4 (9) (17) Gold koz 8 7 8 6 8 29 36 (19) – Silver koz 89 132 137 121 121 511 545 (6) 36 Platinum koz 16 22 14 17 20 73 72 1 25 Palladium koz 48 58 47 57 58 220 238 (8) 21 Rhodium koz 1 1 1 1 1 4 5 (20) – Murrin Murrin Total Nickel metal kt 9.1 7.5 5.6 7.4 9.6 30.1 36.4 (17) 5 Total Cobalt metal kt 0.6 0.6 0.6 0.5 0.8 2.5 2.9 (14) 33 Murrin Murrin – total production including third party feed Total Nickel metal kt 9.8 8.2 6.1 8.4 11.0 33.7 40.8 (17) 12 Total Cobalt metal kt 0.7 0.7 0.6 0.6 0.9 2.8 3.3 (15) 29 Koniambo Nickel in ferronickel kt 4.0 3.4 3.2 3.1 7.3 17.0 16.9 1 83 Total Nickel department Nickel kt 28.4 25.2 22.5 23.4 31.2 102.3 110.2 (7) 10 Copper kt 7.5 5.4 5.4 4.9 6.1 21.8 28.6 (24) (19) Cobalt kt 0.8 1.0 0.8 0.7 1.1 3.6 3.5 3 38 Gold koz 5 4 3 4 4 15 21 (29) (20) Silver koz 66 79 81 77 59 296 339 (13) (11) Platinum koz 10 10 6 8 9 33 40 (18) (10) Palladium koz 23 21 18 21 23 83 101 (18) – Rhodium koz 1 1 1 1 1 4 4 – –

PRODUCTION BY QUARTER – Q4 2020 TO Q4 2021 continued
Glencore Preliminary Results 2021 123
Metals and minerals
PRODUCTION FROM OWN SOURCES – FERROALLOYS ASSETS1
Q4 2020
Q1 2021
Q2 2021
Q3 2021
Q4 2021
2021
2020
Change 2021 vs
2020 %
Change Q4 21 vs
Q4 20 %
Ferrochrome8 kt 378 399 374 298 397 1,468 1,029 43 5 Vanadium pentoxide mlb 5.9 5.5 5.5 4.2 5.3 20.5 19.5 5 (10)
TOTAL PRODUCTION – CUSTOM METALLURGICAL ASSETS1
Q4 2020
Q1 2021
Q2 2021
Q3 2021
Q4 2021
2021
2020
Change 2021 vs
2020 %
Change Q4 21 vs
Q4 20 %
Copper (Altonorte, Pasar, Horne, CCR) Copper metal kt 116.0 127.2 127.6 121.5 114.3 490.6 482.6 2 (1) Copper anode kt 134.4 126.7 109.5 94.4 123.4 454.0 490.1 (7) (8) Zinc (Portovesme, San Juan de Nieva, Nordenham, Northfleet) Zinc metal kt 203.6 202.6 195.8 206.7 195.5 800.6 787.2 2 (4) Lead metal kt 45.8 49.9 52.3 62.3 80.4 244.9 198.0 24 76

PRODUCTION BY QUARTER – Q4 2020 TO Q4 2021 continued
Glencore Preliminary Results 2021 124
Energy products
PRODUCTION FROM OWN SOURCES – COAL ASSETS1
Q4 2020
Q1 2021
Q2 2021
Q3 2021
Q4 2021
2021
2020
Change 2021 vs
2020 %
Change Q4 21 vs
Q4 20 %
Australian coking coal mt 2.0 2.4 1.7 2.5 2.5 9.1 7.6 20 25 Australian semi-soft coal mt 1.0 1.2 1.4 0.9 1.0 4.5 4.6 (2) – Australian thermal coal (export) mt 12.8 12.0 13.0 15.5 15.4 55.9 55.7 – 20 Australian thermal coal (domestic) mt 1.5 1.4 1.2 1.6 1.8 6.0 6.4 (6) 20 South African thermal coal (export) mt 3.3 4.0 3.7 3.9 3.1 14.7 14.8 (1) (6) South African thermal coal (domestic) mt 1.8 1.7 1.4 1.2 1.0 5.3 9.2 (42) (44) Cerrejón9 mt 0.3 1.8 1.8 2.0 2.2 7.8 4.1 90 633 Prodeco mt – – – – – – 3.8 (100) n.m. Total Coal department mt 22.7 24.5 24.2 27.6 27.0 103.3 106.2 (3) 19
OIL ASSETS
Q4 2020
Q1 2021
Q2 2021
Q3 2021
Q4 2021
2021
2020
Change 2021 vs
2020 %
Change Q4 21 vs
Q4 20 %
Glencore entitlement interest basis Equatorial Guinea kboe 345 784 1,245 1,294 818 4,141 1,960 111 137 Chad kbbl – – – – – – 1,112 (100) n.m. Cameroon kbbl 239 287 241 294 311 1,133 872 30 30 Total Oil department kboe 584 1,071 1,486 1,588 1,129 5,274 3,944 34 93 Gross basis Equatorial Guinea kboe 1,871 3,777 6,041 6,233 4,086 20,137 10,435 93 118 Chad kbbl – – – – – – 1,521 (100) n.m. Cameroon kbbl 693 708 699 729 730 2,866 2,528 13 5 Total Oil department kboe 2,564 4,485 6,740 6,962 4,816 23,003 14,484 59 88
1 Controlled industrial assets and joint ventures only. Production is on a 100% basis except for joint ventures, where the Group’s attributable share of production is included. 2 Cobalt contained in concentrates and hydroxides. 3 The Group’s pro-rata share of Collahuasi production (44%). 4 The Group’s pro-rata share of Antamina production (33.75%). 5 Mount Isa copper operations (including Townsville) previously recorded under copper department moved to zinc department. 6 Copper metal includes copper contained in copper concentrates and blister. 7 South American production excludes Volcan Compania Minera. 8 The Group’s attributable 79.5% share of the Glencore-Merafe Chrome Venture. 9 The Group’s pro-rata share of Cerrejón production (33.3%).

FULL YEAR 2022 PRODUCTION GUIDANCE ADER
Glencore Preliminary Results 2021 125
Actual
FY Actual FY
Actual FY
Guidance FY
2019 2020 2021 2022 Copper kt 1,371 1,258 1,196 1,150 ± 30 Cobalt kt 46.3 27.4 31.3 48 ± 3 Zinc kt 1,078 1,170 1,118 1,110 ± 30 1 Nickel kt 121 110 102 115 ± 5 Ferrochrome kt 1,438 1,029 1,468 1,460 ± 30 Coal mt 140 106 103 121 ± 5
1 Excludes Volcan.
• 2022 production guidance unchanged from the Investor Update in December 2021. Purchase of the remaining interest in Cerrejon completed in January 2022, a few months earlier than initially assumed. Changes, if any, to 2022 guidance will be updated in April, together with our Q1 production report.
Important notice concerning this document including forward looking statements
This document contains statements that are, or may be deemed to be, “forward looking statements” which are prospective in nature. These forward looking statements may be identified by the use of forward looking terminology, or the negative thereof such as “outlook”, "plans", "expects" or "does not expect", "is expected", "continues", "assumes", "is subject to", "budget", "scheduled", "estimates", "aims", "forecasts", "risks", "intends", "positioned", "predicts", "anticipates" or "does not anticipate", or "believes", or variations of such words or comparable terminology and phrases or statements that certain actions, events or results "may", "could", "should", “shall”, "would", "might" or "will" be taken, occur or be achieved. Forward-looking statements are not based on historical facts, but rather on current predictions, expectations, beliefs, opinions, plans, objectives, goals, intentions and projections about future events, results of operations, prospects, financial condition and discussions of strategy. By their nature, forward-looking statements involve known and unknown risks and uncertainties, many of which are beyond Glencore’s control. Forward looking statements are not guarantees of future performance and may and often do differ materially from actual results. Important factors that could cause these uncertainties include, but are not limited to, those disclosed in the last published annual report and half-year report, both of which are freely available on Glencore’s website.
For example, our future revenues from our assets, projects or mines will be based, in part, on the market price of the commodity products produced, which may vary significantly from current levels. These may materially affect the timing and feasibility of particular developments. Other factors include (without limitation) the ability to produce and transport products profitably, demand for our products, changes to the assumptions regarding the recoverable value of our tangible and intangible assets, the effect of foreign currency exchange rates on market prices and operating costs, and actions by governmental authorities, such as changes in taxation or regulation, and political uncertainty.
Neither Glencore nor any of its associates or directors, officers or advisers, provides any representation, assurance or guarantee that the occurrence of the events expressed or implied in any forward-looking statements in this document will actually occur. You are cautioned not to place undue reliance on these forward-looking statements which only speak as of the date of this document.
Except as required by applicable regulations or by law, Glencore is not under any obligation and Glencore and its affiliates expressly disclaim any intention, obligation or undertaking, to update or revise any forward looking statements, whether as a result of new information, future events or otherwise. This document shall not, under any circumstances, create any implication that there has been no change in the business or affairs of Glencore since the date of this document or that the information contained herein is correct as at any time subsequent to its date. No statement in this document is intended as a profit forecast or a profit estimate and past performance cannot be relied on as a guide to future performance. This document does not constitute or form part of any offer or invitation to sell or issue, or any solicitation of any offer to purchase or subscribe for any securities.
The companies in which Glencore plc directly and indirectly has an interest are separate and distinct legal entities. In this document, “Glencore”, “Glencore group” and “Group” are used for convenience only where references are made to Glencore plc and its subsidiaries in general. These collective expressions are used for ease of reference only and do not imply any other relationship between the companies. Likewise, the words “we”, “us” and “our” are also used to refer collectively to members of the Group or to those who work for them. These expressions are also used where no useful purpose is served by identifying the particular company or companies.
Copyright © 2022 FDOKUMEN