Preliminary results on nitric oxide emission from a southern African savanna ecosystem
16
Nutrient Cycling in Agroecosystems 48: 123–138, 1997. 123 c 1997 Kluwer Academic Publishers. Printed in the Netherlands. Preliminary results on nitric oxide emission from a southern African savanna ecosystem F. X. Meixner 1 , Th. Fickinger 1 , L. Marufu 12 , D. Ser¸ ca 3 , F. J. Nathaus 1 , E. Makina 2 , L. Mukurumbira 2 & M. O. Andreae 1 1 Max-Planck-Institut f¨ ur Chemie, Abteilung Biogeochemie, Postfach 3060, D-55020 Mainz, Germany; 2 Grasslands Research Station, Soil Productivity Research Laboratory (SPRL), Marondera, Zimbabwe; 3 Laboratoire d’Aerologie – O.M.P., Universite Paul Sabatier Toulouse III, 14 Avenue Edouard Belin, F-31400 Toulouse, France Key words: Africa, biogenic emission, dry season, dynamic chamber, forest, grassland, groundnut, maize, Miombo type savanna ecosystem, nitric oxide, pulsing, sorghum, wet season, Zimbabwe Abstract During October to December 1994, we measured diel and seasonal variability in nitric oxide (NO) exchange by a southern African savanna ecosystem (Grasslands Research Station, Marondera, Zimbabwe). A set of automated dynamic chambers was installed in three sub-sites: Miombo forest, natural grassland, and cropped soils (maize, sorghum, groundnut). The latter received a single application of commercialy available in-organic or cowdung fertilizer. The dynamic chamber system is described in detail, including correction of the resulting data for wall losses and gas-phase reactions of the NO-NO 2 -O 3 triad. During the dry season, net vertical NO fluxes were close to the detection limit (0.44 ngN m 2 s 1 ) regardless of vegetation type. During the transition from dry to wet season strong "pulsing" effects of the NO flux were observed: NO emissions increased by a factor of up to 60 within hours. During the wet season, NO emissions varied between the different sub-sites of the ecosystem; corresponding means are in ranking order of fertilized agricultural plots (27.2 ngN m 2 s 1 ), unfertilized agricultural plots (8.5 ngN m 2 s 1 ), grassland (4.4 ngN m 2 s 1 ), and Miombo forest (1.5 ngN m 2 s 1 ). Soil moisture was found to be the dominant factor controlling the NO fluxes. Whenever it was not limiting, the diel behaviour of NO emission followed the daily variation of soil temperature measured 1 cm below the surface. Introduction OH and other radicals oxidize atmospheric carbona- ceous trace gases (CO, CH 4 ,C H ) through various catalytic cycles (Crutzen, 1987). Depending on the ambient mixing ratio of the key catalyst NO (NO = NO+NO 2 ), these cycles may generate or destroy ozone in the troposphere (Chameides et al., 1992). Because a NO mixing ratio of only 30 pptv establishes the crit- ical threshhold between ozone destruction (NO 30 pptv) and generation (NO 30 pptv), ozone is usual- ly generated in polluted, industrialized regions, where ambient levels of NO are high, and destroyed in more remote parts of the globe. Consequently, the ongo- ing development of NO -sources in non-industrialized regions will trigger the potential increase of global tropospheric ozone and therefore deserves scientific attention. Pyrogenic emissions from African savanna fires have a significant, but seasonally limited impact on the regional and global atmospheric chemistry (Andreae et al., 1996). However, little is known about the pre- sumably more persistent biogenic fluxes of NO from African savanna ecosystems. Recently, LeRoux et al. (1995), Ser¸ ca et al. (1995), Harris et al. (1996), Levine et al. (1996), and Parsons et al. (1996) reported short- term measurements from west and southern African savannas, where a vast range of NO emission rates (0.05 to 100 ngN m 2 s 1 ) was observed. This large variation is mainly due to the very different condi- tions of fire status/incidence, soil moisture and nutrient (especially nitrogen) content which were encountered during the individual experiments. However, mod-
-
Upload
independent -
Category
Documents
-
view
0 -
download
0
Transcript of Preliminary results on nitric oxide emission from a southern African savanna ecosystem

Nutrient Cycling in Agroecosystems 48: 123–138, 1997. 123c 1997 Kluwer Academic Publishers. Printed in the Netherlands.
Preliminary results on nitric oxide emission from a southern Africansavanna ecosystem
F. X. Meixner1, Th. Fickinger1, L. Marufu1;2, D. Serca3, F. J. Nathaus1, E. Makina2,L. Mukurumbira2 & M. O. Andreae1
1Max-Planck-Institut fur Chemie, Abteilung Biogeochemie, Postfach 3060, D-55020 Mainz, Germany;2Grasslands Research Station, Soil Productivity Research Laboratory (SPRL), Marondera, Zimbabwe;3Laboratoire d’Aerologie – O.M.P., Universite Paul Sabatier Toulouse III, 14 Avenue Edouard Belin, F-31400Toulouse, France
Key words: Africa, biogenic emission, dry season, dynamic chamber, forest, grassland, groundnut, maize, Miombotype savanna ecosystem, nitric oxide, pulsing, sorghum, wet season, Zimbabwe
Abstract
During October to December 1994, we measured diel and seasonal variability in nitric oxide (NO) exchange bya southern African savanna ecosystem (Grasslands Research Station, Marondera, Zimbabwe). A set of automateddynamic chambers was installed in three sub-sites: Miombo forest, natural grassland, and cropped soils (maize,sorghum, groundnut). The latter received a single application of commercialy available in-organic or cowdungfertilizer. The dynamic chamber system is described in detail, including correction of the resulting data for walllosses and gas-phase reactions of the NO-NO2-O3 triad. During the dry season, net vertical NO fluxes were close tothe detection limit (0.44 ngN m�2s�1) regardless of vegetation type. During the transition from dry to wet seasonstrong "pulsing" effects of the NO flux were observed: NO emissions increased by a factor of up to 60 withinhours. During the wet season, NO emissions varied between the different sub-sites of the ecosystem; correspondingmeans are in ranking order of fertilized agricultural plots (27.2 ngN m�2 s�1), unfertilized agricultural plots (8.5ngN m�2 s�1 ), grassland (4.4 ngN m�2 s�1 ), and Miombo forest (1.5 ngN m�2 s�1). Soil moisture was found tobe the dominant factor controlling the NO fluxes. Whenever it was not limiting, the diel behaviour of NO emissionfollowed the daily variation of soil temperature measured 1 cm below the surface.
Introduction
OH and other radicals oxidize atmospheric carbona-ceous trace gases (CO, CH4, CmHn) through variouscatalytic cycles (Crutzen, 1987). Depending on theambient mixing ratio of the key catalyst NOx (NOx =NO+NO2), these cycles may generate or destroy ozonein the troposphere (Chameides et al., 1992). Because aNOx mixing ratio of only�30 pptv establishes the crit-ical threshhold between ozone destruction (NOx <30pptv) and generation (NOx >30 pptv), ozone is usual-ly generated in polluted, industrialized regions, whereambient levels of NOx are high, and destroyed in moreremote parts of the globe. Consequently, the ongo-ing development of NOx-sources in non-industrializedregions will trigger the potential increase of global
tropospheric ozone and therefore deserves scientificattention.
Pyrogenic emissions from African savanna fireshave a significant, but seasonally limited impact on theregional and global atmospheric chemistry (Andreaeet al., 1996). However, little is known about the pre-sumably more persistent biogenic fluxes of NO fromAfrican savanna ecosystems. Recently, LeRoux et al.(1995), Serca et al. (1995), Harris et al. (1996), Levineet al. (1996), and Parsons et al. (1996) reported short-term measurements from west and southern Africansavannas, where a vast range of NO emission rates(0.05 to 100 ngN m�2s�1) was observed. This largevariation is mainly due to the very different condi-tions of fire status/incidence, soil moisture and nutrient(especially nitrogen) content which were encounteredduring the individual experiments. However, mod-

124
elling of global soil biogenic NO (Yienger and LevyII, 1995; Potter et al., 1996) suggested that tropicaland subtropical savannas are among the most impor-tant source areas due to high soil temperatures andtheir large geographical extent. Here, we report onpreliminary results of biogenic NO emission from aMiombo-type savanna ecosystem in sub-tropical Zim-babwe, based upon field observations during the periodof October to December 1994. Our results are basedupon diel as well as seasonal monitoring of NO fluxesover grassland, forest and agricultural sites.
Description of field site
Field experiments were performed at GrasslandsResearch Station, Marondera, Zimbabwe. The site islocated 8 km west of Marondera and about 60 kmsouth-east of Harare on the central Zimbabweanplateau (18�110 S, 31�280 E, 1630 m a.s.l., see Fig.1).This region falls within the so-called broad-leavedsavanna. The climax vegetation, which is now mostlycleared, was dominated by Brachystegia spiciformisand Julbernadia globiflora and is classified as Decid-uous Miombo Savanna Woodland (Campbell et al.,1988). The local climate is characterized by a long dryseason (8 months) and a short wet/rainy season (Octo-ber to January). Mean monthly temperatures rangefrom 11.7 �C (June) to 19.0 �C (November), and morethan 80% of the mean annual rainfall (846 mm) occursbetween November and March (Campbell et al., 1988).
Since 1986, the Soil Productivity Research Labora-tory, a section of Grasslands Research Station, has con-tinuously conducted its "Land Use Change/Long TermSoil Fertility Trials" on a 9 hectare fenced off site situat-ed within the station. Within this site, we selected rep-resentative sub-sites to investigate the potential impactof land use changes on biogenic NO emission. Thesub-sites (see Fig. 1) were selected in such a way thatone ("Miombo site") was situated in a natural miom-bo woodland which has been undisturbed for over 50years. The soil on this site was covered by a partiallydecomposed layer of litter 2–4 cm thick. The secondsub-site ("grassland site") was placed in an area that, in1986, was converted from the original Miombo forestto a typical grassland site by clearing trees and shrubs.The grass at this site was dry for the whole experi-mental period. The third sub-site ("agricultural site")was located on agriculturally managed land on whichsoil fertility trials had been conducted continuouslysince 1986. This sub-site was further divided into six
7m�7m plots; three of which were planted with maize,one with groundnut, one with sorghum and one left fal-low. Planting occured from 11-13 October. One com-plete maize plot, half of the groundnut plot, and halfof the sorghum plot were fertilized with inorganic fer-tilizers (as done on commercial farms), while anothermaize plot and the remaining halves of the groundnutand sorghum plots remained unfertilized (control). Thethird maize plot was fertilized with cowdung manurefertilizer (as done by peasant farmers). The inorgan-ic fertilizer used was a locally manufactured granularcompound fertilizer (referred to as compound D) witha chemical composition of 8% N, 14% P2O5, 7% K2O,and 6.5% SO4
2�. The cowdung manure had a nutrientcontent of about 1.7% N, 0.4% P, 1.2% K and 0.2%S. The inorganic and manure fertilizers were appliedonly once (13 October) at rates of 200 kg and 10 tonsha�1, respectively, as recommended by the local soiltesting laboratory.
At the "Land Use Change/Long Term Soil FertilityTrials"-site, soils are strongly leached acidic alfisolsof granitic origin. Soil characteristics of the differentplots were determined on soil samples which were tak-en from the surface depth layer (between 25 Novemberand 14 December, 1994). Results are shown in Tab. 1.Both, the soil nitrate and soil ammonium content ofthe agricultural plots reveal considerable scatter. Sincepeasant farmers apply the fertilizer adjacent to eachsingle plant rather than broadcasting it, this scatterhighlights the obvious difficulty in taking representa-tive samples from soils of high small-scale (< 0.5m)variation of nutrients.
The dynamic chamber system
The dynamic chambers employed were similar to thosedescribed by Ludwig (1994). The design is shown inFig. 2. Each chamber consisted of a stainless steel soilframe, a wall cylinder and a movable chamber lid. Thewall cylinder and the lid were made of transparent (� >410 nm) polycarbonate sheets (MAKROLON R ) 1 mmand 6 mm thick, respectively. At the sub-sites, a totalof 40 steel frames were inserted 0.3 m deep into thesoil. This was done four weeks before any flux mea-surements, in order to avoid possible effects on theflux measurements (e.g. by disturbing the soil struc-ture). The chambers, normally open-top, were closedonly for the measuring period of 3 minutes by meansof remotely controlled lids (s. Fig. 2) to minimize

125
Figure 1. The "Land Use Change/Long Term Fertility Trials"-site of the Soil Productivity Research Laboratory (SPRL, Grasslands ResearchStation, Marondera). Flux measurements (by 5 dynamic chambers) were performed at the "Miombo", "grassland", and "agricultural" sites asindicated.
Table 1. Soil characteristics from different plots of the "Land Use Change/Long Term Soil FertilityTrials"-site at Grasslands Research Station, Marondera, Zimbabwe. Soil samples have been takenbetween 10 October and 13 October (soil C and N content), and 25 November and 14 December,1994, from the surface depth layer (0–2.5 cm; C and N content, soil density: 0–5 cm). Samples werestored at 4 �C until laboratory analysis (Schlichting and Blume, 1966; Hartge and Horn, 1989).
plot type NO3� NH4
+ N C pH bulk density
ppm ppm % % [1] �103 kg m�3
grassland 7.5�2.08 24.5�3.67 0.05 0.8 5.00 1.43�0.13
Miombo forest 5.4�1.00 16.8�2.81 0.05 0.2 5.46 1.55�0.02
fallow 8.6�7.78 19.1�5.81 0.05 – 5.08 1.33�0.02
groundnut, unfertilized 9.4�8.92 22.4�1.98 – – 5.42 1.33�0.02
groundnut, fertilized 16.5�24.2 21.9�1.38 – – 5.22 1.33�0.02
sorghum, unfertilized 5.6�3.58 14.6�7.70 – – 5.51 1.33�0.02
sorghum, fertilized 7.1�3.55 138.6�139.0 – – 7.44 1.33�0.02
maize, unfertilized 6.7�7.10 16.1�2.39 – – 4.66 1.33�0.02
maize, fertilized 12.6�6.70 185.0�143.8 – – 7.94 1.33�0.02
maize, ‘manure’ 7.4�7.57 18.3�8.40 – – 5.72 1.33�0.02
unavoidable disturbances caused by the enclosure ofsoil and plants.
Thorough turbulent mixing inside a chamber is themost important postulate for the desired equilibriumof surface exchange within the chamber and is conse-
quently essential for the evaluation of dynamic cham-ber data (see, Remde et al., 1993; Ludwig, 1994). Tur-bulent mixing inside the chamber was achieved by con-tinuous operation of two PTFE-coated fans (Micronel,model F41MM). Using ozone (87 ppb) as a test agent

126
Figure 2. Schematic view of the dynamic chamber design.
and a saturated potassium iodide solution as a perfectozone absorber (see Galbally and Roy, 1980), labo-ratory tests showed that the mixing within the cham-bers is thorough. Ludwig (1994) found that detectable(vertical and horizontal) gradients of ozone mixingratio do not exist in the chamber. The correspond-ing aerodynamic resistance (the sum of turbulent andmolecular-turbulent resistances) was minimized andcould be quantified to about 55 s m�1. For arable soils,NO surface resistances range typically between 500and � 2000 s m�1 (Ludwig, 1994). Therefore, theNO surface exchange within our dynamic chambersis considered to be unbiased by mixing processes. Toguarantee that NO flux measurements are independentof the flow rate through the chamber (c.f. Ludwig,1994), the air volume of the chamber was displacedevery 26 s. This was achieved by flushing each cham-ber with ambient air at a high flow rate of 60 L min�1.Due to the wide concentric entrance slit of the cham-ber (12 mm, s. Fig. 2) only a negligible pressure drop(< 0.05 hPa) inside the chamber was observed. Thefrequent change of the chamber air volume also keptthe environmental conditions inside the chamber closeto ambient conditions: the difference in air tempera-tures was usually < 2 K, and during precipitation-freeperiods no detectable differences were observed forrelative humidity, soil temperature and moisture in andoutside the chambers.
To examine the spatial heterogeneity of the soil,net vertical NO fluxes were determined by simultane-
ous operation of 4 dynamic chambers at each selectedsub-site (see Fig. 1 and 3). When using the cham-ber techniques, observed NO fluxes must be correct-ed for gas phase reactions of the NO-NO2-O3 triadwhich occur in the air sample while passing throughthe chamber (Remde et al., 1993; Ludwig, 1994).Therefore, mixing ratios of NO, NO2, and O3 weresimultaneously analyzed in each air sample, and a fifthchamber, sealed at bottom by a PTFE-foil against thesoil surface ("blank chamber", see Fig. 3), was usedfor continuous control of these corrections and loss-es to chamber walls. As indicated in Fig. 3, ambientair was drawn into each chamber through the entranceslit between the wall cylinder and chamber lid, andfrom the chamber outlet to the end of the samplingline with a vacuum pump (Brey, model TF71/8W).Flow rate was continuously monitored by a mass flowmeter (Bronkhorst High Tech, model F112-AC-HA-55-V). Tubing and connectors (12.7 mm inner dia.)were made of Teflon-PFA. They were insulated byopaque foam rubber (ARMAFLEX R ) to exclude sun-light which would otherwise photolyze NO2 in theair sample to NO (see below). As shown in Fig. 3,an aliquot of the main sample flow was provided tothe NO-, NO2-, and O3-analyzers by a Teflon pump(KNF Neuberger, model N726FTE). Losses of NOduring the passage through particle filters, tubing, andthe pump were not observed. Corresponding O3-losses(5�1.5%) were quantified frequently to correct mea-sured O3 mixing ratios.
To make dynamic chamber flux measurements, dif-ferences of NO-, NO2-, and O3-mixing ratios at thechamber inlet (= ambient air) and those at the chamberoutlet must be determined. At Marondera, we achievedthis by taking alternate samples of ambient air andchamber air during the continuous operation of theNO-, NO2-, and O3-analyzers. By means of remote-ly controlled closure and opening of sampling valves(downstream of the ambient air intake and each cham-ber, see Fig. 3), the following measurement cycle wasestablished as shown in Figure 3 (j = NO,NO2,O3).Every flux measurement cycle was completed in 25min. From the beginning of October to mid-December1994, periods of successive flux measurements were1–2 days at the Miombo- and grassland sites, followedby 4–7 days at the agricultural plots.
Commercially available analyzers were used tomeasure NO-, NO2-, and O3-mixing ratios. NO wasdetected by a gas-phase chemiluminescence analyzer(Ecophysics, model CLD 780TR; detection limit (2�):0.052 ppbv, reproducibility (2�): �0.026 ppbv). This

127
Figure 3. Measurement procedure of the dynamic chamber system.
Figure 4. Experimental set-up of the dynamic chamber system as used at Grasslands Research Station, Marondera, October - December 1994.
analyzer was also used for the detection of NO2 afterphotolytic conversion to NO (Ecophysics, model PCL760). The ozone mixing ratio was measured by a UV-absorption analyzer (Thermo Instruments, model 49;detection limit (2�): 2 ppbv, reproducibility (2�): � 1ppbv). The NO/NO2-analyzer was calibrated weeklyusing a certified NO standard (BOC; 562 ppbv NO inN2) and a combined dynamic dilution/gas-phase titra-tion system (Ansyco, model Sycos K/GPT). The latterdevice (see Fried and Hodgeson, 1982) was also usedto quantify the conversion efficiency of the photolyticNO2-converter, and made calibrations in the range ofprevailing ambient NO- and NO2-mixing ratios pos-
sible (0.15–0.30 ppbv NO; 0.9–1.2 ppbv NO2). Theozone analyzer was also weekly calibrated by cor-responding blends obtained from a commercial O3-generator (Ansyco, model Sycos K/O3), which wereassured by a standard O3 instrument (Dasibi Env. Inc.,model 1003-AH).
We monitored several environmental quantitieswhich are assumed to influence the surface exchangesof NO, NO2, and O3. Air temperature and relativehumidity were measured alternately inside and outsideeach chamber by a combined sensor (Vaisala, modelHMP 133Y) fixed to the lower side of the lid (see Fig.2 and 4). The photolysis-rate of NO2, j(NO2) was mea-

128
sured simultaneously within and outside of one cham-ber by commercial sensors (Meteorologie Consult).Soil temperatures at 0.005–0.01 m and 0.02–0.03 mdepth were monitored within and outside of the steelframes by thermistor probes suitable for burial into thesoil (Campbell Scientific Ltd., model TP 107). Soilmoisture in and outside a chamber was continuouslyrecorded by TDR-sondes (Imko, model Trime ES/P2).The sondes integrated the volumetric soil moisturecontent over the depth layer 0–0.05 m. Occasional-ly, the volumetric soil moisture content of core soilsamples was determined gravimetrically by samplingwith suitable steel cylinders (0.05 m�0.05 m dia.).The bulk density and the NH4
+- and NO3�-content of
core soil samples from all sub-sites were determinedin the Soil Productivity Research Laboratory accordingto Hartge and Horn (1989). Wind direction and speed,rainfall intensity, global and photosynthetic active radi-ation, air temperature and relative humidity, as well asbarometric pressure were monitored by an automaticweather station (Campell Scientific Ltd., model AWS)located at the agricultural site (see Fig. 1).
Evaluation of dynamic chamber flux data
We assumed a steady state inside the dynamic chamberwith respect to the mixing ratio mj (j = NO,NO2,O3).As shown by Remde et al. (1993) and Ludwig (1994),this occurs beginning at 1 min after the chamber lid isclosed. For that reason, data corresponding to the firstminute after lid closure (i.e. "purge" of the measure-ment cycle) were not recorded. Therefore, all mixingratios at the outlet of each chamber (mout;j) were con-sidered to be equal to those inside the chamber. Hence,the mass balance equation of the dynamic chamber isgiven as follows:
Ff;j+Fm;j+Fbl;j+Fgp;j = 0; j = NO;NO2; O3
(1)where Ff;j is the desired net flux between the enclosedsoil and the air volume of the chamber (Ff;j>0, ifnet emission), Fm;j is the difference between fluxesentering the dynamic chamber by the entrance slit andleaving it through the outlet tube, Fbl;j is the "blank"flux due to losses to the inner chamber walls, and Fgp;jis the flux describing the net loss (gain) of species j dueto chemical reactions in the air sample while passingthrough the dynamic chamber. In the following, equa-tions for the determination of Fm;j , Fbl;j , and Fgp;j areformulated and related evaluations are described.
The flux (Fm;j) is defined by
Fm;j =Q
A(min;j �mout;j)
Mj
Vm;
j = NO;NO2; O3 (2)
where min;j is the mixing ratio at the entrance slit ofthe chamber (= ambient mixing ratio), mout;j is themixing ratio at the outlet tube of the chamber, Q is theflow-rate through the chamber (i.e. 1�10�3 m3 s�1),and A is the soil surface area covered by the chamber(which was approximated by the area of the horizontalcross-section of the steel frame, i.e. 0.086 m2). Theterm MjVm
�1 is used to convert the measured mix-ing ratios (10�9, ppbv) to concentrations (kg m�3),where Mj are the molecular weights of NO, NO2, andO3, respectively, and Vm is the molar gas volume (i.e.24.465 m3 kmole�1 at 1013.25 hPa and 298 K). Asnet fluxes of NO and NO2 are commonly expressedin units of kgN m�2s�1 (or ngN m�2s�1), MjVm
�1
may be replaced by MNVm�1, where MN is the atomic
weight of nitrogen. Based on equ. (2) and the measure-ment cycle described in the preceding chapter, fluxesFm;j for a given time interval ti were calculated asfollows:
Fm;j(ti) =Q
A�min;j(ti�1) +min;j(ti+1)
2�mout;j(ti)
�Mj
Vm
j = NO;NO2; O3; i = 2; 4; 6; 8; ::: (2a)
where the mixing ratio ( min;j(ti) ) at the entranceslit is approximated by the mean of two consecutivemeasurements for the time intervals ti�1 and ti+1.
The "blank" fluxes, Fbl;j , to the (inner) chamberwalls were extensively investigated by laboratory stud-ies and were permanently checked in-situ by the oper-ation of a "blank" chamber. From the results of cor-responding laboratory experiments, sorption effects tothe inner walls of the chamber were parameterizedin terms of related "wall deposition" velocities, vbl;j(vbl;NO = 0.04�10�3 m s�1; vbl;NO2 = 0.15�10�3 ms�1; vbl;O3 = 0.85�10�3 m s�1). Hence, under fieldconditions, "blank" fluxes Fbl;j were calculated as fol-lows:
Fbl;j = �Ach
Ablch
Vbl;jmout;j
Mj
Vm; j = NO;NO2; O3
(3)where Ach and Abl
ch are the areas of the inner wall sur-face of the sampling and the "blank" chambers, respec-tively. During our field campaign relative contributions

129
of Fbl;j to Fm;j were approx. 20% for O3, � 5% NO2,and� 1% for NO.
As the air sample passes through the (closed)dynamic chamber and tubing, fast chemical reactionsof the NO- NO2-O3 triad, such as:
NO2 + hvO2�!NO +O3; k4 = j (NO2) (4)
NO + O3 �! NO2 +O2;
k5 = 5:7� 107e�1450=T (5)
affect individual mixing ratios (c.f. Kramm et al.,1991) and consequently generate (positive or nega-tive) gas-phase fluxes (Fgp;j), which may significantlycontribute to the mass balance of the dynamic cham-ber. Hence, Fgp;j for the individual species can beformulated as follows:
Fgp;NO =
Vch
A[k4mout;NO2 � k5mout;NOmout;O3 ]
MNO
Vm; (6)
Fgp;NO2 =
Vch
A[k5mout;NOmout;O3 � k4mout;NO2 ]
MNO2
Vm(7)
Fgp;O3 =
Vch
A[k4mout;NO2 � k5mout;NOmout;O3 ]
MO3
Vm(8)
where Vch is the volume of the dynamic chamber.The NO2-photolysis rate, j(NO2), was reduced con-siderably inside the chamber due to the used chambermaterial. From our measurements, the reduction couldbe quantified to 85%, hence we used k4 = 0.15�j(NO2)to calculate Fgp;j in eqs. (6–8). Reaction rate k5 wascalculated after Hampson and Garvin (1978) as a func-tion of the air temperature inside each chamber. Sinceambient O3 mixing ratio (11–103 ppbv) was always(far) in excess of NO and NO2 (� 0.05-1.2 ppbv,and 0.1–2.4 ppbv, respectively), the contribution ofFgp;j to Fm;j was dominated by reaction (5). In caseof NO, the relative contribution was usually between30–70%. The scheme for the gas-phase correctionswas checked quantitatively for each flux measurementcycle by applying it to the corresponding data of the"blank" chamber.
The precision of the measured flux Fm;NO is main-ly determined by that of the difference between min;NO
and mout;NO, and consequently by that of the NO-analyzer. Considering the reproducibility of the NO-analyzer, we quantified the minimum detectable NO-flux as 0.44 ngN m�2 s�1 (2�). For jmin;NO -
mout;NOj> 0.15 ppbv, the relative error of Fm;NO fallsbelow < 25%, while for low NO net fluxes (jmin;NO
- mout;NOj < 0.05 ppbv) the relative error of Fm;NO
could be very large (� 100%). Since min;NO for agiven flux measurement interval ti is approximated bythe mean of two consecutive measurements (at ti�1
and ti+1, equ. (2a)), the quality of Fm;NO is also aquestion of whether min;NO was sufficiently constantwith time. For jmin;NO(ti�1) - min;NO(ti+1)j > 0.5ppbv NO fluxes were not calculated.
Preliminary results
NO flux measurements at Marondera spanned fromthe first week of October to 14 December 1994. The1994 dry season ended at the study area on 13 October(16:00h) with a sequence of heavy rain showers (a totalof 59mm) that lasted to 17 October. Therefore, only afew measurements were conducted in the dry season.In the following, we emphazise the seasonal overviewof net vertical NO fluxes at the three sub-sites. Detailedevaluation of diel cycles of NO fluxes and particularanalysis of the impact of controlling factors (soil mois-ture and temperature) are still in progress.
Grassland
At the grassland site, diel flux measurement cycleswere performed for 10 periods of 1–2 days each. Dailymeans of the vertical net NO fluxes (Ff;NO) measuredusing the 4 dynamic chambers are shown in Fig. 5.Chambers 1 and 2 enclosed soil and dry grass, whilechambers 3 and 4 covered bare soil only. Daily meansof soil temperature and moisture measured in cham-ber 1 and 4, respectively, are also shown in Fig. 5.During our measurements in the dry season (11–13October) individual net NO fluxes ranged from �1.3to 1.2 ngN m�2s�1. Volumetric soil water content wasalways < 1.5%, which corresponded to < 3.3% waterfilled pore space (WFPS, calculated with the help ofcorresponding soil bulk density data).The overall aver-age of Ff;NO observed during the dry season was (0.0� 0.43) ngN m�2s�1 and was below the detection limit(0.44 ngN m�2s�1) of the NO flux measurement tech-nique. Within 10 days after the first major rainfall (13October) daily mean NO fluxes increased by an orderof magnitude, declining then steadily over the nextmonth. However, the next major rainfall (25 Novem-ber) raised daily mean NO fluxes again, by factors of

130
Figure 5. Seasonal variation of daily means of net vertical NO flux, soil temperature (1 cm), and volumetric soil water content (0–5 cm) at the"grassland" site, Grasslands Research Station, Marondera. Rainfalls: 13 October, 25 October, and 09/10 December 1994. (Note: time scale isnot linear, but rather on event basis).
5 and 10 in chambers 1 and 2 respectively, and byfactors of 20 to 30 in chambers 4 and 3, respectively.During November, when fluxes declined again untilthe next major rainfall (9/10 December), there werepronounced differences between NO fluxes measuredby chambers 1 & 2 and chambers 3 & 4. The largevariation of Ff;NO (1–30 ngN m�2s�1) during the wetseason is closely linked to a corresponding variation ofdaily mean volumetric soil moisture content (see lowerpart of Fig. 5).
Miombo forest
The seasonal variation of daily mean NO fluxes at theMiombo site is similar to that observed at the grass-land site (see Fig. 5). However, during the periodbetween 11 and 13 October (dry season), NO fluxesranged between -0.4 and +1.7 ngN m�2s�1, averaging(0.4�0.42) ngN m�2s�1, and there was no significantdifference between the NO fluxes from the 4 differ-ent chambers. Daily means of soil temperature andmoisture (measured in chamber 3) are also shown inFig. 6. During dry season, the volumetric soil water
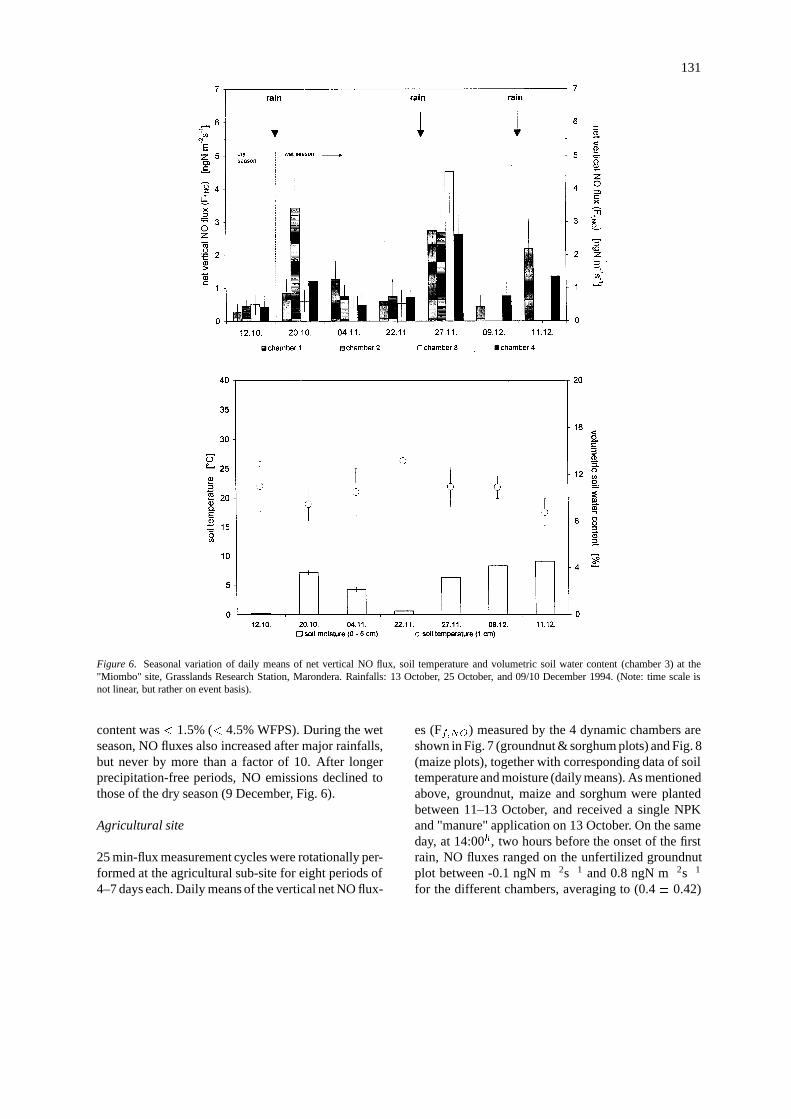
131
Figure 6. Seasonal variation of daily means of net vertical NO flux, soil temperature and volumetric soil water content (chamber 3) at the"Miombo" site, Grasslands Research Station, Marondera. Rainfalls: 13 October, 25 October, and 09/10 December 1994. (Note: time scale isnot linear, but rather on event basis).
content was < 1.5% (< 4.5% WFPS). During the wetseason, NO fluxes also increased after major rainfalls,but never by more than a factor of 10. After longerprecipitation-free periods, NO emissions declined tothose of the dry season (9 December, Fig. 6).
Agricultural site
25 min-flux measurement cycles were rotationally per-formed at the agricultural sub-site for eight periods of4–7 days each. Daily means of the vertical net NO flux-
es (Ff;NO) measured by the 4 dynamic chambers areshown in Fig. 7 (groundnut & sorghum plots) and Fig. 8(maize plots), together with corresponding data of soiltemperature and moisture (daily means). As mentionedabove, groundnut, maize and sorghum were plantedbetween 11–13 October, and received a single NPKand "manure" application on 13 October. On the sameday, at 14:00h, two hours before the onset of the firstrain, NO fluxes ranged on the unfertilized groundnutplot between -0.1 ngN m�2s�1 and 0.8 ngN m�2s�1
for the different chambers, averaging to (0.4 � 0.42)
132
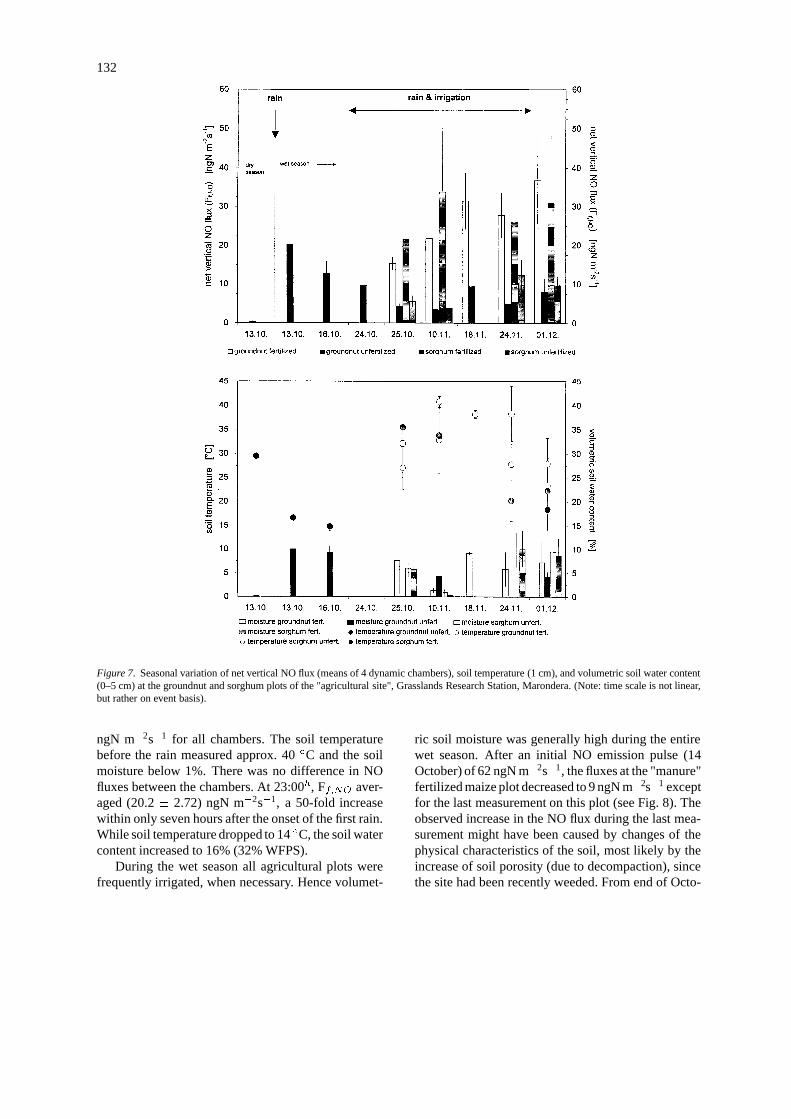
Figure 7. Seasonal variation of net vertical NO flux (means of 4 dynamic chambers), soil temperature (1 cm), and volumetric soil water content(0–5 cm) at the groundnut and sorghum plots of the "agricultural site", Grasslands Research Station, Marondera. (Note: time scale is not linear,but rather on event basis).
ngN m�2s�1 for all chambers. The soil temperaturebefore the rain measured approx. 40 �C and the soilmoisture below 1%. There was no difference in NOfluxes between the chambers. At 23:00h, Ff;NO aver-aged (20.2 � 2.72) ngN m�2s�1, a 50-fold increasewithin only seven hours after the onset of the first rain.While soil temperature dropped to 14 �C, the soil watercontent increased to 16% (32% WFPS).
During the wet season all agricultural plots werefrequently irrigated, when necessary. Hence volumet-
ric soil moisture was generally high during the entirewet season. After an initial NO emission pulse (14October) of 62 ngN m�2s�1, the fluxes at the "manure"fertilized maize plot decreased to 9 ngN m�2s�1 exceptfor the last measurement on this plot (see Fig. 8). Theobserved increase in the NO flux during the last mea-surement might have been caused by changes of thephysical characteristics of the soil, most likely by theincrease of soil porosity (due to decompaction), sincethe site had been recently weeded. From end of Octo-

133
Figure 8. Seasonal variation of the net vertical NO flux (means of 4 dynamic chambers), soil temperature (1 cm), and volumetric soil watercontent (0–5 cm) at the maize plots of the "agricultural site", Grasslands Research Station, Marondera. (Note: time scale is not linear, but onevent basis).
ber, Ff;NO in the unfertilized plots revealed only mod-erate variations (maize: 7–14 ngN m�2s�1; ground-nut: 4–9 ngN m�2s�1; sorghum: 4–12 ngN m�2s�1).NO emissions from fertilized plots were significant-ly above those from the unfertilized plots (except formaize plots at the end of the observational period,see Fig. 8). Excedence factors ranged between 2–9(sorghum), 3–6 (groundnut), and 1–3 (maize).
Diel behaviour of NO flux
We present two examples that describe the typical dielbehaviour of the net vertical NO flux. The first dataset was obtained during 10-11 October (dry season)at the grassland site (Fig. 9). During this period, theaverage volumetric soil water content was 0.4% (0.9%WFPS). Ff;NO varies between � 1.5 ngN m�2s�1
and, as already mentioned above, most data points are
134
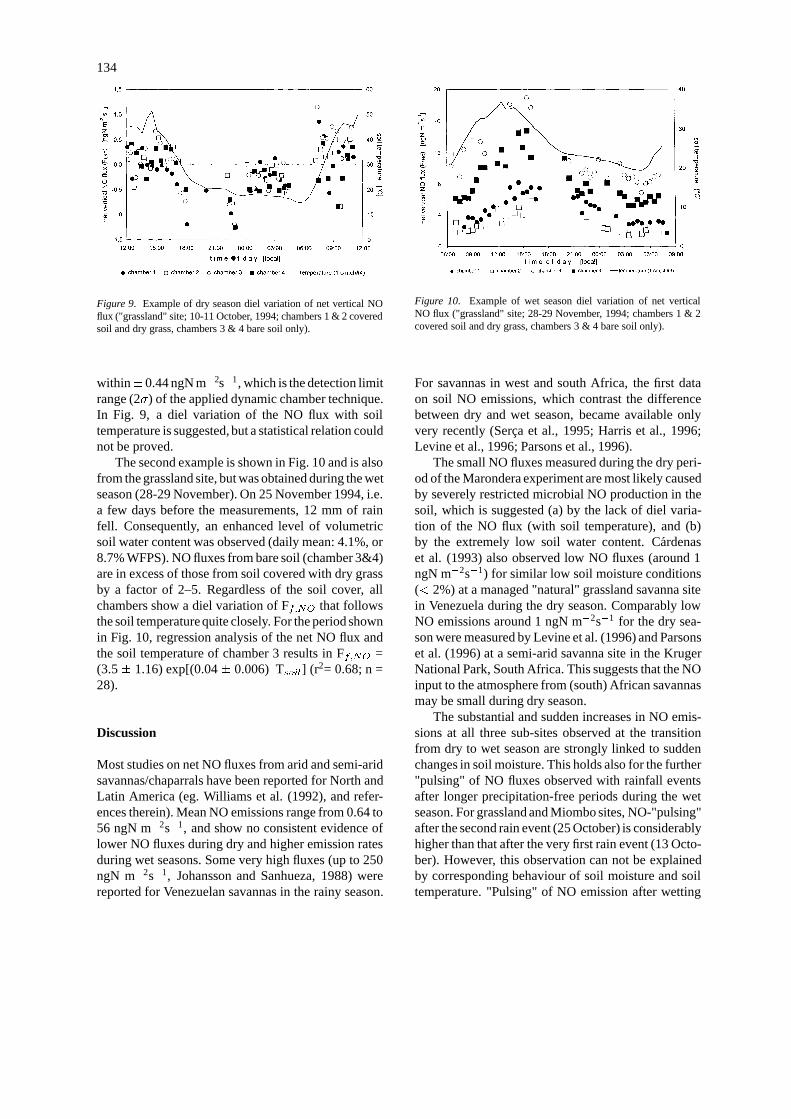
Figure 9. Example of dry season diel variation of net vertical NOflux ("grassland" site; 10-11 October, 1994; chambers 1 & 2 coveredsoil and dry grass, chambers 3 & 4 bare soil only).
within� 0.44 ngN m�2s�1, which is the detection limitrange (2�) of the applied dynamic chamber technique.In Fig. 9, a diel variation of the NO flux with soiltemperature is suggested, but a statistical relation couldnot be proved.
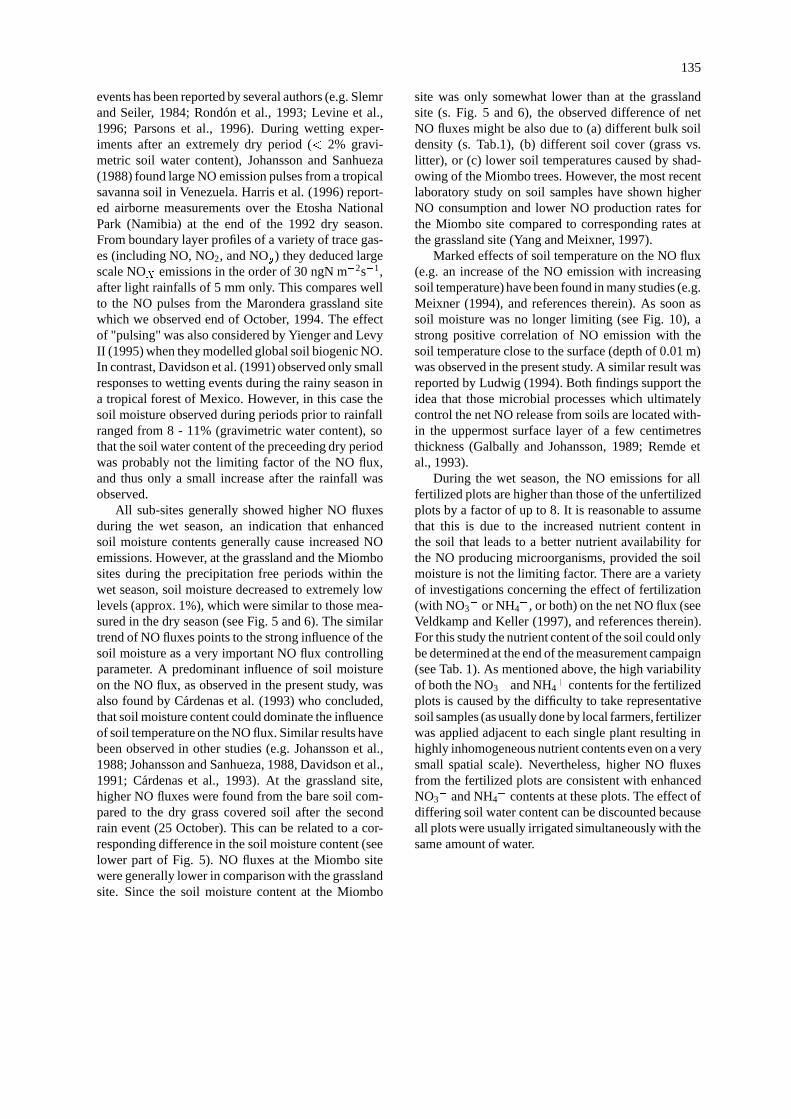
The second example is shown in Fig. 10 and is alsofrom the grassland site, but was obtained during the wetseason (28-29 November). On 25 November 1994, i.e.a few days before the measurements, 12 mm of rainfell. Consequently, an enhanced level of volumetricsoil water content was observed (daily mean: 4.1%, or8.7% WFPS). NO fluxes from bare soil (chamber 3&4)are in excess of those from soil covered with dry grassby a factor of 2–5. Regardless of the soil cover, allchambers show a diel variation of Ff;NO that followsthe soil temperature quite closely. For the period shownin Fig. 10, regression analysis of the net NO flux andthe soil temperature of chamber 3 results in Ff;NO =(3.5 � 1.16) exp[(0.04� 0.006) Tsoil] (r2= 0.68; n =28).
Discussion
Most studies on net NO fluxes from arid and semi-aridsavannas/chaparrals have been reported for North andLatin America (eg. Williams et al. (1992), and refer-ences therein). Mean NO emissions range from 0.64 to56 ngN m�2s�1, and show no consistent evidence oflower NO fluxes during dry and higher emission ratesduring wet seasons. Some very high fluxes (up to 250ngN m�2s�1, Johansson and Sanhueza, 1988) werereported for Venezuelan savannas in the rainy season.
Figure 10. Example of wet season diel variation of net verticalNO flux ("grassland" site; 28-29 November, 1994; chambers 1 & 2covered soil and dry grass, chambers 3 & 4 bare soil only).
For savannas in west and south Africa, the first dataon soil NO emissions, which contrast the differencebetween dry and wet season, became available onlyvery recently (Serca et al., 1995; Harris et al., 1996;Levine et al., 1996; Parsons et al., 1996).
The small NO fluxes measured during the dry peri-od of the Marondera experiment are most likely causedby severely restricted microbial NO production in thesoil, which is suggested (a) by the lack of diel varia-tion of the NO flux (with soil temperature), and (b)by the extremely low soil water content. Cardenaset al. (1993) also observed low NO fluxes (around 1ngN m�2s�1) for similar low soil moisture conditions(< 2%) at a managed "natural" grassland savanna sitein Venezuela during the dry season. Comparably lowNO emissions around 1 ngN m�2s�1 for the dry sea-son were measured by Levine et al. (1996) and Parsonset al. (1996) at a semi-arid savanna site in the KrugerNational Park, South Africa. This suggests that the NOinput to the atmosphere from (south) African savannasmay be small during dry season.
The substantial and sudden increases in NO emis-sions at all three sub-sites observed at the transitionfrom dry to wet season are strongly linked to suddenchanges in soil moisture. This holds also for the further"pulsing" of NO fluxes observed with rainfall eventsafter longer precipitation-free periods during the wetseason. For grassland and Miombo sites, NO-"pulsing"after the second rain event (25 October) is considerablyhigher than that after the very first rain event (13 Octo-ber). However, this observation can not be explainedby corresponding behaviour of soil moisture and soiltemperature. "Pulsing" of NO emission after wetting
135
events has been reported by several authors (e.g. Slemrand Seiler, 1984; Rondon et al., 1993; Levine et al.,1996; Parsons et al., 1996). During wetting exper-iments after an extremely dry period (< 2% gravi-metric soil water content), Johansson and Sanhueza(1988) found large NO emission pulses from a tropicalsavanna soil in Venezuela. Harris et al. (1996) report-ed airborne measurements over the Etosha NationalPark (Namibia) at the end of the 1992 dry season.From boundary layer profiles of a variety of trace gas-es (including NO, NO2, and NOy) they deduced largescale NOX emissions in the order of 30 ngN m�2s�1,after light rainfalls of 5 mm only. This compares wellto the NO pulses from the Marondera grassland sitewhich we observed end of October, 1994. The effectof "pulsing" was also considered by Yienger and LevyII (1995) when they modelled global soil biogenic NO.In contrast, Davidson et al. (1991) observed only smallresponses to wetting events during the rainy season ina tropical forest of Mexico. However, in this case thesoil moisture observed during periods prior to rainfallranged from 8 - 11% (gravimetric water content), sothat the soil water content of the preceeding dry periodwas probably not the limiting factor of the NO flux,and thus only a small increase after the rainfall wasobserved.
All sub-sites generally showed higher NO fluxesduring the wet season, an indication that enhancedsoil moisture contents generally cause increased NOemissions. However, at the grassland and the Miombosites during the precipitation free periods within thewet season, soil moisture decreased to extremely lowlevels (approx. 1%), which were similar to those mea-sured in the dry season (see Fig. 5 and 6). The similartrend of NO fluxes points to the strong influence of thesoil moisture as a very important NO flux controllingparameter. A predominant influence of soil moistureon the NO flux, as observed in the present study, wasalso found by Cardenas et al. (1993) who concluded,that soil moisture content could dominate the influenceof soil temperature on the NO flux. Similar results havebeen observed in other studies (e.g. Johansson et al.,1988; Johansson and Sanhueza, 1988, Davidson et al.,1991; Cardenas et al., 1993). At the grassland site,higher NO fluxes were found from the bare soil com-pared to the dry grass covered soil after the secondrain event (25 October). This can be related to a cor-responding difference in the soil moisture content (seelower part of Fig. 5). NO fluxes at the Miombo sitewere generally lower in comparison with the grasslandsite. Since the soil moisture content at the Miombo
site was only somewhat lower than at the grasslandsite (s. Fig. 5 and 6), the observed difference of netNO fluxes might be also due to (a) different bulk soildensity (s. Tab.1), (b) different soil cover (grass vs.litter), or (c) lower soil temperatures caused by shad-owing of the Miombo trees. However, the most recentlaboratory study on soil samples have shown higherNO consumption and lower NO production rates forthe Miombo site compared to corresponding rates atthe grassland site (Yang and Meixner, 1997).
Marked effects of soil temperature on the NO flux(e.g. an increase of the NO emission with increasingsoil temperature) have been found in many studies (e.g.Meixner (1994), and references therein). As soon assoil moisture was no longer limiting (see Fig. 10), astrong positive correlation of NO emission with thesoil temperature close to the surface (depth of 0.01 m)was observed in the present study. A similar result wasreported by Ludwig (1994). Both findings support theidea that those microbial processes which ultimatelycontrol the net NO release from soils are located with-in the uppermost surface layer of a few centimetresthickness (Galbally and Johansson, 1989; Remde etal., 1993).
During the wet season, the NO emissions for allfertilized plots are higher than those of the unfertilizedplots by a factor of up to 8. It is reasonable to assumethat this is due to the increased nutrient content inthe soil that leads to a better nutrient availability forthe NO producing microorganisms, provided the soilmoisture is not the limiting factor. There are a varietyof investigations concerning the effect of fertilization(with NO3
� or NH4+, or both) on the net NO flux (see
Veldkamp and Keller (1997), and references therein).For this study the nutrient content of the soil could onlybe determined at the end of the measurement campaign(see Tab. 1). As mentioned above, the high variabilityof both the NO3
� and NH4+ contents for the fertilized
plots is caused by the difficulty to take representativesoil samples (as usually done by local farmers, fertilizerwas applied adjacent to each single plant resulting inhighly inhomogeneous nutrient contents even on a verysmall spatial scale). Nevertheless, higher NO fluxesfrom the fertilized plots are consistent with enhancedNO3
� and NH4+ contents at these plots. The effect of
differing soil water content can be discounted becauseall plots were usually irrigated simultaneously with thesame amount of water.

136
Table 2. Nitric oxide emission estimates from different sources in Zimbabwe
emission emission dry season wet season
land use/source areaa rate (dry) rate (wet) (8 months) (4 months) total
km2 ng N m�2 s�1 ng N m�2 s�1 Gg N Gg N Gg N yr�1
min avg max min avg max min avg max
grasslandb 232,700 � 0.5 1.0 4.4 30.5 � 2.5 2.4 10.6 73.6 � 2.4 11.9 76.1
forests (Miombo)b 118,800 � 0.5 0.5 1.5 4.5 � 1.2 0.6 1.8 5.5 � 0.6 2.4 6.7
fert. crop fieldsc 20,090 � 0.5 6.5 27.2 59.0 � 0.2 1.4 5.9 12.8 � 1.4 6.0 13.0
unfert. crop fieldsd 9,100 � 0.5 3.7 8.5 16.3 � 0.09 0.3 0.8 1.5 � 0.3 0.8 1.6
fallow fieldsb 7,000 � 0.5 4.7 14.8 24.2 � 0.07 0.3 1.1 1.8 � 0.3 1.1 1.9
total biogenic 388,500 � 5.0 22.2 99.3
biomass burninge � 2.7 8.9 �15.1
domestic burningf 6.8
coal burningg 21.6
liquid fuelsg 12.0
aSurveyor General Zimbabwe (1984); Zimbabwe total area: 390,000 km2
bthis studycemission rate observed from the fertilized maize plot was used (this study)demission rate observed from the unfertilized groundnut plot was used (this study)eScholes et al. (1996)fLudwig et al. (1996)gNO emissions from industrial coal burning and use of liquid fuels for transport and stationary engines were estimated on the basis of nationalconsumption figures and emission factors from UNEP (1992)
Conclusions
We applied a dynamic chamber technique to studybiogenic NO emissions from a savanna ecosystemin southern Africa. We show that among the correc-tions which have to be applied to NO fluxes measuredby this technique, the most important one is due tothe reaction of NO with O3 in the air stream whileit passes through the chamber. Our results for threesub-sites of the ecosystem, namely grassland, Miom-bo forest, and fertilized/unfertilized agricultural plots(maize, groundnut, sorghum) have particularly shownthat
– during the dry season, net vertical NO fluxes werevery low (� 0.5 ngN m�2s�1) and comparablefor all sub-sites; statistically significant diel varia-tions of NO fluxes (with temperature) could not bedetected,
– the transition from dry to wet season was charac-terized by strong "pulsing" effects of the NO fluxwhich are linked to drastic changes in soil mois-ture; within hours, NO emissions increased by afactor of up to 60 compared to dry season levels,
– during the wet season, NO emissions from non-irrigated sub-sites declined towards the end oflonger precipitation-free events; in the case of
the Miombo forest, emission levels comparable tothose of the dry season (in parallel with soil mois-ture) were reached,
– during the wet season, at all sub-sites, enhancedsoil moisture and its variation is considered to beresponsible for generally higher NO fluxes andtheir variability (0.5 ngN m�2 s�1 to 62 ngN m�2
s�1),– as soon as soil moisture is no longer limiting, the
diel behaviour of NO emission closely followed thedaily variation of soil temperature in the uppermostsoil level,
– NO fluxes from fertilized agricultural plots exceed-ed those from the unfertilized control plots by fac-tors which ranged between 2–9 (sorghum), 3–6(groundnut), and 1–3 (maize),
– during the wet season, biogenic NO emissions var-ied between the different sub-sites of the ecosys-tem. Wet season means of fertilized agriculturalplots were highest (27.2 ngN m�2 s�1) followed byunfertilized agricultural plots (8.5 ngN m�2 s�1),grassland (4.4 ngN m�2 s�1 ) and Miombo forest(1.5 ngN m�2 s�1).
Finally, we would like to compare biogenic NOfluxes to those from other sources. For Africa south

137
of the equator, on national basis, Scholes et al. (1996)have estimated the annual NO emission of vegetationfires from the results of the SAFARI’92 experiment(Southern African Fire Atmosphere Research Initia-tive, Andreae et al., 1994). For Zimbabwe their esti-mate of NOx emission from vegetation fires for thenominal year of 1989 was 8.9 Gg N yr�1 (where NOx
emissions have been assumed to be entirely NO). Thisvalue does not include any wet-season emissions, northose which are associated with biomass burning dueto land clearing, crop residues and domestic fuel use.Therefore, this value has to be considered as a lowerestimate. The authors quote the error of their estimateto be greater than 70%. For comparison, we used ourdata to present a first estimate of biogenic NO emis-sions from grassland, forests, fertilized, unfertilizedand fallow fields of Zimbabwe. The results are givenin Tab. 2 together with data of some other NO sourcesof Zimbabwe (domestic and industrial coal burning,liquid fuels for transport and stationary engines). Aver-age biogenic NO emissions from grassland (11.9 Gg Nyr�1) are of equal magnitude to those from dry-seasonvegetation fires (mainly savanna grass burning). Thisis in agreement with the suggestion of Scholes et al.(1996), on the basis of the measurements of Parsonset al. (1996). While the NO input to the atmospherefrom (southern) African savannas may be small duringthe dry season, pulses of biogenic NO emission fromsoils during the transition between dry and wet sea-son, as well as during the wet season may substantiallycontribute to the regional NOX -budget. Furthermore,anticipated land use change in southern Africa (dueto population pressure), which will likely result in theconversion of more savanna and forested ecosystems topermanently cultivated and fertilized areas, will mostlikely raise Africa’s contribution to the atmosphericNOX -budget in coming years.
Acknowledgements
We are grateful to the National Research Council ofZimbabwe and to the Department of Research andSpecialist Services of the Ministry of Lands, Agri-culture and Rural Resettlement for the permission toconduct field experiments in Zimbabwe. We also thankthe Grasslands Research Station for the personnel andlogistic support as well as for their enthusiastic co-operation. The pH-value of soil samples was deter-mined by Monika Godde, Max Planck Institute forTerrestrial Microbiology, Marburg, FRG. Many thanks
also to Tracey Andreae, Marc von Hobe, and LeeVierling for their help in editing the manuscript. Thisresearch was funded by the Max Planck Society.
References
Andreae, M.O., Atlas, E., Cachier, H., Cofer III, W.R., Harris,G.W., Helas, G., Koppmann, R., Lacaux, J.P. and Ward, D.E.(1996). Trace gas and aerosol emissions from savanna fires. In:Biomass Burning and Global Change. Levine, J.S. (ed.). MITPress, Cambridge, Mass., 278–295.
Andreae, M.O., Fishman, J., Garstang, M., Goldammer, J.G., Jus-tice, C.O., Levine, J.S., Scholes, R.J., Stocks, B.J., Thompson,A.M., van Wilgen, B., and the STARE/TRACE-A SAFARIScience Team (1994). Biomass burning in the global envi-ronment: First results from the IGAC/BIBEX field campaignSTARE/TRACE-A SAFARI-92. In: R.G. Prinn (ed.), GlobalAtmospheric-Biospheric Chemistry: The First IGAC ScientificConference. Plenum, New York, 83–101.
Campbell, B.M., Swift, M.J., Hatton, J., and Frost, P.G.H. (1988).Small-scale vegetation pattern and nutrient cycling in Miom-bo woodland. In: Vegetation structure in relation to carbonand nutrient economy. Verhoeven, J.T.A., Heil, G.W., Werg-er, M.J.A. (eds.), pp. 69–85, SPB Academic Publishing, TheHague, The Netherlands.
Cardenas, L., Rondon, A., Johansson, C., and Sanhueza, E. (1993).Effects of soil moisture, temperature, and inorganic nitrogenon nitric oxide emissions from acidic tropical savannah soils.Journal of Geophysical Research, 98, 14,783–14,790.
Chameides, W.L., Fehsenfeld, F., Rodgers, M.O., Cardelino, C.,Martinez, J., Parrish, D., Lonneman, W., Lawson, D.R., Ras-mussen, R.A., Zimmerman, P., Greenberg, J., Middleton, P., andWang, T. (1992). Ozone precursor relationships in the ambientatmosphere. Journal of Geophysical Research, 92, 6,037–6,055.
Crutzen, P.J. (1987) Role of the tropics in atmospheric chemistry.In: The Geophysiology of Amazonia. Dickinson, R.E. (ed.). pp.107–132. John Wiley & Sons, New York.
Davidson, E.A., Vitousek, P.M., Matson, P.A., Riley, R., Garcia-Mendez, G., and Mass, J.M. (1991). Soil emissions of nitricoxide in a seasonally dry tropical forest of Mexico. Journal ofGeophysical Research, 96, 15,439–15,445.
Davidson, E. A. (1993): Soil water content and the ratio of nitrousoxide to nitric oxide emitted from soil. In: The Biogeochemistryof Global Change: Radiatively Active Trace Gases, Oremland,R.S. (ed.), pp. 369–386, Chapman and Hall, New York.
Fried, A. and Hodgeson, J. (1982). Laser photoacoustic detectionof nitrogen dioxide in the gasphase titration of nitric oxide withozone.Analytical Chemistry, 54, 278–282.
Galbally, I.E. and Roy, C.R. (1980). Destruction of ozone at theearth’s surface.Quart. J. Roy. Meteor. Soc., 106, 599–620.
Galbally, I.E. and Johansson, C. (1989). A model relating labora-tory measurements of rates of nitric oxide production and fieldmeasurements of nitric oxide emissions from soils.Journal ofGeophysical Research, 94, 6,473–6,480.
Hampson R.F. and Garvin, D. (1978). Reaction rate and photochem-ical data for atmospheric chemistry - 1977. Special Publications513, National Bureau of Standards, U.S.A.
Harris, G.W., Wienhold, F.G., and Zenker, T. (1996). Airborne obser-vation of strong biogenic NOX emissions from the Namibiansavanna at the end of the dry season. Journal of GeophysicalResearch, 101, 23,707–23,711.

138
Hartge, K.H. and Horn, R. (1989). Die physikalische Untersuchungvon Boden. Ferdinand Enke Verlag, Stuttgart, Germany.
Johansson, C., Rodhe, H., and Sanhueza, E. (1988). Emission ofNO in a tropical savanna and a cloud forest during the dryseason.Journal of Geophysical Research, 93, 7,180–7,192.
Johansson, C. and Sanhueza, E. (1988). Emission of NO from savan-na soils during rainy season. Journal of Geophysical Research,93, 14,193–14,198.
Kramm, G., Muller, H., Fowler, D., Hofken, K.D., Meixner, F.X.,and Schaller, E. (1991). A modified profile method for deter-mining the vertical fluxes of NO, NO2, ozone, and HNO3 in theatmospheric surface layer. J. Atm. Chemistry, 13, 265–288.
LeRoux, X., Abbadie, L., Lensi, R., and Serca, D. (1995 ). Emissionof nitrogen monoxide from African tropical ecosystems: Controlof emission by soil characteristics in humid and dry savannasof West Africa. Journal of Geophysical Research, 100, 23,133–23,142.
Levine, J.S., Cofer III, W.R. Cahoon Jr., D.R., Winstead, E.L.,Sebacher, D.I., Sebacher, S., Scholes, M., Parsons, D.A.B.and Scholes, R.J. (1996). The impact of wetting and burningon biogenic soil emissions of nitric oxide (NO) and nitrousoxide (N2O) in savanna grasslands in south Africa. Journal ofGeophysical Research, 101, 23,689–23,697.
Ludwig, J. (1994). Untersuchungen zum Austausch von Stickoxidenzwischen Biosphare und Atmosphare. PhD Thesis. Universityof Bayreuth, Bayreuth, Germany.
Ludwig, J., Marufu, T.L., Andreae, M.O., Meixner, F.X., and Helas,G. (1996). Domestic burning of biomass fuels in developingcountries - A significant source of atmospheric pollutants, paperin preparation.
Meixner, F.X. (1994). Surface exchange of odd nitrogen oxides.Nova Acta Leopoldina, NF 70 (288), 299–348.
Parsons, D.A.B., Scholes, M., Scholes, R.J. and Levine, J.S. (1996).Biogenic NO emission from savanna soils as a function of soilnitrogen and water status. Journal of Geophysical Research,101, 23,683–23,688.
Potter, C.S., Matson, P.A., Vitousek, P.M. and Davidson, E.A.(1996). Process modeling of controls on nitrogen trace gas emis-sions from soils worldwide. Journal of Geophysical Research,101, 1,361–1,377.
Remde, A., Ludwig, J., Meixner, F.X., and Conrad, R. (1993). Astudy to explain the emission of nitric oxide from a marsh soil.Journal of Atmospheric Chemistry, 17, 249–275.
Rondon, A., Johansson, C., and Sanhueza, E. (1993). Emissionof nitric oxide from soils and termite nests in a Trachypogonsavanna of the Orinocco basin. Journal of Atmospheric Che-mistry, 17, 293–306.
Schlichting, E. and Blume, H.-P. (1966). Bodenkundliches Prak-tikum. Verlag Paul Parey, Hamburg, Berlin.
Scholes, R.J., Ward, D., and Justice, C.D. (1996). Emissions oftrace gases and aerosol particles due to vegetation burning insouthern- hemispheric Africa. Journal of Geophysical Research,101, 23,677–23,682.
Slemr, F. and Seiler, W. (1984). Field measurements of NO andNO2 emissions from fertilized and unfertilized soils. Journal ofAtmospheric Chemistry, 2, 1–24.
Serca, D., Delmas, R., LeRoux, X., and Labroue, L. (1997). Emis-sion of nitrogen monoxide from African tropical ecosystems:Spatial variability at local and regional scale. Journal of Geo-physical Research, submitted.
Surveyor General Zimbabwe (1984). Natural regions and farmingareas. 2nd edition, Surveyor General’s Office, Harare, Zimbab-we.
UNEP (1992). United Nations Environmental Programme (UNEP)Greenhouse Gas Abatement Costing Studies - Zimbabwe Coun-try Study - Phase 1, UNEP Nairobi, Kenya.
Veldkamp, E. and Keller, M. (1997). Fertilizer induced nitric oxideemissions from agricultural soils. Nutrient Cycling in Agroe-cosystems, this volume.
Williams, E.J., Hutchinson, G.L., and Fehsenfeld, F.C. (1992). NOX
and N2O emission from soil. Global Biogeochemical Cycles, 6,351–388.
Yang, W.X. and Meixner, F.X. (1997). Laboratory studies on therelease of nitric oxide from sub-tropical grassland soils: Theeffect of soil temperature and moisture. Proc. Int. Conf. on"Nitrogen Emissions from Grasslands", Institute of Grasslandsand Environmental Research (IGER), North Wyke, U.K., 20-22May, 1996, in press.
Yienger, J.J. and Levy II, H. (1995). Empirical model of globalsoil-biogenic NOx emissions. Journal of Geophysical Research,100, 11,447–11,464.