Climate Change And Agriculture In Turkey: A Cge Modeling Approach
24
Paper presented at EconAnadolu 2009: Anadolu International Conference in Economics June 17-19, 2009, Eskişehir, Turkey. 1 Climate Change And Agriculture In Turkey: A Cge Modeling Approach * Erol H. Cakmak Department of Economics, Middle East Technical University, Ankara. Hasan Dudu ** Department of Economics, Middle East Technical University, Ankara. [email protected] Sirin Saracoglu Department of Economics, Middle East Technical University, Ankara. Abstract Agriculture remains an important source of income and employment in Turkey. Agricultural production is heavily dependent on water availability for increasing productivity and decreasing volatility in production. Half of the crop production in Turkey relies on irrigation. Irrigated agriculture currently consumes about 75 percent of total water consumption which is about 30 percent of renewable water availability. However climate change is expected to increase the sectoral competition for water resources and raise the need for major changes in water policies in the medium- and the long-run. This study is the first to analyze the likely effects of climate change and changes in the Turkish economy via an economy-wide Walrasian Computable General Equilibrium model with a detailed account of the agricultural sector: 20 agricultural activities in each of the 5 regions are differentiated as irrigated and rainfed. The study investigated the economy-wide effects of climate change, along with the impact of the domestic reallocation of water between agricultural and non-agricultural use. It was also recognized that because of spatial heterogeneity of the climate, the simulated scenarios have differential impact on the agricultural production and hence on the allocation of factors of production including water. Major macroeconomic indicators change significantly under the climate change simulations. The decline in GDP is significant. Wage rate falls, while other factors’ prices increase. Production of irrigated crops decline significantly. Balance of trade in agricultural products becomes negative, indicating both a fall in exports and increase in imports. Key words: Computable General Equilibrium; Feedback links; Climate change, Agriculture; Irrigation Water; Turkey JEL classification: C68; O13 ; Q15; Q18 * This paper is a product of the project “Macro-Micro Feedback Links of Irrigation Water Management”, funded by the Research Committee of World Bank and managed by DECRG-RU. We are indebted to Ariel Dinar, Ozan Eruygur, Xinshen Diao, Terry Roe, Yacov Tsur and Erinc Yeldan for their valuable advice and comments. They are not responable for any remaining deficiencies. ** Corrsponding author: Department of Economics, Middle East Technical University, Ankara, e-mail: [email protected]
Transcript of Climate Change And Agriculture In Turkey: A Cge Modeling Approach

Paper presented at EconAnadolu 2009: Anadolu International Conference in Economics June 17-19, 2009, Eskişehir, Turkey.
1
Climate Change And Agriculture In Turkey: A Cge Modeling Approach*
Erol H. Cakmak Department of Economics, Middle East Technical University, Ankara. Hasan Dudu**
Department of Economics, Middle East Technical University, Ankara.
[email protected] Sirin Saracoglu Department of Economics, Middle East Technical University, Ankara. Abstract Agriculture remains an important source of income and employment in Turkey. Agricultural production is heavily dependent on water availability for increasing productivity and decreasing volatility in production. Half of the crop production in Turkey relies on irrigation. Irrigated agriculture currently consumes about 75 percent of total water consumption which is about 30 percent of renewable water availability. However climate change is expected to increase the sectoral competition for water resources and raise the need for major changes in water policies in the medium- and the long-run. This study is the first to analyze the likely effects of climate change and changes in the Turkish economy via an economy-wide Walrasian Computable General Equilibrium model with a detailed account of the agricultural sector: 20 agricultural activities in each of the 5 regions are differentiated as irrigated and rainfed. The study investigated the economy-wide effects of climate change, along with the impact of the domestic reallocation of water between agricultural and non-agricultural use. It was also recognized that because of spatial heterogeneity of the climate, the simulated scenarios have differential impact on the agricultural production and hence on the allocation of factors of production including water. Major macroeconomic indicators change significantly under the climate change simulations. The decline in GDP is significant. Wage rate falls, while other factors’ prices increase. Production of irrigated crops decline significantly. Balance of trade in agricultural products becomes negative, indicating both a fall in exports and increase in imports. Key words: Computable General Equilibrium; Feedback links; Climate change, Agriculture; Irrigation Water; Turkey JEL classification: C68; O13 ; Q15; Q18 * This paper is a product of the project “Macro-Micro Feedback Links of Irrigation Water Management”, funded by the Research Committee of World Bank and managed by DECRG-RU. We are indebted to Ariel Dinar, Ozan Eruygur, Xinshen Diao, Terry Roe, Yacov Tsur and Erinc Yeldan for their valuable advice and comments. They are not responable for any remaining deficiencies. ** Corrsponding author: Department of Economics, Middle East Technical University, Ankara, e-mail: [email protected]

Paper presented at EconAnadolu 2009: Anadolu International Conference in Economics June 17-19, 2009, Eskişehir, Turkey.
2
Introduction Agriculture remains to be an important sector in the Turkish economy. This sector is a
major source of employment accounting for 27 percent of the total workforce, and provide
employment to approximately 70 percent of the rural workforce. However, similar to other
rapidly growing economies, the share of agriculture in Turkey’s gross domestic product
(GDP) has declined from 30 percent in the late 1970s to 9 percent in 2008. The agricultural
sector, overall, appears to lag behind the rest of the economy in transforming to one with
comparable per capita value added. . The growth rate of agricultural value added is about one
fourth of the rest of the economy, which explains the declining share of agriculture in GDP
over the past three decades.
Irrigation has a significant role in agricultural production. Irrigated agriculture forms
about half of the crop production value. Diverse climatic zones, ranging from Mediterranean
to semi-arid continental climate, and varied regional availability of water resources in Turkey,
imply that water is a major factor in increasing productivity and decreasing volatility in
agricultural production. Almost all export oriented crops (fruits and vegetables) and import-
competing crops (cotton and maize) are heavily dependent on irrigation.
Development of water infrastructure in Turkey has gained momentum in the late
1960s. Irrigated area has more than doubled since then and the storage capacity of dams
reached 140 billion m3. Due to an increase in population, per capita water availability is down
to roughly 1,700 m3 per year. The irrigation sector is currently consuming about 75 percent of
total water consumption which corresponds to about 30 percent of renewable water
availability. The non-agricultural demand for water is increasing rapidly due to the fast pace
of urbanization and industrialization. However, supply-management practices targeting
mainly the development of irrigation infrastructure, have continued to prevail as the major
determinant of irrigated agriculture.
Several developments will certainly increase the competition for water resources and
may stipulate radical changes in water policies in the medium- and long-run. The rapid pace
of urbanization may lead to changes in the inter-sectoral allocation of water. The
Mediterranean basin is expected to be severely affected by the climate change. This may
further increase the pressure on an already stressed water economy with severe implications
for the agricultural sector. Growing interest by developed countries in biofuels, combined
with increasing demand for food, is aggravating the impact of climate change. Although
recent surges in prices of basic staples have begun to decline, the agricultural commodity

Paper presented at EconAnadolu 2009: Anadolu International Conference in Economics June 17-19, 2009, Eskişehir, Turkey.
3
prices, however, are expected to remain high compared to historical averages. In addition, the
renewal of the WTO-Agreement on Agriculture and Turkey’s candidacy for membership to
the European Union (EU) will add new dimensions to the deliberations on agricultural and
water policies.
Based on this background it is therefore necessary to evaluate the consequences of
recent changes in the national and international scenes in the Turkish economy to provide a
better dialogue with policy makers and to develop proper policy responses.
The purpose of this study is to analyze the potential effects of climate change in the
Turkish economy by using an economy-wide model. The Walrasian CGE model for Turkey
disaggregates the economy into 20 agricultural and 9 non-agricultural activities. The
agricultural sector is further disaggregated into 5 regions. The model incorporates agricultural
and non-agricultural water use with the differentiated irrigated and rainfed agricultural
production activities at the regional level. Furthermore, a farm level model is used to estimate
the shadow value of water in agriculture. With the highly disaggregated nature of the
agricultural sector, in response to climate change (as summarized by various scenarios) the
model is expected to capture the reallocation of factors of production (labor, capital, and
water) across various agricultural activities and also non-agricultural activities, along with the
changes in returns to these factors of production, leading to changes in sectoral, regional and
aggregate income.
In what follows, section 1 introduces the background in water and agricultural sectors
in Turkey. Section 2 discusses the climate change phenomenon briefly, and considers the
likely impacts on Turkish agriculture. These impacts are summarized under three scenarios of
climate change: the likely changes in crop yields with changing rainfall and availability of
water. Section 3 introduces the CGE modeling framework that implements these scenarios
with a detailed account of agriculture, and section 5 presents the empirical results from the
model. Finally, section 5 concludes with policy implications of the present study and future
research agenda.
1 Overview of Water and Agricultural Sectors in Turkey Import substituting agricultural commodities (maize and cotton) and most of the
exported products (fruits and vegetables) are irrigation intensive. Although Turkey is
currently using only 40 percent of its available water resources, it is estimated that the country
will reach its limits of available water within two decades due to increasing demands from all
sectors. The estimates are based on the increase in the non-agricultural demand and the full
Paper presented at EconAnadolu 2009: Anadolu International Conference in Economics June 17-19, 2009, Eskişehir, Turkey.
4
development of 8.5 million hectares of “economically irrigable” land. Supply-side water
policies still dominate, despite the widely pronounced pressures from the demand side. Over-
abstraction of groundwater in some regions and over-use of surface water in others continue
to be the major supply side issues in the water sector.
Due to the frequent economic crises in the past two decades, and the mismanagement
of agricultural policies, structural change in Turkish agriculture has been delayed. The sector
still dominates the rural economy, providing about 70 percent of total rural employment. The
dualistic structure of production has all the basic traits of a developing economy. It has a
dominant share of production concentrated in small holdings, while co-existing with
commercial and mostly export-oriented producers.
Turkey’s climate is moderated by both the Mediterranean and continental weather
patterns which displays geo-climatic diversity when combined with a highly varied
topography. The average annual temperature is 18-20oC on the southern coast, 14-15oC on
the west coast, and fluctuates between 4 to 19oC in the interior regions, depending on their
distance from sea level. The annual average precipitation is 643 mm, yet varies from 250 mm
in the central part to 3000 mm in the Eastern Black Sea region. Seventy-five percent of annual
rain falls during winter. Annual rainfall is less than 500 mm in the inland Thrace and in the
Eastern Anatolia regions. This diverse precipitation structure emphasizes the crucial
importance of irrigation.
Generally, agricultural production is adversely affected by the shortage and
inconsistency of rainfall during the growing season. Solar energy makes it possible to grow
arid and semi-arid crops such as bananas and citrus. Moreover, it is possible to grow 2 to 3
different crops in irrigated areas that have crop growing seasons for a period of 270 days.
However, some crops may be harvested before maturation, particularly in Eastern Anatolia
with its 60 to 90 growing days. The southeast region has a very low humidity level. The
coastal regions are humid with high precipitation rates. Inevitably, the topographic features
are main factors shaping the distribution. The long-term annual evaporation rates indicate a
high rate, particularly in the southeast region, which receives almost no rainfall during
summer, and reaches more than 2000 mm per year in winter (Kanber et al., 2005).
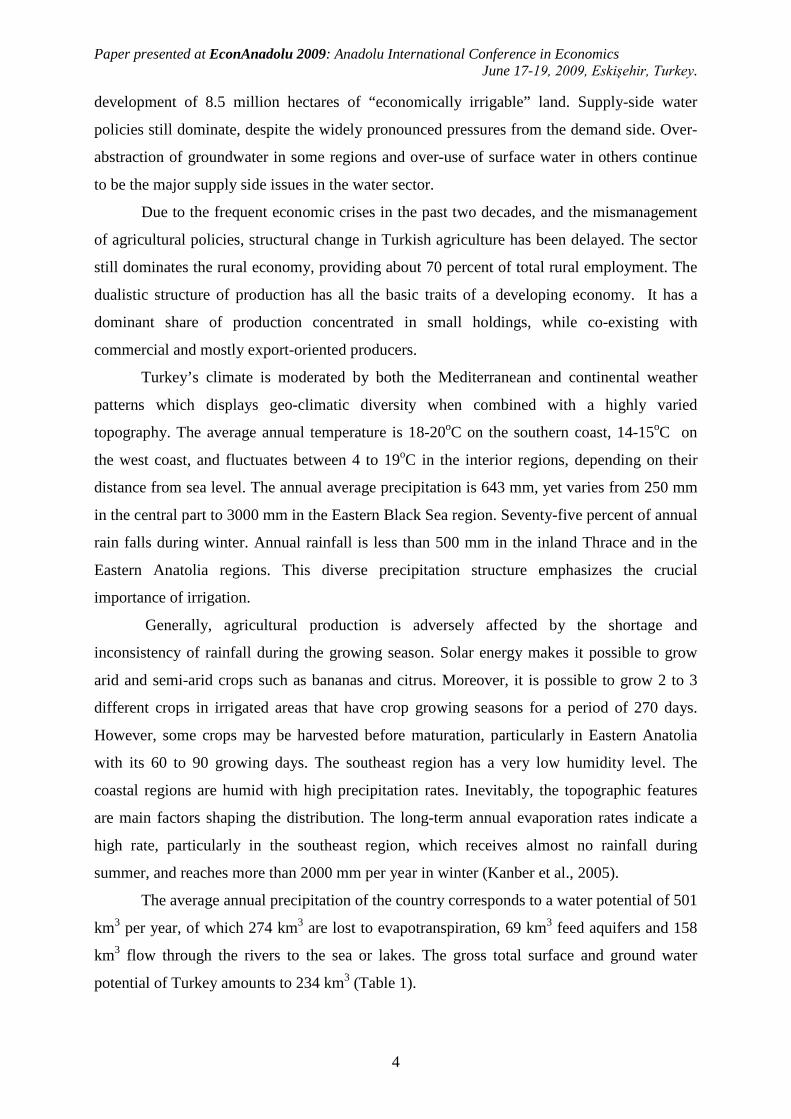
The average annual precipitation of the country corresponds to a water potential of 501
km3 per year, of which 274 km3 are lost to evapotranspiration, 69 km3 feed aquifers and 158
km3 flow through the rivers to the sea or lakes. The gross total surface and ground water
potential of Turkey amounts to 234 km3 (Table 1).

Paper presented at EconAnadolu 2009: Anadolu International Conference in Economics June 17-19, 2009, Eskişehir, Turkey.
5
Table 1. Turkey: Water Resources Potential and Use Surface water Groundwater Total Surface flow 158 km3
Feeding groundwater 69 km3
Mean annual precipitation 501 km3 (603mm)
Surface runoff a 193 km3
Recharge 41 km3
Renewable water potential 234 km3
Usable surface runoffb 98 km3
Safe yield 14 km3
Usable (net) 112 km3
Consumption 31
Consumption 12
Consumption 43
Notes: a includes the contributions from underground (28 km3) and from the neighboring countries (7 km3); b includes the usable flow of 3 km3 from the neighboring countries. Source: DSI, 2008a.
The amount of surface water utilized for consumption purposes is in the range of 98
km3 per year, including the contributions from the neighboring countries. According to the
studies based on groundwater resources, the total safe yield of groundwater resources is
estimated to be 14 km3. Thus, the total potential available water resources from surface flow
and groundwater would amount to 112 km3 per year.
The country’s surface runoff is unevenly distributed in both time and place, consistent
with precipitation. Surface and ground water resources are limited in the Aegean, Thrace and
Central Anatolian regions where the demand for water is higher than the rest of Turkey. The
Aegean and Thrace Regions are highly urbanized and industrialized, and have soil resources
suitable for irrigation. They have 10.5 percent of total surface water resources for the country
while covering 19.3 percent of the entire area. Almost 30 percent of the total surface water
for the country flows through two rivers, the Tigris and Euphrates (DSI, 2007). An irregular
regime of rivers requires reservoirs to regulate the water. It is estimated that 98 km3 of
surface water (51 percent of total surface water) can be consumed by technically and
economically feasible projects. The actual utilizable water amount in Turkey is around 1,700
cum/person/year in 2007.
Sectoral consumption of water is presented in Table 2. Total human and utility water
consumption is increasing steadily with population and income growth, totaling 6.2 km3 per
annum in 2004. The share of the population served by adequate water from the network
connected at home or standpipes, reached 85 percent in rural areas, and 98 percent in urban
areas. Annual water allocated to industry is about 4.1 billion m3 supplied mainly from
groundwater resources.
Paper presented at EconAnadolu 2009: Anadolu International Conference in Economics June 17-19, 2009, Eskişehir, Turkey.
6
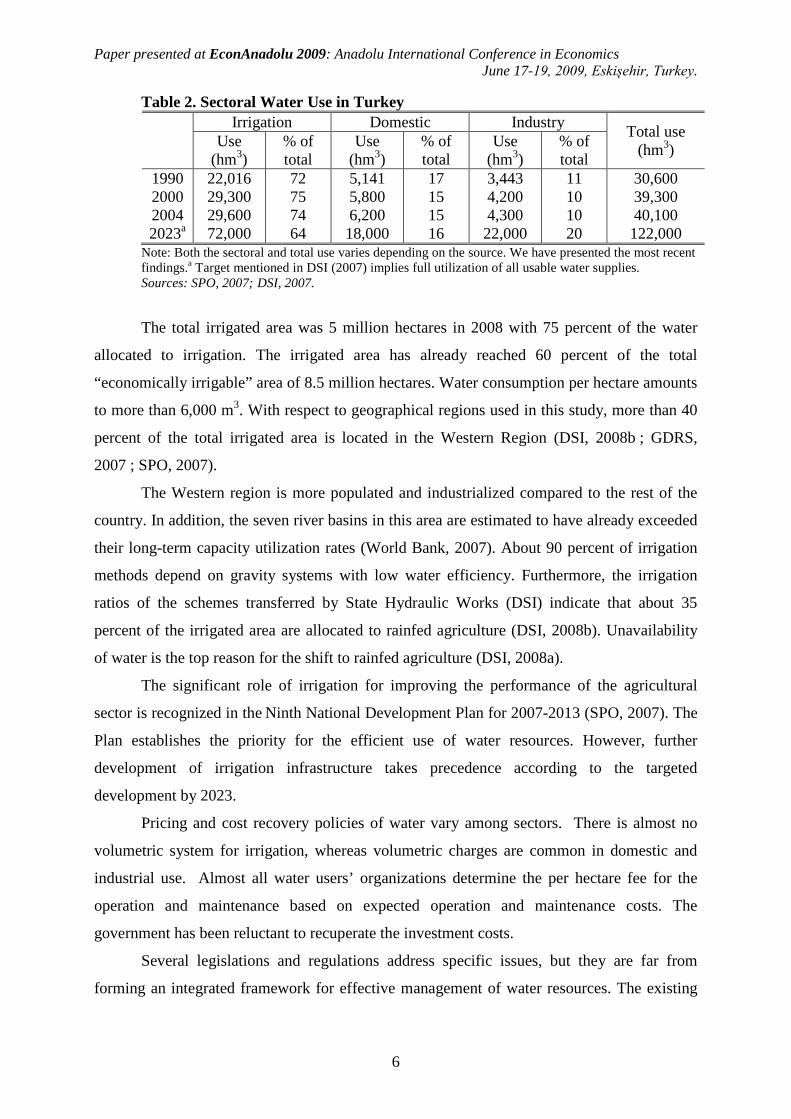
Table 2. Sectoral Water Use in Turkey Irrigation Domestic Industry Total use
(hm3) Use (hm3)
% of total
Use (hm3)
% of total
Use (hm3)
% of total
1990 2000 2004 2023a
22,016 29,300 29,600 72,000
72 75 74 64
5,141 5,800 6,200 18,000
17 15 15 16
3,443 4,200 4,300 22,000
11 10 10 20
30,600 39,300 40,100 122,000
Note: Both the sectoral and total use varies depending on the source. We have presented the most recent findings.a Target mentioned in DSI (2007) implies full utilization of all usable water supplies. Sources: SPO, 2007; DSI, 2007.
The total irrigated area was 5 million hectares in 2008 with 75 percent of the water
allocated to irrigation. The irrigated area has already reached 60 percent of the total
“economically irrigable” area of 8.5 million hectares. Water consumption per hectare amounts
to more than 6,000 m3. With respect to geographical regions used in this study, more than 40
percent of the total irrigated area is located in the Western Region (DSI, 2008b ; GDRS,
2007 ; SPO, 2007).
The Western region is more populated and industrialized compared to the rest of the
country. In addition, the seven river basins in this area are estimated to have already exceeded
their long-term capacity utilization rates (World Bank, 2007). About 90 percent of irrigation
methods depend on gravity systems with low water efficiency. Furthermore, the irrigation
ratios of the schemes transferred by State Hydraulic Works (DSI) indicate that about 35
percent of the irrigated area are allocated to rainfed agriculture (DSI, 2008b). Unavailability
of water is the top reason for the shift to rainfed agriculture (DSI, 2008a).
The significant role of irrigation for improving the performance of the agricultural
sector is recognized in the Ninth National Development Plan for 2007-2013 (SPO, 2007). The
Plan establishes the priority for the efficient use of water resources. However, further
development of irrigation infrastructure takes precedence according to the targeted
development by 2023.
Pricing and cost recovery policies of water vary among sectors. There is almost no
volumetric system for irrigation, whereas volumetric charges are common in domestic and
industrial use. Almost all water users’ organizations determine the per hectare fee for the
operation and maintenance based on expected operation and maintenance costs. The
government has been reluctant to recuperate the investment costs.
Several legislations and regulations address specific issues, but they are far from
forming an integrated framework for effective management of water resources. The existing

Paper presented at EconAnadolu 2009: Anadolu International Conference in Economics June 17-19, 2009, Eskişehir, Turkey.
7
laws and regulations are also far from defining appropriate water rights. Extended drought
periods resulted in full use of available water in western and central regions, initiating transfer
of water from irrigation to non-agricultural sectors. Increasing frequency of water shortages
will augment the uncertainty of irrigation water availability, adversely affecting farmers’
welfare. The legislative arrangements should, at least, cover priority determination for the
intra- and inter-sectoral (irrigation, municipalities, industry, recreation, fishery etc.) allocation
of water, and a proper pricing policy to recover full supply costs of water from the
beneficiaries.
Turkey is resistant toward making any radical changes in agricultural and water
management policies. However climate change, surging agricultural commodity prices in the
medium and long term and rural-urban competition for water resources are expected to affect
the resource allocation within agriculture. Further these factors will also have significant
implications for the inter-sectoral allocation of resources. The impact on producers and
consumers will be diverse, thus it is important to consider the economy-wide feed back
effects of the conducted scenarios to design and prioritize proper policy responses for the
agricultural and water sectors.
2 Climate change and Turkey: Quantification of the Scenarios Climate change is expected to reduce precipitation in Turkey depending on the region.
Reduced precipitation is anticipated to have severe adverse effects on the rainfed agriculture.
Even the irrigated agricultural production will demand more water as a result of reduced
precipitation. Combined by the increase in the urban demand, the pressure on water resources
will certainly increase. The discussion on this topic is generally limited to the price (and
hence production) effects of climate change. We attempt to simulate the effects of the
anticipated climate change by shocking the yields of various crops to observe the economy-
wide effects.
Climate change mainly affects agricultural productivity through reduced water
availability (or runoff, i.e. the difference between rainfall and evapotranspiration)—both by
reduced precipitation and increased temperatures. Most particularly, it has been reported that
most of the Near East Region (including Turkey) will have a decrease in water availability of
up to 40 mm per year, and that the decrease will increase to 80 mm per year in the Anatolian
Plateau.1
1 Summary Report on Climate Change: Implications for Agriculture in the Near East-29th FAO Regional Conference for the Near East, Cairo, The Arab Republic of Egypt, 1-5 March 2008.
Such water deficit stress can cause a decline in agricultural yields or require higher

Paper presented at EconAnadolu 2009: Anadolu International Conference in Economics June 17-19, 2009, Eskişehir, Turkey.
8
water use in irrigation to maintain yields (Yano et al., 2007). In arid and semi-arid parts of the
world, climate changes could easily aggravate periodic and chronic shortages of water, and
most importantly, climate change poses an important threat in developing countries, many of
which are located in arid and semi-arid areas (Watson, et al., 1997). Watson et al. (ibid.)
report also that these countries are especially vulnerable in the sense that they predominantly
rely on single-point systems such as ‘bore-holes’ or ‘isolated reservoirs’ for their water
sources, and once these primary systems fail to function, there is hardly any substitute system
to provide adequate water supply. Additionally, these countries do not possess sufficient
technical, financial or management resources to overcome the vulnerability and adjust to
shortages and/or take on adaptation measures.
Turkey, which is located in arid Western Asia or the Middle East, is also expected to
be significantly affected by climate change (ibid). This region, which already is undergoing
serious water shortages, is possibly one of the regions most influenced by climate change.
Water shortages caused by climate change may also be a blessing in disguise for these
countries as long as they adopt changes in cropping practices and improve efficiency of water
use through efficient irrigation systems (ibid.). However, we have already mentioned that
these countries are more likely to lack adequate technical, financial, or administrative
resources to do so.
Although there are not many studies on the impacts of climate change on food and
agricultural production in the Middle East, one projection finds that increases in temperature
of up to 3-4oC will lead to a fall in yields of predominant regional crops across the region by
25 to 35 percent with weak carbon fertilization, or 15 to 20 percent with strong carbon
fertilization.2,3 When we examine the annual total rainfall (mm) data for Turkish provinces
from the year 1975 in Figures 1, 2, and 3, we see a clear downward trend in annual rainfall
and water availability, particularly in Adana (predominantly producing wheat, maize, cotton,
soybean and citrus), Diyarbakır (primarily supplying wheat, barley and pulses) and Konya
(mostly supplying wheat, barley, sugar beet and pulses), which are important agricultural
regions in the country.4
2 ibid.
Furthermore, Türkeş (1996) has observed that the area-averaged
annual rainfall series has been on the decline slightly throughout Turkey, and particularly over
the Black Sea and the Mediterranean regions between 1930 and 1993,.
3 The negative effect of increase in temperatures may be compensated by positive effects of increased CO2 on crop tolerance to water deficit stress (Fuhrer, 2003; Yano, et al., 2007). 4 According to data from Turkish State Meteorological Service Website, http: meteor.gov.tr

Paper presented at EconAnadolu 2009: Anadolu International Conference in Economics June 17-19, 2009, Eskişehir, Turkey.
9
0
200
400
600
800
1000
1200
1975
1976
1977
1978
1979
1980
1981
1982
1983
1984
1985
1986
1987
1988
1989
1990
1991
1992
1993
1994
1995
1996
1997
1998
1999
2000
2001
2002
2003
2004
2005
2006
2007
Years
Ann
ual t
otal
pre
cipi
tatio
n (m
m)
Figure 1. Annual total precipitation (mm), Adana, 1975-2007
0
100
200
300
400
500
600
700
800
1975
1976
1977
1978
1979
1980
1981
1982
1983
1984
1985
1986
1987
1988
1989
1990
1991
1992
1993
1994
1995
1996
1997
1998
1999
2000
2001
2002
2003
2004
2005
2006
2007
Years
Ann
ual t
otal
pre
cipi
tatio
n (m
m)
Figure 2. Annual total precipitation (mm), Diyarbakır, 1975-2007
0
100
200
300
400
500
600
1975
1976
1977
1978
1979
1980
1981
1982
1983
1984
1985
1986
1987
1988
1989
1990
1991
1992
1993
1994
1995
1996
1997
1998
1999
2000
2001
2002
2003
2004
2005
2006
2007
Years
Ann
ual t
otal
pre
cipi
tatio
n (m
m)
Figure 3. Annual total precipitation (mm), Konya, 1975-2007
Paper presented at EconAnadolu 2009: Anadolu International Conference in Economics June 17-19, 2009, Eskişehir, Turkey.
10
In a simulation study focusing on the effects of climate change on crop growth and
irrigation water demand for a wheat-maize cropping sequence in Adana province in Turkey,
Yano et al. (2007) find that in the future (simulation period 2070-2079), irrigation water
demand in wheat activity will increase due to decreased precipitation in this region. In these
simulations, precipitation is expected to decrease up to 163 mm over the period of 1990 to
2100. They also find that with current (base) CO2 levels and only with increased air
temperature of 2.20C, wheat biomass and grain yield decrease by 24 percent and 12 percent
respectively for the same simulation period. However they conclude that doubling the CO2
levels, combined with an air temperature rise will result in a decrease in biomass by 4 percent,
and an increase in grain yield by 16 percent in the 2070s. For maize, their findings suggest
that its biomass and grain yield both decrease by 17 percent and 25 percent respectively,
under the same scenario of elevated CO2 levels and increased air temperature. Hence, ignoring
the effects of carbon fertilization, one would expect a clear decline in the yields of these
crops.
The impact of climate change on agricultural production in Turkey and its implications
for the Turkish economy are analyzed using three scenarios. First scenario simulates the
impact of a decrease in the yields of rainfed crops by 30 percent (Scenario A), and then the
yields of irrigated crops are decreased by 10 percent (Scenario B). Final scenario (Scenario
C) involves reducing the yield in all types of crops at varying degrees, ranging from 0 to 30
percent, depending on whether the crop is rainfed or irrigated, and the region it is produced in.
3 The Modeling Framework The application of computable general equilibrium (CGE) modeling analysis on water
management issues is relatively new in the literature. CGE modeling has made possible the
exploration of economy-wide effects of the changes in water policy. The direct and indirect
effects of climate change can be easily incorporated into the CGE models to illustrate the
sectoral and economy-wide impact.
3.1. Overview of Water CGE Models
CGE models dealing with water issues can be broadly grouped into four categories
according to their research questions. The first group of models deals with the competition of
different sectors or alternative user groups for water. Seung et al. (2000) model the welfare
effects of using water in irrigation or for recreational purposes. Briand (2004) on the other
hand, introduces drinking water demand and analyzes the competition between drinking and
irrigation water.

Paper presented at EconAnadolu 2009: Anadolu International Conference in Economics June 17-19, 2009, Eskişehir, Turkey.
11
The second group of models investigates the cost recovery and pricing based water
conservation policies. Beritella (2006) for example identifies the global and national level
economic impacts of water transfer projects in China. Valezquez (2007) analyzes the effects
of the increase in the price of irrigation water on the efficiency of the water consumption in
agriculture and the possible reallocation of water to the other sectors. Letsoalo et al. (2005)
test the ‘triple dividend hypothesis’ to see if water price policies can bring about reduced
water use, more rapid economic growth and a more equal income distribution simultaneously.
He concludes that it is possible to achieve triple dividends through water pricing.
Third group of models is related to the facilitation or liberalization of irrigation water
trade. In fact, almost all relevant papers in the literature can be included in this group.
However, some studies are missing the necessary constructs to simulate water markets.
Goodman (2000) shows that water trade can replace construction of new irrigation facilities
by increasing efficiency. Peterson (2004) illustrates that the impact of water shortages can be
compensated by increasing water trade. Dywer (2005), extends the analysis of Peterson
(2004) to urban water usage. Tirado (2004) deals with the effect of having a market for water
rights between urban and agricultural sectors and argues that such a market would benefit
both user groups. Kohn (2003), on the other hand, investigates the effect of international
water trade by using Hecksher-Ohlin framework.
The last group of models attempts to combine CGE models with other types of
models. Finoff (2004) introduces a bio-economic model based on general equilibrium
approach while Smajgl et al.(2005) integrates theoretically agent-based modeling with CGE
models. Lastly, some recent models aimed at analyzing the micro-macro linkages in water
issues with CGE models. Roe et al. (2005) and Diao et al. (2005, 2008) use both top-down
(trade reform) and bottom-up (farm water assignments and the possibility of water trading)
linkages. They concluded that trade reform (top-bottom or macro to micro linkage) has a
higher effect compared to water reform (bottom-up or micro to macro linkage).
Several CGE models were developed for Turkey aimed at analyzing macroeconomic
issues in the 1990s. A selected list may include Harrison et al. (1993, 1996), Yeldan (1997),
Karadag and Westaway (1999). Starting in the early 2000s, efforts devoted to develop CGE
models for Turkey have increased. However, these models are also geared toward macro and
trade analysis with an aggregated agricultural sector.
CGE models targeted specifically to analyze the issues of Turkish agriculture are
relatively few. Agricultural CGE models on Turkey generally seek to address trade
liberalization and structural reform issues. The first serious attempt to analyze the Turkish

Paper presented at EconAnadolu 2009: Anadolu International Conference in Economics June 17-19, 2009, Eskişehir, Turkey.
12
agriculture by using a CGE model is Cakmak et al. (1996), where a partial equilibrium model
is coupled with a CGE model. The CGE model had an aggregated agricultural sector together
with three non-agricultural sectors. The dynamics in the agricultural sector were captured via
the sectoral model. Further, the simulations related to the agricultural sector were done via the
sectoral model, while the CGE simulations aimed to evaluate the effects of macroeconomic
shocks and to reveal the role of the agricultural sector in the macroeconomic adjustment
process.
Diao and Yeldan (2001) developed a general equilibrium model of the Turkish
economy with a detailed agricultural sector. They have used an inter-temporal CGE model to
analyze the effects of global agricultural trade liberalization. Turkey is one of the regions in
the model along with Morocco and other Middle Eastern countries. Agriculture is
disaggregated into five subsectors; grain crops, vegetables and fruits, sugar, other agriculture
and animal products. Their main conclusion was in favor of trade liberalization.
Dogruel et al. (2003) used a CGE model to explore the feasible alternatives of
agricultural reform and links between “the public sector fiscal balances, accumulation
patterns, dynamic resource allocation, and consumer welfare under a medium-long-term
horizon”. The model consists of six sectors. Agriculture is modeled as an aggregate sector.
Land is not included in the model as a production factor.
The intention of the CGE model developed by Çırpıcı (2008), is to analyze water
management issues in Turkey. The model has 9 sectors, incorporating 4 factors of production.
Agriculture is not disaggregated. Water enters agricultural production as land and water
aggregate calibrated with a Leontief function. The Cobb-Douglas production function is used
in the non-agricultural production. The model lacks the regional and sectoral detail in
agricultural production.
Studies using CGE models to conduct agricultural policy analysis incorporate
agriculture as an aggregate sector both in production and consumption. Thus the policy
simulations can not take into account possible interactions within the agricultural sector. The
model used in this study namely, Turkish Agricultural Computable General Equilibrium
Model with Water (TACOGEM-W), incorporates enriched treatment of agricultural
production and consumption activities.
3.2. Model Structure
Turkish Agricultural Computable General Equilibrium Model with Water
(TACOGEM-W) is the first attempt that exclusively models Turkish agriculture both in
regional and sectoral details. The model utilizes the results of a farm level model developed
Paper presented at EconAnadolu 2009: Anadolu International Conference in Economics June 17-19, 2009, Eskişehir, Turkey.
13
for a micro region to estimate the shadow price of irrigation water. Hence, the rent created by
the low prices for irrigation water is included in the model, linking the micro and macro
aspects of irrigation water management.
TACOGEM-W is a Walrasian CGE model that includes the behavior of the three main
sectors in the Turkish economy: the production activities, the institutions, and the foreign
sector. In order to study the impact of a range of policy simulations, TACOGEM-W further
disaggregates the economy into 20 agricultural and 9 non-agricultural activities. Agricultural
activities are categorized by field crops, livestock, fishing and forestry (classified as ‘other
agriculture’). Non-agricultural activities include mining, consumer manufacturing, food
manufacturing, intermediates and capital goods, electricity and gas, water, construction,
private services and government services.
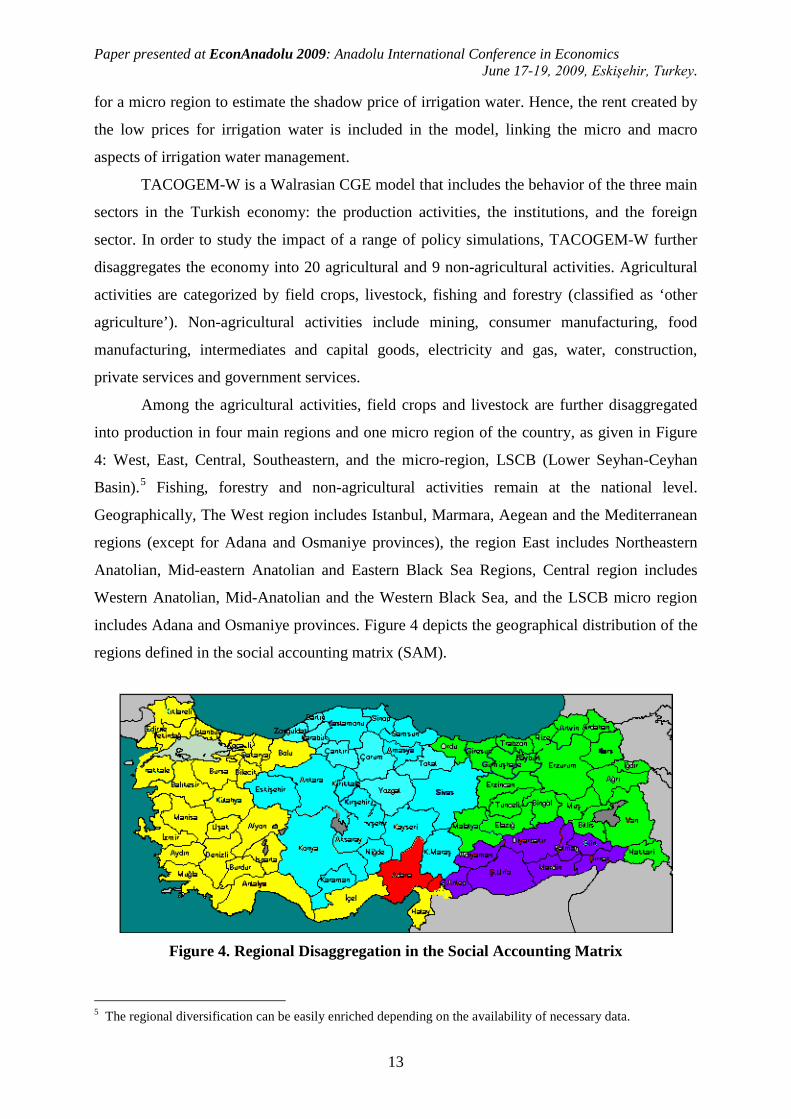
Among the agricultural activities, field crops and livestock are further disaggregated
into production in four main regions and one micro region of the country, as given in Figure
4: West, East, Central, Southeastern, and the micro-region, LSCB (Lower Seyhan-Ceyhan
Basin).5
Fishing, forestry and non-agricultural activities remain at the national level.
Geographically, The West region includes Istanbul, Marmara, Aegean and the Mediterranean
regions (except for Adana and Osmaniye provinces), the region East includes Northeastern
Anatolian, Mid-eastern Anatolian and Eastern Black Sea Regions, Central region includes
Western Anatolian, Mid-Anatolian and the Western Black Sea, and the LSCB micro region
includes Adana and Osmaniye provinces. Figure 4 depicts the geographical distribution of the
regions defined in the social accounting matrix (SAM).
Figure 4. Regional Disaggregation in the Social Accounting Matrix
5 The regional diversification can be easily enriched depending on the availability of necessary data.

Paper presented at EconAnadolu 2009: Anadolu International Conference in Economics June 17-19, 2009, Eskişehir, Turkey.
14
The institutions sector (or, block) of the economy includes households, the
government and the Water User Associations (WUA). Households are disaggregated into
rural and urban households. Rural households are further disaggregated among each other
according to their geographical location. Hence in TACOGEM-W, there are five rural
household and one urban household type (urban household defined at the national level).
Households earn income from factors of production (land, labor, capital), engage in
expenditures on various commodities, save, and also pay taxes to and receive transfers from
the government. The identification of rural household types links to the variation in resource
endowments common to agriculture.
The government collects tax revenue from numerous sources: production, sales,
households, and imports. The government uses these funds for purchases of goods and
services at the respective markets and makes transfers to households, and engages in public
savings.
Regional activities of field crops , in addition to land, labor and capital, use water as an
input in production. These activities also make payments to WUAs in their respective regions.
These water charges are income earned by the Water User Associations. In TACOGEM-W, it
is assumed that this water income collected in each region is simply transferred back to the
respective rural household in a lump-sum.
To construct the regionalized SAM for the year 2003, we combine various data from
2003 Agricultural Structure-Production, Price, Value Statistics (TurkSTAT, 2003); Telli
(2004); 1998 Input Output Structure of the Turkish Economy (TurkSTAT, 2004); 2003
foreign trade statistics by Undersecretariat of Foreign Trade (UFT Website); TurkSTAT 2002
Household consumption expenditures and income survey statistics (TurkSTAT Website),
ARIP Quantitative Household Survey (QHS) commissioned by the Treasury and implemented
by the G.G. Consulting et al. (conducted in 2002 and 2004), and the Turkish SAM for 2001
developed by GTAP. This regionalized SAM includes information on the regional level
employment of labor and capital as well as intermediate input use by crop, along with water
charge and irrigated versus rainfed land rents by crop. Employment of capital, labor and data
on intermediate input use are also entered for activities at the national level in the SAM.
Detailed income, consumption and saving information for the five-types of households
(urban, and four rural) are included in the institutions block of the SAM. Also included in the
institutions block are the data on government consumption, net tax receipts, and public
savings, along with the WUAs’ accounts. Finally, import, export and tariff data concerning
the EU-25 and the rest of the world constitute the foreign sector block of the SAM (the
Paper presented at EconAnadolu 2009: Anadolu International Conference in Economics June 17-19, 2009, Eskişehir, Turkey.
15
foreign trade partners to Turkey are the 25 European Union countries and the rest of the
world). These detailed data are used to obtain the parameters for TACOGEM-W.
The algebraic structure of TACOGEM-W is based on the CGE model developed by Lofgren,
et al. (2002). The entire sequence of mathematical equations that define TACOGEM-W and
the main characteristics of the model is provided in Cakmak et al.(2008). A farm model is
used to estimate the shadow value of water in agricultural production. The algebraic details
of the farm model is also available in Cakmak et al. (2008).
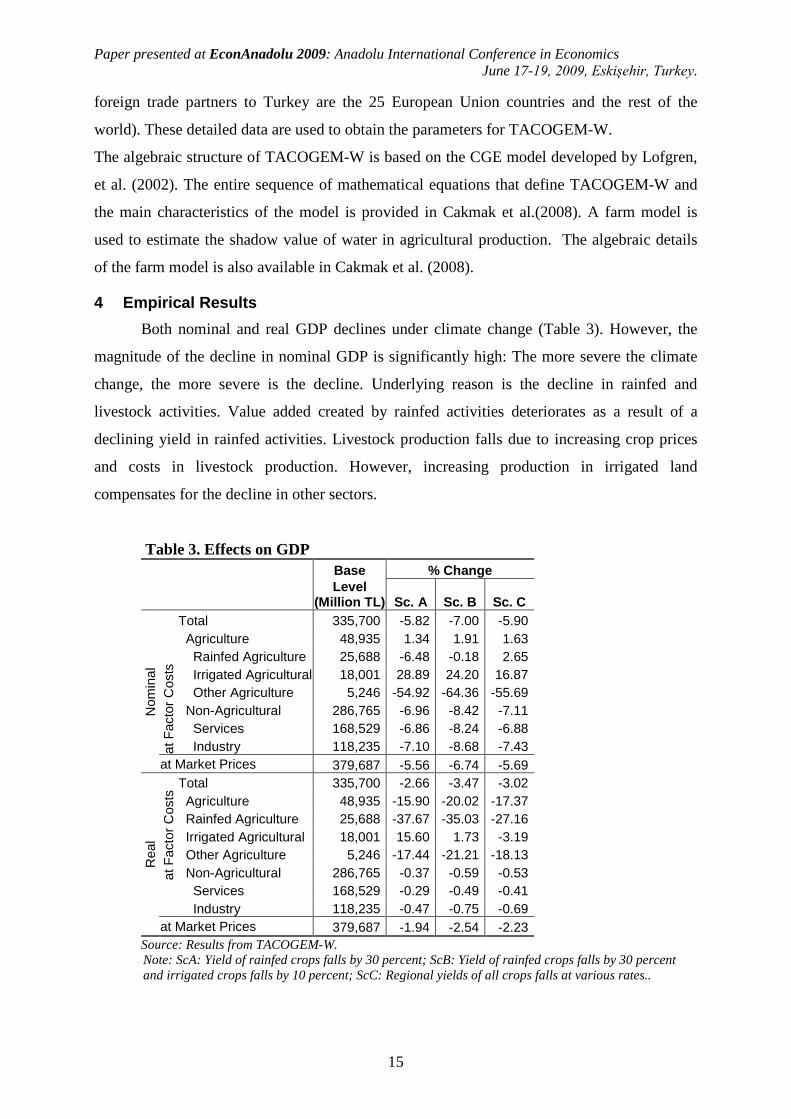
4 Empirical Results Both nominal and real GDP declines under climate change (Table 3). However, the
magnitude of the decline in nominal GDP is significantly high: The more severe the climate
change, the more severe is the decline. Underlying reason is the decline in rainfed and
livestock activities. Value added created by rainfed activities deteriorates as a result of a
declining yield in rainfed activities. Livestock production falls due to increasing crop prices
and costs in livestock production. However, increasing production in irrigated land
compensates for the decline in other sectors.
Table 3. Effects on GDP Base % Change
Level
(Million TL) Sc. A Sc. B Sc. C
Nom
inal
at
Fac
tor C
osts
Total 335,700 -5.82 -7.00 -5.90 Agriculture 48,935 1.34 1.91 1.63 Rainfed Agriculture 25,688 -6.48 -0.18 2.65 Irrigated Agricultural 18,001 28.89 24.20 16.87 Other Agriculture 5,246 -54.92 -64.36 -55.69 Non-Agricultural 286,765 -6.96 -8.42 -7.11 Services 168,529 -6.86 -8.24 -6.88 Industry 118,235 -7.10 -8.68 -7.43
at Market Prices 379,687 -5.56 -6.74 -5.69
Rea
l at
Fac
tor C
osts
Total 335,700 -2.66 -3.47 -3.02 Agriculture 48,935 -15.90 -20.02 -17.37 Rainfed Agriculture 25,688 -37.67 -35.03 -27.16 Irrigated Agricultural 18,001 15.60 1.73 -3.19 Other Agriculture 5,246 -17.44 -21.21 -18.13 Non-Agricultural 286,765 -0.37 -0.59 -0.53
Services 168,529 -0.29 -0.49 -0.41 Industry 118,235 -0.47 -0.75 -0.69 at Market Prices 379,687 -1.94 -2.54 -2.23
Source: Results from TACOGEM-W. Note: ScA: Yield of rainfed crops falls by 30 percent; ScB: Yield of rainfed crops falls by 30 percent and irrigated crops falls by 10 percent; ScC: Regional yields of all crops falls at various rates..

Paper presented at EconAnadolu 2009: Anadolu International Conference in Economics June 17-19, 2009, Eskişehir, Turkey.
16
Although value added created by agriculture increases in all scenarios in nominal
terms, real agricultural value added declines. This implies, that in all three cases the effects
working on increasing domestic price dominates the effects working on the cost of
production. Sectoral value added is highly sensitive to the shock given in the climate change
scenario when compared with the impact of other scenarios.
The increase in the value added of agricultural sector is mainly due to the increase in
production in irrigated activities. The decline in the nominal value added of other agricultural
activities may reach 64 percent. Industrial activities also experience a decline of
approximately 7 to 9 percent. A change in the non-agricultural value added is also higher. The
changes in the real value added are milder.
The comparison of changes in nominal and real GDP and the sectoral value added
show that an important account of GDP change is due to adjustment in prices. In real terms,
effects are milder, and in the opposite direction.
For demand side macro variables we can conclude similar results. The changes are
significant in all three cases. Increase in manufacturing goods consumption cannot
compensate the decline in agricultural consumption, and total consumption falls (Table 4).
Table 4. Macroeconomic results of simulations
Base % Change Levela Sc. A Sc. B Sc. C
Absorption 384,423 -1.9 -2.5 -2.2 Household Consumption 245,161 -1.8 -2.4 -2.1 Investment 75,017 -3.8 -5.1 -4.5 Export 98,447 -2.1 -2.6 -2.4 Import 103,184 -2.0 -2.4 -2.2 PPP Real FX Rate 100 -4.2 -5.0 -4.2 Nominal FX Rate 100 -5.9 -7.1 -6.0 Domestic Price Index 100 -1.8 -2.2 -1.9 Source: Results from TACOGEM-W. Notes: a Million TL for GDP accounts.See text and Table 3 for the description of the scenarios.
Under Scenario A, we first notice that overall production volume in irrigated crops
such as vegetables, other grains (rice, etc.), wheat, oil seeds, fruits, and other crops category
rise at varying rates. The highest increase is seen in the other grains category by 34 percent,
followed by vegetables with 30 percent. Irrigated wheat activity, on the other hand, increases
by 9.63 percent overall. We must mention that the crops named above are modeled as
growing on both irrigated and rainfed land. While we observe production volume increases in
crops which have activity in both irrigated and rainfed land, the production quantity in crops

Paper presented at EconAnadolu 2009: Anadolu International Conference in Economics June 17-19, 2009, Eskişehir, Turkey.
17
such as cotton (raw), sugar beet and potatoes, which are only grown on irrigated land, all
decrease significantly (Table 5).
Table 5. Change in production of irrigated activities Base % Change
Level (Tons) Sc. A Sc. B Sc. C
Wheat 7,877 9.63 -4.41 -8.07 Maize 1,355 -1.81 -14.89 -16.02 Other grains 304 33.63 17.10 7.02
Sugar beet 12,622 -8.84 -13.71 -13.76
Cotton (raw) 2,295 -15.99 -23.52 -14.34 Oil seeds 976 19.76 5.11 -5.16 Potatoes 5,300 -5.54 -7.74 -7.90 Vegetables 9,827 29.77 14.50 6.66 Fruits 6,562 13.56 1.60 -3.56 Other crops 1,203 35.19 18.69 8.59 Source: Results from TACOGEM-W. Note:.See text and Table 3 for the description of the scenarios. As a result of the fall in the yields of crops on rainfed land, and as production shifts to
irrigated land, the shadow value of irrigation water is expected to rise due to increased
competition for water. Particularly, the shadow value (or price) of irrigation water in the
Central region increases by 27 percent, in the East region by 26 percent, in the LSCB region
by 10.46 percent, and in the Southeast region by a moderate 3.34 percent (Table 6).
Table 6. Change in factor prices
Region
Base % Change Level (TRY) Sc. A Sc. B Sc. C
Labora 1.00 -6.21 -7.13 -5.90
Irrigated Land
West 0.64 20.20 15.04 17.19 Central 0.26 21.06 15.43 0.48 East 0.27 22.06 16.76 7.65 Southeast 0.53 13.53 8.67 -3.07 LSCB 0.70 19.79 14.12 10.74
Rainfed Land
West 0.27 -3.63 2.21 11.24 Central 0.11 0.28 5.69 -0.01 East 0.11 -1.04 3.95 5.89 Southeast 0.23 3.79 8.20 2.17 LSCB 0.14 -3.74 3.49 21.86
Water
West 0.13 21.82 15.88 18.85 Central 0.11 27.14 21.65 0.48 East 0.05 26.09 20.83 9.60 Southeast 0.09 3.34 -1.35 -13.82 LSCB 0.13 10.46 5.54 2.25 Urban 0.81 -7.31 -9.27 -7.88
Source: Results from TACOGEM-W. Notes: a Labor employment is taken as value added created by labor. See text and Table 3 for the
description of the scenarios.

Paper presented at EconAnadolu 2009: Anadolu International Conference in Economics June 17-19, 2009, Eskişehir, Turkey.
18
Central Region has the highest share in total production of wheat. About 40 percent of
total agricultural land is devoted to wheat activity in the Central Region. Part of the wheat is
produced on irrigable land. In that sense, recognizing the significance of wheat production in
the Central region, one can expect to observe a relatively high increase in irrigation water
shadow prices in this region.
Employment of irrigated land increases for some cereals, vegetables and fruits, and
crops classified as other grains such as rice. This is due to the shift from rainfed land in these
activities towards irrigated land as an alternative. Employment of irrigated land in sugar beet,
cotton, potatoes and maize production fall at different rates. We mentioned sugar beet, cotton
and potatoes are grown only on irrigated land. As production of all crops shifts from rainfed
land to irrigated land due to the yield shock in rainfed activity, the price of irrigated land
increases in all regions at rates ranging from 13 to 30 percent. With this increase in the price
of irrigated land, a drop in employment in irrigated-land-only activities can be expected.
As can be inferred from the discussion above, production volume in all rainfed crop
activities drop at various rates. For example, production of fruits in rainfed land drops by 39
percent, while production of oil seeds drop by 36 percent from the base as a result of the 30
percent drop in yield. Overall, considering the sum of both irrigated and rainfed land
production activity, we observe a fall in volume of production in all crops. Moreover,
production in livestock and national non-agricultural activities also declines.
For example, food manufacturing contracts by 13 percent as there is a reduction in
production of intermediate goods in this sector. As a result of the contraction in domestic
production, import volume in almost all crops increases except for raw cotton, which
experiences a fall in production and a rise in domestic prices. The most significant increase in
import volume is seen in other grains with 65 percent as well as an increase in nuts by 45
percent. It is also important to note that manufactured food imports rise by 85 percent in
volume. Export volume, on the other hand, decreases significantly following the fall in
production in agriculture and an increase in domestic commodity prices.
We must also note that urban household’s real consumption decreases by about 3.3
percent, while that of rural households in all regions increases by 4 percent except in the East
with a 1.6 percent increase (Table 7). We can attribute this disparity in rural and urban
household response to differences in sources of income of these household types, and also the
composition of consumption expenditures. Urban households earn about 40 percent of the
total income due to labor, and the rest from capital, while rural households have income from

Paper presented at EconAnadolu 2009: Anadolu International Conference in Economics June 17-19, 2009, Eskişehir, Turkey.
19
land and water resources as well. While there is a clear drop in labor and capital income
overall, there is a rise in rents to both irrigated and rainfed land, and a slight increase in the
water factor income in the West and Central regions (which inhabit a large share of rural
households). Nevertheless, there is a significant decline in real GDP by about 6 percent as a
result of the fall in yields in rainfed crops by 30 percent simulating a shortage of water caused
by climate change.
Table 7. Change in disaggregated real household consumption Base % Change
Level
(Mil. TRY) Sc. A Sc. B Sc. C
Urban HH 192,526 -3.30 -4.00 -3.50 West Rural 28,136 4.10 4.50 5.80 Central Rural 11,422 3.70 3.90 -0.30 East Rural 8,662 1.60 1.50 0.60 Southeast Rural 2,450 2.40 2.00 -3.90 LSCB Rural 1,965 3.90 2.90 2.50 Rural Total 52,635 15.70 14.80 4.70 Turkey 245,161 -1.80 -2.40 -2.10 Source: Results from TACOGEM-W.
Considering Scenario B, in which the crop yield in irrigated activities are reduced by
10 percent, in addition to the 30 percent reduction in rainfed activities, the changes in the
production volume of irrigated crops are much less pronounced than those in Scenario A. For
example, production quantity in wheat declines by 20 percent compared to 16 percent. An
increase in irrigated fruit activity becomes insignificant. We further notice that the response in
cotton (raw), sugar beet and potatoes production volume is stronger than that in the previous
scenario: there is an additional 10 to 15 percentage point decline in the production of these
crops. In this scenario, the changes in the water shadow price and irrigated land price are not
as high as those in the former scenario. This is because there is not as much competition for
these inputs as before, simply due to the fall in yields and the pursuing fall in production
volumes. In all crops, a change in water consumption from the base is smaller than that in
the first scenario. As in the first scenario, the import volume of all crops increases and the
export volume decreases following a rise in commodity prices, however these changes occur
at higher magnitudes. The fall in real GDP is also higher by 3.5 percent.
5 Conclusions, policy implications and future research agenda This study investigated the economy-wide effects of climate change which is
introduced as an external shock. It is recognized that because of spatial heterogeneity of the
Paper presented at EconAnadolu 2009: Anadolu International Conference in Economics June 17-19, 2009, Eskişehir, Turkey.
20
climate, the simulated scenarios have differential impact on the agricultural production and
hence on the allocation of factors of production including water.
The effects on major macroeconomic indicators under the climate change simulations
are significant. Nominal GDP declines drastically, but the real impact is limited. This
situation points out the importance of the climate change in the performance of the overall
economy. It is obvious that the impact of the climate change will not be confined only to the
agricultural sector. Through the interactions with the rest of the economy, the negative impact
of the climate change will be amplified. Irrigation is considered the most important adaptation
measure to ease the negative impact of climate change, especially on farmers’ income.
Warming is also expected to affect the availability of water resources. This aspect of the
climate change is not incorporated in these simulations. Hence, the climate change adaptation
policies incorporating water and land management should be given priority.
Turkey has been fortunate in its endowment of water resources. However, the demand
of water is growing rapidly. The pressure on usable water resources is predicted to increase
with the rapid pace of industrialization and urbanization. Scarcity of water in some regions
has already started to hamper agricultural production. Over-abstraction of groundwater in the
Central Region and over-use of surface water in the West have affected not only the
availability of water, but also degraded its quality with serious environmental impact. The
response of the governments so far has been focused on building additional infrastructure to
release the constraints on water availability. Shifting the irrigation pricing method to promote
efficient use of water has never been considered as an alternative to the current pricing
method which consists of a per area based operation and maintenance charge. Seven river
basins (out of 26), mostly in the West, are already in a serious state of water shortage, with
abstractions exceeding 200 percent of the annual renewable resource (World Bank, 2007). If
all of the 8.5 million hectares of the “economically irrigable” area is developed, the World
Bank (2007) found that almost 18 basins will face serious water shortages. This situation
raises serious doubts about the sustainability of the prevailing policies in the irrigation sector.
The results of the simulations further prove deficiency in the currently implemented
approach of supply management and the pricing policy in the irrigation sector. The pressure
on irrigation water augments in all scenarios. The results of all simulations indicate that the
shadow prices for irrigation water increase in all regions, except in the Southeast Region that
has a higher impact case in the climate change scenario. Hence, it is necessary to achieve
more efficient use of irrigation water which requires not only the promotion of water saving

Paper presented at EconAnadolu 2009: Anadolu International Conference in Economics June 17-19, 2009, Eskişehir, Turkey.
21
irrigation techniques, but serious consideration should be given to fit the demand for water to
meet the supply.
Water stress in Turkey is predicted to increase with the demographic changes and
unfavorable global climatic and economic conditions. Fast implementation of the necessary
policy measures at all levels will achieve more efficient use of public resources and water.
The project stock in the irrigation sector remains to be large compared to the allocated
financial resources (SPO, 2008). Priority should be given better use of existing water
infrastructure and proper ranking of the unfinished projects. The first one requires
improvement in irrigation management practices. More resources can be allocated to restrict
water losses from irrigation infrastructure starting from the high evaporation regions. There
have been improvements in adopting more efficient water application technologies induced by
government subsidies. The uptake of these technologies by irrigators can be further increased
by shifting towards volumetric pricing practices. SPO (2008) points out the importance of
increasing the efficiency in the use of irrigation water by the determination of irrigation fees
proportional to the actual amount used.
Although the results of the model simulations are rich, it is possible to further improve
the model structure. The priority should be given to incorporate the heterogeneous labor
structure in the model. The regions can be further disaggregated to NUTS-I level. Further
disaggregation of food manufacturing and other agriculture related industries, such as textiles,
are necessary to ameliorate the inter-sectoral interactions. Sooner or later Turkey may be
tempted by the biofuels frenzy, hence making it necessary to have a detailed energy sector.
One valuable extension can be separating rural and urban households according to income
groups. This would allow analysis of welfare distribution that the model currently lacks.
Structural enhancements will improve the performance of the model, i.e. nested structure in
production, especially for irrigated land and water. Another enhancement could be
transforming the model into a recursive dynamic one that provides the adjustment paths for
external and policy shocks.

Paper presented at EconAnadolu 2009: Anadolu International Conference in Economics June 17-19, 2009, Eskişehir, Turkey.
22
References
Berrittella, M., Rehdanz, K., Tol, S.J.R., 2006, The Economic Impact of the South-North Water Transfer Project in China: A Computable General Equilibrium Analysis, NOTA DI LAVORO 154.2006: Fondazione Eni Enrico Mattei
Briand, A., 2004, “Comparative Water Pricing Analysis: Duality Formal-Informal in a CGE Model for Senegal”. Paper presented in the Conference Input-output and General Equilibrium: Data, Modeling and Policy Analysis. Brussels, 2-4 September 2004.
Cakmak, E. H., Yeldan E., Zaim, O., 1996, “The Rural Economy Under Structural Adjustment and Financial Liberalization: Results of a Macro-Integrated Agricultural Sector Model for Turkey,” Revue Canadienne d’Etudes du Development (Canadian Journal of Development Studies), Vol. XVII, No. 3, pp. 427-47.
Cakmak, E. H., Dudu, H., Saracoglu, D. S., Diao, X., Roe, T. L., Tsur, Y., 2008, Macro-Micro Feedback Links of Irrigation Water Management in Turkey, World Bank Policy Research Working Paper Series No: 4781, http://www-wds.worldbank.org/external/default/WDSContentServer/IW3P/IB/2008/11/18/000158349_20081118114025/Rendered/PDF/WPS4781.pdf.
Cırpıcı, Y.A., 2008, Economy-wide Analysis of Water Resource Management: A CGE Model for Turkey, METU, unpublished Ph.D. dissertation.
Diao, X., Roe, T., Doukkali, R., 2005, Economy-wide Gains from Decentralized Water Allocation in a Spatially Heterogeneous Agricultural Economy, Environment and Development Economics 10: 249–269
Diao, X., Yeldan E., 2001, An intertemporal, multi-region general equilibrium model of agricultural trade liberalization in the South Mediterranean NIC's, Turkey, and the European Union. In: J. VON HAGEN and M. WIDGREN (eds.), Regionalism in Europe, Geometries and Strategies After 2000. Massachusetts: Kluwer Academic Publishers, pp.195-220.
Diao, X., Dinar, A., Roe, T., Tsur, Y., 2008, A General Equilibrium Analysis of Conjunctive Ground and Surface Water Use with an Application to Morocco, Journal of Agricultural Economics, (forthcoming)
Dogruel, F., Dogruel S.A., Yeldan, E., 2003, Macroeconomics of Turkey’s agricultural reforms: an inter-temporal computable general equilibrium analysis, Journal of Policy Modeling, 25: 617–637
DSI (General Directorate of State Hydraulic Works), 2008a, Annual Activity Report of the General Directorate of State Hydraulic Works: 2007, Ankara: DSI.
DSI, 2008b, Irrigation Development and Land Reclamation by the General Directorate of State Hydraulic Works: 2007-2008, Ankara: DSI.
DSI, 2007, Annual Activity Report of the General Directorate of State Hydraulic Works: 2006, Ankara: DSI.
Fuhrer, J., 2003, Agroecosystem responses to combinations of elevated CO2, ozone, and global climate change, Agriculture, Ecosystems and Environment, 97: 1-20.
G&G Consulting, Başkent Unv. Development Foundation, TNS Siar JV (2003) Agricultural Reform Implementation Project Quantitative Household Survey Final Report

Paper presented at EconAnadolu 2009: Anadolu International Conference in Economics June 17-19, 2009, Eskişehir, Turkey.
23
G&G Consulting, Başkent Unv. Development Foundation, TNS Siar JV (2005) Agricultural Reform Implementation Project Quantitative Household Survey Final Report
Goodman, D. J., 2000, More reservoirs or transfers? A Computable General Equilibrium Analysis of Projected Water Shortages in the Arkansas River Basin, Journal of Agricultural and Resource Economics, 25(2):698-713.
Harrison, G.W., Rutherford, T.F., Tarr, D.G., 1993, Piecemeal Trade Reform in the Partially Liberalized Economy of Turkey, The World Bank Economic Review, 7:191-217
Harrison, G.W., Rutherford, T.F., Tarr, D.G., 1996, Economic Implications for Turkey of a Customs Union with the European Union, The World Bank International Economics Department International Trade Division, Policy Research Working Paper No: 1599.
Kanber, R., Ünlü, M., Cakmak, E. H. and Tüzün, M., 2005, “Irrigation Systems Performance: Turkey”, in N. Lamaddalena, F. Lebdi, M. Todorovic, C. Bogliotti (eds.) Irrigation systems performance, Options Méditerranéennes : Série B. Etudes et Recherches No. 52, Bari:CIHEAM-IAMB.
Kohn, R.E., 2003, Israel’s Need to Import Freshwater, Water Air and Soil Pollution, 143: 257–270
Letsoalo, A., Blignaut, J., de Wet, T., de Wit, M., Hess, S., Tol, R.S.J., van Heerden, J., 2005, Triple Dividends of Water Consumption Charges in South Africa, Water Resources Research
Lofgren, H., Harris, R.L, Robinson, S., 2002, A Standard Computable General Equilibrium (CGE) model in GAMS. IFPRI; Wahington, D.C.
Peterson, D., Dwyer, G., Appels, D., Fry, J.M., 2004, Modeling Water Trade in the Southern Murray-Darling Basin. Staff Working Paper. Melbourne: Productivity Commission
Roe, T., Dinar, A., Tsur, Y., Diao, X., 2005, Feedback Links Between Economy-wide and Farm Level Policies: Application to Irrigation Water management in Morocco. World Bank Policy Research Working Paper 3550
Seung, C. K., Harris, T. R., Englin, J. E., Noelwah, R. N., 2000, Impacts of Water Reallocation: A Combined Computable General Equilibrium And Recreation Demand Model Approach, The Annals of Regional Science, 34:473-487.
Smajgl, A., Morris, S., Heckbert, S., 2005, Water Policy Impact Assessment – Combining Modeling Techniques in the Great Barrier Reef Region, In Zerger, A. and Argent, R.M. (eds) MODSIM 2005 International Congress on Modeling and Simulation. Modeling and Simulation Society of Australia and New Zealand, December 2005, pp. 1985-1991
State Planning Organization (SPO) Website: www.spo.gov.tr acceesed on 2/03/2008
SPO, 2008, Annual Programme, 2008, 9th. Development Programme (2007-2013), Ankara:SPO.
SPO, 2007, Land and Water Resources Utilization and Management, SPO Special Expertise Commission Report, Ankara:SPO.
Telli, Ç., 2004, Sosyal Hesaplar Matrisi Üretme Yöntemi ile Türkiye Uygulaması, Manuscript, State Planning Organization, Ankara.

Paper presented at EconAnadolu 2009: Anadolu International Conference in Economics June 17-19, 2009, Eskişehir, Turkey.
24
Tirado, D., Gómez C.M., Lozano, J., 2006, Efficiency Improvements and Water Policy in The Balearic Islands: A General Equilibrium Approach, Investigaciones Económicas, XXX (3):441-463
Turkish State Meteorological Service Website, www.meteor.gov.tr, acceesed on 20/07/2008
TurkSTAT (Turkish Statistical Institute), 2008, National Account Statistics, http://www.tuik.gov.tr/VeriBilgi.do?tb_id=55&ust_id=16, acceesed on 05/05/2008
TurkSTAT, Website. www.tuik.gov.tr, accessed on 01/02/2008
TurkSTAT, 2004, The Input-output Structure of the Turkish Economy, 1998. TurkSTAT, Printing Division, Ankara.
TurkSTAT, 2003, Agricultural Structure-Production, Price, and Value Statistics-2003, TurkSTAT, Printing Division, Ankara.
Türkeş, M., 1996, Spatial and temporal analysis of annual rainfall variations in Turkey, International Journal of Climatology, 16(9): 1057-1076.
Undersecretariat of Foreign Trade Website: www.dtm.gov.tr accessed on 20/11/2008
Watson, R.T., Zinyowera, M.C., Moss, R.H, Dokken, D.J., 1997, The Regional impacts of climate change: an assessment of vulnerability. IPCC Special Report.
World Bank, 2007, Turkey: Water and Irrigation & Drainage Sectors Towards Long-Term Suatainability (draft), Sustainable Development Department, June, manuscript.
Yeldan, E., 1997, Financial Liberalization and Fiscal Repression in Turkey: Policy Analysis in a CGE Model With Financial Markets, Journal of Policy Modeling 19(1):79-117
Yano, T., Aydın, M., Haraguchi, T., 2007, Impact of climate change on irrigation demand and crop growth in a Mediterranean environment of Turkey, Sensors, 7: 2297-2315.