
Precision Clock Synchronization Protocol - NIST Technical ...
Upload
khangminh22Category
view
1download
0
POWER AND CGE (CLOCK GATE EFFICIENCY) ANALYSIS USING
POWERARTIST TOOL
A Project
Presented to the faculty of the Department of Electrical and Electronic Engineering
California State University, Sacramento
Submitted in partial satisfaction ofthe requirements for the degree of
MASTER OF SCIENCE
in
Electrical and Electronic Engineering
by
Prachi Dagli
SPRING
2016

ii
© 2016
Prachi Dagli
ALL RIGHTS RESERVED

iii
POWER AND CGE (CLOCK GATE EFFICIENCY) ANALYSIS USING
POWERARTIST TOOL
A Project
by
Prachi Dagli
Approved by:
__________________________________, Committee ChairDr. Fethi Belkhouche
__________________________________, Second ReaderDr. Preetham B. Kumar
____________________________Date

iv
Student: Prachi Dagli
I certify that this student has met the requirements for format contained in the University
format manual, and that this project is suitable for shelving in the Library and credit is to
be awarded for the project.
__________________________, Graduate Coordinator ___________________Dr. Preetham B. Kumar Date
Department of Electrical and Electronic Engineering

v
Abstract
of
POWER AND CGE (CLOCK GATE EFFICIENCY) ANALYSIS USING
POWERARTIST TOOL
by
Prachi Dagli
In recent years, chip design has increased in speed and complexity, which resulted in a
significant increase in the power consumption of very-large-scale-integration (VLSI)
chips. Therefore, it is required to accurately measure and effectively reduce the power
consumption of the design. This project shows the automation of the PowerArtist tool,
which is used for early RTL (Register Transfer Level) power and Clock Gate Efficiency
(CGE) estimation.
The PowerArtist tool is widely used across semi-conductor industries, it provides precise
power analysis and suggestions in order to make the design more power friendly while
meeting all required functional specifications.
_______________________, Committee ChairDr. Fethi Belkhouche
_______________________Date

vi
TABLE OF CONTENTS
Page
List of figures…………………………………………………………………………....viii
Chapter
1. Introduction..................................................................................................................... 1
2. POWERARTIST DESIGN FLOW................................................................................. 4
3. PowerArtist RUN............................................................................................................ 9
Input Description............................................................................................................................ 9
4. FLOW OF POWERARTIST RUN............................................................................... 11
Scripts ..............................................................................................................................................13
Description of “run.tcl” script ..................................................................................................13
Flow of “run.tcl” script...............................................................................................................14
Description of “reduction_analysis.tcl”.................................................................................16
Flow of “reduction_analysis.tcl”.............................................................................. 17
5. RESULTS ..................................................................................................................... 20
Reports ............................................................................................................................................20
Logs..................................................................................................................................................32
6. POWER REDUCTION ANALYSIS............................................................................ 34

vii
7. CONCLUSION............................................................................................................. 38
References......................................................................................................................... 39
LIST OF FIGURES

viii
Figures Page
1. Clock gating technique ................................................................................................. 2
2. PowerArtist design flow ............................................................................................... 4
3. Flow diagram of run.tcl............................................................................................... 11
4. Flow diagram of reduction analysis............................................................................ 12
5. Clock gating summary report top ............................................................................... 21
6. Clock gating summary report bottom ......................................................................... 22
7. Power report................................................................................................................ 24
8. DACGE report ............................................................................................................ 26
9. PWC gated flops report............................................................................................... 28
10. One Level Power Report............................................................................................. 30
11. PowerCanvas............................................................................................................... 34
12. Power reduction drop down menu .............................................................................. 35

1
1. INTRODUCTION
Significant increase in the power consumption of very-large-scale
integration (VLSI) chips has been observed as a result of the increasing speed and
complexity in chip design. To meet this challenge, researchers have developed different
design techniques to reduce power [1]. The complexity of today’s ICs, with over 100
million transistors, clocked at over 1 GHz, means manual power optimization would be
hopelessly slow and prone to errors. Therefore, computer-aided design (CAD) tools and
methodologies are crucial to address the issue.
The CMOS dynamic power consumption is given by,
P = ACV? fwhere, P is the power consumed,
A is the activity factor, i.e., the fraction of the circuit that is switching,
C is the switched capacitance,
V is the supply voltage,
f is the clock frequency
Based on equation (1), it is evident that in CMOS VLSI circuits, the clock plays a crucial
role in determining the dynamic power as it has the activity factor of ‘1’ [2]. In this
project, we mainly focus on reducing the activity factor to reduce power. The best way to
reduce the activity is to turn off the clock to registers in unused blocks as clocks are the
components that consume the highest power in a CMOS circuit [8].

2
We can turn off the clock of unused blocks by various clock-gating techniques.
An illustration is shown in figure1 [3] where the enable signal is ended with a clock so
the clock will be on only when the enable signal is 1, otherwise the clock is off. By
implementing this technique, we can reduce the activity factor and thereby reduce the
power consumption of the circuit.
Figure 1: Clock gating technique
The power consumption and clock-gating efficiency (CGE) estimation is a very
important aspect of modern digital circuit design [7]. The clock gate efficiency (CGE) of
a circuit is measured by the ratio of the number of clocks when digital circuit remains idle
and the total number of clocks in a simulation window. Obviously, higher clock gating
efficiency (CGE) corresponds to smaller dynamic power consumption.
There are various tools in the market that measure the clock gating efficiency (CGE) and
perform power estimation of digital circuits comprising multi-billion gates. The
PowerArtist from Apache is one of the most widely used tools for this purpose. Various
3
semi-conductor companies like Intel, AMD, Avago, Apple have used this tool for power
estimation in their designs. This tool also provides the clock gating efficiency (CGE) of
RTL design along with calculating dynamic power. It also gives suggestions on RTL
design change to improve CGE/power consumption. In this project, we illustrate how this
tool is used and how the tool flows are automated through Tcl/Perl scripting [6].

4
2. POWERARTIST DESIGN FLOW
The PowerArtist tool has a complete RTL Design-For-Power (DFP™) environment with
fully integrated advanced analysis and automatic power reduction techniques. The
following diagram in figure 2 illustrates the PowerArtist design flow [4].
Figure 2 : PowerArtist design flow
Integration with System Level Tools for Power Trade -offs
Power Analysis and Debug Automatic Power Reduction SOC Power Technique
Exploration:Power Gating, Voltage
RTL Vector Selection for Power Integrity
RTL Vector-Driven Gate Power Sign-off
Power Regressions
GDSII
Physical Design
Logic Synthesis
RTL DESIGN
ESL DESIGN

5
Power Artist Design Flow Description:
A. ESL (Electronic System Level) Design phase:
The ESL design stands for Electronic System Level design. Each of the building
blocks of RTL can be represented as an ESL at higher level. For each building block
also known as design FUB (functional block), there exist requirements related to
power. Depending upon these requirements, various constraints are provided to the
PowerArtist tool based on which the power is estimated.
Integration with System-Level Tools for Power Trade-offs:
Some design components are performance centered and power can be
compromised in order to achieve higher throughput/bandwidth numbers and
hence the PowerArtist tool needs to be provided with some
constraints/relaxations based on which power would be traded-off for such
building blocks.
During this step (which is really the pre-power flow run phase), for each of
the design FUBs, the constraints are provided to the PowerArtist tool. When
the actual power flows are executed, based on the specified constraints, the
PowerArtist tool will determine the expected power consumption and check
if the actual design meets the expected numbers.

6
B. RTL Design phase:
In this phase, the PowerArtist tool is executed on actual RTL and the power reports
are generated. The PowerArtist tool is designed to do a first level analysis of these
reports and suggest any possible modifications in the design to reduce the power
consumption. The tool also applies other power reduction techniques and runs power
regressions to help aid the power saving. Below is a brief description of all the steps
that are present in this phase.
Power Analysis and Debug:
During this phase, the PowerArtist tool is run on actual RTL design and
power consumption and clock-gate efficiency are analyzed and debugged.
The PowerArtist tool is automated to debug and figure out possible RTL
coding issues if the actual power numbers do not match with the expected
ones.
Automatic Power Reduction
The PowerArtist tool also suggests possible RTL fixes, and re-run the flow
after applying those fixes and generate new power numbers to reduce power
automatically.

7
SOC Power Technique Exploration
The PowerArtist tool also applies various system on chip (SOC) power
reduction techniques like power clock-gating, voltage islands to see if any
further power optimizations are possible at the system on chip (SOC) level.
Power Regressions
The PowerArtist tool does not rely on single test run result, but it rather runs
various power regressions on the test-suite identified by the user and measure
power across these runs. It is possible to see power deviation across different
runs. The tool compares all these results and come up with the optimal RTL
design in which power numbers are as close to the expected numbers as
possible.
C. Logic Design, Physical Design, GDSII:
As part of the power measurement flow, the PowerArtist tool needs to generate gate-
level netlist from the given RTL design to be able to estimate accurate power
numbers. The tool also comprehends the wire delay model and estimates RC wire
delay associated with the design. This is mainly done in two phases as described
below.

8
RTL Vector Selection for Power Integrity:
For more accurate power measurement, power flow needs to be run on a gate
level netlist. To achieve this, the logic design is first converted into gate level
design by in-built logic synthesizer tool. The RC wire model delays and
clock-tree synthesis is also getting accounted for and the design is finally
converted into actual cell level physical design on which detailed power
analysis is being performed.
RTL Vector-Driven Gate Power sign-off & Regressions:
On the final cell level physical design, power flows are being run and power
numbers and clock-gate efficiency numbers are getting derived. The power is
measured at various gate levels depending upon the fan-in and fan-out of the
gate. If some portion of the design is found to be consuming more power
than it should, it’s reported to the design engineers.
This exercise is performed multiple times on various test-suites to derive
more accurate results based on regression runs.

9
3. POWERARTIST RUN
Input Description
The PowerArtist is a generic tool. It is used by graphics, media and display groups. Each
group has different designs where power and clock gate efficiency (CGE) analysis needs
to be performed on each design. We developed a generic configuration file which is used
as an input to the tool for any design. To run the PowerArtist, the user needs to create a
configuration file. It should contain all the needed input parameters to run PowerArtist.
This file should be written in TCL (Tool Command Language) format and should be
named “cfg.tcl” [5].
Display, media and graphics groups at Intel have different designs and each design has a
unique unit name, test name and rtl model. The “cfg.tcl” contains unit name and pointer
to rtl model. The rtl model has all the design modules that are written in Verilog or
System Verilog language. The “cfg.tcl” contains power state name as well. The power
state might be idle or active. The “cfg.tcl” also contains pointer to fsdb file and instance
name. The fsdb file has the details of all signal activity which is a very important input
parameter because without the signal activity information we cannot calculate accurate
clock gate efficiency.
The user also needs to define flow control variables in the “cfg.tcl”. These variables
control the flow of the PowerArtist run. Whichever variable is set to “1”, only that part of
the flow will be run by the tool. The “cfg.tcl” contains flow control variables like

10
generate VC (verilog components file), elaboration, reduction power analysis, average
power analysis and upload report to MDP. By setting elaboration to “1”, the tool
elaborates the design and generates gate level netlist which is used for further power
analysis. If we set upload report to “1”, the tool uploads reports to the online database.
The users should set flow control variables accurately so the tool performs the run
properly.

11
4. FLOW OF POWERARTIST RUN
In this section we discuss the flow of the scripts. The section provides the information on
each script. The diagrams below give an idea about the flow. An illustration is shown in
figure 3 where “cfg.tcl” executes “run.tcl” and “run.tcl” executes other scripts
(“extract_vc.pl”, “elaborate.tcl”, “reduction_analysis.tcl” and/or
“upload_report_to_mdp.tcl”) based on specification in the “cfg.tcl”.
Figure 3 : Flow diagram of run.tcl
cfg.tcl
run.tcl
extract_vc.pl
elaborate.tcl
reduction_analysis.tcl
upload_report_to_mdp.tcl
12
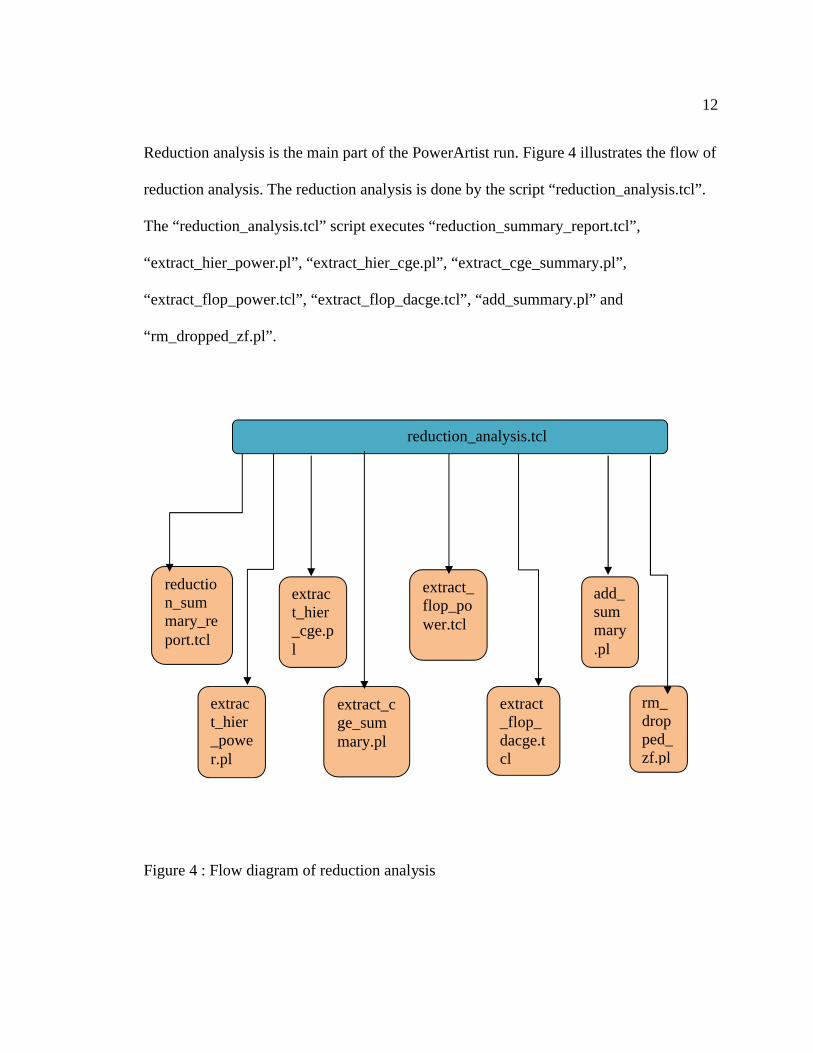
Reduction analysis is the main part of the PowerArtist run. Figure 4 illustrates the flow of
reduction analysis. The reduction analysis is done by the script “reduction_analysis.tcl”.
The “reduction_analysis.tcl” script executes “reduction_summary_report.tcl”,
“extract_hier_power.pl”, “extract_hier_cge.pl”, “extract_cge_summary.pl”,
“extract_flop_power.tcl”, “extract_flop_dacge.tcl”, “add_summary.pl” and
“rm_dropped_zf.pl”.
Figure 4 : Flow diagram of reduction analysis
reduction_analysis.tcl
reduction_summary_report.tcl
extract_hier_power.pl
extract_hier_cge.pl
extract_cge_summary.pl
extract_flop_power.tcl
extract_flop_dacge.tcl
add_summary.pl
rm_dropped_zf.pl

13
Scripts
Description of “run.tcl” script
The “run.tcl” script is the heart of the PowerArtist flow. It is the main script and it
invokes a number of other scripts from the global directory.
This script is executed by a tcl (Tool Command Language) script named “cfg.tcl”.
Depending upon the user requirement, several switches /command line options are
provided when this script is called. Depending upon the command line options, various
sub scripts are invoked by “run.tcl”.
If “Generate vc” is set to 1 in “cfg.tcl” then “run.tcl” executes “extract_vc.pl” script. If
“elaboration” is set to 1 in “cfg.tcl” then “run.tcl” executes “elaborate.tcl” script. If
“Reduction_Power_Analysis” is set to 1 then “run.tcl” executes “reduction_analysis.tcl”
script. If “Upload_Report_To_MDP” is set to 1 in “cfg.tcl” then “run.tcl” executes
“upload_report_to_mdp.tcl” script. Depending upon the specified input option, the
PowerArtist flow is driven by the “cfg.tcl”.

14
Flow of “run.tcl” script
Now, we know that the “run .tcl” is the main script that executes other scripts from global
directory.
The section will describe each script’s functionality.
“extract_vc.pl”
If “Generate VC” is set to 1 in the “cfg.tcl” [“set Generate_VC 1”] then
“run.tcl” executes the “extract_vc.pl” script. The “extract_vc.pl” script
generates “<unit>.vc” file which lists of all the necessary files needed to
elaborate RTL design.
This script will parse through the entire design hierarchy of the specified
unit, and determine all different functional blocks from the unit on which the
elaboration needs to be run. In complex designs, there could be multiple sub-
directories within a single directory, each of them would contain functional
blocks that need to be elaborated. The script will find out all such fubs and
list them down.
Along with RTL functional blocks, we need to run elaboration on some
custom library components. This script will also find all library components
that are being used in the RTL functional block and list them down as part of
the elaboration list.

15
“elaborate.tcl”
If “set elaboration” is 1 in “cfg.tcl” then “run.tcl” calls and executes
“elaborate.tcl”. This script as its name suggests, is responsible for
elaborating the RTL files listed in the “extract_vc.pl”. It first elaborates the
model to make sure RTL files are LIRA (syntax checker software)
compatible and synthesis flows can be run.
Once RTL files are LIRA clean, the function runs synthesis on the listed files
and generates the netlist. It has its own synthesis tool which is equivalent to
that of the “DesignCompiler” by Synopsys.

16
Description of “reduction_analysis.tcl”
If “reduction analysis” is set to 1 in “cfg.tcl” then “run.tcl” executes the
“reduction_analysis.tcl” script.
This script plays a crucial role in PowerArtist flow. It is responsible for power generation
based on the RTL netlist and reporting the cdyn (active/inactive dynamic) power
generated by each cell of the RTL fub/unit. It generates a file called “power data base”
and outputs power reports.
It also provides a useful feedback about RTL implementation from Power perspective
and suggestions on how to reduce the power consumption in RTL design. This is why it
has been named “reduction analysis”. It also invokes a bunch of other scripts. The name
and role of each of these scripts are mentioned in the next section.

17
Flow of “reduction_analysis.tcl”
This script actually executes the set of scripts listed below.
o reduction_summary_report.tcl
o extract_hier_power.pl
o extract_hier_cge.pl
o extract_cge_summary.pl
o extract_flop_power.tcl
o extract_flop_dacge.tcl
o rm_dropped_zf.pl
o add_summary.pl
Description of each script is given below.
reduction_summary_report.tcl
This script generates reports for ungated clock gating flops/latches, pwc gated
flops/latches, rtl gated flop/latches and also does the calculation of clock gate
efficiency for all types of flops/latches.

18
extract_hier_power.pl
This script generates power reports for one to four level hierarchies. It also
calculates the total dynamic power and the percentage of the total power
consumed. It also performs sorting operation on hierarchical power reports and
sorts’ reports in descending order so the user does not need to go through the
whole power reports.
extract_hier_cge.pl
This script searches dacge (data aware clock gate efficiency) reporting part from
original apche reports and generates new clock gate efficiency reports for flops
and latches.
extract_cge_summary.pl
This script searches the summaries from apache reports and generates a new
summary report.
rm_dropped_zf.pl
This script checks whether any zero frequency flop/latch is present in power
reports. If they are present in any of the reports, then discard zero frequency
flop/latch from the report so the user can get accurate clock gate efficiency
numbers. It also keeps track of zero frequency flops. It creates a debug directory
19
and creates zero frequency reports and lists the flops/latches that are discarded
from gated power reports.
add_summary.pl
This script adds summary of all flops and latches on top of the cg_summary
reports so that the user can obtain a clear idea of his/her unit’s clock gate
efficiency numbers.
upload_report_to_mdp.tcl
If “Upload_Reports_To_MDP” is set to 1 then “run.tcl” executes the
“upload_report_to_mdp.tcl” script. This script sends main probes to MDP
database and also copies “good run” to central directory.

20
5. RESULTS
This section gives a description of the results and reports generated by PowerArtist run.
Reports
Reports can be divided into two categories:
1. PowerArtist Post Processed Reports
These reports are well organized and easy to understand. They are located in the
reports directory. Different reports contain different information like power
numbers, cge numbers and summary reports. Each report has a meaningful name
which describes the contents of that report. These reports are primarily used by the
RTL designers.
2. PowerArtist Native Reports
These reports are located in Apache directory. They are native and very detailed
reports generated by the tool. Each report has too many sections which makes it
difficult to find specific information.

21
Clock Gating Summary Report
The name of the clock gating summary report is “<unit>.cg_summary.rpt”. As an
example, the report name is “lsqcunit.cg_summary.rpt” for unit named “lsqcunit”.
This report contains summary of different cells (flops/latches). An illustration is
shown in figure 5.
Figure 5 : Clock gating summary report top
This report contains summary of flops and latches. The “cell_Type” column shows
the type of the cell like ungated flop/latch, rtl gated flop/latch, pwc gated flop/latch
and both gated flop/latch. The column “count” has the total number of flop/latch. The

22
column dcge shows dynamic clock gate efficiency numbers and column dacge shows
data aware clock gate efficiency numbers.
The report also provides clock gating summary as shown in figure 6.
Figure 6 : Clock gating summary report bottom

23
Power Reports
There are two types of power reports, one for flop power and the other for latch
power.
The name of the flop power report is “<unit>.pw_FFs.pwr.rpt”. As an example,
the report name is “lsqcunit. pw_FFs.pwr.rpt” for unit named “lsqcunit”. The
report contains power information of all flops.
Similarly, the name of the latch power report is “<unit>.pw_ latches.pwr.rpt”. As
an example, the report name is “: lsqcunit. pw_ latches.pwr.rpt” for unit named
“lsqcunit”. This report contains power information of all latches.
These reports also contain flop/latch name with its clock and root clock, gating
technique, width, static and dynamic power, activity, initial and final DCGE and
DACGE.
The content of the reports is sorted according to dynamic power values.
Power Report Example: <unit>.pw_FFs.pwr.rpt

24
Figure 7 : Power report
As it can be seen in figure 7, the report contains information about gating technique,
width, static and dynamic power, activity, initial and final DCGE and DACGE
organized in columns.

25
DACGE Reports
There are two types of data aware clock gate efficiency reports (DACGE), one for
flops and the other for latches.
The name of the flop dacge report is “<unit>.pw_FFs. dacge.rpt”. As an example,
the report name is “lsqcunit. pw_FFs. dacge.rpt” for unit named “lsqcunit”. This
report contains data aware clock gate efficiency (DACGE) information of all
flops.
In similar way, the name of the latch dacge report is “<unit>.pw_
latches.dacge.rpt”. As an example, the report name is “lsqcunit. pw_ latches.
dacge.rpt” for unit named “lsqcunit”. This report contains data aware clock gate
efficiency (DACGE) information of all latches.
These reports contain instance name, static power, dynamic power and data
activity for the instances. They also contain DCGE and DACGE of flops/latches
and shows initial, final and improvement numbers for both metrics.
The report is sorted according to DACGE values.
Example of <unit>.pw_FFs.dacge.rpt

26
Figure 8 : DACGE report
An illustration is shown in figure 8 where the report contains information about
total flops, static and dynamic power, activity, initial and final DCGE and
DACGE organized in columns.

27
Reports on Gating Types
These reports contain information of flops and latches of different gating types
including total count, DCGE and DACGE of that category.
There are four types:
1. Ungated Flops/Latches
• Name : <unit>.no_cg.ff.rpt
It contains information of ungated flops.
• Name : <unit>.no_cg.latch.rpt
It contains information of ungated latches.
2. Only RTL gated Flops/Latches
• Name : <unit>.rtl_cg_only.ff.rpt
It contains information of only RTLgated flops.
• Name : <unit>.rtl_cg_only.latch.rpt
It contains information of only RTLgated latches.
3. Only PWC gated Flops/Latches
• Name : <unit>.pwc_cg_only.ff.rpt
It contains information of only pwc gated flops.
• Name : <unit>.pwc_cg_only.latch.rpt
It contains information of only pwc gated latches.

28
4. Both RTL & PWC gated Flops/Latches
• Name : <unit>.rtl_pwc_cg.ff.rpt
It contains information of both RTL and PWC gated flops.
• Name : <unit>.rtl_pwc_cg.latch.rpt
It contains information of both RTL and PWC gated latches.
Figure 9 : PWC gated flops report

29
As it can be seen in figure 9, the report contains information about cell type, width,
DCGE and DACGE organized in columns.
Hierarchical Power Reports
There are four hierarchical power reports
• <unit>.pw_cell_ONE_level.pwr.rpt
• <unit>.pw_cell_TWO_level.pwr.rpt
• <unit>.pw_cell_THREE_level.pwr.rpt
• <unit>.pw_cell_FOUR_level.pwr.rpt
Each report contains internal power, switching power, leakage power and total
power for that specific hierarchy. Only in level one report the percentage of total
power is also included and the information is sorted based on percentage total
power.

30
One Level Power Report Example
Figure 10 : One Level Power Report
An illustration is shown in figure 10 where the report contains information about
hierarchy, internal power, switching power, leakage power and total power
organized in columns.

31
Additional Reports
The list of additional reports includes:
<unit>_dropped_ff.rpt
<unit>_dropped_latch.rpt
<unit>_zf_ff.rpt
<unit>_zf_latch.rpt
These reports can be found in the reports/debug directory.
“dropped_ff.rpt” or “dropped_latch.rpt”
It contains a list of flops/latches that are dropped by the PowerArtist after RTL
inference but present in original RTL.
“zf_ff.rpt” or “zf_latch.rpt”
It contains a list of flops/latches that have zero frequency clock input.

32
Logs
When the PowerArtist tool is used for power runs, it can fail (i.e. crashed/spit out errors)
due to multiple reasons. Failures are mainly categorized as elaboration stage or reduction
stage failures. There exist different log areas for these categories.
1. elab.<unit>.<test_name>.rtl.log -> Elaboration stage log file
2. red.<unit>.<test_name>.rtl.log -> Reduction stage log file
Elaboration Stage Log File
This log contains error details that come through RTL module elaboration. RTL
modules are mostly Verilog/SystemVerilog based files which when provided by the
user can have syntactical errors or contain constructs which are not supported by the
PowerArtist tool.
This log also contains errors related to incorrect constraints provided to the tool
during ESL design stage. The “cfg.tcl” could crash due to syntactical errors in TCL
set-up files which are also categorized as elaboration stage failures
One noteworthy thing to mention here is that the elaboration stage log file is not
generated when the elaboration is successful. The log file is printed only when one or
more elab errors are present.

33
Reduction Stage Log File
This log file contains errors encountered during the actual power flow run. Similar to
elab stage log file, the reduction stage log file will not be generated if the PowerArtist
flow runs smooth.
There is a set of Tcl and Perl based scripts run during the actual PowerArtist tool
execution. If there are any syntactical or other legitimate errors in these scripts, the
flow would abort in the middle and log file containing errors gets generated.
When both elaboration and reduction stages run smoothly, no error file will be
dumped in the log area.
The standard debug process is to go through the elab log file first, followed by the
reduction log file. The user should look for the 1st error message and try to resolve it
and then go to the next set of errors and so on. Some of the later stage errors could be
related to earlier stage errors therefore, while debugging these errors, the best known
method is to follow a sequential order starting from the 1st error debug.

34
6. POWER REDUCTION ANALYSIS
This section will discuss how user can analyze the results and change their design
accordingly to implement PoweArtist’s power reduction suggestions using PowerCanvas.
PowerCanvas is the graphical user interface for the PowerArtist. The PowerArtist run
creates a binary file in data directory called Power Database. PDB contains a hierarchical
netlist of the design, power analysis and reduction information.
An illustration of PowerCanvas is shown in figure 11.
Figure 11 : PowerCanvas

35
The user clicks on view there will be drop down menu, when the user makes a selection
one of the reduction suggestions window will be popped up.
An example of power reduction drop down menu is shown in figure 12.
Figure 12 : Power reduction drop down menu
Each of the reductions suggests new implementations on the user’s design. Higher clock
gating efficiency and reduction in power can be achieved if the suggestion is
implemented.
36
The next section describes simple power reduction.
1. Simple Power reduction
Simple power reduction is also called LNR/LER [Low activity Non-enabled/Enabled
Register] power reduction. In this technique, the PowerArtist tool identifies buses in
the design that change infrequently and are not enabled or weakly enabled. The
PowerArtist tool also estimates the savings gained if a clock enable is generated by
detecting changes on the bus. The PowerArtist generates the enable for maximum 16
bit wide registers.
2. Linter Power reduction
The goal of low power design is to achieve the required functionality and timing
while consuming the least amount of power. Linter reductions help in identifying the
parts of the design where power is wasted. The PowerArtist tool generates various
reports which include the total amount of wasted power, the kind of wasted power,
the design instances/fubs in which the power is getting wasted etc. But the limitation
of the tool is such that it does not recommend means of recovering wasted power.
Recovering the wasted power solely depends on how the RTL is coded and the test
patterns injected to determine the power consumption.

37
MUX power Linter
The PowerArtist monitors all muxes and their inputs in the design to see if certain
input toggles are unnecessary due to input not being selected.
The PowerArtist estimates the power in the cones of logic leading to the inputs
with the wasted power.
Register Power Linter
The PowerArtist monitors registers and their inputs in the design to see if certain
toggles were unnecessary.
The PowerArtist estimates the power lost due to extraneous activity on the inputs.
3. Advanced power reduction
Advanced power reduction is also called prism technique. In this technique,
PowerArtist looks for register chain where a register early in the chain is enabled but
registers later in the chain are not enabled. The PowerArtist propagate and use the
existing enable to clock gate pipeline stages.

38
7. CONCLUSION
In modern VLSI world, the dynamic power consumed by a digital circuit plays a crucial
role. The CMOS process technology is getting smaller generation after generation in
order to sustain the famous Moore’s law which says “the number of transistors that can
fit into per mm^2 chip area are getting doubled every 2 years”. With this exponential
growth in the number of transistors, today’s digital circuit contains billions of transistors
in a tiny area. It has become essential to monitor constantly the overall dynamic power
consumption of a digital circuit. To make an ASIC VLSI multi-billion gate system on
chip (SOC) which consumes low power is an important question in today’s world, and
there have been a lot of research going on in analyzing digital circuit dynamic power
consumption, and innovating methodologies that could help reduce the power
consumption. Tools like PowerArtist are widely used across the semi-conductor
industries, and they have been continuously enhanced to provide more precise power
analysis. By incorporating the suggestions provided by this tool, the designs can be made
more power friendly while meeting all required functional specifications.

39
REFERENCES
[1].http://www.csus.edu/indiv/p/pangj/274/handout/Handout_CMOS_power_consumptio
n.pdf, November 2014.
[2].Jacob Baker, Circuit Design, Layout, and Simulation, 3rd Edition, John Wiley and
sons, September 2010.
[3].Neil Weste and David Harris, CMOS VLSI Design: A Circuits and Systems
Perspective, 4th Edition, Pearson, March 2010.
[4].PowerArtist User guide from Apache, April 2015.
[5].PowerArtist Training Document [Intel], October 2015.
[6].Teach Yourself Perl in 21 days [e book], http://ft-
sipil.unila.ac.id/dbooks/(ebook%20pdf)%20Teach%20Yourself%20Perl%20in%2021
%20Days.pdf, March 2015.
[7].https://www.ece.cmu.edu/~ece322/LECTURES/Lecture13/Lecture13.03.pdf,
September 2014.
[8].https://en.wikipedia.org/wiki/CMOS, March 2015.
Copyright © 2022 FDOKUMEN