Chuar Group of the Grand Canyon: Record of breakup of Rodinia, associated change in the global...
22
Precambrian Research 129 (2004) 71–92 Paleomagnetism of the Neoproterozoic Chuar Group, Grand Canyon Supergroup, Arizona: implications for Laurentia’s Neoproterozoic APWP and Rodinia break-up Arlo B. Weil a,∗ , John W. Geissman b , Rob Van derVoo c a Department of Geology, Bryn Mawr College, 101 North Merion Avenue, Bryn Mawr, PA 19010, USA b Department of Earth and Planetary Sciences, University of New Mexico, Albuquerque, NM 87131, USA c Department of Geological Sciences, University of Michigan, Ann Arbor, MI 48109, USA Received 23 January 2003; accepted 30 September 2003 Abstract Selected parts of the Galeros and Kwagunt Formations, of the Neoproterozoic Chuar Group (ca. 800–740 Ma) exposed in the eastern Grand Canyon, Arizona, yield paleomagnetic data that are consistent with a primary origin. Both formations are dominated by dark mudrock with multiple, hematite-cemented fine sandstone and mudstone horizons that yield magnetizations of west declination and shallow inclination (or antipodes). The grand mean magnetization for the older Galeros Formation, determined by giving unit weight to each of 16 sites, is Dec = 265.5 ◦ , Inc = 5.1 ◦ , α95 = 8.5 ◦ , κ = 19.8 and yields a paleopole of 2 ◦ S, 163 ◦ E (dp = 4.3; dm = 8.5). The younger Kwagunt Formation provides a grand mean magnetization of Dec = 280.8 ◦ , Inc = 30.6 ◦ , α95 = 8.4 ◦ , κ = 38.6 (three sites of normal polarity and six sites of reverse polarity), determined by giving unit weight to each of the nine sites, and yields a paleopole of 18 ◦ N, 166 ◦ E (dp = 5.2; dm = 9.4). The NRM of about a third of the collection, mainly from coarser-grained hematitic sandstones, is dominated by a north-directed, moderate positive inclination magnetization with laboratory unblocking temperatures up to 680 ◦ C and is interpreted as a recent overprint. We argue that the east–west and shallow magnetization in the Chuar Group strata, although similar to early Paleozoic magnetizations for North America, is primary because both groups of data pass fold tests and because Chuar strata lie in angular unconformity below the flat-lying Middle Cambrian Tapeats sandstone. Furthermore, we infer that the Chuar Group paleopoles, together with other North American Neoproterozoic results, are fully consistent with a tight counterclockwise loop in the south Pacific in the apparent polar wander path for North America during the Neoproterozoic. This new path represents a drift history that positions the central part of the Rodinia supercontinent at or near the equator at ∼800 Ma and slightly younger time. Penecontemporaneous with Chuar deposition, extension began along the Cordilleran margin of Laurentia. This large-scale extensional event culminated in the rift-to-drift transition of Laurentia away from East Gondwana or Asian (South China, Siberia) blocks by ca. 750 Ma. © 2003 Elsevier B.V. All rights reserved. Keywords: Paleogeography; Paleomagnetism; Rodinia; Neoproterozoic; Grand Canyon Supergroup ∗ Corresponding author. Fax: +1-610-526-5086. E-mail address: [email protected] (A.B. Weil). 1. Introduction Well-dated Neoproterozoic paleomagnetic poles for Laurentia are relatively sparse and, consequently, considerable uncertainty exists about the paleogeog- 0301-9268/$ – see front matter © 2003 Elsevier B.V. All rights reserved. doi:10.1016/j.precamres.2003.09.016
Transcript of Chuar Group of the Grand Canyon: Record of breakup of Rodinia, associated change in the global...

Precambrian Research 129 (2004) 71–92
Paleomagnetism of the Neoproterozoic Chuar Group, GrandCanyon Supergroup, Arizona: implications for Laurentia’s
Neoproterozoic APWP and Rodinia break-up
Arlo B. Weil a,∗, John W. Geissmanb, Rob Van der Vooca Department of Geology, Bryn Mawr College, 101 North Merion Avenue, Bryn Mawr, PA 19010, USA
b Department of Earth and Planetary Sciences, University of New Mexico, Albuquerque, NM 87131, USAc Department of Geological Sciences, University of Michigan, Ann Arbor, MI 48109, USA
Received 23 January 2003; accepted 30 September 2003
Abstract
Selected parts of the Galeros and Kwagunt Formations, of the Neoproterozoic Chuar Group (ca. 800–740 Ma) exposed inthe eastern Grand Canyon, Arizona, yield paleomagnetic data that are consistent with a primary origin. Both formations aredominated by dark mudrock with multiple, hematite-cemented fine sandstone and mudstone horizons that yield magnetizationsof west declination and shallow inclination (or antipodes). The grand mean magnetization for the older Galeros Formation,determined by giving unit weight to each of 16 sites, is Dec= 265.5◦, Inc = 5.1◦, α95 = 8.5◦, κ = 19.8 and yields a paleopoleof 2◦S, 163◦E (dp= 4.3; dm= 8.5). The younger Kwagunt Formation provides a grand mean magnetization of Dec= 280.8◦,Inc = 30.6◦, α95 = 8.4◦, κ = 38.6 (three sites of normal polarity and six sites of reverse polarity), determined by giving unitweight to each of the nine sites, and yields a paleopole of 18◦N, 166◦E (dp= 5.2; dm= 9.4). The NRM of about a third of thecollection, mainly from coarser-grained hematitic sandstones, is dominated by a north-directed, moderate positive inclinationmagnetization with laboratory unblocking temperatures up to 680◦C and is interpreted as a recent overprint. We argue that theeast–west and shallow magnetization in the Chuar Group strata, although similar to early Paleozoic magnetizations for NorthAmerica, is primary because both groups of data pass fold tests and because Chuar strata lie in angular unconformity below theflat-lying Middle Cambrian Tapeats sandstone. Furthermore, we infer that the Chuar Group paleopoles, together with other NorthAmerican Neoproterozoic results, are fully consistent with a tight counterclockwise loop in the south Pacific in the apparent polarwander path for North America during the Neoproterozoic. This new path represents a drift history that positions the centralpart of the Rodinia supercontinent at or near the equator at∼800 Ma and slightly younger time. Penecontemporaneous withChuar deposition, extension began along the Cordilleran margin of Laurentia. This large-scale extensional event culminated inthe rift-to-drift transition of Laurentia away from East Gondwana or Asian (South China, Siberia) blocks by ca. 750 Ma.© 2003 Elsevier B.V. All rights reserved.
Keywords: Paleogeography; Paleomagnetism; Rodinia; Neoproterozoic; Grand Canyon Supergroup
∗ Corresponding author. Fax:+1-610-526-5086.E-mail address: [email protected] (A.B. Weil).
1. Introduction
Well-dated Neoproterozoic paleomagnetic polesfor Laurentia are relatively sparse and, consequently,considerable uncertainty exists about the paleogeog-
0301-9268/$ – see front matter © 2003 Elsevier B.V. All rights reserved.doi:10.1016/j.precamres.2003.09.016

72 A.B. Weil et al. / Precambrian Research 129 (2004) 71–92
raphy of Laurentia for this time period (Roy, 1983;Park, 1994;Buchan et al., 2001; Meert and Powell,2001). Conversely, some intervals during the Meso-proterozoic for Laurentia (i.e., the Logan-Loop) pro-vide the most complete Precambrian apparent polarwander paths (APWP) of any of the major continents.The Logan-Loop is largely derived from rocks of theKeweenawan rift system of northeastern Laurentia(1.1–1.0 Ga) and is defined by over 60 poles having,overall, well-determined stratigraphy, structure andgeochronology (Halls and Pesonen, 1982). On theother hand, for the Neoproterozoic, and more specif-ically for the time interval between 1.0 and 0.75 Ga,most paleopoles have been derived from high-grademetamorphic rocks from the Grenville Province ofnortheastern Laurentia, which have been either chemi-cally and or thermally remagnetized (McWilliams andDunlop, 1978; Hyodo and Dunlop, 1993; Costanzoand Dunlop, 1998; Warnock et al., 2000). AlthoughLaurentia’s APWP has no substantial spatial discon-tinuities between the Keweenawan and Grenville polesequences, the direction and sense of younging of theGrenville aged part of the APWP remains contested(McWilliams and Dunlop, 1978; Berger et al., 1979;Roy, 1983; Hyodo and Dunlop, 1993; Weil et al.,1998).
Global paleogeography for this time period(1.1–0.75 Ga), and in particular Laurentia’s positions,are especially important in the context of the hypoth-esized Rodinia supercontinent and its history of amal-gamation and subsequent fragmentation (Hoffman,1991; Dalziel, 1991, 1997; Weil et al., 1998; Meertand Powell, 2001; Hartz and Torsvik, 2002; Torsvik,2003). Rodinia is hypothesized as a long-lived Pro-terozoic supercontinent formed from the amalgama-tion of all of the major continental blocks during theGrenville orogeny (∼1.10 Ga). However, both the ul-timate configuration and lifecycle of Rodinia are stillpoorly understood (Buchan et al., 2001; Meert andPowell, 2001; Torsvik, 2003). Of particular interestand contention are the timing of Rodinia’s breakupand the paleogeography of the dispersing continentsduring breakup.
Surrounded by rift margins that developed in theNeoproterozoic (Bond et al., 1984), Laurentia isthought to have made up the core of Rodinia duringthe supercontinent’s lifecycle. Proposals for possibleconnecting pieces include Australia, East Antarctica,
South China, and Siberia for Laurentia’s Cordilleraand Arctic margins, and Baltica, Amazonia, Riode la Plata, Congo, and Kalahari for Laurentia’sAppalachian margin (Piper, 1982; Moores, 1991;Hoffman, 1991; Li et al., 1996; Dalziel, 1997; Weilet al., 1998; Torsvik et al., 2001a, 2001b; Karlstromet al., 2001). Although there is compelling evidencefor the approximate timing of Laurentia’s ‘break-out’from Rodinia (Hoffman, 1991), and the subsequentopening of the Paleo-Pacific and Iapetus Oceans, largediscrepancies still exist between available paleomag-netic data and the geologic records of continent dis-persal (Lindsay et al., 1987; Bond and Kominz, 1984;Powell et al., 1993, 1994; Meert and Powell, 2001).
One of the most widely accepted adjoining blocksfor Laurentia’s Cordilleran margin is Australia (Belland Jefferson, 1987; Moores, 1991; Karlstrom et al.,2001). Stratigraphic similarities between Laurentiaand Australia, and subsidence curves of the Laurentiamargin suggest a Vendian age of separation (Bond andKominz, 1984) between East Gondwana and Lauren-tia. However, paleomagnetic results from Laurentiaand East Gondwana indicate an earlier rift-to-driftage ranging between∼800 and 725 Ma (Powell et al.,1993; Wingate et al., 2002). This 200 Ma differencein the timing of rift initiation is substantial and hasimportant ramifications for global tectonics. It is nowwidely accepted that formation of the Gondwanasupercontinent—amalgamation of East and WestGondwana tectonic elements—was completed by ca.560 Ma along the Mozambique belt of eastern Africaduring the East African Orogen (Stern, 1994). Re-cent geochronologic and paleomagnetic data supporta two-stage model for the collision of East and WestGondwana, with final amalgamation culminating atca. 550 Ma (Meert et al., 1995; Meert and Van derVoo, 1996). Clearly, if these interpretations are cor-rect, the East Gondwana blocks must have rifted awayfrom the Cordilleran margin of Laurentia consider-ably earlier than predicted by the thermal subsidencemodels for the western margin of Laurentia (Bondet al., 1984). This dichotomy emphasizes the need foradditional, well-dated paleomagnetic poles from bothEast Gondwana and Laurentia for the time intervalbetween 900 and 700 Ma to better define the timingand paleogeography of Rodinia’s breakup.
A better understanding of Neoproterozoic paleo-geography is also needed due to the recent renewed

A.B. Weil et al. / Precambrian Research 129 (2004) 71–92 73
interest inHarland’s (1964)hypothesis that the Earthexperienced a long-lived widespread ice age in theNeoproterozoic.Kirschvink (1992)proposed, on thebasis of paleomagnetic data interpreted to indicate that
Fig. 1. Simplified geologic map of sampled Proterozoic rocks exposed in the Grand Canyon, Arizona. Modified fromTimmons et al. (2001).
many of these global glacial deposits formed at equa-torial latitudes, a “snowball” Earth hypothesis, duringwhich the planet is covered in ice, weathering reactionsbasically cease, and carbon dioxide concentrations

74 A.B. Weil et al. / Precambrian Research 129 (2004) 71–92
gradually increase in the atmosphere, ultimately cre-ating a global, CO2-induced catastrophic warming.Hoffman et al. (1998), Hoffman (1999)andHoffmanand Schrag (2002)assimilated stratigraphic and stableisotope data that strongly support such a hypothesisand in fact argue that the development of a snowballEarth and consequent rapid warming may have takenplace up to four times in the Neoproterozoic. Witha growing body of information supporting periods ofexceedingly unusual climate behavior for Earth in theNeoproterozoic, additional, robust paleomagnetic datafor this time period have become even more important.Some initial paleomagnetic data from Neoproterozoicrocks from North America (e.g.,Elston, 1989a, 1989b;Elston, 1993; Park and Aitken, 1986) are consistentwith the possibility of North America lying at or nearthe equator during this time period, but there are is-sues of concern that bear on the overall reliability ofmany of the data, especially the data from the Ameri-can Southwest. These include inadequate documenta-tion of demagnetization results, inaccuracies in the ageof the rocks sampled, and the possibility that the mag-netizations are secondary, as the poles derived frommany Neoproterozoic rocks have positions similar tothose from rocks of Cambro-Ordovician age.
We report here new paleomagnetic results fromthe Chuar Group, which forms the upper part of theGrand Canyon Supergroup (GCSG), northern Arizona(Fig. 1). Exposed in a 6 km×24 km area in the easternGrand Canyon, the sedimentary sequence is one ofthe thickest (about 1600 m thick) and best-preservedNeoproterozoic successions in North America. Be-cause depositional ages for these rocks span between∼800 and 740 Ma (Karlstrom et al., 2001; Timmonset al., 2001), these rocks were studied with the hopethat they could provide a temporally well-definedset of paleopoles that better elucidates Laurentia’sNeoproterozoic APWP, and thereby provides an im-proved definition of the general paleogeography ofthe Neoproterozoic.
2. Geologic setting
The Chuar Group comprises a sequence of shal-low marine and tidal-flat deposits. The sequence isdominated by mudrock (>85%) with subordinatemeter-scale beds of dolomite and sandstone. The
Chuar Group has been subdivided into the Galerosand Kwagunt Formations, which are further subdi-vided into seven members (Fig. 2) (Ford and Breed,1973). Internal deformation of the Chuar Group isminor (i.e. broad folds and minor faults) and inter-preted to be related to large-scale extension prior to740 Ma (Timmons et al., 2001). Subsequent Laramidedeformation produced high-angle reverse faults andlocally juxtaposed Chuar Group and Paleozoic strata.
The age of the Chuar Group is bracketed be-tween 1.09 Ga (underlying Cardenas Basalts) andabout 0.74 Ga (ash at the top of the Chuar Group(Dehler et al., 1999)). The basal age comes froma Rb-Sr whole-rock date of 1070± 70 Ma and a40Ar/39Ar age of 1091± 5 Ma derived from theunderlying Cardenas Basalts and its feeder dikes(Elston and McKee, 1982; Timmons et al., 2001;Weil et al., 2003). The upper age limit of 742± 6 Mais based on a U–Pb zircon date of an ash bed fromthe Walcott member (Karlstrom et al., 2000). Fossilassemblages includingChuaria, Baicalia-Boxonia,Stratifera-Inzeria and vase-shaped microfossils foundthroughout the Chuar Group succession corroboratea Neoproterozoic age (Vidal and Ford, 1985; Porterand Knoll, 2000). Preliminary paleomagnetic workin the Chuar Group is also consistent with a Neo-proterozoic age for the Chuar succession (Elston1989a,b, 1993; also summarized inElston et al.,2002).
Environmental interpretation of Chuar Group facieshas been the subject of substantial debate, mainly dueto the lack of megafossils and bioturbation (Ford andBreed, 1973; Vidal and Knoll, 1983; Reynolds et al.,1988; Cook, 1991; Dehler et al., 2001a). Recently,Dehler et al. (2001a)used microfossils, sedimentarystructures, facies associations, and geochemical trendsto discount previously held non-marine interpretationsfor Chuar deposition (Ford and Breed, 1973; Reynoldset al., 1988; Cook, 1991). All Chuar facies indicate amarine setting with no unequivocal evidence suggest-ing terrestrial depositional environments (Dehler et al.,2001a). Ripple-laminated and cross-bedded sandstonefacies exhibit epsilon cross-beds, bi-directional troughcross-beds, interference ripples, convolute bedding,load casts, and mudcracked mud drapes that over-lie symmetrical ripples, which collectively suggesta marine tidal environment (Dehler et al., 2001a).The existence of marine fossils and high local pyrite

A.B. Weil et al. / Precambrian Research 129 (2004) 71–92 75
Fig. 2. Simplified stratigraphic section of the Grand Canyon Supergroup, Arizona. Column modified fromDehler et al. (2001a,b).

76 A.B. Weil et al. / Precambrian Research 129 (2004) 71–92
content within the mudrocks also indicates a marineenvironment (Porter and Knoll, 2000).
It has recently been proposed that the Chuar Groupwas part of a large intra-continental seaway thatformed during initial phases of extension and riftingalong the Cordilleran margin (Dehler et al., 2001b).In their model, Dehler et al. (2001b)hypothesizethat the Chuar Group was deposited penecontempo-raneously with rifting in a large sea, which they callthe CHUMP (Chuar, Uinta Mountain and Pahrumpgroups) seaway, additional remnants of which arerepresented by parts of the Uinta Mountain Groupof northeastern Utah and the Pahrump Group of theDeath Valley area, California.
Structural interpretations of the Chuar Group indi-cate deposition concurrent with east–west extensionalong north–south trending structures, including thewell-exposed Butte fault (Timmons et al., 2001). Themain structural feature in the Chuar Group is theChuar syncline just west of, and parallel to, the Buttefault (Fig. 1). Timmons et al. (2001)documentedseveral features from the Chuar syncline that theyinterpreted to be consistent with a growth fold originfor the structure. These features include tighteningof the syncline with depth, intraformational faults,soft-sediment deformation, stratigraphic thickeningwithin the hinge zone of the fold, and abrupt strati-graphic and thickness variations across the Butte fault.The trends of the Chuar syncline, as well as the orien-tation of syn-depositional normal faults like the Buttefault, suggest that it formed subparallel to the ancientCordilleran rift margin (Timmons et al., 2001).
Stratigraphic and structural interpretations of theChuar Group indicate the succession was depositedin an intracratonic basin created as a consequence ofextension, possibly related to the breakup of Rodinia(Sears, 1990; Timmons et al., 2001). Detailed descrip-tions of Chuar stratigraphy, structure and paleontol-ogy are found inDehler et al. (2001a), Timmons et al.(2001)andPorter and Knoll (2000), respectively.
3. Methods
With numerous red sandstone, siltstone and mud-stone beds, the Chuar Group is ideal for a compre-hensive paleomagnetic study. Forty-four sites werecollected in the Kwagunt and Galeros Formations
from a total of six different members. Sampling wascompleted in the summers of 1999–2001. Site loca-tions were distributed within the side canyons off ofthe main Colorado River corridor. Due to NationalPark Service restrictions, oriented hand samples werecollected in the field using a geologic hammer andchisel. Seven to nine hand samples were collectedper site, with each site typically consisting of mul-tiple beds. Severe outcrop weathering and highlyfaulted areas were avoided where possible. Beddingand sample orientations were measured in the fieldusing a magnetic compass. Sampling concentrated onhematite-rich detrital rocks, with grain sizes typicallyranging from medium sand to mud.
On average, eight standard 2.54 cm diameter paleo-magnetic specimens from each site were progressivelydemagnetized in an Analytical Service Co. (ASC)thermal demagnetizer and measured in a three-axesCryogenic 2G Magnetometer in the field-free room atthe University of Michigan’s paleomagnetic labora-tory. Samples from several sites were demagnetized inthe field-free room at the University of New Mexico’spaleomagnetic laboratory, using either a Shaw Mag-netic Measurements or a Schonstedt TSD-1 furnace.Thermal heating was carried out in 100◦C incrementsto 300◦C, with smaller temperature steps to a maxi-mum temperature of 680◦C. Chemical demagnetiza-tion (Henry, 1979) was carried out in the Universityof New Mexico Laboratory. Remanence directionswere calculated from principal component analysis(Kirschvink, 1980) of linear vectors picked from or-thogonal projection demagnetization plots (Zijderveld,1967). Site means were calculated by averaging thesample directions, using the method ofFisher (1953).Fold tests were performed where possible to charac-terize the relative age of magnetization acquisition.
4. Results
Two statistically unique paleomagnetic poles werederived from Chuar Group strata, one from the Kwa-gunt and one from the Galeros Formations. Demag-netization behavior of Chuar Group rocks is variablebut overall the rocks yield uniform dual polarity char-acteristic remanent magnetizations (ChRMs) of highcoercivity and high, distributed laboratory unblockingtemperature (Figs. 3 and 4).

A.B. Weil et al. / Precambrian Research 129 (2004) 71–92 77
Fig. 3. (a–d) Orthogonal demagnetization plots, in geographic coordinates, of representative samples from the Galeros Formation. Filled(open) symbols indicate projections onto the horizontal (vertical) plane. (e and f) Orthogonal demagnetization plots, in geographic coordinatesof representative chemical demagnetization (Henry, 1979) response of samples from the upper part of the Galeros Formation. Chemicaldemagnetization times indicate the duration of the individual leaching step, not the cumulative duration of leaching. After the 10 h step,most hematite-cemented Chuar rocks are partly to wholly decrepitated. Note that most of the hematite pigment is removed by leachingafter a few hours, and specimens reach a yellowish gray (5 Y 7/2) to grayish yellow (5 Y 8/4) color.

78 A.B. Weil et al. / Precambrian Research 129 (2004) 71–92
Fig. 4. Orthogonal demagnetization plots, in geographic coordinates, of representative samples from the Kwagunt Formation. Filled (open)symbols indicate projections onto the horizontal (vertical) plane.

A.B. Weil et al. / Precambrian Research 129 (2004) 71–92 79
Fig. 5. Equal area projections showing structurally corrected paleomagnetic site mean directions (filled symbols: lower hemisphere projection)for the (a) Galeros Formation and the (b) Kwagunt Formation. (c) PDF overprint sites (N = 9 sites) from the Carbon Butte Member ofthe Kwagunt Formation.
4.1. Galeros Formation
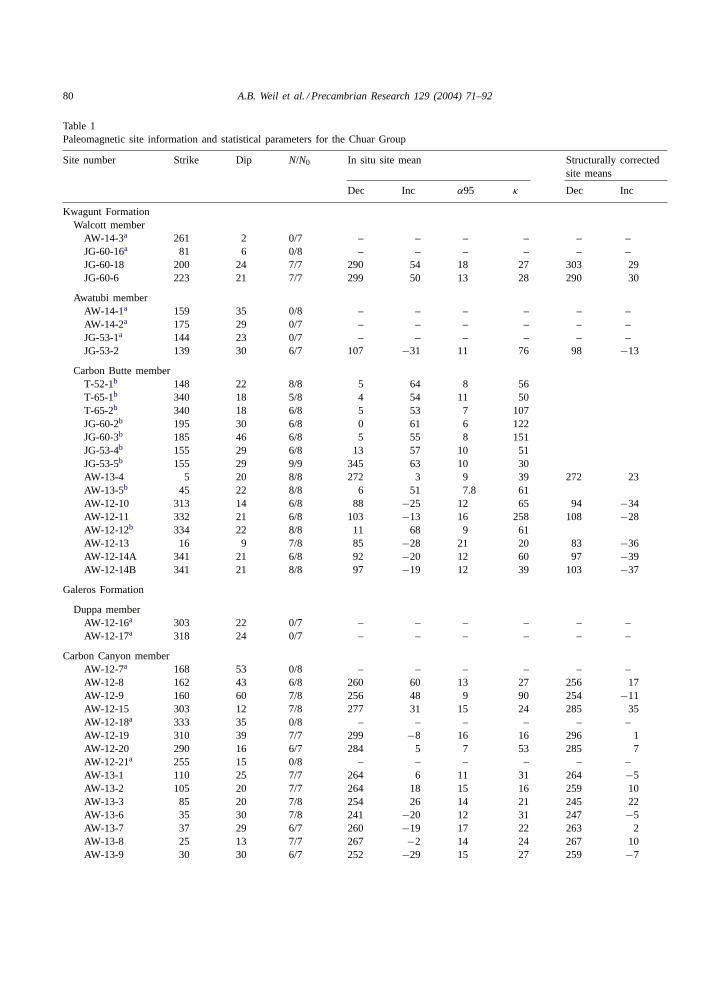
Intensities of natural remanent magnetizations(NRM) had values between 0.1 and 20.0 mA/m.Most of the Galeros samples had discrete unblock-ing temperatures between 630 and 680◦C, indicatinghematite to be the main remanence carrier (Fig. 3).Galeros sites were dominated by magnetizations ofwest declinations and moderate to shallow inclina-tions (Fig. 5a). However, some individual samplescarried an opposite polarity magnetization of east andshallow direction.
In stepwise demagnetization (Fig. 3), a north-directed, present-day field viscous overprint was usu-ally removed by 300◦C. After removal of any PDFor recent overprint, most Galeros samples showed theisolation of a well-defined high unblocking tempera-ture (∼680◦C) component. The 16 sites that carrieda stable ChRM are well-grouped and have an accept-able within-site dispersion (Table 1). The remaining
five sites either did not carry a stable remanence di-rection, or yielded magnetizations of unacceptablyhigh dispersion at the site level.
The sites in Galeros Formation strata were dis-tributed throughout both limbs of the Chuar syncline,whose north-trending fold axis provided an ideal foldtest given the general orientation of the ChRM inthese rocks. The in-situ site mean magnetizations haveinclinations that range from+60 to −30◦, and upontilt correction have a much more clustered range. In-cremental unfolding yields a maximum kappa value(κ = 20) at 100% unfolding (Fig. 6a). This resultis interpreted as a pre-folding magnetization. To testthe robustness of the incremental fold test a para-metric bootstrap fold test was applied (Tauxe, 1998),which gives a similar result of maximum clusteringat ∼100% unfolding (Fig. 6b).
The mean paleopole of the Galeros Formation, de-termined by giving unit weight to each of the 16 sitesis 2◦S, 163◦E (dp= 4.3; dm= 8.5) (Table 2).
80 A.B. Weil et al. / Precambrian Research 129 (2004) 71–92
Table 1Paleomagnetic site information and statistical parameters for the Chuar Group
Site number Strike Dip N/N0 In situ site mean Structurally correctedsite means
Dec Inc α95 κ Dec Inc
Kwagunt FormationWalcott member
AW-14-3a 261 2 0/7 – – – – – –JG-60-16a 81 6 0/8 – – – – – –JG-60-18 200 24 7/7 290 54 18 27 303 29JG-60-6 223 21 7/7 299 50 13 28 290 30
Awatubi memberAW-14-1a 159 35 0/8 – – – – – –AW-14-2a 175 29 0/7 – – – – – –JG-53-1a 144 23 0/7 – – – – – –JG-53-2 139 30 6/7 107 −31 11 76 98 −13
Carbon Butte memberT-52-1b 148 22 8/8 5 64 8 56T-65-1b 340 18 5/8 4 54 11 50T-65-2b 340 18 6/8 5 53 7 107JG-60-2b 195 30 6/8 0 61 6 122JG-60-3b 185 46 6/8 5 55 8 151JG-53-4b 155 29 6/8 13 57 10 51JG-53-5b 155 29 9/9 345 63 10 30AW-13-4 5 20 8/8 272 3 9 39 272 23AW-13-5b 45 22 8/8 6 51 7.8 61AW-12-10 313 14 6/8 88 −25 12 65 94 −34AW-12-11 332 21 6/8 103 −13 16 258 108 −28AW-12-12b 334 22 8/8 11 68 9 61AW-12-13 16 9 7/8 85 −28 21 20 83 −36AW-12-14A 341 21 6/8 92 −20 12 60 97 −39AW-12-14B 341 21 8/8 97 −19 12 39 103 −37
Galeros Formation
Duppa memberAW-12-16a 303 22 0/7 – – – – – –AW-12-17a 318 24 0/7 – – – – – –
Carbon Canyon memberAW-12-7a 168 53 0/8 – – – – – –AW-12-8 162 43 6/8 260 60 13 27 256 17AW-12-9 160 60 7/8 256 48 9 90 254 −11AW-12-15 303 12 7/8 277 31 15 24 285 35AW-12-18a 333 35 0/8 – – – – – –AW-12-19 310 39 7/7 299 −8 16 16 296 1AW-12-20 290 16 6/7 284 5 7 53 285 7AW-12-21a 255 15 0/8 – – – – – –AW-13-1 110 25 7/7 264 6 11 31 264 −5AW-13-2 105 20 7/7 264 18 15 16 259 10AW-13-3 85 20 7/8 254 26 14 21 245 22AW-13-6 35 30 7/8 241 −20 12 31 247 −5AW-13-7 37 29 6/7 260 −19 17 22 263 2AW-13-8 25 13 7/7 267 −2 14 24 267 10AW-13-9 30 30 6/7 252 −29 15 27 259 −7

A.B. Weil et al. / Precambrian Research 129 (2004) 71–92 81
Table 1 (Continued )
Site number Strike Dip N/N0 In situ site mean Structurally correctedsite means
Dec Inc α95 κ Dec Inc
AW-13-10 25 23 7/7 264 −6 14 25 263 13AW-13-11 30 30 7/8 263 −30 19 13 269 −5
Jupiter memberAW-12-22 287 17 8/8 268 −11 16 20 266 −5AW-12-23 75 1 8/8 270 3 6 112 272 5
N/N0 is ratio of samples used in the calculation of the site mean direction to the total number of samples collected and measured; strike/dip,dip direction is 90◦ clockwise from strike; Dec and Inc are declination and inclination of the site mean directions;α95 is semi angle ofthe cone of confidence about the site mean direction;κ is precision parameter (Fisher, 1953).
a Designates those sites that had no interpretable results.b Represents those sites in which all samples carry a stable PDF component upto 680◦C.
Fig. 6. (a) Incremental fold test for the Galeros Formation, plotting the kappa parameter (open circles) vs. percent unfolding (McElhinny,1964). Maximum kappa (κ = 23) reached at 100% unfolding. (b) Incremental parametric bootstrap fold test for the Galeros Formation(Tauxe, 1998). The τ1 parameter represents the largest eigenvalue of the orientation matrices from representative para-data sets. Histogramrepresents 500 maxima ofτ1 with their respective fraction of maximum given by the right-hand side ordinate axis. Calculated 95%confidence interval is between 77 and 132% unfolding.

82 A.B. Weil et al. / Precambrian Research 129 (2004) 71–92
Table 2Paleomagnetic site information for the Chuar Group, Grand Canyon Supergroup, Arizona
Pole location Approximateage (Ma)
N/N0
sitesIn situ Structurally corrected Plong. PLat. dp dm
Dec Inc α95 κ Dec Inc α95 κ
Chuar GroupKwagunt Formation 740 9/23 278.0 27.3 12.2 18.6 280.8 30.6 8.4 38.6 166 18.2 5.2 9.4Galeros Formation 800 16/21 265.7 4.0 14.0 7.9 265.5 5.1 8.5 19.8 163−2.1 4.3 8.5
N/N0 is ratio of sites used in the calculation of the grand mean direction to the total number of sites collected and measured; Dec andInc are declination and inclination of the mean paleomagnetic directions;α95 is semi-angle of the cone of confidence about the meandirection; Plong. and Plat. are the latitude and longitude of the mean paleomagnetic pole; dp/dm are the semi-axes of the cone of 95%confidence about the pole; the value of the paleomagnetic pole in the table is based on the tilt corrected site mean directions.
4.2. Kwagunt Formation
Intensities of natural remanent magnetizations(NRM) for Kwagunt Formation samples were similar
Fig. 7. (a) Incremental fold test for the Kwagunt Formation, plotting the kappa parameter (open circles) vs. percent unfolding (McElhinny,1964). Maximum kappa (κ = 44) reached at 80% unfolding. (b) Incremental parametric bootstrap fold test for the Kwagunt Formation(Tauxe, 1998). The τ1 parameter represents the largest eigenvalue of the orientation matrices from representative para-data sets. Histogramrepresents 500 maxima ofτ1 with their respective fraction of maximum given by the right-hand side ordinate axis. Calculated 95%confidence interval is between 52 and 107% unfolding.
to those of the Galeros Formation samples with valuesranging from 0.1 to 30.0 mA/m. Most of the Kwa-gunt samples had discrete unblocking temperaturesbetween 650 and 680◦C, also indicating hematite
A.B. Weil et al. / Precambrian Research 129 (2004) 71–92 83
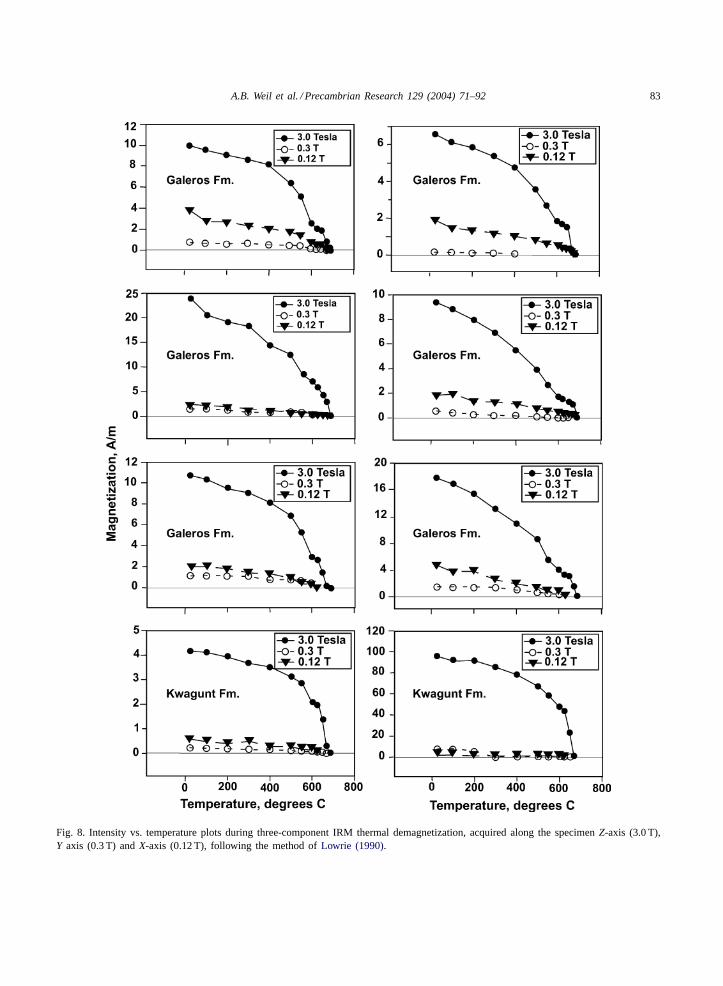
Fig. 8. Intensity vs. temperature plots during three-component IRM thermal demagnetization, acquired along the specimenZ-axis (3.0 T),Y axis (0.3 T) andX-axis (0.12 T), following the method ofLowrie (1990).
84 A.B. Weil et al. / Precambrian Research 129 (2004) 71–92
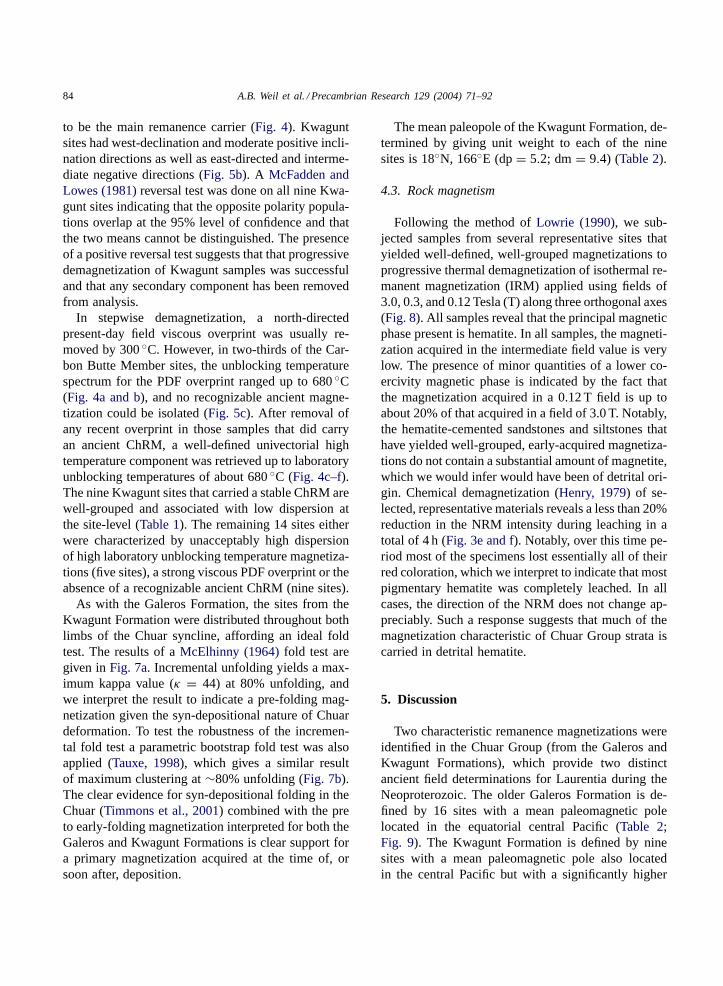
to be the main remanence carrier (Fig. 4). Kwaguntsites had west-declination and moderate positive incli-nation directions as well as east-directed and interme-diate negative directions (Fig. 5b). A McFadden andLowes (1981)reversal test was done on all nine Kwa-gunt sites indicating that the opposite polarity popula-tions overlap at the 95% level of confidence and thatthe two means cannot be distinguished. The presenceof a positive reversal test suggests that that progressivedemagnetization of Kwagunt samples was successfuland that any secondary component has been removedfrom analysis.
In stepwise demagnetization, a north-directedpresent-day field viscous overprint was usually re-moved by 300◦C. However, in two-thirds of the Car-bon Butte Member sites, the unblocking temperaturespectrum for the PDF overprint ranged up to 680◦C(Fig. 4a and b), and no recognizable ancient magne-tization could be isolated (Fig. 5c). After removal ofany recent overprint in those samples that did carryan ancient ChRM, a well-defined univectorial hightemperature component was retrieved up to laboratoryunblocking temperatures of about 680◦C (Fig. 4c–f).The nine Kwagunt sites that carried a stable ChRM arewell-grouped and associated with low dispersion atthe site-level (Table 1). The remaining 14 sites eitherwere characterized by unacceptably high dispersionof high laboratory unblocking temperature magnetiza-tions (five sites), a strong viscous PDF overprint or theabsence of a recognizable ancient ChRM (nine sites).
As with the Galeros Formation, the sites from theKwagunt Formation were distributed throughout bothlimbs of the Chuar syncline, affording an ideal foldtest. The results of aMcElhinny (1964)fold test aregiven inFig. 7a. Incremental unfolding yields a max-imum kappa value (κ = 44) at 80% unfolding, andwe interpret the result to indicate a pre-folding mag-netization given the syn-depositional nature of Chuardeformation. To test the robustness of the incremen-tal fold test a parametric bootstrap fold test was alsoapplied (Tauxe, 1998), which gives a similar resultof maximum clustering at∼80% unfolding (Fig. 7b).The clear evidence for syn-depositional folding in theChuar (Timmons et al., 2001) combined with the preto early-folding magnetization interpreted for both theGaleros and Kwagunt Formations is clear support fora primary magnetization acquired at the time of, orsoon after, deposition.
The mean paleopole of the Kwagunt Formation, de-termined by giving unit weight to each of the ninesites is 18◦N, 166◦E (dp= 5.2; dm= 9.4) (Table 2).
4.3. Rock magnetism
Following the method ofLowrie (1990), we sub-jected samples from several representative sites thatyielded well-defined, well-grouped magnetizations toprogressive thermal demagnetization of isothermal re-manent magnetization (IRM) applied using fields of3.0, 0.3, and 0.12 Tesla (T) along three orthogonal axes(Fig. 8). All samples reveal that the principal magneticphase present is hematite. In all samples, the magneti-zation acquired in the intermediate field value is verylow. The presence of minor quantities of a lower co-ercivity magnetic phase is indicated by the fact thatthe magnetization acquired in a 0.12 T field is up toabout 20% of that acquired in a field of 3.0 T. Notably,the hematite-cemented sandstones and siltstones thathave yielded well-grouped, early-acquired magnetiza-tions do not contain a substantial amount of magnetite,which we would infer would have been of detrital ori-gin. Chemical demagnetization (Henry, 1979) of se-lected, representative materials reveals a less than 20%reduction in the NRM intensity during leaching in atotal of 4 h (Fig. 3e and f). Notably, over this time pe-riod most of the specimens lost essentially all of theirred coloration, which we interpret to indicate that mostpigmentary hematite was completely leached. In allcases, the direction of the NRM does not change ap-preciably. Such a response suggests that much of themagnetization characteristic of Chuar Group strata iscarried in detrital hematite.
5. Discussion
Two characteristic remanence magnetizations wereidentified in the Chuar Group (from the Galeros andKwagunt Formations), which provide two distinctancient field determinations for Laurentia during theNeoproterozoic. The older Galeros Formation is de-fined by 16 sites with a mean paleomagnetic polelocated in the equatorial central Pacific (Table 2;Fig. 9). The Kwagunt Formation is defined by ninesites with a mean paleomagnetic pole also locatedin the central Pacific but with a significantly higher
A.B. Weil et al. / Precambrian Research 129 (2004) 71–92 85
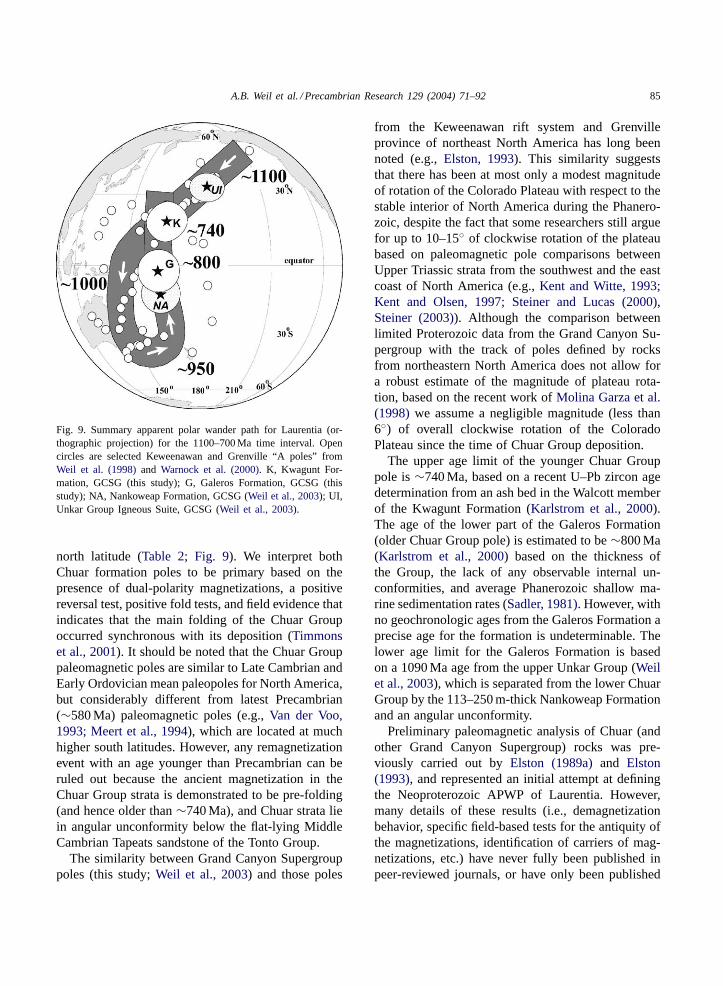
Fig. 9. Summary apparent polar wander path for Laurentia (or-thographic projection) for the 1100–700 Ma time interval. Opencircles are selected Keweenawan and Grenville “A poles” fromWeil et al. (1998)and Warnock et al. (2000). K, Kwagunt For-mation, GCSG (this study); G, Galeros Formation, GCSG (thisstudy); NA, Nankoweap Formation, GCSG (Weil et al., 2003); UI,Unkar Group Igneous Suite, GCSG (Weil et al., 2003).
north latitude (Table 2; Fig. 9). We interpret bothChuar formation poles to be primary based on thepresence of dual-polarity magnetizations, a positivereversal test, positive fold tests, and field evidence thatindicates that the main folding of the Chuar Groupoccurred synchronous with its deposition (Timmonset al., 2001). It should be noted that the Chuar Grouppaleomagnetic poles are similar to Late Cambrian andEarly Ordovician mean paleopoles for North America,but considerably different from latest Precambrian(∼580 Ma) paleomagnetic poles (e.g.,Van der Voo,1993; Meert et al., 1994), which are located at muchhigher south latitudes. However, any remagnetizationevent with an age younger than Precambrian can beruled out because the ancient magnetization in theChuar Group strata is demonstrated to be pre-folding(and hence older than∼740 Ma), and Chuar strata liein angular unconformity below the flat-lying MiddleCambrian Tapeats sandstone of the Tonto Group.
The similarity between Grand Canyon Supergrouppoles (this study;Weil et al., 2003) and those poles
from the Keweenawan rift system and Grenvilleprovince of northeast North America has long beennoted (e.g.,Elston, 1993). This similarity suggeststhat there has been at most only a modest magnitudeof rotation of the Colorado Plateau with respect to thestable interior of North America during the Phanero-zoic, despite the fact that some researchers still arguefor up to 10–15◦ of clockwise rotation of the plateaubased on paleomagnetic pole comparisons betweenUpper Triassic strata from the southwest and the eastcoast of North America (e.g.,Kent and Witte, 1993;Kent and Olsen, 1997; Steiner and Lucas (2000),Steiner (2003)). Although the comparison betweenlimited Proterozoic data from the Grand Canyon Su-pergroup with the track of poles defined by rocksfrom northeastern North America does not allow fora robust estimate of the magnitude of plateau rota-tion, based on the recent work ofMolina Garza et al.(1998) we assume a negligible magnitude (less than6◦) of overall clockwise rotation of the ColoradoPlateau since the time of Chuar Group deposition.
The upper age limit of the younger Chuar Grouppole is∼740 Ma, based on a recent U–Pb zircon agedetermination from an ash bed in the Walcott memberof the Kwagunt Formation (Karlstrom et al., 2000).The age of the lower part of the Galeros Formation(older Chuar Group pole) is estimated to be∼800 Ma(Karlstrom et al., 2000) based on the thickness ofthe Group, the lack of any observable internal un-conformities, and average Phanerozoic shallow ma-rine sedimentation rates (Sadler, 1981). However, withno geochronologic ages from the Galeros Formation aprecise age for the formation is undeterminable. Thelower age limit for the Galeros Formation is basedon a 1090 Ma age from the upper Unkar Group (Weilet al., 2003), which is separated from the lower ChuarGroup by the 113–250 m-thick Nankoweap Formationand an angular unconformity.
Preliminary paleomagnetic analysis of Chuar (andother Grand Canyon Supergroup) rocks was pre-viously carried out byElston (1989a)and Elston(1993), and represented an initial attempt at definingthe Neoproterozoic APWP of Laurentia. However,many details of these results (i.e., demagnetizationbehavior, specific field-based tests for the antiquity ofthe magnetizations, identification of carriers of mag-netizations, etc.) have never fully been published inpeer-reviewed journals, or have only been published
86 A.B. Weil et al. / Precambrian Research 129 (2004) 71–92
in abstract form (Elston, 1986), in field guides (Elston,1989b), or simply as a compilation of data, with littleexplanation (Elston, 1993; Elston et al., 2002). Com-parison of results from this study with a recent tableof poles published byElston et al. (2002, their Ta-ble 4) reveals a significant difference in paleolatitudebetween the two datasets. The results compiled byElston et al. (2002)show a consistent south-directedoffset compared to the results presented here (about16◦ for the Kwagunt Formation and about 10◦ forthe Galeros Formation). Because only pole positionswere reported it is impossible to determine the sourceof the discrepancy between the two datasets.
5.1. Laurentia’s APWP
The time progression of paleopoles that defineLaurentia’s APWP for the 1000–700 Ma time intervalhas remained ambiguous and has generated consid-erable debate over the past few decades. Althoughmost researchers agree that the Grenville section ofLaurentia’s APWP loops down (southward) throughthe southwest Pacific quadrant (Fig. 9), both the ge-ometry and age progression of the path are controver-sial because of the high degree of age uncertainty forspecific results (Weil et al., 1998; Walderhaug et al.,1999). This uncertainty is based in large part on thefact that most of the Grenville Province paleomag-netic data have come from metamorphic rocks, andtherefore the timing of magnetization acquisition canbe ambiguous (Warnock et al., 2000). The temporalambiguity of paleomagnetic poles from the Grenvillesection of Laurentia’s APWP has produced two dis-parate proposals regarding the path’s geometry anddirection of younging: (1) a clockwise loop (Fig. 10a)(McWilliams and Dunlop, 1978; Berger et al., 1979;Hyodo and Dunlop, 1993; Alvarez and Dunlop, 1998)and (2) a counterclockwise loop (Fig. 10b and c) (Weilet al., 1998; Warnock et al., 2000). These conflictingAPWP have major implications and consequences forhow paleomagnetic-based configurations for Rodiniaare constructed. The number of well-dated robustpaleomagnetic data for the relevant time period issmall; using only key poles, it is nearly impossibleto base reconstructions on the few results from agiven continent for the purposes of paleogeography(Fig. 10d) (Buchan et al., 2001). However, if severalhigh-quality poles are available for a given pair of
continents, and a clearly defined APWP path can begenerated for each block, then APWP geometry be-comes a useful tool for generating relative continentalreconstructions (Weil et al., 1998). Consequently, itis imperative that the correct time progression andgeometry of Laurentia’s APWP be known before fur-ther speculation is made on the paleogeography ofthe Rodinia supercontinent during its lifecycle andultimately during its rift-to-drift history.
Sampling multiple horizons of Galeros and Kwa-gunt strata within the Chuar Group has provided twowell-defined paleomagnetic poles for this critical inter-val of time during the Neoproterozoic, between about800 and 740 Ma. Because of the sedimentary nature ofthe Chuar Group, the sequence of poles obtained, as-suming a primary acquisition, provides a relative ageprogression for a part of Laurentia’s APWP (Fig. 9).Utilizing recent paleomagnetic results from the south-west US (Weil et al., 2003) and other North Amer-ican Proterozoic results (summarized inWeil et al.,1998), we argue that the most internally consistentexplanation for the data is a tight counterclockwiseAPWP loop that passes down through the south Pa-cific (Fig. 9). It should be noted that this preferredcounterclockwise path is specifically dependent on theages of the poles chosen for the Laurentian APWPfor the interval from 1000 to 950 Ma. These poles arefrom the Grenville metamorphic rocks in Ontario, forwhich ages have been interpolated from regional cool-ing ages (Cosca et al., 1991, 1992, 1995; Busch et al.,1996).
5.2. Paleogeography and Rodinia
The break-up history of Rodinia is not well under-stood due to the paucity of well-dated Neoproterozoicpaleomagnetic poles. What we do know is that Lau-rentia and Baltica drifted into high southern latitudesby the latest Precambrian (Torsvik et al., 1996), andthat the Laurentian Iapetus rift margin formed betweenLaurentia, West Gondwana and Baltica by ca. 580 Ma(Cawood et al., 2001). Furthermore, it is now ac-cepted that the final assembly of Gondwana occurredat ca. 560 Ma with the collision of the West Gond-wana cratons, the Arabian–Nubian Shield, Madagas-car, Australia, Antarctica and India (e.g.,Meert andPowell, 2001; Meert, 2001). Meert (2003)provides athorough review of the events related to the assembly

A.B. Weil et al. / Precambrian Research 129 (2004) 71–92 87
Fig. 10. Several previously proposed Proterozoic APWPs for Laurentia. (a) Clockwise loop (dark grey path) based on Grenville polesused byHyodo and Dunlop (1993)and Costanzo and Dunlop (1998). Also shown is a similar clockwise APWP proposed byRoy (1983)(medium grey). (b) Counterclockwise loop for the 1100–800 Ma time interval based on similarities between Grenville and Keweenawanpaleopoles from North America with similar aged poles from Baltica (Weil et al., 1998). (c) Keweenawan and Grenville “A poles” used byWarnock et al. (2000). (d) Key paleopoles for Laurentia for part of the 1200–500 Ma period as proposed byBuchan et al. (2001)(arrowrepresents well-defined Keweenawan track).
of Eastern Gondwana. We still do not know the ex-act timing of Rodinia’s breakup, especially along theCordilleran margin of Laurentia; what blocks actuallyrifted and drifted away and from where; and whetheror not the rifted blocks behaved as a coherent, largecontinental mass (i.e., East Gondwana) or as a se-ries of smaller, independent fragments (e.g., separateAustralia, India, South China, and Seychelles blocks).
To date, high-quality paleomagnetic results havebeen determined for about 750 Ma for the Australiancraton (Wingate and Giddings, 2000), the South Chinablock (Evans et al., 2000), the India subcontinent(Torsvik et al., 2001a), and the Seychelles microcon-tinent (Torsvik et al., 2001b). However, there are norobust well-dated paleomagnetic data for this timeperiod from Antarctica, Siberia, Madagascar, or any
88 A.B. Weil et al. / Precambrian Research 129 (2004) 71–92
of the West Gondwana blocks (Amazonia, Rio de laPlata, West Africa, Congo, Sao Francisco, or Kalaharicratons) (Torsvik et al., 2001a). The new results fromthe East Gondwana blocks (Australia, India, and theSeychelles blocks) and South China have spawnedrenewed debate as to the configuration of western(in North American coordinates) Rodinia prior to itsbreakup. Previously, the SWEAT (Southwest UnitedStates—East Antarctica) hypothesis, which placedthe western margin of Laurentia against East Antarc-tica (Moores, 1991), had been the preferred recon-struction. Other researchers have recently argued fora more southerly position for the East Gondwana
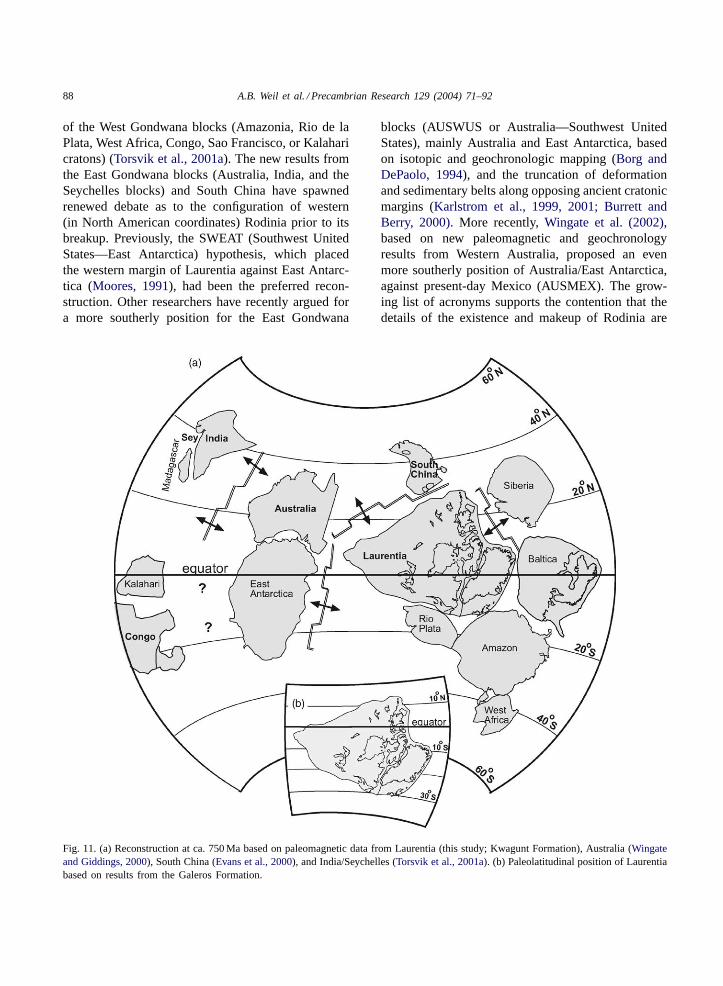
Fig. 11. (a) Reconstruction at ca. 750 Ma based on paleomagnetic data from Laurentia (this study; Kwagunt Formation), Australia (Wingateand Giddings, 2000), South China (Evans et al., 2000), and India/Seychelles (Torsvik et al., 2001a). (b) Paleolatitudinal position of Laurentiabased on results from the Galeros Formation.
blocks (AUSWUS or Australia—Southwest UnitedStates), mainly Australia and East Antarctica, basedon isotopic and geochronologic mapping (Borg andDePaolo, 1994), and the truncation of deformationand sedimentary belts along opposing ancient cratonicmargins (Karlstrom et al., 1999, 2001; Burrett andBerry, 2000). More recently,Wingate et al. (2002),based on new paleomagnetic and geochronologyresults from Western Australia, proposed an evenmore southerly position of Australia/East Antarctica,against present-day Mexico (AUSMEX). The grow-ing list of acronyms supports the contention that thedetails of the existence and makeup of Rodinia are

A.B. Weil et al. / Precambrian Research 129 (2004) 71–92 89
still unclear and in dire need of more well-dated pa-leomagnetic results.
In both the SWEAT and AUSWUS fits, the relativeconfiguration of East Gondwana is the same, as it istreated as a coherent block. However, the new EastGondwana results require a drastically different recon-struction subsequent to rifting between Australia-EastAntarctica and the India/Madagascar/Seychelles con-tinent (Torsvik et al., 2001b; Torsvik, 2003). The datafrom Australia (Mundine Well Dike Swarm;Wingateand Giddings, 2000), India (Torsvik et al., 2001a),and the Seychelles microcontinent (Torsvik et al.,2001b) for ∼755 Ma are not consistent with eitherthe SWEAT or the AUSWUS connection and indicatethat Australia, and consequently whatever cratonswere outboard of Australia, had already completedthe rift-to-drift transition from Laurentia by∼755 Ma.
When the new paleomagnetic results from the ChuarGroup are compared with recent results from severalof the East Gondwana blocks and South China it isclear that regardless of the preferred Rodinia recon-struction (e.g., SWEAT, AUSWUS, AUSMEX, etc.)the present-day Cordilleran margin of Laurentia hadalready undergone its rift-to-drift transition from anopposing margin well before 750 Ma, because in a750 Ma reconstruction (Fig. 11) based on availablewell-dated paleomagnetic poles these continents arefar apart. Presently, a dearth of paleomagnetic datafor the major constituents of Rodinia at about 800 Maprevents any robust reconstruction for the Rodinia su-percontinent prior to its breakup.
6. Conclusions
Paleomagnetic results from the Chuar Group, GrandCanyon Supergroup, yield two primary paleomagneticpoles for Laurentia for the Neoproterozoic. The polepositions for the two Chuar Group formations, in com-bination with other recent Late Proterozoic paleomag-netic results, define a counterclockwise loop in theapparent polar wander path for North America in thesouth Pacific (Fig. 9). This is in contrast to recentlypublished clockwise APWP loops for Laurentia for the1100–700 Ma time interval. Furthermore, our data areof about the same age as recently published data fromEast Gondwana, which together suggest that drift-ing had begun between Laurentia and the East Gond-
wana block(s) well before 750 Ma. As a whole, theRodinia Supercontinent drifted northward from highsouthern latitudes to equatorial latitudes during the950–750 Ma time interval. This drift history positionedthe supercontinent at or near the equator between 800and 740 Ma, which does not contradict the hypothe-sized Sturtian aged snowball Earth event, the first ofseveral widespread glaciations in the Neoproterozoic(Hoffman et al., 1998). At the same time, extensioninitiated along the Cordilleran margin of Laurentia,represented by the deposition of the Chuar Group andpossibly the Pahrump and Uinta Mountain groups ofthe western U.S. This large-scale extensional eventculminated in the dispersal of Laurentia away fromthe East Gondwana blocks before∼750 Ma.
Acknowledgements
The following individuals assisted us in samplingin the Grand Canyon: Carol M. Dehler, Karl E. Karl-strom, and Susannah Porter. A special thanks goes to J.Michael Timmons who collected some of the samplesin the Carbon Butte Member. We also thank GrandCanyon National Park for our research agreement andsampling permit, which was granted to Karl E. Karl-strom. This study was supported by the National Sci-ence Foundation, Division of Earth Sciences, grantEAR-9706541 (to Karlstrom, Geissman, and M. El-rick), and a University of Michigan Scott Turner Fundgrant awarded to A. Weil. We thank Joe Meert for athorough review that proved valuable in improving thequality of the manuscript.
References
Alvarez, V.C., Dunlop, D.J., 1998. A regional paleomagnetic studyof lithotectonic domains in the Central Gneiss Belt, GrenvilleProvince. Ontario. Earth Planet. Sci. Lett. 157, 103.
Bell, R.T., Jefferson, C.W., 1987. A hypothesis for anAustralian–Canadian connection in the late Proterozoic andthe birth of the Pacific Ocean. In: Edward, B. (Convener),Proceedings of the Pacific Rim Congress’87: An InternationalCongress on the Geology, Structure, Materialization andEconomics of the Pacific Rim. pp. 39–50.
Berger, G.W., York, D., Dunlop, D.J., 1979. Calibration ofGrenvillian paleopoles by40Ar/39Ar dating. Nature 277, 46–48.
Bond, G.C., Kominz, M.A., 1984. Construction of tectonicsubsidence curves for the early Paleozoic miogeocline, southern

90 A.B. Weil et al. / Precambrian Research 129 (2004) 71–92
Canadian Rocky Mountains: implications for subsidencemechanisms, age of break-up, and crustal thinning. Geol. Soc.Am. Bull. 95, 155–173.
Bond, G.C., Nickeson, P.A., Kominz, M.A., 1984. Breakup of asupercontinent between 625 and 555 Ma: new evidence andimplications for continental histories. Earth Planet. Sci. Lett.70, 325–345.
Borg, S.G., DePaolo, D.J., 1994. Laurentia, Australia, andAntarctica as a Late Proterozoic supercontinent: constraintsfrom isotopic mapping. Geology 22, 307–310.
Buchan, K.L., Ernst, R.E., Hamilton, M.A., Mertanen, S., Pesonen,L.J., Elming, S., 2001. Rodinia: the evidence from integratedpalaeomagnetism and U–Pb geochronology. Precambrian Res.110, 9–32.
Burrett, C., Berry, R., 2000. Proterozoic Australia–western US(AUSWUS) fit between Laurentia and Australia. Geology 28,103–106.
Busch, J.P., van der Pluijm, B.A., Hall, C.M., Essene, E.J.L.,1996. Normal faulting revealed by40Ar/39Ar thermochronologynear the Robertson Lake shear zone, Grenville orogen, Canada.Tectonics 15, 387–402.
Cawood, P.A., McCausland, P.J.A., Dunning, G.R., 2001.Opening Iapetus: constraints from the Laurentian margin inNewfoundland. Geol. Soc. Am. Bull. 113, 443–452.
Cosca, M.A., Sutter, J.F., Essene, E.J., 1991. Cooling andinferred uplift/erosion history of the Grenville orogen Ontario:constraints from40Ar/39Ar thermochronology. Tectonics 10,959–977.
Cosca, M.A., Essene, E.J., Kunk, M.J., Sutter, J.F., 1992.Differential unroofing within the Central Metasedimentarybelt of the Grenville orogen: constraints form40Ar/39Arthermochronology. Contrib. Mineral Petrolol. 110, 211–225.
Cosca, M.A., Essene, E.J., Mezger, K., van der Pluijm, B.A., 1995.Constraints on the duration of tectonic processes: protractedextension and deep-crustal rotation in the Grenville orogen.Geology 23, 361–364.
Costanzo, A.V., Dunlop, D.J., 1998. A regional paleomagneticstudy of lithotectonic domains in the Central Gneiss Belt,Grenville Province, Ontario. Earth Planet. Sci. Lett. 157, 89–103.
Cook, D.A., 1991. Sedimentary and shale petrology of theupper Proterozoic Walcott Member, Kwagunt Formation, ChuarGroup, Grand Canyon, Arizona. Masters Thesis, Flagstaff,Northern Arizona University, Arizona, 128 pp.
Dalziel, I.W.D., 1997. Neoproterozoic–Paleozoic paleogeographyand tectonics: review, hypothesis, and environmental specu-lation. Geol. Soc. Am. Bull. 109, 16–42.
Dalziel, I.W.D., 1991. Pacific margins of Laurentia and EastAntarctica–Australia as a conjugate rift pair: evidence andimplications for an Eocambrian supercontinent. Geology 19,598–601.
Dehler, C.M., Des Marais, D.J., Bowring, S., Sharp, Z., Kalrstrom,K.E., Elrick, M., 1999. Chuar Group (1.1–0.74) Ga, GrandCanyon: carbon-isotope systematics at the onset of Sturtianglaciation. Geol. Soc. Am. Abst. Prog. 31, A-487.
Dehler, C.M., Elrick, M., Karlstrom, K.E., Smith, G.A., Crossey,L.J., Timmons, J.M., 2001a. Neoproterozoic Chuar Group(∼800–742 Ma), Grand Canyon: a record of cyclic marine
deposition during global cooling and supercontinent rifting.Sedimentary Geol. 141–142, 465–499.
Dehler, C.M., Prave, A., Crossey, L.J., Karlstrom, K.E., 2001b.Linking Mid-Neoproterozoic successions in the western UnitedStates: The Chuar Group–Uinta Mountain Group–PahrumpGroup connection (CHUMP). Geol. Soc. Am. Abstr. Prog. 33,A20–A21.
Elston, D.P., 1986. Magnetostratigraphy of Late Proterozoic ChuarGroup and Sixtymile Formation, Grand Canyon Supergroup,northern Arizona; correlation with other Proterozoic strata ofNorth America. Geol. Soc. Am. Abstr. Prog. 18 (5), 353.
Elston, D.P., 1989a. Grand Canyon Supergroup, northernArizona; stratigraphic summary and preliminary paleomagneticcorrelations with parts of other North American Proterozoicsuccessions. In: Jenney, J.P., Reynolds, S.J. (Eds.), GeologicEvolution of Arizona, Arizona Geological Society Digest, vol.17. pp. 259–272.
Elston, D.P., 1989b. Middle and Late Proterozoic Grand CanyonSupergroup. In: Elston, D.P., Billingsley, G.H., Young, R.A.(Eds.), Proceedings of the 28th International GeologicalCongress, Field Trip Guidebook T115/315: Geology of GrandCanyon, Northern Arizona. American Geophysical Union,Washington, DC, Chapter 9, pp. 94–105.
Elston, D.P., 1993. Middle and Early–Late Proterozoic GrandCanyon Supergroup, northern Arizona. In: Reed, J.C., Bickford,M.E., Houston, R.S., Link, P.K., Rankin, D.W., Sims, P.K.,Van Schumus, W.R. (Eds.), Precambrian, Conterminous U.S.:Boulder, Colorado, Geological Society of America, Geology ofNorth America, vol. C-2. pp. 521–529.
Elston, D.P., McKee, E.H., 1982. Age and correlation of theProterozoic Grand Canyon disturbance, northern Arizona. Geol.Soc. Am. Bull. 93, 681–699.
Elston, D.P., Enkin, R.J., Baker, J., Kisilevsky, D.K., 2002.Tightening the belt: paleomagnetic–stratigraphic constraintson deposition, correlation, and deformation of the MiddleProterozoic (ca. 1.4 Ga) Belt-Purcell Supergroup, United Statesand Canada. Geol. Soc. Am. Bull. 114 (5), 619–638.
Evans, D.A.D., Li, Z.X., Kirschvink, J.L., Wingate, M.T.D., 2000.A high-quality mid-Neoproterozoic paleomagnetic pole fromSouth China, with implications for ice ages and the breakupconfiguration of Rodinia. Precambrian Res. 100, 313–334.
Fisher, R.A., 1953. Dispersion on a sphere. Proc. R. Soc. LondonA 217, 295–305.
Ford, T.D., Breed, W.J., 1973. Late Precambrian Chuar Group,Grand Canyon, Arizona. Geol. Soc. Am. Bull. 84, 1243–1260.
Halls, H.C., Pesonen, L.J., 1982. Paleomagnetism of Keweenawanrocks. Geol. Soc. Am. Memoir 156, 173–201.
Harland, W.B., 1964. Evidence of late Precambrian glaciationand its significance. In: Nairn, A.E.M. (Eds.), Problems inPalaeoclimatology. pp. 119–149.
Hartz, E.H., Torsvik, T.H., 2002. Baltica upside down: a new platetectonic model for Rodinia and the Iapetus Ocean. Geology 30,255–258.
Henry, S., 1979. Chemical demagnetization-methods, procedures,and applications through vector analysis. Can. J. Earth Sci.16 (9), 1832–1841.
Hoffman, P.F., 1991. Did the breakout of Laurentia turn Gondwanainside out? Science 252, 1409–1412.

A.B. Weil et al. / Precambrian Research 129 (2004) 71–92 91
Hoffman, P.F., Kaufman, A.J., Halverson, G.P., Schrag, D.P., 1998.A Neoproterozoic snowball Earth. Science 281, 1342–1346.
Hoffman, P.F., 1999. The breakup of Rodinia, birth of Gondwana,true polar wander, and the snowball Earth. J. Afr. Earth Sci.28, 9–26.
Hoffman, P.F., Schrag, D.P., 2002. The snowball Earth hypothesis:testing the limits of global change. Terra Nova 14, 129–155.
Hyodo, H., Dunlop, D.J., 1993. Effect of anisotropy on thepaleomagnetic contact test for a Grenville dike. J. Geophys.Res. 98 (B5), 7997–8017.
Karlstrom, K.E., Williams, M.L., McLelland, J., Geissman, J.W.,Ahall, K., 1999. Refining Rodinia: geologic evidence for theAustralia–western U.S. connection in the Proterozoic. GSAToday 9, 1–7.
Karlstrom, E., Bowring, S.A., Dehler, C.M., Knoll, A.H., Porter,S.M., Sharp, Z., Des Marais, D.J., Weil, A.B., Geissman, J.W.,Elrick, M., Timmons, M.J., Keefe, K., Crossey, L.J., 2000.The Chuar Group of the Grand Canyon: Record of break upof Rodinia, associated change in the global carbon cycle, andeukaryotic diversification by 740 Ma. Geology 28, 619–622.
Karlstrom, K.E., Ahall, K.-I., Harlan, S.S., Williams, M.L.,McLelland, J., Geissman, J.W., 2001. Long-lived (1.8–0.8 Ga)Cordilleran type orogen in southern Laurentia, its extensionsto Australia and Baltica, and implications for refining Rodinia.Precambrian Res. 111, 5–30.
Kent, D.V., Olsen, P.E., 1997. Paleomagnetism of continentalsediments of Late Triassic age from Dan River-Danville RiftBasin (eastern North America). Geol. Soc. Am. Bull. 109, 366–379.
Kent, D.V., Witte, W.K., 1993. Slow apparent polar wander forNorth America in the Late Triassic and large Colorado plateaurotation. Tectonics 12, 291–300.
Kirschvink, J.L., 1980. The least-squares line and plane and theanalysis of paleomagnetic data. Geophys. J. R. Astronom. Soc.62, 699–718.
Kirschvink, J.L., 1992. Late Proterozoic low-latitude globalglaciation: the Snowball Earth. In: Schopf, J.W., Klein, C.(Eds.), The Proterozoic Biosphere. Cambridge University Press,Cambridge, pp. 51–52.
Li, Z.X., Zhang, L., Powell, C.M., 1996. Positions of the EastAsian cratons in the Neoproterozoic supercontinent Rodinia. In:Li, Z.X., Metcalfe, I. Powell, C.M. (Eds.), Breakup of Rodiniaand Gondwanaland and assembly of Asia; Aust. J. Earth Sci.43, 593–604.
Lindsay, J.F., Korsch, R.J., Wilford, J.R., 1987. Timing the breakupof a Proterozoic supercontinent; evidence from Australianintracratonic basins. Geology 15 (11), 1061–1064.
Lowrie, W., 1990. Identification of ferromagnetic minerals in a rockby coercivity and unblocking temperature properties. Geophys.Res. Lett. 17, 159–162.
McElhinny, M.W., 1964. Statistical significance of the fold test inpaleomagnetism. Geophys. J. R. Astronom. Soc. 8, 338–340.
McFadden, P.L., Lowes, F.J., 1981. The discrimination of meandirections drawn from Fisher distributions. Geophys. J. R.Astronom. Soc. 67, 19–33.
McWilliams, M.O., Dunlop, D.J., 1978. Grenville paleomagnetismand tectonics. Can. J. Earth Sci. 15, 687–695.
Meert, J.G., 2001. Growing Gondwana and rethinking Rodinia: apaleomagnetic perspective. Gondwana Res. 4, 279–288.
Meert, J.G., 2003. A synopsis of events related to the assemblyof eastern Gondwana. Tectonophysics 362, 1–40.
Meert, J.G., Van der Voo, R., Payne, T.W., 1994. Paleomagnetismof the Catoctin volcanic province a new Vendian–Cambrianapparent polar wander path for North America. J. Geophys.Res. B (99), 4625–4641.
Meert, J.G., Van der Voo, R., Ayub, S., 1995. Paleomagneticinvestigation of the Neoproterozoic Gagwe lavas and Mbozicomplex, Tanzania and the assembly of Gondwana. PrecambrianRes. 74, 225–244.
Meert, J.G., Van der Voo, R., 1996. Paleomagnetic and40Ar/39Arstudy of the Sinyai Dolerite, Kenya; implications for Gondwanaassembly. J. Geol. 104, 131–142.
Meert, J.G., Powell, C.M., 2001. Editorial: assembly and break-upof Rodinia: introduction to the special volume. PrecambrianRes. 110, 1–8.
Molina Garza, R.S., Acton, G.D., Grissman, J.W., 1998. Carboni-ferous through Jurassic paleomagnetic data and their bearingon rotation of the Colorado plateau. J. Geophys. Res. 103,24179–24188.
Moores, E.M., 1991. Southwest U.S.–East Antarctica (SWEAT)connection: a hypothesis. Geology 19, 425–428.
Park, J.K., Aitken, J.D., 1986. Paleomagnetism of the LateProterozoic Tsezotene Formation of Northwestern Canada. J.Geophys. Res. Solid Earth Planets 91 (B5), 4955–4970.
Piper, J.D.A., 1982. The Precambrian paleomagnetic record: thecase for the Proterozoic supercontinent. Earth Planet. Sci. Lett.59, 61–89.
Porter, S., Knoll, A.H., 2000. Testate amoebae in the Neopro-terozoic Era: evidence from vase-shaped microfossils in theChuar Group, Grand Canyon. Paleobiology 26, 345–370.
Powell, C.M., Li, Z.X., McElhinny, M.W., Meert, J.G., Park,J.K., 1993. Paleomagnetic constraints on timing of theNeoproterozoic breakup of Rodinia and the Cambrian formationof Gondwana. Geology 21, 889–892.
Powell, C., Preiss, W.V., Gatehouse, C.G., Krapez, B., Li, Z.X.,1994. South Australian record of a Rodinian epicontinentalbasin and its mid-Neoproterozoic breakup (∼700 Ma) to formthe Palaeo-Pacific Ocean. Tectonophysics 237, 113–140.
Reynolds, M.W., Palaces, J.G., Elston, D.P., 1988. Potentialpetroleum source rocks in the late Proterozoic Chuar GroupGrand Canyon, Arizona. USGS Circular 1025, 49–50.
Roy, J.L., 1983. Paleomagnetism of the North AmericanPrecambrian: a look at the data base. Precambrian Res. 19,319–348.
Sadler, P.M., 1981. Sediment accumulation rates and thecompleteness of stratigraphic sections. J. Geol. 89, 569–584.
Sears, J.W., 1990. Geologic structure of the Grand CanyonSupergroup. In: Beus, S.S., Morales, M. (Eds.), Grand CanyonGeology. Oxford University Press, New York, pp. 71–82.
Steiner, M.B., 2003. A Cratonic Middle Jurassic Paleopole:Callovian-Oxfordian stillstand (J-2 Cusp), Rotation of theColorado Plateau, and Jurassic North American Apparent PolarWander: Tectonics, vol. 22. p. 10.1029/2001TC001284.
Steiner, M.B., Lucas, S.G., 2000. Paleomagnetism of the LateTriassic Petrified Forest Formation, Chinle Group, western

92 A.B. Weil et al. / Precambrian Research 129 (2004) 71–92
United States: further evidence of “large” rotation of theColorado Plateau. J. Geophys. Res. 105, 25791–25808.
Stern, R.J., 1994. Arc-assembly and continental collision in theNeoproterozoic East African Orogen, implications for theconsolidation of Gondwanaland. Annu. Rev. Earth Planetar. Sci.22, 319–351.
Tauxe, L., 1998. Paleomagnetic Principles and Practice, ModernApproaches in Geophysics, vol. 17. Kluwer AcademicPublishers, London, 299 pp.
Timmons, J.M., Karlstrom, K.E., Dehler, C.M., Geissman, J.W.,Heizler, M.T., 2001. Proterozoic multistage (ca. 1.1 and 0.8 Ga)extension recorded in the Grand Canyon Supergroup andestablishment of northwest- and north-trending tectonic grainsin the southwestern United States. Geol. Soc. Am. Bull. 113,163–1800.
Torsvik, T.H., Smethurst, M.A., Meert, J.G., Van der Voo, R.,McKerrow, W.S., Braiser, M.D., Sturt, B.A., Walderhaug,H.J., 1996. Continental break-up in the Neoproterozoic andPaleozoic—a tale of Baltica and Laurentia. Earth-Sci. Rev. 40,229–258.
Torsvik, T.H., Carter, L.M., Ashwal, L.D., Bhushan, S.K., Pandit,M.K., Jamtveit, B., 2001a. Rodinia refined or obscured:palaeomagnetism of the Malani igneous suite (NW India).Precambrian Res. 108, 319–333.
Torsvik, T.H., Ashwal, L.D., Tucker, R.D., Eide, E.A., 2001b.Neoproterozoic geochronology and palaeogeography of theSeychelles microcontinent: the India link. Precambrian Res.110, 47–59.
Torsvik, T.H., 2003. The Rodinia jigsaw puzzle. Science 300,1379–1381.
Van der Voo, R., 1993. Paleomagnetism of the Atlantic, Tethysand Iapetus Oceans. Cambridge University Press, New York,411 pp.
Vidal, G., Knoll, A.H., 1983. Proterozoic plankton. Geol. Soc.Am. Memoir 161, 265–277.
Vidal, G., Ford, T.D., 1985. Microbiotas from the Late ProterozoicChuar Group (northern Arizona) and Uinta Mountain Group(Utah) and their chronostratigraphic implications. PrecambrianRes. 28, 349–389.
Walderhaug, H.J., Torsvik, T.H., Eide, A.E., Sundvoll, B.,Binger, B., 1999. Geochronology and palaeomagnetism ofthe Hunnedalen dykes, SW Norway: implications for theSveconorwegian apparent polar wander loop. Earth Planet. Sci.Lett. 169, 71–83.
Warnock, A.C., Kodama, K.P., Zeitler, P.K., 2000. Using thermo-chronology and low-temperature demagnetization to accuratelydate Precambrian poles. J. Geophys. Res. 105 (B8), 19,435–19,453.
Weil, A.B., Van der Voo, R., Mac Niocaill, C., Meert, G.M., 1998.The Proterozoic supercontinent Rodinia: Paleomagneticallyderived reconstructions for the 1,100 to 800 Ma interval. EarthPlanet. Sci. Lett. 154, 13–24.
Weil, A.B, Geissman, J., Heizler, M., Van der Voo, R.A.,2003. Paleomagnetic investigation of Middle Proterozoic maficintrusions and Upper Proterozoic redbeds from the Lower GrandCanyon Supergroup, Arizona. Tectonophysics 375, 199–220.
Wingate, M.T.D., Giddings, J.W., 2000. Age and paleomagnetismof the Mundine Well dyke swarm, Western Australia:implications for an Australia-Laurentia connection at 755 Ma.Precambrian Res. 335–357.
Wingate, M.T.D., Pisarevsky, S.A., Evans, A.D., 2002. Rodiniaconnections between Australia and Laurentia: no SWEAT, noAUSWUS? Terra Nova 14 (2), 121–128.
Zijderveld, J.D.A., 1967. AC demagnetization of rocks: analysis ofresults. In: Collison, D.W., Runcorn, S.K., Creer, K.M. (Eds.),Methods in Paleomagnetism. Elsevier, New York,pp. 254–286.