Chlorophyll a as a marker for bioturbation and carbon flux in southern and central North Sea...
11
MARINE ECOLOGY PROGRESS SERIES Mar Ecol Prog Ser Published February 12 Chlorophyll a as a marker for bioturbation and carbon flux in southern and central North Sea sediments A. R. Boon*, G. C. A. Duineveld Department of Marine Ecology, Netherlands Institute for Sea Research, PO Box 59. 1790 AB Den Burg, The Netherlands ABSTRACT: In 1993, 3 stations (depth 28 to 49 m) In the southern and central North Sea were visited to study the relationship between phytopigment input to the sediment and the subsequent response by the benth~c community. Duplicate sediment cores were taken, s h e d and analysed for chlorophyll a, and sediment oxygen demand was measured. The downcore distribution of chlorophyll a was modelled with both a random diffusive model and a non-local mixing model. In most cases, the random diffusive model gave the best fit. In some cases, however, when a subsurface maximum of chlorophyll was found, the non-local mixing model gave a better description of the depth-distribution of chlorophyll. From these models, the bloturbation rates in and the fluxes of chlorophyll a to the sediments were cal- culated. Fluxes were also calculated according to the inventory of chlorophyll in the sediments. Results from these 2 methods correlated well. Fluxes were highest in spring, lower in summer and lowest in autumn and winter. At one station a good correlation between the chlorophyll flux to the sediment and the bioturbation rate was found. Another station demonstrated a positive trend between these 2 para- meters, and the third station showed no relation at all. Sediment oxygen demand a1 the 3 stdtions exhibited a clear seasonal cycle, with high values in mid or late summer When both chlorophyll fluxes and sediment oxygen demand were converted into carbon units, the annual averages of carbon supply (chlorophyll) and carbon mineralisation (oxygen demand) were reasonably balanced. It appeared that In spring, carbon build-up took place, while in late summer this carbon was degraded. It is argued that chlorophyll a is a good marker for metabolisable organlc matter KEY WORDS. Benthic-pelagic coupling . Phytopigments . Bioturbation . Carbon budget INTRODUCTION To understand the activity of benthic communities, it is important to assess the amount and quality of the organic matter sedimenting to and buried in marine sediments. Clear relationships have been observed, especially in coastal shelf seas, but also in the deep- sea, between the input of fresh organic matter, such as algal detritus or faecal pellets, and the metabolic reac- tion of the benthic community (Kanneworff & Chris- tensen 1986, Pfannkuche 1992). However, time-lags or quantitative discrepancies can occur between detritus sedimentation and benthic metabolism. Christensen & Kanneworff (1985) and Boon et al. (1998) showed the rapid reaction by benthic macrofauna to spring bloom sedimentation, while the maximum of bacterial pro- duction was attained in (late) summer (Van Duyl & Kop 1994). Furthermore, as Roden & Tuttle (1996) have pointed out, the seasonal discrepancies between organic matter input and the metabolic activity of benthic communities are to a large extent explained by the temperature-dependent remineralisation activities of bacterial organisms and by the seasonally varying input of fresh labile organic matter as compared to more refractory organic matter. In this study, the seasonal variation of chlorophyll a (chl a) input to the shallow sediments of the North Sea, a European shallow coastal shelf sea, and sediment oxygen demand (SOD) were combined to gain insight into the relation between bioturbation, community res- piration and algal matter input to the sediments. Chl a is used in this study as an indicator for the input of metabohsable organic matter as a food source for ben- thic organisms (Kannewoi-ff & Christensen 1986, Boon O Inter-Research 1998 Resale of full art~cle not permitted
Transcript of Chlorophyll a as a marker for bioturbation and carbon flux in southern and central North Sea...
MARINE ECOLOGY PROGRESS SERIES Mar Ecol Prog Ser
Published February 12
Chlorophyll a as a marker for bioturbation and carbon flux in southern and central North Sea sediments
A. R. Boon*, G. C. A. Duineveld
Department of Marine Ecology, Netherlands Institute for Sea Research, PO Box 59. 1790 AB Den Burg, The Netherlands
ABSTRACT: In 1993, 3 stations (depth 28 to 49 m) In the southern and central North Sea were visited to study the relationship between phytopigment input to the sediment and the subsequent response by the ben th~c community. Duplicate sediment cores were taken, s h e d and analysed for chlorophyll a, and sediment oxygen demand was measured. The downcore distribution of chlorophyll a was modelled with both a random diffusive model and a non-local mixing model. In most cases, the random diffusive model gave the best fit. In some cases, however, when a subsurface maximum of chlorophyll was found, the non-local mixing model gave a better description of the depth-distribution of chlorophyll. From these models, the bloturbation rates in and the fluxes of chlorophyll a to the sediments were cal- culated. Fluxes were also calculated according to the inventory of chlorophyll in the sediments. Results from these 2 methods correlated well. Fluxes were highest in spring, lower in summer and lowest in autumn and winter. At one station a good correlation between the chlorophyll flux to the sediment and the bioturbation rate was found. Another station demonstrated a positive trend between these 2 para- meters, and the third station showed no relation at all. Sediment oxygen demand a1 the 3 stdtions exhibited a clear seasonal cycle, with high values in mid or late summer When both chlorophyll fluxes and sediment oxygen demand were converted into carbon units, the annual averages of carbon supply (chlorophyll) and carbon mineralisation (oxygen demand) were reasonably balanced. It appeared that In spring, carbon build-up took place, while in late summer this carbon was degraded. It is argued that chlorophyll a is a good marker for metabolisable organlc matter
K E Y WORDS. Benthic-pelagic coupling . Phytopigments . Bioturbation . Carbon budget
INTRODUCTION
To understand the activity of benthic communities, it is important to assess the amount and quality of the organic matter sedimenting to and buried in marine sediments. Clear relationships have been observed, especially in coastal shelf seas, but also in the deep- sea, between the input of fresh organic matter, such as algal detritus or faecal pellets, and the metabolic reac- tion of the benthic community (Kanneworff & Chris- tensen 1986, Pfannkuche 1992). However, time-lags or quantitative discrepancies can occur between detritus sedimentation and benthic metabolism. Christensen & Kanneworff (1985) and Boon et al. (1998) showed the rapid reaction by benthic macrofauna to spring bloom sedimentation, while the maximum of bacterial pro-
duction was attained in (late) summer (Van Duyl & Kop 1994). Furthermore, as Roden & Tuttle (1996) have pointed out, the seasonal discrepancies between organic matter input and the metabolic activity of benthic communities are to a large extent explained by the temperature-dependent remineralisation activities of bacterial organisms and by the seasonally varying input of fresh labile organic matter as compared to more refractory organic matter.
In this study, the seasonal variation of chlorophyll a (chl a) input to the shallow sediments of the North Sea, a European shallow coastal shelf sea, and sediment oxygen demand (SOD) were combined to gain insight into the relation between bioturbation, community res- piration and algal matter input to the sediments. Chl a is used in this study as an indicator for the input of metabohsable organic matter as a food source for ben- thic organisms (Kannewoi-ff & Christensen 1986, Boon
O Inter-Research 1998 Resale of full a r t~c le not permitted

34 Mar Ecol Prog Ser 162: 33-43. 1998
et al. 1998). The depth distribution of chl a was mod- elled with both a diffusive and a non-local mixing model (Soetaert et al. 1996), from which particle mix- ing activity in and fluxes of chlorophyll to the sedi- ments were calculated. These chl a fluxes as well as the SOD were converted into carbon units. This gives an estimate of a benthic carbon budget for 3 locations in the southern and central North Sea. Part of the data on chl a concentrations in the sediments and sediment oxygen consumption have been published in Boon et al. (1998), which also contains information on the sea- sonal changes in phytopigment composition and hence algal succession in water and sediment from the sta- tions mentioned here.
METHODS
Description of study sites. Three stations in the southern and central North Sea were visited on 23-25 February, 20-22 March, 10-12 May, 14-16 June, 2-4 August and 15-17 November 1993 with the RV 'Pela- gia' (Fig. 1). Some characteristics of the sampling loca- tions are presented in Table l. Stn BF (depth 28 m) is situated ca 30 nautical miles west of the Dutch coast in an area called Broad Fourteens. Tidal currents near the bottom vary between ca 10 and 45 cm S-', causing extensive resuspension of surficial detritus and sand (Boon unpubl.). This suspended material is transported northwards, due to the typical counter-clockwise resid- ual water movement in the southern North Sea (Otto et al. 1990). As a consequence, the sediments at Stn BF contain low amounts of fine silt (c63 pm) particles and organic carbon (Creutzberg et al. 1984). However, periodic input of fresh algal detritus is substantial (Boon et al. 1998), probably because of deposition of the bed-load during slack periods in the tidal cycle (Jenness & Duineveld 1985, Boon unpubl.).
Stn FF (depth 39 m) is located on a gentle slope about 60 nautical miles north of Stn BF, in an area re- ferred to as the Frisian Front (Creutzberg et al. 1984). Water masses entering the North Sea with the tide, via the English Channel in the south and around the north of Scotland, form a convergence zone stretching from East Anglia (UK) to the German Bight and the Danish west coast (Otto et al. 1990). As a result, this conver-
3 5
Longitude (E)
Fig. 1. Map of North Sea with isobaths and sample locations. Arrows indicate residual current direction
gence zone creates a tidal front, the Frisian Front. This area is characterised by higher sedimentation of detri- tus compared to Stn BF, due to slowing down of cur- rents when the water mass from the south enters deeper water. Furthermore, the primary production at the front is often prolonged after the spring bloom. This is likely due to the reflux of mineralisation prod- ucts to the photic zone, thus enhancing algal produc- tion. It has been postulated that these charactenstics are responsible for the increased benthic biomass and oxygen consumption at the Frisian Front, compared to areas north and south of it (Creutzberg 1985).
Stn OG (depth 49 m) is situated at the Oyster Ground, some 60 nautical miles north of Stn FF.
Table 1. Geographical positions and some characteristics of the study sites
Stn Latltude Longitude Depth Water column Sediment (NI (E) (m) mixing type (% ~n sed.)
Broad Fourteens (Stn BP) 53" 00' 3" 52' 28 Mixed Medium coarse sand 0.01-0.05 Frisian Front (Stn FF) 53" 42' 4" 30' 39 Transitional Silt and fine sand 0.5-1 Oyster Ground (Stn OG) 54'31' 4"28' 49 Summer stratified Fine sand and silt 0.1-0.5

Boon & Duineveld: Chlorophyll a as a carbon marker in North Sea sediments 3 5
The Oyster Ground is a somewhat isolated deeper basin (-50 m), bordered by relatively shallow areas, like the Dogger Bank to the north, the Southern Bight to the south, and England to the west. Residual water input is mainly from the west, but with prolonged southern winds, frontal and southern water masses can reach this area (Otto et al. 1990). The near-bottom water current velocity (max. -15 cm S- ') at this location is less than that at Stn FF (W. Van Raaphorst pers. comm.). The presence of subfossil bivalves (-9000 yr BP) at or near the sediment surface illustrates the lack of net-deposition in this area (Cadee 1984), despite the relatively low water current. The sediment type con- tains less silt and organic carbon than is found at Stn FF, but more than at Stn BF. Zoobenthic biomass levels are also intermediate a t this site (Duineveld et al. 1991).
Sampling and analytical procedures. Duplicate sed- iment samples were taken for pigment analyses, each from a different box core using acrylic linings (0 5 cm). Sediment cores were collected with a cylindrical box corer (inner diameter, i.d. 31 cm) developed at the Netherlands Institute for Sea Research (NIOZ), after a modification of Reineck's box corer (Reineck 1963). Our box corer encloses a 30 to 50 cm long sediment column together with 15 to 25 1 of overlying bottom water. Any disturbance of the sediment-water inter- face and contamination by water from the upper water column was prevented by a closing lid on the upper end of the box corer. Taking the amount of samples to be analysed into account, only 2 sediment cores were taken. Maximum sample depth (25 cm) could only be reached in the soft sediments at Stn FF. At the other stations, sample depth varied between 10 and 20 cm, due to the compactness of the sediment. The cores were stored at -80°C until analysis in the laboratory. Prior to analysis, sediment samples were vertically sliced into segments from 0-1, 1-2, 2-3, 3-4, 4-5, 5-7, 8-10, 13-15, 18-20 and 23-25 cm depth and freeze- dried. Lyophilisation of the sediment samples did not result in a loss of pigments compared to direct extrac- tion of the wet sediment samples.
Phytopigment analyses on the samples were per- formed by reverse-phase high performance liquid chromatography (RP-HPLC), using a Waters Associate liquid chromatograph equipped with a Bio-Sil C18 HL 90-5 S (Bio-Rad) column and a Model 991 Waters photo diode array spectrophotometer. Pigments were extracted in methanol containing 2 % ammonium ace- tate-buffer and 5 % double-distilled water. The solvent and gradient system was similar to that described by Kraay et al. (1992). Calibration of the spectrophoto- meter was done using pigment standards from Fluka Chemie A.G., Buchs, Switzerland. Storage of sediment samples at -80°C showed no significant decline in
chl a concentrations over a 2 yr period (authors' unpubl. res.). Furthermore, replicate analyses of simi- lar, homogenated samples showed a variation well below 10% of the average value. Identification of chl a was performed using spectral analysis and retention time. Quantity was calculated according to a n ex- tension of Beer's Law, a s described by Mantoura & Llewellyn (1983). Porosity data were used to express the chl a concentrations per volun~e of sediment (data supplied by Dr Wim van Raaphorst, NIOZ).
Sediment oxygen demand (SOD), which covers the aerobic respiration of the sediment community and partly the oxidation of reduced substances a s well (Canfield et al. 1993), was determined at Stns BF and FF in replicates (3 to 4) by shipboard incubations of sediment cores. The cores were taken with the cylin- drical box corer described above, in which a detach- able polyester core tube (i.d. 30 cm) was inserted. The core tubes were placed into a water bath on deck with an opaque lid to prevent light from entering. The water was cooled to in sjtu temperature. A height-adjustable lid sealed each core tube by means of an inflatable ring in its outer edge. The lid contained a stirring device and an oxygen electrode (Yellow Spring Instruments 620) to monitor the oxygen concentration in the head space. The electrode was calibrated in aerated, oxygen- saturated water (100% Oz), and in oxygen-depleted (sodium sulphite) water (0% 0 2 ) . SOD was estimated from the linear part of the first 2 to 3 h of the concen- tration time series. SOD was corrected for the oxygen use by the electrode. Sediment oxygen consumption data at Stn OG were derived from the literature (De Wilde et al. 1984, Cramer 1990).
Modelling and budget calculations. Assuming steady- state conditions, random diffusive mixing and simple first-order decomposition kinetics, the following diage- netic equation was used to fit down core distributions of organic matter in sediments (Berner 1980, Sun et al. 1994) :
where C = concentration of the compound in the sediments, t = time, D,, = particle mixing coefficient or bioturbation rate, X = depth in sediments, o = sedi- mentation rate and A = first-order decay constant of the organic material.
A recent study by De Haas et al. (1997), who mea- sured 'lOPb profiles in North Sea sediments, showed that at the Stns BF and FF no significant net sedimen- tation could be determined. The absence of net sedi- mentation at Stn OG is indicated by the presence of subfossil (-9000 yr BP) bivalve remains at the sediment surface (Cadee 1984).
The insignificance or absence of sedimentation rates a t our stations results in a negligible effect of the factor

3 6 Mar Ecol Prog Ser 162: 33-43, 1998
w(aC/ax) in Eq. (1). Hence, for the purposes of our study we om~tted this factor, which simplifies the dia- genetic equation to
The solution, with the following boundary condi- tions: at X = 0 , C = CO and at X = m, C = C,, is
where t = time (d), X = depth (cm), C, = concentration of chl a at depth X in the sediment (pg cm-", CO = con- centration of chl a at the sediment-water interface (pg cm-3), C, = background concentration of chl a at large X (pg cm-3), Db = mixing coefficient (cm2 d-l) and h = first order degradation constant of chl a (d-').
Soetaert et al. (1996) developed fitting routines to model the downcore distribution of 'lOPb in ocean sediments. They described models for steady-state dif- fusive mixing as well as non-local mixing situations. We modified their routines to model the depth-distnb- ution of chl a in North Sea sediments. In our routines, the variables in Eq. (2) relate to days instead of years, and o and Sp (production term for 2'0Pb) were set to zero.
Six different models were developed by Soetaert et al. (1996). The first model, 'model l', describes the situation in which no bioturbation occurs and the depth-distribution of the studied compound is domi- nated by sedimentation. Since we omitted this term from our diagenetic equations, this model was not used
Boundary conditions
Fig. 2. Schematic representation of the models used, modified
in our study. The second model, 'model 2', describes the steady-state diffusive mixing, calculated by solving our Eq. (2) for the whole profile of chl a . In their paper, Soetaert et al. (1996) developed 4 different non-local mixing models, with increasing complexity. Here, only their 'model 3', the simplest non-local mixing model, is applied. The other, more sophisticated models did not give a better description of the downcore distribution of chl a in our study. These models are not mentioned further here, and the reader should consult Soetaert et al. (1996) for further information.
In Fig. 2 , a schematic representation, including the diagenetic equations and their boundary conditions, of the 2 models used here is given. Model 2 (the same term as in Soetaert et al. 1996) consists of only 1 layer, with a flux boundary at the sediment-water interface. The depth-distribution of chl a is described by Eq. (2). Model 3 is a modification of model 2 by injecting the non-local part of the flux at depth L. Hence, 2 layers are considered, one from the sediment-water interface to L and the other from L to infinite depth. Eq. (2) is applied to both layers, assuming equal bioturbation in both layers.
The fitting routines also calculated fluxes of chl a to the sediment. In the case of model 2, this is the flux to the sediment-water interface, in case of model 3, the injected flux at depth L is also calculated (see also Fig. 2) . These fluxes (J) were calculated according to Fick's law (Berner 1980), assuming 'steady-state' con- ditions, as follows:
Db- - 1 C = O I-r I
v A I d2c1 Db- - I C 1 = 0
from Soetaert et al. (1996). Boundary conditions are denoted in the left-hand box by A to D. The diagenetic equations re- ferring to the layers in question are given (courtesy of K .
Soetaert) in the right-hand boxes
Boon & Duineveld. Chlorophyll a as a carbon marker in North Sea sediments 3 7
J = - Db(dC/dx)l,=o (4) curves in Fig. 3, it is clear to see why fitting a diffusive
which has the solved form
J = Co-,'Dbh
model on a non-local mixed situation gives a n over- estimate of the bioturbation rate. In Table 2, it is indi-
(5) cated in which cases the non-local mixing model 3 In case of model 2, this equation was applied to the gave a better description of chl profiles than the diffu- whole sediment layer. In the case of model 3, this equa- sive model 2 tion was also applied to the second layer, from L to infinity, and calculated as follows:
Bioturbation rates J2 = -Db(dC2/dx)I~ +Dl , (dCI/dx) l L (6)
where .I2 is the flux to the second layer, and C, and C2 are the concentrations of chl a in the layers from 0 to L and from L to infinity, respectively. Calculation of the flux using these models is referred to here a s the 'model-approach'.
Another way of calculating the chl a flux is simply to balance supply and breakdown (Sun et al. 1994):
J = h1 (7)
where I is the inventory of chl a in the sediment (summed over maximum depth; pg cm-2). Calculation of the flux using Eq. (7) is referred to here as the 'inventory-approach'.
To test whether model 2 or model 3 gave the best fit to the depth-distribution of chl a, a l-tailed F-test was used (Sokal & Rohlf 1995). This test calculated the dif- ference in the residual variance between the modelled and observed data for the 2 models. The null hypothe- sis was that there was no difference in residual vari- ance between the 2 models. In this case, model 2 gave the best fit. If the residual variance in model 3 was smaller than in model 2 (p < 0.011, then the null hypothesis was rejected, and model 3 gave the best fit. Differences between bioturbation rates and fluxes from the different stations or months were
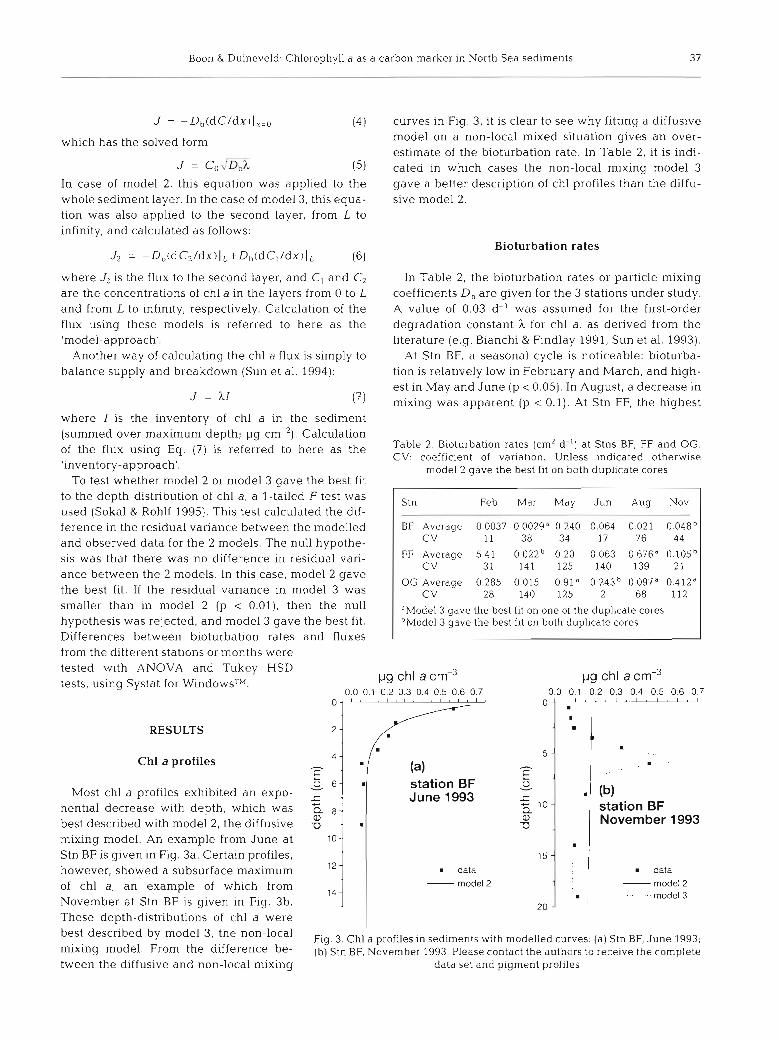
In Table 2, the bioturbation rates or particle mixing coefficients D, a re given for the 3 stations under study. A value of 0.03 d-l was assumed for the first-order degradation constant )c for chl a, a s derived from the literature (e.g. Bianchi & Findlay 1991, Sun et al. 1993).
At Stn BF, a seasonal cycle is noticeable: bioturba- tion is relatively low in February and March, and high- est in May and June (p c 0.05). In August, a decrease in mixing was apparent (p c 0.1). At Stn FF, the highest
Table 2. Bioturbation rates (cm2 d") at Stns BF, FF and OG. CV: coefficient of variation. Unless indicated otherwise
model 2 gave the best fit on both duplicate cores
Feb Mar May Jun Aug Nov
BF Itn Average 0.0037 0.0029" 0.240 0.064 0.021 0.048b CV 11 38 34 17 76 44
FF Average 5.41 0.022" 0.20 0.063 0.676" 0 .105~ CV 31 141 125 140 139 21
OG Average 0.285 0.015 0.91" 0.243h 0 097" 0 412" CV 28 140 125 2 68 112
dModel 3 gave the best fit on one of the dupl~cate cores bModel 3 gave the best fit on both duplicate cores
tested with ANOVA and Tukey HSD tests, using Systat for WindowsTM.
pg chl a c m 3 pg chl a cm" 0.0 0.1 0.2 0.3 0.4 0.5 0.6 0.7 0.0 0.1 0.2 0.3 0.4 0.5 0.6 0.7
RESULTS
Chl a profiles
Most chl a profiles exhibited a n expo- nential decrease with depth, which was best described with model 2, the diffusive mixing model. An example from June at Stn BF is given in Fig. 3a. Certain profiles, however, showed a subsurface maximum of chl a, an example of which from November at Stn BF is given in Fig. 3b. These depth-distributions of chl a were best described by model 3, the non-local mixing model. From the difference be- tween the diffusive and non-local mixing
(a) station BF June 1993
data - model 2
station BF November l993
I data - model 2
- - - ---model 3
Fig. 3. Chl a profiles in sediments with modelled curves: (a) Stn BF, June 1993; (b) Stn BF, November 1993 Please contact the authors to receive the complete
data set and p ~ g m e n t profiles

38 Mar Ecol Prog Ser 162: 33-43, 1998
mixing rate was found in February (p < 0.1). Apart from this exceptional value, a seasonal trend can be inferred with increased mixing in May and August, although this was not significant. Also at Stn OG, the February mixing rate was (insignificantly) higher than in March. The highest average bioturbation rate was found in May, but due to high variation it was not sig- nificantly higher than in March. However, mixing in June was significantly higher than in March (p < 0.05), and in August it decreased again (p c 0.05).
No consistent differences in bioturbation rate could be detected among the stations. Mixing was lower at Stn BF than at Stn FF in February (p c 0.05) and November (p < 0.1). Furthermore, in February, mixing was higher a t Stn FF than a t Stn OG, but in June the reverse was found ( p < 0.1).
Chl a fluxes
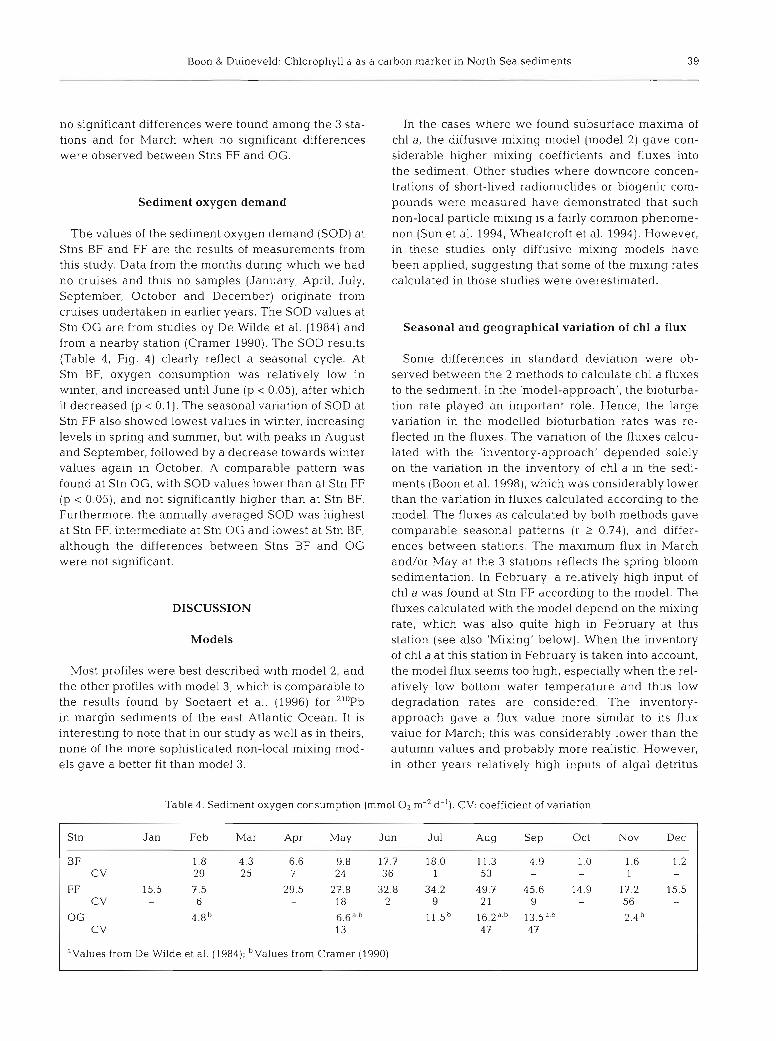
Fluxes of chl a into the sediment (Table 3) were cal- culated in 2 ways, first using the 'model-approach' and second using the 'inventory-approach'. A graphical presentation of these data is given in Fig. 4 , where they have been converted to carbon units, using a carbon to chl a ratio of 50 (w/w). Although fluxes are given as values per day, they should not be viewed as daily fluxes. Due to the fact that the decay rate of chl a is on the scale of weeks, the fluxes in Table 3 should also be regarded as more time-averaged values.
The 2 models gave similar seasonal patterns (r > 0.7, p c 0.05). with maximum average fluxes of chl a in May at Stns BF and FF and in March a t Stn OG. More specifically, at Stn BF, an increase in flux from Febru- ary to May was noted (p c 0.05, inventory-approach),
Table 3. Flux of chl a into the sediment (pg m-* d-'): calculated using the 'model-approach' and the 'inventory-approach'
CV: coefficient of variation
Stn Feb mar May Jun Aug Nov
'Model-approach' BF Average 86 673 2397 997 774 231
CV 63 53 54 99 111 96
FF Average 5680 972 7255 2519 5010 3655 CV 16 36 47 139 65 16
OGAverage 860 2357 2113 1929 1831 1832 C V 28 115 20 26 96 31
'Inventory-approach' BF Average 297 858 1432 1169 425 360
CV 17 42 16 90 31 44
FF Average 2607 1705 8700 5154 5775 4157 CV 25 19 3 101 75 11
OGAverage 818 2700 2092 1577 2216 1520 CV 35 l 0 5 21 22 99 11
station BF 180 - 1601
b 140 Jrn JI
+ SOD
jan feb mar apr may june july aug sep oct nov dec
station FF 500 r
0 4 . . . . . . jan feb mar apr may june july aug sep oct nov der
station OG
o l . . . . . . : . : . , jan feb mar apr may june july aug sep oct nov dec
months
Fig. 4. Monthly carbon budgets calculated from chl a flux anc sediment oxygen demand (SOD) for all 3 stations. Jm = flux according to 'model-approach', Ji - flux according to 'inven-
tory-approach'. Lines are drawn to aid interpretation
with thereafter a decrease in August and November (p < 0.05, inventory-approach). At Stn FF, the differ- ences between the 2 approaches were more distinct: the model-approach resulted in a higher flux (p i 0.05) in February than in March, then again a higher flux in May (p < 0.1), and (non-significant) lower fluxes in later months; the inventory-approach gave a higher flux in May than in February and March (p c 0.05), with (non-significant) lower values in June and August, and a significantly lower flux in November (p c 0.05). At Stn OG, the 2 approaches gave comparable results. In March, an increase in flux was found compared to February, and in May this increase became significant (p c 0.05). The model-approach showed a decrease again in June (p c 0.1).
A general trend is observed when the chl a fluxes into the sediment are compared among the stations. The lowest fluxes occurred at Stn BF, intermediate fluxes at Stn OG and highest fluxes at Stn FF. Accord- ing to the model-approach, these differences were sig- nificant between Stns BF, FF and OG in February and November (p < 0.05) and between Stns OG and FF in May (p c 0.1). The inventory-approach gave more sig- nificant differences, except for June and August when
Boon & Duineveld: Chlorophyll a as a carbon marker in North Sea sediments 3 9
no significant differences were found among the 3 sta- tions and for March when no significant differences were observed between Stns FF and OG.
Sediment oxygen demand
The values of the sediment oxygen demand (SOD) at Stns BF and FF are the results of measurements from this study. Data from the months during which we had no cruises and thus no samples (January, April, July, September, October and December) originate from cruises undertaken in earlier years. The SOD values at Stn OG are from studies by De Wilde et al. (1984) and from a nearby station (Cramer 1990). The SOD results (Table 4, Fig. 4) clearly reflect a seasonal cycle. At Stn BF, oxygen consumption was relatively low in winter, and increased until June (p < 0.05), after which it decreased (p < 0.1). The seasonal variation of SOD at Stn FF also showed lowest values in winter, increasing levels in spring and summer, but with peaks in August and September, followed by a decrease towards winter values again in October. A comparable pattern was found at Stn OG, with SOD values lower than at Stn FF (p < 0.051, and not significantly higher than at Stn BF. Furthermore, the annually averaged SOD was highest at Stn FF, intermediate at Stn OG and lowest at Stn BF, although the differences between Stns BF and OG were not significant.
DISCUSSION
Models
Most profiles were best described with model 2, and the other profiles with model 3, which is comparable to the results found by Soetaert et al. (1996) for 210Pb in margin sediments of the east Atlantic Ocean. It is interesting to note that in our study as well as in theirs, none of the more sophisticated non-local mixing mod- els gave a better fit than model 3.
In the cases where we found subsurface maxima of chl a, the diffusive mixing model (model 2) gave con- siderable higher mixing coefficients and fluxes into the sediment. Other studies where downcore concen- trations of short-lived radionuclides or biogenic com- pounds were measured have demonstrated that such non-local particle mixing is a fairly common phenome- non (Sun et al. 1994, Wheatcroft et al. 1994). However, in these studies only diffusive mixing models have been applied, suggesting that some of the mlxing rates calculated in those studies were overestimated.
Seasonal and geographical variation of chl a flux
Some differences in standard deviation were ob- served between the 2 methods to calculate chl a fluxes to the sediment. In the 'model-approach', the bioturba- tion rate played an important role. Hence, the large variation in the modelled bioturbation rates was re- flected in the fluxes. The variation of the fluxes calcu- lated with the 'inventory-approach' depended solely on the variation in the inventory of chl a in the sedi- ments (Boon et al. 1998), which was considerably lower than the variation in fluxes calculated according to the model. The fluxes as calculated by both methods gave comparable seasonal patterns (r 2 0.74), and differ- ences between stations. The maximum flux in March and/or May at the 3 stations reflects the spring bloom sedimentation. In February, a relatively high input of chl a was found at Stn FF according to the model. The fluxes calculated with the model depend on the mixing rate, which was also quite high in February at this station (see also 'Mixing' below). When the inventory of chl a at this station in February is taken into account, the model flux seems too high, especially when the rel- atively low bottom water temperature and thus low degradation rates are considered. The inventory- approach gave a flux value more similar to its flux value for March; this was considerably lower than the autumn values and probably more realistic. However, in other years relatively high inputs of algal detritus
Table 4. Sediment oxygen consumption (mm01 O2 m-' d-l). CV: coefficient of variation
Stn Jan Feb Mar Apr May Jun Jul Aug Sep Oct Nov Dec
BF 1.8 4.3 6.6 9.8 17.7 18.0 11.3 4.9 1.0 1.6 1.2 CV 29 25 7 24 36 1 53 - - 1 -
FF 15.5 7.5 29.5 27.8 32.8 34.2 49.7 45.6 14.9 17.2 15.5 CV - 6 - 18 2 9 2 1 9 - 56 -
OG 4.8b 6.6a,b 1 1 . 5 ~ 13.5a,b 2.4 C V 13 47 47
aValues from De Wilde et al. (1984); b ~ a l u e s from Cramer (1990)

Mar Ecol Prog Ser
have been recorded this early in the year. Joint & Pomroy (1993) found a late winter increase in chl a in the water column by the end of February 1989 at the latitude of the Frisian Front and a month later (end of March) at the Oyster Ground, a pattern comparable to our results. Although in 1993 (the year of our study) no early bloom was noted at Broad Fourteens, this was the case in 1994 (Boon & Duineveld 1996). However, there exists notable annual differences in the spatial onset and timing of early spring blooms; in May 1994, the typical spring bloom of Phaeocystjs sp., as found in 1993 (Boon et al. 1998). was absent at Stns BF and FF (Boon & Duineveld 1996; Stn OG not studied).
The chl a flux was highest at Stn FF in all months (p < 0.05) except in March. These relatively high val- ues support the earlier findings of Creutzberg (1985), Cramer (1990) and Baars et al. (1991) that, in a rela- tively narrow zone at the Frisian Front, increased pri- mary production and benthic metabolism occur often compared to closely adjacent areas north and south of it.
Mixing
The bioturbation or particle mixing rate (Dh) is a measure of the physical activity of macrobenthos. Although subsurface deposit feeders, like converyor- belt feeding species, are the main contributors to mix- ing, other benthic animals (e.g. predatory polychaetes, suspension-feeding Ophiuroidae) are also conducive to bioturbation. The optimal foraging theory predicts higher ingestion rates when more or fresher food is available (Taghon & Jumars 1984). In the case of deposit-feeders, this means higher intake rates of sed- iment when more chl a is present. This is likely to be positively related to the physical activity (foraging) of the animals in the sediment. Thus, it was hypothesised that the mixing rates would be dependent on the input of chl a to the sediment. At Stn BF, a significant positive correlation between bioturbation and the chl a flux (inventory-approach) was indeed found (p < 0.1); there is an increase in mixing and flux in May, with a decrease thereafter. At Stn FF no significant relation was found, although mixing and flux tended to follow the same pattern. Stn OG demonstrated no relation between these variables at all. A comparison between the bioturbation and the flux calculated with the model-approach is not valid, since these values were not determined independently. Mixing rates in Long Island Sound, USA, sediments, calculated by Sun et al. (1994) using chl a and 234Th, are in the same range and display a comparable seasonal range as our data. How- ever, their data lack a correlation between bioturba- tion rate and chl a input into the sediments. Clearly, the relation between organic matter input and bioturba-
tion rate is not straightforward. Furthermore, as can be seen in Table 2, there is a large variation in mixing rates between duplicate cores in our study; in many cases, the coefficient of variation is over 100. This could be an effect of a patchy distribution of the ben- thic fauna in the North Sea.
An unexpected high mixing rate was observed at Stn FF in February. Modelling the downcore distribu- tion of chl a in the sediments here gave a relatively steep profile, although the concentrations of chloro- phyll were relatively low. Such a distribution gives a high mixing rate, even when the actual amount of chlorophyll is low. If we consider the possibility that a small part of the chl a is not directly available for degradation, through adsorption to or through other means of physical or chemical protection by fine sedi- ment particles, such depth-distributions could develop without intense mixing. As a result, one would find high bioturbation rates when a model is applied and the total chl a pool is considered. The alternative is to subtract this 'refractory' chlorophyll from the total pool, analogous to the subtraction of the background production in the case of modelling profiles of radionu- clides. However, as yet there is no means by which such a less available fraction can be estimated or analysed. As a result, we consider the mixing rate at Stn FF in February to be an overestimate.
An important factor influencing the calculation of the particle mixing rate is the first-order decay constant h for chl a. The average 1 for chl a has been estimated at a value of 0.03 d-l in various studies (Graf 1989, Bianchi & Findlay 1991, Sun et al. 1993). Sun et al. (1994) calculated that this degradation rate varies along with the temperature, from 0.017 d-' at 2°C in the winter to 0.079 d-' at 22°C in the late summer. Tak- ing this seasonal variation of h into account, a 2-fold decrease and increase in mixing during late summer and winter/early spring respectively is predicted from the values presented here.
Another important factor influencing mixing rate could be the biomass and/or abundance of macrobenthic or- ganisms at the locations. Since bioturbation is the sum of all physical activities of such organisms, one might ex- pect t h s factor to exert some influence. Although Stn FF contains at least a 2-fold higher benthic biomass and abundance (Holtmann & Groenewold 1994), compared to Stn BF the mixing rate was only higher in 2 months (February, November). Thus, our results show that 2 im- portant factors thought to determine the bioturbation rate (chl a input and macrobenthic biomass/abundance) only show a limited influence. Another possibility is the limited validity of the steady-state model to describe short-term, pulse-like events like the sedimentation and subsequent burial and breakdown of compounds with a relatively high turnover rate.

Boon & Duineveld: Chlorophyll a as a carbon marker in North Sea sedirnents 4 1
In conclusion, our data reveal a significant positive correlation between mixing and algal matter input at 1 station (BF), but no relation at the other 2 stations. Whether the values we found and especially the high variation of them, are typical and which factors are of major importance remains speculative as such.
Benthic carbon budget
In order to compare the fluxes of chl a with the sedi- ment oxygen consumption, certain conversion factors were used to express all values in terms of carbon. The conversion of chl a to carbon was done using a (w/w) C to chlorophyll ratio of 50. It is acknowledged that this ratio can vary considerably, i.e. from 20 to 500, the latter being winter values, which are not associated to phytoplankton production (Baker et al. 1985). Fresh phytoplankton C to chl a values normally vary in the range from 20 to 80 (Antia et al. 1963). According to the Redfield ratio, 7 7 % of the consumed oxygen is involved, directly or indirectly, in the breakdown of organic carbon. Partly, this oxygen is used to oxidise reduced compounds (Mn, Fe, sulphides) from the anoxic zone (Canfield et al. 1993). The other 23% of the oxygen is used for nitrification. Hence, to convert the SOD values to carbon units, a factor of 0.77 was used.
Our data (Tables 3 & 4, Fig. 4) show an accumulation of chl a-carbon in spring, as indicated by the sediment inventory, due to increased fluxes in March and May. This spring input possibly fuelled the late summer SOD maximum, when fluxes of chlorophyll decreased relative to the spring values. Our results agree with those of Roden & Tuttle (1996), who modelled a build- up of metabolisable particulate organic matter (MPOC) in spring in the sediments due the increased sedimentation of labile organic matter. They showed that 2 factors contribute to the accumulation of organic matter in shallow shelf sediments early in the year: the increased sedimentation of algal detritus due to the spring bloom on the one hand, and on the other hand the low water temperatures in spring inhibiting degra- dation.
Although this pattern of c'arbon accumulation in spring and mineralisation in late summer was also demonstrated at Stn BF, it is evident from Fig. 4 that here the spring chl a flux was just sufficient to fuel the actual SOD, when both were expressed in terms of carbon. The summer maximum in SOD was not bal- anced by the chlorophyll-carbon flux into the sedi- ment. This is reflected in the annual benthic carbon budget (Table 5): the SOD-carbon mineralisation is about 2 times higher than the chlorophyll-carbon input. At the other 2 stations, FF and OG, the annual
Table 5. Annual primary production, chl a flux into the sedi- ment and sediment oxygen demand (SOD), all in g C m-2 yr-'
(a: 'model-approach'; b: 'inventory-approach')
Stn Chl a flux SOD Primary production d b
dValues from Cramer (1990) bValues from Joint & Pomroy (1993) CValues from Baars (1991) dValue calculated from Cramer (1990) and De Wilde et al.
(1984)
carbon budget is more balanced. The reasons for the lack of balance at Stn BF are not clear. Hiittel et al. (1996) found increased flux of particles to and ex- change of nutrients from the sediment due to relatively high current velocities near the sea-bed. The resulting stimulation of bacterial activity could be responsible for an increased turnover of organic matter, resulting in an elevated SOD. Furthermore, a higher organic matter (and thus chlorophyll) turnover results in lower inventories of chlorophyll in the sediment, seriously affecting the fluxes calculated with our equations. Such effects underline the problems with applying a steady-state model to short-term dynamic systems.
An important factor influencing the somewhat sim- plified view of the benthic carbon budget we present here is the carbon to chl a (C:chl) ratio. In a study on near-bottom seston at Stns BF and FF (Boon & Duin- eveld 1996), we found this ratio to vary from 30 to >1000. Since both these locations are exposed to rela- tively high tidal near-bottom water currents (maxima of 45 and 25 cm S-' respectively), a large proportion of the carbon originates from sedimentary resuspended organic matter which is admixed with the fresh algal matter settling in the near-bottom realm. It is generally accepted that the majority of sedimentary carbon is refractory, and does not contribute much to benthic metabolism. Taking the limited depth of the study sites into account, newly settled algal matter is likely to be only slightly degraded, with a C:chl ratio between 30 and 100, when it becomes incorporated in the sedi- ment. It is conceivable that, even though the total pool of carbon has a high C:chl ratio, especially fresh parti- cles get entrapped by means of selective feeding. The reasonable balance in the carbon budgets here seems to justify the assumed C:chl ratio of 50. Furthermore, it indicates that for the purpose of this study, chl a is a good marker for the MPOC sedimenting to the sea- floor. Lastly, the possibility of benthic primary produc- tion in these shallow waters should be considered.

4 2 Mar Ecol Prog SE
Joint & Pomroy (1993) mentioned that during winter and spring 1993, the base of the euphotic zone was at or very close to the bottom in parts of the coastal regions of The Netherlands (near our Stn BF). Hence, accord~ng to this finding some of the sedimentary pig- ments could originate from benthic algae. However, since the sediment top layer of this area is subject to high near-bottom water current velocities (up to 4 5 cm S-') leading to extensive resuspension (Jago et al. 1993, Boon & Duineveld 1996), it is unlikely that any benthic algal community would survive these harsh circum- stances. Hence, we consider the contribution of ben- thic algal chlorophyll to the total sedimentary chloro- phyll pool to be negligible.
According to the data in Table 5, 10 to 20% of the annual primary production was mineralised in the sed- iments at Stn BF, as compared to 20 to 25% at Stn FF and 15 to 4 1 % at Stn OG. The primary production (PP) values at Stn FF, derived from literature, vary consid- erably. Joint & Pomroy (1993) gave an annual PP of 150 to 200 g C m-2, while Baars (1991) estimated an annual PP of 420 g C m-2 We assume the latter value to be a better estimate, since this value was measured at Stn FF itself, while Joint & Pomroy's value was inter- polated from measurements around this station. Baars (1991) showed the PP at this station to be twice as high as stations 10 nautical miles north and south of it. Clearly, there is no decline in the proportion of PP being mineralised in the sediments with depth among the 3 stations. Other factors, like hydrography may play an important role in this matter. However, a con- siderable proportion of the PP at Stn BF gets buried and mineralised in the sediments, despite the rela- tively high tidal current velocities here, which cause extensive resuspension in this area (Jago et al. 1993, Boon unpubl.).
The station with the highest macrobenthic biomass, Stn FF, shows the highest sediment oxygen demand. However, the station with the lowest macrobenthic biornass, Stn BF, shows an annual SOD comparable to that of Stn OG, which has a higher benthic biomass (Holtmann et al. 1995) It could be that such a differ- ence is caused by the stimulated bacterial activity as a result of the coarser sediment type at Stn BF, in combi- nation with the higher tidal current velocities (Hiittel et al. 1996). This would mean that the macrobenthos, and possibly also meiobenthos, have a higher share in the SOD at Stns FF and OG than at Stn BF.
Despite the relatively extensive data set on organic matter sedimentation and the subsequent burial in sediments, knowledge on the degradation of organic matter in sediments is still lacking. Only a few studies have attempted to calculate degradation rates for molecular organic compounds or studied the effects of hydrographical circumstances and sediment types on
such rates. This information is highly necessary when using molecular markers like phytopigments for the processing of organic matter in the benthic realm. Moreover, the dynamical character of coastal ecosys- tems, and their intrinsic spatial and temporal hetero- geneity, although acknowledged theoretically, is still an undervalued research topic. Future ecosystems studies on the North Sea should certainly focus on these aspects, while degradation experiments on pig- ments and other organic molecules would significantly contribute to their use as biomarkers.
Acknowledgements. Thanks to the crew of RV 'Pelagia' for their work on board. Wim Boer is acknowledged for his assis- tance with the model Many thanks also to Drs Peter de Wilde, Karline Soetaert, lan Jenness and several anonymous review- ers for carefully reading and commenting on earlier versions of this paper. A grant from The Netherlands Organisation for Scientific Research (NWO), project VvA/NIOP made this pub- lication possible. This is NIOZ publication no. 3168.
LITERATURE CITED
Antia NJ, McAllister CD, Parsons TR. Strickland JDH (1963) Further measurements of primary production using a large-volume plastic sphere. Limnol Oceanogr 8:166-183
Baars MA (1991) Het Friese Front: een wisselwerking tussen water en bodem. In: de Gee A, Baars MA, van der Veer H (eds) De ecologie van het Friese Front. Internal NIOZ report 1991-2, p 91-96
Baars MA, Kraay GW, Oosterhuis SS (1991) Het fytoplankton op het Friese Front. In: de Gee A, Baars MA, van der Veer H (eds) De ecologie van het Fnese Front. Internal NIOZ report 1991-2, p 21-32
Baker ET, Feely RA, Landry MR, Lamb M (1985) Temporal variation in the concentration and settling flux of carbon and phytoplankton pigments in a deep fjordlike estuary. Estuar Coast Shelf Sci 214359-877
Berner RA (1980) Early diagenesis a theoretical approach. Princeton Series in Geochemistry. Princeton University Press, Pnnceton. NJ
Bianchi TS, Flndlay S (1991) Decomposition of Hudson estu- ary macrophytes. photosynthetic pigment transformations and decay constants. Estuaries 14:65-73
Boon AR, Duineveld GCA (1996) Phytopigments and fatty acids as molecular markers of near-bottom particulate organic matter in the North Sea. J Sea Res 35279-291
Boon AR, Duineveld GCA, Berghuis EM, Van der Weele JA (1998) Relationships between benthic activity and the annual phytopigment cycle in near-bottom water and sediments in the southern North Sea. Estuar Coast Shelf Sci (in press)
Cadee GC (1984) Macrobenthos and macrobenthic remains on the Oyster Ground, North Sea. Neth J Sea Res 18: 160-178
Canfield DE. Jsrgensen BB, Fossing H, Glud R. Gundersen J , Ramsing NB, Thamdrup B, Hansen JW, Nielsen LP, Hall POJ (1993) Pathways of organic carbon oxidation in three continental margin sed~rnents. Mar Geol 113:27-40
Christensen H, Kanneworff E (1985) Sedimenting phyto- plankton as major food source for suspension and deposit feeders In the Dresund. Ophelia 24:223-244

Boon & Duineveld: Chlorophyll a as a carbon marker in North Sea sediments 4 3
Crarner A (1990) Seasonal variation In benthic metabolic activity in a frontal system in the North Sea. In: Barnes M, Gibson RN (eds) Proc 24th Eur Mar Biol Symp. Aberdeen University Press, Aberdeen, p 54-76
Creutzberg F (1985) A persistent chlorophyll a maximum coinciding with an enriched benthlc zone. In: Gibbs PE (ed) Proc 19th Eur Mar Biol Symp. Cambridge University Press, Cambridge, p 97-108
Creutzberg F, Wapenaar P, Duineveld GCA, Lopez Lopez N (1984) Distribution and density of the benthic fauna in the southern North Sea in relation to bottom charactenstics and hydrographical conditions. Rapp PV Reun Cons Int Explor Mer 183:101-110
De Haas H, Boer W, Van Weering TCE (1997) Recent sedi- mentation and organic carbon burial in a shelf sea: the North Sea. Mar Geol 144:131-146
De Wilde PAWJ, Berghuis EM, Kok A (1984) Structure and energy demand of the benthic community of the Oyster Ground, central North Sea. Neth J Sea Res 18:143-159
Duineveld GCA, Kiinitzer A, Niermann U, de Wilde PAWJ, Gray JS (1991) The macrobenthos of the North Sea. Neth J Sea Res 28:53-65
Graf G (1989) Benthic-pelagic coupling In a deep-sea benthic community. Nature 341:43?-439
Holtrnann SE, Belgers JJM, Kracht B, Duineveld GCA (1995) The macrobenthic fauna in the Dutch sector of the North Sea in 1994 and a comparison with previous data. Internal NlOZ report 1995-7
Holtrnann SE, Groenewold A (1994) Distribution of the zoobenthos on the Dutch continental shelf: the western Fnsian Front, Brown Bank and Broad Fourteens. Internal NIOZ report 1994-1
Hiittel M, Ziebis W. Forster S (1996) Flow-induced uptake of particulate matter in permeable sediments. Limnol Oceanogr 41:309-322
Jago CF, Bale AJ, Green MO, Howarth MJ, Jones SE, Mc- Cave IN, Millward GE, Morris AW, Rowden AA. WiUlams JJW (1993) Resuspension processes and seston dynamics, southern North Sea. In: Charnock H, Dyer KR, Huthnance JM. Liss PS, Simpson JH, Tett PB (eds) Understanding the North Sea system. Philos Trans K Soc Lond A 343:4?5-491
Jenness MI, Duineveld GCA (1985) Effects of tldal currents on chlorophyll a content of sandy sediments in the south- ern North Sea. Mar Ecol Prog Ser 21:283-287
Joint I, Pomroy A (1993) Phytoplankton biomass and produc- tion in the southern North Sea. Mar Ecol Prog Ser 99: 169-182
Edltonal responsibihty. Otto Kinne (Editor), Oldendorf/Luhe, Germany
Kanneworff E, Christensen H (1986) Benthic community respiration in relation to sedimentation in the Oresund. Ophelia 26:269-284
Kraay GW, Zapata M, Veldhuis MJW (1992) Separation of chlorophylls c l , c2 and c3 of marine phytoplankton by reverse-phase-C18-high-performance liquid chrornato- graphy. J Phycol 28:708-712
Mantoura RFC. Lle~rellyn CA (1983) The rapid determination of algal chlorophyll and carotenoid pigments and their breakdown products in natural waters by reverse-phase high-performance liquid chromatography. Anal Chim Acta 151:297-314
Otto L, Zimrnerman JTF, Fui-nes GK, Mork M, Stetre R, Becker G (1990) Review of the physical oceanography of the North Sea. Neth J Sea Res 26:161-238
Pfannkuche 0 (1992) Organic carbon flux through the ben- thic community in th.e temperate abyssal northeast Atlantic. In. Rowe GT, Panente V (eds) Deep-sea food chains and the global carbon cycle, Kluwer Academic Press, Dordrecht, p 183-198
Reineck HE (1963) Der Kastengreifer. Nat Mus 93:102-108 Roden EE, Tuttle J H (1996) Carbon cycling in mesohaline
Chesapeake Bay sediments 2. kinetics of particulate and dissolved organic carbon turnover. J Mar Res 54:343-383
Soetaert K, Herman PMJ, Middelburg JJ , De Stlgter HS, Van Weering TCE. Epping E, Helder W (1996) Modeling 2 ' 0 ~ b - derived mixing activity in ocean margin sediments: diffu- sive versus non-local mixing. J Mar Res 54:120?-1227
Sokal RP., Rohlf FJ (1995) Biometry, 3rd edn. The principles and practice of statistics in biological research. Freeman, New York
Sun MY, Aller RC. Lee C (1994) Spatial and temporal distrib- utions of sedimentary chloropigmcnts as indicators of benthic processes in Long Island Sound. J Mar Res 52: 149-176
Sun MY, Lee C, Aller RC (1993) Laboratory s tud~es of oxic and anoxic degradation of chlorophyll a in Long Island Sound sediments. Geochim Cosmochim Acta 57:147-157
Taghon GL, Jumars PA (1984) Variable ingestion rate and its role in optimal foraging behavior of marine deposit feeders. Ecology 65:549-558
Van Duyl FC, Kop AJ (1994) Bacterial production in North Sea sediments: clues to seasonal and spatial variations. Mar Biol 120:323-337
Wheatcroft RA, Olmez I, Pink FX (1994) Particle bioturbation in Massachusetts Ba.y: preliminary results using a deliber- ate tracer technique. J Mar Res 52:1129-1150
Submitted: J u n e 6, 1997; Accepted: November 14, 1997 Proofs received from author(s): Jan uary 30, 1998