A Dataplane Programmable Traffic Marker using Packet Value ...
65
Faculty of Health, Science and Technology Master thesis in Computer Science Second Cycle, 30 hp (ECTS) Supervisor: Prof. Dr. Andreas Kassler, University of Karlstad, Karlstad, SWE <[email protected]> Examiner: Dr. Per Hurtig, University of Karlstad, Karlstad, SWE <[email protected]> Karlstad, August 25th, 2021 A Dataplane Programmable Traffic Marker using Packet Value Concept En Paket Värde Markerare För DataPlan Programerbara Enheter Maher Shaker <[email protected]>
-
Upload
khangminh22 -
Category
Documents
-
view
0 -
download
0
Transcript of A Dataplane Programmable Traffic Marker using Packet Value ...
Faculty of Health, Science and TechnologyMaster thesis in Computer ScienceSecond Cycle, 30 hp (ECTS)Supervisor: Prof. Dr. Andreas Kassler, University of Karlstad, Karlstad, SWE <[email protected]>Examiner: Dr. Per Hurtig, University of Karlstad, Karlstad, SWE <[email protected]>Karlstad, August 25th, 2021
A Dataplane ProgrammableTraffic Marker using Packet ValueConcept
En Paket Värde Markerare För DataPlan Programerbara Enheter
Maher Shaker <[email protected]>

Abstract
Realtime sensitive network applications are emerging and require ultralow latency toreach the desired QoS. A main issue that contributes to latency is excessive bufferingat intermediate switches and routers.
Existing queuing strategies that aim to reduce buffering induced latency typically applya single queue AQM that does not support service differentiation and treats all packetsequally.
The recently proposed per packet value framework utilizes a packet value marker anda packet value aware AQM to solve this issue by supporting service differentiation in asingle queue and introducing more advanced policies for resource sharing. However,the per packet value framework is implemented and tested in a software environmentwith no possibility to study the performance on hardware equipment.
This thesis utilizes P4 to design and implement a packet value marker on dataplaneprogrammable devices. Themarker should be capable of supportingmultiple resourcesharing policies, following resource sharing policies accurately, and not being thebottleneck in the network.
A targetindependent packet value marker is designed and modified with targetdependent P4 constructs to fit the implementation requirements of a Tofino switchand a Netronome smart NIC.
An accurate Tofino implementation using this approach is difficult to achieve becauseof a complicated random number generation process and resource limitation.
Evaluation using a testbed with a Netronome marker shows that the marker achievesdesired functionality with accurate packet value distribution for throughputs largerthan 5000 Kbps. However, the challenge of concurrent packet processing combinedwith a smart NIC that does not have powerful packet processing cores results in themarker having lower throughput and higher latency than expected. The evaluationalso shows that resource limitation in terms of available memory and the number ofsupported policies affects the maximum number of supported users.
We also ported a version to a switching ASIC with limited functionality due to therestrictions of the hardware platform. Our evaluation also provides insights into howsuch a marking scheme performs on different hardware targets and the limitationimposed by such target specific architecture.
iii

KeywordsPPV, SDN, Packet value marker, Resourcesharing
iv
Sammanfattning
Realtids Känsliga nätverksapplikationer utvecklas och kräver ultralåg latens för att nåönskad QoS. Befintliga lösningar på detta problem tillämpar AQM på en enda kö ochstöder inte tjänst differentiering och behandlar alla paket lika.
Det nyligen föreslagna ramverket per packet value löser problemet genom att stödjatjänst differentiering på en kö och införa mer avancerade policyer för resursdelning.Ramverket per packet value implementeras och testas i en mjukvaru miljö utanmöjlighet att studera prestanda på hårdvaru utrustning.
Denna avhandling använder P4 för att designa och implementera en packet valuemarker på dataplan programmerbara enheter. Markern bör kunna stödja fleraresursdelning principer, följa resursdelning principer exakt, och inte vara bottleneckeni nätverket.
En hårdvaruoberoende packet value marker är designad och modifierad medhårdvaruberoende P4konstruktioner för att passa implementerings kraven för enTofino switch och en Netronome smart NIC.
Slumpmässig talgenerering och resursbegränsning resulterar i en misslyckadimplementering av en marker på Tofino med detta tillvägagångssätt.
Utvärdering med hjälp av en testbädd med en Netronome marker visar att ettenanvändarscenario och en slumptalsgenerator orsakar lägre genomströmning ochhögre latens jämförtmed forwarding. Resultaten visar att dennametod förMarkern ärfelaktig när man tillämpar policyer vid lägre genomströmningar. Utvärderingen visarockså att det maximala antalet användare begränsas av minnet och antalet policyersom stöds. Denna utvärdering ger inblick i hur en sådanmarking algoritm är designadoch svårigheterna med implementering för olika hårdvara.
NyckelordPPV, SDN, Packet value marker, Resourcesharing
v

Acknowledgements
I would like to thank my supervisor and mentor, Prof. Andreas Kassler at KarlstadUniversity for the active support, encouragement and great ideas throughout theproject. I am also thankful to Ludwig Toresson for the support and for being anenjoyable colleague. I would also like to thank Jonatan Langlet and Jonathan Vestinfor sharing their knowledge and helping with important milestones of the project. Iam grateful for Ericsson Research for their fast feedback and help during the project.Lastly, I am thankful formy family and friends that have supportedme throughout thisjourney.
vi
Acronyms
API Application Programming Interface
AQM Active Queue Management
ASIC Application Specific Integrated Circuit
CoDel Controlled Delay
CPU Central Processing Unit
CTM Cluster Target Memory
CTV Congetion Threshold Value
DDR3 Double Data Rate 3
DiffServ Diffreciated Services
eCDF Empirical Distribution Function
EMEM External Memory
FLENT FLExible Network Tester
FPC Flow Processing Core
IMEM Internal Memory
IP Internet Protocol
LM Local Memory
NFP Network Flow Processor
NIC Network Interface Card
NUM Network Utility Maximization
OS Operating System
P4 Programming Protocolindependent Packet Processors
PCAP Packet CAPture
PCIe Peripheral Component Interconnect Express
PI Proportional Integral Controller
vii
PIE Proportional Integral Controller Enhanced
PPC Packet Processing Cores
PPV Per Packet Value
PV Packet Value
PVPIE Per Packet Value Proportional Integral Controller Enhanced
QoS Quality of Service
RED Random Early Detection
REM Random Exponential Marking
RNG Random Number Generator
RRED Adaptive Random Early Detection
RRUL Realtime Response Under Load
SDN Software Defined Networking
TCP Transmission Control Protocol
TVF Throughput Value Function
UDP User Datagram Protocol
viii
Contents
1 Introduction 11.1 Background . . . . . . . . . . . . . . . . . . . . . . . . . . . . . . . . . . 11.2 Objectives and Goals . . . . . . . . . . . . . . . . . . . . . . . . . . . . 21.3 Ethics and Sustainability . . . . . . . . . . . . . . . . . . . . . . . . . . 31.4 Thesis Outline . . . . . . . . . . . . . . . . . . . . . . . . . . . . . . . . 3
2 Background and Related Work 42.1 Software Defined Networking . . . . . . . . . . . . . . . . . . . . . . . . 42.2 Dataplane Programming . . . . . . . . . . . . . . . . . . . . . . . . . . 5
2.2.1 P4 . . . . . . . . . . . . . . . . . . . . . . . . . . . . . . . . . . . 52.2.2 General P4 Architecture . . . . . . . . . . . . . . . . . . . . . . . 62.2.3 General P4 constructs . . . . . . . . . . . . . . . . . . . . . . . . 82.2.4 Limitation Of P4 . . . . . . . . . . . . . . . . . . . . . . . . . . . 10
2.3 P4 Programmable Hardware Targets . . . . . . . . . . . . . . . . . . . 112.3.1 Tofino Architecture . . . . . . . . . . . . . . . . . . . . . . . . . . 112.3.2 Netronome NFP4000 Architecture . . . . . . . . . . . . . . . . 12
2.4 Limitation of P4 in Programmable Hardware . . . . . . . . . . . . . . . 162.5 Related Works . . . . . . . . . . . . . . . . . . . . . . . . . . . . . . . . 17
2.5.1 Per Packet Value . . . . . . . . . . . . . . . . . . . . . . . . . . 172.5.2 Per Packet Value Marker . . . . . . . . . . . . . . . . . . . . . . 172.5.3 Per Packet Value AQM . . . . . . . . . . . . . . . . . . . . . . . 202.5.4 Packet Value Based L4S Scheduling . . . . . . . . . . . . . . . 202.5.5 P4 Based L4S AQM With Emulated HQoS . . . . . . . . . . . . 21
3 Marker Design 223.1 Important Concepts . . . . . . . . . . . . . . . . . . . . . . . . . . . . . 223.2 Design Overview . . . . . . . . . . . . . . . . . . . . . . . . . . . . . . . 23
3.2.1 Table Functionality . . . . . . . . . . . . . . . . . . . . . . . . . . 243.2.2 Traffic Identification . . . . . . . . . . . . . . . . . . . . . . . . . 243.2.3 Rate Calculation . . . . . . . . . . . . . . . . . . . . . . . . . . . 263.2.4 Random Number Generation . . . . . . . . . . . . . . . . . . . . 273.2.5 Throughput Value Functions . . . . . . . . . . . . . . . . . . . . 273.2.6 Pipeline Summery . . . . . . . . . . . . . . . . . . . . . . . . . . 30
3.3 Summary . . . . . . . . . . . . . . . . . . . . . . . . . . . . . . . . . . . 30
ix
CONTENTS
4 Challenges 314.1 Tofino challenges . . . . . . . . . . . . . . . . . . . . . . . . . . . . . . . 31
4.1.1 Random Number Generation . . . . . . . . . . . . . . . . . . . . 314.1.2 Resources and Memory . . . . . . . . . . . . . . . . . . . . . . . 32
4.2 Netronome Challenges . . . . . . . . . . . . . . . . . . . . . . . . . . . 324.2.1 Topology Bottleneck and Throughput throttling . . . . . . . . . . 334.2.2 Race Conditions . . . . . . . . . . . . . . . . . . . . . . . . . . . 33
5 Implementation 365.1 Tofino . . . . . . . . . . . . . . . . . . . . . . . . . . . . . . . . . . . . . 36
5.1.1 Tofino Rate Calculation . . . . . . . . . . . . . . . . . . . . . . . 365.1.2 Tofino Random Number Generation . . . . . . . . . . . . . . . . 38
5.2 Netronome Agilio CX SmartNIC Implementation . . . . . . . . . . . . . 405.2.1 Netronome Random Number Generation . . . . . . . . . . . . . 40
5.3 Summary . . . . . . . . . . . . . . . . . . . . . . . . . . . . . . . . . . . 41
6 Evaluation 426.1 Evaluation Setup . . . . . . . . . . . . . . . . . . . . . . . . . . . . . . . 42
6.1.1 Testbed . . . . . . . . . . . . . . . . . . . . . . . . . . . . . . . . 426.2 Evaluation Metrics . . . . . . . . . . . . . . . . . . . . . . . . . . . . . . 43
6.2.1 Throughput . . . . . . . . . . . . . . . . . . . . . . . . . . . . . . 436.2.2 Packet Value Distribution . . . . . . . . . . . . . . . . . . . . . . 436.2.3 Hardware Resource Utilization . . . . . . . . . . . . . . . . . . . 44
6.3 Packet Value Distribution . . . . . . . . . . . . . . . . . . . . . . . . . . 446.4 Hardware Capacity Evaluation . . . . . . . . . . . . . . . . . . . . . . . 46
6.4.1 Tofino Memory utilization . . . . . . . . . . . . . . . . . . . . . . 466.4.2 Netronome Memory utilization . . . . . . . . . . . . . . . . . . . 47
6.5 Throughput and Latency Evaluation . . . . . . . . . . . . . . . . . . . . 486.5.1 Marker Versus Simple Forwarding . . . . . . . . . . . . . . . . . 486.5.2 Effect of Random Number Generation . . . . . . . . . . . . . . . 50
7 Conclusion and Future work 52
References 53
x
Chapter 1
Introduction
1.1 BackgroundRemote surgery [38], financial trading [15], and cloud gaming [35] are examples ofemerging services that require ultralow latency network communication for reliabilityand responsiveness. Latency is one of the factors that affect the quality of service (QoS)(e.g., guaranteed performance) for a network service. Examples of other QoS factorsare packet loss and throughput.
Current networks strive for more speed and are designed to reach higher capacityusing large buffers to temporarily store more inflight packets in order to enable TCPto increase its sending rate. The large buffers introduce a problem where bottlenecklinks cause the buffers to fill up and drop packets. This problem is called bufferbloat[11] and is prominent in single buffer switches. It causes a high latency in the trafficbecause the large buffers lead to packets waiting a long time before they are processed.Bufferbloat is widespread in most networks and needs to be addressed to reach theultralow latency requirement.
Active queue management (AQM) are used as a mitigation tactic to minimize thebufferbloat problem and decrease the latency. AQMs are schemes that manage thebottleneck queue/buffer by dropping packets based on queue size or other packetstatistics. Examples of AQMs that manage a single queue are RED [10], REM [2],RRED [37], CoDel [25], PI2 [6], and PIE [30].
Typical AQMs treat all the packets equallywhile using FIFOqueuing. They do not allowfor configurable resource sharing to give priority to latencysensitive traffic. A serviceclass aware AQM is needed to distinguish between latencysensitive traffic and regulartraffic and apply resource sharing to prioritize low latency traffic.
The Per Packet Value (PPV) concept [22] introduces a packet marker and a Packet
1
CHAPTER 1. INTRODUCTION
Value (PV) aware AQM that work together to achieve both low latency and servicedifferentiation. PPV allows for more advanced resource sharing where flows may havea proportional relationship with other flows that allow them to gain a configurablethroughput advantage/disadvantage compared to flows of other traffic classes incertain throughput ranges.
This concept has mostly been implemented on emulators in Linux without thepossibility to study performance aspects and implementation constraints of realhardware.
New hardware that supports configurable match tables [12] allows additionalfunctionality to be implemented on reprogrammable ASICs and smart NetworkInterface Cards (NIC). The programmable devices use the highlevel language P4[26] to program the pipeline that packets pass through. This allows for moredynamic implementation and testing of new concepts without the need to developfixedfunction hardware that limits the development of new features for existingimplementations.
1.2 Objectives and GoalsThis thesis aims to implement and evaluate a marking scheme inside a dataplaneprogrammable network device like a switch or a smart NIC. This marking schememarks incoming packets based on two factors: the throughput and the packetattributes. The throughput describes the desired rate of a service while the packetattributes describe the service classification of user traffic. This marking algorithmallows for a wide range of policies, a light execution, and single queue resourcesharing that supports prioritization of one flow over the other in a specified throughputrange.
The marker may be positioned as an internal network node or an edge node, as is donefor this approach. The marker works in conjunction with a PV aware AQM. The AQMaims to maintain a certain queue length and considers the marking whenmaking dropdecisions [33].
The goal of this thesis is to design a targetindependent PV marker and implement iton a Tofino programmable switch and a Netronome smart NIC. The packet markerimplementation should fulfill the following requirements:
• Assign correct PVs to traffic
• Handle throughputs in the order of Gbps
• Support a large number of simultaneous users
• Support multiple PV functions or traffic classes, each with its own marking
2
CHAPTER 1. INTRODUCTION
function that maps between throughput and packet value
1.3 Ethics and SustainabilityThe focus of this project is to help the network handle the pressure of traffic and at thesame time deliver a smooth experience for the users. This advancement is a necessarycounter measurement to bufferbloat and ensures a more smooth internet experienceto the overall userbase.
The marker implementation on dataplane programmable devices increasessustainability by removing the need to develop new hardware for new iterations ofthe marker while allowing network administrators to quickly scale the operation bysupporting more resource sharing configurations or using more devices.
This project may be seen as an advancement that goes against net neutrality [18]because it introduces traffic prioritization and throttling of certain traffic types.
1.4 Thesis OutlineThis thesis is structured as follows. Concepts, related works, and other essentialbackground information are presented in section 2. A description of a targetindependent PV marker design is detailed in section 3. Challenges during Tofinoand Netronome implementations are described in section 4. Targetdependent P4constructs in the Tofino and Netronome smart NIC implementations are detailed insection 5. Testbed setup and evaluation of the marker in Tofino and Netronome smartNIC are presented in section 6. Finally, section 7 concludes the thesis and proposesfuture work.
3
Chapter 2
Background and Related Work
This section covers subjects, methods, and technologies that lay the ground for thisthesis. Essential concepts such as Software Defined Networking are explored. P4 isintroduced. The architectures of the Tofino switch and theNetronome smartNICusingNFP4000 are explained to gain a better understanding of the hardware used for thisthesis. Lastly, the PPV concept that inspired this thesis is explained.
2.1 Software Defined NetworkingCurrent network architectures are dominated by infrastructure that leave little to noconfigurability. Once a feature is outdated or is insecure, it is turned off insteadof removed, because it is the easier option. When adding or removing a feature, ahardware revision needs to be implemented, tested, and later reviewedwith the chanceof becoming a standard.
Software Defined Networking (SDN) aims to addresses this issue by separating thenetwork functions into control and data plane and adding programmability andconfigurability to the controlplane. Dataplane programming on the other hand makesthe data plane programmable and allows modification of packet processing functionswithout the need for hardware revisions. Dataplane programming means that featurerevisions can be as simple as changing the code that is run closer to the hardware.Further descriptions of these solutions are presented below.
The introduction of controlplane and dataplane and how they interact is necessary tounderstand the concpet of software defined networking andwhat it adds to the networkinfrastructure.
• The controlplane controls the forwarding of packets by filling forwarding tablesthat are defined in the dataplane. The controlplane may also control many otherfunctions by filling dataplane defined tables to achieve a desired result. It acts asthe smart part of the forwarding device that allows for more complex operationsand interacts with the dataplane to reach advanced networking functionality.
4
CHAPTER 2. BACKGROUND AND RELATEDWORK
In order to configure tables, it typically runs routing algorithms to definedconsistent forwarding state throughout the network.
• The dataplane forwards packets from the ingress port towards an egress portas instructed by the tables that are filled by the control plane. For each packetthat enters the data plane, multiple table matches are executed that may result inactions to rewrite andmodify (parts) of the packet headers during the forwardingexecution process.
Software defined networking aims to separate the controlplane from the forwardingfunctionality (dataplane) inside network infrastructure. The controlplane is moved toan external SDN controller that is a software platform that runs on server hardware.The SDN controller interacts with the dataplane and is programmable throughsoftware applications that run on top of the controller [19].
The separation of the controlplane and the dataplane in the network infrastructureadds more configurability, programmability and scalability. The addition ofcontrolplane programmability allows networkmaintainers tomodify some behivour ofpacket processing hardware and thus removes the need for hardware revisions in somecases. Although SDNs introduce a major change to networking that makes networkdevelopment more efficient, it requires a complete overhaul to the internal networkwhere it is applied. Besides the need to change the majority of the hardware on theinternal network, SDNs still require a change of hardware once the SDN providerreleases a new version of the technology.
Dataplane programming using P4 is a solution that addresses the shortcomingsof SDNs. Dataplane programmability introduces more configurability closer tothe hardware. The combination of an SDN programmable controlplane and a P4programmable dataplane results in a fully configurable packet processing device thatallows for functionality revisions without the need for new hardware design.
2.2 Dataplane Programming
2.2.1 P4Programming protocolindependent Packet Processors (P4) is a framework that aimsto add dataplane programmability to programmable switching ASICs and otherprogrammable network packet processing hardware that are programmable using theReconfigurable MatchAction Table (RMT) model.
The RMTmodel enables hardware flexibility and features a packet processing pipelinewith a programmable parser, the ability to define and fully configurematchtables, andthe ability to define and fully configure programmable actions that enable arbitrarymodification of packet headers [5].
The goal of P4 is to make network device programming and reconfigurability more
5
CHAPTER 2. BACKGROUND AND RELATEDWORK
straightforward than it is today. It aims to deliver a framework that lets developerswrite code that does not depend on the type of hardware that a network device has[4]. In providing the highlevel framework that makes it easy for developers to getinto, it helps encourage the implementation and widespread use of current and newprotocols, thus diversifying the internet and partially breaking down the walls that aremiddle boxes.
P4 defines a packet processing pipeline that is specified by a developer using highlevelprogramming language P4. The pipeline is then parsed and compiled to intermediaterepresentation language that is target independent. A backend compiler furthercompiles the intermediate representation language to a specific target.
The advantage of P4 is not only its implementation in software switches and nonspecialized hardware, but its target independent structure that makes it flexible andeasier to adapt by manufacturers.The P4 framework also has its drawbacks when it comes to variety of hardware targets.Different targets have diverse features and may require different syntax for someconstructs in P4. This means that a targetdependent P4 code cannot be easily portedbetween all target hardware. The original version of P4 is called P4 14. This versionwasshipped as a single unit that is complex and requires more than 70 keywords to utilizeall the features. P4 16 is the next version that came after P4 14 and aimed to simplifythe language and make it more flexible and lightweight. The P4 16 version divided theframework into: the P4 16 language, the core library for the language, and a multitudeof libraries that are architecture specific and are specified by the manufacturer ofeach target. The move into multiple libraries simplified the language and lowered thekeyword count to less than 40 [27]. When P4 is mentioned throughout this paper, it isreferring to P4 16.
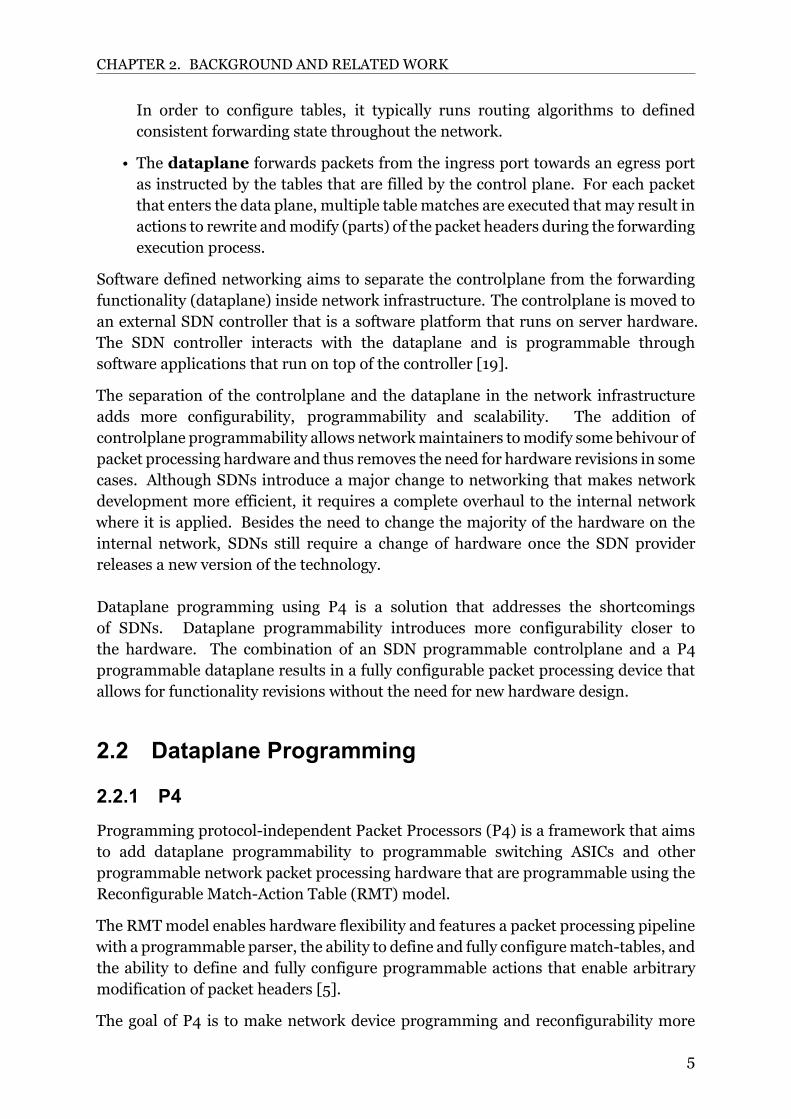
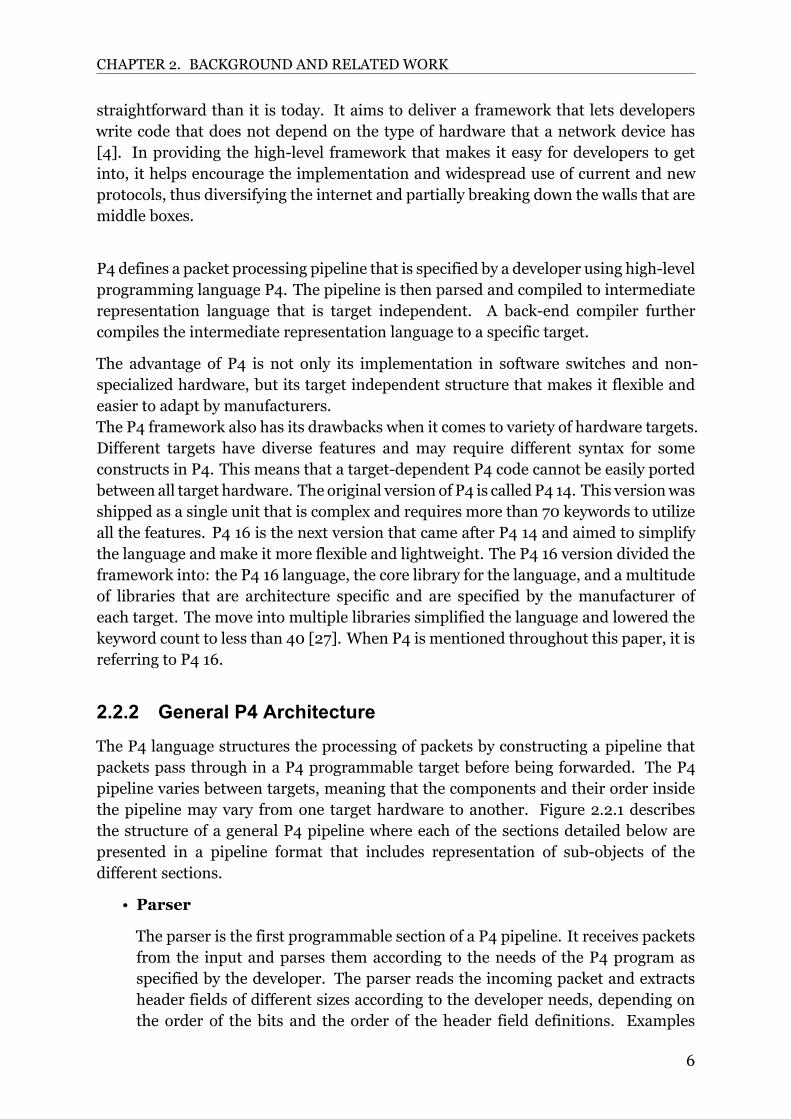
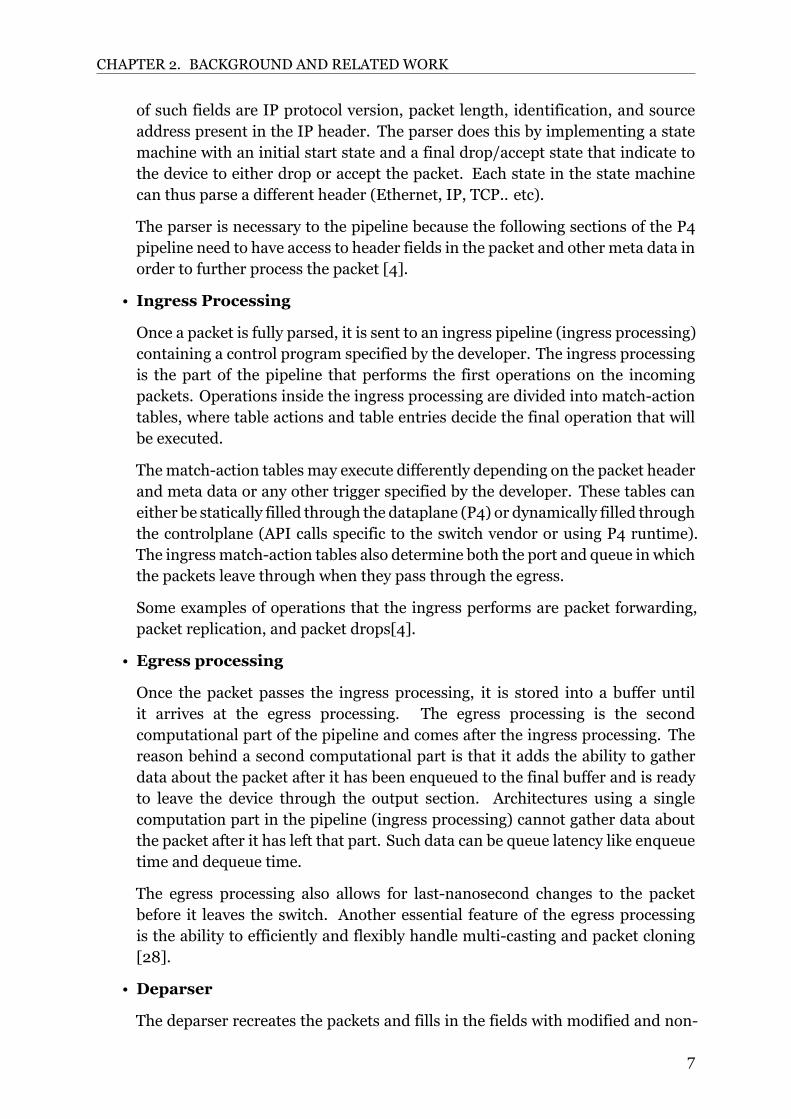
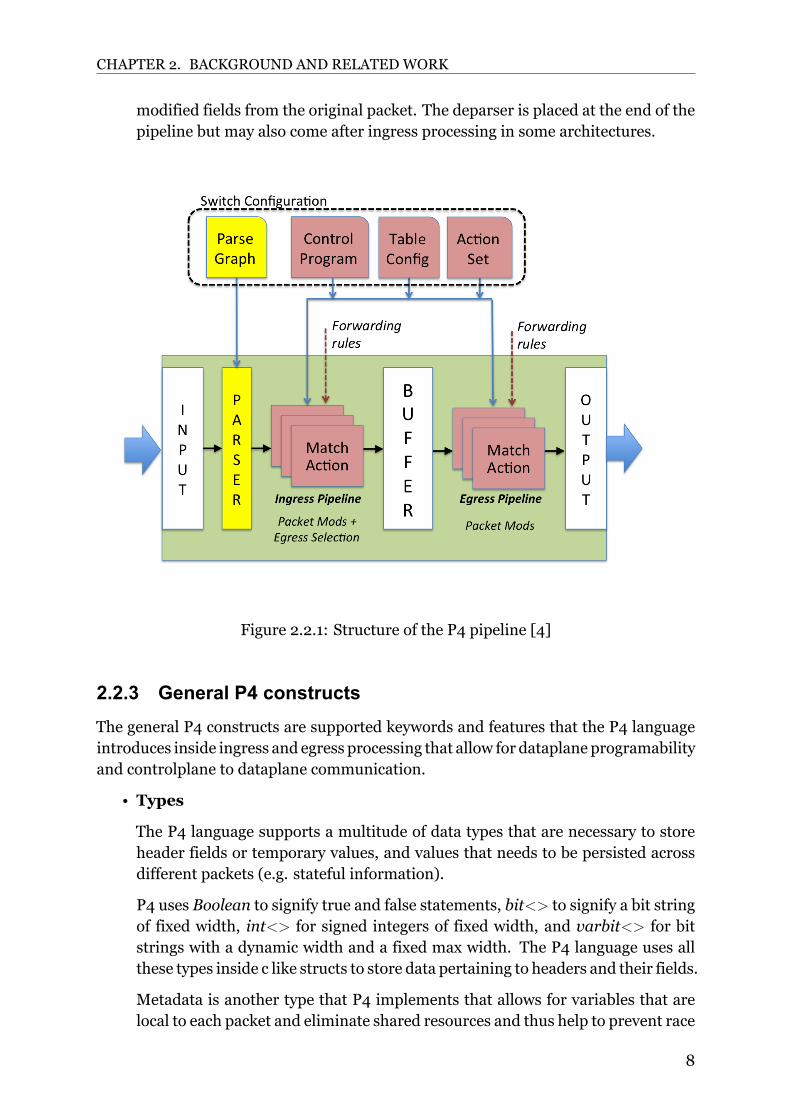
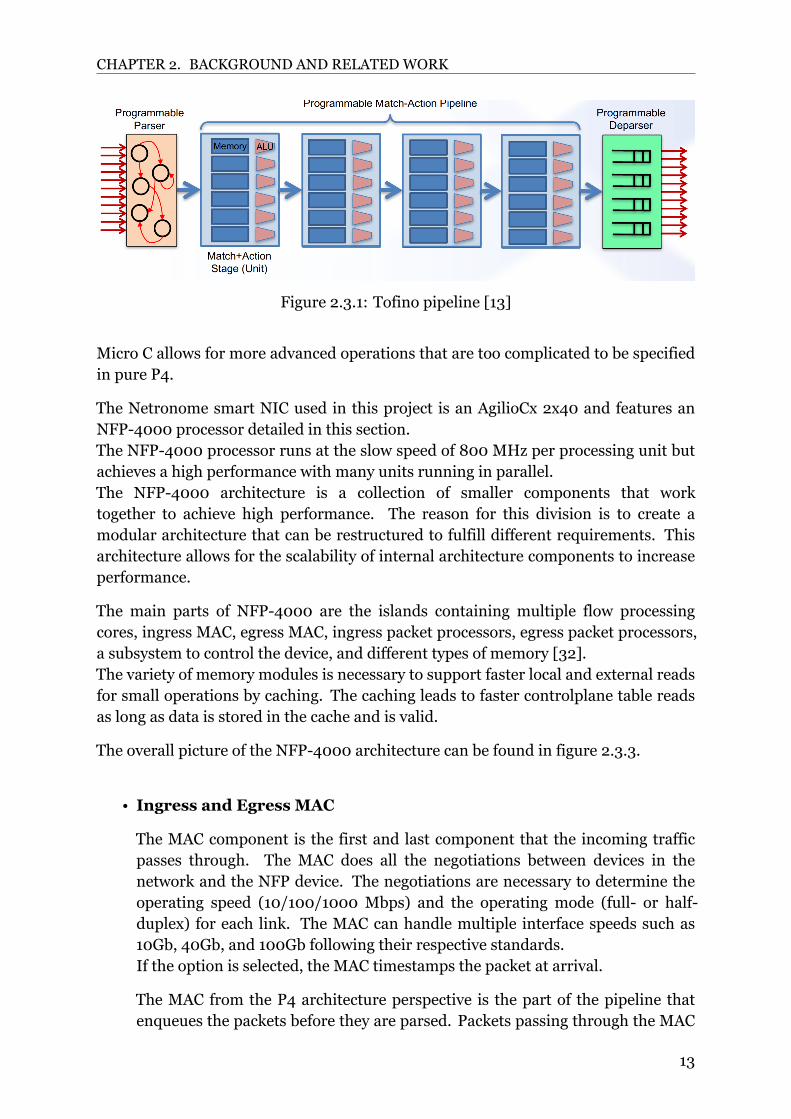
2.2.2 General P4 ArchitectureThe P4 language structures the processing of packets by constructing a pipeline thatpackets pass through in a P4 programmable target before being forwarded. The P4pipeline varies between targets, meaning that the components and their order insidethe pipeline may vary from one target hardware to another. Figure 2.2.1 describesthe structure of a general P4 pipeline where each of the sections detailed below arepresented in a pipeline format that includes representation of subobjects of thedifferent sections.
• Parser
The parser is the first programmable section of a P4 pipeline. It receives packetsfrom the input and parses them according to the needs of the P4 program asspecified by the developer. The parser reads the incoming packet and extractsheader fields of different sizes according to the developer needs, depending onthe order of the bits and the order of the header field definitions. Examples
6
CHAPTER 2. BACKGROUND AND RELATEDWORK
of such fields are IP protocol version, packet length, identification, and sourceaddress present in the IP header. The parser does this by implementing a statemachine with an initial start state and a final drop/accept state that indicate tothe device to either drop or accept the packet. Each state in the state machinecan thus parse a different header (Ethernet, IP, TCP.. etc).
The parser is necessary to the pipeline because the following sections of the P4pipeline need to have access to header fields in the packet and other meta data inorder to further process the packet [4].
• Ingress Processing
Once a packet is fully parsed, it is sent to an ingress pipeline (ingress processing)containing a control program specified by the developer. The ingress processingis the part of the pipeline that performs the first operations on the incomingpackets. Operations inside the ingress processing are divided into matchactiontables, where table actions and table entries decide the final operation that willbe executed.
Thematchaction tables may execute differently depending on the packet headerand meta data or any other trigger specified by the developer. These tables caneither be statically filled through the dataplane (P4) or dynamically filled throughthe controlplane (API calls specific to the switch vendor or using P4 runtime).The ingressmatchaction tables also determine both the port and queue in whichthe packets leave through when they pass through the egress.
Some examples of operations that the ingress performs are packet forwarding,packet replication, and packet drops[4].
• Egress processing
Once the packet passes the ingress processing, it is stored into a buffer untilit arrives at the egress processing. The egress processing is the secondcomputational part of the pipeline and comes after the ingress processing. Thereason behind a second computational part is that it adds the ability to gatherdata about the packet after it has been enqueued to the final buffer and is readyto leave the device through the output section. Architectures using a singlecomputation part in the pipeline (ingress processing) cannot gather data aboutthe packet after it has left that part. Such data can be queue latency like enqueuetime and dequeue time.
The egress processing also allows for lastnanosecond changes to the packetbefore it leaves the switch. Another essential feature of the egress processingis the ability to efficiently and flexibly handle multicasting and packet cloning[28].
• Deparser
The deparser recreates the packets and fills in the fields with modified and non
7
CHAPTER 2. BACKGROUND AND RELATEDWORK
modified fields from the original packet. The deparser is placed at the end of thepipeline but may also come after ingress processing in some architectures.
Figure 2.2.1: Structure of the P4 pipeline [4]
2.2.3 General P4 constructsThe general P4 constructs are supported keywords and features that the P4 languageintroduces inside ingress and egress processing that allow for dataplane programabilityand controlplane to dataplane communication.
• Types
The P4 language supports a multitude of data types that are necessary to storeheader fields or temporary values, and values that needs to be persisted acrossdifferent packets (e.g. stateful information).
P4 uses Boolean to signify true and false statements, bit<> to signify a bit stringof fixed width, int<> for signed integers of fixed width, and varbit<> for bitstrings with a dynamic width and a fixed max width. The P4 language uses allthese types inside c like structs to store data pertaining to headers and their fields.
Metadata is another type that P4 implements that allows for variables that arelocal to each packet and eliminate shared resources and thus help to prevent race
8
CHAPTER 2. BACKGROUND AND RELATEDWORK
conditions caused by parallelism.
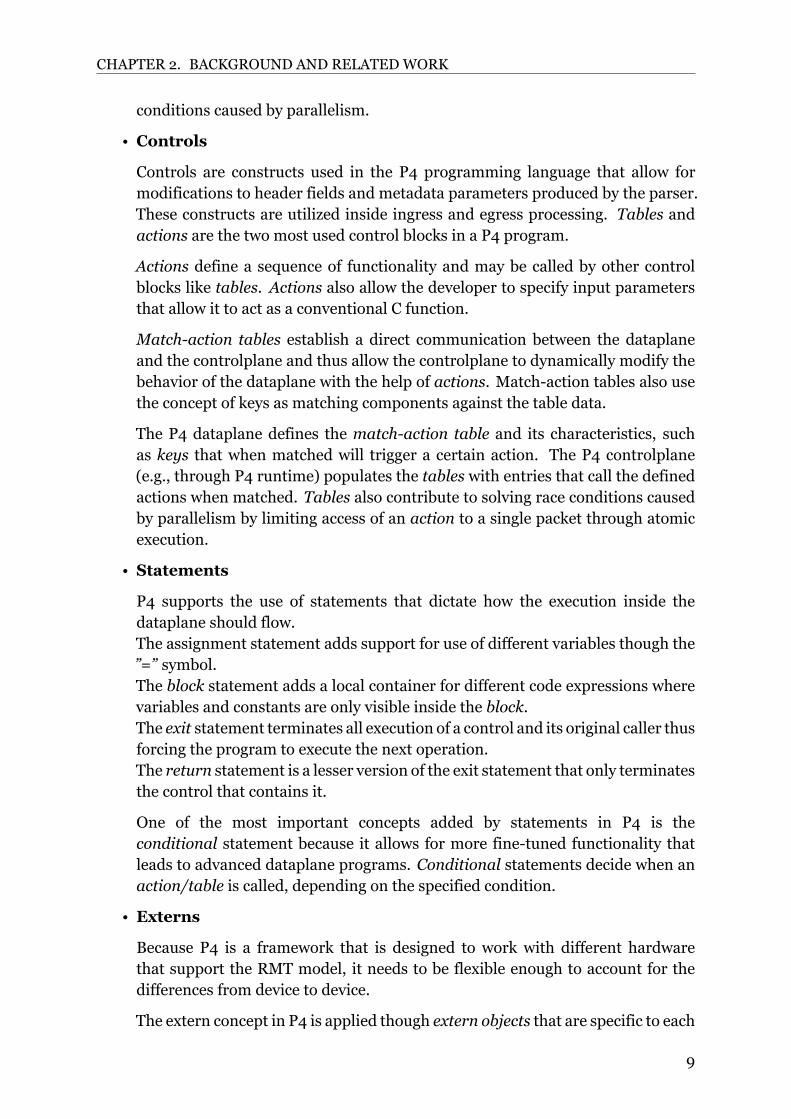
• Controls
Controls are constructs used in the P4 programming language that allow formodifications to header fields and metadata parameters produced by the parser.These constructs are utilized inside ingress and egress processing. Tables andactions are the two most used control blocks in a P4 program.
Actions define a sequence of functionality and may be called by other controlblocks like tables. Actions also allow the developer to specify input parametersthat allow it to act as a conventional C function.
Matchaction tables establish a direct communication between the dataplaneand the controlplane and thus allow the controlplane to dynamically modify thebehavior of the dataplane with the help of actions. Matchaction tables also usethe concept of keys as matching components against the table data.
The P4 dataplane defines the matchaction table and its characteristics, suchas keys that when matched will trigger a certain action. The P4 controlplane(e.g., through P4 runtime) populates the tables with entries that call the definedactions when matched. Tables also contribute to solving race conditions causedby parallelism by limiting access of an action to a single packet through atomicexecution.
• Statements
P4 supports the use of statements that dictate how the execution inside thedataplane should flow.The assignment statement adds support for use of different variables though the”=” symbol.The block statement adds a local container for different code expressions wherevariables and constants are only visible inside the block.The exit statement terminates all execution of a control and its original caller thusforcing the program to execute the next operation.The return statement is a lesser version of the exit statement that only terminatesthe control that contains it.
One of the most important concepts added by statements in P4 is theconditional statement because it allows for more finetuned functionality thatleads to advanced dataplane programs. Conditional statements decide when anaction/table is called, depending on the specified condition.
• Externs
Because P4 is a framework that is designed to work with different hardwarethat support the RMT model, it needs to be flexible enough to account for thedifferences from device to device.
The extern concept in P4 is applied though extern objects that are specific to each
9
CHAPTER 2. BACKGROUND AND RELATEDWORK
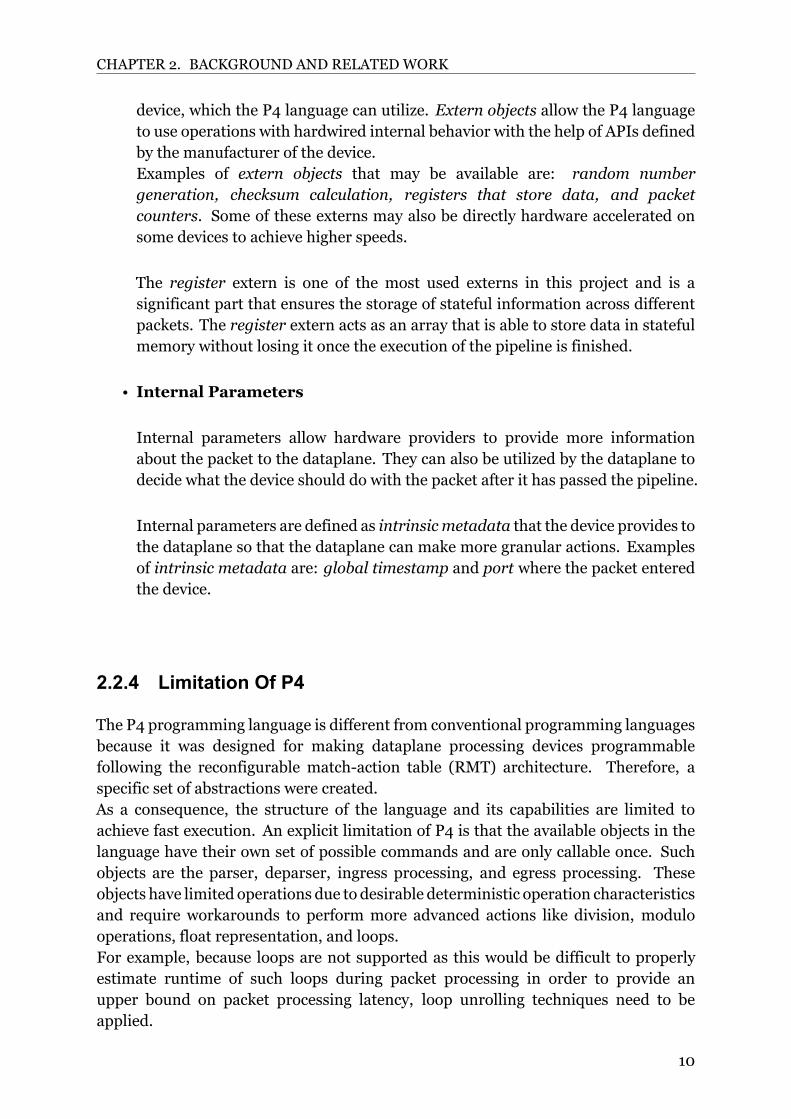
device, which the P4 language can utilize. Extern objects allow the P4 languageto use operations with hardwired internal behavior with the help of APIs definedby the manufacturer of the device.Examples of extern objects that may be available are: random numbergeneration, checksum calculation, registers that store data, and packetcounters. Some of these externs may also be directly hardware accelerated onsome devices to achieve higher speeds.
The register extern is one of the most used externs in this project and is asignificant part that ensures the storage of stateful information across differentpackets. The register extern acts as an array that is able to store data in statefulmemory without losing it once the execution of the pipeline is finished.
• Internal Parameters
Internal parameters allow hardware providers to provide more informationabout the packet to the dataplane. They can also be utilized by the dataplane todecide what the device should do with the packet after it has passed the pipeline.
Internal parameters are defined as intrinsicmetadata that the device provides tothe dataplane so that the dataplane can make more granular actions. Examplesof intrinsic metadata are: global timestamp and port where the packet enteredthe device.
2.2.4 Limitation Of P4
The P4 programming language is different from conventional programming languagesbecause it was designed for making dataplane processing devices programmablefollowing the reconfigurable matchaction table (RMT) architecture. Therefore, aspecific set of abstractions were created.As a consequence, the structure of the language and its capabilities are limited toachieve fast execution. An explicit limitation of P4 is that the available objects in thelanguage have their own set of possible commands and are only callable once. Suchobjects are the parser, deparser, ingress processing, and egress processing. Theseobjects have limited operations due to desirable deterministic operation characteristicsand require workarounds to perform more advanced actions like division, modulooperations, float representation, and loops.For example, because loops are not supported as this would be difficult to properlyestimate runtime of such loops during packet processing in order to provide anupper bound on packet processing latency, loop unrolling techniques need to beapplied.
10

CHAPTER 2. BACKGROUND AND RELATEDWORK
2.3 P4 Programmable Hardware TargetsThe programmable network devices used in this project are a first generation Tofinoswitching ASIC and a Netronome AgilioCX 2x40 SmartNIC. Architectures for theTofino switch and the Netronome smart NIC are presented below. The architecturedescriptions include how the devices implement a controlplane and a dataplane andthe interaction between them.
2.3.1 Tofino ArchitectureTofino is a P4programmableEthernet packet processor thatwas developed byBarefootNetworks (recently acquired by Intel). Tofino is special because it is an applicationspecific integrated circuit (ASIC) chip that features a programmable dataplane throughP4. This makes Tofino a versatile device that also provides terabit speeds.
Details on the Tofino architecture are not publicly available because it is a new deviceat the forefront of switch technology. Only general architecture layouts are availableand will be presented here.
As figure 2.3.1 shows, the Tofino switch pipeline starts with a programmable parserthat follows the same construction as a P4 parser by dividing the process into a numberof states. The parser is followed by a programmable matchaction pipeline also calledthe ingress pipeline. The ingress pipeline is one of the main processing units that areutilized to use and modify parsed packet headers to achieve an advanced functionalityin both the controlplane and the dataplane. The ingress pipeline sends the processeddata to a deparser that reassembles the packet and sends it into an output queue.
The pipeline presented in figure 2.3.1 may be repeated multiple times, depending onthe Tofino hardware model. This is done to allow for more processing time and thusto allow the implementation of more complex functions.The Tofino model used in this project uses two pipelines, one for ingress processing,and one for egress processing.
Tofino tables is one of the most important concepts used inside ingress processing toachieve a functional PV marker.Tofino mainly uses two types of memory to achieve table matching of different typessuch as range match and exact match. These memory types are TCAM /for rangematches) and SRAM (for exact matches) and are described below.
• SRAM
Static Random Access Memory (SRAM) is a volatile and fast memory that is ableto store information in bits. It uses latching circuitry to store each bit.SRAM is used in Tofino in combination with an arithmetic logic unit to achieveextremely fast and simple table matching of exact values in P4 [8].
11
CHAPTER 2. BACKGROUND AND RELATEDWORK
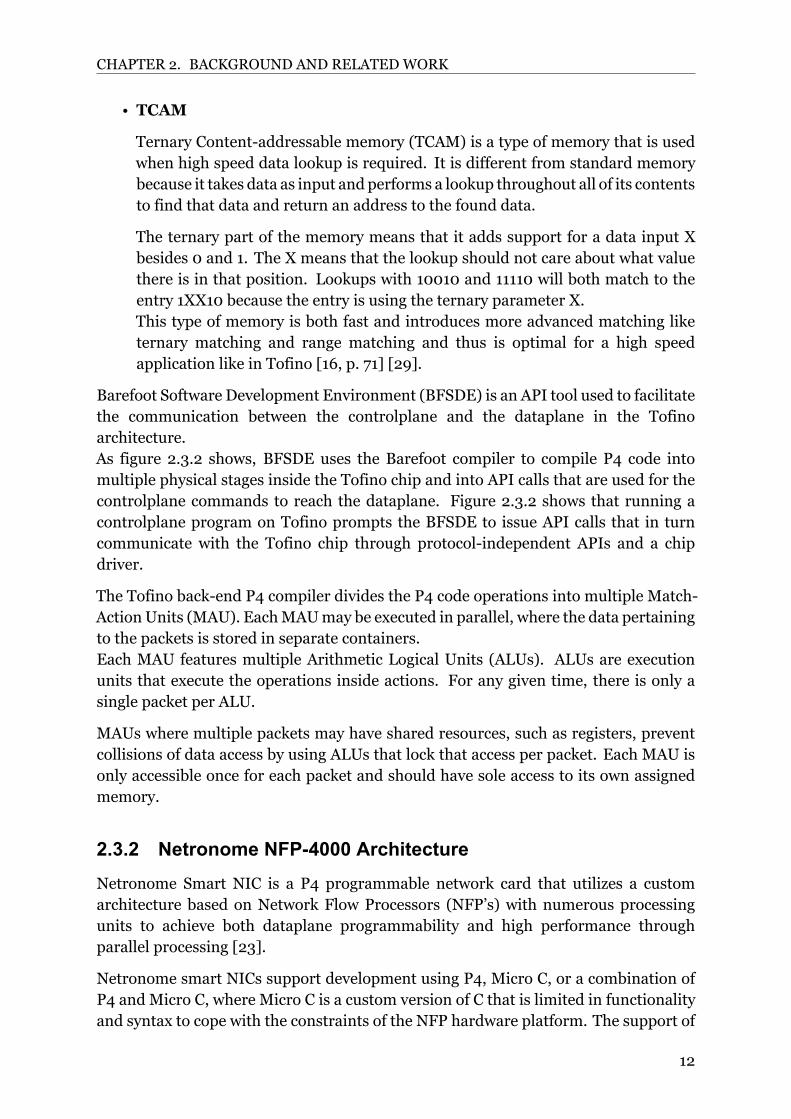
• TCAM
Ternary Contentaddressable memory (TCAM) is a type of memory that is usedwhen high speed data lookup is required. It is different from standard memorybecause it takes data as input and performs a lookup throughout all of its contentsto find that data and return an address to the found data.
The ternary part of the memory means that it adds support for a data input Xbesides 0 and 1. The X means that the lookup should not care about what valuethere is in that position. Lookups with 10010 and 11110 will both match to theentry 1XX10 because the entry is using the ternary parameter X.This type of memory is both fast and introduces more advanced matching liketernary matching and range matching and thus is optimal for a high speedapplication like in Tofino [16, p. 71] [29].
Barefoot Software Development Environment (BFSDE) is an API tool used to facilitatethe communication between the controlplane and the dataplane in the Tofinoarchitecture.As figure 2.3.2 shows, BFSDE uses the Barefoot compiler to compile P4 code intomultiple physical stages inside the Tofino chip and into API calls that are used for thecontrolplane commands to reach the dataplane. Figure 2.3.2 shows that running acontrolplane program on Tofino prompts the BFSDE to issue API calls that in turncommunicate with the Tofino chip through protocolindependent APIs and a chipdriver.
The Tofino backend P4 compiler divides the P4 code operations into multiple MatchAction Units (MAU). EachMAUmay be executed in parallel, where the data pertainingto the packets is stored in separate containers.Each MAU features multiple Arithmetic Logical Units (ALUs). ALUs are executionunits that execute the operations inside actions. For any given time, there is only asingle packet per ALU.
MAUs where multiple packets may have shared resources, such as registers, preventcollisions of data access by using ALUs that lock that access per packet. Each MAU isonly accessible once for each packet and should have sole access to its own assignedmemory.
2.3.2 Netronome NFP4000 ArchitectureNetronome Smart NIC is a P4 programmable network card that utilizes a customarchitecture based on Network Flow Processors (NFP’s) with numerous processingunits to achieve both dataplane programmability and high performance throughparallel processing [23].
Netronome smart NICs support development using P4, Micro C, or a combination ofP4 and Micro C, where Micro C is a custom version of C that is limited in functionalityand syntax to cope with the constraints of the NFP hardware platform. The support of
12
CHAPTER 2. BACKGROUND AND RELATEDWORK
Figure 2.3.1: Tofino pipeline [13]
Micro C allows for more advanced operations that are too complicated to be specifiedin pure P4.
The Netronome smart NIC used in this project is an AgilioCx 2x40 and features anNFP4000 processor detailed in this section.The NFP4000 processor runs at the slow speed of 800 MHz per processing unit butachieves a high performance with many units running in parallel.The NFP4000 architecture is a collection of smaller components that worktogether to achieve high performance. The reason for this division is to create amodular architecture that can be restructured to fulfill different requirements. Thisarchitecture allows for the scalability of internal architecture components to increaseperformance.
The main parts of NFP4000 are the islands containing multiple flow processingcores, ingress MAC, egress MAC, ingress packet processors, egress packet processors,a subsystem to control the device, and different types of memory [32].The variety of memory modules is necessary to support faster local and external readsfor small operations by caching. The caching leads to faster controlplane table readsas long as data is stored in the cache and is valid.
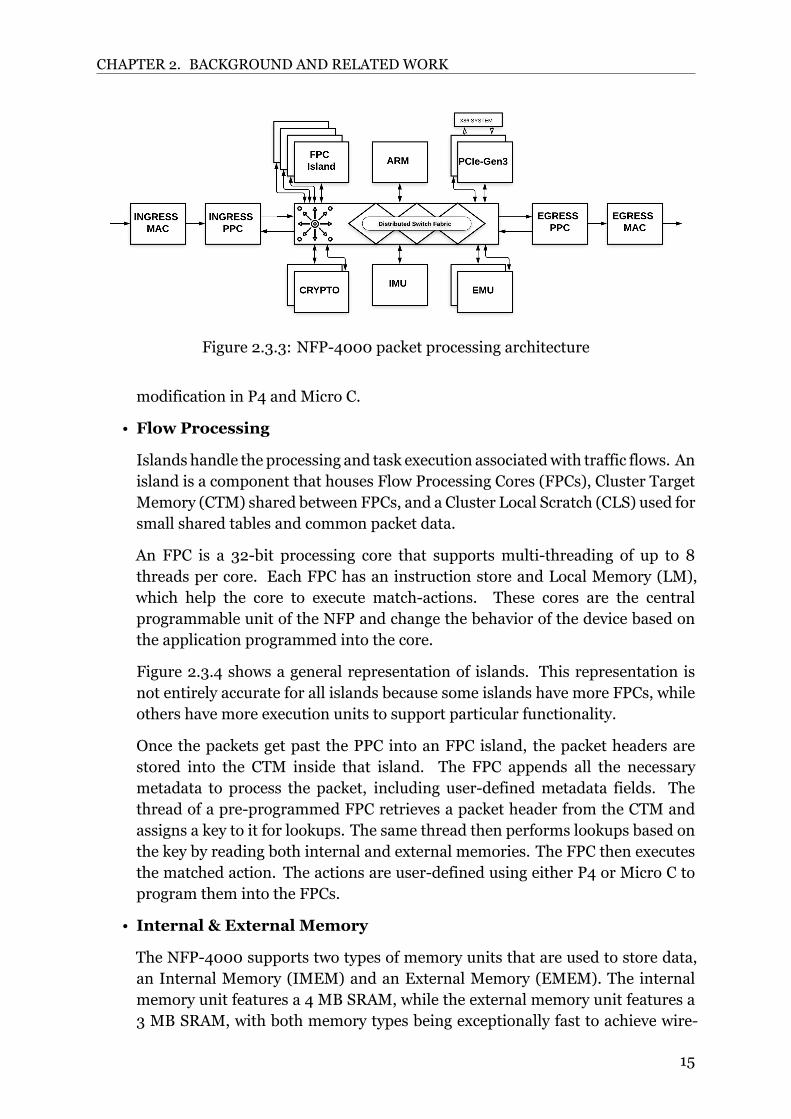
The overall picture of the NFP4000 architecture can be found in figure 2.3.3.
• Ingress and Egress MAC
The MAC component is the first and last component that the incoming trafficpasses through. The MAC does all the negotiations between devices in thenetwork and the NFP device. The negotiations are necessary to determine theoperating speed (10/100/1000 Mbps) and the operating mode (full or halfduplex) for each link. The MAC can handle multiple interface speeds such as10Gb, 40Gb, and 100Gb following their respective standards.If the option is selected, the MAC timestamps the packet at arrival.
The MAC from the P4 architecture perspective is the part of the pipeline thatenqueues the packets before they are parsed. Packets passing through the MAC
13

CHAPTER 2. BACKGROUND AND RELATEDWORK
P4Program
Control-plane Program (Apps)
Auto-generated API
Tofino P4 Target
Chip Driver
Protocol-independent API
ASIC Model
Add/delete table rules at run time
Barefoot Compiler
& Dev Tools
Barefoot SDE
Figure 2.3.2: Controlplane and dataplane interaction in Tofino [14]
go throughmultiple checks to verify their integrity before being placed in a bufferto enter the next step [32].
• Packet Processing
The packet processing section of the NFP architecture is handled by multiplepacket processing cores working in parallel to increase efficiency. There aretwo different packet processing cores (PPC) in the architecture. One handlesincoming packets (ingress) while the other handles outgoing packets (egress).
Ingress packet processing cores parse the packets for packet headers and packetheader fields, classifying the incoming traffic, and distributingwork in a balancedway to the other units in the architecture to lower the overall load on the system.
From a P4 perspective, ingress packet processing handles header extraction,checksum verification, hashing, and forwarding packets with metadata attached[32].
Egress packet processing cores support hardware acceleration by includingcustom hardware such as a packet modification engine, traffic manager, anda reorder engine. These custom hardware are controlled through metadata
14
CHAPTER 2. BACKGROUND AND RELATEDWORK
Figure 2.3.3: NFP4000 packet processing architecture
modification in P4 and Micro C.
• Flow Processing
Islands handle the processing and task execution associatedwith traffic flows. Anisland is a component that houses Flow Processing Cores (FPCs), Cluster TargetMemory (CTM) shared between FPCs, and a Cluster Local Scratch (CLS) used forsmall shared tables and common packet data.
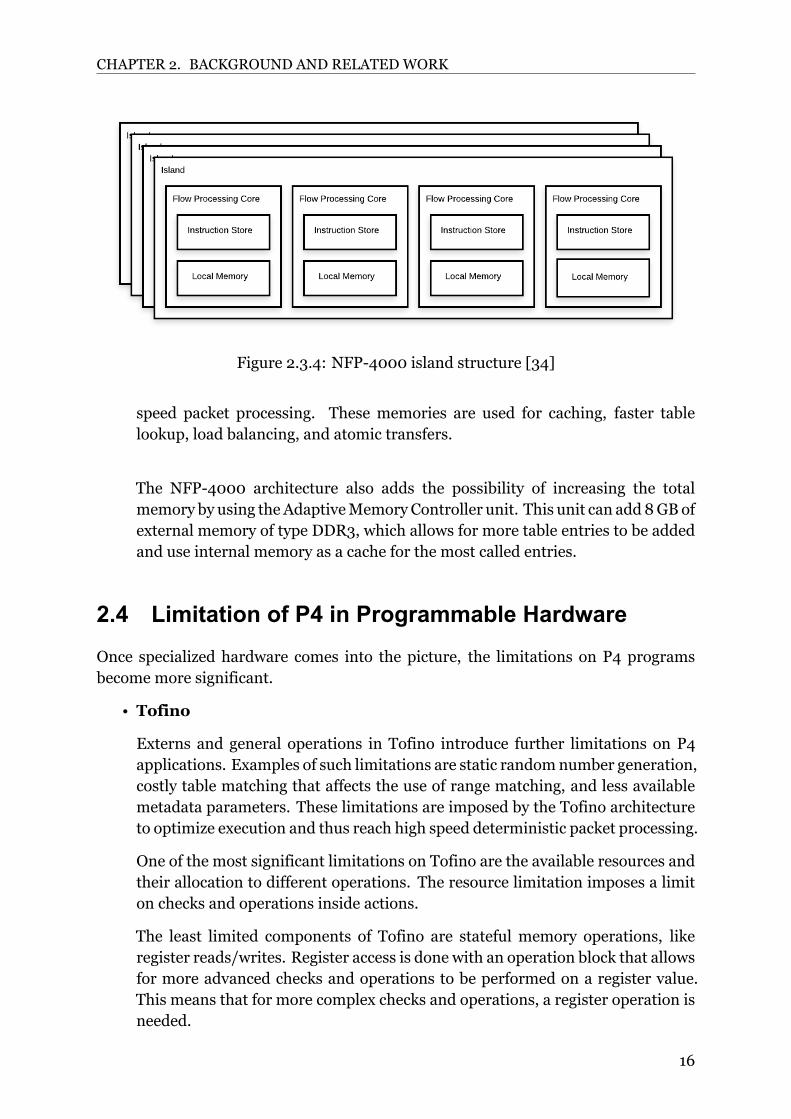
An FPC is a 32bit processing core that supports multithreading of up to 8threads per core. Each FPC has an instruction store and Local Memory (LM),which help the core to execute matchactions. These cores are the centralprogrammable unit of the NFP and change the behavior of the device based onthe application programmed into the core.
Figure 2.3.4 shows a general representation of islands. This representation isnot entirely accurate for all islands because some islands have more FPCs, whileothers have more execution units to support particular functionality.
Once the packets get past the PPC into an FPC island, the packet headers arestored into the CTM inside that island. The FPC appends all the necessarymetadata to process the packet, including userdefined metadata fields. Thethread of a preprogrammed FPC retrieves a packet header from the CTM andassigns a key to it for lookups. The same thread then performs lookups based onthe key by reading both internal and external memories. The FPC then executesthe matched action. The actions are userdefined using either P4 or Micro C toprogram them into the FPCs.
• Internal & External Memory
The NFP4000 supports two types of memory units that are used to store data,an Internal Memory (IMEM) and an External Memory (EMEM). The internalmemory unit features a 4 MB SRAM, while the external memory unit features a3 MB SRAM, with both memory types being exceptionally fast to achieve wire
15
CHAPTER 2. BACKGROUND AND RELATEDWORK
Figure 2.3.4: NFP4000 island structure [34]
speed packet processing. These memories are used for caching, faster tablelookup, load balancing, and atomic transfers.
The NFP4000 architecture also adds the possibility of increasing the totalmemory by using theAdaptiveMemory Controller unit. This unit can add8GBofexternal memory of type DDR3, which allows for more table entries to be addedand use internal memory as a cache for the most called entries.
2.4 Limitation of P4 in Programmable HardwareOnce specialized hardware comes into the picture, the limitations on P4 programsbecome more significant.
• Tofino
Externs and general operations in Tofino introduce further limitations on P4applications. Examples of such limitations are static randomnumber generation,costly table matching that affects the use of range matching, and less availablemetadata parameters. These limitations are imposed by the Tofino architectureto optimize execution and thus reach high speed deterministic packet processing.
One of the most significant limitations on Tofino are the available resources andtheir allocation to different operations. The resource limitation imposes a limiton checks and operations inside actions.
The least limited components of Tofino are stateful memory operations, likeregister reads/writes. Register access is done with an operation block that allowsfor more advanced checks and operations to be performed on a register value.This means that for more complex checks and operations, a register operation isneeded.
16
CHAPTER 2. BACKGROUND AND RELATEDWORK
If the desired operation is still too resource heavy for the configuration of registeroperations, the task must be subdivided into smaller tasks that are less resourceheavy for each register operation. If that is not possible, then the implementationneeds to be changed to work around the limitation.
• Netronome
The limitations of Netronome are much milder compared to Tofino due to themore flexible hardware architecture of networking flow processors and theirsupport for the more flexible Micro C language. However, the drawback is a lessdeterministic performance as the network flow processing cores run at a limitedspeed (e.g. 800 MHz). The scalable and flexible architecture of Netronomeallows for a relatively open P4 implementation wheremore advanced checks andoperation are supported.
2.5 Related Works
2.5.1 Per Packet Value
PPV is a CoreStateless Resource Sharing framework, which allows a wide variety ofdetailed and flexible policies; — enforces those policies for all traffic mixes; and —scales well with the number of flows.
The Packet Value represents the gain of the operator when the packet is delivered. Itexpresses the relative importance of one packet to another [22].The packet value concept uses a packet value marker and a packet value Active QueueManagement (AQM) scheme to fully control the traffic. The objective of a markerand an AQM combination is to reach a lower latency in the network and thus gain abetter user experience while obeying the relative importance and bandwidth sharingcharacteristics as defined by the operator.
The PV marker is placed on the edge of the network and marks the packets accordingto a configurable throughput function per user and service class.
The PV AQM uses an algorithm that considers the packet value for its drop decisions.The main idea of the AQM is to control the queue latency while ensuring resourcesharing according to the packet values.
2.5.2 Per Packet Value Marker
The PV marker is a node component that should act as the entry point to the networkin the form of an edge node. The marker should be light in processing time andshould work on less resource heavy hardware. This is because each entry point to anetwork using the PPV concept should contain a marker so that all incoming traffic ismarked.
17
CHAPTER 2. BACKGROUND AND RELATEDWORK
Each passing packet is processed, the throughput is calculated, and lastly marked witha PV which depends on the throughput and a configurable value function before beingforwarded to the core of the network.
The PV marker is influenced by many concepts and utilizes standardized features likeDiffServ [3] to determine the classification of the packets. The concept of marking thepackets based on flow characteristics instead of individual packet attributes is inspiredby the Network Utility Maximization (NUM) framework [36]. The ideas in NUM hasled to marking packets based on a function that is assigned to a flow.
Higher PVs give higher priority to the traffic. These values are assigned based onpredefined attributes of a packet, like a price plan or overuse of allocated bandwidth.However, a packet carrying a particular type of data like video, audio, or radio mayalso affect the classification of such a packet. These PVs are directly dependenton the throughput to have a clear threshold for when the PVs start to decrease.Different threshold values give higher traffic classesmore prioritywhen the throughputincreases. The more PVs there are, the more precise the AQM can be. This PVmapping is best described in a PV over the throughput graph, where each traffic classis assigned a specific function. These functions are called Throughput Value Functions(TVFs).
TVFs also use a random number bound by the rate to give a variety of PVs for the samerate, thus preventing starving of low priority traffic. A pseudocode description of thisoperation is present in listing 2.1 below.A TVF results in a curve that shows the distribution of PVs over different throughputs.If only one TVF is used, the AQM will limit different flows to achieve low latency anddesired resource sharing between the flows.If multiple TVFs are used, the AQM will do the same as one TVF but also limit thelink utilization per TVF and result in one TVF receiving more link utilization than theother.
1 ra te = getUserRate ( ) ;2 random_rate = RNG(0 , ra te ) ; // generate a random number between 0 and
ra te3 PV = getPVFromTVF( random_rate ) ;
Listing 2.1: A pseudocode description of a typical PV TVF
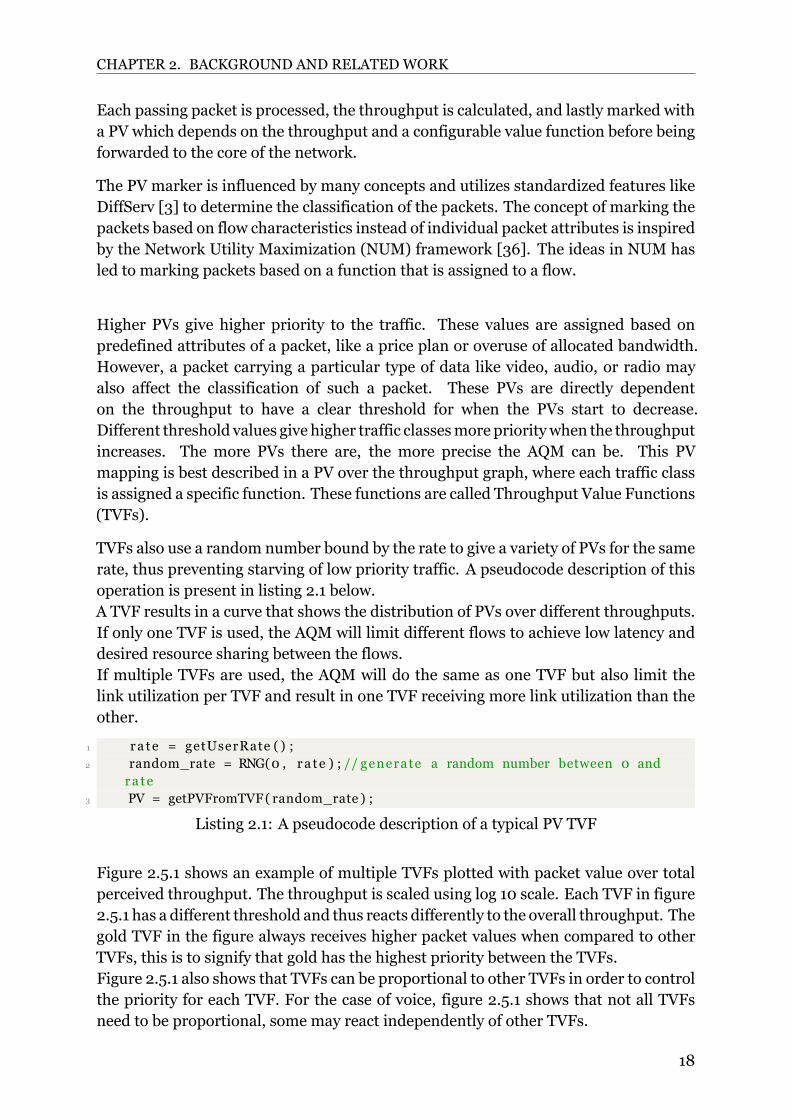
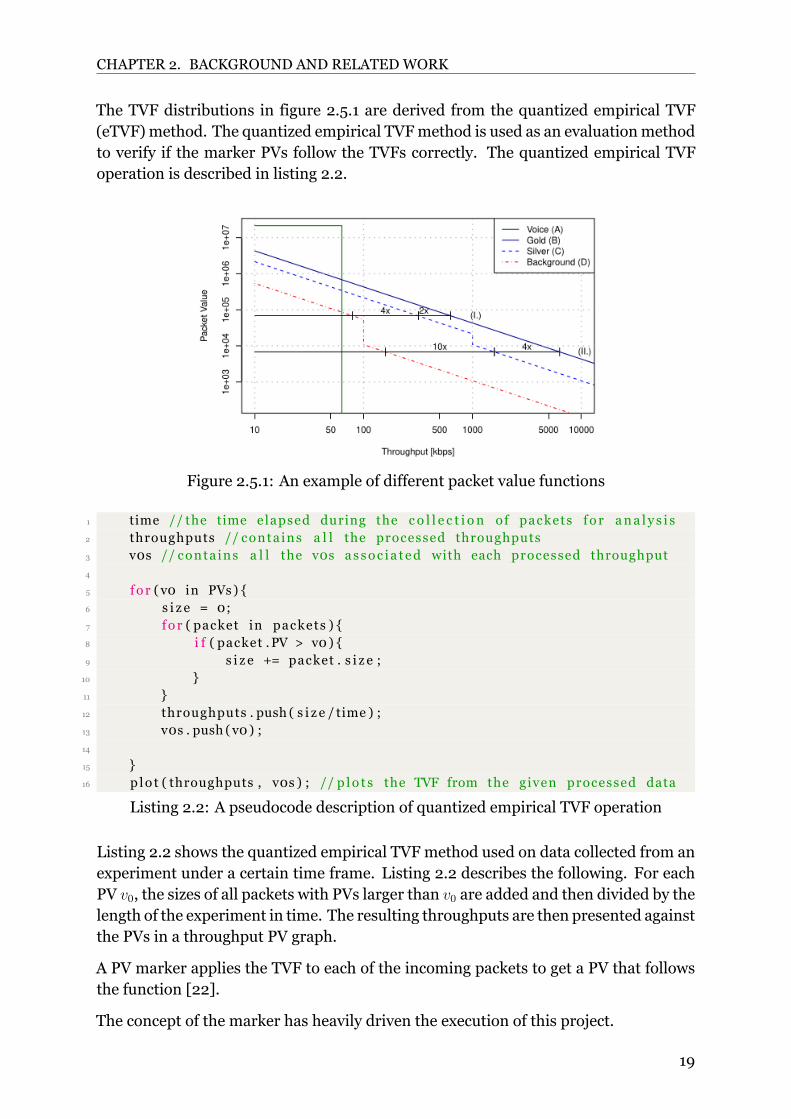
Figure 2.5.1 shows an example of multiple TVFs plotted with packet value over totalperceived throughput. The throughput is scaled using log 10 scale. Each TVF in figure2.5.1 has a different threshold and thus reacts differently to the overall throughput. Thegold TVF in the figure always receives higher packet values when compared to otherTVFs, this is to signify that gold has the highest priority between the TVFs.Figure 2.5.1 also shows that TVFs can be proportional to other TVFs in order to controlthe priority for each TVF. For the case of voice, figure 2.5.1 shows that not all TVFsneed to be proportional, some may react independently of other TVFs.
18
CHAPTER 2. BACKGROUND AND RELATEDWORK
The TVF distributions in figure 2.5.1 are derived from the quantized empirical TVF(eTVF)method. The quantized empirical TVFmethod is used as an evaluationmethodto verify if the marker PVs follow the TVFs correctly. The quantized empirical TVFoperation is described in listing 2.2.
Figure 2.5.1: An example of different packet value functions
1 time // the time elapsed during the c o l l e c t i o n of packets fo r ana l y s i s2 throughputs // conta ins a l l the processed throughputs3 v0s // conta ins a l l the v0s assoc ia ted with each processed throughput4
5 f o r ( v0 in PVs ) 6 s i z e = 0;7 f o r ( packet in packets ) 8 i f ( packet .PV > v0) 9 s i z e += packet . s i z e ;10 11 12 throughputs . push ( s i z e / time ) ;13 v0s . push (v0 ) ;14
15 16 p lo t ( throughputs , v0s ) ; // p lo t s the TVF from the given processed data
Listing 2.2: A pseudocode description of quantized empirical TVF operation
Listing 2.2 shows the quantized empirical TVF method used on data collected from anexperiment under a certain time frame. Listing 2.2 describes the following. For eachPV v0, the sizes of all packets with PVs larger than v0 are added and then divided by thelength of the experiment in time. The resulting throughputs are then presented againstthe PVs in a throughput PV graph.
A PV marker applies the TVF to each of the incoming packets to get a PV that followsthe function [22].
The concept of the marker has heavily driven the execution of this project.
19
CHAPTER 2. BACKGROUND AND RELATEDWORK
2.5.3 Per Packet Value AQM
An AQM in the per packet value concept is necessary to limit and control trafficby analyzing network conditions and using packet values when making packet dropdecisions under resource constraints. Themain idea is that the queue length should becontrolled by increasing drop probability when congestion builds up. Once congestionreduces and the queue becomes shorter, packet drop rate can be reduced. Whenmaking drop decisions, considering the packet value of each packet can help to achievedesired traffic priorities and resource sharing behavior as defined by the TVFs.
PVPIE [20] and PV aware DualPI [21] are examples of AQMs that can be used with thePV marker. They use modified versions of existent AQMs like Proportional Integralcontroller Enhanced (PIE) [31] and DualPI [1] to achieve a PV aware AQM. The AQMcalculates a dropping probability by using a proportional term (α), an integral term (β),current queue delay, and target queue delay. A Congestion Threshold Value (CTV) isthen calculated based on an observed PV distribution from previous packets.
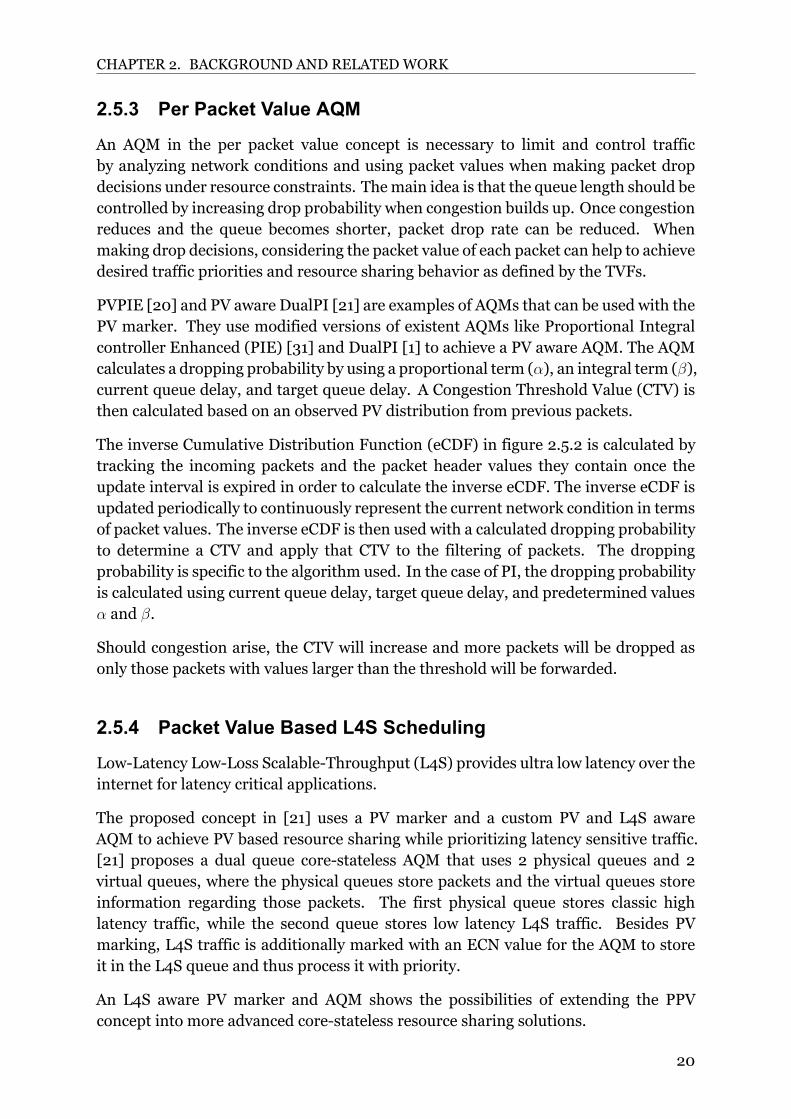
The inverse Cumulative Distribution Function (eCDF) in figure 2.5.2 is calculated bytracking the incoming packets and the packet header values they contain once theupdate interval is expired in order to calculate the inverse eCDF. The inverse eCDF isupdated periodically to continuously represent the current network condition in termsof packet values. The inverse eCDF is then used with a calculated dropping probabilityto determine a CTV and apply that CTV to the filtering of packets. The droppingprobability is specific to the algorithm used. In the case of PI, the dropping probabilityis calculated using current queue delay, target queue delay, and predetermined valuesα and β.
Should congestion arise, the CTV will increase and more packets will be dropped asonly those packets with values larger than the threshold will be forwarded.
2.5.4 Packet Value Based L4S Scheduling
LowLatency LowLoss ScalableThroughput (L4S) provides ultra low latency over theinternet for latency critical applications.
The proposed concept in [21] uses a PV marker and a custom PV and L4S awareAQM to achieve PV based resource sharing while prioritizing latency sensitive traffic.[21] proposes a dual queue corestateless AQM that uses 2 physical queues and 2virtual queues, where the physical queues store packets and the virtual queues storeinformation regarding those packets. The first physical queue stores classic highlatency traffic, while the second queue stores low latency L4S traffic. Besides PVmarking, L4S traffic is additionally marked with an ECN value for the AQM to storeit in the L4S queue and thus process it with priority.
An L4S aware PV marker and AQM shows the possibilities of extending the PPVconcept into more advanced corestateless resource sharing solutions.
20
CHAPTER 2. BACKGROUND AND RELATEDWORK
Figure 2.5.2: The process of a PV aware AQM using PI
2.5.5 P4 Based L4S AQM With Emulated HQoSAccess aggregation networks utilize Hierarchical QoS to apply QoS policies atdifferent layers to ensure fairness among their subscribers. The proposed workin [9] implements an AQM called VDQCSAQM presented in [21] in highspeedP4 programmable hardware to achieve low latency for L4S traffic while applyingHierarchical QoS. [9] utilizes a Tofino device to implement the AQM, which showsthe capabilities of such a device in both programmability and high speed.
21
Chapter 3
Marker Design
This section presents a detailed description of a dataplane design of a targetindependent Packet Value (PV) marker on a P4 pipeline. It explains the expectedfeatures and how they are realized.
A targetindependent design is necessary to gain a broad understanding of the innerworkings of the PV marker and to apply this targetindependent design to specifictargets.
3.1 Important ConceptsNew concepts need to be defined in order to describe the design of the marker. Theconcepts are explained in a general sense and their importance will be detailed furtherwhere they are applied in the marker design. Such concepts are:
• User Id
The User ID (UID) identifies each sender by matching the source IP addressagainst a predefined table of users. It is used as an index in registers to store datavolume received over time, that is needed to determine the per user throughputin order to derive the packet value later on. The data is in the form of time,bytes sent, and previous throughput (i.e. the throughput corresponding to thelast measurement time.
• Throughput Value Function
Throughput Value Functions (TVFs) generate and limit PVs to achieve a desiredpacket value distribution. The distribution of PVs generated by a TVF helps theAQM decide the resource sharing of the traffic.
• Delay Class
A Delay Class (DC) describes the priority of traffic to the marker. The DC isdetermined by reading an external value connected to the traffic, like a header
22
CHAPTER 3. MARKER DESIGN
field. A single user may be associated with multiple DCs and thus needs to betreated differently depending on the DC. Therefore, rate calculation needs to bedifferent per DC and different TVF may apply.The DCs are finally used to identify which TVF the current traffic should follow(e.g. gold, silver, bronze).
• Rate
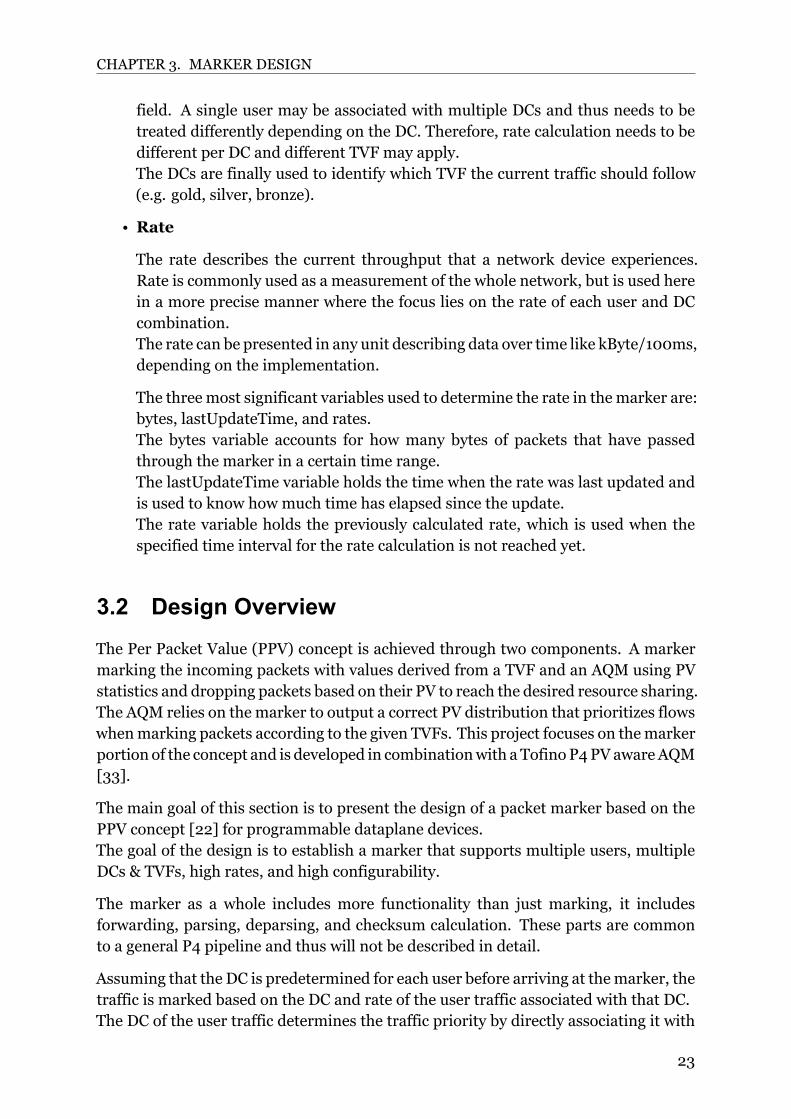
The rate describes the current throughput that a network device experiences.Rate is commonly used as a measurement of the whole network, but is used herein a more precise manner where the focus lies on the rate of each user and DCcombination.The rate can be presented in any unit describing data over time like kByte/100ms,depending on the implementation.
The three most significant variables used to determine the rate in the marker are:bytes, lastUpdateTime, and rates.The bytes variable accounts for how many bytes of packets that have passedthrough the marker in a certain time range.The lastUpdateTime variable holds the time when the rate was last updated andis used to know how much time has elapsed since the update.The rate variable holds the previously calculated rate, which is used when thespecified time interval for the rate calculation is not reached yet.
3.2 Design OverviewThe Per Packet Value (PPV) concept is achieved through two components. A markermarking the incoming packets with values derived from a TVF and an AQM using PVstatistics and dropping packets based on their PV to reach the desired resource sharing.The AQM relies on the marker to output a correct PV distribution that prioritizes flowswhenmarking packets according to the given TVFs. This project focuses on themarkerportion of the concept and is developed in combinationwith aTofinoP4PVawareAQM[33].
The main goal of this section is to present the design of a packet marker based on thePPV concept [22] for programmable dataplane devices.The goal of the design is to establish a marker that supports multiple users, multipleDCs & TVFs, high rates, and high configurability.
The marker as a whole includes more functionality than just marking, it includesforwarding, parsing, deparsing, and checksum calculation. These parts are commonto a general P4 pipeline and thus will not be described in detail.
Assuming that the DC is predetermined for each user before arriving at themarker, thetraffic is marked based on the DC and rate of the user traffic associated with that DC.The DC of the user traffic determines the traffic priority by directly associating it with
23

CHAPTER 3. MARKER DESIGN
a TVF.The marker then uses the rate of the user associated with a DC with a random numbergenerator to calculate an input parameter to the TVF and get a PV to mark on thepacket.This process is also described through pseudocode in listing 3.1 below.
1 IP = getIP ( packet ) ;2 user_Id = getUserIDFromIP ( IP ) ;3 DC = getDelayClass ( packet ) ;4 ra te = getUserDCRate ( user_Id , DC) ;5 random_rate = RNG(0 , ra te ) ; // between 0 and ra te6 TVF = getTVF (DC, random_rate ) ;7 PV = getPVFromTVF(TVF, random_rate ) ;
Listing 3.1: A pseudocode description of the desired marking process
A general overview of the marker is present in figure 3.2.1. Each part of figure 3.2.1 isused in the design sections below and described in further detail.
Figure 3.2.1: The expected marker pipeline
3.2.1 Table FunctionalityThe operations in the ingress processing are divided into tables that are calledsequentially. The tables in the marker perform traffic identification, rate calculation,random number generation, and random number matching to a TVF.
3.2.2 Traffic IdentificationUID and DC are the two identification operations that the marker uses to decide howthe overall processing of the traffic should be.
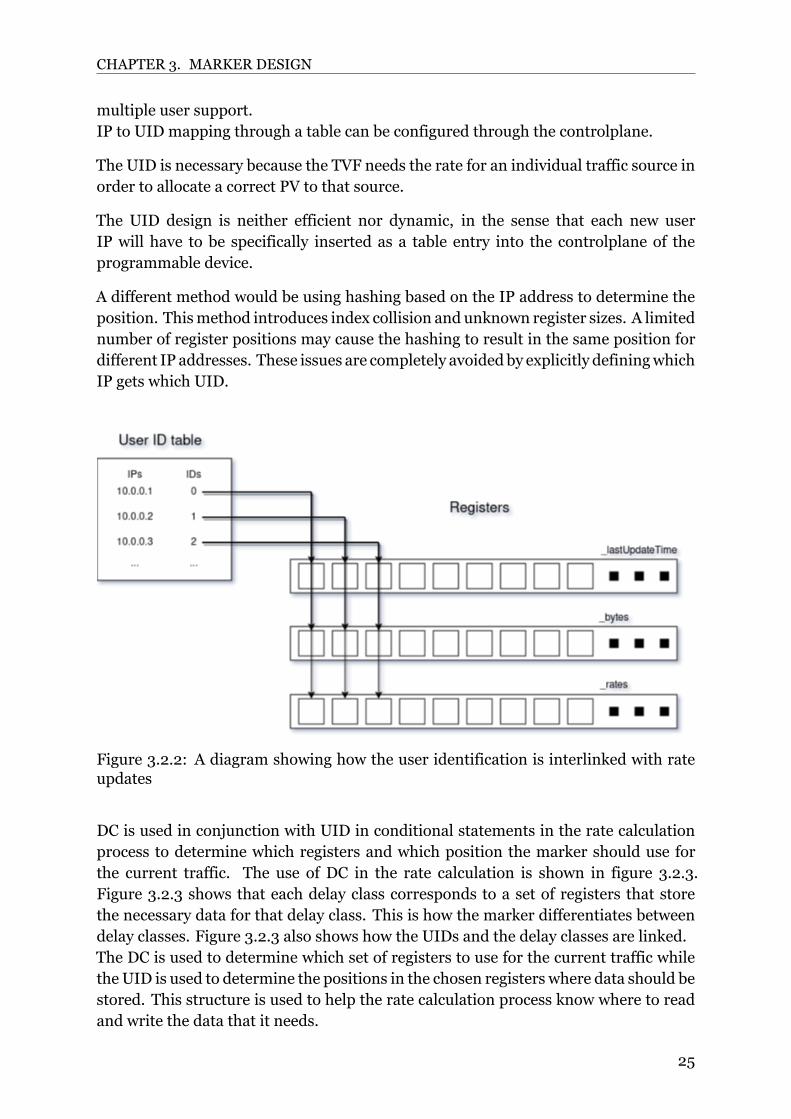
UID is essential to the rate calculation because it ensures that data is stored per userin the rate calculation process. The UID should be implemented using a table thatmatches a source IP address as a key and returns an integer representation of the IPaddress. The integer is used as a positional parameter for registers that store the datafor rate calculation.Figure 3.2.2 shows that each IP is associated with an identifier or UID that is used todetermine where the data for that user should be stored. For example, IP 10.0.0.1 ismapped to ID 0, meaning that data pertaining to the IP such as rate or lastUpdateTimeis stored in position 0 in each corresponding register. This simplifies the storage andupdate of stateful information (e.g. the current rate) across packets and also allows for
24
CHAPTER 3. MARKER DESIGN
multiple user support.IP to UID mapping through a table can be configured through the controlplane.
The UID is necessary because the TVF needs the rate for an individual traffic source inorder to allocate a correct PV to that source.
The UID design is neither efficient nor dynamic, in the sense that each new userIP will have to be specifically inserted as a table entry into the controlplane of theprogrammable device.
A different method would be using hashing based on the IP address to determine theposition. Thismethod introduces index collision and unknown register sizes. A limitednumber of register positions may cause the hashing to result in the same position fordifferent IP addresses. These issues are completely avoidedby explicitly definingwhichIP gets which UID.
Figure 3.2.2: A diagram showing how the user identification is interlinked with rateupdates
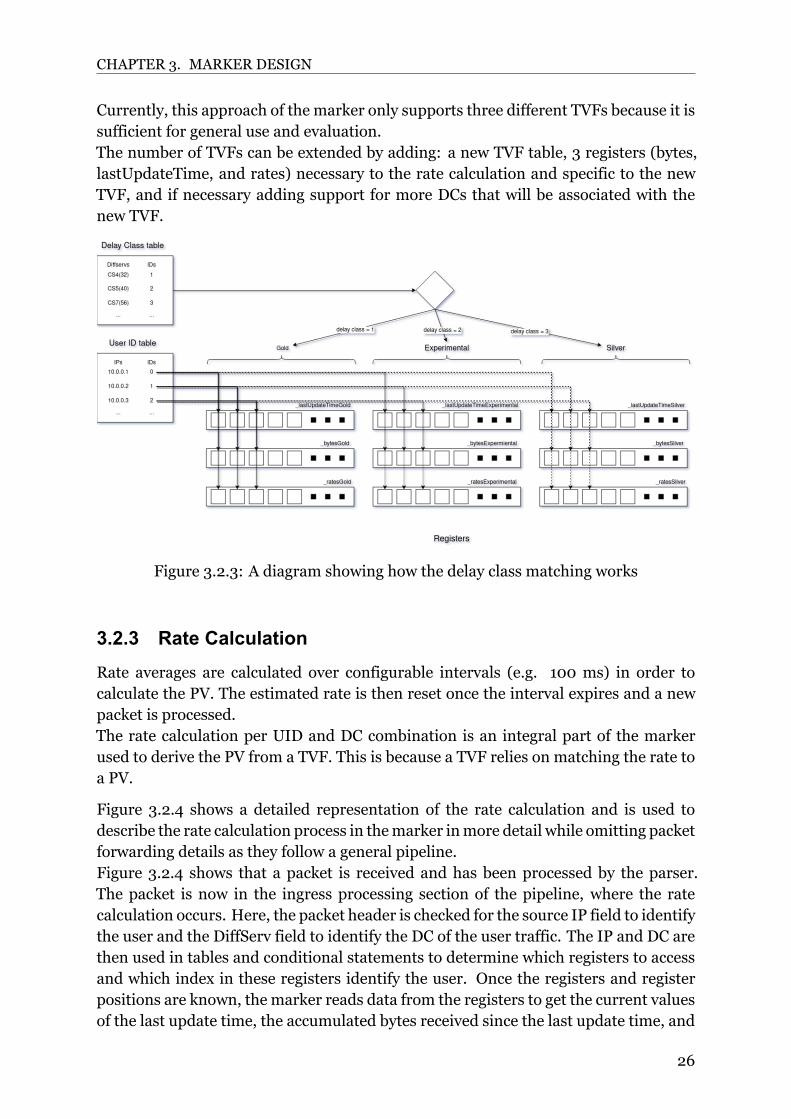
DC is used in conjunction with UID in conditional statements in the rate calculationprocess to determine which registers and which position the marker should use forthe current traffic. The use of DC in the rate calculation is shown in figure 3.2.3.Figure 3.2.3 shows that each delay class corresponds to a set of registers that storethe necessary data for that delay class. This is how the marker differentiates betweendelay classes. Figure 3.2.3 also shows how the UIDs and the delay classes are linked.The DC is used to determine which set of registers to use for the current traffic whilethe UID is used to determine the positions in the chosen registers where data should bestored. This structure is used to help the rate calculation process know where to readand write the data that it needs.
25
CHAPTER 3. MARKER DESIGN
Currently, this approach of the marker only supports three different TVFs because it issufficient for general use and evaluation.The number of TVFs can be extended by adding: a new TVF table, 3 registers (bytes,lastUpdateTime, and rates) necessary to the rate calculation and specific to the newTVF, and if necessary adding support for more DCs that will be associated with thenew TVF.
Figure 3.2.3: A diagram showing how the delay class matching works
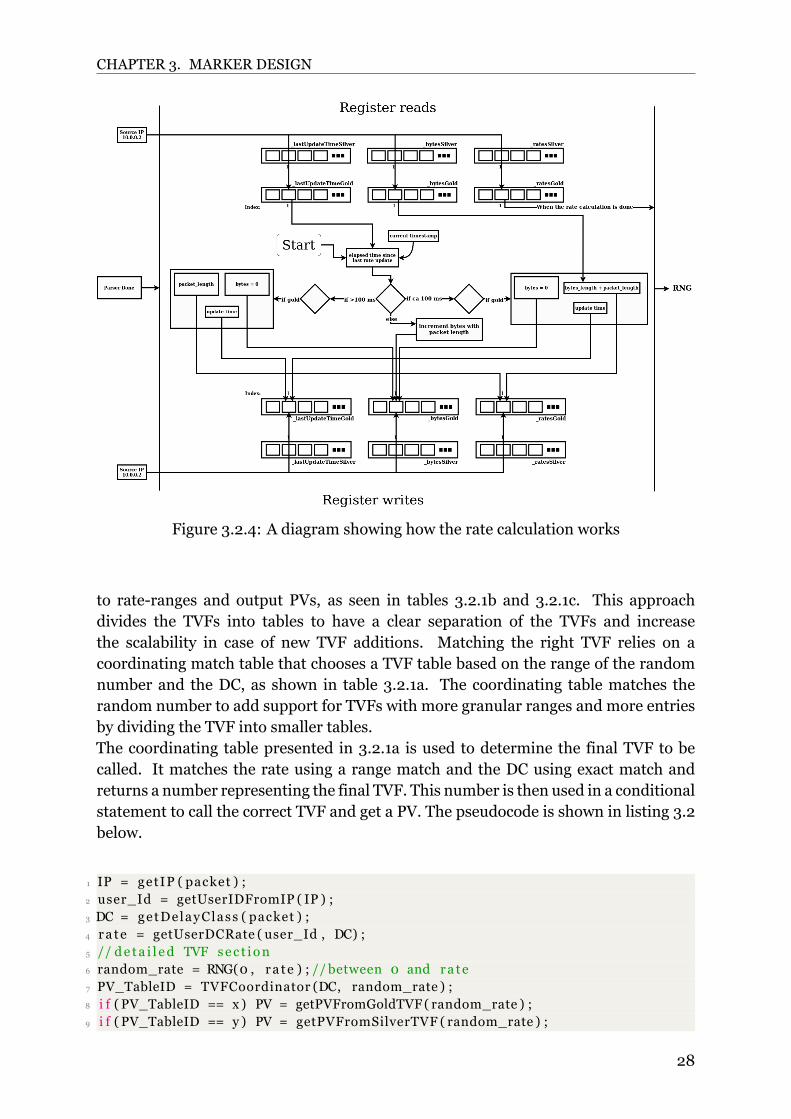
3.2.3 Rate CalculationRate averages are calculated over configurable intervals (e.g. 100 ms) in order tocalculate the PV. The estimated rate is then reset once the interval expires and a newpacket is processed.The rate calculation per UID and DC combination is an integral part of the markerused to derive the PV from a TVF. This is because a TVF relies on matching the rate toa PV.
Figure 3.2.4 shows a detailed representation of the rate calculation and is used todescribe the rate calculation process in themarker inmore detail while omitting packetforwarding details as they follow a general pipeline.Figure 3.2.4 shows that a packet is received and has been processed by the parser.The packet is now in the ingress processing section of the pipeline, where the ratecalculation occurs. Here, the packet header is checked for the source IP field to identifythe user and the DiffServ field to identify the DC of the user traffic. The IP and DC arethen used in tables and conditional statements to determine which registers to accessand which index in these registers identify the user. Once the registers and registerpositions are known, the marker reads data from the registers to get the current valuesof the last update time, the accumulated bytes received since the last update time, and
26
CHAPTER 3. MARKER DESIGN
the current rate estimate.The last update time is used in combination with the current time to determine howmuch time has elapsed since the last update. This is seen as the starting point of therate estimation, as it is here where the decisionmaking starts. There are three possibleoutcomes for the rate calculation:
• If the elapsed time since last update » 100 ms:
If this check is passed, then it is assumed that no other traffic has passed in thelast 100 ms and thus the registers should be reset/updated. The rate registershould be set to the length of the current packet as that is the only traffic thathas passed in the last 100ms. The last update time register should be updated tothe current time meaning that the timer is reset. The accumulated bytes registershould be reset to 0 to remove the previous traffic data. Finally, the result of therate calculation in this case is the length of the packet that triggers this action.
• If the elapsed time since last update is ca 100 ms:
If this check is passed, then it means that a full update interval has happened,and it is time to reset/update the registers.The packet length is incremented on top of the byte register, and that value in thebyte register is written to the rate register. The byte register is then reset and thelast update time register is set to the current time.Finally, the output of the rate calculation in this case is the value present in therate register.
• All other cases:
If all other checks fail, the elapsed time is less than 100ms. Only the incrementedbytes register should be updated and that the value present in the rate registershould be the result of the rate calculation. The incremented bytes register isincremented by the length of the packet that passes this check.
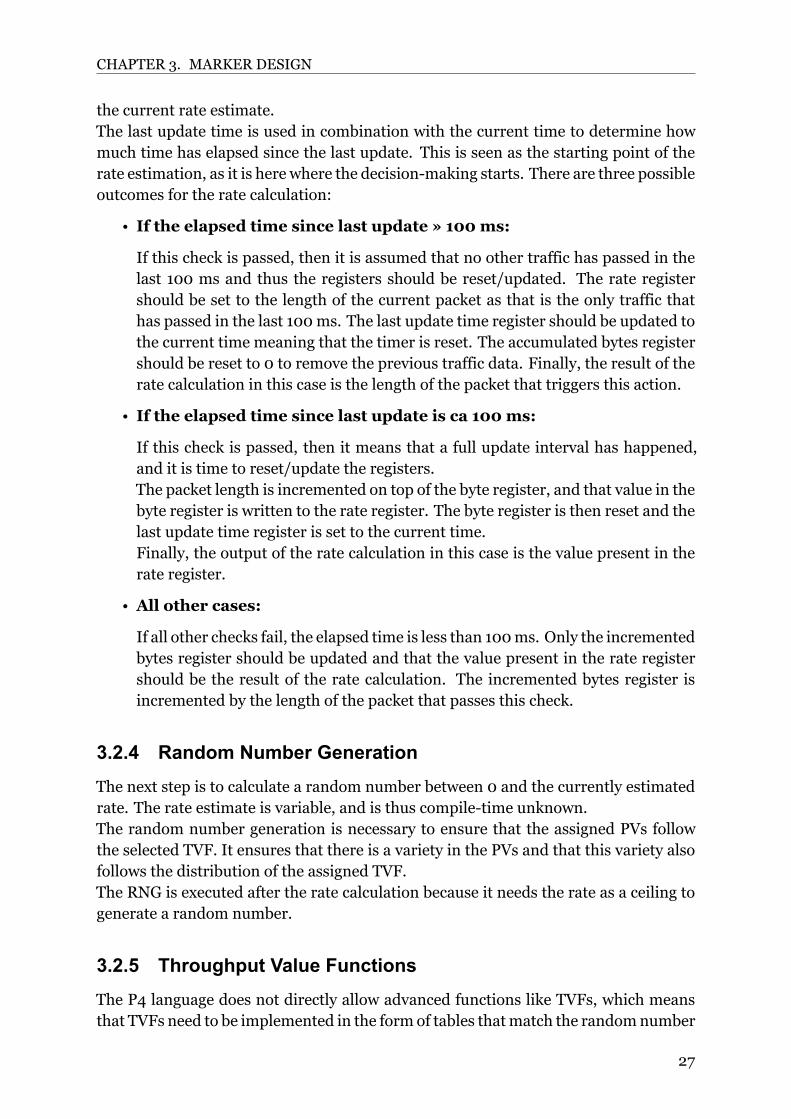
3.2.4 Random Number GenerationThe next step is to calculate a random number between 0 and the currently estimatedrate. The rate estimate is variable, and is thus compiletime unknown.The random number generation is necessary to ensure that the assigned PVs followthe selected TVF. It ensures that there is a variety in the PVs and that this variety alsofollows the distribution of the assigned TVF.The RNG is executed after the rate calculation because it needs the rate as a ceiling togenerate a random number.
3.2.5 Throughput Value FunctionsThe P4 language does not directly allow advanced functions like TVFs, which meansthat TVFs need to be implemented in the form of tables thatmatch the randomnumber
27
CHAPTER 3. MARKER DESIGN
Figure 3.2.4: A diagram showing how the rate calculation works
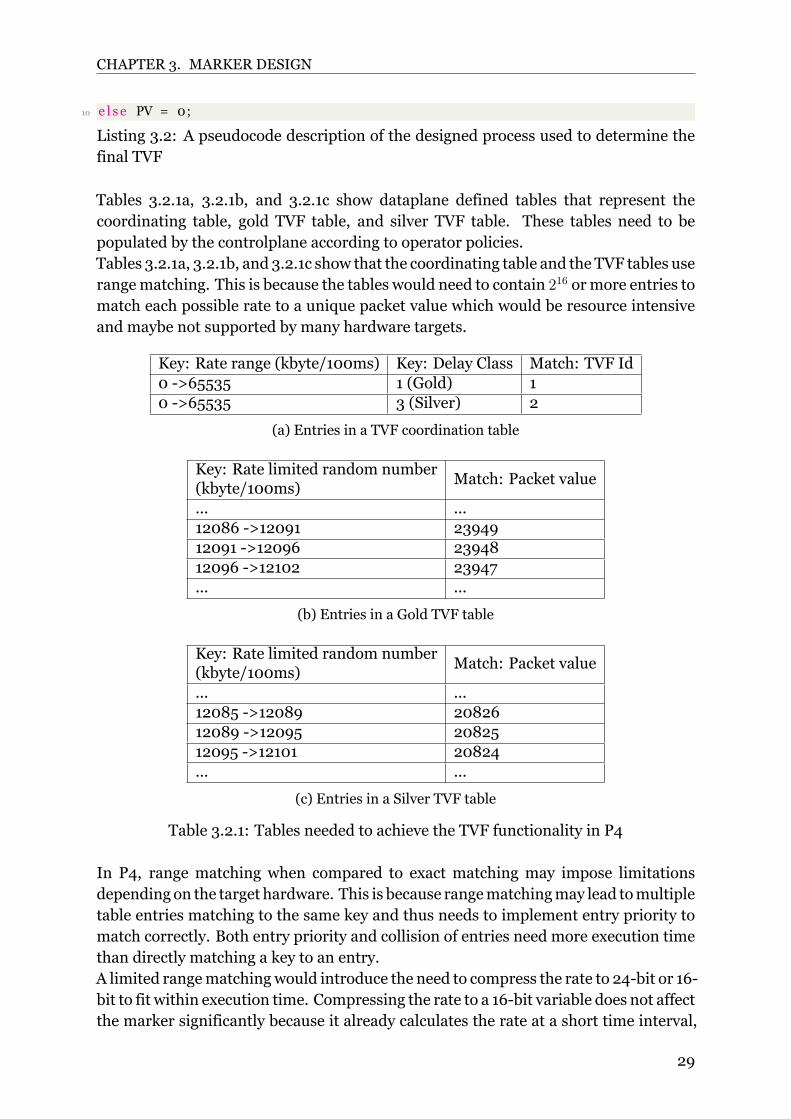
to rateranges and output PVs, as seen in tables 3.2.1b and 3.2.1c. This approachdivides the TVFs into tables to have a clear separation of the TVFs and increasethe scalability in case of new TVF additions. Matching the right TVF relies on acoordinating match table that chooses a TVF table based on the range of the randomnumber and the DC, as shown in table 3.2.1a. The coordinating table matches therandom number to add support for TVFs with more granular ranges and more entriesby dividing the TVF into smaller tables.The coordinating table presented in 3.2.1a is used to determine the final TVF to becalled. It matches the rate using a range match and the DC using exact match andreturns a number representing the final TVF. This number is then used in a conditionalstatement to call the correct TVF and get a PV. The pseudocode is shown in listing 3.2below.
1 IP = getIP ( packet ) ;2 user_Id = getUserIDFromIP ( IP ) ;3 DC = getDelayClass ( packet ) ;4 ra te = getUserDCRate ( user_Id , DC) ;5 // de ta i l ed TVF sec t ion6 random_rate = RNG(0 , ra te ) ; // between 0 and ra te7 PV_TableID = TVFCoordinator (DC, random_rate ) ;8 i f ( PV_TableID == x ) PV = getPVFromGoldTVF( random_rate ) ;9 i f ( PV_TableID == y ) PV = getPVFromSilverTVF ( random_rate ) ;
28
CHAPTER 3. MARKER DESIGN
10 e l s e PV = 0;
Listing 3.2: A pseudocode description of the designed process used to determine thefinal TVF
Tables 3.2.1a, 3.2.1b, and 3.2.1c show dataplane defined tables that represent thecoordinating table, gold TVF table, and silver TVF table. These tables need to bepopulated by the controlplane according to operator policies.Tables 3.2.1a, 3.2.1b, and 3.2.1c show that the coordinating table and the TVF tables userangematching. This is because the tables would need to contain 216 ormore entries tomatch each possible rate to a unique packet value which would be resource intensiveand maybe not supported by many hardware targets.
Key: Rate range (kbyte/100ms) Key: Delay Class Match: TVF Id0 >65535 1 (Gold) 10 >65535 3 (Silver) 2
(a) Entries in a TVF coordination table
Key: Rate limited random number(kbyte/100ms)
Match: Packet value
... ...12086 >12091 2394912091 >12096 2394812096 >12102 23947... ...
(b) Entries in a Gold TVF table
Key: Rate limited random number(kbyte/100ms)
Match: Packet value
... ...12085 >12089 2082612089 >12095 2082512095 >12101 20824... ...
(c) Entries in a Silver TVF table
Table 3.2.1: Tables needed to achieve the TVF functionality in P4
In P4, range matching when compared to exact matching may impose limitationsdepending on the target hardware. This is because rangematchingmay lead tomultipletable entries matching to the same key and thus needs to implement entry priority tomatch correctly. Both entry priority and collision of entries need more execution timethan directly matching a key to an entry.A limited rangematchingwould introduce the need to compress the rate to 24bit or 16bit to fit within execution time. Compressing the rate to a 16bit variable does not affectthe marker significantly because it already calculates the rate at a short time interval,
29

CHAPTER 3. MARKER DESIGN
which means that it needs fewer bits to represent the rate.
3.2.6 Pipeline SummeryThe final pipeline design is presented in listing 3.3 in pseudocode that follows thesame order as the pipeline. According to listing 3.3, the marker begins by parsing theincomingpacket and thenprocessing that packet to deriveUserID, IP, andDC.The IP isderived from the IPv4 source IP field, while the DC is derived from the DiffServ headerfield. The derived values are then used in the rate calculation process. The calculatedrate is used in an RNG that generates a random number between 0 and the estimatedrate. The random number is then used in combination with the DC to determine a TVFthat matches the random number to a PV. Once a PV is determined, it is written to thepacket, deparsed, and ready to be forwarded to the AQM.In our approach, we write the PV into the IPv4 identification field, but headerextensions would also be possible to be used. By reusing the IPv4 identification field,we do not assume that fragmentation and reassmebly will appear in our testbed.
1 marker 2 packet = parsePacket ( packetData ) ;3 IP = getIP ( packet ) ;4 user_Id = getUserIDFromIP ( IP ) ;5 DC = getDelayClass ( packet ) ;6 ra te = getUserDCRate ( user_Id , DC) ;7 random_rate = RNG(0 , ra te ) ; // between 0 and ra te8 PV_table_Id = TVFCoordinator (DC, random_rate ) ;9 i f ( PV_table_Id == x ) PV = getPVFromGoldTVF( random_rate ) ;10 i f ( PV_table_Id == y ) PV = getPVFromSilverTVF ( random_rate ) ;11 e l s e PV = 0;12 deparsed_packet = deparse ( packet , PV) ;13 forward ( deparsed_packet , IP ) ;14
Listing 3.3: A pseudocode description of the final pipeline design
3.3 SummaryThis section presented a general design of a PV marker that divides the marker intotable functionality, traffic identification, rate calculation, RNG, and TVFs. The designdescribes the functionality and mechanisms of each of the parts and their relation anddependency.
The generality of the design allows for more target support, but cannot cover all theextern functions because they are targetdependent. The flaw of this design is that itdoes not guarantee that the marker will work with all target devices that support P4because of its dependence on external functions and objects like registers and randomnumber generation.
30

Chapter 4
Challenges
This section present the challenges encountered during the implementation phase onTofino switching ASIC and Netronome smart NIC. Those challenges are mostly dueto the external functions needed in order to implement the marker (e.g. registers,counters, random number generations), which have many target specific restrictionsdue to hardware architecture limitations.The section also details solutions to the addressed challenges and conclusions aboutthe challenges that are outside the scope of this thesis.
4.1 Tofino challengesThe Terabit speed requirement of Tofino together with aiming for deterministic packetprocessing limits the supported functionality, which introduces multiple challenges tothe marker implementation.
4.1.1 Random Number GenerationAll the tested RNG methods in combination with the marker on Tofino resulted incompile errors due to extensive clock cycles or memory usage because, which areimportant constraints to obey for achieving deterministic packet processing at highspeeds.The issue of clock cycles is prevalent here because a randomnumber generation limitedby a compile time unknown value is a very time consuming task thus requiring a longcomputational time that the Tofino architecture does not allow for and cannot support.Generating a random number in a binary form is as simple as generating random 0sand 1s in succession. It becomes harder but possible when it comes to generatingrandom number in a certain range in a decimal form because the binary number needsto be converted and then limited to conform to the range. The task becomesmuchmorecomplicated and time consuming when it comes to not knowing the desired range atcompile timemeaning that the range is dynamic and changes depending on the currentrate estimate, which may change for each packet processed.
31
CHAPTER 4. CHALLENGES
While we did not achieve a fully packet value conform marker in Tofino due tothe complexity of the random number generation, we implemented a version thatcalculates a random number between 0 and a compile time unknown value at lessfidelity as required.
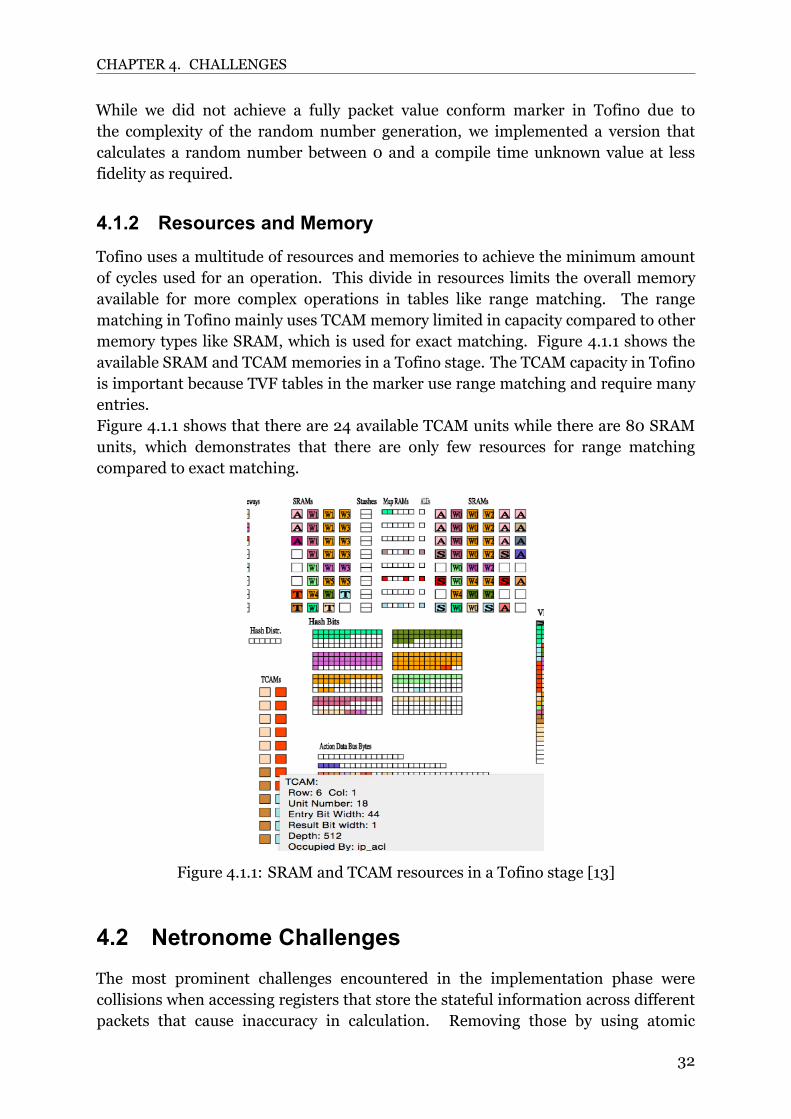
4.1.2 Resources and MemoryTofino uses a multitude of resources and memories to achieve the minimum amountof cycles used for an operation. This divide in resources limits the overall memoryavailable for more complex operations in tables like range matching. The rangematching in Tofino mainly uses TCAMmemory limited in capacity compared to othermemory types like SRAM, which is used for exact matching. Figure 4.1.1 shows theavailable SRAM and TCAMmemories in a Tofino stage. The TCAM capacity in Tofinois important because TVF tables in the marker use range matching and require manyentries.Figure 4.1.1 shows that there are 24 available TCAM units while there are 80 SRAMunits, which demonstrates that there are only few resources for range matchingcompared to exact matching.
Figure 4.1.1: SRAM and TCAM resources in a Tofino stage [13]
4.2 Netronome ChallengesThe most prominent challenges encountered in the implementation phase werecollisions when accessing registers that store the stateful information across differentpackets that cause inaccuracy in calculation. Removing those by using atomic
32
CHAPTER 4. CHALLENGES
operations or locks results in inefficient code that causes a lower throughput thandesired.
4.2.1 Topology Bottleneck and Throughput throttlingOne of the challenges when a marker is combined with an AQM within a network isthat the AQMneeds to be the bottleneck to be effective. This challenge is prevalent herebecause the achievable throughput of the Netronomemarker implementation dependson the implementation and may be impacted by intensive operations or large tablelookups when table entries are not cached.This means that the marker needs to be very efficient and also much faster than theAQM in the scenario where there is a single marker. This issue is not of importancewhen it comes to multiple markers connected to different ports of the switch thatforward to a single egress port managed by the AQM.
The implementation of the marker on Netronome did not work as intended initiallybecause of an error in the compilation. The device would handle a rate of ca 2 Gbpsbut then, after a certain amount of time, start dropping packets and limit the rateto ca 0.5 Gbps. This behavior is shown in figure 4.2.1. Figure 4.2.1 shows a stablestream of packets until ca 28 seconds pass. The stream then becomes unstable andis throttled because of some irregular drops. The figure shows that at second 42, thestream becomes more stable and less drops occur.
The inconsistent behavior in figure 4.2.1 is caused by enabling the flow caching featurein Netronome and compiling a P4 program that uses the global ingress timestampmetadata parameter or variables that operate on it in a conditional statement. Thisstatement is necessary to the marker because it lets the marker determine the actionbased on how much time has passed and thus allow the marker to correctly calculatethe rate.Disabling the flow caching feature in the Netronome SDK resolved this issuecompletely.
4.2.2 Race ConditionsThe Netronome target is based on multiple flow processing cores that execute P4code in parallel on multiple packet headers and metadata fields. This parallelismmay introduce synchronization issues, which may be critical if parallel read/writeoperations to stateful memory (e.g., register updates) are required. This phenomenonis called a race condition [24].
The rate calculation in the marker heavily relies on stateful memory to calculate therate. Eachpacket accesses registers according to the description in the design in section3.
The issue of race conditions can be solved by either using atomic functions or mutexlocks.
33
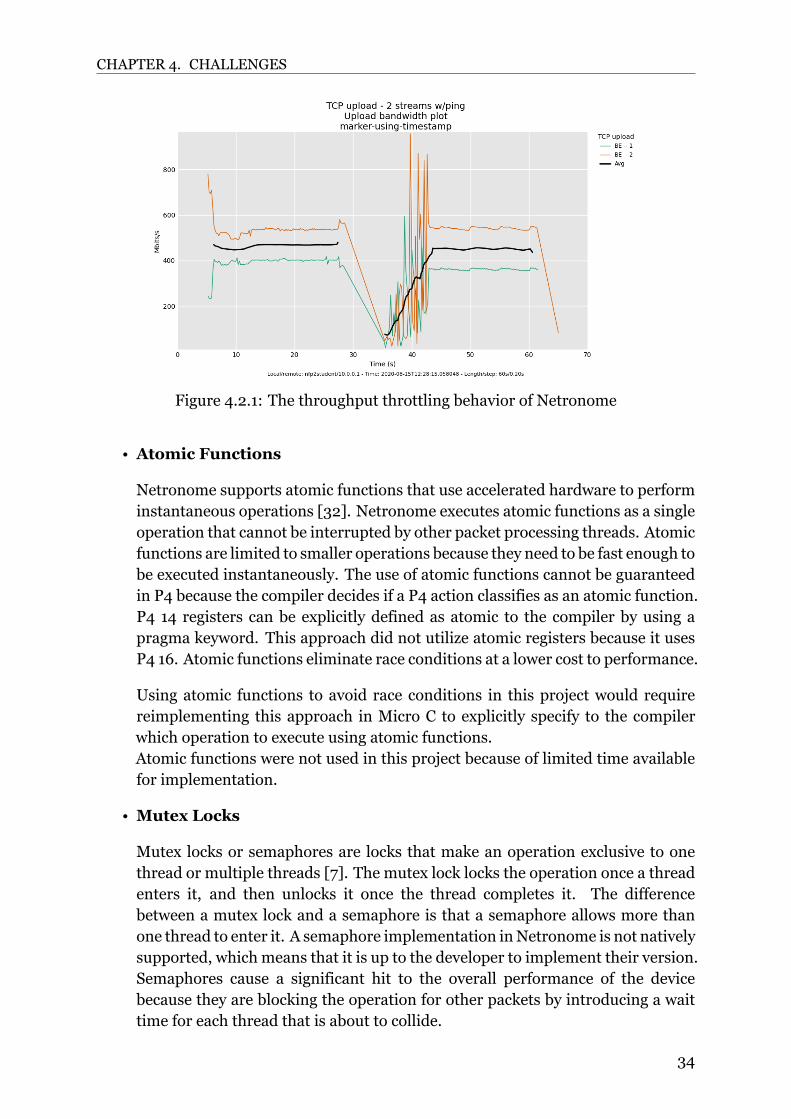
CHAPTER 4. CHALLENGES
Figure 4.2.1: The throughput throttling behavior of Netronome
• Atomic Functions
Netronome supports atomic functions that use accelerated hardware to performinstantaneous operations [32]. Netronome executes atomic functions as a singleoperation that cannot be interrupted by other packet processing threads. Atomicfunctions are limited to smaller operations because they need to be fast enough tobe executed instantaneously. The use of atomic functions cannot be guaranteedin P4 because the compiler decides if a P4 action classifies as an atomic function.P4 14 registers can be explicitly defined as atomic to the compiler by using apragma keyword. This approach did not utilize atomic registers because it usesP4 16. Atomic functions eliminate race conditions at a lower cost to performance.
Using atomic functions to avoid race conditions in this project would requirereimplementing this approach in Micro C to explicitly specify to the compilerwhich operation to execute using atomic functions.Atomic functions were not used in this project because of limited time availablefor implementation.
• Mutex Locks
Mutex locks or semaphores are locks that make an operation exclusive to onethread or multiple threads [7]. The mutex lock locks the operation once a threadenters it, and then unlocks it once the thread completes it. The differencebetween a mutex lock and a semaphore is that a semaphore allows more thanone thread to enter it. A semaphore implementation inNetronome is not nativelysupported, which means that it is up to the developer to implement their version.Semaphores cause a significant hit to the overall performance of the devicebecause they are blocking the operation for other packets by introducing a waittime for each thread that is about to collide.
34
CHAPTER 4. CHALLENGES
Using a mutex lock for this project would mean that the registers are notaccessible for all other senders and DCs, even though the senders and DCs donot collide in the rate calculation process.
This project used a modified version of the semaphore implementation in MicroC [17]. The marker implements a semaphore functionality that chooses registersbased on the DC of the packet and locks specific register positions based on theUID.Any register used during the rate calculation process that is accessed by anypacket, semaphore locks its accessed index until the rate calculation is completedand the same packet does not need to access that index anymore. It does thatbecause the only place that race conditions can occur in the marker is wheremultiple threads access the same register position during the rate calculation.Locking a single position for each register means that only one user is affectedfor each semaphore locked position in the registers thus allowing other users toaccess other positions in the same registers.
35
Chapter 5
Implementation
The design in section 3 describes a general PVmarker, but does not go further into howa targetdependent implementation would be structured. This section uses the designin section 3 and target specific operations to describe the implementation process ona Tofino switching ASIC and a Netronome NFP4000 smart NIC.The two devices are used to show which target complexity and speed requirementsallows for the marker algorithm to function correctly in the dataplane. The Tofinoswitch is an ASIC and thus imposes more restrictions to reach higher speeds, whileNetronome NFP4000 Smart NIC imposes fewer restrictions and reaches much lowerspeeds than Tofino.
The description in this section will only mention the parts of the marker that areaffected by the specific target. The parts that are not mentioned are implementedaccording to the design in section 3.
The sections below further describe externs on both architectures and how they affectthe implementation and what challenges they add.
5.1 TofinoRate calculation and random number generation are the two parts affected by Tofinohardware architecture and will be described below.
Tofino does not suffer from concurrency issues because of the division of MAUs, theirlocal memory, and the use of ALUs. Once a packet needs to execute an action andenters an ALU, no other packet can enter that ALU. The sole access to an ALU removesthe possible concurrency issues in Tofino.
5.1.1 Tofino Rate CalculationThe rate calculation presented in the design section uses amultitude of registers to readand write necessary state across different packets. The rate calculation in the design
36
CHAPTER 5. IMPLEMENTATION
also uses conditional statements to determine the right time to access the registers.Registers and conditional statements when used together in Tofino may result incomplex implementation due to hardware limitations.
Conditional statements in Tofino are limited to comparison between constants. Thisis a limitation to the rate calculation in the design because the time stamp is a compiletime unknown value and is thus variable. This means that the time stamp cannot beused in comparisons inside actions in Tofino.
Registers in Tofino are limited to a single action (read, write, and read & write) perpacket. This action is containedwithin a register action construct that is a Tofino externin P4. Each register action is directly connected to a single register and is only ableto access that register once per packet to reduce the execution time and comply withrequirements of the ASIC infrastructure. Register actions also have limited access tooutside parameters like variables and thus need to read metadata parameters to haveexternal inputs.
Besides providing access to registers, register actions also allow for more advancescomparisons like comparison between a variable and a constant. This means thata Tofino implementation of the rate calculation in the design is possible by using amultitude of register actions in succession.The marker thus uses a multitude of register actions to determine if an interval reset isrequired, to increment bytes, and to read/write a rate. Because these register actionsdepend on the outcome of each other to derive a final rate for each packet, they needto exchange information through metadata parameters that save the outcome of eachregister action.
Listing 5.1 details both the register actions and how metadata is used. Each of theregister actions takes an integer position as a parameter to know which position intheir corresponding register they need to access.The timeCheck register action is used to determine if 100 ms has passed and if thetime elapsed is much larger than 100ms or not. This is to determine if the markerneeds to reset the rate calculation. Because of the granularity of the time, it is unlikelythat packets will arrive at exactly 100ms. This is why the first conditional statement inthe timeCheck register gives a leeway of 10 ms in both direction to catch packets thatarrive close to the interval expiration time.The updateByte register action returns the incremented packet lengths if the elapsedtime is 100 ms, returns 0 if the elapsed time is much larger than 100 ms, and finallyincrements the packet length and saves it to the index if the elapsed time is less than100 ms.Lastly, if the elapsed time is 100 ms or larger, the updateRate register actionwrites the value of the bytes register to the rates register. The returned value fromupdateRate is the final calculated rate for that packet.
1 RateCalcu la t ion ( ) 2 Regis terAct ion timeCheck ( index ) 3 value = read ( ) ;
37

CHAPTER 5. IMPLEMENTATION
4 i f ( ( global_tstamp −10) < value < ( global_tstamp+10) ) 5 wri te ( global_tstamp+100)//100 ms6 return 1 ;7 8 e l s e i f ( global_tstamp >> value ) 9 wri te ( global_tstamp+100)//100 ms10 return 2;11 12 13
14 Regis terAct ion updateByte ( index ) 15 value = read ( ) ;16 i f ( timeCheckResult == 1 ) r e su l t = value + packetLength ;17 e l s e i f ( timeCheckResult == 2) r e su l t = 0;18 e l s e wr i te ( value + packetLength ) ;19 return r e su l t ;20 21
22 Regis terAct ion updateRate ( index ) 23 i f ( timeCheckResult == 1 | | timeCheckResult == 2) wr i te ( rateValue ) ;24 value = read ( ) ;25 return value ;26 27
28 // here begins the c a l l s29 metadata timeCheckResult = timeCheck ( user1 . index ) ;30 metadata bytesOut = updateByte ( user1 . index ) ;31 metadata rateValue ;32
33 i f ( timeCheckResult == 1 ) rateValue = bytesOut ;34 e l s e i f ( timeCheckResult == 2) rateValue = packetLength ;35
36 ra te = updateRate ( user1 . index ) ;37 return ra te38
Listing 5.1: A pseudocode description of how the rate calculation is performed inTofino
5.1.2 Tofino Random Number GenerationThe RNG implementation in Tofino has the same limitation as general hardwaretargets, as described in 3.2.4, which means that it does not directly support therequirements of the marker. The most significant attribute of the desired RNG isuniformity, a hard requirement to achieve when implementing a custom RNG withlimited resources.
The RNG extern in Tofino can generate a number between 0 and 2n − 1 where n is acompiletime known integer, meaning that the random number ceiling has to bea constant number. This causes an issue because the marker RNG needs to use theexecutiontime calculated rate as a ceiling.
38
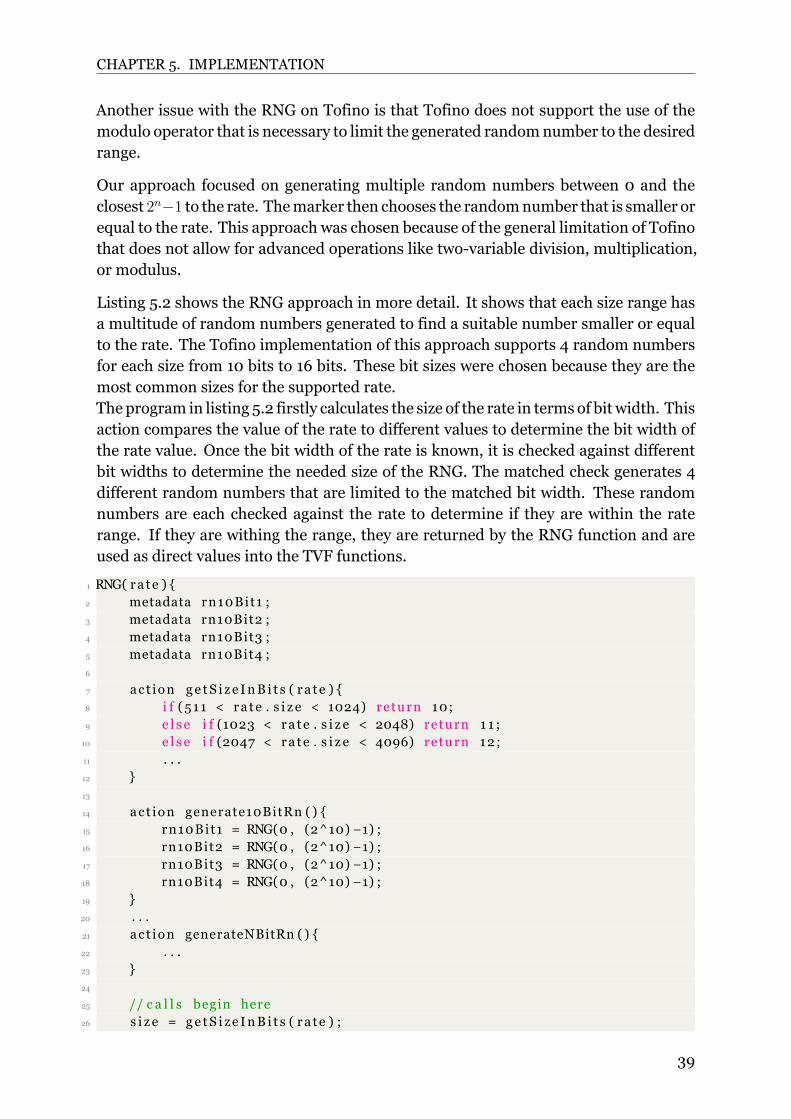
CHAPTER 5. IMPLEMENTATION
Another issue with the RNG on Tofino is that Tofino does not support the use of themodulo operator that is necessary to limit the generated randomnumber to the desiredrange.
Our approach focused on generating multiple random numbers between 0 and theclosest 2n−1 to the rate. Themarker then chooses the randomnumber that is smaller orequal to the rate. This approach was chosen because of the general limitation of Tofinothat does not allow for advanced operations like twovariable division, multiplication,or modulus.
Listing 5.2 shows the RNG approach in more detail. It shows that each size range hasa multitude of random numbers generated to find a suitable number smaller or equalto the rate. The Tofino implementation of this approach supports 4 random numbersfor each size from 10 bits to 16 bits. These bit sizes were chosen because they are themost common sizes for the supported rate.The program in listing 5.2 firstly calculates the size of the rate in terms of bit width. Thisaction compares the value of the rate to different values to determine the bit width ofthe rate value. Once the bit width of the rate is known, it is checked against differentbit widths to determine the needed size of the RNG. The matched check generates 4different random numbers that are limited to the matched bit width. These randomnumbers are each checked against the rate to determine if they are within the raterange. If they are withing the range, they are returned by the RNG function and areused as direct values into the TVF functions.
1 RNG( ra te ) 2 metadata rn10Bit1 ;3 metadata rn10Bit2 ;4 metadata rn10Bit3 ;5 metadata rn10Bit4 ;6
7 ac t ion ge tS i z e InB i t s ( ra te ) 8 i f (511 < ra te . s i z e < 1024) return 10;9 e l s e i f (1023 < ra te . s i z e < 2048) return 1 1 ;10 e l s e i f (2047 < ra te . s i z e < 4096) return 12 ;11 . . .12 13
14 ac t ion generate10BitRn ( ) 15 rn10Bit1 = RNG(0 , (2^10) −1) ;16 rn10Bit2 = RNG(0 , (2^10) −1) ;17 rn10Bit3 = RNG(0 , (2^10) −1) ;18 rn10Bit4 = RNG(0 , (2^10) −1) ;19 20 . . .21 ac t ion generateNBitRn ( ) 22 . . .23 24
25 // c a l l s begin here26 s i z e = ge tS i z e InB i t s ( ra te ) ;
39
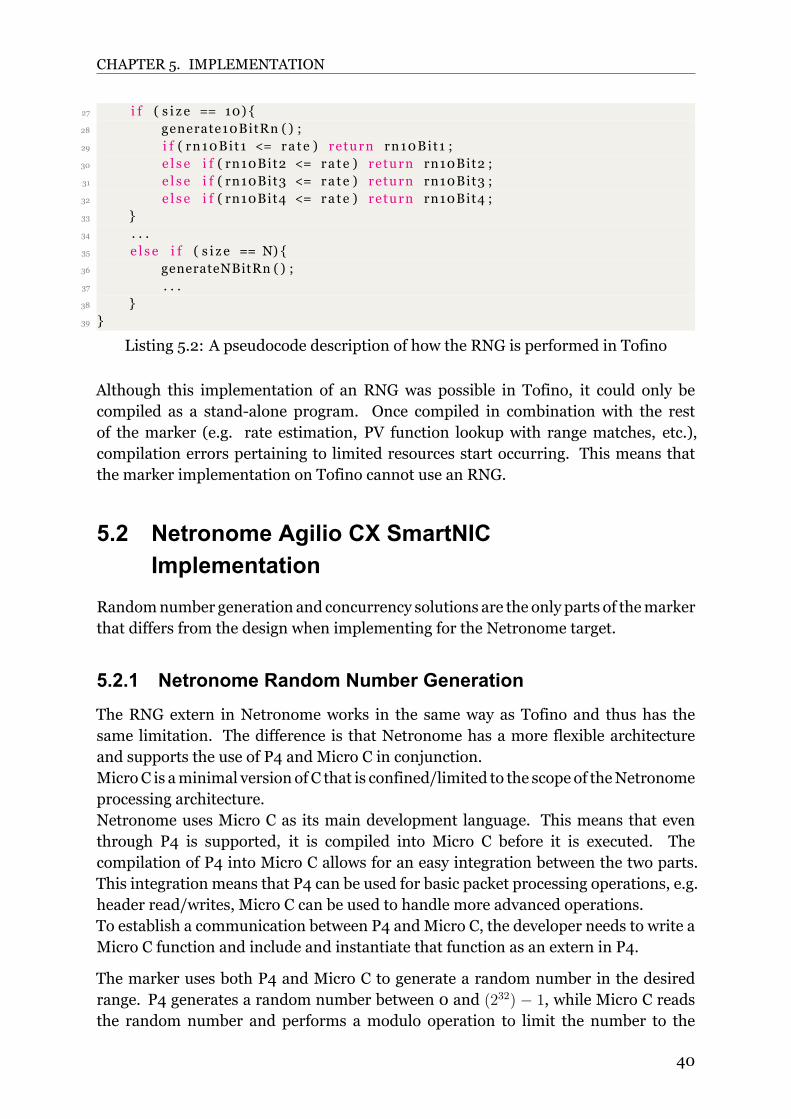
CHAPTER 5. IMPLEMENTATION
27 i f ( s i z e == 10) 28 generate10BitRn ( ) ;29 i f ( rn10Bit1 <= ra te ) return rn10Bit1 ;30 e l s e i f ( rn10Bit2 <= ra te ) return rn10Bit2 ;31 e l s e i f ( rn10Bit3 <= ra te ) return rn10Bit3 ;32 e l s e i f ( rn10Bit4 <= ra te ) return rn10Bit4 ;33 34 . . .35 e l s e i f ( s i z e == N) 36 generateNBitRn ( ) ;37 . . .38 39
Listing 5.2: A pseudocode description of how the RNG is performed in Tofino
Although this implementation of an RNG was possible in Tofino, it could only becompiled as a standalone program. Once compiled in combination with the restof the marker (e.g. rate estimation, PV function lookup with range matches, etc.),compilation errors pertaining to limited resources start occurring. This means thatthe marker implementation on Tofino cannot use an RNG.
5.2 Netronome Agilio CX SmartNICImplementation
Randomnumber generation and concurrency solutions are the only parts of themarkerthat differs from the design when implementing for the Netronome target.
5.2.1 Netronome Random Number GenerationThe RNG extern in Netronome works in the same way as Tofino and thus has thesame limitation. The difference is that Netronome has a more flexible architectureand supports the use of P4 and Micro C in conjunction.MicroC is aminimal version of C that is confined/limited to the scope of theNetronomeprocessing architecture.Netronome uses Micro C as its main development language. This means that eventhrough P4 is supported, it is compiled into Micro C before it is executed. Thecompilation of P4 into Micro C allows for an easy integration between the two parts.This integration means that P4 can be used for basic packet processing operations, e.g.header read/writes, Micro C can be used to handle more advanced operations.To establish a communication between P4 andMicro C, the developer needs to write aMicro C function and include and instantiate that function as an extern in P4.
The marker uses both P4 and Micro C to generate a random number in the desiredrange. P4 generates a random number between 0 and (232) − 1, while Micro C readsthe random number and performs a modulo operation to limit the number to the
40
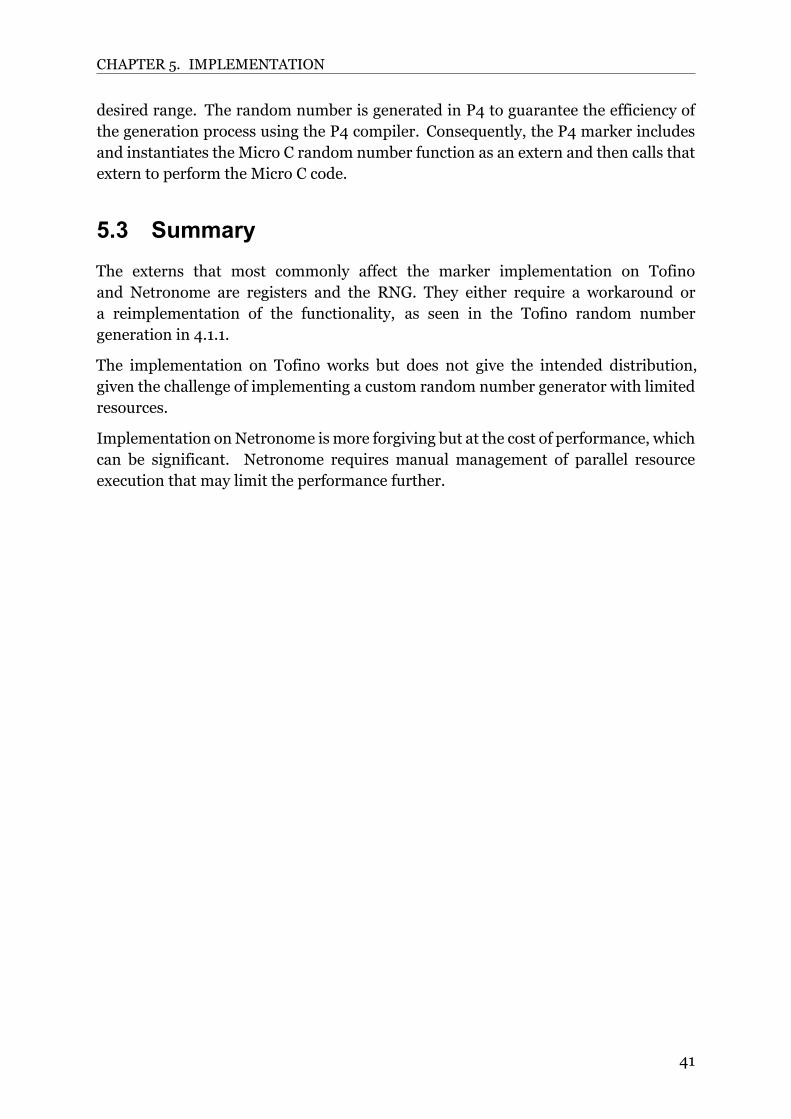
CHAPTER 5. IMPLEMENTATION
desired range. The random number is generated in P4 to guarantee the efficiency ofthe generation process using the P4 compiler. Consequently, the P4 marker includesand instantiates the Micro C random number function as an extern and then calls thatextern to perform the Micro C code.
5.3 SummaryThe externs that most commonly affect the marker implementation on Tofinoand Netronome are registers and the RNG. They either require a workaround ora reimplementation of the functionality, as seen in the Tofino random numbergeneration in 4.1.1.
The implementation on Tofino works but does not give the intended distribution,given the challenge of implementing a custom random number generator with limitedresources.
Implementation onNetronome ismore forgiving but at the cost of performance, whichcan be significant. Netronome requires manual management of parallel resourceexecution that may limit the performance further.
41

Chapter 6
Evaluation
This evaluation aims to answer the following questions: Does the marker follow thegoals described in the introduction? In order to answer this, the following questionswill be answered: (i) can themarker handle traffic at Gbps speeds? (ii) does themarkeroutput a correct TVF distribution? (iii) does the marker support multiple TVFs?
All evaluation results except memory utilization are derived from the markerimplementation on Netronome alone. This is because the marker implementation onTofino is unable to use anRNGdue to resource limitations, and thus results in incorrectPV distributions.
6.1 Evaluation SetupThe evaluation of the PPV marker only needs a simple setup using a client and aserver that communicate through the marker. This section describes the setup usedto evaluate the marker. The description of the setup includes the testbed and topologyused in the evaluation.
6.1.1 TestbedThe testbed used during this evaluation consists of 3 main components. Thesecomponents are further described below and also shown in figure 6.1.1.
• Client
The client in this setup features an Intel machine running Ubuntu server OS andusing an Intel Ethernet card to send and receive traffic at high speeds.
• Server
The server in this setup features the same hardware and software as the client toachieve consistency in the traffic analysis.
• Switch
42
CHAPTER 6. EVALUATION
The switch in this topology is amarker and is themain component in the topologyand thus is the focus of this evaluation. Themarker comprises a NetronomeNFP4000 smart NIC connected to a breakout board of 8x 10 Gbps ports. The smartNIC is connected to a host machine through a PCIe slot. The machine acts as ahost for the switch and API to update the firmware and read internal data suchas registers, table data, and statistics about the traffic.
Figure 6.1.1: The testbed topology for the evaluation
6.2 Evaluation MetricsThis section describes the metrics chosen in the evaluation of the marker. Thesemetrics bring out a good representation of how the marker works in its differentaspects. The topics below describe each of the metrics used throughout the evaluationprocess.
6.2.1 ThroughputThroughput is ametric thatmeasures the capacity of a network device when it comes tohandling traffic. Themost common unit used to describe throughput is bits per second,or bps for short.
The throughput provides indication if the marker will be the bottleneck of somedeployments. The marker should not be the bottleneck of the topology, and thus allowthe AQM to act as the bottleneck in order to manage and regulate the queue buildupprocess.
6.2.2 Packet Value DistributionThe PV distribution is an important metric used to determine if the distribution of theproduced PVs is following the intended TVF correctly. Evaluating the PV distributionalso evaluates the uniformity of the RNG. The PV distribution can be visualized using aThroughput Packet Value Function (TVF), where the lowest PV for a specific constant
43
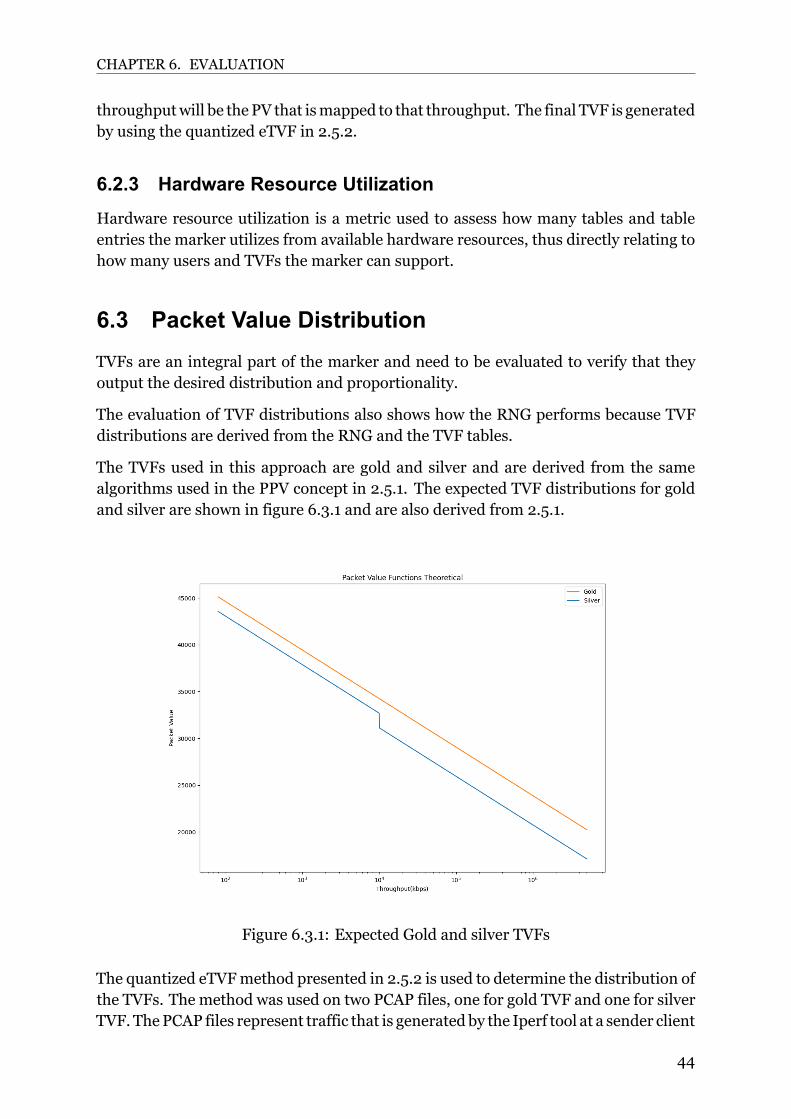
CHAPTER 6. EVALUATION
throughputwill be thePV that ismapped to that throughput. The final TVF is generatedby using the quantized eTVF in 2.5.2.
6.2.3 Hardware Resource UtilizationHardware resource utilization is a metric used to assess how many tables and tableentries the marker utilizes from available hardware resources, thus directly relating tohow many users and TVFs the marker can support.
6.3 Packet Value DistributionTVFs are an integral part of the marker and need to be evaluated to verify that theyoutput the desired distribution and proportionality.
The evaluation of TVF distributions also shows how the RNG performs because TVFdistributions are derived from the RNG and the TVF tables.
The TVFs used in this approach are gold and silver and are derived from the samealgorithms used in the PPV concept in 2.5.1. The expected TVF distributions for goldand silver are shown in figure 6.3.1 and are also derived from 2.5.1.
Figure 6.3.1: Expected Gold and silver TVFs
The quantized eTVFmethod presented in 2.5.2 is used to determine the distribution ofthe TVFs. The method was used on two PCAP files, one for gold TVF and one for silverTVF. ThePCAP files represent traffic that is generated by the Iperf tool at a sender client
44
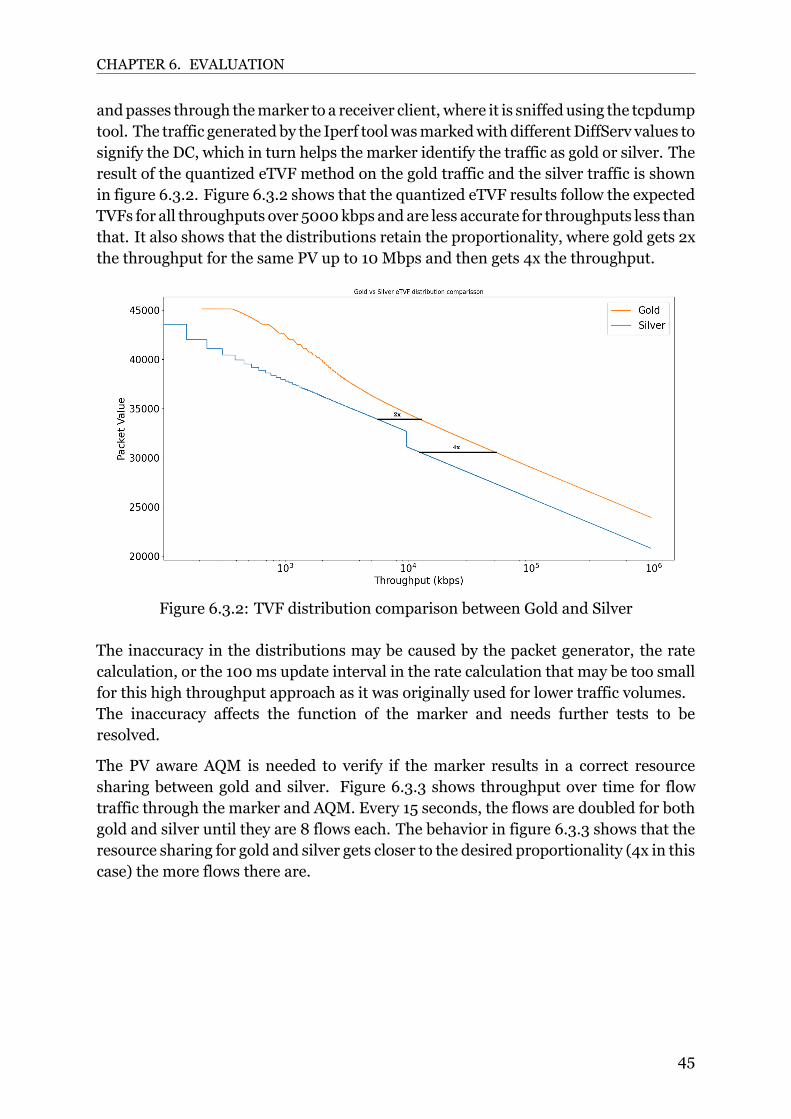
CHAPTER 6. EVALUATION
andpasses through themarker to a receiver client, where it is sniffed using the tcpdumptool. The traffic generated by the Iperf toolwasmarkedwith differentDiffServ values tosignify the DC, which in turn helps the marker identify the traffic as gold or silver. Theresult of the quantized eTVF method on the gold traffic and the silver traffic is shownin figure 6.3.2. Figure 6.3.2 shows that the quantized eTVF results follow the expectedTVFs for all throughputs over 5000kbps and are less accurate for throughputs less thanthat. It also shows that the distributions retain the proportionality, where gold gets 2xthe throughput for the same PV up to 10 Mbps and then gets 4x the throughput.
Figure 6.3.2: TVF distribution comparison between Gold and Silver
The inaccuracy in the distributions may be caused by the packet generator, the ratecalculation, or the 100 ms update interval in the rate calculation that may be too smallfor this high throughput approach as it was originally used for lower traffic volumes.The inaccuracy affects the function of the marker and needs further tests to beresolved.
The PV aware AQM is needed to verify if the marker results in a correct resourcesharing between gold and silver. Figure 6.3.3 shows throughput over time for flowtraffic through the marker and AQM. Every 15 seconds, the flows are doubled for bothgold and silver until they are 8 flows each. The behavior in figure 6.3.3 shows that theresource sharing for gold and silver gets closer to the desired proportionality (4x in thiscase) the more flows there are.
45
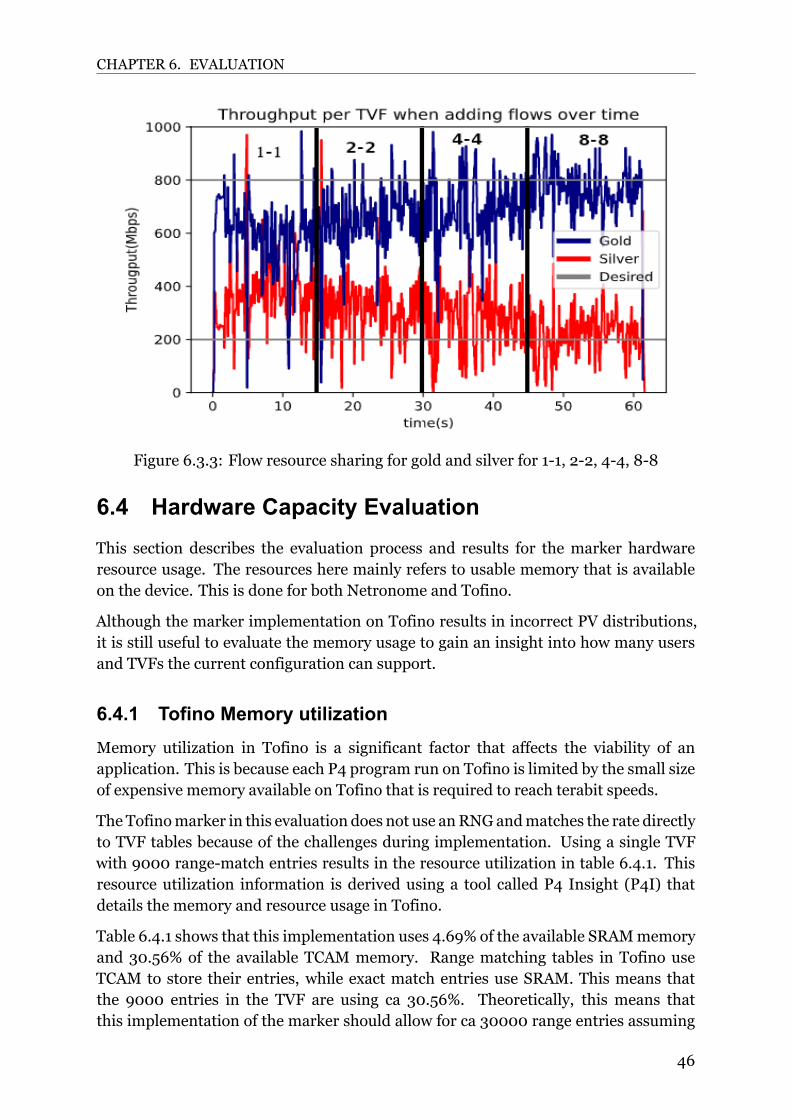
CHAPTER 6. EVALUATION
Figure 6.3.3: Flow resource sharing for gold and silver for 11, 22, 44, 88
6.4 Hardware Capacity EvaluationThis section describes the evaluation process and results for the marker hardwareresource usage. The resources here mainly refers to usable memory that is availableon the device. This is done for both Netronome and Tofino.
Although the marker implementation on Tofino results in incorrect PV distributions,it is still useful to evaluate the memory usage to gain an insight into how many usersand TVFs the current configuration can support.
6.4.1 Tofino Memory utilizationMemory utilization in Tofino is a significant factor that affects the viability of anapplication. This is because each P4 program run on Tofino is limited by the small sizeof expensive memory available on Tofino that is required to reach terabit speeds.
The Tofinomarker in this evaluation does not use anRNGandmatches the rate directlyto TVF tables because of the challenges during implementation. Using a single TVFwith 9000 rangematch entries results in the resource utilization in table 6.4.1. Thisresource utilization information is derived using a tool called P4 Insight (P4I) thatdetails the memory and resource usage in Tofino.
Table 6.4.1 shows that this implementation uses 4.69% of the available SRAMmemoryand 30.56% of the available TCAM memory. Range matching tables in Tofino useTCAM to store their entries, while exact match entries use SRAM. This means thatthe 9000 entries in the TVF are using ca 30.56%. Theoretically, this means thatthis implementation of the marker should allow for ca 30000 range entries assuming
46
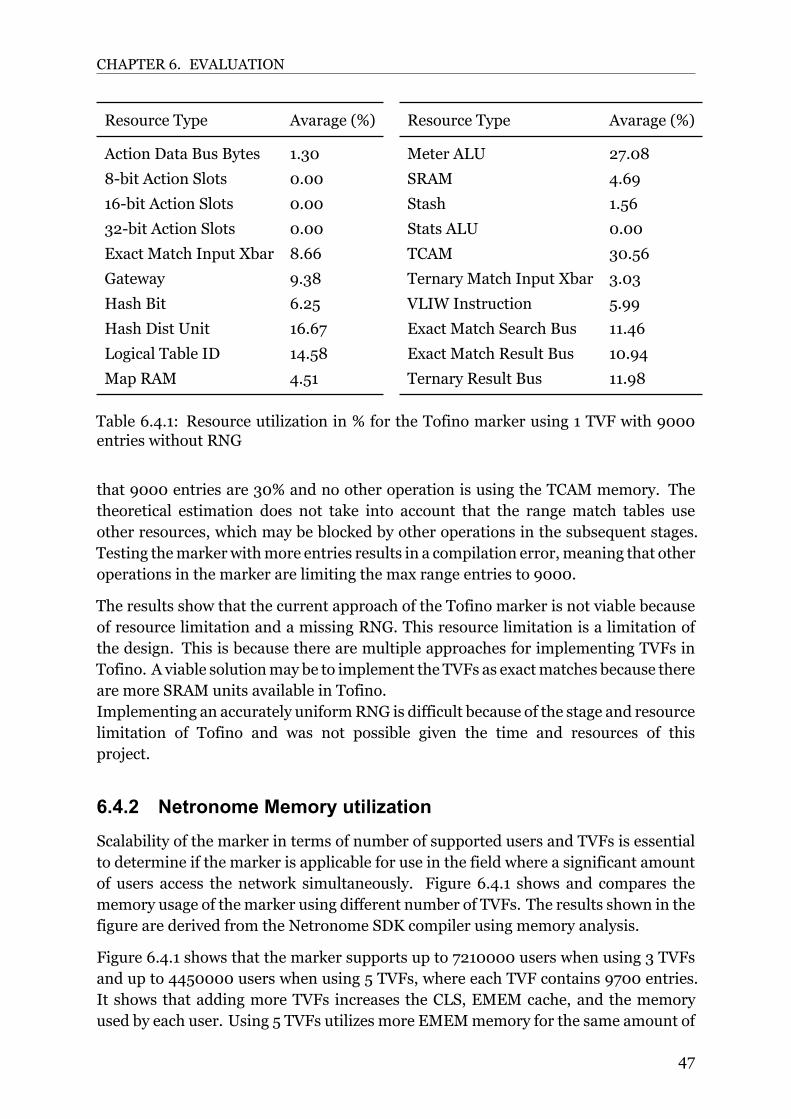
CHAPTER 6. EVALUATION
Resource Type Avarage (%) Resource Type Avarage (%)
Action Data Bus Bytes 1.30 Meter ALU 27.08
8bit Action Slots 0.00 SRAM 4.69
16bit Action Slots 0.00 Stash 1.56
32bit Action Slots 0.00 Stats ALU 0.00
Exact Match Input Xbar 8.66 TCAM 30.56
Gateway 9.38 Ternary Match Input Xbar 3.03
Hash Bit 6.25 VLIW Instruction 5.99
Hash Dist Unit 16.67 Exact Match Search Bus 11.46
Logical Table ID 14.58 Exact Match Result Bus 10.94
Map RAM 4.51 Ternary Result Bus 11.98
Table 6.4.1: Resource utilization in % for the Tofino marker using 1 TVF with 9000entries without RNG
that 9000 entries are 30% and no other operation is using the TCAM memory. Thetheoretical estimation does not take into account that the range match tables useother resources, which may be blocked by other operations in the subsequent stages.Testing themarkerwithmore entries results in a compilation error, meaning that otheroperations in the marker are limiting the max range entries to 9000.
The results show that the current approach of the Tofino marker is not viable becauseof resource limitation and a missing RNG. This resource limitation is a limitation ofthe design. This is because there are multiple approaches for implementing TVFs inTofino. A viable solutionmay be to implement the TVFs as exactmatches because thereare more SRAM units available in Tofino.Implementing an accurately uniformRNG is difficult because of the stage and resourcelimitation of Tofino and was not possible given the time and resources of thisproject.
6.4.2 Netronome Memory utilizationScalability of the marker in terms of number of supported users and TVFs is essentialto determine if the marker is applicable for use in the field where a significant amountof users access the network simultaneously. Figure 6.4.1 shows and compares thememory usage of themarker using different number of TVFs. The results shown in thefigure are derived from the Netronome SDK compiler using memory analysis.
Figure 6.4.1 shows that the marker supports up to 7210000 users when using 3 TVFsand up to 4450000 users when using 5 TVFs, where each TVF contains 9700 entries.It shows that adding more TVFs increases the CLS, EMEM cache, and the memoryused by each user. Using 5 TVFs utilizes more EMEMmemory for the same amount of
47
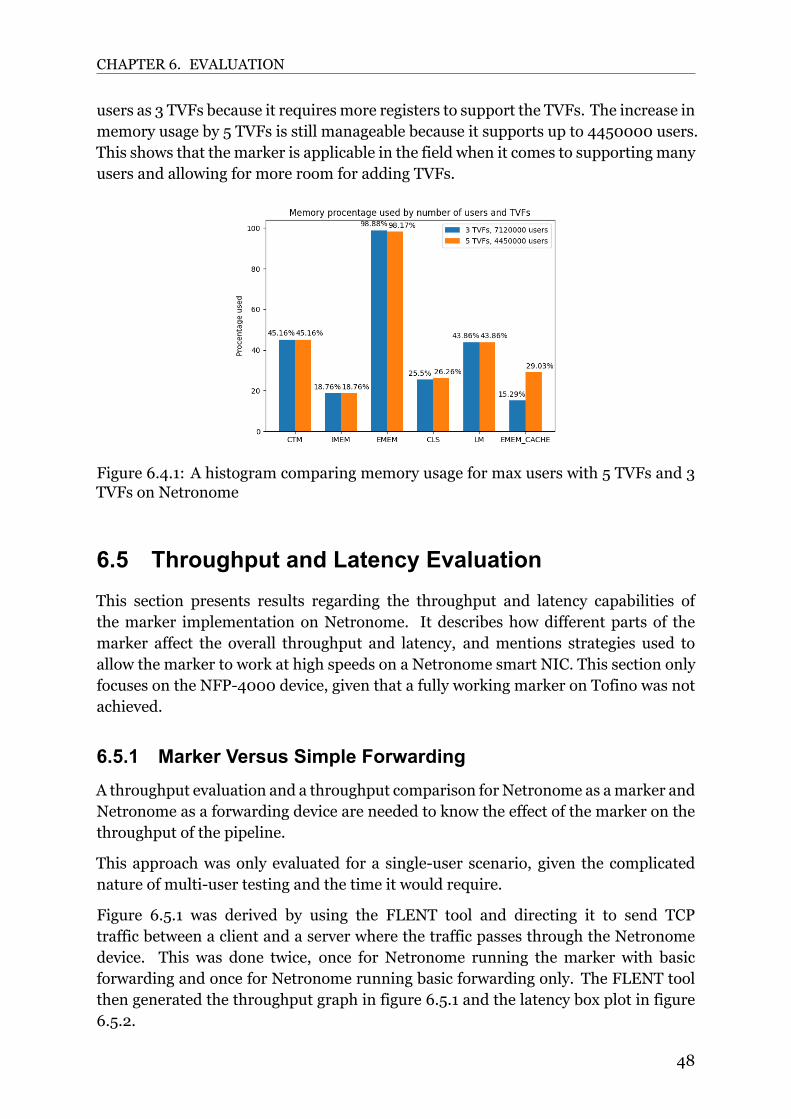
CHAPTER 6. EVALUATION
users as 3 TVFs because it requiresmore registers to support the TVFs. The increase inmemory usage by 5 TVFs is still manageable because it supports up to 4450000 users.This shows that the marker is applicable in the field when it comes to supporting manyusers and allowing for more room for adding TVFs.
Figure 6.4.1: A histogram comparing memory usage for max users with 5 TVFs and 3TVFs on Netronome
6.5 Throughput and Latency EvaluationThis section presents results regarding the throughput and latency capabilities ofthe marker implementation on Netronome. It describes how different parts of themarker affect the overall throughput and latency, and mentions strategies used toallow the marker to work at high speeds on a Netronome smart NIC. This section onlyfocuses on the NFP4000 device, given that a fully working marker on Tofino was notachieved.
6.5.1 Marker Versus Simple ForwardingA throughput evaluation and a throughput comparison for Netronome as amarker andNetronome as a forwarding device are needed to know the effect of the marker on thethroughput of the pipeline.
This approach was only evaluated for a singleuser scenario, given the complicatednature of multiuser testing and the time it would require.
Figure 6.5.1 was derived by using the FLENT tool and directing it to send TCPtraffic between a client and a server where the traffic passes through the Netronomedevice. This was done twice, once for Netronome running the marker with basicforwarding and once for Netronome running basic forwarding only. The FLENT toolthen generated the throughput graph in figure 6.5.1 and the latency box plot in figure6.5.2.
48
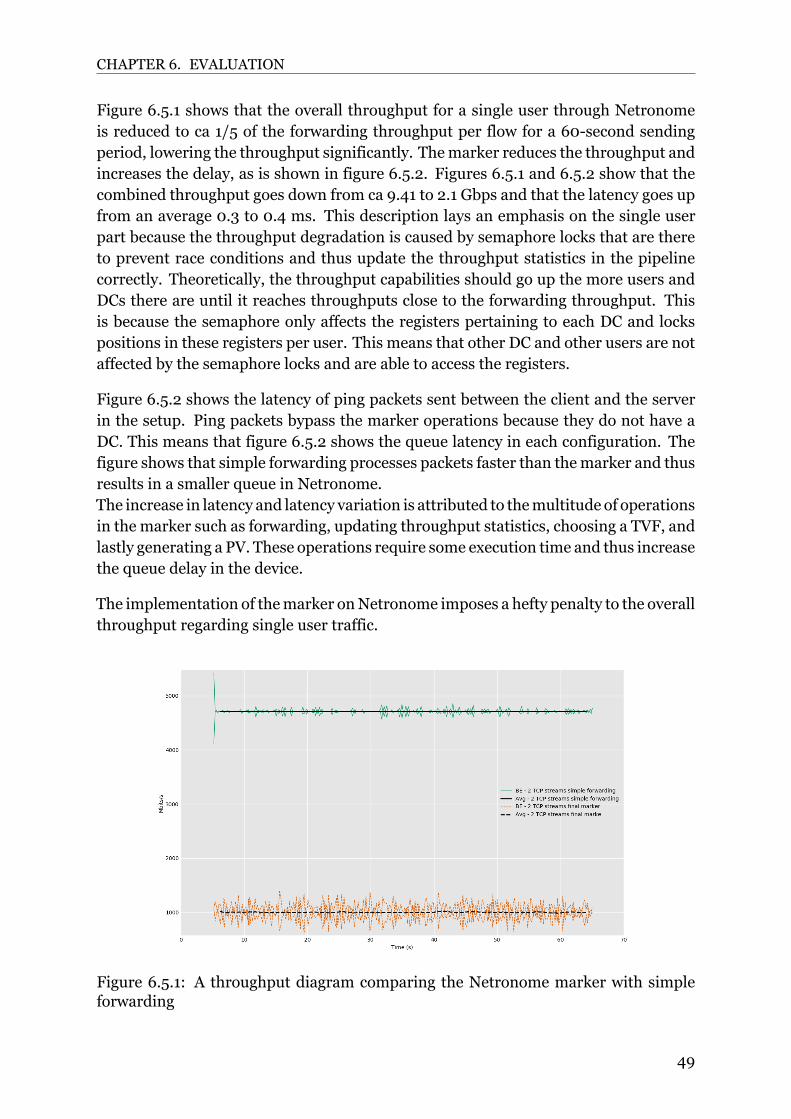
CHAPTER 6. EVALUATION
Figure 6.5.1 shows that the overall throughput for a single user through Netronomeis reduced to ca 1/5 of the forwarding throughput per flow for a 60second sendingperiod, lowering the throughput significantly. Themarker reduces the throughput andincreases the delay, as is shown in figure 6.5.2. Figures 6.5.1 and 6.5.2 show that thecombined throughput goes down from ca 9.41 to 2.1 Gbps and that the latency goes upfrom an average 0.3 to 0.4 ms. This description lays an emphasis on the single userpart because the throughput degradation is caused by semaphore locks that are thereto prevent race conditions and thus update the throughput statistics in the pipelinecorrectly. Theoretically, the throughput capabilities should go up the more users andDCs there are until it reaches throughputs close to the forwarding throughput. Thisis because the semaphore only affects the registers pertaining to each DC and lockspositions in these registers per user. This means that other DC and other users are notaffected by the semaphore locks and are able to access the registers.
Figure 6.5.2 shows the latency of ping packets sent between the client and the serverin the setup. Ping packets bypass the marker operations because they do not have aDC. This means that figure 6.5.2 shows the queue latency in each configuration. Thefigure shows that simple forwarding processes packets faster than themarker and thusresults in a smaller queue in Netronome.The increase in latency and latency variation is attributed to themultitude of operationsin the marker such as forwarding, updating throughput statistics, choosing a TVF, andlastly generating a PV. These operations require some execution time and thus increasethe queue delay in the device.
The implementation of themarker onNetronome imposes a hefty penalty to the overallthroughput regarding single user traffic.
Figure 6.5.1: A throughput diagram comparing the Netronome marker with simpleforwarding
49

CHAPTER 6. EVALUATION
Figure 6.5.2: Box diagrams comparing latency of the Netronome marker and simpleforwarding
6.5.2 Effect of Random Number GenerationRNG is computation heavy in this approach because it performs two operations togenerate a random number within a dynamic range.The RNG first generates a random number between 0 and (232) − 1 and then uses amodulus operation to limit the randomnumber to a number lower than the throughput.This affects both the throughput and the latency becausemodulus is a computationallyheavy operation.To verify the effect of the RNG on the performance of the marker, experiments areneeded. The FLENT tool was used on two configurations, a fullfledged (denoted as+RNG)Netronomemarker and aNetronomemarker that does not useRNG to generatea PV. The FLENT tool generates TCP traffic between two clients that are connectedthrough the Netronome device and collects data regarding the transfer. The data forthis experiment is present in figures 6.5.3 and 6.5.4.Figure 6.5.3 details a throughput graph for the two scenarios and shows that the RNGhas a minimal impact on the throughput when sending traffic for 60 seconds.Figure 6.5.4 details a latency box plot for the two scenarios and further shows that theRNG causes a significant degradation to latency compared to a marker without RNG.This is because RNG causes longer execution times and queue buildup.
While RNG does not affect the throughput significantly, it increases the latency of themarker significantly. Given that the RNG uses the random number generation andmodulus directly, it can be further optimized by checking for cases where the modulusoperation is not needed, which may lower the overall performance hit.
50
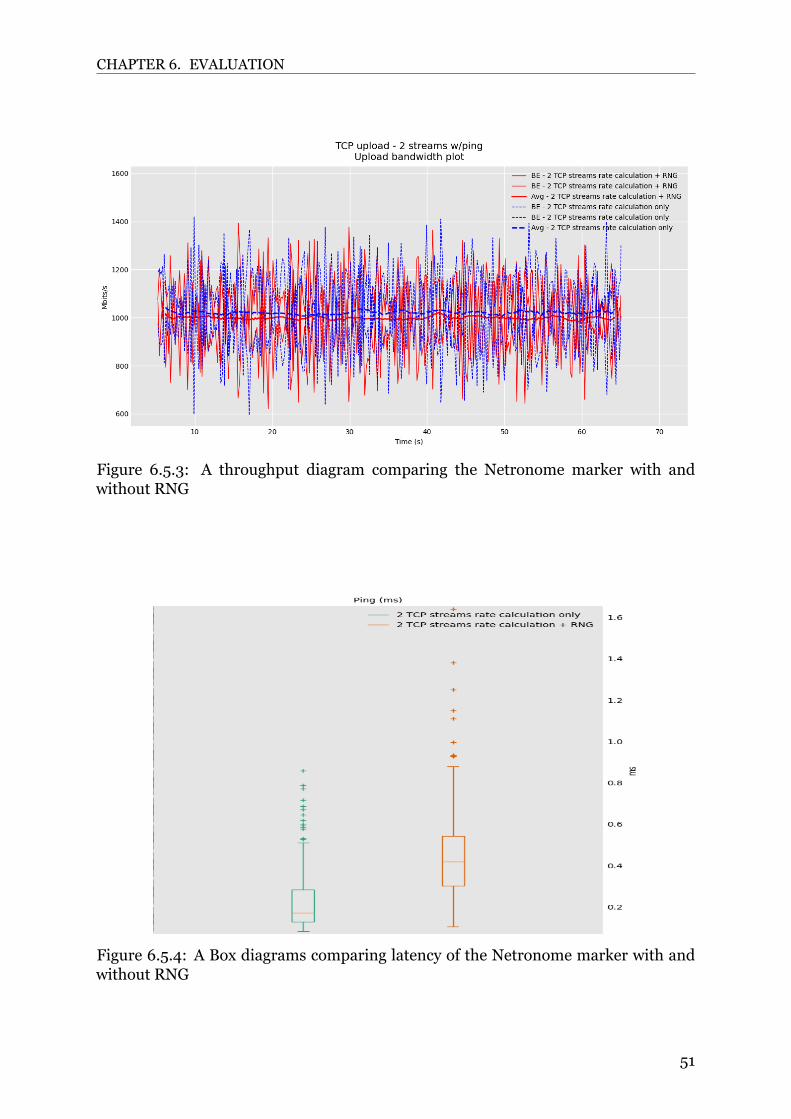
CHAPTER 6. EVALUATION
Figure 6.5.3: A throughput diagram comparing the Netronome marker with andwithout RNG
Figure 6.5.4: A Box diagrams comparing latency of the Netronome marker with andwithout RNG
51

Chapter 7
Conclusion and Future work
A packet valuemarking schemewas designed and implemented on a Tofino switch anda Netronome smart NIC dataplane programmable devices.
The implementation of the marker on Tofino was met with multiple limitations thatlead to a less accurate maker that does not follow the desired distribution of generatedrandom numbers. This issue requires a marker implementation that does not followthe proposed targetindependent design and thus is left for future work.
This implementation was successful on Netronome due to the additional possibility touse extern functions to calculate the correct random number needed for the markerto function. The Netronome implementation results in correct TVF distributions forhigher throughputs and correct priorities, while supporting a singleuser throughputof 2.1 Gbps and a theoretical multiuser throughput of up to 9.4 Gbps.This indicates that aNetronomemarker reaching such throughputs is highly applicablein real world scenarios where multiple markers are deployed as edge nodes in thenetwork.
TheNetronomemarker is inaccurate for sub 5Mbps throughputs, whichmay be causedby the packet generator, the rate calculation, or the time interval for the rate calculation.The RNG and semaphore implementations in the Netronome marker need furtheroptimizations to reach a higher throughput and a lower delay.
The issues above need to be addressed to reach a reliable marker, and thus are left forfuture work.
52
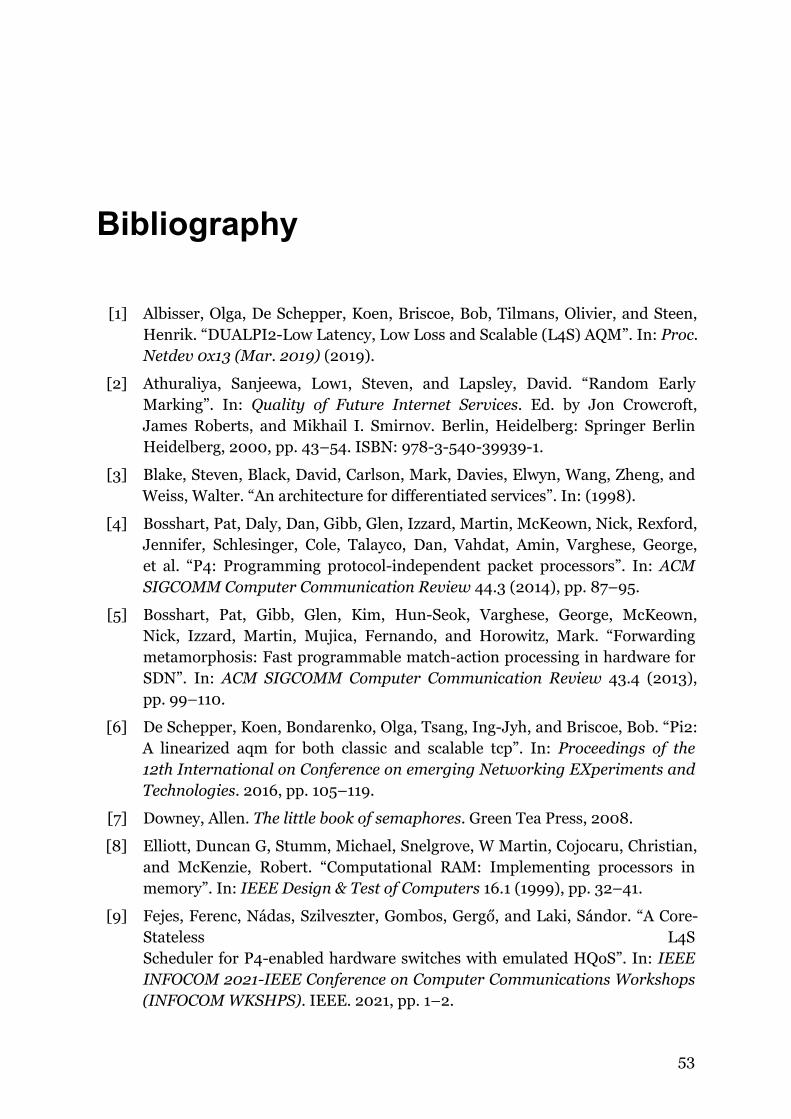
Bibliography
[1] Albisser, Olga, De Schepper, Koen, Briscoe, Bob, Tilmans, Olivier, and Steen,Henrik. “DUALPI2Low Latency, Low Loss and Scalable (L4S) AQM”. In: Proc.Netdev 0x13 (Mar. 2019) (2019).
[2] Athuraliya, Sanjeewa, Low1, Steven, and Lapsley, David. “Random EarlyMarking”. In: Quality of Future Internet Services. Ed. by Jon Crowcroft,James Roberts, and Mikhail I. Smirnov. Berlin, Heidelberg: Springer BerlinHeidelberg, 2000, pp. 43–54. ISBN: 9783540399391.
[3] Blake, Steven, Black, David, Carlson, Mark, Davies, Elwyn, Wang, Zheng, andWeiss, Walter. “An architecture for differentiated services”. In: (1998).
[4] Bosshart, Pat, Daly, Dan, Gibb, Glen, Izzard, Martin, McKeown, Nick, Rexford,Jennifer, Schlesinger, Cole, Talayco, Dan, Vahdat, Amin, Varghese, George,et al. “P4: Programming protocolindependent packet processors”. In: ACMSIGCOMM Computer Communication Review 44.3 (2014), pp. 87–95.
[5] Bosshart, Pat, Gibb, Glen, Kim, HunSeok, Varghese, George, McKeown,Nick, Izzard, Martin, Mujica, Fernando, and Horowitz, Mark. “Forwardingmetamorphosis: Fast programmable matchaction processing in hardware forSDN”. In: ACM SIGCOMM Computer Communication Review 43.4 (2013),pp. 99–110.
[6] De Schepper, Koen, Bondarenko, Olga, Tsang, IngJyh, and Briscoe, Bob. “Pi2:A linearized aqm for both classic and scalable tcp”. In: Proceedings of the12th International on Conference on emerging Networking EXperiments andTechnologies. 2016, pp. 105–119.
[7] Downey, Allen. The little book of semaphores. Green Tea Press, 2008.
[8] Elliott, Duncan G, Stumm, Michael, Snelgrove, W Martin, Cojocaru, Christian,and McKenzie, Robert. “Computational RAM: Implementing processors inmemory”. In: IEEE Design & Test of Computers 16.1 (1999), pp. 32–41.
[9] Fejes, Ferenc, Nádas, Szilveszter, Gombos, Gergő, and Laki, Sándor. “A CoreStateless L4SScheduler for P4enabled hardware switches with emulated HQoS”. In: IEEEINFOCOM 2021IEEE Conference on Computer Communications Workshops(INFOCOMWKSHPS). IEEE. 2021, pp. 1–2.
53
BIBLIOGRAPHY
[10] Floyd, Sally and Jacobson, Van. “Random early detection gateways forcongestion avoidance”. In: IEEE/ACM Transactions on networking 1.4 (1993),pp. 397–413.
[11] Gettys, Jim and Nichols, Kathleen. “Bufferbloat: Dark buffers in the internet”.In: Queue 9.11 (2011), pp. 40–54.
[12] Gibb, Glen. “Reconfigurable Hardware for softwaredefined networks”. PhDthesis. Stanford University, 2013.
[13] Gurevich, Vladimir. Programmable Data Plane at Terabit Speeds. https://p4.org/assets/p4_d2_2017_programmable_data_plane_at_terabit_speeds.pdf.Accessed: 20200911.
[14] Gurevich, Vladimir. Programmable Data Plane at Terabit Speeds. https://open - nfp . org / static / pdfs / Sponsor - Lecture - Vladimir - Data - Plane -Acceleration-at-Terabit-Speeds.pdf. Accessed: 20200918.
[15] Hasbrouck, Joel and Saar, Gideon. “Lowlatency trading”. In: Journal ofFinancial Markets 16.4 (2013), pp. 646–679.
[16] Hucaby,David.CCNPBCMSNexamcertification guide: CCNP selfstudy. CiscoPress, 2004.
[17] Index specific semaphore implementation. https : / / github . com / jsonch /TurboFlow/blob/master/dataplanes/P4Netronome/primitive_actions.c.Accessed: 20200826.
[18] Krämer, Jan, Wiewiorra, Lukas, and Weinhardt, Christof. “Net neutrality: Aprogress report”. In: Telecommunications Policy 37.9 (2013), pp. 794–813.
[19] Kreutz, Diego, Ramos, Fernando MV, Verissimo, Paulo Esteves, Rothenberg,Christian Esteve, Azodolmolky, Siamak, and Uhlig, Steve. “Softwaredefinednetworking: A comprehensive survey”. In:Proceedings of the IEEE 103.1 (2014),pp. 14–76.
[20] Laki, Sándor, Gombos, Gergő, Nádas, Szilveszter, and Turányi, Zoltán. “Takeyour own share of the PIE”. In: Proceedings of the Applied NetworkingResearch Workshop. 2017, pp. 27–32.
[21] Nádas, Szilveszter, Gombos, Gergő, Fejes, Ferenc, and Laki, Sándor. “ACongestion Control Independent L4S Scheduler”. In: Proceedings of theApplied Networking Research Workshop. 2020, pp. 45–51.
[22] Nádas, Szilveszter, Turányi, Zoltán Richárd, and Rácz, Sándor. “Per packetvalue: A practical concept for network resource sharing”. In: 2016 IEEE GlobalCommunications Conference (GLOBECOM). IEEE. 2016, pp. 1–7.
[23] Netronome products featuring NFP4000. https : / / www . netronome . com /products/agilio-cx/. Accessed: 20200825.
[24] Netzer, Robert HB and Miller, Barton P. “What are race conditions? Someissues and formalizations”. In: ACM Letters on Programming Languages andSystems (LOPLAS) 1.1 (1992), pp. 74–88.
54
BIBLIOGRAPHY
[25] Nichols, Kathleen, Jacobson, Van, McGregor, Andrew, and Iyengar, Jana.“Controlled delay active queue management”. In:Work in Progress (2013).
[26] P416 Language Specification. https://p4.org/p4-spec/docs/P4-16-v1.0.0-spec.html. Accessed: 20200815.
[27] P416 Language Specification. https://opennetworking.org/wp- content/uploads/2020/10/P416-Language-Specification-wd.html. Accessed: 20210628.
[28] P416 Portable Switch Architecture. https : / / p4 . org / p4 - spec / docs / PSA -v1.0.0.html. Accessed: 20200815.
[29] Pagiamtzis, Kostas and Sheikholeslami, Ali. “Contentaddressable memory(CAM) circuits and architectures: A tutorial and survey”. In: IEEE journal ofsolidstate circuits 41.3 (2006), pp. 712–727.
[30] Pan, Rong, Natarajan, Preethi, Piglione, Chiara, Prabhu, Mythili, Subramanian,Vijay, Baker, Fred, and Versteeg, Bill. “PIE: A lightweight control scheme toaddress the bufferbloat problem”. In: July 2013. DOI: 10 . 1109 / HPSR . 2013 .6602305.
[31] Pan, Rong,Natarajan, Preethi, Piglione, Chiara, Prabhu,Mythili Suryanarayana,Subramanian, Vijay, Baker, Fred, and VerSteeg, Bill. “PIE: A lightweight controlscheme to address the bufferbloat problem”. In: 2013 IEEE 14th InternationalConference on High Performance Switching and Routing (HPSR). IEEE. 2013,pp. 148–155.
[32] Systems, I.Netronome. NFP4000 theory of operation. en. Tech. Rep.,2016.[Online]. Acessed: 20200819. URL: https://www.netronome.com/static/app/img/products/silicon-solutions/WPNFP4000TOO.pdf.
[33] Toresson, Ludwig. “Making a packet value based scheduler on a programmableswitch for resource sharing and low latency”. In: (2020).
[34] Wray, Stuart. The Joy of MicroC. https : / / cdn . open - nfp . org / media /documents/the-joy-of-micro-c_fcjSfra.pdf. Accessed: 20200822.
[35] Yates, R. D., Tavan,M., Hu, Y., andRaychaudhuri, D. “Timely cloud gaming”. In:IEEE INFOCOM 2017 IEEE Conference on Computer Communications. 2017,pp. 1–9.
[36] Yi, Yung and Chiang, Mung. “Stochastic network utility maximisation—atribute to Kelly’s paper published in this journal a decade ago”. In: EuropeanTransactions on Telecommunications 19.4 (2008), pp. 421–442.
[37] Zhang, C., Yin, J., Cai, Z., and Chen, W. “RRED: robust RED algorithm tocounter lowrate denialofservice attacks”. In: IEEE Communications Letters14.5 (2010), pp. 489–491.
[38] Zhang, Qi, Liu, Jianhui, and Zhao, Guodong. “Towards 5G enabled tactilerobotic telesurgery”. In: arXiv preprint arXiv:1803.03586 (2018).
55