Chemical Geology - Universidad de Granada
10
Contents lists available at ScienceDirect Chemical Geology journal homepage: www.elsevier.com/locate/chemgeo Microscale trace-element distribution across the Cretaceous/Palaeogene ejecta layer at the Agost section: Constraining the recovery of pre-impact conditions Claudia Sosa-Montes de Oca a, ⁎ , Gert J. de Lange b , Francisca Martínez-Ruiz c , Miguel Ortega-Huertas d , Francisco J. Rodríguez-Tovar a a Departamento de Estratigrafía y Paleontología, Universidad de Granada, Avda. Fuentenueva s/n, 18002 Granada, Spain b Department of Earth Sciences—Geochemistry, Utrecht University, 3584 CD Utrecht, the Netherlands c Instituto Andaluz de Ciencias de la Tierra, IACT, CSIC-Universidad de Granada, Avda. Las Palmeras 4, 18100 Armilla, Granada, Spain d Departamento de Mineralogía y Petrología, Universidad de Granada, Avda. Fuentenueva s/n, 112002 Granada, Spain ARTICLE INFO Editor: Dr. Don Porcelli Keywords: KPgB Ejecta layer LA-ICP-MS Palaeoenvironmental reconstruction Microscale analyses ABSTRACT A high-resolution, sub-mm scale analysis of the distribution of major and trace elements across the ejecta layer marking the Cretaceous/Palaeogene boundary (KPgB) at the Agost section (SE Spain) was performed using Laser Ablation-Inductivity Coupled Plasma-Mass Spectrometry (LA-ICP-MS). A KPgB interval ≈17 mm thick, has been selected for this study. It includes gray calcareous marl from the uppermost Maastrichtian (Cretaceous), 2.02- mm-thick red clay (the ejecta layer), and blackish-gray clay (boundary clay layer) from the lowermost Danian (Palaeogene). The unconsolidated sediments were resin-embedded under O 2 -free conditions and analyzed by LA- ICP-MS line continuous scan measurements at 20 μm increments and a laser-beam of 120 μm. These micron-scale analyses show that the anomalous contents of trace and major elements in this boundary are restricted to the ejecta layer, which displays a relatively uniform distribution over its ≈2 mm thickness. Trace and major ele- mental ratios, such as Ca/Al, Ti/Al, Cr/Al, Fe/Al, Ni/Al, Cu/Al, Zn/Al, As/Al, Sb/Al and Pb/Al have similar values below and above the ejecta layer, consistent with similar palaeoenvironmental conditions prior to and after the impact event. Such element distribution points to anomalies exclusively restricted to the ejecta, thus a nearly instantaneous re-establishment of pre-impact conditions right after the impact event is observed. 1. Introduction The link between the major mass extinction at the end of the Cretaceous (KPgB), i.e. 66.04 Ma (Husson et al., 2014; Schulte et al., 2010a), and the Chicxulub asteroid impact event, has been broadly demonstrated (Renne et al., 2013). This impact entailed important short and long-term palaeoenvironmental changes worldwide (Kring, 2007; Vellekoop et al., 2018), including the instantaneous input of CO 2 into the atmosphere-ocean system (Artemieva and Morgan, 2017) analogous to current anthropogenic CO 2 input (Pachauri et al., 2014). Currently, the relationship between the KPg mass extinction and a meteorite impact is widely accepted however, alternative or com- plementary mechanisms, especially volcanism associated with the Deccan Traps, are still considered (Renne et al., 2015; Schoene et al., 2015, 2019). Although this event has been profusely studied, there are still debated issues such as the re-establishment time of pre-impact conditions or the recovery of biological productivity after this mass extinction (e.g., Lowery et al., 2018). To assess these aspects it is fun- damental to understand the evolution of environmental conditions prior to, during, and after the impact event. Major geochemical anomalies, recognized worldwide, characterize this boundary in both marine and continental depositional environ- ments (Goderis et al., 2013). However, the extraterrestrial contribution is particularly evident in the ejecta layer of marine distal sites, those located more than 5000 km from the Chicxulub impact crater (Claeys et al., 2002; Goderis et al., 2013; Smit, 1999; Urrutia-Fucugauchi and Pérez-Cruz, 2016). The Agost (SE Spain) section is one of the best ex- posed and most representative of marine distal areas for the KPgB event (Molina et al., 2005; Rodríguez-Tovar et al., 2006). This section has been intensely studied, thus an adequate background information is https://doi.org/10.1016/j.chemgeo.2019.119431 Received 19 March 2019; Received in revised form 20 November 2019; Accepted 27 November 2019 ⁎ Corresponding author. E-mail addresses: [email protected], [email protected] (C. Sosa-Montes de Oca), [email protected] (G.J. de Lange), [email protected], [email protected] (F. Martínez-Ruiz), [email protected] (F.J. Rodríguez-Tovar). Chemical Geology 533 (2020) 119431 Available online 14 December 2019 0009-2541/ © 2019 Elsevier B.V. All rights reserved. T
-
Upload
khangminh22 -
Category
Documents
-
view
0 -
download
0
Transcript of Chemical Geology - Universidad de Granada

Contents lists available at ScienceDirect
Chemical Geology
journal homepage: www.elsevier.com/locate/chemgeo
Microscale trace-element distribution across the Cretaceous/Palaeogeneejecta layer at the Agost section: Constraining the recovery of pre-impactconditions
Claudia Sosa-Montes de Ocaa,⁎, Gert J. de Langeb, Francisca Martínez-Ruizc,Miguel Ortega-Huertasd, Francisco J. Rodríguez-Tovara
a Departamento de Estratigrafía y Paleontología, Universidad de Granada, Avda. Fuentenueva s/n, 18002 Granada, SpainbDepartment of Earth Sciences—Geochemistry, Utrecht University, 3584 CD Utrecht, the Netherlandsc Instituto Andaluz de Ciencias de la Tierra, IACT, CSIC-Universidad de Granada, Avda. Las Palmeras 4, 18100 Armilla, Granada, SpaindDepartamento de Mineralogía y Petrología, Universidad de Granada, Avda. Fuentenueva s/n, 112002 Granada, Spain
A R T I C L E I N F O
Editor: Dr. Don Porcelli
Keywords:KPgBEjecta layerLA-ICP-MSPalaeoenvironmental reconstructionMicroscale analyses
A B S T R A C T
A high-resolution, sub-mm scale analysis of the distribution of major and trace elements across the ejecta layermarking the Cretaceous/Palaeogene boundary (KPgB) at the Agost section (SE Spain) was performed using LaserAblation-Inductivity Coupled Plasma-Mass Spectrometry (LA-ICP-MS). A KPgB interval ≈17 mm thick, has beenselected for this study. It includes gray calcareous marl from the uppermost Maastrichtian (Cretaceous), 2.02-mm-thick red clay (the ejecta layer), and blackish-gray clay (boundary clay layer) from the lowermost Danian(Palaeogene). The unconsolidated sediments were resin-embedded under O2-free conditions and analyzed by LA-ICP-MS line continuous scan measurements at 20 μm increments and a laser-beam of 120 μm. These micron-scaleanalyses show that the anomalous contents of trace and major elements in this boundary are restricted to theejecta layer, which displays a relatively uniform distribution over its ≈2 mm thickness. Trace and major ele-mental ratios, such as Ca/Al, Ti/Al, Cr/Al, Fe/Al, Ni/Al, Cu/Al, Zn/Al, As/Al, Sb/Al and Pb/Al have similarvalues below and above the ejecta layer, consistent with similar palaeoenvironmental conditions prior to andafter the impact event. Such element distribution points to anomalies exclusively restricted to the ejecta, thus anearly instantaneous re-establishment of pre-impact conditions right after the impact event is observed.
1. Introduction
The link between the major mass extinction at the end of theCretaceous (KPgB), i.e. 66.04 Ma (Husson et al., 2014; Schulte et al.,2010a), and the Chicxulub asteroid impact event, has been broadlydemonstrated (Renne et al., 2013). This impact entailed importantshort and long-term palaeoenvironmental changes worldwide (Kring,2007; Vellekoop et al., 2018), including the instantaneous input of CO2
into the atmosphere-ocean system (Artemieva and Morgan, 2017)analogous to current anthropogenic CO2 input (Pachauri et al., 2014).Currently, the relationship between the KPg mass extinction and ameteorite impact is widely accepted however, alternative or com-plementary mechanisms, especially volcanism associated with theDeccan Traps, are still considered (Renne et al., 2015; Schoene et al.,2015, 2019). Although this event has been profusely studied, there are
still debated issues such as the re-establishment time of pre-impactconditions or the recovery of biological productivity after this massextinction (e.g., Lowery et al., 2018). To assess these aspects it is fun-damental to understand the evolution of environmental conditionsprior to, during, and after the impact event.
Major geochemical anomalies, recognized worldwide, characterizethis boundary in both marine and continental depositional environ-ments (Goderis et al., 2013). However, the extraterrestrial contributionis particularly evident in the ejecta layer of marine distal sites, thoselocated more than 5000 km from the Chicxulub impact crater (Claeyset al., 2002; Goderis et al., 2013; Smit, 1999; Urrutia-Fucugauchi andPérez-Cruz, 2016). The Agost (SE Spain) section is one of the best ex-posed and most representative of marine distal areas for the KPgB event(Molina et al., 2005; Rodríguez-Tovar et al., 2006). This section hasbeen intensely studied, thus an adequate background information is
https://doi.org/10.1016/j.chemgeo.2019.119431Received 19 March 2019; Received in revised form 20 November 2019; Accepted 27 November 2019
⁎ Corresponding author.E-mail addresses: [email protected], [email protected] (C. Sosa-Montes de Oca), [email protected] (G.J. de Lange), [email protected],
[email protected] (F. Martínez-Ruiz), [email protected] (F.J. Rodríguez-Tovar).
Chemical Geology 533 (2020) 119431
Available online 14 December 20190009-2541/ © 2019 Elsevier B.V. All rights reserved.
T

available for our high-resolution approach.The distribution of trace elements is crucial for the reconstruction of
the palaeoenvironmental parameters associated with the impact (e.g.,Goderis et al., 2013; Smit and Ten Kate, 1982), and to evaluate oxy-genation conditions. However, appropriate high-resolution samplingacross the KPgB is a challenge, due to the different lithologies of thetransition and the millimetric to few centimeters scale thickness of theejecta and boundary clay layers.
Sosa-Montes de Oca et al. (2018a, 2018b) have explored a novelmethodology in the KPgB sediments at the Agost section, enabling high-resolution LA-ICP-MS analyses in continuous mode after resin embed-ding. In these contributions, the high potential of the methodology wasdemonstrated. In this study we have used this novel methodologythough applied to the high-resolution analysis of the ejecta layer thathas not been previously studied by using this method since preservationin the formerly studied section was not good enough.
Hence we have used intact segments of the KPgB at Agost and LA-ICP-MS in continuous high-resolution laser mode (μm-scale) after resinembedding, to obtain a high-resolution profiles of elemental ratios, Ca/Al, Ti/Al, Cr/Al, Fe/Al, Cu/Al, Ni/Al, Zn/Al, As/Al, Sb/Al and Pb/Al,across the ≈2 mm thick ejecta layer, in order to provide new insightsinto the duration of environmental perturbations derived from theimpact event.
2. Geological setting
The KPgB distal section of Agost (38°27′3.31′N; 0°38′9.71″E) is lo-cated at km 9 on the west side of road CV-827, north of the town ofAgost, Alicante (Southeast Spain) (Fig. 1). At the time of the KPgBimpact, the Agost site was located offshore, in a upper-bathyal setting(~600 to 1000 m depth) (Schulte et al., 2010b), at around 27–30° Npalaeolatitude (Smith et al., 1981). Lithologically, the Agost sectioncomprises (Fig. 1): (a) Cretaceous sediments consisting of gray calcar-eous marl and marl of Late Maastrichtian age (uppermost Cretaceous),
overlain by lowermost Palaeogene sediments (Early Danian), including(b) 2.02-mm-thick of a red clay ejecta layer, and (c) a blackish-grayboundary clay interval (see a, b and c in Fig. 1). The ejecta layer, at thedistal sections, marks the sharp contact between the Maastrichtian andDanian, and is known to contain impact evidence such as spherules(Glass and Burns, 1987; Martínez-Ruiz et al., 1997; Smit, 1990, 1999;Smit and Klaver, 1981), iridium and other platinum-group element(PGE) anomalies (Alvarez et al., 1980, 1990; Claeys et al., 2002; Smitand Ten Kate, 1982) as well as enhanced concentrations of Cr, Fe, Ni,and Ti which came from the meteorite, a sulphide-rich carbonaceouschondrite (Kyte, 1998; Martínez-Ruiz et al., 1997; Shukolyukov andLugmair, 2004) and also a significant decrease of calcium carbonate(Goderis et al., 2013; Schulte et al., 2010b), a result to the mass ex-tinction caused.
This study focuses on a ≈ 17 mm-thick interval, containing allabove-mentioned facies (a, b and c; Fig. 1). According to the sedi-mentation rates of 2.05 cm kyr−1 estimated for the uppermost Maas-trichtian sediments (Thibault and Husson, 2016), and that of0.83 cm kyr−1 calculated for the lowermost Danian sediments (Grootet al., 1989), the studied material is considered to span a time intervalranging from 240 years before to 1300 years after the KPgB. Further-more, it is thought that the ejecta layer deposition itself was a snapshoton a geological time scale, potentially in the order of days to months(Artemieva and Morgan, 2009).
3. Material and methods
3.1. Resin embedding Cretaceous-Palaeogene interval
In the studied KPgB interval of the Agost section, seven segments~25 mm-thick were collected, all including a well-preserved visibleejecta layer. All segments were vertically sawn in two parts; one partwas reserved for conventional ICP-OES and ICP-MS analyses, while inthe other part resin embedding treatments were conducted (Fig. 2).
Fig. 1. Agost outcrop. Location of the Cretaceous-Palaeogene section (KPg) in the Agost section (Alicante, Southeast Spain). The studied Agost transition (KPgT)comprises: (a) gray calcareous marlstones and marlstones from the uppermost Maastrichtian (Cretaceous), (b) 2–3-mm-thick ejecta layer, and (c) blackish-grayboundary clay layer from the lowermost Danian (Maastrictian).
C. Sosa-Montes de Oca, et al. Chemical Geology 533 (2020) 119431
2

Prior to the resin embedding, the segments were reinforced, usingaluminum foil (0.2 mm thickness) and Teflon mesh. To do so, we firstcut the section edges as flat as possible and covered their bottom withTeflon mesh and perforated aluminum foil, fixing both with wire(Fig. 2a and b).
For resin embedding we used Spurr Epoxy Resin following themethodology specified in Hennekam et al. (2015) and Jilbert et al.(2008). The required duration of resin embedding steps depends on thedimensions of the segment. In this case, all steps were done during26 days in an argon-filled glove box. The specific process is as follows:a) firstly, samples are treated with acetone during four consecutivedays; for this, 1 l of oxygen-free acetone was used, changing every 24 hand keeping the samples always submerged, b) secondly, samples aretreated with spurr epoxy resin during 22 days, in which four sub-stepswere differentiated: sub-step 1: using a mixture of acetone and resin 3:1(75% acetone: 25% resin) during four days, sub-step 2: using a mixtureof acetone and resin 2:1 (66% acetone: 33% resin) during four days,sub-step 3: using a mixture of acetone and resin 1:1 (50% acetone: 50%resin) during four days, and sub-step 4: using pure spurr epoxy resinduring 10 days. All exchanges were done using syringes with the dif-ferent intervals remaining undisturbed inside the bath, and all handlingwas done inside the anoxic glove box.
After that, the different treated segments were removed from theglove box and put into the oven for curing during 48 h at 60 °C. Thesolid resin KPgB segments (seven segments in total) were then cutperpendicular to the bedding plane. Segments surfaces were polishedand the two best segments (segments 1 and 6), in which the ejecta layerseems visibly best preserved, were analyzed by LA-ICP-MS line-scan(Fig. 2c and Fig. 2d).
3.2. LA-ICP-MS measurements and processing
Segments 1 and 6 were selected for line scan analyses, because ofbetter visible preservation of the ejecta layer during all processing.Therefore, 7 and 12 LA-ICP-MS lines scan were respectively conductedin segments 1 and 6 (Fig. 2c and d). Each profile was between 8 and25 mm long and the analytical sampling was done at 20 μm steps
(Fig. 2c and d). Between 345 and 1223 values were thus obtained, in-cluding between 29 and 360 data in the gray calcareous marl and marl(uppermost Maastrichtian), between 63 and 144 data in the ejectalayer, and between 127 and 879 data in the blackish-gray boundaryclay interval (lowermost Danian).
A 193 nm wavelength COMPex 102 ArF excimer laser ablationsystem (Lambda Physik, Göttingen, Germany) connected to an Element2 sector field ICP-MS (Thermo Scientific, Bremen, Germany) was usedfor all LA-ICP-MS analyses at the GML of Utrecht University (TheNetherlands). The data were subsequently processed following theprocedure of Sosa-Montes de Oca et al. (2018a, 2018b). The LA-ICP-MSspecifications as well as elemental ratios used in this paper are sum-marized in Table 1.
Concretely, for our samples and with the goal to measure elementslike Ir, Pt and Pd a specific external standard (WPR-1) was used,
Fig. 2. Evolution of segments 1 and 6 (S-1 and S-6) during the resin embedding process: (a) section prior to embedding; (b) section prepared for embedding; (c)section after cutting (*) and polishing. LA-paths in red lines; (d) Black part of segment-6. (*): after embedding, the ~2 mm-thick sections were cut so as to have aclean, flat surface and being ~10 mm-thick. (For interpretation of the references to color in this figure legend, the reader is referred to the web version of this article.)
Table 1Typical LA-ICP-MS settings for measurements on resin embedded samples.
ICP-MS type Thermo Scientific Element 2
RF power 1300 WPlasma gas Ar (16.00 l min−1)Auxiliary gas Ar (0.85 l min−1)Carrier gas Ar (0.67 l min−1) and He (0.75 l min−1)Skimmer cone AluminumSampler cone NickelMeasurement
frequency~2.5–3 Hz
Resolution Low (M/ΔM = 400)Isotopes⁎ 23Na, 24Mg, 25Mg, 26Mg, 27Al, 29Si, 31P, 43Ca, 44Ca, 49Ti,
51V, 52Cr, 55Mn, 57Fe, 59Co, 60Ni, 65Cu, 66Zn, 75As, 88Sr,89Y, 90Zr, 97Mo, 98Mo, 103Rh, 105Pd, 121Sb, 137Ba, 140Ce,185Re, 193Ir, 194Pt, 195Pt, 208Pb, 232Th, 238U
Laser type COMPex 102 (ArF Excimer, Lambda Physik)Wavelength 193 nmFluence 8 J cm−2
Spot size diameter 120 μmRepetition rate 10 HzScanning rate 0.0275 mm s−1
⁎ Elements used in this paper.
C. Sosa-Montes de Oca, et al. Chemical Geology 533 (2020) 119431
3
additionally to external standard (NIST SRM610) used for the otherelements (see Sosa-Montes de Oca et al., 2018a, 2018b).
3.3. ICP-OES and ICP-MS analyses
Discrete samples from segments 1 and 6 were manual collected andanalyzed by ICP-OES and ICP-MS. Specifically, nine samples were takenalong 22 mm of segment 1, and six samples were taken along 17 mm ofsegment 6.
For the geochemical analysis, samples were crushed in an agatemortar and digested with HNO3 + HF in order to obtain the samplesolution. Trace element concentrations were determined using an ICP-Mass Spectrometry (NEXION 300D). Results were calibrated usingblanks and international standards, with analytical precision betterthan±2% for 50 ppm elemental concentrations and ± 5% for 5 ppmelemental concentrations. The concentrations of major elements (Al,Ca, Fe, K and Mg) were measured in the same sample solutions using anICP-Optical Emission Spectroscope (Perkin-Elmer Optima 8300) withan Rh anode X-ray tube. Blanks and international standards were usedfor quality control and the analytical precision was better than±2.8%and 1.9% for 50 ppm elemental concentrations of Al and Ca, respec-tively; better than±0.5% for 20 ppm elemental concentrations of Fe;better than±0.4% for 5 ppm elemental concentrations of K; and betterthan±1.5% for 2.5 ppm elemental concentrations of Mg. All thegeochemical analyses were performed at the Center for ScientificInstrumentation (CIC), University of Granada, Spain.
Across the KPgB, a large shift in carbonate content occurs. Forstudying elemental variability without this carbonate dilution effect, Al-normalized concentrations or recalculation on a carbonate-free basis isusually applied (Calvert and Pedersen, 1993; De Lange et al., 1987;Morford and Emerson, 1999; Tribovillard et al., 2006; Van der Weijden,2002). We have used the more straight-forward ratios versus Al. Thosereported in this paper are Ca/Al, Cr/Al, Fe/Al, Ni/Al, Cu/Al, and Zn/Al.
3.4. High-Resolution Scanning Electron Microscopy (HRSEM)
Morphology and compositional information was also obtained fromHigh-Resolution Scanning Field Scanning Electron Microscope(HRSEM) (AURIGA from Carl Zeiss SMT, CIC, University of Granada,Spain) equipped with an Oxford energy-dispersive X-ray spectrometer(EDX), used to quantitatively analyze the elements present in the se-lected areas.
The analysis by HRSEM focused on the transition between the graycalcareous marlstones from the uppermost Maastrichtian and the ejectalayer from the lowermost Danian.
4. Results
4.1. Analytical results of LA-ICP-MS
After LA-ICP-MS measurements, the data for all profiles were pro-cessed, that is 7 profiles for segment 1 (see Appendix B of the supple-mentary material), with path-lengths between 8 and 25 mm long, and12 profiles for segment 6 (see Appendix C and Appendix D of thesupplementary material), with lengths between 13 and 18 mm long.The profiles where the ejecta layer is unaffected by cracks were selected(i.e., profiles 1b and 1f for segment 1; and profiles 6j, 6reva and 6revbfor segment 6). Cracks may have pre-existed and were augmentedduring the embedding procedure. Analytically, cracks lead to varia-bility in the elemental ratios, due to edge effects of the abrasion surface,and are not homogeneous for all elements. Furthermore, it is importantto take into account, that the remaining variability inside the ejectalayer is possibly attributable to the presence of different minerals ty-pical of the ejecta layer (such as spherules or pyrite).
The final profiles, with the mean values of the 5 profiles selected(1b, 1f, 6j, 6reva, 6revb), resulted scatter and with several anomalouspoints. To clean these profiles, first values associated with major crackswere deleted. Subsequently, the data were subjected to statistical
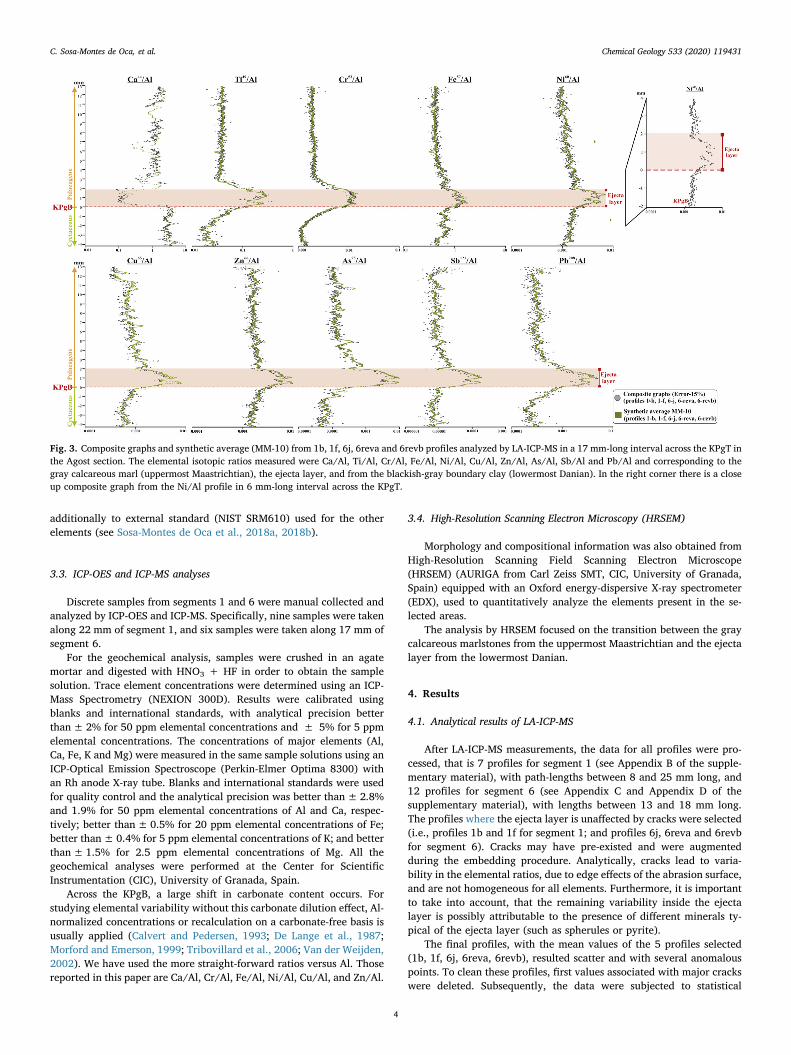
Fig. 3. Composite graphs and synthetic average (MM-10) from 1b, 1f, 6j, 6reva and 6revb profiles analyzed by LA-ICP-MS in a 17 mm-long interval across the KPgT inthe Agost section. The elemental isotopic ratios measured were Ca/Al, Ti/Al, Cr/Al, Fe/Al, Ni/Al, Cu/Al, Zn/Al, As/Al, Sb/Al and Pb/Al and corresponding to thegray calcareous marl (uppermost Maastrichtian), the ejecta layer, and from the blackish-gray boundary clay (lowermost Danian). In the right corner there is a closeup composite graph from the Ni/Al profile in 6 mm-long interval across the KPgT.
C. Sosa-Montes de Oca, et al. Chemical Geology 533 (2020) 119431
4

treatment.Different statistical treatments were done:
i) Firstly, a synthetic average was determined for the 5 profiles se-lected (1b, 1f, 6j, 6reva, 6revb) (Fig. 3). The synthetic average of the5 profiles is the mean between the synthetic averages of each profileindividually. Thus, the synthetic average throughout one full profileis mean value between those profiles whose absolute value of thesubtraction between them is lower. For example; for the syntheticaverage of 1b-profile, is necessary to calculate, for each individualpoint along all profile, the absolute value of the subtraction between│1b-1f│, │1b-6i│, │1b-6reva│ and │1b-6revb│, if minor valuebetween them is │1b-1f│, then for this point, the synthetic averageis the mean value between the profile b and f. The same calculationis repeated along the full profile b (see Fig. 3).
ii) Secondly, composite graphs were made from the 5 selected profiles(Fig. 3). For the composite graphs, those values of the syntheticaverage of each profile, which present an error greater than 15%, inrelation to the mean value of the 5 synthetic average profiles, wereremoved. The mean of the error values of 5 profiles formed com-posite graphs for a studied interval ≈17 mm long (Fig. 3) or for astudied interval ≈6 mm long (Fig. 3).
Neither the slight difference in the ejecta layer thickness among thedifferent profiles not the anomalous values in the profiles were nottaken into consideration since all of them were corrected following theaforementioned statistic treatment (the synthetic average and compo-site graphs).
Geochemical ratios Ca/Al, Ti/Al, Cr/Al, Fe/Al, Ni/Al, Cu/Al, Zn/Al,As/Al, Sb/Al and Pb/Al measured by LA-ICP-MS are given in AppendixA of the supplementary material. Furthermore, composite graphs foreach element are represented for an interval of≈17 mm long (831 datain total) (Fig. 3) and of ~6 mm long (295 data in total) (Fig. 3), in-cluding uppermost Maastrichtian gray calcareous marl and marl, ejectalayer and blackish-brown boundary clay interval of lowermost Danian.
4.2. ICP-OES and ICP-MS data
Geochemical data and profiles on discrete samples from segments 1and 6 analyzed by ICP-OES and ICP-MS (ICP-OES/MS) are presented inTable 2 and Fig. 4.
For a selected set of discrete samples, the CaCO3⁎ content (calcu-
lated from Ca*2.5), Fe/Al, Cr/Al, Ni/Al, Cu/Al and Zn/Al ratios havebeen determined using ICP-OES/MS (Table 2; Fig. 4). These samplescome from an ≈24 mm long interval, from segment 1 and 6. In all keyintervals (a, b, c), between 1 and 4 samples were taken.
4.3. Comparing discrete-samples using ICP-OES and ICP-MS vs continuous-samples using LA-ICP-MS
The shared interval, covered by both discrete sampling/ICP-OES/MS and by continuous/LA-ICP-MS analyses, is 17.54 mm, including4.75 mm of uppermost Maastrichtian gray calcareous marl and marl,2.02 mm of the ejecta layer, and 10.77 mm of blackish-gray boundaryclay interval from the lowermost Danian (Fig. 4).
For this interval, maximum values of ≈50% for CaCO3⁎ and ≈10
for Ca/Al ratio are registered in both, the gray calcareous marl from theuppermost Maastrichtian and the boundary clay interval from thelowermost Danian, while the ejecta layer is characterized by minimumvalues for CaCO3
⁎ (between 10 and 20%) and Ca/Al ratio (0.09).In contrast, significant increases in Fe/Al, Cr/Al, Ni/Al, Cu/Al and
Zn/Al ratios are exclusively observed within the ejecta layer (Fig. 4),while in all profiles similar values are observed for the uppermostMaastrichtian sediments and for the lowermost Danian boundary clayinterval (Fig. 4).
Within just a 6 mm interval (Fig. 5), the data obtained by LA-ICP-MSof 1f profile from segment 1 and by ICP-OES/MS from segment 1 can becompared (Fig. 5). The difference in analytical resolution is striking,being 0.09 mm and ~1 mm respectively. This represents, for the~2.02 mm-thick ejecta layer, a much larger amount of analytical databy LA-ICP-MS using 20 μm increments than by discrete sampling usingICP-OES/MS (99 data versus 1–2 data). Accordingly, for this ejectalayer a single peak is observed in ICP-OES/MS analyses, whereas arange of constant values is obtained with LA-ICP-MS (Fig. 5).
5. Discussion
5.1. Geochemical anomalies across the ejecta layer
The conducted high-resolution analysis (continuous μm-scale) in theKPgB transition at the Agost section focused on elements such as Cr, Fe,
Table 2Table with the elemental content (major) and elemental ratios, measured by ICP-OES and ICP-MS across a 20 mm-long interval (from −5 mm to 15 mm) from thesample 6 and a 22 mm-interval (from −2 mm to 20 mm) from the sample 1 in the KPgB at the Agost section, including the gray calcareous marlstones and malstonesfrom the uppermost Maastrichtian, the ejecta layer (red color) and the boundary clay layer from the lowermost Danian. Al, Ca, CaO, CaCO3
⁎, concentrations (%); Ca/Al and Fe/Al ratios; Cr/Al, Cu/Al, Ni/Al, and Zn/Al ratios (×10−4).
Samples Agost Distance KPgB (mm) Mayor elements Geochemical proxies
(%) (%/%) (∗10−4)
Al Ca CaO CaCO3(⁎) Fe Fe/Al Ca/Al Cr/Al Cu/Al Ni/Al Zn/Al
Segment-1 Ag-1.9 (+20) 20 6.08 11.86 16.60 29.65 2.48 0.41 1.95 15.64 4.61 10.49 11.64Ag-1.8 (+15) 15 6.33 11.32 15.85 28.30 2.53 0.40 1.79 16.02 4.73 10.63 12.39Ag-1.7 (+10) 10 6.93 11.28 15.79 28.20 2.68 0.39 1.63 15.00 5.06 10.35 11.23Ag-1.6 (+5) 5 7.31 9.35 13.08 23.37 3.09 0.42 1.28 18.35 6.57 11.59 12.28Ag-1.5 (1, 2) 1.5 6.54 6.91 9.68 17.28 4.79 0.73 1.06 72.97 16.55 21.14 24.58Ag-1.4 (0, 1) 0.5 5.47 11.12 15.57 27.80 4.37 0.80 2.03 56.29 12.21 18.94 20.58Ag-1.3 (−1, 0) −0.5 4.63 13.92 19.49 34.80 3.62 0.78 3.01 12.02 5.72 13.99 12.95Ag-1.2 (−2, −1) −1.5 4.35 15.36 21.50 38.40 3.29 0.76 3.53 10.01 6.13 13.34 12.79Ag-1.1 (−2, −1) −2.0 3.78 18.94 26.52 47.35 2.22 0.59 5.01 9.95 7.34 11.81 13.88
Segment-6 Ag-6.6 (+15) 15 4.95 16.53 23.14 41.33 2.01 0.41 3.34 15.14 4.32 8.57 11.18Ag-6.5 (+10) 10 5.88 14.00 19.60 35.00 2.38 0.41 2.38 15.12 4.15 8.59 11.47Ag-6.4 (+5) 5 6.56 9.06 12.68 22.65 2.84 0.43 1.38 19.41 5.81 10.65 12.28Ag-6.3 (0, 2) 1 7.50 2.20 3.08 5.49 6.65 0.89 0.29 91.29 25.26 27.89 36.98Ag-6.2 (−1) −1.0 4.70 15.21 21.29 38.02 3.22 0.68 3.23 25.96 8.68 16.06 14.67Ag-6.1 (−5, −2) −3.5 4.85 16.02 22.43 40.05 2.61 0.54 3.30 15.25 5.89 12.73 13.37
(⁎) Calculated from Ca*2.5.
C. Sosa-Montes de Oca, et al. Chemical Geology 533 (2020) 119431
5

Ni, Cu, and Zn. These are related with anoxic depositional conditions(Calvert and Pedersen, 1993; Tribovillard et al., 2006). The study re-vealed constant high concentrations in the selected elements linkedexclusively to the ejecta layer. This fact supports similar oxygen con-ditions prior to and after the KPgB, and anoxic conditions restrictedonly to the brief episode of the ejecta layer deposition, estimated to beof the order of days to months at most (Artemieva and Morgan, 2009).
Lowery et al. (2018) have recently shown that the recovery ofproductivity in the Chicxulub structure is faster than in many othersites. They find that proximity to the impact was not a factor on re-covery in marine ecosystems but linked it with the recovery of en-vironmental conditions (e.g. oxygenation conditions).
Here we demonstrate that at the Agost distal section, the recovery ofthe oxygenation conditions may have been geologically instantaneous(in the range of days). This is also supported by the rapid recovery ofthe macrobenthic tracemaker community based on the presence of Fe-oxide spherules in the infilling of Thalassinoides traces in the Agostsection (Rodríguez-Tovar, 2005) and the bioturbational disturbance ofthe 2–3-mm-thick K/Pg red boundary layer at the deeper Caravacasection (Rodríguez-Tovar and Uchman, 2008).
Hence, the rapid re-establishment of the oxic conditions at the distal
sections of KPgB, led to a quick recovery of the opportunistic organismsof the macrobenthic tracemarker community. This quick recovery ofbiological activity also led to the mixture of the infilling material oftrace fossils, essentially as a result to the unconsolidated character ofthe sediment (Sosa-Montes de Oca et al., 2016).
5.2. Comparing analytical continuously profiles obtained by LA-ICP-MSwith HRSEM
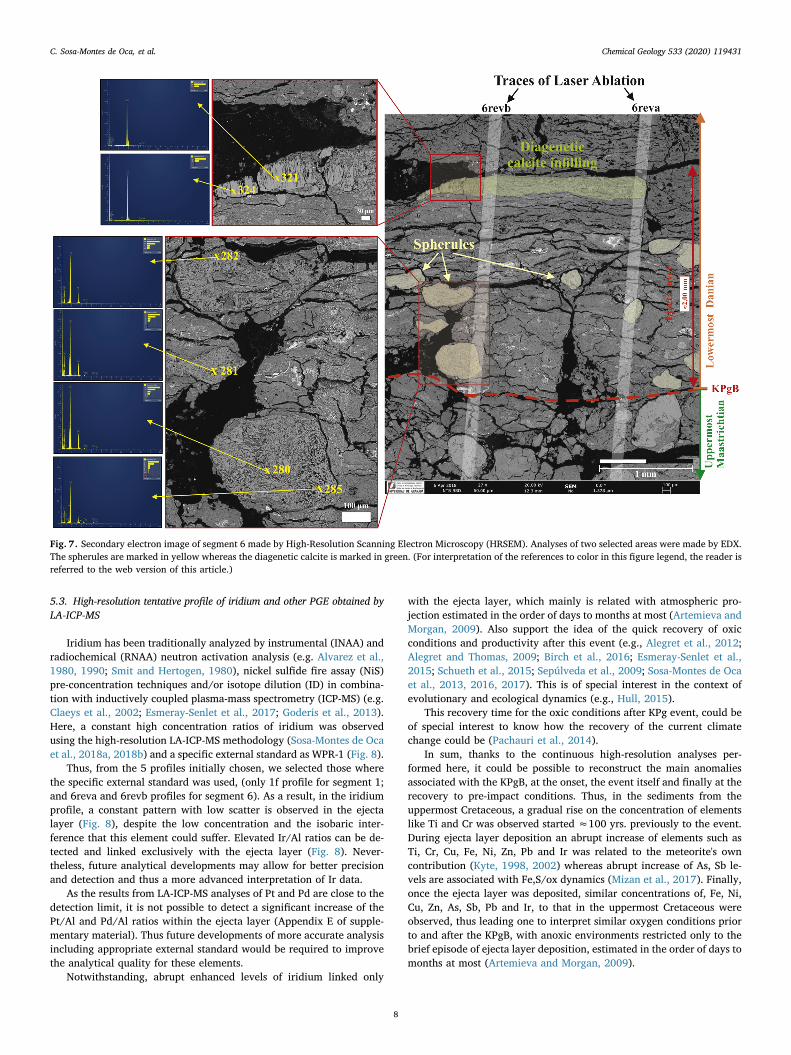
Comparing our continuous profiles obtained by LA-ICP-MS vsHRSEM analyses for elements such as Ca and Ti, within segment 6 (revaand revb profiles) (Fig. 6) also illustrates how the decrease of the Ca/Alratio and the increase of the Ti/Al ratio are mainly associated with theejecta layer, maintaining relatively constant values in the entire ejectalayer. For the Ca/Al profile (Fig. 6), minor decrease peaks are observed,mainly associated with the presence of spherules. Specifically, most ofthe spherules in the Agost distal section have a composition of Fe-oxides(goethite) or K-feldspar spherules (Martínez-Ruiz et al., 1997), thustending to result in a slight decrease in our Ca/Al profiles (6reva and6revb) (see Fig. 7).
In addition, at the top the ejecta layer, a rapid increase of Ca/Al
Fig. 4. Comparison of % CaCO3⁎, Cr/Al, Ni/Al, Cu/Al, Zn/Al (10−4) and Fe/Al ratio analyzed by ICP-OES and ICP-MS vs Ca/Al, Cr/Al, Fe/Al, Ni/Al, Cu/Al and Zn/Al
ratios analyzed by LA-ICP-MS, in a 15.57 mm shared interval, including the gray calcareous marls (uppermost Maastrichtian), the ejecta layer, and the boundary claylayer (lowermost Danian).
Fig. 5. Comparison of % CaCO3⁎, Cr/Al, Ni/Al, Cu/Al, Zn/Al (10−4) and Fe/Al ratio analyzed by ICP-OES and ICP-MS from the segment 1 vs the same ratios from the
segment 1, profile f but analyzed by LA-ICP-MS, in a 6 mm interval, including the gray calcareous marlstones (uppermost Maastrichtian) and the ejecta layer and theboundary clay layer (lowermost Danian).
C. Sosa-Montes de Oca, et al. Chemical Geology 533 (2020) 119431
6

level is observed. However, for both segments this is due to the pre-sence of a vein of diagenetic calcite (see Fig. 6 and Fig. 7). In fact, thetotal reestablishment of the Ca/Al ratio, and thus the carbonate content,occurred at the end of the boundary clay layer. From the ejecta layerupward, there is a gradual increase in the carbonate content to reachsimilar values to those in the Late Cretaceous (Ortega-Huertas et al.,2002; Smit, 1990, 1999).
In the case of the Ti/Al profiles (6reva and 6revb) (Fig. 6), someminor decrease/increase peaks are observed. These variations are as-sociated to edge effects of the abrasion surface of the laser beam. Takingthese potential deviations into account, we may consider the Ti/Al ratioto be rather constant across the ejecta layer.
Another interesting point to take into account, at this μm scale re-solution, is the shape of the major peak associated with the ejecta layerin all elemental profiles (Figs. 3 and 5). The meteorite impact at theKPgB, implied an instantaneous contribution of a number of chemicalmarkers (Kyte, 1998, 2002). However, the shape in which the increase/decrease appears starting a few mm below the ejecta layer is differentfor each element. Whereas a sharp decrease/indecrease is observed inthe case of Ca, Fe, Ni, Cu, Zn, Pb, As and Sb profiles, a gradual increaseis clearly observed in profiles for Ti and Cr (Figs. 3 and 5).
Titaniun is a rather immobile element thus the Ti/Al profile in Fig. 3represents an unmobilized feature. Similarly, Cr, thought to be pre-dominantly in a Cr-spinel mineral at the KPgB, thus largely refractorytoo, displays the same shape as Ti. Thus, any affect by postdepositionalmobilisation can be excluded for these two elements. Consequently, the
early onset of an increasing Ti and Cr flux immediately prior to theimpact (≈100 yrs, according to the sedimentation rate of2.05 cm kyr−1 estimated for the uppermost Maastrichtian sediments),must be a primary signal. In contrast to the gradual onset observed forCr, Ti, that for Ca is exclusively linked at the boundary and its incre-ment is abrupt (Fig. 3).
Accordingly, this gradual onset for Cr, Ti, cannot be attributed toimpact-related or sampling-related sediment mixing. Nor can it be re-lated to any other form of physical mixing such as bioturbation, whichhas been previously tested in several KPgB sediments sections (Alegretet al., 2015; Kędzierski et al., 2011; Rodríguez-Tovar et al., 2010; Sosa-Montes de Oca et al., 2016). In the case that we had sediment mixing orbioturbation, all sedimentary components, and in particular CaCO3
⁎
(here represented as Ca/Al), should demonstrate the same feature.The gradually increasing flux observed for Ti and Cr profiles could
only be related with a primary signal and with only 2 phenomena: agradual onset of meteorite impacts (e.g. Jolley et al., 2010) or volcaniceruptions (e.g.; Renne et al., 2015; Schoene et al., 2015, 2019). How-ever, based on our data, only for that one section, we cannot decide forany hypothesis, but can state that there was an external source for theexplaining of these anomalies. Thus, further similar continuous highresolution studies (micro scale) are needed to corroborate if theseanomalies are global or local.
Fig. 6. Comparison between LA-ICP-MS traces (Ca/Al and Ti/Al ratios) and secondary electron images made by High-Resolution Scanning Electron Microscopy(HRSEM). In the photo are the traces of LA-ICP-MS (Trace 6reva and 6revb). The red dash line shows the KPgB. At the ejecta layer from the lowermost Danian,numerous spherules are observed (in yellow). Ca/Al profiles are in blue color while Ti/Al profiles are in green color. (For interpretation of the references to color inthis figure legend, the reader is referred to the web version of this article.)
C. Sosa-Montes de Oca, et al. Chemical Geology 533 (2020) 119431
7
5.3. High-resolution tentative profile of iridium and other PGE obtained byLA-ICP-MS
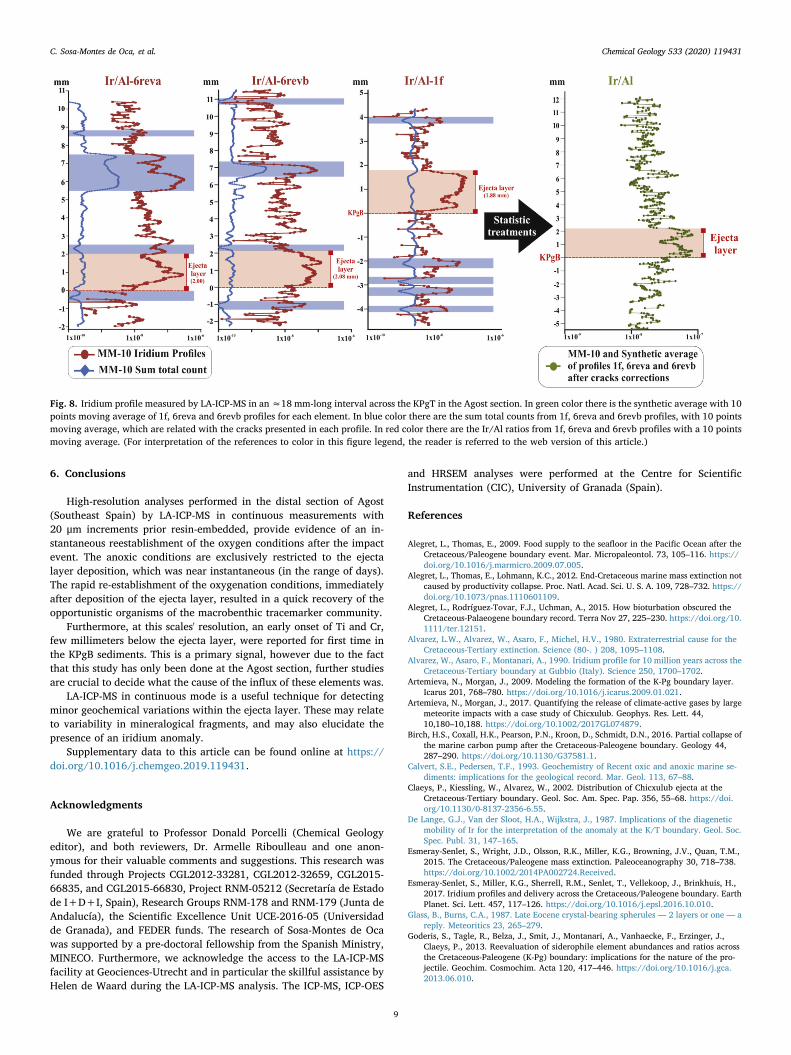
Iridium has been traditionally analyzed by instrumental (INAA) andradiochemical (RNAA) neutron activation analysis (e.g. Alvarez et al.,1980, 1990; Smit and Hertogen, 1980), nickel sulfide fire assay (NiS)pre-concentration techniques and/or isotope dilution (ID) in combina-tion with inductively coupled plasma-mass spectrometry (ICP-MS) (e.g.Claeys et al., 2002; Esmeray-Senlet et al., 2017; Goderis et al., 2013).Here, a constant high concentration ratios of iridium was observedusing the high-resolution LA-ICP-MS methodology (Sosa-Montes de Ocaet al., 2018a, 2018b) and a specific external standard as WPR-1 (Fig. 8).
Thus, from the 5 profiles initially chosen, we selected those wherethe specific external standard was used, (only 1f profile for segment 1;and 6reva and 6revb profiles for segment 6). As a result, in the iridiumprofile, a constant pattern with low scatter is observed in the ejectalayer (Fig. 8), despite the low concentration and the isobaric inter-ference that this element could suffer. Elevated Ir/Al ratios can be de-tected and linked exclusively with the ejecta layer (Fig. 8). Never-theless, future analytical developments may allow for better precisionand detection and thus a more advanced interpretation of Ir data.
As the results from LA-ICP-MS analyses of Pt and Pd are close to thedetection limit, it is not possible to detect a significant increase of thePt/Al and Pd/Al ratios within the ejecta layer (Appendix E of supple-mentary material). Thus future developments of more accurate analysisincluding appropriate external standard would be required to improvethe analytical quality for these elements.
Notwithstanding, abrupt enhanced levels of iridium linked only
with the ejecta layer, which mainly is related with atmospheric pro-jection estimated in the order of days to months at most (Artemieva andMorgan, 2009). Also support the idea of the quick recovery of oxicconditions and productivity after this event (e.g., Alegret et al., 2012;Alegret and Thomas, 2009; Birch et al., 2016; Esmeray-Senlet et al.,2015; Schueth et al., 2015; Sepúlveda et al., 2009; Sosa-Montes de Ocaet al., 2013, 2016, 2017). This is of special interest in the context ofevolutionary and ecological dynamics (e.g., Hull, 2015).
This recovery time for the oxic conditions after KPg event, could beof special interest to know how the recovery of the current climatechange could be (Pachauri et al., 2014).
In sum, thanks to the continuous high-resolution analyses per-formed here, it could be possible to reconstruct the main anomaliesassociated with the KPgB, at the onset, the event itself and finally at therecovery to pre-impact conditions. Thus, in the sediments from theuppermost Cretaceous, a gradual rise on the concentration of elementslike Ti and Cr was observed started ≈100 yrs. previously to the event.During ejecta layer deposition an abrupt increase of elements such asTi, Cr, Cu, Fe, Ni, Zn, Pb and Ir was related to the meteorite's owncontribution (Kyte, 1998, 2002) whereas abrupt increase of As, Sb le-vels are associated with Fe,S/ox dynamics (Mizan et al., 2017). Finally,once the ejecta layer was deposited, similar concentrations of, Fe, Ni,Cu, Zn, As, Sb, Pb and Ir, to that in the uppermost Cretaceous wereobserved, thus leading one to interpret similar oxygen conditions priorto and after the KPgB, with anoxic environments restricted only to thebrief episode of ejecta layer deposition, estimated in the order of days tomonths at most (Artemieva and Morgan, 2009).
Fig. 7. Secondary electron image of segment 6 made by High-Resolution Scanning Electron Microscopy (HRSEM). Analyses of two selected areas were made by EDX.The spherules are marked in yellow whereas the diagenetic calcite is marked in green. (For interpretation of the references to color in this figure legend, the reader isreferred to the web version of this article.)
C. Sosa-Montes de Oca, et al. Chemical Geology 533 (2020) 119431
8
6. Conclusions
High-resolution analyses performed in the distal section of Agost(Southeast Spain) by LA-ICP-MS in continuous measurements with20 μm increments prior resin-embedded, provide evidence of an in-stantaneous reestablishment of the oxygen conditions after the impactevent. The anoxic conditions are exclusively restricted to the ejectalayer deposition, which was near instantaneous (in the range of days).The rapid re-establishment of the oxygenation conditions, immediatelyafter deposition of the ejecta layer, resulted in a quick recovery of theopportunistic organisms of the macrobenthic tracemarker community.
Furthermore, at this scales' resolution, an early onset of Ti and Cr,few millimeters below the ejecta layer, were reported for first time inthe KPgB sediments. This is a primary signal, however due to the factthat this study has only been done at the Agost section, further studiesare crucial to decide what the cause of the influx of these elements was.
LA-ICP-MS in continuous mode is a useful technique for detectingminor geochemical variations within the ejecta layer. These may relateto variability in mineralogical fragments, and may also elucidate thepresence of an iridium anomaly.
Supplementary data to this article can be found online at https://doi.org/10.1016/j.chemgeo.2019.119431.
Acknowledgments
We are grateful to Professor Donald Porcelli (Chemical Geologyeditor), and both reviewers, Dr. Armelle Riboulleau and one anon-ymous for their valuable comments and suggestions. This research wasfunded through Projects CGL2012-33281, CGL2012-32659, CGL2015-66835, and CGL2015-66830, Project RNM-05212 (Secretaría de Estadode I+D+I, Spain), Research Groups RNM-178 and RNM-179 (Junta deAndalucía), the Scientific Excellence Unit UCE-2016-05 (Universidadde Granada), and FEDER funds. The research of Sosa-Montes de Ocawas supported by a pre-doctoral fellowship from the Spanish Ministry,MINECO. Furthermore, we acknowledge the access to the LA-ICP-MSfacility at Geociences-Utrecht and in particular the skillful assistance byHelen de Waard during the LA-ICP-MS analysis. The ICP-MS, ICP-OES
and HRSEM analyses were performed at the Centre for ScientificInstrumentation (CIC), University of Granada (Spain).
References
Alegret, L., Thomas, E., 2009. Food supply to the seafloor in the Pacific Ocean after theCretaceous/Paleogene boundary event. Mar. Micropaleontol. 73, 105–116. https://doi.org/10.1016/j.marmicro.2009.07.005.
Alegret, L., Thomas, E., Lohmann, K.C., 2012. End-Cretaceous marine mass extinction notcaused by productivity collapse. Proc. Natl. Acad. Sci. U. S. A. 109, 728–732. https://doi.org/10.1073/pnas.1110601109.
Alegret, L., Rodríguez-Tovar, F.J., Uchman, A., 2015. How bioturbation obscured theCretaceous-Palaeogene boundary record. Terra Nov 27, 225–230. https://doi.org/10.1111/ter.12151.
Alvarez, L.W., Alvarez, W., Asaro, F., Michel, H.V., 1980. Extraterrestrial cause for theCretaceous-Tertiary extinction. Science (80-. ) 208, 1095–1108.
Alvarez, W., Asaro, F., Montanari, A., 1990. Iridium profile for 10 million years across theCretaceous-Tertiary boundary at Gubbio (Italy). Science 250, 1700–1702.
Artemieva, N., Morgan, J., 2009. Modeling the formation of the K-Pg boundary layer.Icarus 201, 768–780. https://doi.org/10.1016/j.icarus.2009.01.021.
Artemieva, N., Morgan, J., 2017. Quantifying the release of climate-active gases by largemeteorite impacts with a case study of Chicxulub. Geophys. Res. Lett. 44,10,180–10,188. https://doi.org/10.1002/2017GL074879.
Birch, H.S., Coxall, H.K., Pearson, P.N., Kroon, D., Schmidt, D.N., 2016. Partial collapse ofthe marine carbon pump after the Cretaceous-Paleogene boundary. Geology 44,287–290. https://doi.org/10.1130/G37581.1.
Calvert, S.E., Pedersen, T.F., 1993. Geochemistry of Recent oxic and anoxic marine se-diments: implications for the geological record. Mar. Geol. 113, 67–88.
Claeys, P., Kiessling, W., Alvarez, W., 2002. Distribution of Chicxulub ejecta at theCretaceous-Tertiary boundary. Geol. Soc. Am. Spec. Pap. 356, 55–68. https://doi.org/10.1130/0-8137-2356-6.55.
De Lange, G.J., Van der Sloot, H.A., Wijkstra, J., 1987. Implications of the diageneticmobility of Ir for the interpretation of the anomaly at the K/T boundary. Geol. Soc.Spec. Publ. 31, 147–165.
Esmeray-Senlet, S., Wright, J.D., Olsson, R.K., Miller, K.G., Browning, J.V., Quan, T.M.,2015. The Cretaceous/Paleogene mass extinction. Paleoceanography 30, 718–738.https://doi.org/10.1002/2014PA002724.Received.
Esmeray-Senlet, S., Miller, K.G., Sherrell, R.M., Senlet, T., Vellekoop, J., Brinkhuis, H.,2017. Iridium profiles and delivery across the Cretaceous/Paleogene boundary. EarthPlanet. Sci. Lett. 457, 117–126. https://doi.org/10.1016/j.epsl.2016.10.010.
Glass, B., Burns, C.A., 1987. Late Eocene crystal-bearing spherules — 2 layers or one — areply. Meteoritics 23, 265–279.
Goderis, S., Tagle, R., Belza, J., Smit, J., Montanari, A., Vanhaecke, F., Erzinger, J.,Claeys, P., 2013. Reevaluation of siderophile element abundances and ratios acrossthe Cretaceous-Paleogene (K-Pg) boundary: implications for the nature of the pro-jectile. Geochim. Cosmochim. Acta 120, 417–446. https://doi.org/10.1016/j.gca.2013.06.010.
Fig. 8. Iridium profile measured by LA-ICP-MS in an≈18 mm-long interval across the KPgT in the Agost section. In green color there is the synthetic average with 10points moving average of 1f, 6reva and 6revb profiles for each element. In blue color there are the sum total counts from 1f, 6reva and 6revb profiles, with 10 pointsmoving average, which are related with the cracks presented in each profile. In red color there are the Ir/Al ratios from 1f, 6reva and 6revb profiles with a 10 pointsmoving average. (For interpretation of the references to color in this figure legend, the reader is referred to the web version of this article.)
C. Sosa-Montes de Oca, et al. Chemical Geology 533 (2020) 119431
9

Groot, J.J., de Jonge, R.B.G., Langereis, C.G., ten Kate, W.G.H.Z., Smit, J., 1989.Magnetostratigraphy of the Cretaceous-Tertiary boundary at Agost (Spain). EarthPlanet. Sci. Lett. 94, 385–397. https://doi.org/10.1016/0012-821X(89)90155-6.
Hennekam, R., Jilbert, T., Mason, P.R.D., de Lange, G.J., Reichart, G.J., 2015. High-re-solution line-scan analysis of resin-embedded sediments using laser ablation-in-ductively coupled plasma-mass spectrometry (LA-ICP-MS). Chem. Geol. 403, 42–51.https://doi.org/10.1016/j.chemgeo.2015.03.004.
Hull, P., 2015. Life in the aftermath of mass extinctions. Curr. Biol. 25, R941–R952.https://doi.org/10.1016/j.cub.2015.08.053.
Husson, D., Galbrun, B., Gardin, S., Thibault, N., 2014. Tempo and duration of short-termenvironmental perturbations across the Cretaceous-Paleogene boundary.Stratigraphy 11, 159–171.
Jilbert, T., de Lange, G.J., Reichart, G.J., 2008. Fluid displacive resin embedding of la-minated sediments: preserving trace metals for high-resolution paleoclimate in-vestigations. Limnol. Oceanogr. Methods 6, 16–22. https://doi.org/10.4319/lom.2008.6.16.
Jolley, D., Gilmour, I., Gurov, E., Kelley, S., Watson, J., 2010. Two large meteorite im-pacts at the Cretaceous-Paleogene boundary. Geology 38, 835–838. https://doi.org/10.1130/G31034.1.
Kędzierski, M., Rodríguez-Tovar, F.J., Uchman, A., 2011. Vertical displacement and ta-phonomic filtering of nannofossils by bioturbation in the Cretaceous-Palaeogeneboundary section at Caravaca, SE Spain. Lethaia 44, 321–328. https://doi.org/10.1111/j.1502-3931.2010.00244.x.
Kring, D.A., 2007. The Chicxulub impact event and its environmental consequences at theCretaceous-Tertiary boundary. Palaeogeogr. Palaeoclimatol. Palaeoecol. 255, 4–21.https://doi.org/10.1016/j.palaeo.2007.02.037.
Kyte, F.T., 1998. A meteorite from the Cretaceous/Tertiary boundary. Nature 396,237–239.
Kyte, F.T., 2002. Tracers of the Extraterrestrial Component in Sediments and Inferencesfor Earth’s Accretion History. Special Paper of the Geological Society ofAmericahttps://doi.org/10.1130/0-8137-2356-6.21.
Lowery, C.M., Bralower, T.J., Owens, J.D., Rodríguez-tovar, F.J., Jones, H., Smit, J.,Gulick, S., Joanna, V., Green, S., Chenot, E., Whalen, M.T., Claeys, P., Farley, K.,Sean, P., 2018. Rapid recovery of life at ground zero of the end-Cretaceous massextinction. Nature. https://doi.org/10.1038/s41586-018-0163-6.
Martínez-Ruiz, F., Ortega-Huertas, M., Palomo, I., Acquafredda, P., 1997. Quench tex-tures in altered spherules from the Cretaceous-Tertiary boundary layer at Agost andCaravaca, SE Spain. Sediment. Geol. 113, 137–147. https://doi.org/10.1016/S0037-0738(97)00057-2.
Mizan, S.A., Chatterjee, A., Ahmed, S., 2017. Arsenic enrichment in groundwater insouthern flood plain of Ganga-Son interfluves. Arab. J. Geosci. 10, 0–10. https://doi.org/10.1007/s12517-017-2880-9.
Molina, E., Alegret, L., Arenillas, I., Arz, J.A., 2005. The Cretaceous/Paleogene boundaryat the Agost section revisited: paleoenvironmental reconstruction and mass extinctionpattern. J. Iber. Geol. 31, 135–148.
Morford, J.L., Emerson, S., 1999. The geochemistry of redox sensitive trace metals insediments. Geochim. Cosmochim. Acta 63, 1735–1750. https://doi.org/10.1016/S0016-7037(99)00126-X.
Ortega-Huertas, M., Martínez-Ruiz, F., Palomo, I., Chamley, H., 2002. Review of themineralogy ot the Cretaceous-Tertiary boundary clay: evidence supporting a majorextraterrestrial catastrophic event. Clay Miner. 37, 395–411. https://doi.org/10.1180/0009855023730054.
Pachauri, R.K., Allen, M.R., Barros, V.R., Broome, J., Cramer, W., Christ, R., Church, J.A.,Clarke, L., Dahe, Q., Dasgupta, P., 2014. Climate Change 2014: Synthesis Report,Climate Change 2014 — Synthesis Report. https://doi.org/10.1017/CBO9781107415324.
Renne, P.R., Deino, A.L., Hilgen, F.J., Kuiper, K.F., Mark, D.F., Mitchell, W.S., Morgan,L.E., Mundil, R., Smit, J., 2013. Time scales of critical events around the Cretaceous-Paleogene boundary. Science 339, 684–687. https://doi.org/10.1126/science.1230492.
Renne, P.R., Sprain, C.J., Richards, M.A., Self, S., Vanderkluysen, L., Pande, K., 2015.Possibly induced by impact. Science (80-. ) 350, 76–78. https://doi.org/10.1126/science.aac7549.
Rodríguez-Tovar, F.J., 2005. Fe-oxide spherules infilling Thalassinoides burrows at theCretaceous-Paleogene (K-P) boundary: evidence of a near-contemporaneous macro-benthic colonization during the K-P event. Geology 33, 585–588. https://doi.org/10.1130/G21527.1.
Rodríguez-Tovar, F.J., Uchman, A., 2008. Bioturbational disturbance of the Cretaceous-Palaeogene (K-Pg) boundary layer: implications for the interpretation of the K-Pgboundary impact event. Geobios 41, 661–667. https://doi.org/10.1016/j.geobios.2008.01.003.
Rodríguez-Tovar, F.J., Martínez-Ruiz, F., Bernasconi, S.M., 2006. Use of high-resolutionichnological and stable isotope data for assessing completeness of a K-P boundarysection, Agost, Spain. Palaeogeogr. Palaeoclimatol. Palaeoecol. 237, 137–146.https://doi.org/10.1016/j.palaeo.2005.11.019.
Rodríguez-Tovar, F.J., Uchman, A., Molina, E., Monechi, S., 2010. Bioturbational redis-tribution of Danian calcareous nannofossils in the uppermost Maastrichtian across theK-Pg boundary at Bidart, SW France. Geobios 43, 569–579. https://doi.org/10.1016/j.geobios.2010.03.002.
Schoene, B., Samperton, K.M., Eddy, M.P., Keller, G., Adatte, T., Bowring, S.A., Khadri,S.F.R., Gertsch, B., 2015. U-Pb geochronology of the Deccan Traps and relation to theend-Cretaceous mass extinction. Science (80-. ) 347, 182–184. https://doi.org/10.1126/science.aaa0118.
Schoene, B., Eddy, M.P., Samperton, K.M., Keller, C.B., Keller, G., Adatte, T., Khadri,S.F.R., 2019. U-Pb constraints on pulsed eruption of the Deccan Traps across the end-Cretaceous mass extinction. Science (80-. ) 363, 862–866. https://doi.org/10.1126/science.aau2422.
Schueth, J.D., Bralower, T.J., Jiang, S., Patzkowsky, M.E., 2015. The role of regionalsurvivor incumbency in the evolutionary recovery of calcareous nannoplankton fromthe Cretaceous/Paleogene (K/Pg) mass extinction. Paleobiology 41, 661–679.https://doi.org/10.1017/pab.2015.28.
Schulte, P., Alegret, L., Arenillas, I., Arz, J.A., Barton, P., Paul, R., Bralower, T.J.,Christeson, G.L., Claeys, P., Cockell, C.S., Collins, G.S., Deutsch, A., Goldin, T.J.,Goto, K., José, M., Grieve, R.A.F., Gulick, S.P.S., Johnson, K.R., Koeberl, C., Kring,D.A., Macleod, K.G., Matsui, T., Melosh, J., Montanari, A., Morgan, J.V., Neal, C.R.,Douglas, J., Norris, R.D., Pierazzo, E., Ravizza, G., Rebolledo-vieyra, M., Reimold,W.U., Robin, E., Salge, T., Speijer, R.P., Sweet, A.R., Vajda, V., Whalen, M.T.,Willumsen, P.S., 2010a. Supporting online material for the Chicxulub asteroid impactand mass extinction at the Cretaceous-Paleogene boundary. Science (80-. ). 327,1214–1218. https://doi.org/10.1126/science.1177265.
Schulte, P., Alegret, L., Arenillas, I., Arz, J.A., Barton, P.J., Bown, P.R., Bralower, T.J.,Christeson, G.L., Claeys, P., Cockell, C.S., Collins, G.S., Deutsch, A., Goldin, T.J.,Goto, K., Grajales-Nishimura, J.M., Grieve, R.A.F., Gulick, S.P.S., Johnson, K.R.,Kiessling, W., Koeberl, C., Kring, D.A., MacLeod, K.G., Matsui, T., Melosh, J.,Montanari, A., Morgan, J.V., Neal, C.R., Nichols, D.J., Norris, R.D., Pierazzo, E.,Ravizza, G., Rebolledo-Vieyra, M., Reimold, W.U., Robin, E., Salge, T., Speijer, R.P.,Sweet, A.R., Urrutia-Fucugauchi, J., Vajda, V., Whalen, M.T., Willumsen, P.S., 2010b.The Chicxulub asteroid impact and mass extinction at the Cretaceous-Paleogeneboundary. Science (80-. ) 327, 1214–1218. https://doi.org/10.1126/science.1177265.
Sepúlveda, J., Wendler, J.E., Summons, R.E., Hinrichs, K.-U., 2009. Rapid resurgence ofmarine productivity after the Cretaceous-Paleogene mass extinction. Science (80-. )326, 129–132. https://doi.org/10.1126/science.1176233.
Shukolyukov, A., Lugmair, G.W., 2004. Manganese-chromium isotope systematics ofenstatite meteorites. Geochim. Cosmochim. Acta 68, 2875–2888. https://doi.org/10.1016/j.gca.2004.01.008.
Smit, J., 1990. Meteorite impact, extinctions and the Cretaceous-Tertiary boundary. Geol.en Mijnb. 69, 187–204.
Smit, J., 1999. The global stratigraphy of the Cretaceous-Tertiary boundary impact ejecta.Annu. Rev. Earth Planet. Sci. 27, 75–113.
Smit, J., Hertogen, J., 1980. An extraterrestrial event at the Cretaceous-Tertiaryboundary. Nature 285, 198–200.
Smit, J., Klaver, G., 1981. Sanidine spherules at the Cretaceous-Tertiary boundary in-dicate a large impact event. Nature 292, 47–49.
Smit, J., Ten Kate, W.G.H.Z., 1982. Trace-element patterns at the Cretaceous-Tertiaryboundary—consequences of a large impact. Cretac. Res. 3, 307–332.
Smith, A.G., Hurley, A.M., Briden, J.C., 1981. Phanerozoic Paleocontinental World Maps.CUP Archive.
Sosa-Montes de Oca, C., Martínez-Ruiz, F., Rodríguez-Tovar, F.J., 2013. Bottom-waterconditions in a marine basin after the Cretaceous-Paleogene impact event: timing therecovery of oxygen levels and productivity. PLoS One 8, e82242. https://doi.org/10.1371/journal.pone.0082242.
Sosa-Montes de Oca, C., Rodríguez-Tovar, F.J., Martínez-Ruiz, F., 2016. Geochemical andisotopic characterization of trace fossil infillings: new insights on tracemaker activityafter the K/Pg impact event. Cretac. Res. 57, 391–401. https://doi.org/10.1016/j.cretres.2015.03.003.
Sosa-Montes de Oca, C., Rodríguez-Tovar, F.J., Martínez-Ruiz, F., Monaco, P., 2017.Paleoenvironmental conditions across the Cretaceous–Paleogene transition at theApennines sections (Italy): an integrated geochemical and ichnological approach.Cretac. Res. 71. https://doi.org/10.1016/j.cretres.2016.11.005.
Sosa-Montes de Oca, C., de Lange, G.J., Martínez-Ruiz, F., Rodríguez-Tovar, F.J., 2018a.Application of laser ablation-ICP-MS to determine high-resolution elemental profilesacross the Cretaceous/Paleogene boundary at Agost (Spain). Palaeogeogr.Palaeoclimatol. Palaeoecol. 497, 128–138. https://doi.org/10.1016/j.palaeo.2018.02.012.
Sosa-Montes de Oca, C., de Lange, G.J., Martínez-Ruiz, F., Rodríguez-Tovar, F.J., 2018b.High-resolution data from Laser Ablation-ICP-MS and by ICP-OES analyses at theCretaceous/Paleogene boundary section at Agost (SE Spain). Data Br 18, 1900–1906.https://doi.org/10.1016/j.dib.2018.04.118.
Thibault, N., Husson, D., 2016. Climatic fluctuations and sea-surface water circulationpatterns at the end of the Cretaceous era: calcareous nannofossil evidence.Palaeogeogr. Palaeoclimatol. Palaeoecol. 441, 152–164. https://doi.org/10.1016/j.palaeo.2015.07.049.
Tribovillard, N., Algeo, T.J., Lyons, T., Riboulleau, A., 2006. Trace metals as paleoredoxand paleoproductivity proxies: an update. Chem. Geol. 232, 12–32. https://doi.org/10.1016/j.chemgeo.2006.02.012.
Urrutia-Fucugauchi, J., Pérez-Cruz, L., 2016. Planetary sciences, geodynamics, impacts,mass extinctions, and evolution: developments and interconnections. Int. J. Geophys.2016. https://doi.org/10.1155/2016/4703168.
Van der Weijden, C.H., 2002. Pitfalls of normalization of marine geochemical data using acommon divisor. Mar. Geol. 184, 167–187.
Vellekoop, J., Woelders, L., van Helmond, N.A.G.M., Galeotti, S., Smit, J., Slomp, C.P.,Brinkhuis, H., Claeys, P., Speijer, R.P., 2018. Shelf hypoxia in response to globalwarming after the Cretaceous-Paleogene boundary impact. Geology 46, 683–686.https://doi.org/10.1130/G45000.1.
C. Sosa-Montes de Oca, et al. Chemical Geology 533 (2020) 119431
10